Article

Simultaneous Pressure and Displacement Measurement on Helicopter Rotor Blades Using a Binocular Stereophotogrammetry PSP System

1
China Aerodynamic Research and Development Center, Mianyang 621000, China
2
Key Lab of Education Ministry for Power Machinery and Engineering, School of Mechanical Engineering, Shanghai Jiao Tong University, Shanghai 200240, China
3
Gas Turbine Research Institute, Shanghai Jiao Tong University, Shanghai 200240, China
*
Authors to whom correspondence should be addressed.
Aerospace 2022, 9(6), 292; https://doi.org/10.3390/aerospace9060292
Submission received: 26 April 2022 / Revised: 16 May 2022 / Accepted: 16 May 2022 / Published: 27 May 2022
(This article belongs to the Special Issue Advanced Flow Diagnostic Tools)

Abstract

:
A simultaneous surface pressure and displacement measurement method that integrates pressure-sensitive paint (PSP) and binocular stereophotogrammetry is proposed. The assays were completed on the Φ4 m rotor test stand at China Aerodynamic Research and Development Center (CARDC). A single-shot lifetime approach was utilized to acquire the instantaneous pressure field on a rotor blade coated with PSP. At the same time, the PSP feature points were used to obtain the 3D coordinates of stereo cameras, which yielded the blade displacement field. The experimental results showed that the displacement measuring accuracy was better than 0.2 mm, and the pressure measurement accuracy was not affected, with Standard Deviation (STD) values below 700 Pa. The advantages of the proposed system are its simple structure, low cost, high accuracy and high test efficiency, which will offer a practical solution for the exploration of fluid–structure interplay. Hence, such a system is a prospective for the wind tunnel tests of helicopter rotor blades.

1. Introduction

Helicopters have unique flight characteristics such as vertical take-off and landing, hovering, low altitude flying, low speed flying, and flexible maneuverability. Helicopter lift and maneuvering load mainly come from the rotor. As a key component, the aerodynamic performance of the rotor directly affects the overall performance of the helicopter. Compared with fixed-wing aircraft, helicopter aerodynamics and dynamics are more complex, and the rotor blade is always in a three-dimensional unsteady aerodynamic environment [1]. When the helicopter flies forward, the forward blade is in the trans-sonic flow field, and shock waves are easily formed at the tip of the blade [2,3]. At the backward blade, the forward flight speed is contrary to the rotating speed of the blade, which makes the inner side of the backward blade in the reflux zone. Moreover, in order to overcome the unbalanced lift caused by the uneven distribution of airflow velocity, the trailing blades are in a state of high attack angle, and there is a possibility of dynamic stall [4,5]. When the helicopter flies forward at a low speed, the sudden drop of the tip pressure will cause the blade to have a strong tip vortex overflow, which seriously affects the subsequent blades and brings about a significant problem of blade vortex interference [6,7,8]. On the other hand, as the rotor blade is a slender and flexible body, when it rotates at a high speed, it has complex waving, oscillating, and variable pitch motions, and the aerodynamic load will make it elastically vibrate and deform non-linearly. The dynamic response, in turn, leads to a redistribution of the blade aerodynamic load, so the blade’s aerodynamic load and structural motion interact and couple with each other [9]. The complex flow field structure of the helicopter rotor and the dynamic deformation of blades jointly induce the typical fluid–solid interaction problem.
In recent years, helicopter rotors have made many breakthroughs in aerodynamic performance, vibration, and noise control. In order to reduce the weight of rotor blades and hubs and improve performance, the use of a large number of high-strength composite materials has further enhanced the flexibility of the rotor. In addition, a new type of hinge-less and bearing-less rotor blade structure has been proposed; in order to optimize the aerodynamic layout, there are new blade tip designs such as the back-swept, sharpened, and downwardly reversed designs; in order to control the noise and vibration of the rotor, the Higher Harmonic Control (HHC) [10,11] and the Individual Blade Control (IBC) [12] and Actively Controlled Flaps (ACF) [13,14] methods have been proposed. These new materials and new technologies have greatly improved helicopter performance, but they have also resulted in a larger bending and torsional deformation of the blades and a more complex flow field structure. This requires a large number of rotor wind tunnel tests to realize result verification. To study this complex fluid–structure interaction problem, there are two key parameters that need to be measured in wind tunnel tests. The first one is the aerodynamic load on the rotor surface, that is, the transient pressure on the surface of the blade, and the second one is the deformation of the blade in three-dimensional space, which covers attitude parameters such as blade flapping, swing vibration, pitch change, other attitude parameters, and three-dimensional stress and strain.
With the improvement of the dynamic response speed of the paint and the establishment of the single-pulse life method [15,16,17], the PSP technology has been introduced into the field of rotor blade pressure measurement, and a breakthrough has been made. PSP is a cutting-edge non-contact optical measurement technology with the great advantage of high spatial and temporal resolution. As an image-based measurement technology, PSP has the potential to be combined with stereo vision measurement technology [18,19]. In this work, surface pressure and displacement on a 4 m diameter rotor blade were simultaneous obtained through both PSP and binocular stereophotogrammetry. The experimental setup and experimental method were presented in detail. The results of PSP measurements and displacement measurement were carefully compared, and the measurement errors were quantified. At the same time, the variations in pressure distribution and displacement under different collective pitch angle (CPA) were discussed.

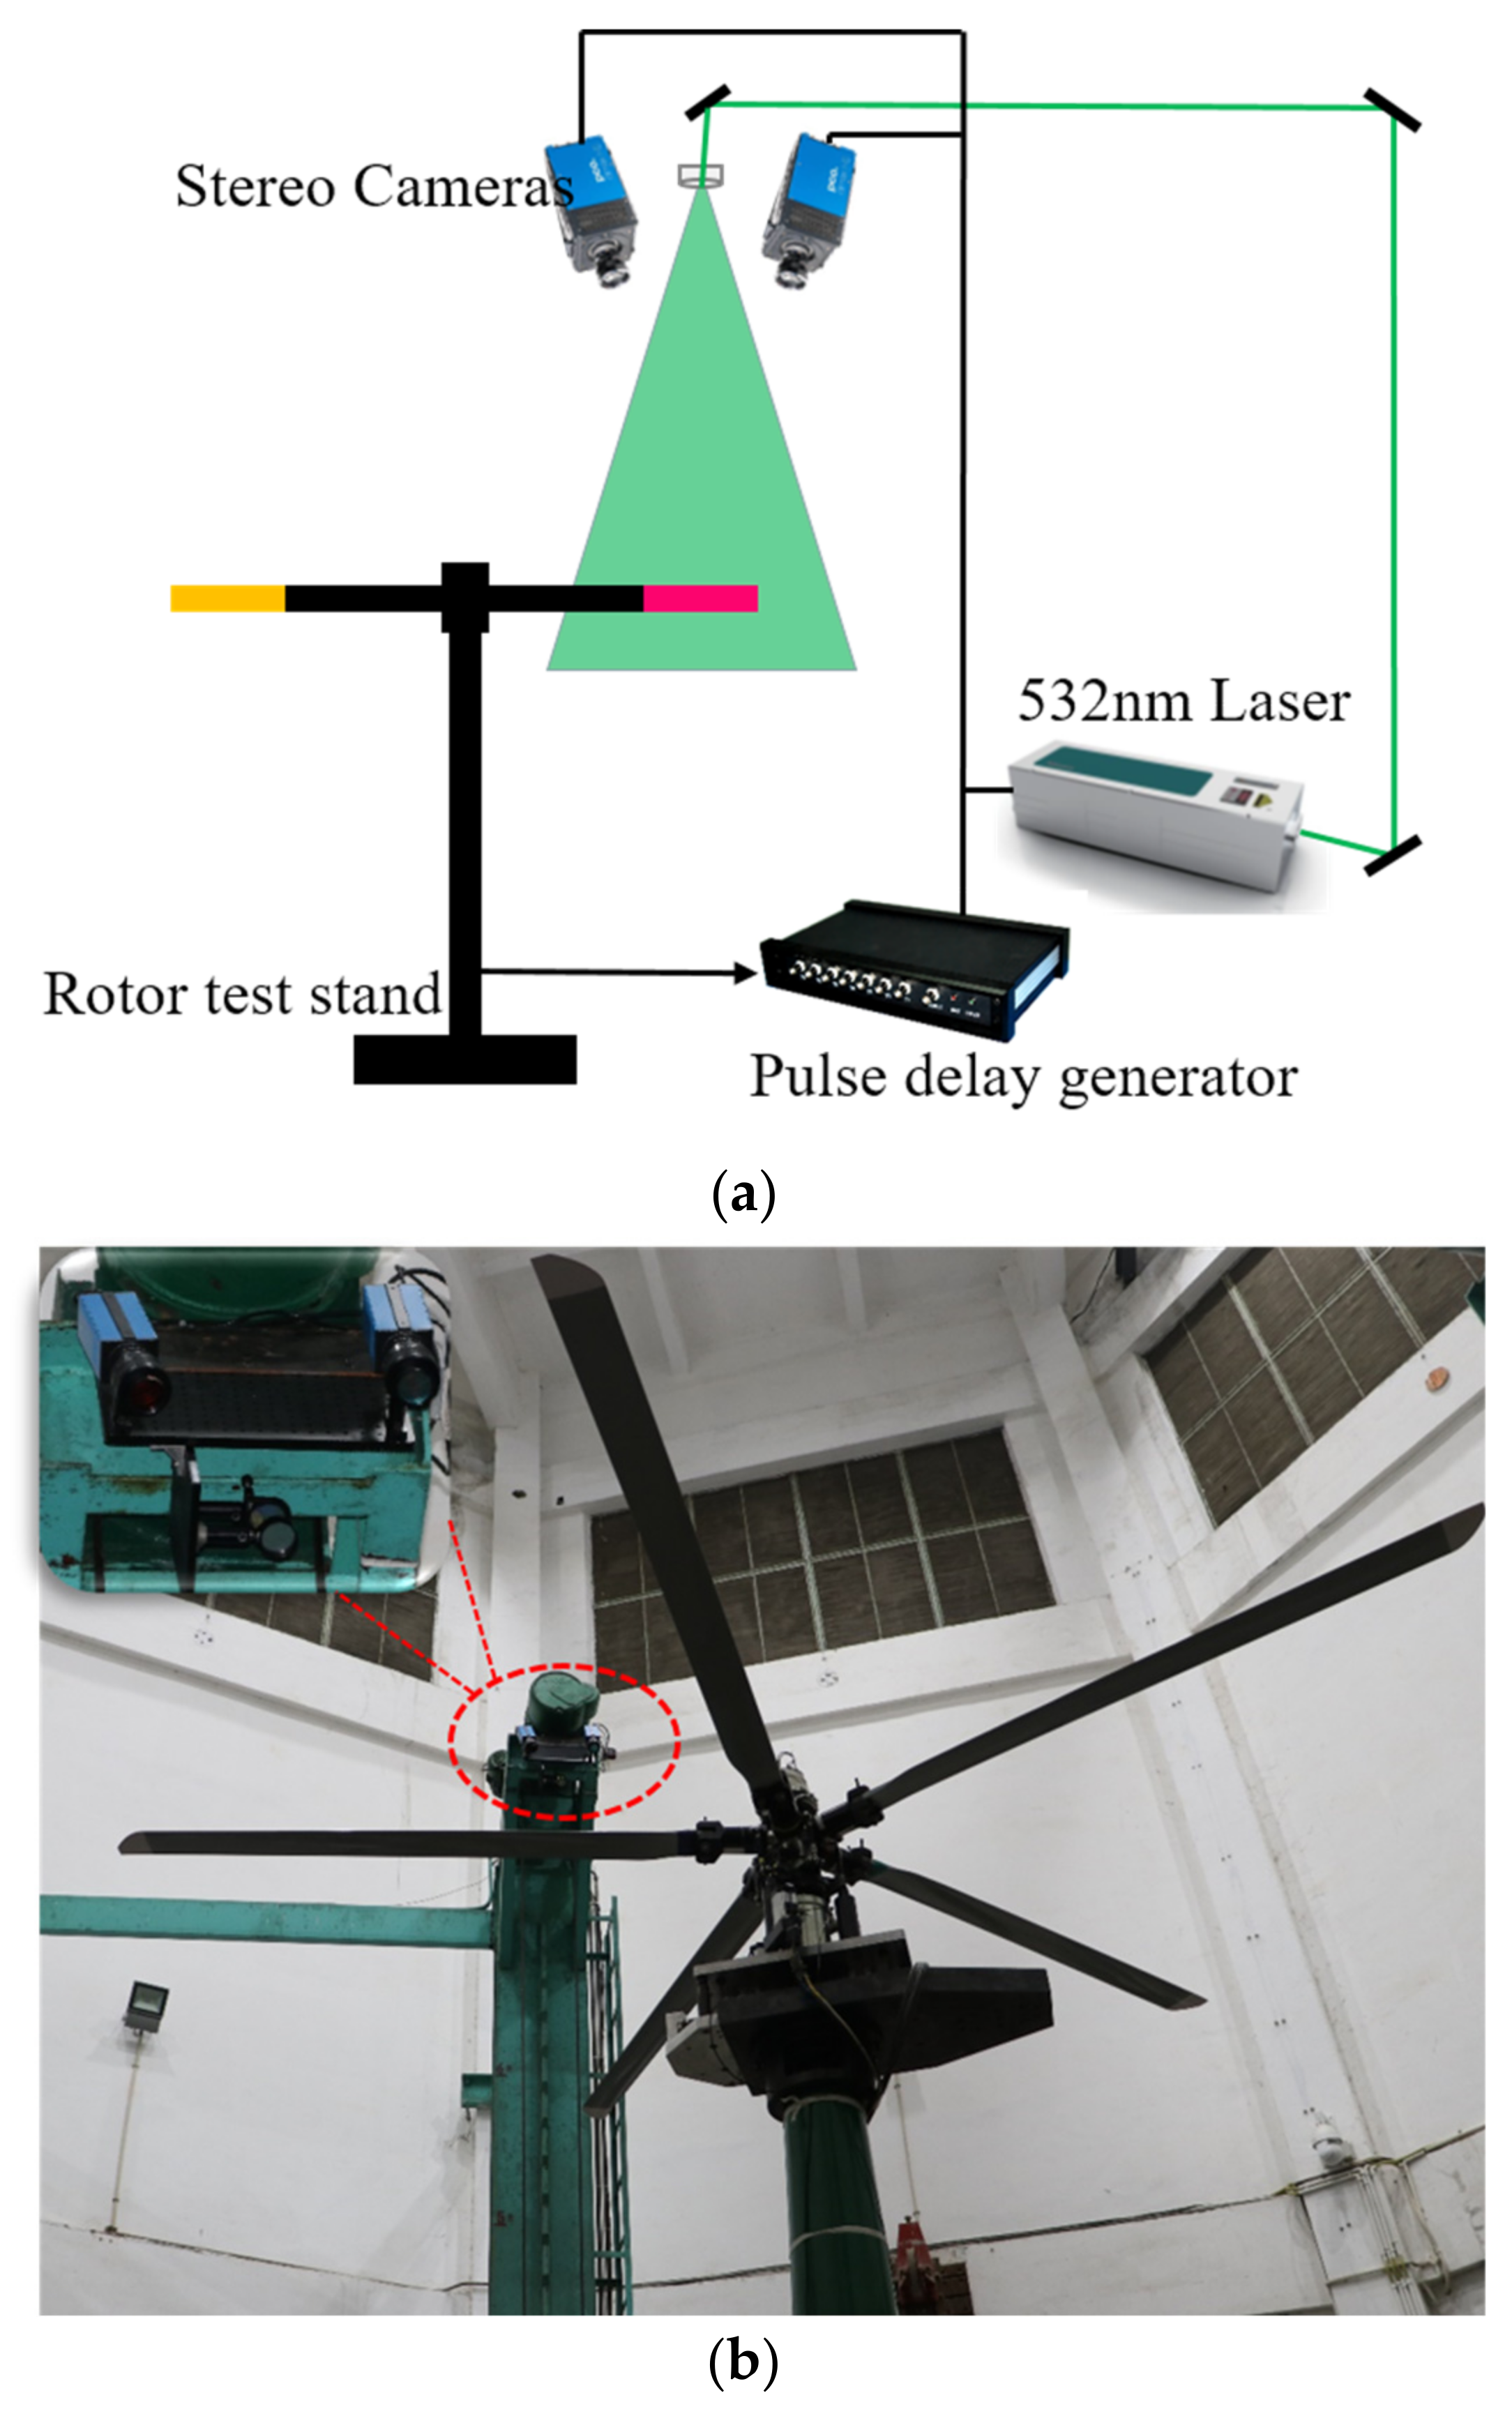
2. Experimental Setup

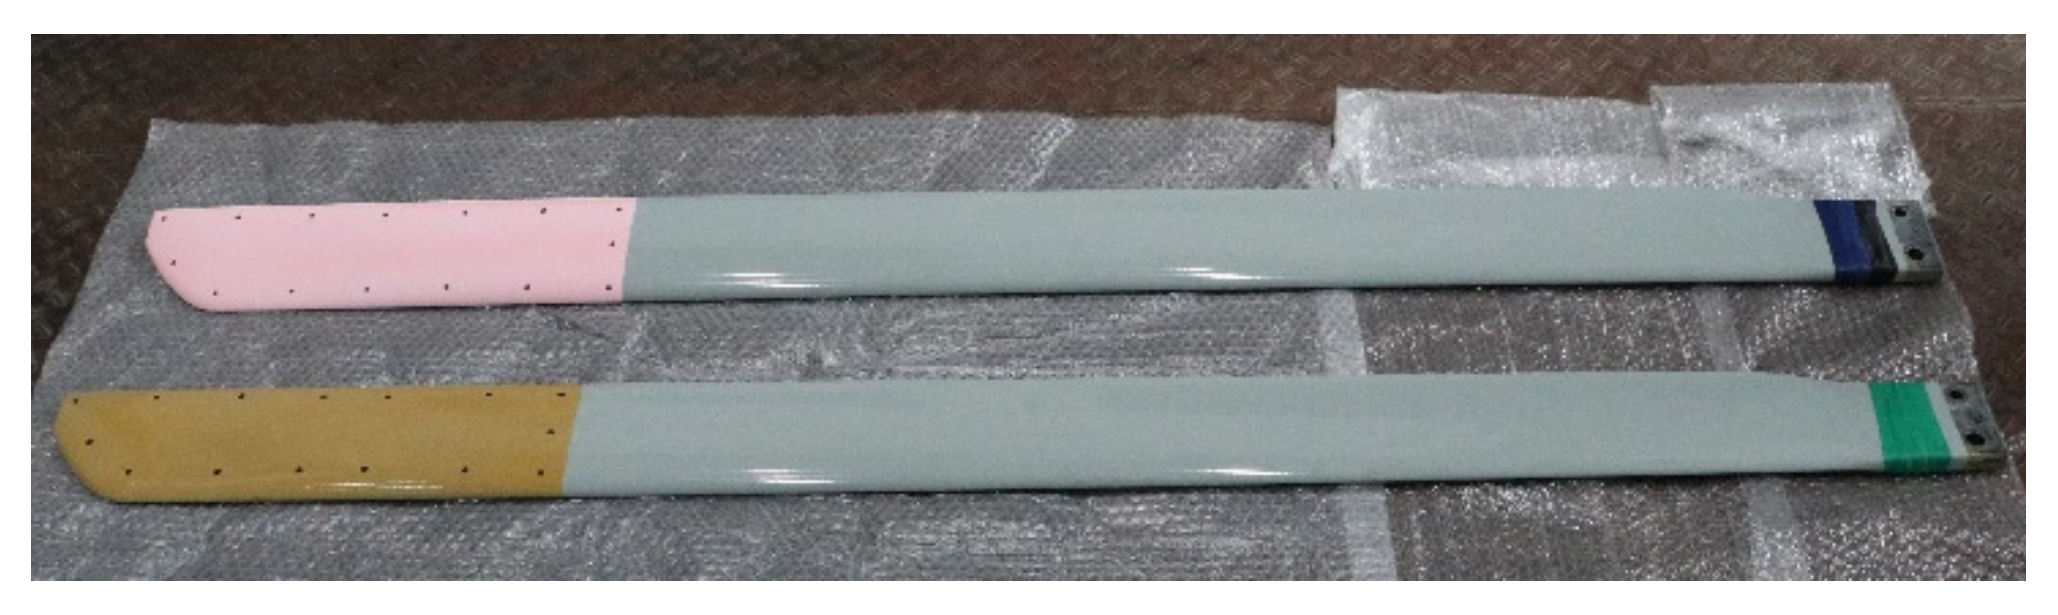
2.1. Rotor Test Stand and Model

The assays were completed on the Φ4 m rotor test stand at CARDC. The rotor test stand utilized in the assays is presented in Figure 1, which is electrically driven with the maximal output power of 380 kW. The maximum rated velocity of the rotor shaft is 1050 rpm, and its control accurateness is better than 1‰. The range of the blade CPA was between 0° and +12°, which had the control accurateness better than 0.1°.
The test model was a 4 m diameter standard rotor model, and the rotor airfoil was OA-309. The rotor model contained five blades with swept tapered tips and a constant chord, each with a chord of C = 126 mm. Each blade was made of carbon fiber composite materials, and the hub was made of alloy steel. Polymer ceramic PSP (PC PSP) and temperature-sensitive paint (TSP) were separately applied to two symmetrical blades via air spraying. For the PSP blade, a porous binder layer, which consisted of TiO2 particles and a small amount of polymer, was first applied. Platinum tetra (pentafluorophenyl) porphyrin (PtTFPP) was used as the pressure sensors and its solution in methanol was then air sprayed onto the binder layer. For the TSP blade, a tier of white paint was first utilized to increase the TSP signal level. Then, a mixture of clear coat and tris (4,7-diphenyl-1,10-phenanthroline) ruthenium (II) dichloride (Ru(dpp)3) solution was air sprayed onto the white coat. The PSP and TSP occupied the area from 0.75 to 1 along the radial length, as presented in Figure 2. The rotational velocity was maintained at 840 rpm during the assay, which was a commonly used safe velocity, slightly lower than the maximum rated velocity. The blade tip velocity was 175.84 m/s, and the Mach quantity at the tip was 0.517.

2.2. Measurement Setup

The illustration of the system is presented in Figure 3. The PSP and TSP coatings were subjected to excitation by a 532 nm pulse Nd:YAG laser with maximum output power of 1 J (Vlite-1000 from Beamtech Optronics, Beijing, China). A digitalized impulse delay generator (BNC-575, Berkeley Nucleonics Company, San Rafael, USA) was utilized, and two CCD cameras (pco. 2000 from PCO AG, Kelheim, Germany) were installed on an optical breadboard, as presented in Figure 3a. These two cameras were run under dual exposure mode with a 35 mm/f1.2 lens (Nikon). Based on the emission spectra of PtTFPP and Ru(dpp)3, two 600 nm long-pass filter were placed before the lens on these two cameras.
When these two cameras were installed, they were corrected for photogrammetrical analysis. An elastic app called ‘Stereo Camera Calibrator’ in the MATLAB Computer Vision Tool Box was utilized. Subsequently, 20–30 pairs of photos of a specific check board pattern were taken by these cameras from diverse directions. The variables required for photogrammetrical analysis could be calculated as per the acquired photo set. We could obtain the internal and external matrixes of all cameras, as well as the translation and rotation between these two cameras.

2.3. Data Acquisition
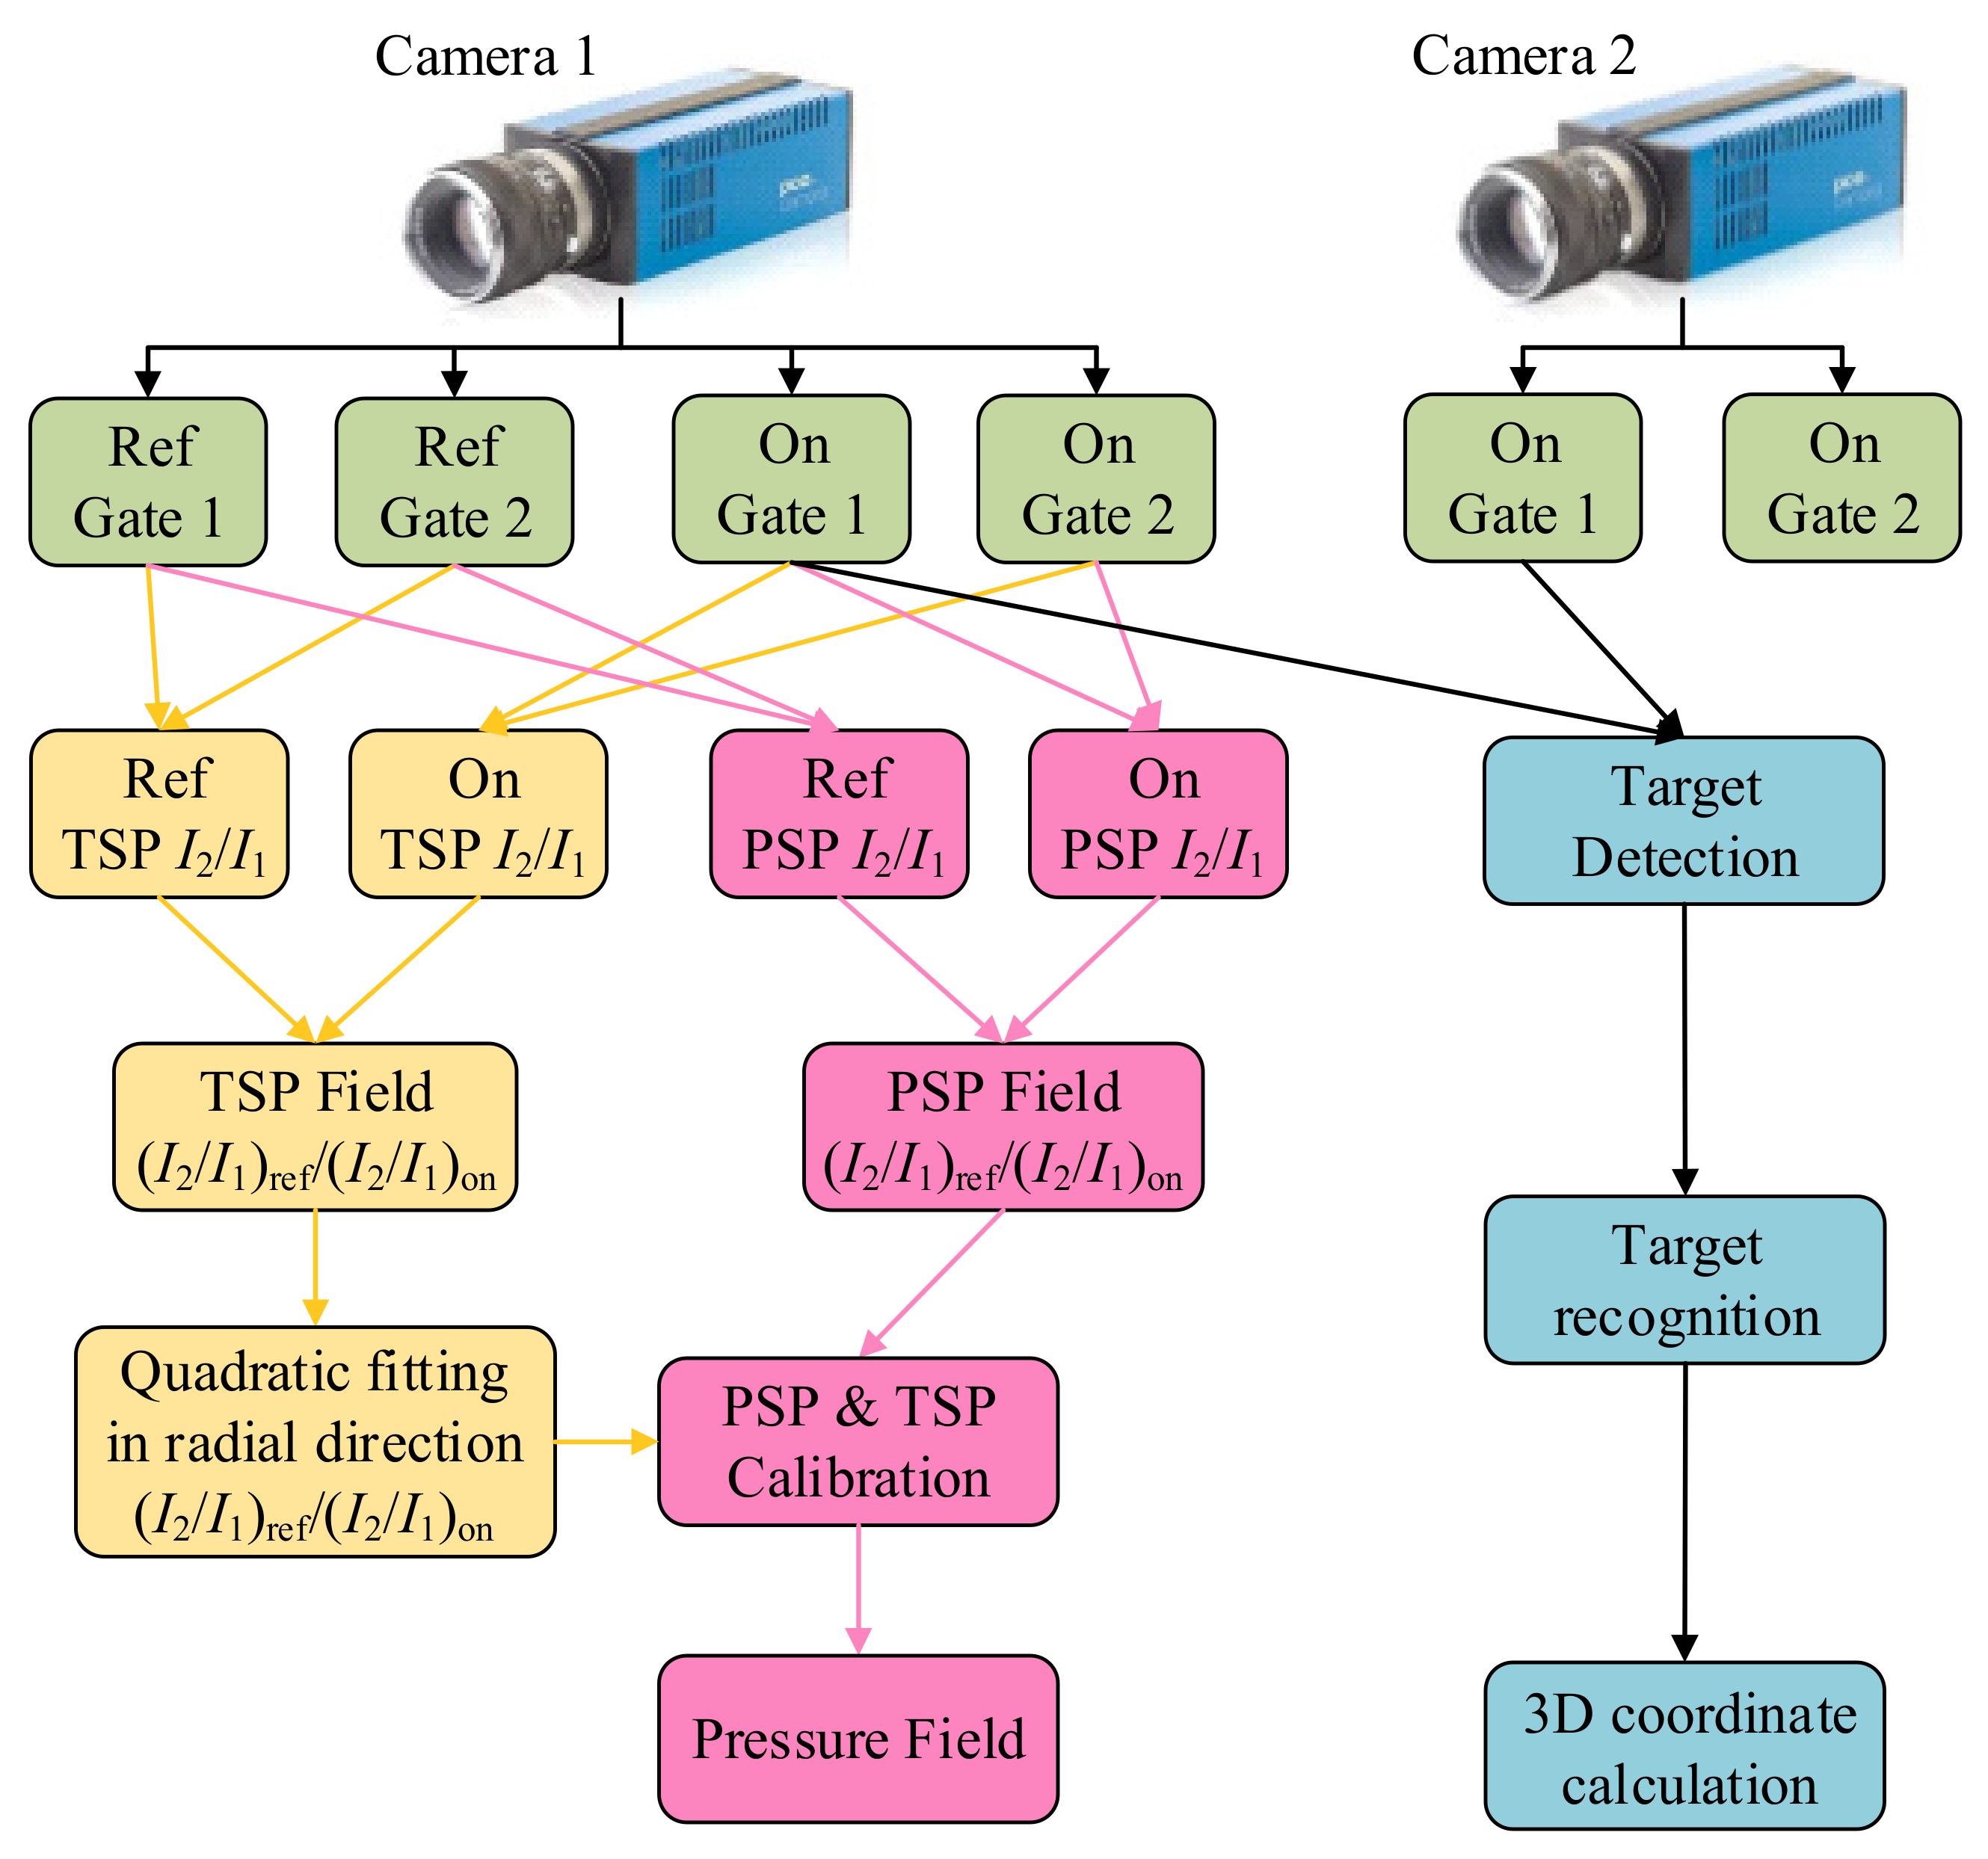
A single-shot lifetime approach was utilized to collect PSP data, and the schematic of such an approach is presented in Figure 4. Following the excitation of the pulsed laser (around 8 ns pulse width), the emissions of PSP and TSP decayed exponentially. Two consecutive images, which were referred to as Gate 1 and Gate 2, were recorded by the camera with a time interval of around 100 ns. The intensity ratios of PSP and TSP between the two gates (I2/I1) represented the emission lifetimes and were inversely proportional to the local pressure and temperature, respectively. This relation is shown in Equation (1):
I 2 / I 1 ref I 2 / I 1 on = A ( T ) + B ( T ) P P ref
in which A(T) and B(T) denote calibration coefficients. The subscript “ref” reflects the reference condition and “on” denotes the wind-on condition. The exposure of the first gate was 4 μs to realize the equilibrium of the intensity levels in these two gates. It should be noted that the wind-on conditions in current PSP experiments represent all the conditions with rotor rotating.
In order to verify the feasibility of the synchronous measurement system, the hover flight condition was measured continuously throughout the experiments. As per the signals from the rotor shaft encoder at diverse azimuth angles, the synchronous controller triggered two cameras and lasers simultaneously to obtain the transient images of the rotor blades. The rotation velocity was 840 rpm. Posterior to the heat balance, the temperature gradient was still steady in the spanwise orientation. The PSP blade and TSP blade smoothly entered into the camera field via modifying the exposure delay. In the course of the PSP and TSP measuring, different CPAs of θ = 0°, 4°, 8° were successively set. It is noteworthy that prior to the kinetic assays, multiple photos of the dark background had to be collected for environment light subtraction. The laser was turned off to create a completely dark environment. Ten background images were then captured using the same camera settings as in the experiments. The average of these images was calculated for both Gate 1 and Gate 2 and were referred as Idark1 and Idark2. For each PSP image captured, including both reference and wind-on conditions, Idark1 and Idark2 were firstly subtracted from the corresponding original image. The following processing procedures in Figure 5 were then conducted. For the recording of the reference photos, the rotation velocity was 50 rpm and the collective pitch was 0°. Consequently, the effects of aerodynamical loading could be neglected. The flap and lag angles were hypothesized as 0°. It is noteworthy that the data collection rate of such a system (approximately 7 Hz) was lower than the rotor frequency (14 Hz), as it was restricted by the repetitive rates of these cameras.

3. Data Processing

The data processing flowchart of the synchronous measuring system is presented in Figure 5. The general procedure of the single-shot lifetime PSP data processing includes image registration, deblurring, temperature calibration, filtration, etc. For detailed information, please refer to the article written by Disotell et al. [16]. In this study, the lifetimes of PSP and TSP under reference conditions were approximately 5 μs, which induced the image blurring of approximately 1 mm at the blade tip. In Figure 6, the original PSP images at Gate 2 were compared for reference and rotation conditions. As can be seen from the marked points and edges, no severe image blurring was observed, therefore, no image deblurring approach was utilized to prevent the introduction of extra errors. For stereo photogrammetrical analysis, target identification and recognition were utilized on the sharp gate 1 photos from these two cameras.

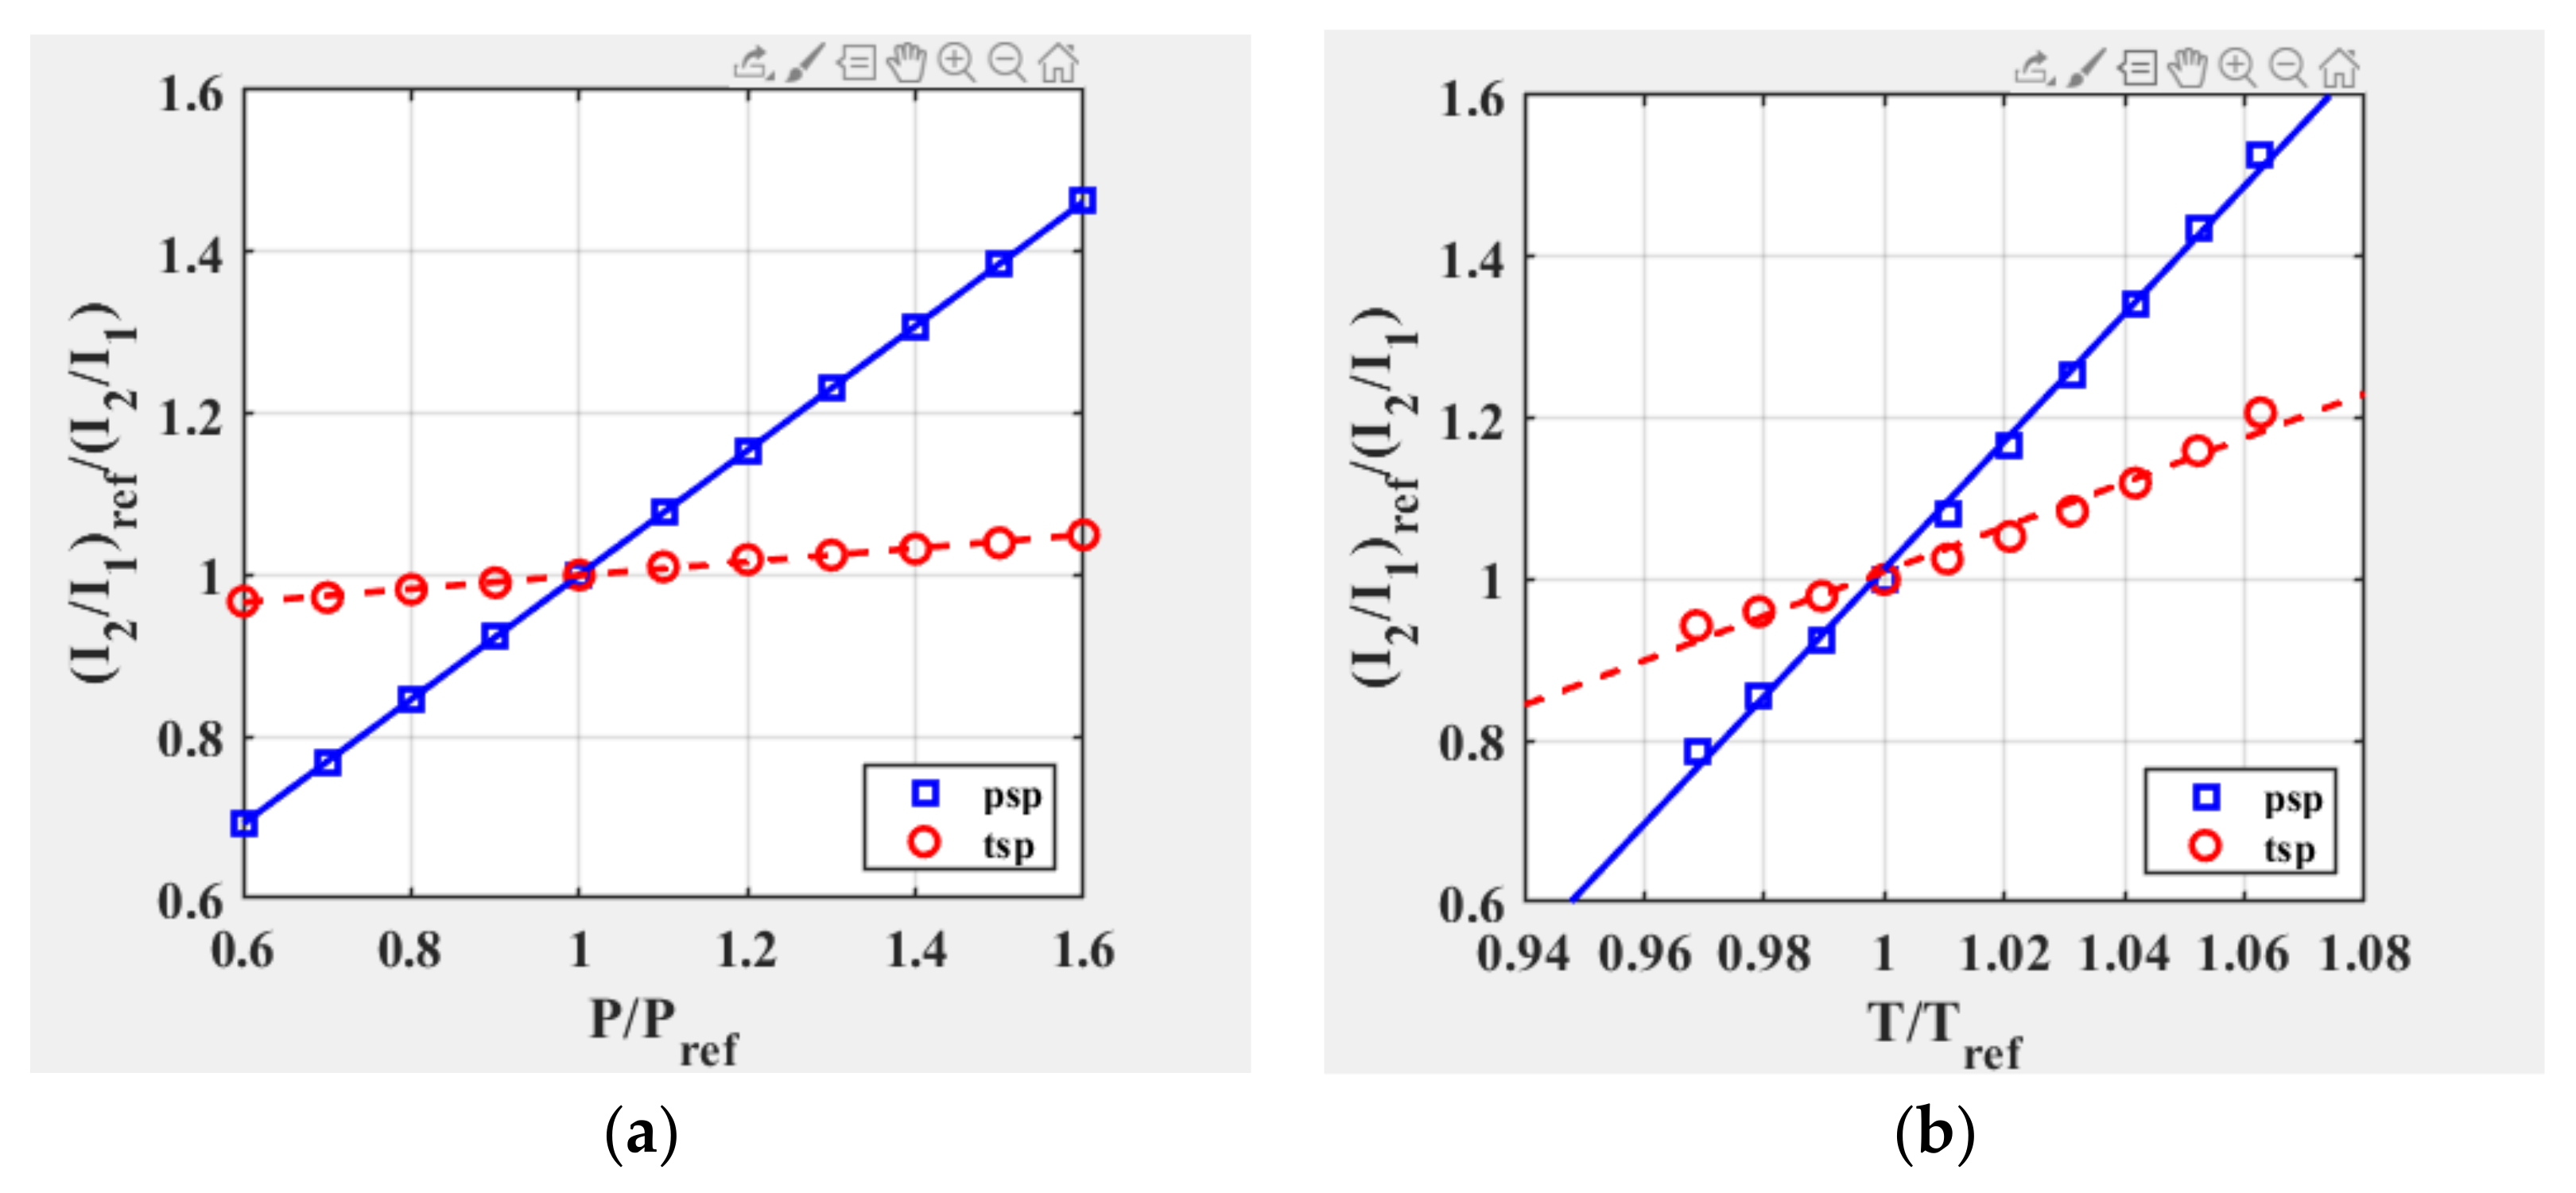
3.1. PSP Paint Calibration

During rotor blade painting, two small swatches of PSP and TSP were applied simultaneously for paint calibration. Paint calibration was performed in a self-made calibration chamber with individually controlled pressure and temperature. Camera parameters and reference conditions (97 kPa and 287 K), which influenced the PSP calibration coefficients, were kept identical in the rotor experiments. Since the temperature and pressure of the blade surface vary greatly in the 4-m (diameter) rotor experiment, it was necessary to calibrate the sample in a larger pressure and temperature range. The pressure range and temperature range were 60–160 kPa and 278–305 K, respectively. The calibration outcomes are presented in Figure 7. Just as expected, TSP showed little sensitivity to pressure, while PSP showed high temperature sensitivity. Therefore, temperature-caused deviations in the PSP outcomes have to be removed via the TSP data. As the temperature calibration range was relatively large, the temperature sensitivity no longer presented a linear relationship. Hence, quadratic fitting was used in this paper.

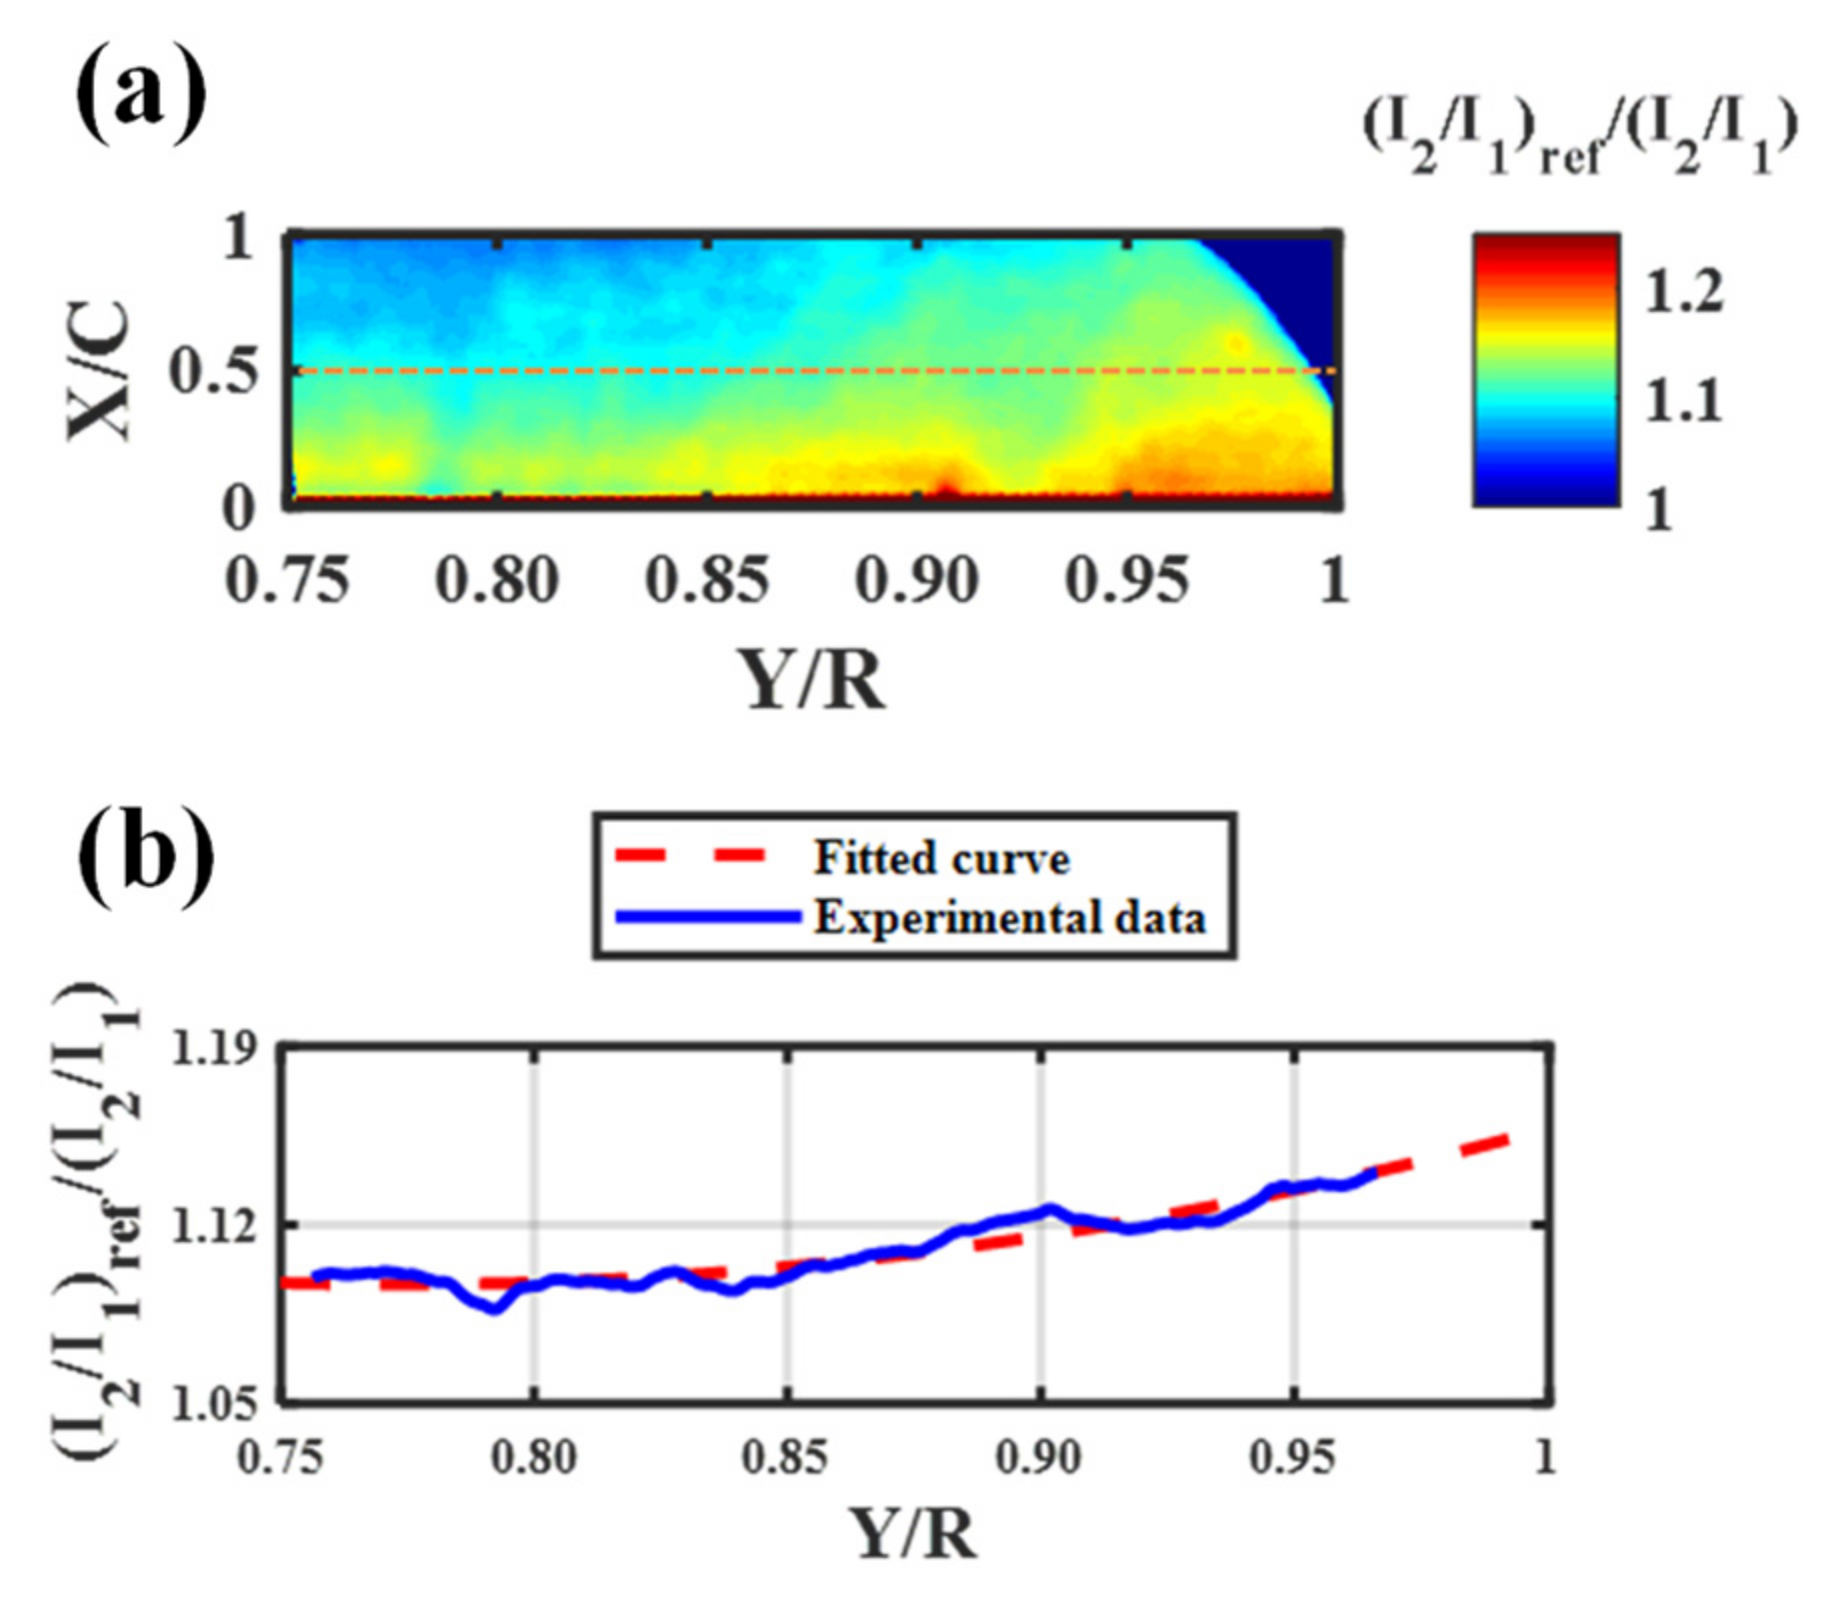
3.2. PSP Temperature Correction

Due to the temperature sensitivity of PSP, the temperature correction of PSP is critical for the accuracy of the final pressure distribution results. The temperature-induced error was removed based on the temperature distribution measured by TSP and the PSP’s temperature sensitivity acquired from the calibration. In this paper, the one-dimensional correction method was adopted. The temperature distribution was assumed to increase quadratically in the radial direction based on Equation (2):
T aw = T 1 + r ( k 1 2 ) M 2
in which r denotes the recovery factor and k is the specific heat ratio.
To eliminate error propagation in the temperature correction, the TSP intensity ratio-of-ratios (IRoR) was first fitted with a quadratic curve. The TSP IRoR field and the effect of quadratic fitting are presented in Figure 8. In Figure 8a, the horizontal and vertical directions represent the radial and chord directions, respectively. Figure 8b presents the span-wise temperature distribution extracted and the effect of quadratic fitting at x/C = 0.5. At each radial location, 10 chordwise pixels in the middle of the blade were averaged to reduce the random measurement errors caused by paint non-uniformity and camera noise.
Then the fitted curve was used to acquire the corrected PSP IRoR_corr fields according to the following equation:
I RoR _ corr = I RoR _ PSP ( I RoR _ TSP 1 ) m ( T ) + 1
where IRoR_PSP and IRoR_corr are PSP IRoR before and after temperature correction, and m(T) is the ratio of temperature sensitiveness between PSP and TSP.
Finally, the pressure distribution was converted based on the corrected PSP IRoR_corr fields and the pressure calibration results. During data processing, 15 marker points were applied near the edge of the blade for image registration. As there were no data available at these points, pressure was interpolated in a small area around each point to fill empty pixels.

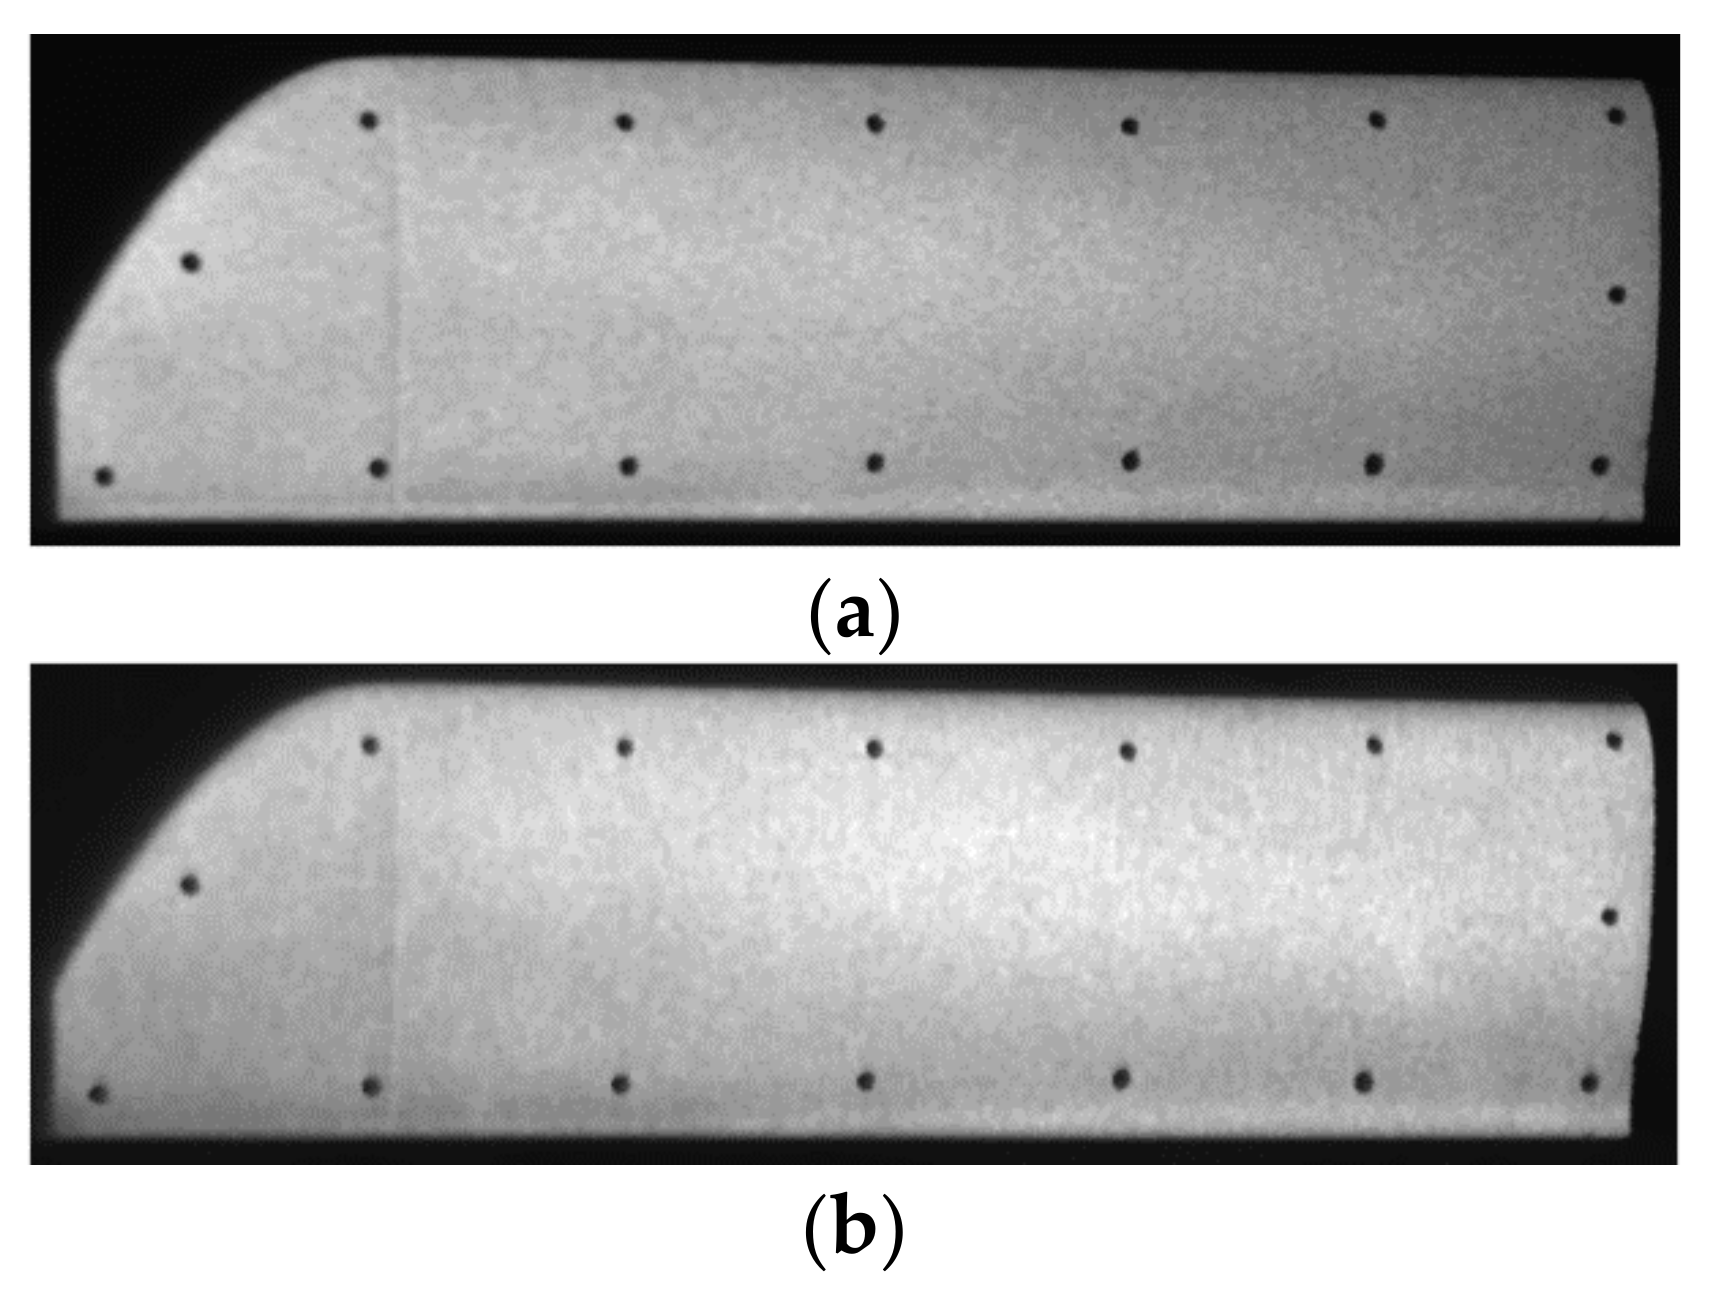
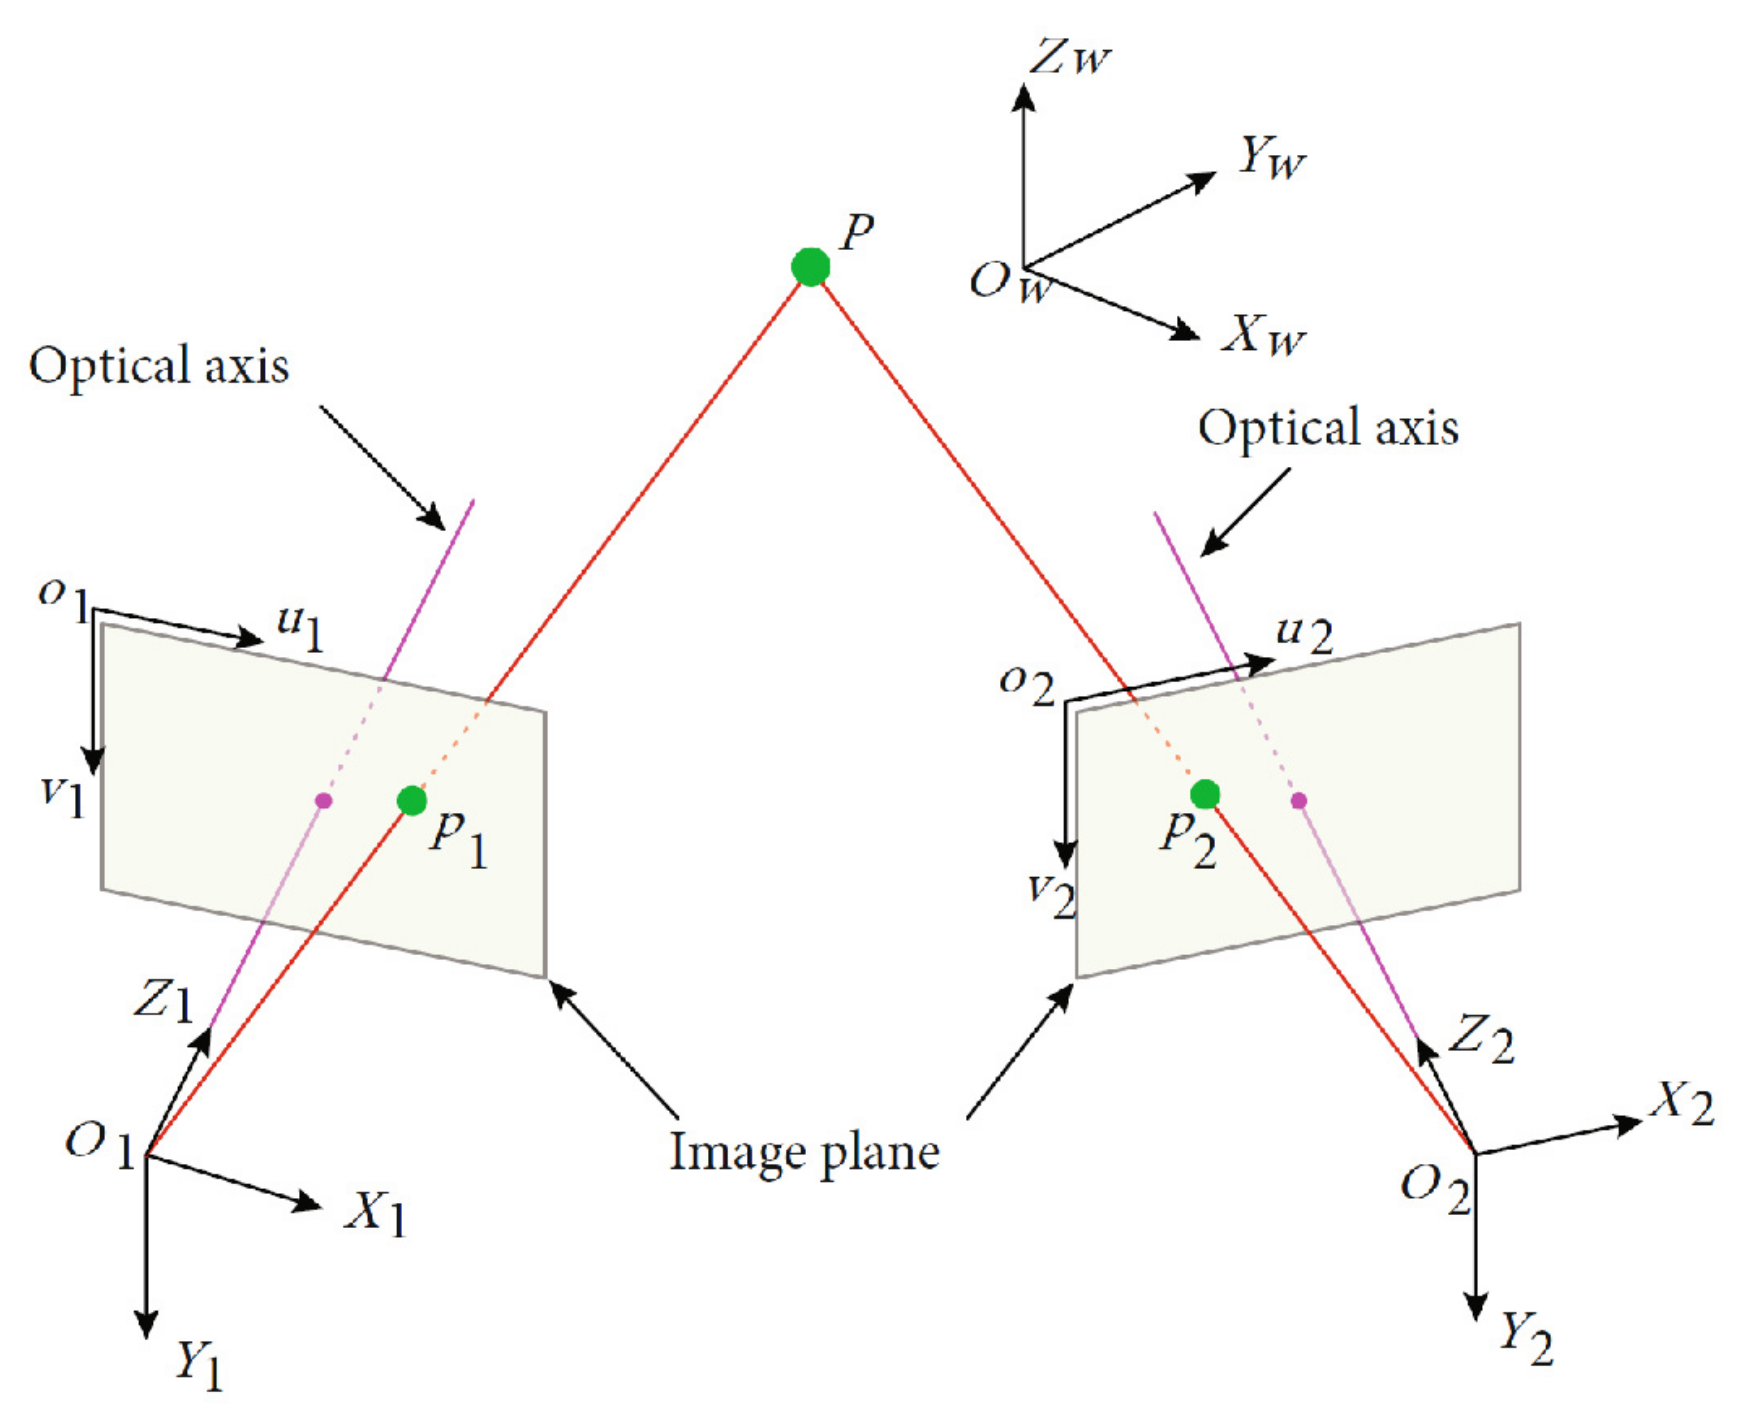
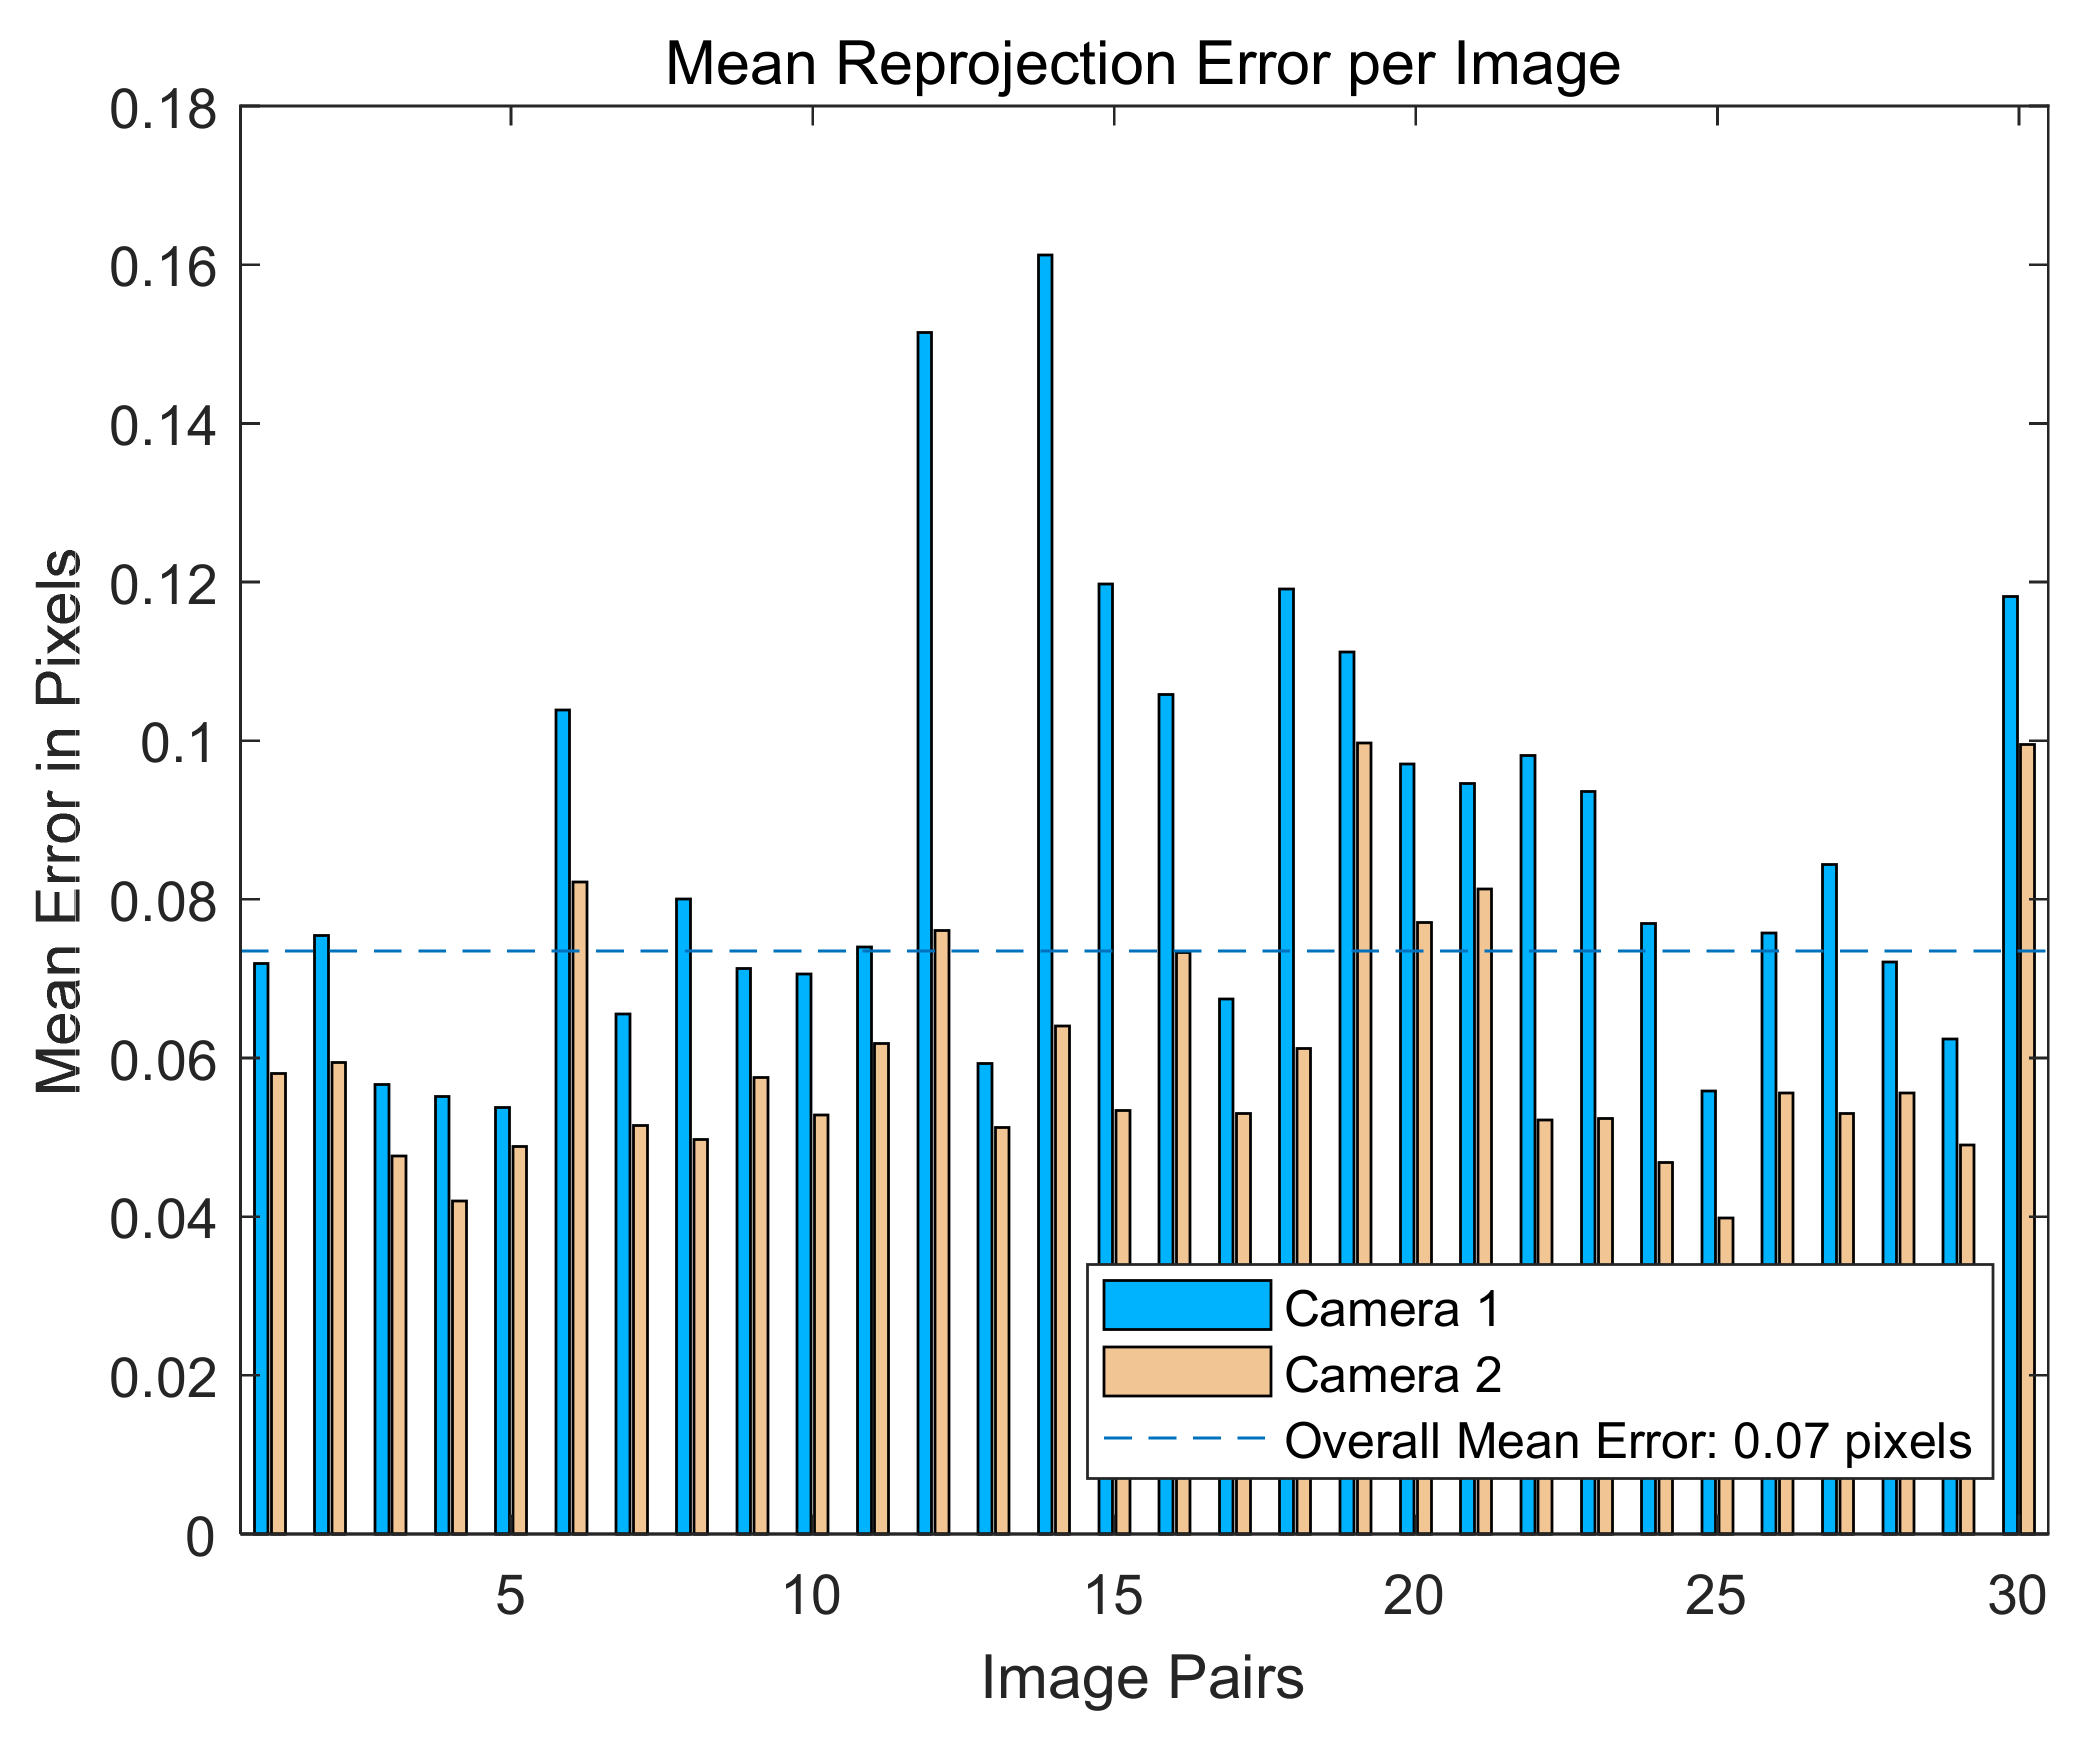
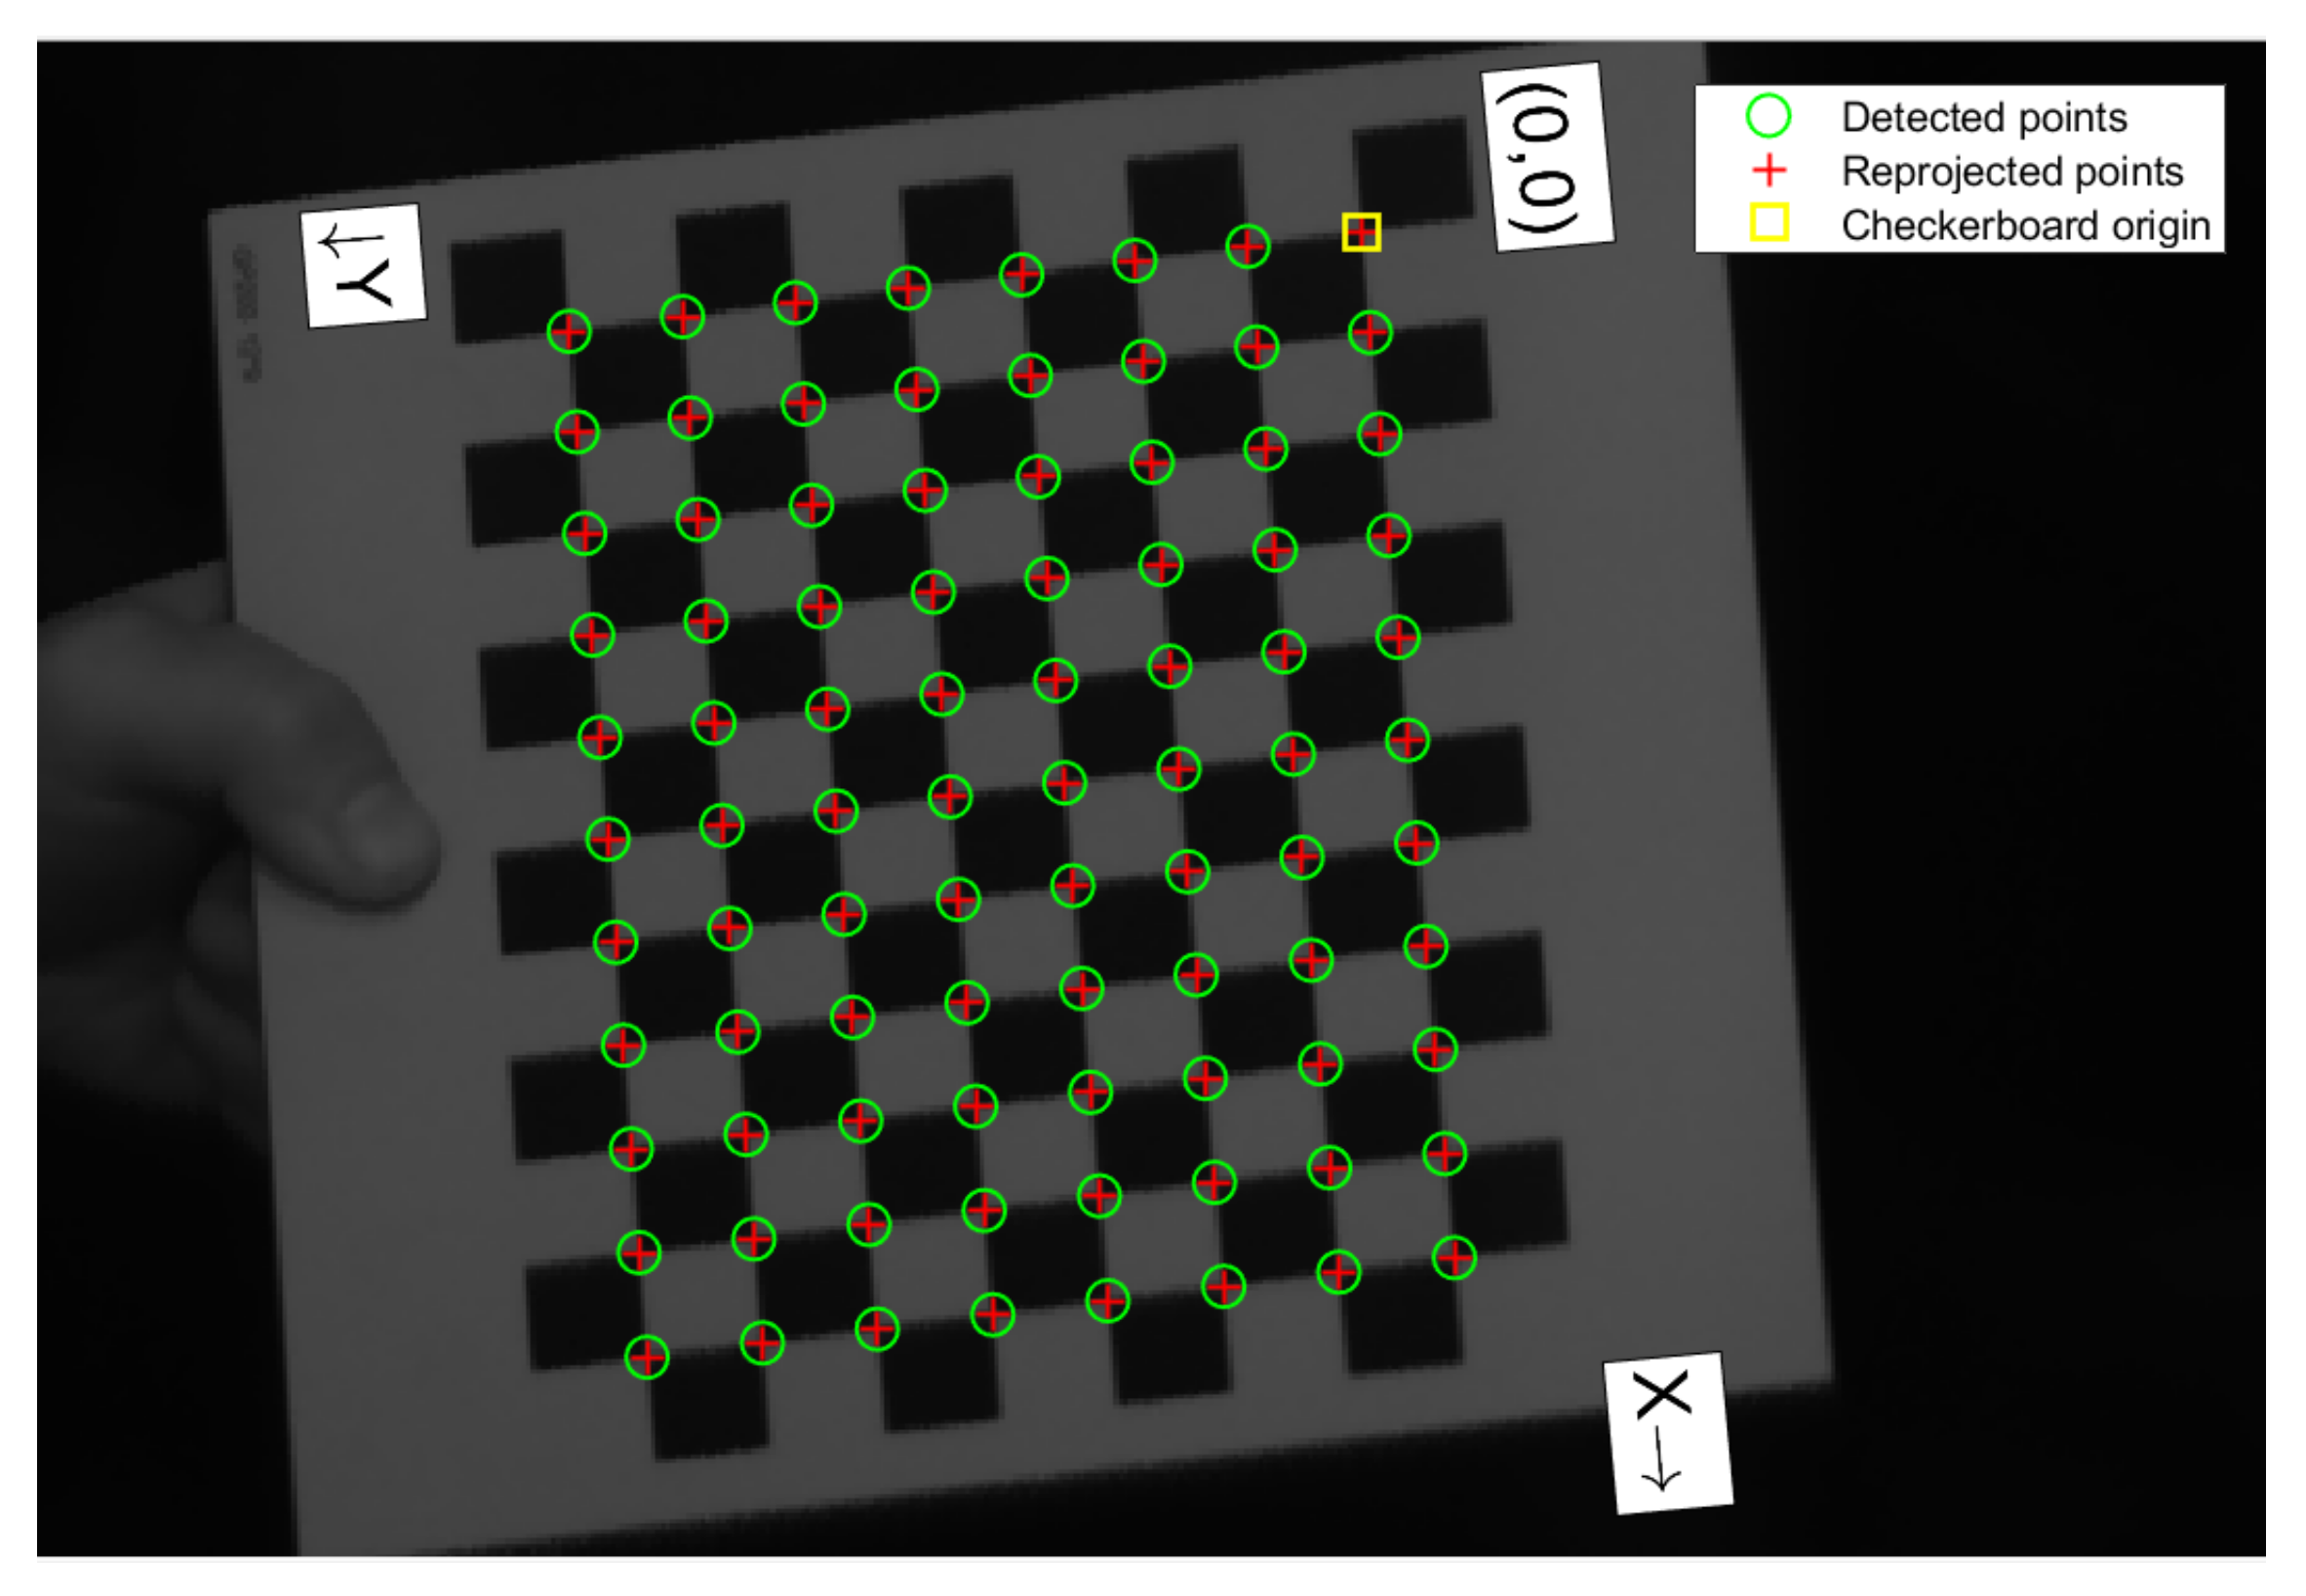
3.3. Binocular Stereophotogrammetry

The principle of binocular stereophotogrammetric analysis is presented in Figure 9. Based on the principle of parallax, two cameras were utilized to acquire two photos of the object from diverse locations, and the 3D data of the object could be acquired via computing the location error of the relevant points in the images. Binocular stereo calibration was utilized to solve the internal and external parameters of the binocular imaging system and was leveraged to establish the corresponding relationship between the binocular vision measurement and the three-dimensional world measurement.
Generally, the camera is modeled by the imaging mathematical model as follows:
s x y 1 = A R T X Y Z 1
where (x, y) and (X, Y, Z) are the two-dimensional image coordinates and its corresponding three-dimensional coordinates, s is an arbitrary scale factor, (R T), called the extrinsic parameters, is the rotation and translation which relates the world coordinate system to the camera coordinate system, and A, called the intrinsic matrix, is given by
A = f x γ x 0 0 f y y 0 0 0 1
with (x0, y0) the coordinates of the principal point, fx and fy the equivalent focal length in image x and y axes, and γ the parameter describing the skewness of the two image axes.
Considering the radial distortion of the camera lens, its mathematical model is expressed as follows:
x ˜ = x + ( x x 0 ) k 1 ( x 2 + y 2 ) + k 2 ( x 2 + y 2 ) 2 y ˜ = y + ( y y 0 ) k 1 ( x 2 + y 2 ) + k 2 ( x 2 + y 2 ) 2
where (x,y) and ( x ˜ , y ˜ ) are the ideal image coordinates and its corresponding real observed image coordinates, k1 and k2 are the coefficients of the radial distortion.
So far, Zhang’s [20] correction approach is a commonly utilized tool in substantial photo processing programs. Hence, herein, the Stereo Camera Calibration app in the MATLAB program was utilized to achieve these two cameras’ correction. In the course of correction, a calibration checkerboard plate with a side length of 15 mm was placed at the same height as the blade, and overall 30 pairs of photos were harvested for correction.
By virtue of the calibrated intrinsic and extrinsic parameter matrices, the focus of the checkerboard can be remapped back, the process of which is called reprojection. As shown in Figure 10, the average error of 30 images was only 0.07 pixels, which was less than the recommended value of 0.1 pixels, which also displayed the accuracy of the binocular stereophotogrammetry measurement system.
In the binocular measurement, since there was no significant texture feature on the rotor blade surface, the traditional stereo matching method could not achieve the accurate matching of blade image pairs. In this paper, the mark points used for PSP image registration were used for detection and identification, which could realize the precise positioning and matching of mark points.
The data processing procedure of the displacement measurement is presented in Figure 5. The first step was to compute the central positions of the entire targets on the rotor blade. Subsequently, a Canny edge detecting device was utilized to abstract the photo edges. With geometrical constraints, like shape and perimeter, the target edges could be well retained, whereas other ones were removed, as presented in Figure 11. For the sake of obtaining more precise target edges, Zernike orthogonal moments [21] were utilized to realize subpixel outcomes. With least-squares ellipse fitting on the subpixel edges of all targets, their subpixel center coordinates were acquired, hence we obtained precise target positions. After we obtained the 2D image coordinates of the matching marker points in the blade image pair, the 3D space coordinates of the target point could be calculated according to the internal and external parameters obtained by the binocular stereo calibration.
In order to verify the calibration accuracy of the binocular stereophotogrammetry measurement system, the distance between the re-projected corner points on the calibration checkerboard was calculated, as shown in Figure 11. The measured average value was 14.9947 ± 0.0598 mm, and the nominal value of the side length of the checkerboard was 15 ± 0.01 mm, hence we considered that the static calibration error of the system was above 0.1 mm.

4. Results and Discussion

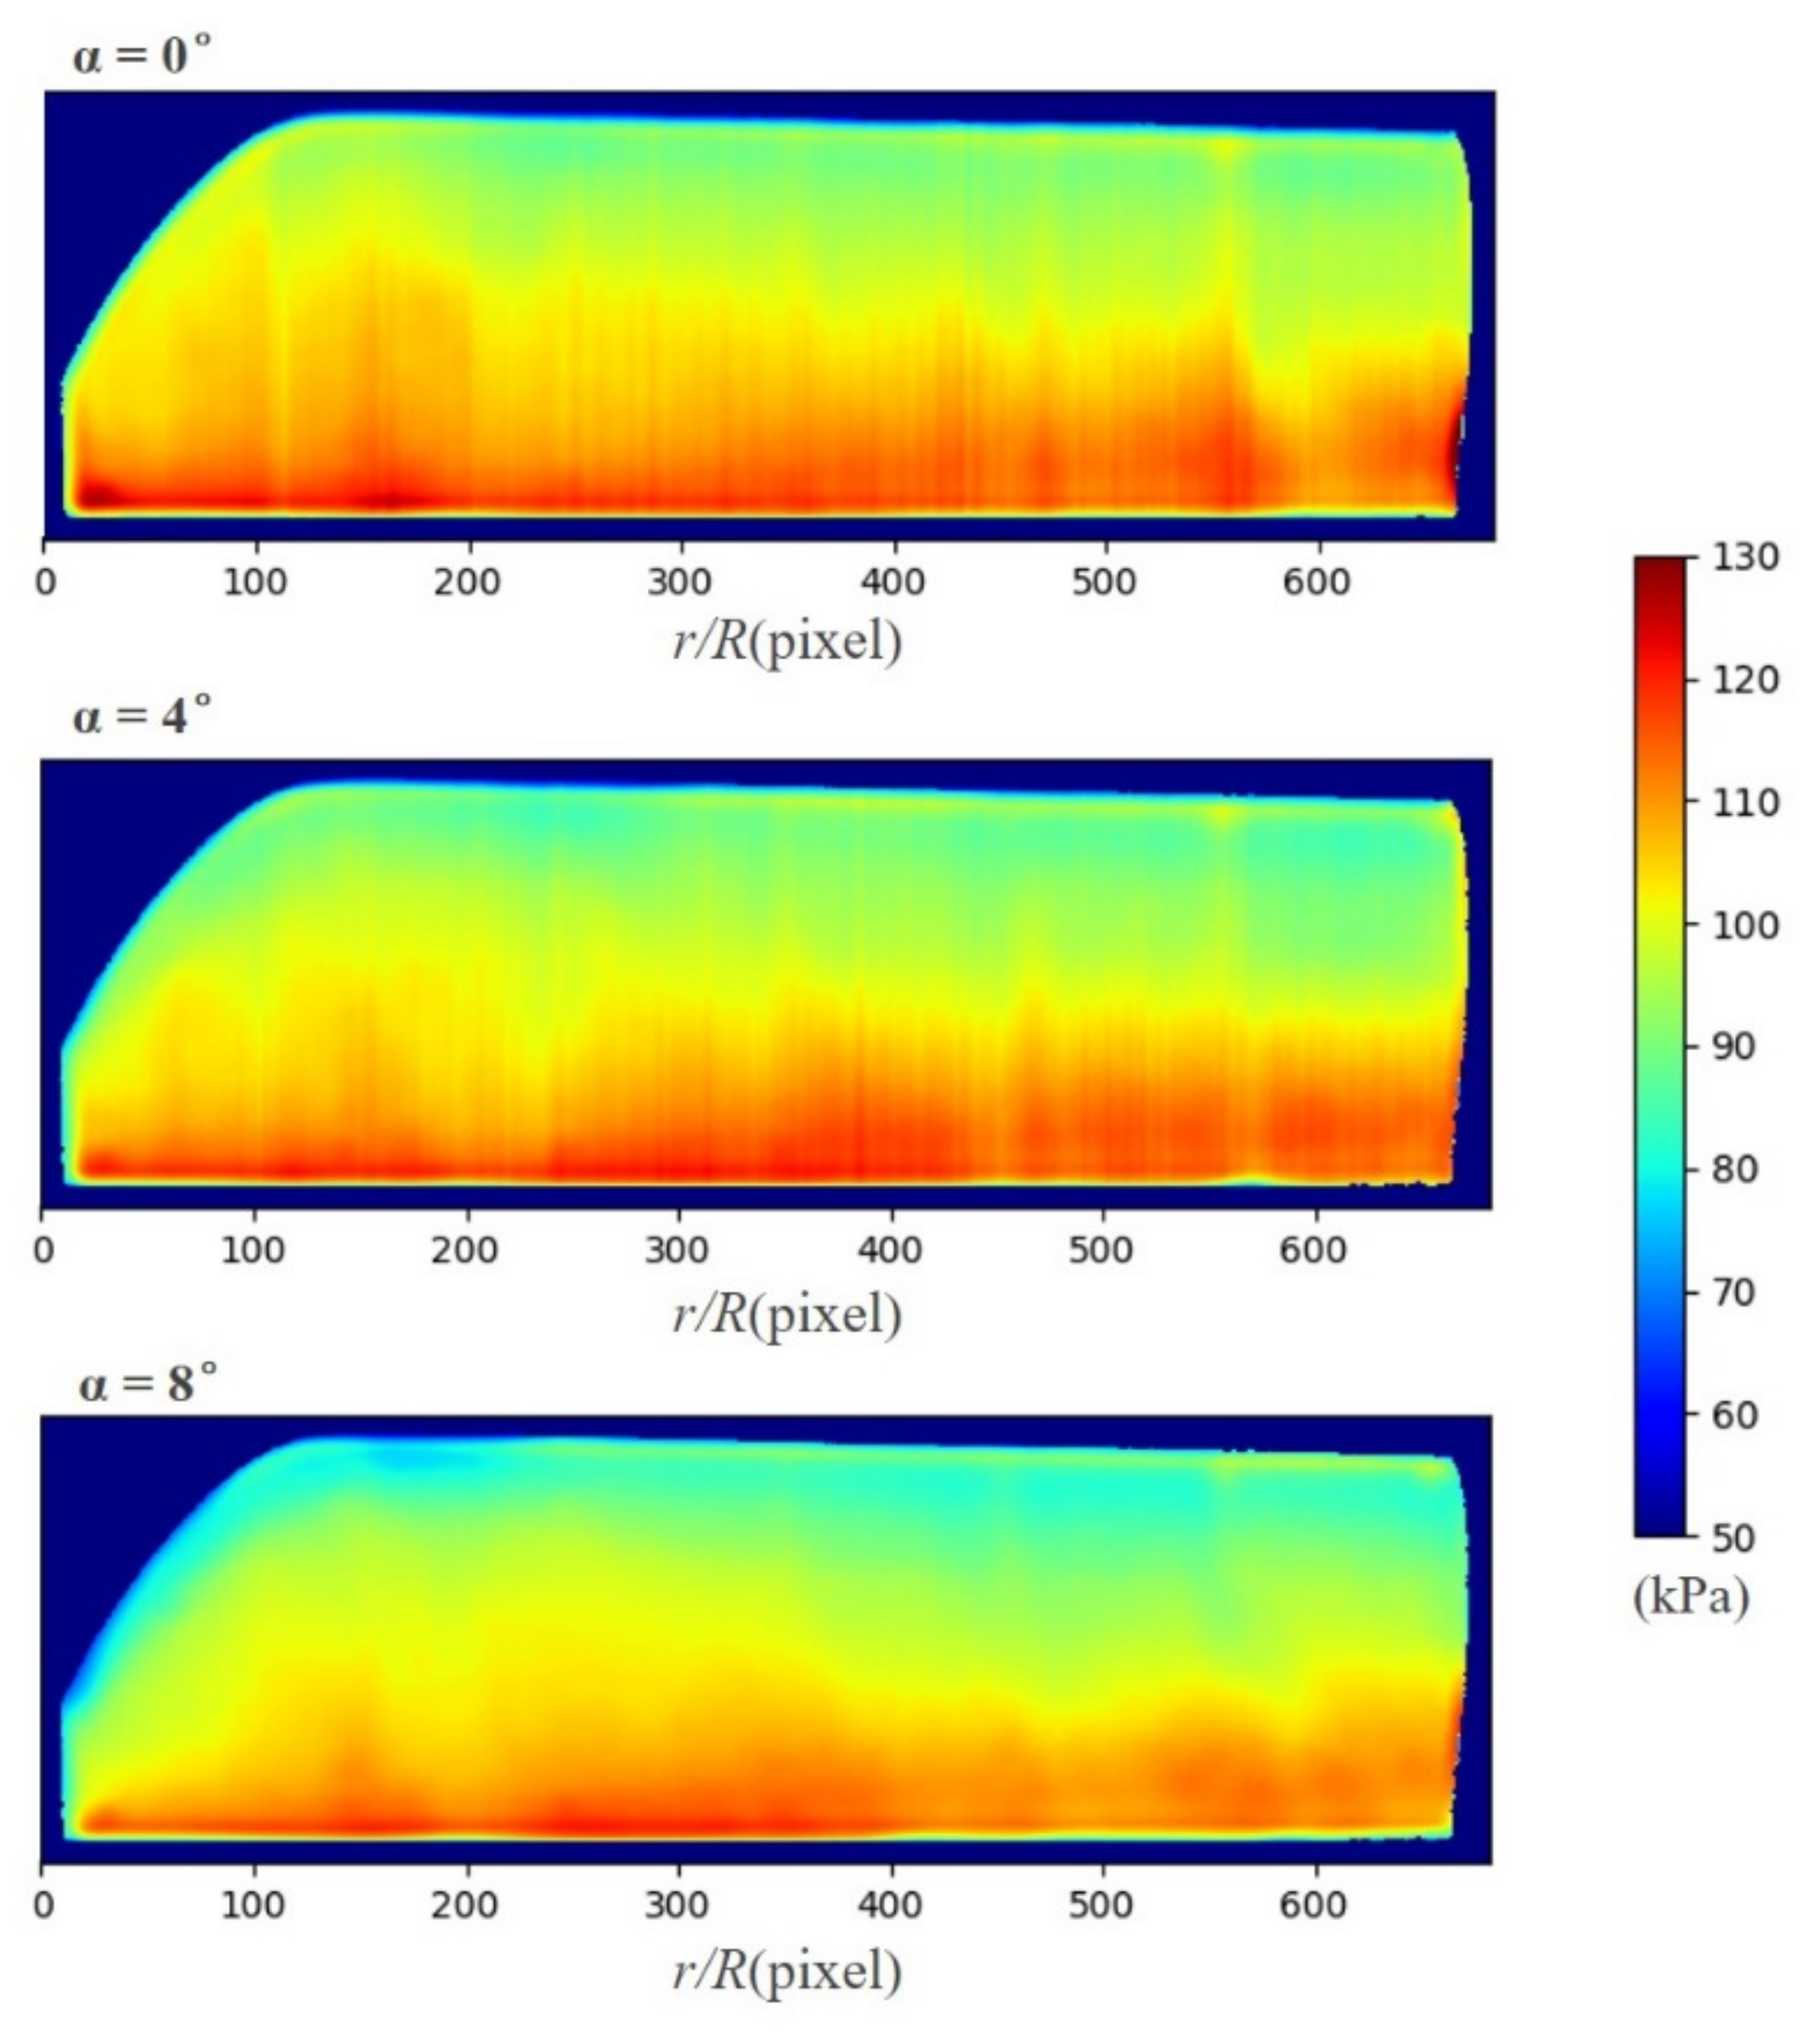
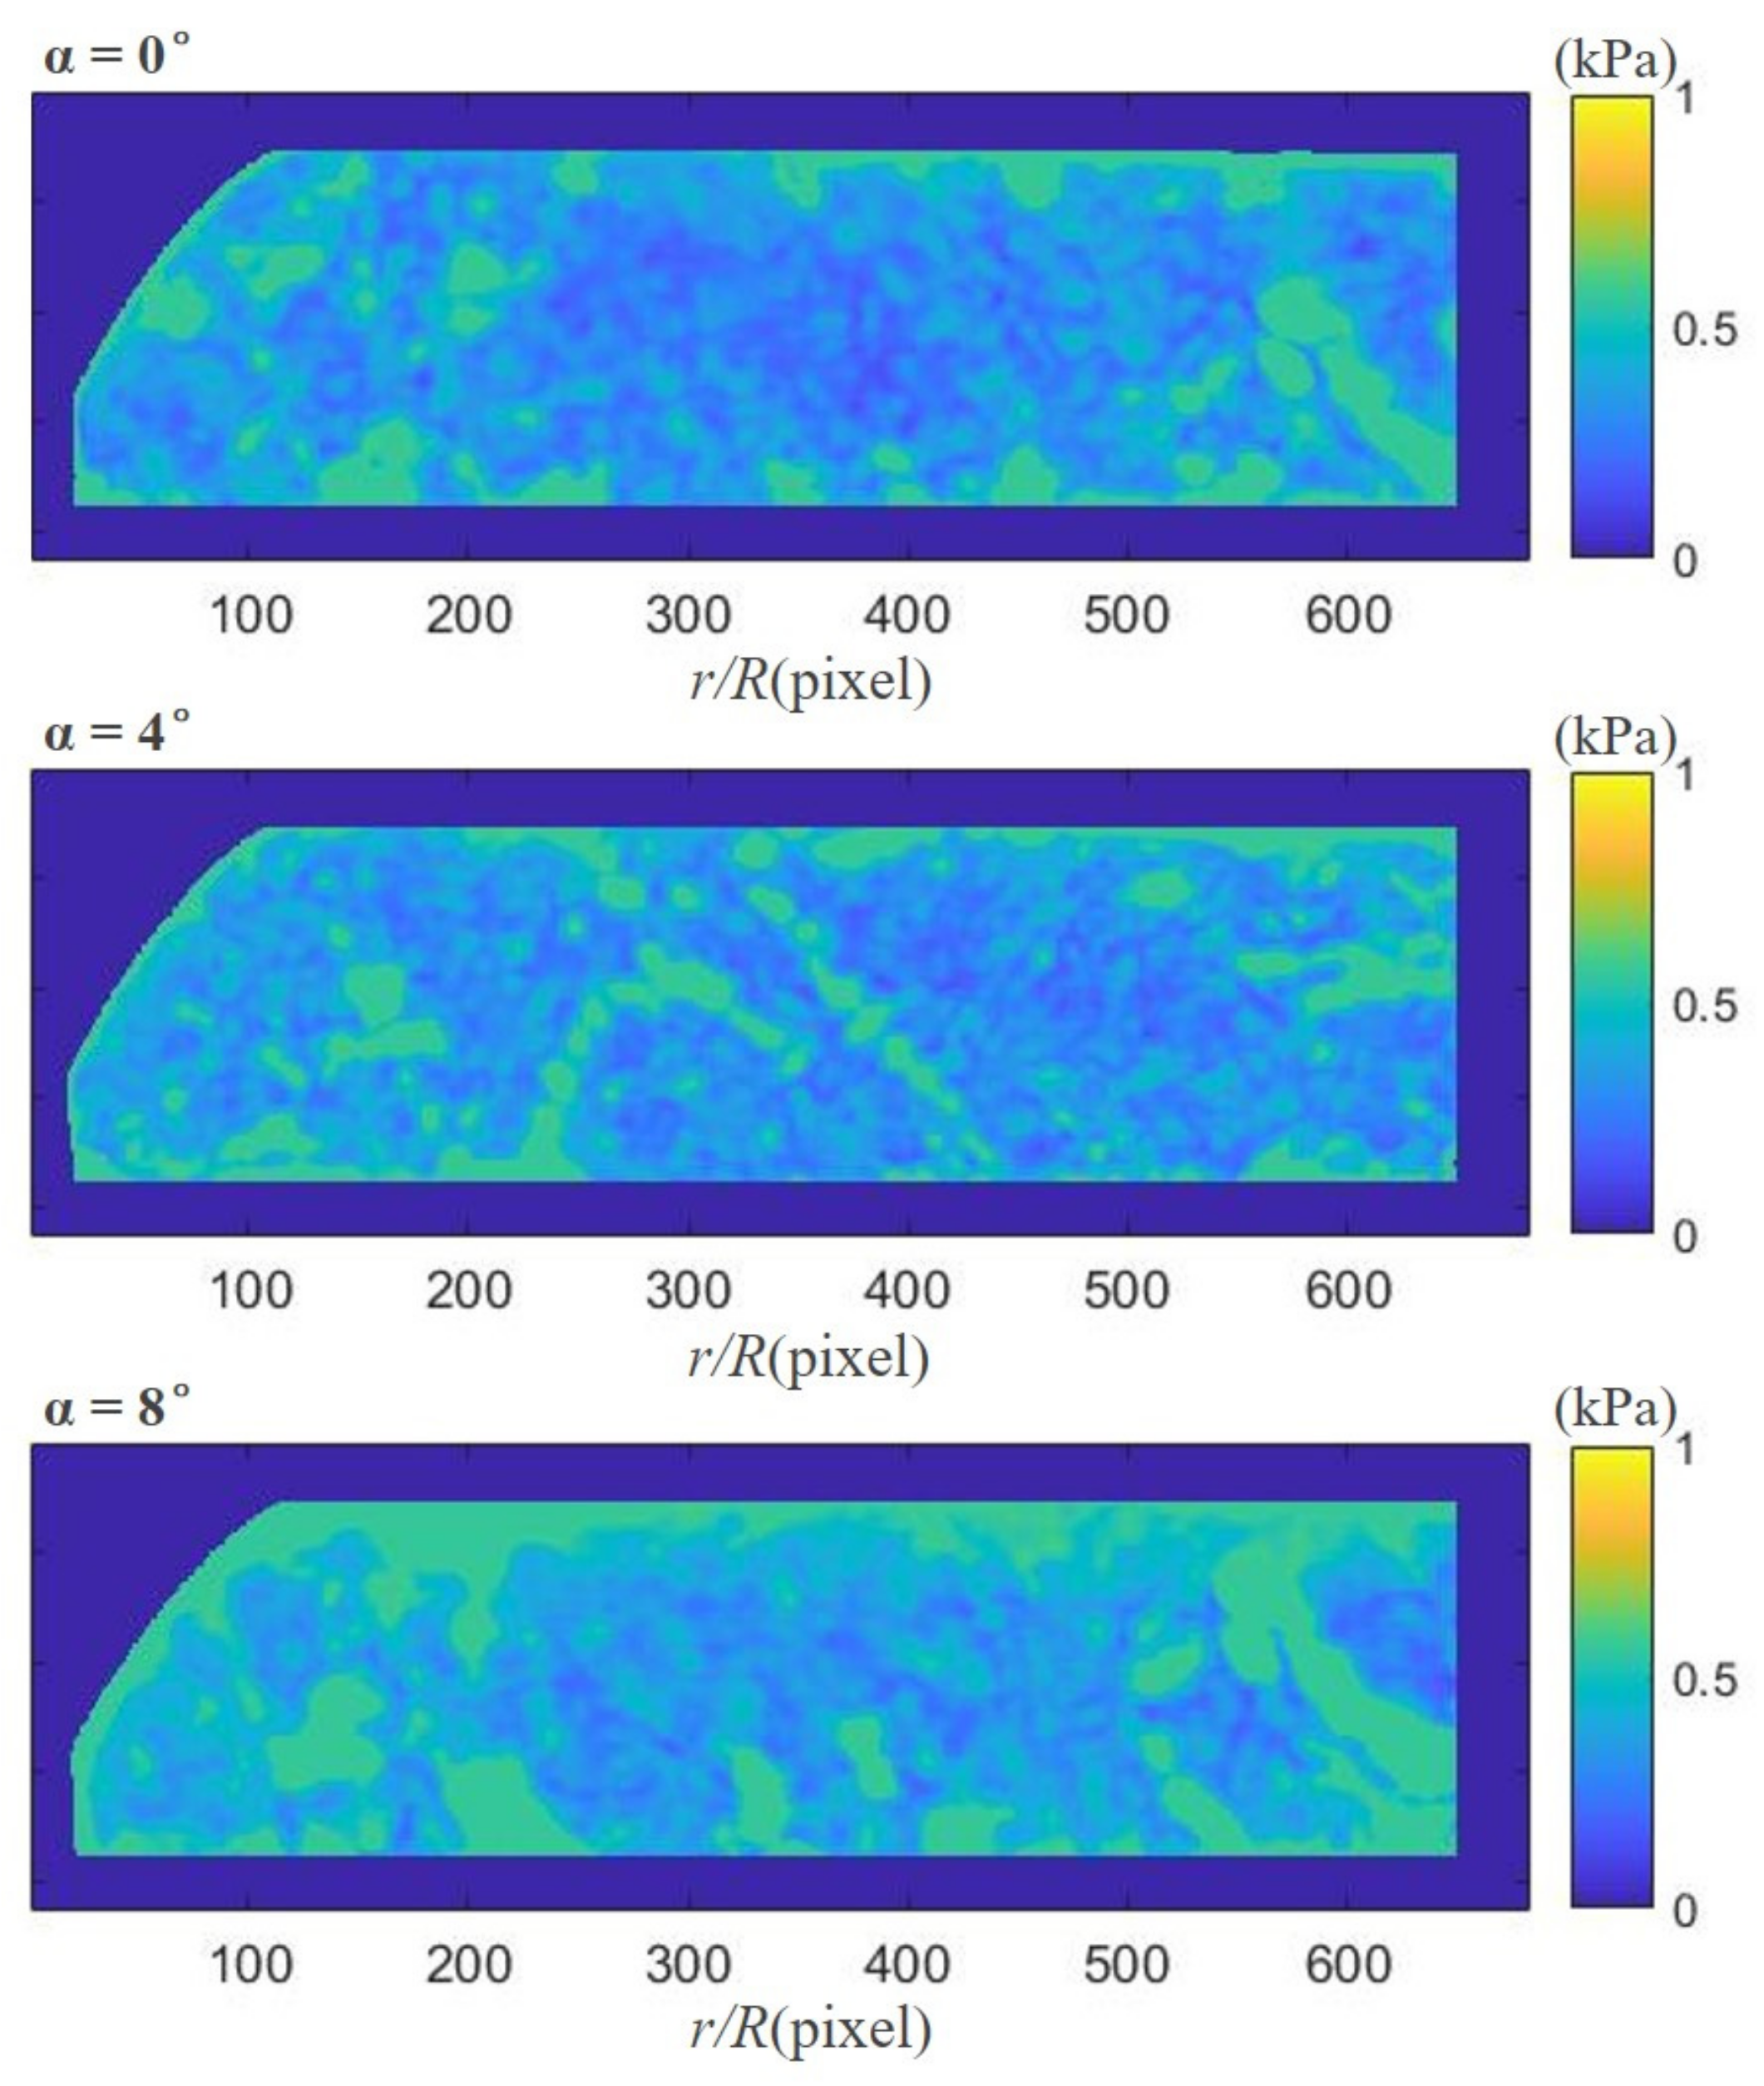
4.1. Results of Surface Pressure Measurement

The pressure distribution on the blade surface measured by PSP under diverse pitch angles is presented in Figure 12. Three collective angles of 0°, 4°, and 8° were set during the assay. Since the collective angle represents the overall aerodynamic load of the paddle, the larger the collective angle, the greater the pulling force generated by the rotor, and therefore the lower the pressure on the upper surface. A low pressure area can be clearly observed around the leading edge of the blade at α = 8°. As the CPA increased, the pressure drop in the low pressure region was more severe and occupied a larger leading edge area. Pressure recovery can be observed along the chord, and the pressure gradient up the chord became larger as the angle of attack elevated.
The main purpose of this rotor experiment is to verify the synchronous measurement technology for pressure and displacement analysis. As no other pressure sensors were installed on the blade, the comparison of pressure measurement accuracy could not be carried out. However, as the test conditions were relatively simple, the pressure field did not change too much in the hovering state. Hence, the fluctuation of the pressure field of 30 consecutive sheets at each angle of attack could be analyzed. The calculated standard deviation is shown in Figure 13, where the STD values at all pixels was subjected to normalization via the relevant average pressure of 30 single-shot photos. As the pitch angle elevated, the STD elevated slightly because of the fluctuated pressure. Overall, however, the STD was less than 0.007 (700 Pa). The rotor speed in this experiment was 840 rpm, thereby the velocity of the blade tip was about 175.8 m/s, and the kinetic pressure at the blade tip was about 19.9 kPa. According to the normalization of the kinetic pressure at the blade tip, the repeatability errors introduced by pressure fluctuations in this pressure measurement were less than 3.5%.

4.2. Results of Blade Displacement Measurement

By measuring the 3D coordinates of the blade targets in an instantaneous manner, 3D re-construction of the rotor blade could be realized, which was utilized to study the kinetic movement of the rotor blade in a qualitative manner. Figure 14 presents the re-construction outcomes under the conditions of different pitch angles of 0°, 4°, and 8°, respectively. It can be seen from the figure, as the control pitch angle increased, that the rotor blade was gradually raised under the action of aerodynamic load, and the blade tip was upturned, and the displacement of the blade tip gradually increased with the increase of the pitch angle.
Based on the 3D coordinates of the mark points on the blade tip, the flapping displacement of the blade tip under different control pitch angle conditions was calculated. As shown in Figure 15, the larger the control pitch angle, the larger the tip flapping displacement; in addition, since the rotor was in a hovering state, the displacement under different pitch angle conditions was basically stable.
Since the actual distances between any two blade targets were known and almost did not vary in the assays, the measuring accurateness could be assessed via computing the 3D distances of the targets and via the comparison with the actual values. Table 1 presents the measuring accurateness of diverse collective pitch in hover flight. The accurateness of blade targets was computed as per the 3D distances between these two targets along the chord-wise orientation. Evidently, the accurateness of the blade targets changed obviously as the test conditions varied. With the elevation of the CPA, the accurateness reduced progressively. The major reason is that stereophotogrammetrical analysis often exhibits lower measuring accurateness in the Z-orientation in contrast to the XY plane. When the CPA varied, the comparative positions of blade targets became near the Z-orientation. Hence, the measuring accurateness was reduced. The mean accurateness of blade targets was approximately 0.174 mm.

5. Conclusions

In this work, the synchronous pressure analysis and displacement measuring on rotating blades were achieved via the binocular stereophotogrammetry PSP system. Pressure measurements were completed by the single-shot lifetime PSP approach. By virtue of PSP feature targets, the instantaneous 3D locations were obtained, which produced the blade displacement field. In the proposed method, two cameras were used, which required larger optical access than normal PSP measurement system. As the quality of the displacement measurements was related to the contrast ratio of PSP image, a higher power laser source needs to be used. When the signal level of PSP image was low, accuracy of the identification and location of the marker points may be affected.
The proposed method was validated on a Φ4m diameter rotor bench under hover flight conditions. The experiment outcomes displayed the validity of the binocular stereophotogrammetry PSP system. The displacement measuring accuracy was better than 0.2 mm. At the same time, the pressure measurement accuracy was not affected and was comparable to the accuracy of previous results, with STD values below 700 Pa. Our system offers a practical solution for the exploration of fluid–structure interplay and is remarkably prospective for the wind tunnel tests of helicopter rotor blades.

Author Contributions

Conceptualization, C.W. and L.L; methodology, X.L. and C.Z.; software, L.J. and X.L.; writing—original draft preparation, C.W.; writing—review and editing, C.Z.; visualization, X.L.; supervision, L.L. and D.P.; project administration, L.L. and G.L.; funding acquisition, C.W. All authors have read and agreed to the published version of the manuscript.

Funding

This research was funded by the State Key Laboratory of Aerodynamics of China (grant number SKLA2019040302).

Institutional Review Board Statement

Not applicable.

Informed Consent Statement

Not applicable.

Data Availability Statement

Not applicable.

Conflicts of Interest

The authors declare no conflict of interest.

References

  1. Schneider, O. Analysis of SPR measurements from HART II. Aerosp. Sci. Technol. 2005, 9, 409–420. [Google Scholar] [CrossRef]
  2. Wang, Y.; Cai, L.; Wang, S.; Zhou, X. Numerical Investigations of the Influence of Unsteady Vane Trailing Edge Shock Wave on Film Cooling Effectiveness of Rotor Blade Leading Edge. J. Therm. Sci. 2018, 27, 135–145. [Google Scholar] [CrossRef]
  3. Shi, J.; Xu, T.; Schafer, S.; Chen, C. Adaptive Control of Shock Waves with a Passively Morphing Layer for Rotating Blades. J. Aerosp. Eng. 2015, 28, 1040140701. [Google Scholar] [CrossRef]
  4. Castells, C.; Richez, F.; Costes, M. A Numerical Investigation of the Influence of the Blade-Vortex Interaction on the Dynamic Stall Onset. J. Am. Helicopter Soc. 2021, 66, 1–13. [Google Scholar] [CrossRef]
  5. Weiss, A.; Geisler, R.; Müller, M.; Klein, C.; Henne, U.; Braukmann, J.; Letzgus, J. Dynamic-stall measurements using time-resolved pressure-sensitive paint on double-swept rotor blades. Exp. Fluids. 2022, 63, 15. [Google Scholar] [CrossRef]
  6. Johannes, N.; Braukmann, C.; Andreas, G.; Markus, R. Blade Tip Vortex System of a Rotor with Cyclic Pitch. AIAA J. 2020, 58, 2869–2880. [Google Scholar]
  7. Wu, J.; Stalnov, O.; Chen, W.; Yang, Z.; Huang, X. Transient analysis of blade-vortex interaction noise. Aerosp. Sci. Technol. 2022, 120, 107294. [Google Scholar] [CrossRef]
  8. Bauknecht, A.; Ewers, B.; Wolf, C.; Leopold, F.; Yin, J.; Raffel, M. Three-dimensional reconstruction of helicopter blade–tip vortices using a multi-camera BOS system. Exp. Fluids 2015, 56, 1866. [Google Scholar] [CrossRef]
  9. Zuo, C.; Wei, C.; Ma, J.; Yue, T.; Liu, L.; Shi, Z. Full-Field Displacement Measurements of Helicopter Rotor Blades Using Stereophotogrammetry. Int. J. Aerosp. Eng. 2021, 2021, 8811601. [Google Scholar] [CrossRef]
  10. Hammond, C. Higher Harmonic Control: A Historical Perspective. J. Am. Helicopter Soc. 2021, 66, 1–14. [Google Scholar] [CrossRef]
  11. Ma, J.; Lu, Y.; Qin, Y.; Xu, X. Tilt-rotor aircraft fuselage wall aeroacoustics radiation suppression using Higher harmonic control. Appl. Acoust. 2022, 188, 108548. [Google Scholar] [CrossRef]
  12. Saptarshi, S.; Breiffni, F.; Biswajit, B. Individual Blade Pitch Control of Floating Offshore Wind Turbines for Load Mitigation and Power Regulation. IEEE Trans. Control. Syst. Technol. 2021, 29, 305–315. [Google Scholar]
  13. Vedulla, M.; Wang, C. Active Flow Control of Flapping Airfoil Using Openfoam. J. Mech. 2021, 36, 361–372. [Google Scholar]
  14. Tan, J.; Sun, Y.; Wang, H.; Lin, C. New Approach for Aerodynamic and Aeroacoustic Analysis of Actively Controlled Flaps Roto. J. Aircraft. 2018, 55, 2191–2202. [Google Scholar] [CrossRef]
  15. Juliano, T.; Kumar, P.; Peng, D.; Gregory, J.; Crafton, J.; Fonov, S. Single shot, lifetime based pressure sensitive paint for rotating blades. Mea. Sci. Technol. 2011, 22, 085403. [Google Scholar] [CrossRef]
  16. Disotell, K.; Peng, D.; Juliano, T.; Crafton, J.; Komerath, N. Single shot temperature and pressure sensitive paint measurements on an unsteady helicopter blade. Exp. Fluids. 2014, 55, 1671. [Google Scholar] [CrossRef] [Green Version]
  17. Jiao, L.; Shi, Z.; Zhang, W.; Liang, L.; Chen, X.; Zhao, Q.; Peng, D.; Liu, Y. A two-dimensional temperature correction method for pressure-sensitive paint measurement on helicopter rotor blades. Exp. Fluids. 2020, 61, 104. [Google Scholar] [CrossRef]
  18. Davidson, T.; Stokes, N.; Roberts, D.; Quinn, M. Time-resolved surface pressure and model deformation measurements in an industrial transonic wind tunnel. In Proceedings of the AIAA Aviation 2019 Forum, AIAA 2019–2905, Dallas, TX, USA, 17–21 June 2019. [Google Scholar]
  19. Ogg, D.; Rice, B.; Peltier, S.; Staines, J.; Claucherty, S.; Combs, C. Simultaneous Stereo Digital Image Correlation and Pressure-Sensitive Paint Measurements of a Compliant Panel in a Mach 2 Wind Tunnel. In Proceedings of the 2018 Fluid Dynamics Conference, AIAA 2018-3869, Atlanta, GA, USA, 25–29 June 2018. [Google Scholar]
  20. Zhang, Z. A flexible new technique for camera calibration. IEEE Trans. Pattern Anal. Mach. Intell. 2000, 22, 1330–1334. [Google Scholar] [CrossRef] [Green Version]
  21. Gao, S.; Zhao, M.; Zhang, L.; Zou, Y. Improved algorithm about subpixel edge detection of image based on Zernike orthogonal moments. Acta Autom. Sin. 2008, 34, 1163–1168. [Google Scholar] [CrossRef]
Figure 1. Test stand and rotor model.
Aerospace 09 00292 g001
Figure 2. Test blades coated with PSP and TSP.
Aerospace 09 00292 g002
Figure 3. Experimental setup: (a) schematics, (b) image of the experimental installation.
Aerospace 09 00292 g003
Figure 4. Schematic of single-shot lifetime-based method.
Aerospace 09 00292 g004
Figure 5. PSP data-processing procedures.
Aerospace 09 00292 g005
Figure 6. Comparison of PSP image in Gate 2. (a) I2 under reference conditions. (b) I2 at n = 840 rpm.
Aerospace 09 00292 g006
Figure 7. Calibration results for PSP and TSP. (a) Pressure calibration. (b) Temperature calibration.
Aerospace 09 00292 g007
Figure 8. TSP field from TSP (840 rpm, θ = 4°). (a) TSP IRoR field of TSP blade. (b) Span-wise temperature distribution extracted and effect of quadratic fitting at x/C = 0.5.
Aerospace 09 00292 g008
Figure 9. The principle of binocular stereophotogrammetry.
Aerospace 09 00292 g009
Figure 10. Reprojection error distribution of 30 calibration images.
Aerospace 09 00292 g010
Figure 11. Example of location of identified corners and reprojected corners on the checkerboard.
Aerospace 09 00292 g011
Figure 12. Pressure field distribution under different pitch angles measured by PSP.
Aerospace 09 00292 g012
Figure 13. Maps of standard deviation of pressure on blade at different pitch angles.
Aerospace 09 00292 g013
Figure 14. Comparison of average displacements at seven different radial locations.
Aerospace 09 00292 g014
Figure 15. Blade tip displacements at three different collective pitch angles in hover flight.
Aerospace 09 00292 g015
Table 1. Measurement accuracy.
Collective Pitch (°)Accuracy of Blade Targets (mm)
00.152
40.174
80.197
Average0.174
Publisher’s Note: MDPI stays neutral with regard to jurisdictional claims in published maps and institutional affiliations.

