Abstract
In this work, numerical simulation and experimental research were carried out on ablation mechanism of the first pulse (I pulse) insulation layer in a double-pulse solid rocket motor (SRM). Firstly, based on the internal thermal environment of the typical double pulse SRM, the internal flow field in combustion chamber of the double-pulse SRM with soft type pulse separation device (PSD) under the second pulse (Ⅱ pulse) working condition was numerically simulated. The results showed that the main reason for the difference of ablation in I pulse insulation layer was the difference of gas phase velocity. Secondly, based on the simulation analysis results, the experimental system for ablation of insulation layer was developed, and the ablation performance experiments under two gas phase velocities were carried out. It was found that a brittle carbonized layer had been formed on the surface of the insulation layer after the completion of I pulse work. In addition, at the beginning of Ⅱ pulse work, the suddenly generated gas flow made a denudation effect on the carbonized layer, which consumed a part of the carbonized layer. After the carbonized layer was peeled off, the gas flow continued to ablate the matrix of the insulation layer. Finally, the simulation analysis of the ablation process of the insulation layer under two gas phase velocities was carried out. The results showed that the velocity of the fuel gas is the main factor affecting the ablation rate of the insulation layer, which was consistent with the experimental results. It is proven that the model can be used to estimate the ablation amount of insulation of solid rocket motor. The conclusion can provide a significant reference for the internal heat protection design of the double-pulse SRM.
1. Introduction
The double-pulse solid rocket motor (SRM) consists of two combustion chambers. Two combustion chambers, which share the same nozzle, are connected by a pulse separation device (PSD). The interval time between the two pulses can be adjusted according to tactical indicators. Compared with the traditional SRM, the double pulse SRM has the advantages of multiple times ignition, discontinuous thrust, and controllable energy of the propulsion system. It is an advanced power device in the existing flight system. The PSD is one of the key components of the double-pulse SRM, and many researchers have carried out comprehensive and systematic research on different types of PSD. Wang CG [1,2,3,4], Stadler [5,6], Sun N [7], Wang CH [8], and Schilling S [9] deeply studied the PSD of metal diaphragm type, soft barrier type, plug type, and ceramic hatch cover type, respectively, and verified their working characteristics experimentally. Among them, the soft-type PSD of double-pulse SRM mainly plays the role of flame retardant and heat insulation and does not bear the force from the high pressure of fuel gas. Its structure is relatively light, which is beneficial to improve the mass ratio of the motor. The structure of the double-pulse SRM with the soft-type PSD diagram is shown in Figure 1.
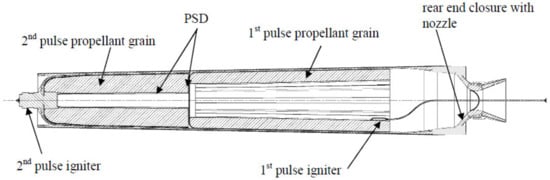
Figure 1.
The double-pulse SRM with soft type PSD.
It can be found by sorting the references that the research on the double-pulse SRM with soft-type PSD mainly focuses on the design of PSD, the research on the destruction of PSD, and the influence of the channel aperture after destruction on the I pulse internal flow field. Liu W et al. [10] numerically simulated the flow characteristics of the flow field near the soft-type PSD. The deformation and stress change of PSD under cold-flow impact, and the time of the PSD failure were obtained. SUN et al. [7] numerically simulated the two-phase flow field in the combustion chamber of a double-pulse SRM. Their results suggested that the inter-stage channel in the double-pulse SRM leads to the backward-facing step flow of the fuel gas in the I pulse combustion chamber. The gas flow separated and then reattached, in which the reattached point located exactly the area with severe ablation in the adiabatic layer. Chunguang Wang et al. [11,12] analyzed the stress state of the PSD during the operation process of the double-pulse SRM and established a method to calculate the hoop strain of the PSD. They obtained the failure mechanism of the PSD material by experimental study of its mechanical properties, which provided a theoretical basis and technical means for the design of the PSD in the double-pulse SRM. Peng Fu et al. [13] simulated the reverse opening process of PSD by explicit dynamic method. They further verified the opening process of the PSD by utilizing the gas generator experimental device. The research results showed that using brittle fracture criterion could accurately predict the failure location and pressure of the PSD. After the weak area first ruptured under the impact of internal pressure, the PSD structure gradually opened in reverse and, finally, the port was greatly destroyed.
However, there is less research on the ablation of the I pulse insulation layer. Yabing Liu et al. [14] simulated the internal flow field of the double-pulse SRM with a PSD port with a diameter of 203 mm and 120 mm during the II pulse steady operation. The results showed that the aggravated ablation area on the wall surface basically coincided with the position of the recirculation zone in I pulse combustion chamber. The convective heat transfer coefficient in the fuel gas recirculation zone was relatively high, especially near the reattachment point. The increase of the convective heat transfer coefficient was the main reason for the aggravated ablation in this area. XI Bo et al. [15] designed the I pulse secondary ablation test apparatus and carried out ablation tests under two working conditions to obtain the characteristics of I pulse insulation material in the secondary ablation. The experimental results and SEM analysis showed that the flow velocity of II pulse had a great impact on the secondary ablation of I pulse insulation.
Although the references [14,15] have simply studied the secondary ablation phenomenon of the I pulse insulation material, the lack of the combined analysis of the test and the flow field leads to the limitation of the practicability of the results. In addition, the numerical simulation and experimental research on ablation mechanism of the I pulse insulation layer in a double-pulse SRM are rarely mentioned in the reference [16].
This paper is constructed as follows. In Section 2, the internal flow field in combustion chamber of the double-pulse SRM with soft type PSD is numerically simulated, and the influence of the pulse separation device (PSD) is investigated under the II pulse working condition. Based on the simulation results, the ablation performance experiments under two gas phase velocities are carried out in Section 3. In Section 4, the thermochemical ablation model of the I pulse insulation layer is established, and the simulation analysis of the ablation process of the insulation layer under two gas phase velocities is carried out. The main conclusions are summarized in Section 5.
2. Simulation Analysis of the Internal Flow Field of the Double-Pulse SRM
2.1. Theoretical Model
The flow process in the combustion chamber of a double-pulse SRM is a typical two-phase flow process. At present, the Euler-Lagrange method is employed to numerically simulate the process. The governing equation of the gas phase is solved in the Euler coordinate system, and the particles are tracked in the Lagrange coordinate system. The coupling between the two phases is generally completed by adding a source term to the right of the governing equation. According to the statistical result, the particle diameter is concentrated between 10 μm and 120 μm, and the peak value of the particle diameter is 70 μm.
(1) Governing equation of the gas phase
Mass conservation equation:
where is the density of the gas phase; is the flow velocity in the direction; is the material source; is the particle number density of p-type particle phase; is the mass of p type of particle phase; and is the mass flow rate.
Momentum conservation equation:
where P is the pressure of the gas phase; is the viscosity coefficient; is the gravity; is the density of the particle phase; and is the particle momentum relaxation time.
Energy conservation equation:
where is the specific heat capacity of the gas phase; is the radiant heat of gas phase; and is the convective heat transfer between the gas phase and the particle phase.
(2) Governing equation of the particle phase
Mass conservation equation:
where A is the cross-sectional area of the channel.
Momentum conservation equation:
where is the lift force in the control body.
Energy conservation equation:
where, is the specific heat capacity of the particle phase; is convective heat transfer; and is the radiant heat of particle phase.
2.2. Boundary Condition and Calculation Parameters
When the Ⅱ pulse works, the burning surface of the grain will retreat, resulting in the change of the flow field near the I pulse insulation layer. Therefore, in this paper, the shape of grain at different time under the Ⅱ pulse working condition is selected for simulation analysis. The simulation model for calculation is shown in Figure 2. The fuel gas parameters [7] are shown in Table 1. After PSD is turned on, stable pressure is established in the engine within 2 s. Simulation analysis is performed at three time points: the start state (2 s), the intermediate state (7 s), and the end state (14 s). In addition, the working condition parameters for the calculation are shown in Table 2. The crosswise overload Ny = −1 g with considering the influence of gravity. The radial length and axial height of the interlayer are shown in Figure 2.
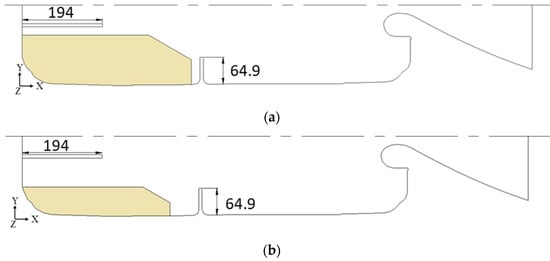
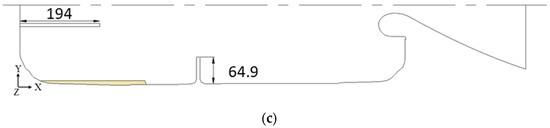
Figure 2.
The model for calculations (The burning surface of the propellant grain is retreating): (a) The calculation model at t = 2 s; (b) The calculation model at t = 7 s; (c) The calculation model at t = 14 s.

Table 1.
The parameters for the calculation.
Table 2.
The working condition parameters for the calculation.
The nozzle outlet pressure is a standard atmospheric pressure and the ambient temperature is 300 K. The surface of the propellant grain in Ⅱ pulse combustion chamber is taken as the mass flow rate inlet boundary and the temperature is 3400 K. The particle phase uniformly diffuses from the mass-added wall, and the diffusion velocity is 0. The rebound model is applied to other solid walls with a recovery coefficient of 0.8. The calculation parameters are based on hydroxyl terminated polybutadiene (HTPB) propellant. The aluminum powder content in the HTPB propellant is 12% [7]. The Rosin-Rammler (R-R) distribution function can describe particle diameter distribution [17,18]. The expression of the R-R distribution function is described as follows:
where is the cumulative distribution of particle mass fraction; is the mean diameter of the particles; and n is the distribution index. The particle diameter distribution ranged from 1 μm to 100 μm, with a mean diameter of = 15 μm and a distribution index n = 0.87. Fluent is used to simulate in this section.
2.3. Simulation Results and Analysis
The full hexahedral structure grid is meshed in the calculation with the size of 5 mm × 5 mm × 5 mm, as shown in Figure 3. The grid at the wall is densified. The grid at the nozzle grows proportionally and becomes sparser as it gets closer to the nozzle outlet. The grid transition between different partitions is smooth, the axial and radial grid lines are orthogonal, and the grid in the entire computational domain has a high quality. The grid numbers of the three models are about 320 thousand, 470 thousand, and 660 thousand, respectively.
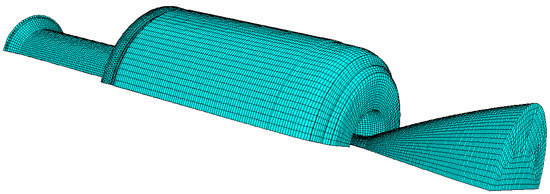
Figure 3.
The mesh diagram of the calculation model (t = 2 s).
Under the condition of constant propellant formula, working pressure and structural form, the main factors of the ablation of the I pulse insulation layer are the impact concentration of particle phase and the velocity of gas phase. In addition, temperature and gas composition are not the focus of this paper.
The influence degree of particle phase on ablation is analyzed through the contour of the particle concentration at different times, as shown in Figure 4. The results show that, at different times of the II pulse motor working process, most of the Al2O3 particles converge in the center and then flow out of the nozzle along the center line due to the obstruction of the axial PSD to the gas flow. The accumulation of particles in the I pulse combustion chamber is very small, so there is no collision of large-scale condensed particles with the wall of the I pulse combustion chamber and the wall of the rear head. Therefore, the particle phase is not the main factor of the ablation in the I pulse insulation layer.
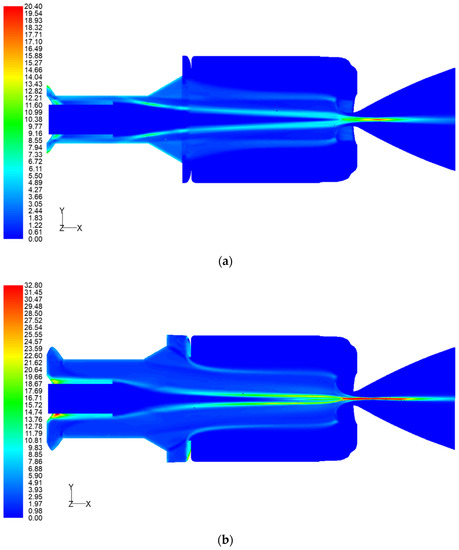
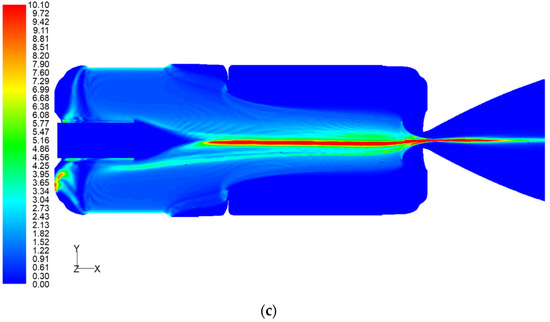
Figure 4.
The contour of the particle concentration (kg/m3) at different times: (a) t = 2 s; (b) t = 7 s; (c) t = 14 s.
The influence degree of gas phase on ablation is analyzed through the contour of the gas tracks at different times, as shown in Figure 5. During the working process of Ⅱ pulse motor, a larger vortex is formed in the cavity of the Ⅰ pulse combustion chamber because of the residue of the PSD. The vortex is large in size, which almost occupies the entire filling area at the bottom of I pulse combustion chamber. At the same time, due to the effect of crosswise overload (gravity), the upper and lower vortexes are structurally asymmetric. Large vortices lead to large differences in gas phase velocity distribution. As shown in Figure 6, most of the gas phase velocity in the combustion chamber range from 0 to 50 m/s, and it can reach 100 m/s near the nozzle inlet. Therefore, the gas phase velocity has a great impact on the ablation of the insulation layer.
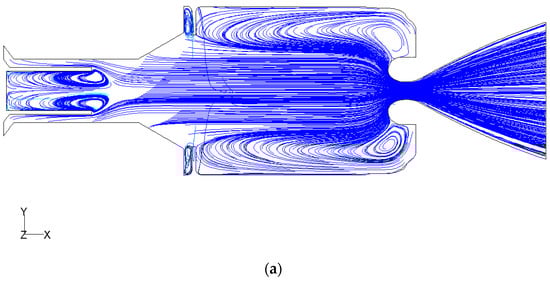
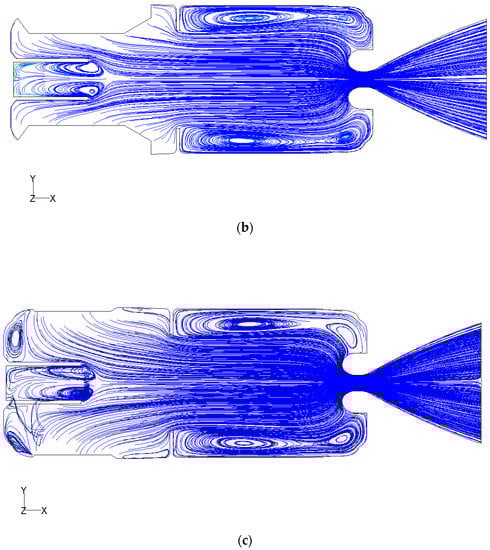
Figure 5.
The contour of the gas tracks at different times: (a) t = 2 s; (b) t = 7 s; (c) t = 14 s.
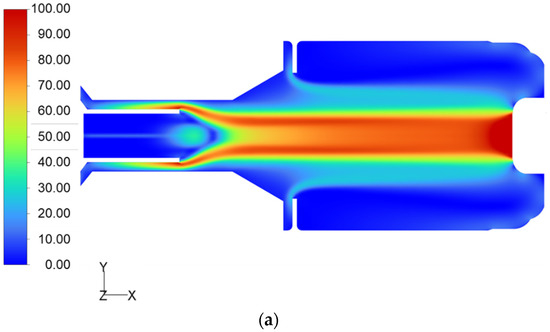
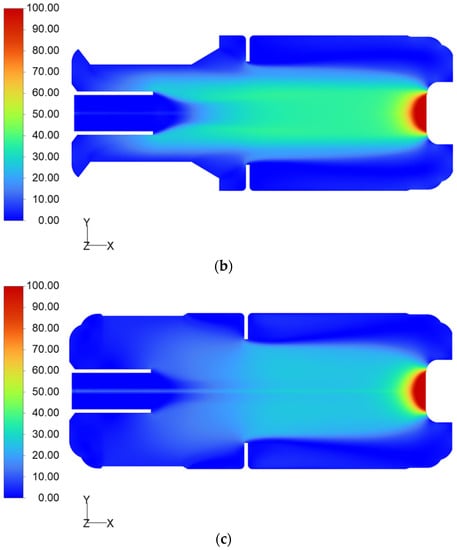
Figure 6.
The velocity (m/s) of the gas phase in I pulse combustion chamber at different times: (a) t = 2 s; (b) t = 7 s; (c) t = 14 s.
Through comparative analysis, it is found that the main factor causing the difference of the ablation of the I pulse insulation layer is the difference of the gas phase velocity in the recirculation zone of the I pulse combustor. Therefore, experiments and simulations are carried out in the following Sections to study the effect of gas phase velocity on ablation in the I pulse insulation layer.
3. Experimental Study on the Ablation Performance of the I Pulse Insulation Layer under Ⅱ Pulse Working Conditions
Based on the simulation analysis results in Section 2, the experimental system for ablation of insulation layer was developed to investigate the ablation influence of the gas flow velocity on I pulse insulation layer under II pulse working conditions, as shown in Figure 7. The experimental device is a sub-scale engine with a maximum diameter of 300 mm and a length of 200 mm. Among them, 1 is the front head, 2 is the propellant grain, 3 is the case, 4 is the low-velocity section, 5 is the high-velocity section, 6 is the propellant grain baffle, and 7 is the nozzle. HTPB propellant was used in the experiment and the II pulse working conditions were realized by two artificial ignitions.
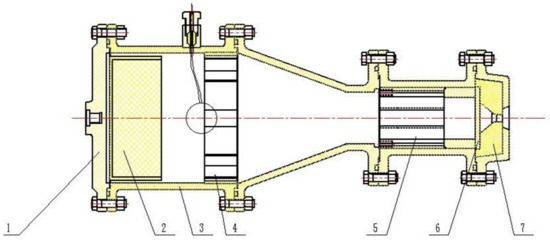
Figure 7.
Structural chart of the experiment device.
After the PSD of the II pulse engine is destroyed, the channel sizes are different, resulting in inconsistent gas phase velocity in the I pulse combustion chamber. Therefore, the ablation of the I pulse insulation layer is different. The temperature is too high to measure the gas phase velocity inside the sub-scale engine under working conditions, so the gas phase velocity is calculated by numerical simulation to estimate the test velocity. Figure 8 shows the gas phase velocity at different positions of the sub-scale engine. From the velocity contour in Figure 8, the gas phase velocity on I pulse insulation layer varies from 0 to 30 m/s. Therefore, the velocity in the ablation experiment was divided into two types: the low-velocity of 2 m/s and the high-velocity of 30 m/s.
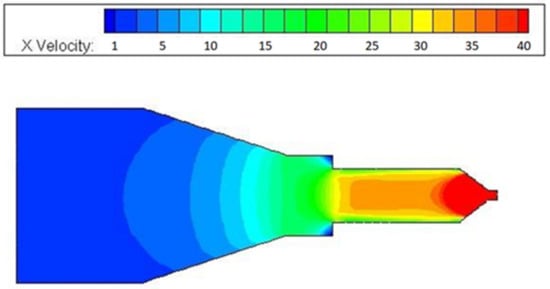
Figure 8.
The velocity contour (m/s) of the experimental device.
Adjust the propellant combustion velocity and nozzle throat diameter so that the gas burning speed in the high-velocity section is 30 m/s and that in the low-velocity section is 2 m/s. The working pressure of the combustion chamber is 7.0 MPa and the working time is 5 s. After the I pulse, a new HPTB grain is loaded into the sub-scale engine.
The experiment was divided into two steps. Firstly, the I pulse working experiment (first ablation experiment) was carried out, and a carbonized layer which weakens the heat resistance of the insulation layer is formed. Then, the II pulse working experiment was conducted to study the ablation law of the insulation layer under different gas phase velocities. In the experiments, specimens after the I pulse working experiment was divided into two groups: peeling carbonized layer group (group A) and non-peeling carbonized layer group (group B).
The ablation rate represents the ablation resistance of insulation layer, which is defined as follows:
The ablation rate is defined as follows:
where is the initial thickness of the insulation layer before experiment; is the residual thickness of the insulation layer with carbonized layer peeled off after experiment; and is the working time of SRM.
After taking out the specimens and removing the carbonized layer, the residual thickness of the insulation layer is measured by an ultrasonic thickness gauge with a resolution of 0.001 mm.
After peeling the carbide layer, the ablated thickness is obtained by subtracting the original thickness from the residual thickness. The ablation rate of Group A is measured after the I pulse and the II pulse, respectively. And the ablation rate of Group B is measured only after the II pulse. According to the test settings, the carbonized layer of Group B needs to be retained after I pulse, so the residual thickness of Group B after the I pulse cannot be measured.
The experiment included two experimental conditions. Experimental condition 1: the gas phase velocity in the first ablation experiment was 30 m/s, and the gas phase velocity in the second ablation experiment was 30 m/s. The velocity combination was 30 + 30, and the adiabatic specimen was arranged in the “high-velocity section” of the experimental device, which is in the position of number 5 in Figure 7. Experimental condition 2: the gas phase velocity in the first ablation experiment was 2 m/s, and the gas phase velocity in the second ablation experiment was 2 m/s. The velocity combination was 2 + 2, and the adiabatic specimen was arranged in the “low-velocity section” of the experiment device, which is in the position of number 4 in Figure 7.
Different experimental conditions are achieved by placing the specimen in the low-velocity section and the high-velocity section of the apparatus. Size and shape of the specimens are shown in Figure 9. The specimen size is much smaller than the sub-scale engine size, and positions for placing the specimen are reserved inside the sub-scale engine. Therefore, the influence of the specimen on the gas phase velocity can be ignored. The material of the specimen is consistent with the material of the insulation layer. Ethylene propylene diene monomer (EPDM) is used as insulation layer because of its low density, high thermal decomposition temperature, and thermal resistance.
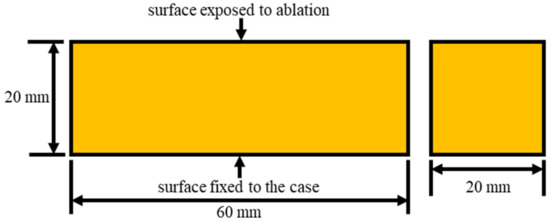
Figure 9.
Schematic diagram of specimen size.
3.1. Experimental Condition 1
This experiment was carried out under the conditions of Experimental condition 1. After the Ⅰ pulse experiment, a black carbonized layer had been formed on the surface of all the heat insulation materials. The carbonized layer generated by the EPDM insulation layer was compact and closely connected to the matrix, as shown in Figure 10. The surface morphology of the original layer was exposed after peeling off the carbonized layer, as shown in Figure 11.
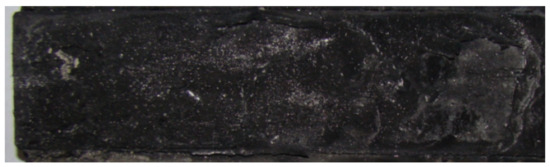
Figure 10.
Surface state of insulation layer after first ablative experiment (gas phase velocity was 30 m/s).

Figure 11.
Surface state of insulation layer after second ablative experiment (gas phase velocity was 30 m/s).
Four EPDM insulation specimens were taken out from the high-velocity section after the experiments as Group A specimens. The line ablation rate of the EPDM insulation specimens was 0.2341 mm/s, as listed in Table 3.
Table 3.
The ablation rate after experiments.
Observing the cross-section of the entire specimen, it was found that the cross-section includes the carbonized layer, the original layer, and the pyrolytic layer in between. The structure is shown in Figure 12, in which the left side is a schematic diagram, and the right side is a physical diagram. In this experiment, the pyrolytic layer was retained when the carbonized layer was peeled off. The surface of the insulation layer was carbonized under the high temperature and high pressure of the fuel gas and formed a carbonized layer. The pyrolytic layer in the middle was protected by the surface carbonized layer and did not reach the temperature required for carbonization. Only the decomposition reaction of the material happened after heating, and it became the pyrolytic layer with darker color than the matrix layer and lighter color than the carbonized layer, which can distinguish the original layer and the carbonized layer.

Figure 12.
The different layers in the cross section of the ablative specimen.
The second ablation experiment was carried out for Group A and Group B to simulate the ablation of the II pulse working conditions in the double-pulse SRM. After the experiment, the ablation rates of specimens from two groups were shown in Table 4 and Table 5.
Table 4.
Ablation rate of Group A in second ablation experiment and whole process (gas phase velocity was 30 m/s).
Table 5.
Ablation rate of Group B in whole process (gas phase velocity was 30 m/s).
By comparing the ablation rate of Group A in the two pulses, it can be seen that the second ablation rate is 1.78 times that of the first one. This is due to the poor surface state of the newly formed original layer, which leads to the decline of ablation resistance under the high velocity of gas. Although the average ablation rate of group A and group B are almost equal, it suggests that under the condition of 30 + 30 gas phase velocity, the carbonized layer formed on the surface of the insulation layer after the first ablation is quickly peeled off by the fuel gas and cannot protect the insulation layer.
3.2. Experimental Condition 2
This experiment was carried out under the conditions of Experimental condition 2. The surface morphology of the adiabatic specimen after I pulse ablation and after peeling off the carbonized layer were shown in Figure 13 and Figure 14. It could be observed that the ablation rate was obviously lower than in Experimental condition 1, because the gas phase velocity in Experimental condition 2 was much smaller than that in Experimental condition 1.
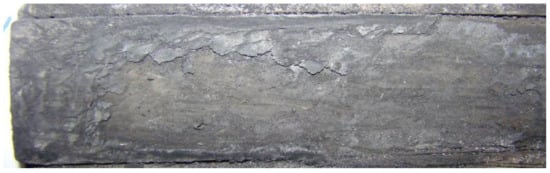
Figure 13.
Surface state of insulation layer after first ablative experiment (gas phase velocity was 2 m/s).

Figure 14.
Surface state of insulation layer after second ablative experiment (gas phase velocity was 2 m/s).
After the first ablation experiment, two EPDM specimens were taken from the low-velocity experiment section as the specimens of group A. The measured ablation rate was shown in Table 6.
Table 6.
The ablation rate after experiments.
The secondary ablation experiment was conducted after the carbonized layer peeled off and the measured ablation rate was shown in Table 7. The line ablation rate of EPDM insulation material was 0.2389 mm/s, and the average ablation rate of the two experiments was 0.2345 mm/s, which was relatively close.
Table 7.
Ablation rate of Group A in second ablation experiment and whole process (gas phase velocity was 2 m/s).
The second ablation experiment of Group B was conducted, and the ablation rate of the specimens after the experiment was shown in Table 8.
Table 8.
Ablation rate of Group B in whole process (gas phase velocity was 2 m/s).
The results of the insulation layer after the two ablation experiments were analyzed. Comparing the experimental results of Group A, it is found that the ablation rate of the insulation specimen in the first ablation experiment is little different from it in the second experiment. The average ablation rate of the adiabatic specimens with carbonized layer from Group B is significantly lower than it from Group A, which was about 80%. It indicates that the carbonized layer after the first ablation experiment can protect the insulation layer from the second ablation, to a certain extent, when the gas phase velocity is relatively low.
4. Computation Study on the Ablation Process of the Adiabatic Layer
4.1. Governing Equation for Thermal Conduction of the Adiabatic Layer
The pyrolytic layer model is adopted in the thermal protection model of the I pulse insulation layer. That is, as the surface of the insulation layer is continuously heated, the insulation layer will be stratified, including the carbonized layer, the pyrolytic layer, and the original layer, as shown in Figure 15. The surface of the insulation layer gradually heats under the influence of the heat flow in the I pulse combustion chamber, and the heat is transferred to the inside of the insulation layer by thermal conduction simultaneously. When the temperature reaches the pyrolysis temperature of the material, the original material of the insulation layer begins to pyrolyze, and the gas produced by pyrolysis diffuses outward by passing through the carbonized layer. When it reaches the carbonization temperature, the pyrolysis of the material ends and at the same time a permeable, loose and porous carbonized layer structure is formed. The carbonized layer is considered as a porous structure with sparse upper and lower dense. Therefore, porosity, the ratio of pore volume to total volume, is used to describe the carbonized layer. The distribution of porosity is controlled by the thermochemical ablation process. When the porosity exceeds the critical value, the surface of the insulation layer retreats, so that the peeling process can be simulated.
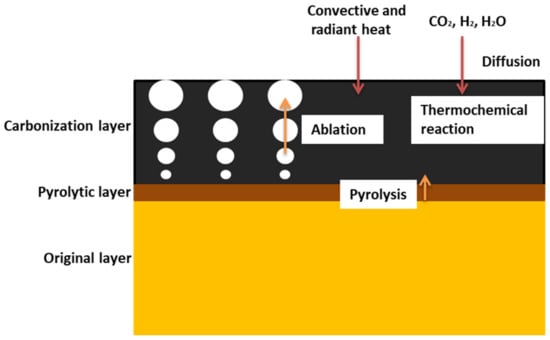
Figure 15.
The thermochemical ablation model based on the porous carbonized layer structure.
Assuming that the thermal conductivity of the EPDM insulation material is isotropic, the three-dimensional unsteady thermal conduction governing equation of the insulation material based on Fourier’s law is:
where , is density of the insulation layer, is specific heat capacity of material, is thermal conductivity of the insulation layer, and is the boundary of a fixed area . represents the total heat per unit time and unit volume of the material, that is,
where is the energy of the pyrolytic gas diffusion, is the equivalent radiative heat exchange between the surface of the insulation layer and the outside, and is the energy required for the pyrolysis of the insulation layer, which is:
where is the enthalpy of gas phase, in kJ/kg, is the surface emissivity of the material, is Stefan–Boltzmann constant, is the reference temperature of the external environment, and is the latent heat of pyrolysis of the adiabatic material, in kJ/kg. Furthermore, the variably physical property model of EPDM material, including the pyrolytic gas, specific heat capacity and thermal conductivity, and related parameters can be found in literature [19].
4.2. Thermochemical Ablation Model
A thermochemical reaction occurs on the surface in the ablation process of the insulation layer. The carbon atoms on the surface of the insulation layer react with CO2 and H2O in the fuel gas. The mass flow rate of the carbon consumed in this process is:
where and are the mass flow rates of carbon consumed in the reaction between carbon with H2O and CO2 in the fuel gas, respectively, which can be expressed as:
where and are the partial pressures of H2O and CO2, respectively, is the area of the wall, and , , , are the kinetic parameters of the chemical reaction.
The retreat amount on the surface of the insulation layer is obtained by calculating carbon mass consumed by the reaction in the first layer elements on the surface of the insulation layer, that is:
where is the volume of the first layer elements on the surface of the insulation layer, is the side length of the element, and is the density of the element.
4.3. Numerical Calculation Method
In the pyrolysis process of the insulation layer, the energy diffusion governing equation is solved by discretizing the diffusion term. Based on the cell-centered finite volume method, the Jacobian variation is used to calculate the temperature partial derivative of the diffusion term in the governing equation through the central difference scheme with second-order spatial accuracy in this paper. The third order explicit TVD Runge-Kutta method is used for time advancement. In addition, when element in the calculation area of the insulation layer recedes due to ablation, the element will be deformed. Therefore, it is necessary to use the local Lagrange polynomial interpolation method to interpolate the physical quantities of the deformed elements.
4.4. Numerical simulation and results of ablation
The ablation model is established according to the size of the test piece as shown in Figure 16, where the upper part is the fluid domain, the Z direction is the flow direction, and the lower part is the solid domain. The face on the right side of the model is displayed in Figure 17 and Figure 18. The working conditions are consistent with experiments. The working pressure of the combustion chamber is 7.0 MPa and the working time is 5 s. The time interval between two pulse ignitions is 50 s. The gas velocity in the fluid domain is changed to simulate the low gas phase velocity (2 m/s) condition and high gas phase velocity (30 m/s) condition. After the I pulse, the carbonized layer under high gas phase velocity condition is peeled off.
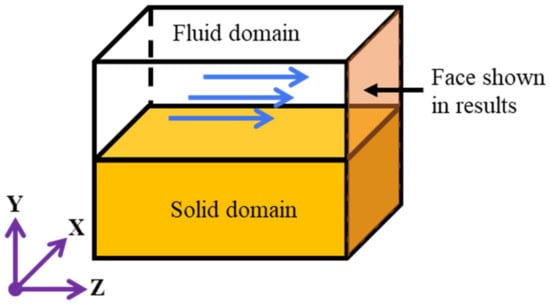
Figure 16.
Numerical calculation model of ablation.
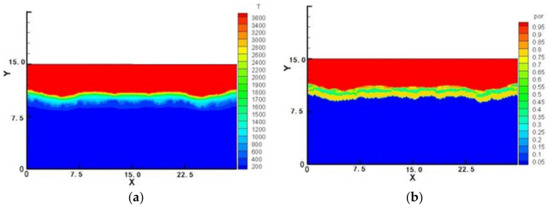
Figure 17.
Numerical calculation results under the gas phase velocity of 2 m/s: (a) the temperature (℃) distribution contour; (b) porosity distribution contour.
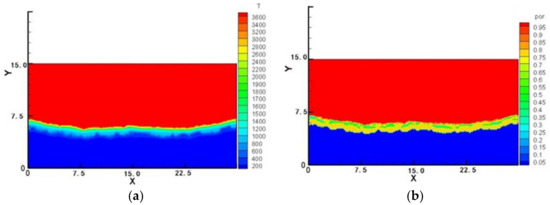
Figure 18.
Numerical calculation results under the gas phase velocity of 30 m/s: (a) the temperature (℃) distribution contour; (b) porosity distribution contour.
The ablation process of the insulation layer in Experimental condition 1 and Experimental condition 2 were numerically simulated, respectively. Figure 17 and Figure 18 are the temperature (°C) distribution contour and porosity distribution contour under two experimental conditions, respectively.
As shown in Figure 17, after the I pulse, the carbonized layer under a low gas phase velocity (2 m/s) condition is not peeled off and resists the transfer of temperature, resulting in a slower retreat of the carbide layer. Under a high gas phase velocity (30 m/s) condition, since the carbide layer is peeled off, the temperature transfer is easier during the II pulse process, resulting in a faster retreat of the carbide layer, as shown in Figure 18.
According to the simulation results, it can be observed that the ablation rate of the insulation layer under low gas phase velocity (2 m/s) condition is 0.25 mm/s, whereas it is 0.35 mm/s under high gas phase velocity (30 m/s) condition. The ablation rate of the insulation layer under the high gas phase velocity condition is significantly higher than that under the low gas phase velocity condition.
Corresponding to the simulation results is the data of Group B in the test. Under a low gas phase velocity (2 m/s) condition, the carbide layer of Group B is not peeled off. Additionally, under a high gas phase velocity (30 m/s) condition, the carbonized layer of Group B is quickly peeled off by the fuel gas. In the test, the ablation rate of Group B under a low gas phase velocity (2 m/s) condition is 0.1932 mm/s, whereas it is 0.3257 mm/s under a high gas phase velocity (30 m/s) condition. This conclusion is consistent with experimental results, which once again verifies that the gas phase velocity is an important condition influencing the ablation rate of the insulation layer.
5. Conclusions
The secondary ablation characteristics of I pulse insulation in a double-pulse SRM are investigated in this paper and conclusions are obtained as the following:
- (1)
- According to simulation results of the flow field, most of the Al2O3 particles converge in the center and then flow out of the nozzle along the center line due to the obstruction of the axial PSD to the gas flow, whereas fewer particles accumulate in the I pulse combustion chamber and the wall of the rear head. The gas phase velocity in the recirculation zone of I pulse differs greatly in different directions, which is the main factor causing the difference of the ablation of the I pulse insulation layer.
- (2)
- According to the secondary ablation experiments, when the gas phase velocity under II pulse working condition is low, the carbonized layer formed on the surface of the insulation layer after I pulse working condition can protect the insulation layer to a certain extent. When the gas phase velocity under II pulse working condition is high, the carbonized layer formed on the surface of the insulation layer after I pulse working condition is quickly peeled off by the fuel gas and cannot protect the insulation layer.
- (3)
- The thermal protection model of the double-pulse SRM is represented by the pyrolysis layer model. Numerical calculation results show that the ablation rate of the insulation layer under high gas phase velocity conditions is significantly higher than that under low gas phase velocity conditions. This model can be utilized to estimate the ablation amount of the insulation layer for a solid rocket motor.
Author Contributions
Conceptualization, K.Z., C.W. and W.T.; methodology, W.T.; software, K.Z.; validation, K.Z. and C.W.; formal analysis, K.Z. and C.W.; investigation, W.T.; resources, W.T. and C.W.; data curation, K.Z.; writing—original draft preparation, K.Z.; writing—review and editing, K.Z., C.W. and W.T.; visualization, K.Z.; supervision, W.T.; project administration, C.W.; funding acquisition, C.W. All authors have read and agreed to the published version of the manuscript.
Funding
This article was funded by the Application Innovation Plan Project of China Aerospace Science and Technology Group (No. 6230112002), and the Basic Research Project (No. 514010304-302-2).
Institutional Review Board Statement
Not applicable.
Informed Consent Statement
Not applicable.
Data Availability Statement
The data presented in this study are available upon request from the corresponding author.
Conflicts of Interest
The authors declare no conflict of interest.
References
- Wang, C.G.; Liu, H.C.; Yang, D.M.; Chen, C. Study of Development Status and Future Development Proposals for Pulse Solid Rocket Motor. Appl. Mech. Mater. 2012, 110–116, 2354–2358. [Google Scholar] [CrossRef]
- Wang, C.; Ren, Q.; Tian, W. Investigation on the Designing of the Metal Diaphragm in Pulse Solid Rockets. J. Spacecr. Rockets 2016, 53, 178–183. [Google Scholar] [CrossRef]
- Wang, C.; Chen, C.; Ren, Q.; Chen, K. Investigation on metal diaphragm of pulse separation device in dual-pulse solid rocket motor. Proc. Inst. Mech. Eng. Part G J. Aerosp. Eng. 2016, 231, 444–451. [Google Scholar] [CrossRef]
- Wang, C.G.; Ren, Q.B.; Tian, W.P.; Liu, H.C.; Yang, D.M. Research on the process of dynamic failure of metal diaphragm pulse separation device in pulse motor. J. Solid Rocket Technol. 2013, 36, 22–26. [Google Scholar] [CrossRef]
- Stadler, L.; Hoffmann, S.; Huber, J.; Naumann, K.; Stingl, R. The flight demonstration of the double pulse motor demonstrator MSA. In Proceedings of the 46th AIAA/ASME/SAE/ASEE Joint Propulsion Conference & Exhibit, AIAA-2010-6756, Nashville, TN, USA, 25–28 July 2010. [Google Scholar] [CrossRef]
- Stadler, L.; Hoffmann, S.; Niedermaier, H.; Hacker, A.; Bénayon, G.; Trouillot, P.; Naumann, K. Testing and verification of the LFK NG dual pulse motor. In Proceedings of the 42nd AIAA/ASME/SAE/ASEE Joint Propulsion Conference & Exhibit, AIAA-2006-4765, Sacramento, CA, USA, 9–12 July 2006. [Google Scholar] [CrossRef]
- Sun, N.; Lou, Y.C.; Sun, C.H.; Shen, T.H. Numerical analysis of two-phase flow in combustion chamber of dual-pulse motor. J. Solid Rocket Technol. 2012, 35, 335–338. [Google Scholar]
- Wang, C.H.; Liu, Y.; Liu, Y.B. Design and experimental studies on ceramic port cover for dual pulse motor. Acta Astronaut. 2011, 68, 1881–1890. [Google Scholar] [CrossRef]
- Schilling, S.; Trouillot, P.; Weigand, A. On the development and testing of a 120 mm caliber double pulse motor (DPM). In Proceedings of the 40th AIAA/ASME/SAE/ASEE Joint Propulsion Conference & Exhibit, AIAA-2004-3387, Fort Lauderdale, FL, USA, 11–14 July 2004. [Google Scholar] [CrossRef]
- Liu, W.; Chen, X.; Li, Y. Numerical Simulation on Cold-Flow Impact of the Soft Pulse Separation Device in Dual Pulse Solid Rocket Motor. J. Phys. Conf. Ser. 2020, 1510, 012016. [Google Scholar] [CrossRef]
- Wang, C.; Tian, W.; Wang, L.; Xu, G. Experimental study on soft PSD material of dual pulse solid rocket motor. Proc. Inst. Mech. Eng. Part G J. Aerosp. Eng. 2021, 235, 1623–1629. [Google Scholar] [CrossRef]
- Wang, C.; Xu, G. The Analytical Method to Compute the Strain on the Soft PSD in Double-Pulse SRM. Int. J. Aerosp. Eng. 2019, 2019, 3190980. [Google Scholar] [CrossRef]
- Fu, P.; Song, X.-Y.; Sun, L.-Q.; Yao, D. Investigation on the reverse opening process of the soft insulator of double pulse solid rocket motor. J. Solid Rocket Technol. 2017, 40, 146–150. [Google Scholar]
- Liu, Y.-B.; Wang, C.-H.; Liu, Y. Analysis of local ablation characteristics in combustion chamber of dual-pulse motor. J. Solid Rocket Technol. 2011, 34, 453–456. [Google Scholar]
- Xi, B.; Pu, D.; Liu, W. Research on the Secondary Ablation of I Pulse Insulation Material in Double Pulse Solid Rocket. J. Proj. Rockets Missiles Guid. 2020, 40, 35–38. [Google Scholar] [CrossRef]
- Natali, M.; Kenny, J.M.; Torre, L. Science and technology of polymeric ablative materials for thermal protection systems and propulsion devices: A review. Prog. Mater. Sci. 2016, 84, 192–275. [Google Scholar] [CrossRef]
- Liu, M.; Liu, Z.; Li, S.; Yu, W.; Cao, J.; Wang, N. Study on Size Distribution and Flow Characteristics of Condensed Products in Solid Rocket Motor. Int. J. Aerosp. Eng. 2021, 2021, 5481436. [Google Scholar] [CrossRef]
- Feng, H.; Zhu, X.; Zhang, B.; Chen, R.; Liao, Q.; Ye, D.; Liu, J.; Liu, M.; Chen, G.; Wang, K. Visualization of two-phase reacting flow behavior in a gas–liquid–solid microreactor. React. Chem. Eng. 2019, 4, 715–723. [Google Scholar] [CrossRef]
- Xu, Y.H.; Hu, X.; Yang, Y.X.; Zeng, Z.X.; Hu, C.B. Dynamic simulation of insulation material ablation process in solid propellant rocket motor. J. Aerosp. Eng. 2015, 28, 04014118. [Google Scholar] [CrossRef]
Publisher’s Note: MDPI stays neutral with regard to jurisdictional claims in published maps and institutional affiliations. |
© 2022 by the authors. Licensee MDPI, Basel, Switzerland. This article is an open access article distributed under the terms and conditions of the Creative Commons Attribution (CC BY) license (https://creativecommons.org/licenses/by/4.0/).