Article

Experimental Study of the Aerodynamic Interaction between Side-by-Side Propellers in eVTOL Airplane Mode through Stereoscopic Particle Image Velocimetry

Politecnico di Milano, Dipartimento di Scienze e Tecnologie Aerospaziali, Via La Masa 34, 20156 Milan, Italy
Aerospace 2021, 8(9), 239; https://doi.org/10.3390/aerospace8090239
Submission received: 12 July 2021 / Revised: 6 August 2021 / Accepted: 20 August 2021 / Published: 30 August 2021
(This article belongs to the Special Issue Rotorcraft)

Abstract

:
Side-by-side propellers characterise the architecture of most new electric aircraft (eVTOLs) designed in recent years for urban air mobility. The aerodynamic interaction between side-by-side propellers represents one of the key phenomena that characterise the flow field and performance of these novel aircraft configurations. The present article describes the main results of a wind tunnel campaign that aimed to investigate the flow features that characterise this aerodynamic interaction, with a particular application to cruise flight conditions in eVTOLs. With this aim, stereo particle image velocimetry (PIV) measurements were performed in the wake of two co-rotating propeller models in a side-by-side configuration. The three-dimensional flow surveys provided detailed insights into the flow physics of the interacting propellers, with a particular focus on the interactional effects on the trajectory of the tip vortices and the wake topology provided at two different advance ratios by reproducing a moderate and a fast cruise speed of eVTOLs in urban areas.

1. Introduction

In recent years, the great challenge of urban air mobility (UAM) has caused a wide range of startup companies in the automotive and aerospace industries to become involved in the design of unconventional VTOL aircrafts based on electric distributed propulsion (eVTOLs). This challenge has provided a great boost in the rotorcraft community, as these novel aircraft architectures represent a real novel solution that can be considered in the future as an effective alternative to ground transportation in overcrowded metropolitan areas [1]. The design of such novel aircraft architectures, even if rather diverse, presents the use of multiple propellers, which are typically mounted on single or dual lifting surfaces, as a key feature. Consequently, the aerodynamic interaction between propellers represents a critical aspect that engineers must thoroughly investigate. As a matter of fact, considering the layout of the most promising aircraft on the market, the main types of aerodynamic interactions for eVTOL applications are between propellers in side-by-side and tandem configurations. Indeed, as can be observed in Figure 1, both of these multiple-propeller configurations are simultaneously present, for instance, in the recently unveiled Archer Maker aircraft and in the layout of Airbus Vahana [2], where two rows of side-by-side propellers are placed in tandem.
Aerodynamic interactions between rotors have been widely investigated in the literature, particularly for applications in helicopters with tandem or coaxial rotors as well as for tiltrotor configurations. Nevertheless, the findings from rotorcraft research are not completely applicable to the aerodynamic propeller interactions that are typical of eVTOL configurations because helicopters are characterised by articulated high-aspect-ratio blades with a quite low twist, while propeller blades are rigidly mounted on a hub and are characterised by a lower aspect ratio and a higher twist. Moreover, the rotorcraft research literature regarding the study of aerodynamic interactions and their application to tandem rotors, coaxial rotors, and tiltrotors has mainly considered hovering flight conditions [3,4].
Due to the great interest regarding the development of novel multi-propeller architectures in the field of drones and UAVs, in the recent literature, a certain number of experimental works have presented investigations of the complex aerodynamic flow features that characterise the interactions between rotors, with greater effort with respect to the hover condition. To cite a few examples, Zhou et al. [5] investigated the interactional flow field in the wake of two side-by-side UAV propellers in the hover condition. Similarly, Shukla and Komerath [6] performed stereo PIV measurements to study the interacting wake of a side-by-side configuration made by two mini-drone rotors that were also in the hover condition. Moreover, a very recent work by Stokkermans et al. [7] described a comprehensive wind tunnel activity performed over two propellers in both tandem and side-by-side configurations. In particular, in this last work, PIV was dedicated only to the study of the side-by-side interacting flow field characteristic of vertical takeoff and the first stage of transition.
The aerodynamic interactions between multi-propeller configurations also represent an interesting benchmark for the validation of numerical tools in rotorcraft applications. In particular, recently, several mid-fidelity aerodynamic solvers were developed to perform the preliminary design of novel VTOL aircraft architectures [8,9] or to investigate the interactional flow physics typical of complex rotorcraft configurations, such as tiltrotors and compound helicopters [10,11]. Indeed, the use of vortex particle methods (VPMs) for wake modelling [12,13], which is typically implemented in these mid-fidelity solvers, enabled the authors to capture the aerodynamic interactions between several bodies while keeping the computational effort required for the simulations low. Nevertheless, these solvers required a robust experimental validation, especially to evaluate their capabilities of accurately simulating the strong interactional effects that are typical of the flow fields of multi-propeller configurations. With this aim, Alvarez and Ning [14,15] reproduced the side-by-side propeller experiment in hover conditions conducted by Zhou et al. [5] using a mid-fidelity aerodynamic VPM code and found a quite promising agreement in terms of flow-field representation.
Despite the efforts found in the literature to gain knowledge on side-by-side propellers, particularly for hover conditions, the literature lacks experimental studies focused on the investigation of interactional flow field that characterise side-by-side configurations in forward flight conditions. As recent works by Zhou et al. [5] and Stokkermans et al. [7] highlighted the negligible effects of side-by-side interactions on propeller performance for both hover and forward flight conditions, this paper focuses on an investigation of the effects of side-by-side aerodynamic interactions on a propeller wake by means of stereoscopic PIV surveys. The measurements were performed during a wind tunnel campaign and reproduced cruise conditions in order to fill the gap in the literature concerning interactional flow studies of two propeller models in a side-by-side configuration for this flight condition, typical of the eVTOL aircraft airplane mode. The flow surveys were performed with a very low separation distance between propeller models in order to maximise interactional effects. Moreover, two advance ratios were considered during the tests to evaluate the different effects on wake topology for flight conditions reproducing a moderate and a fast cruise speed for an eVTOL aircraft. The experiments were performed over propeller models designed and manufactured with a free geometry in order to provide a new, open experimental data set that can be used for thorough validation of CFD tools with different levels of fidelity to scientific and industrial communities.
The paper is organized as follows. Section 2 provides a description of the experimental set up, including the propeller model design and the stereo PIV measurements set up in a wind tunnel. Section 3 presents a discussion of the main results obtained via the experiments, while conclusions are drawn in Section 4.

2. Experimental Set-Up

The experimental activity was performed in the S. De Ponte wind tunnel of Politecnico di Milano. This closed-loop wind tunnel has a 1 m × 1.5 m test section and a maximum speed of 55 m/s, with a turbulence level lower than 0.1%.

2.1. Propeller Model Design

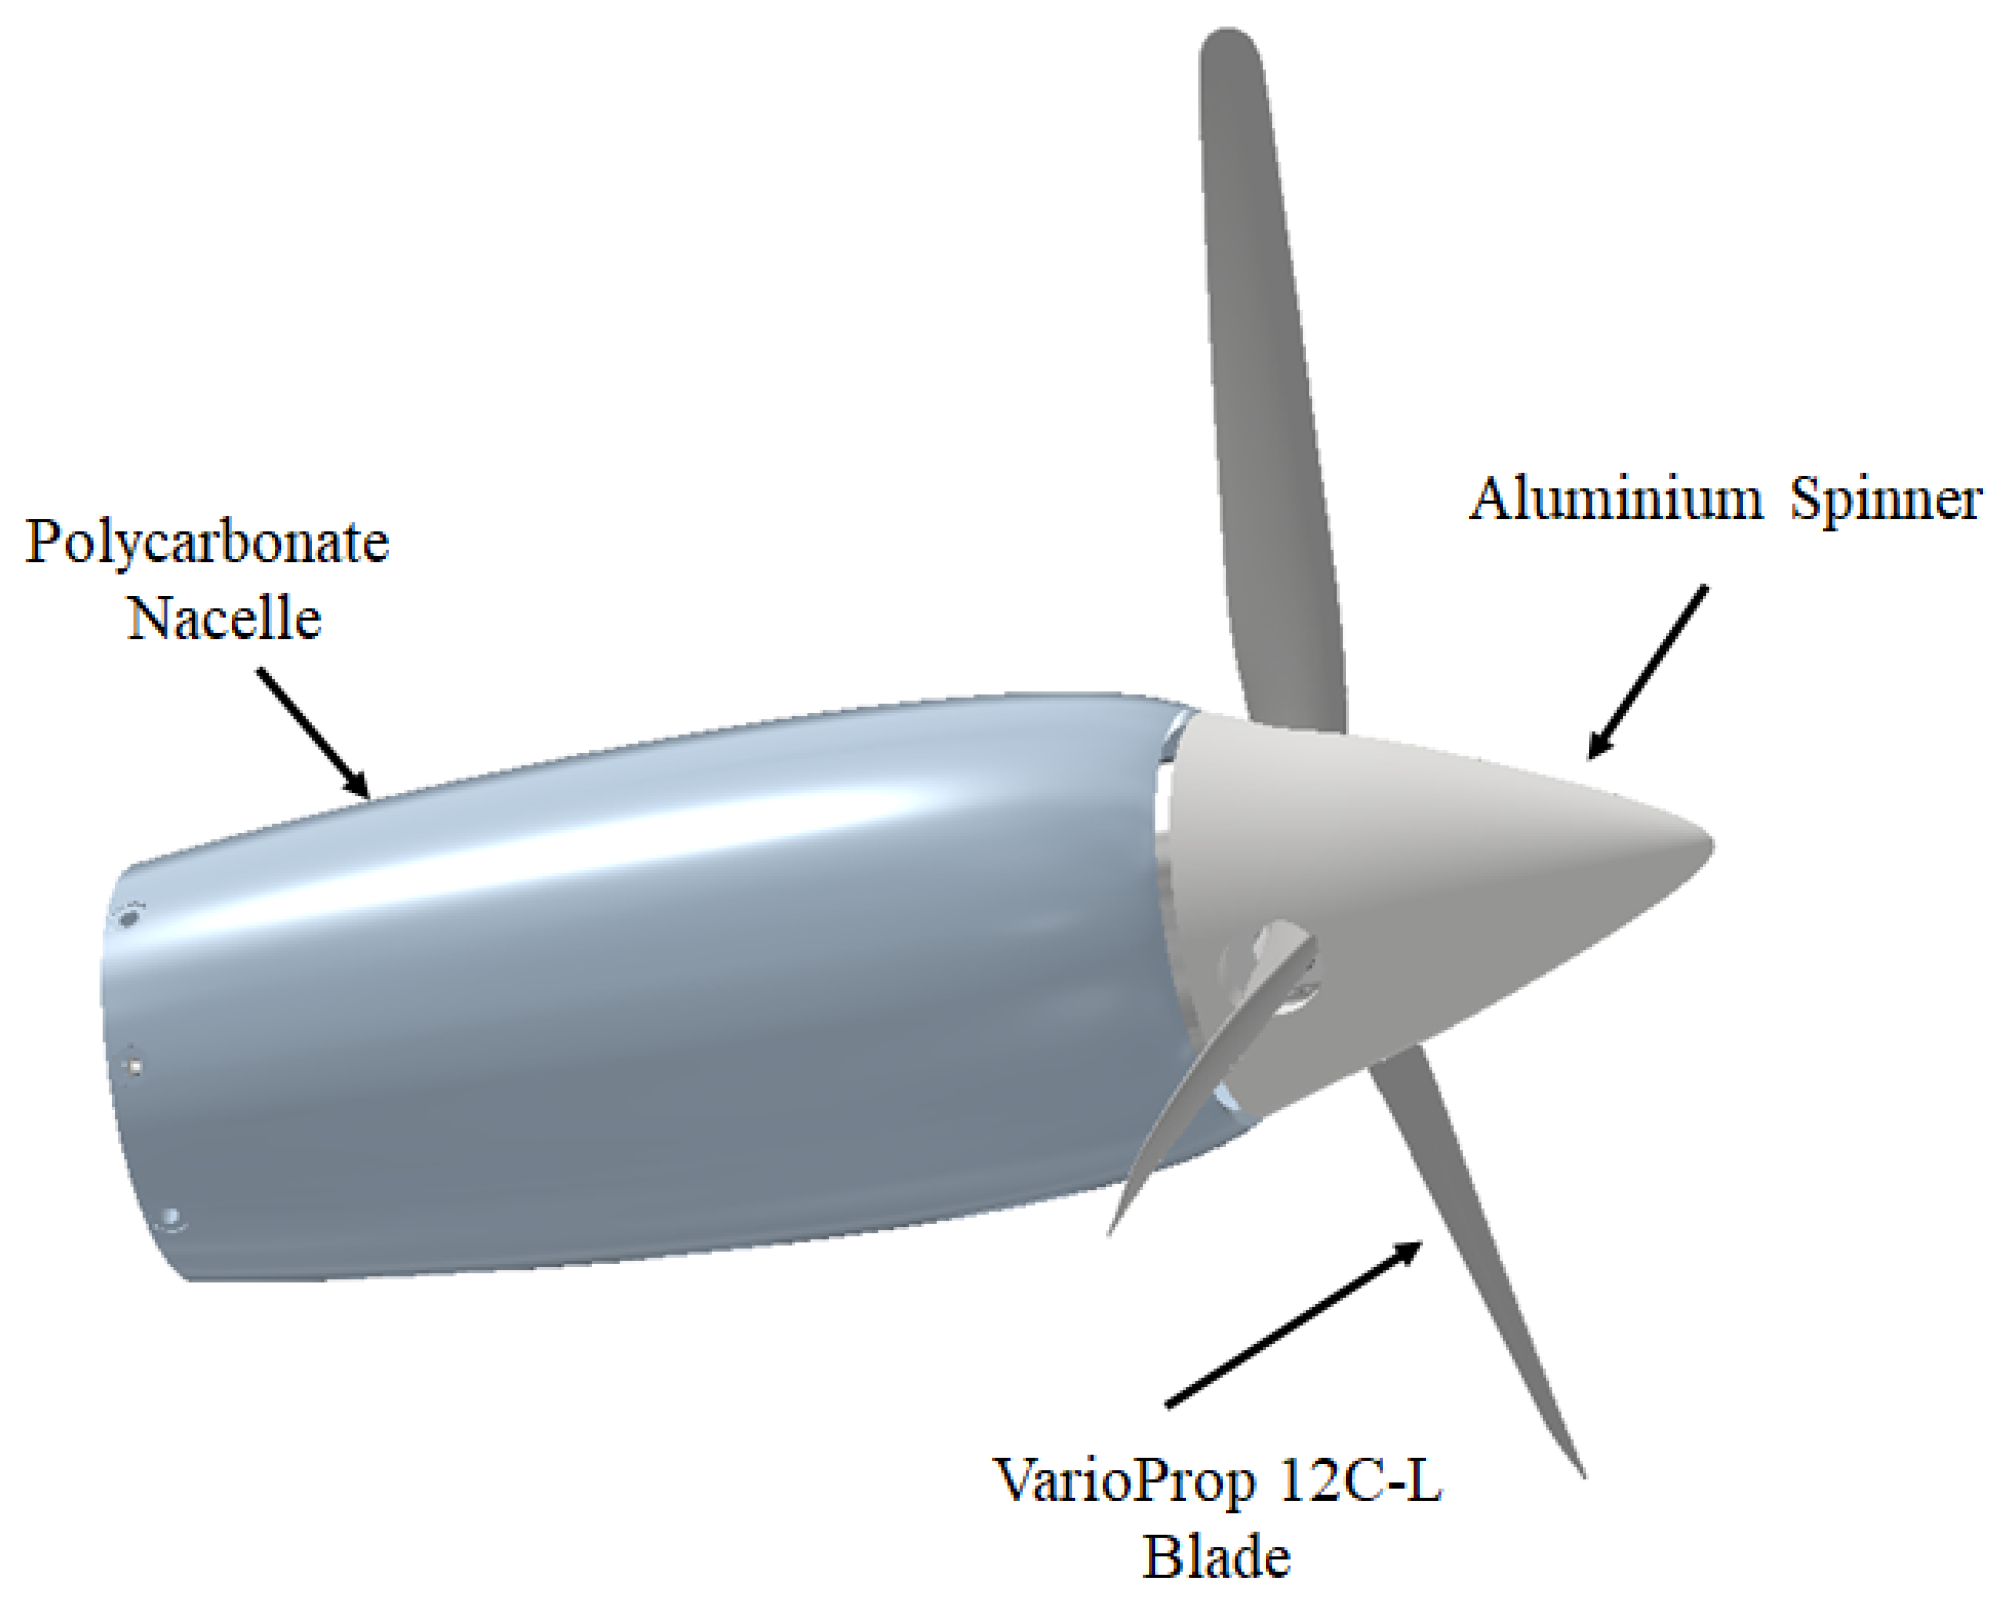
Two propeller models were designed and manufactured for the test campaign. The layout of the propeller model is presented in the render shown in Figure 2.
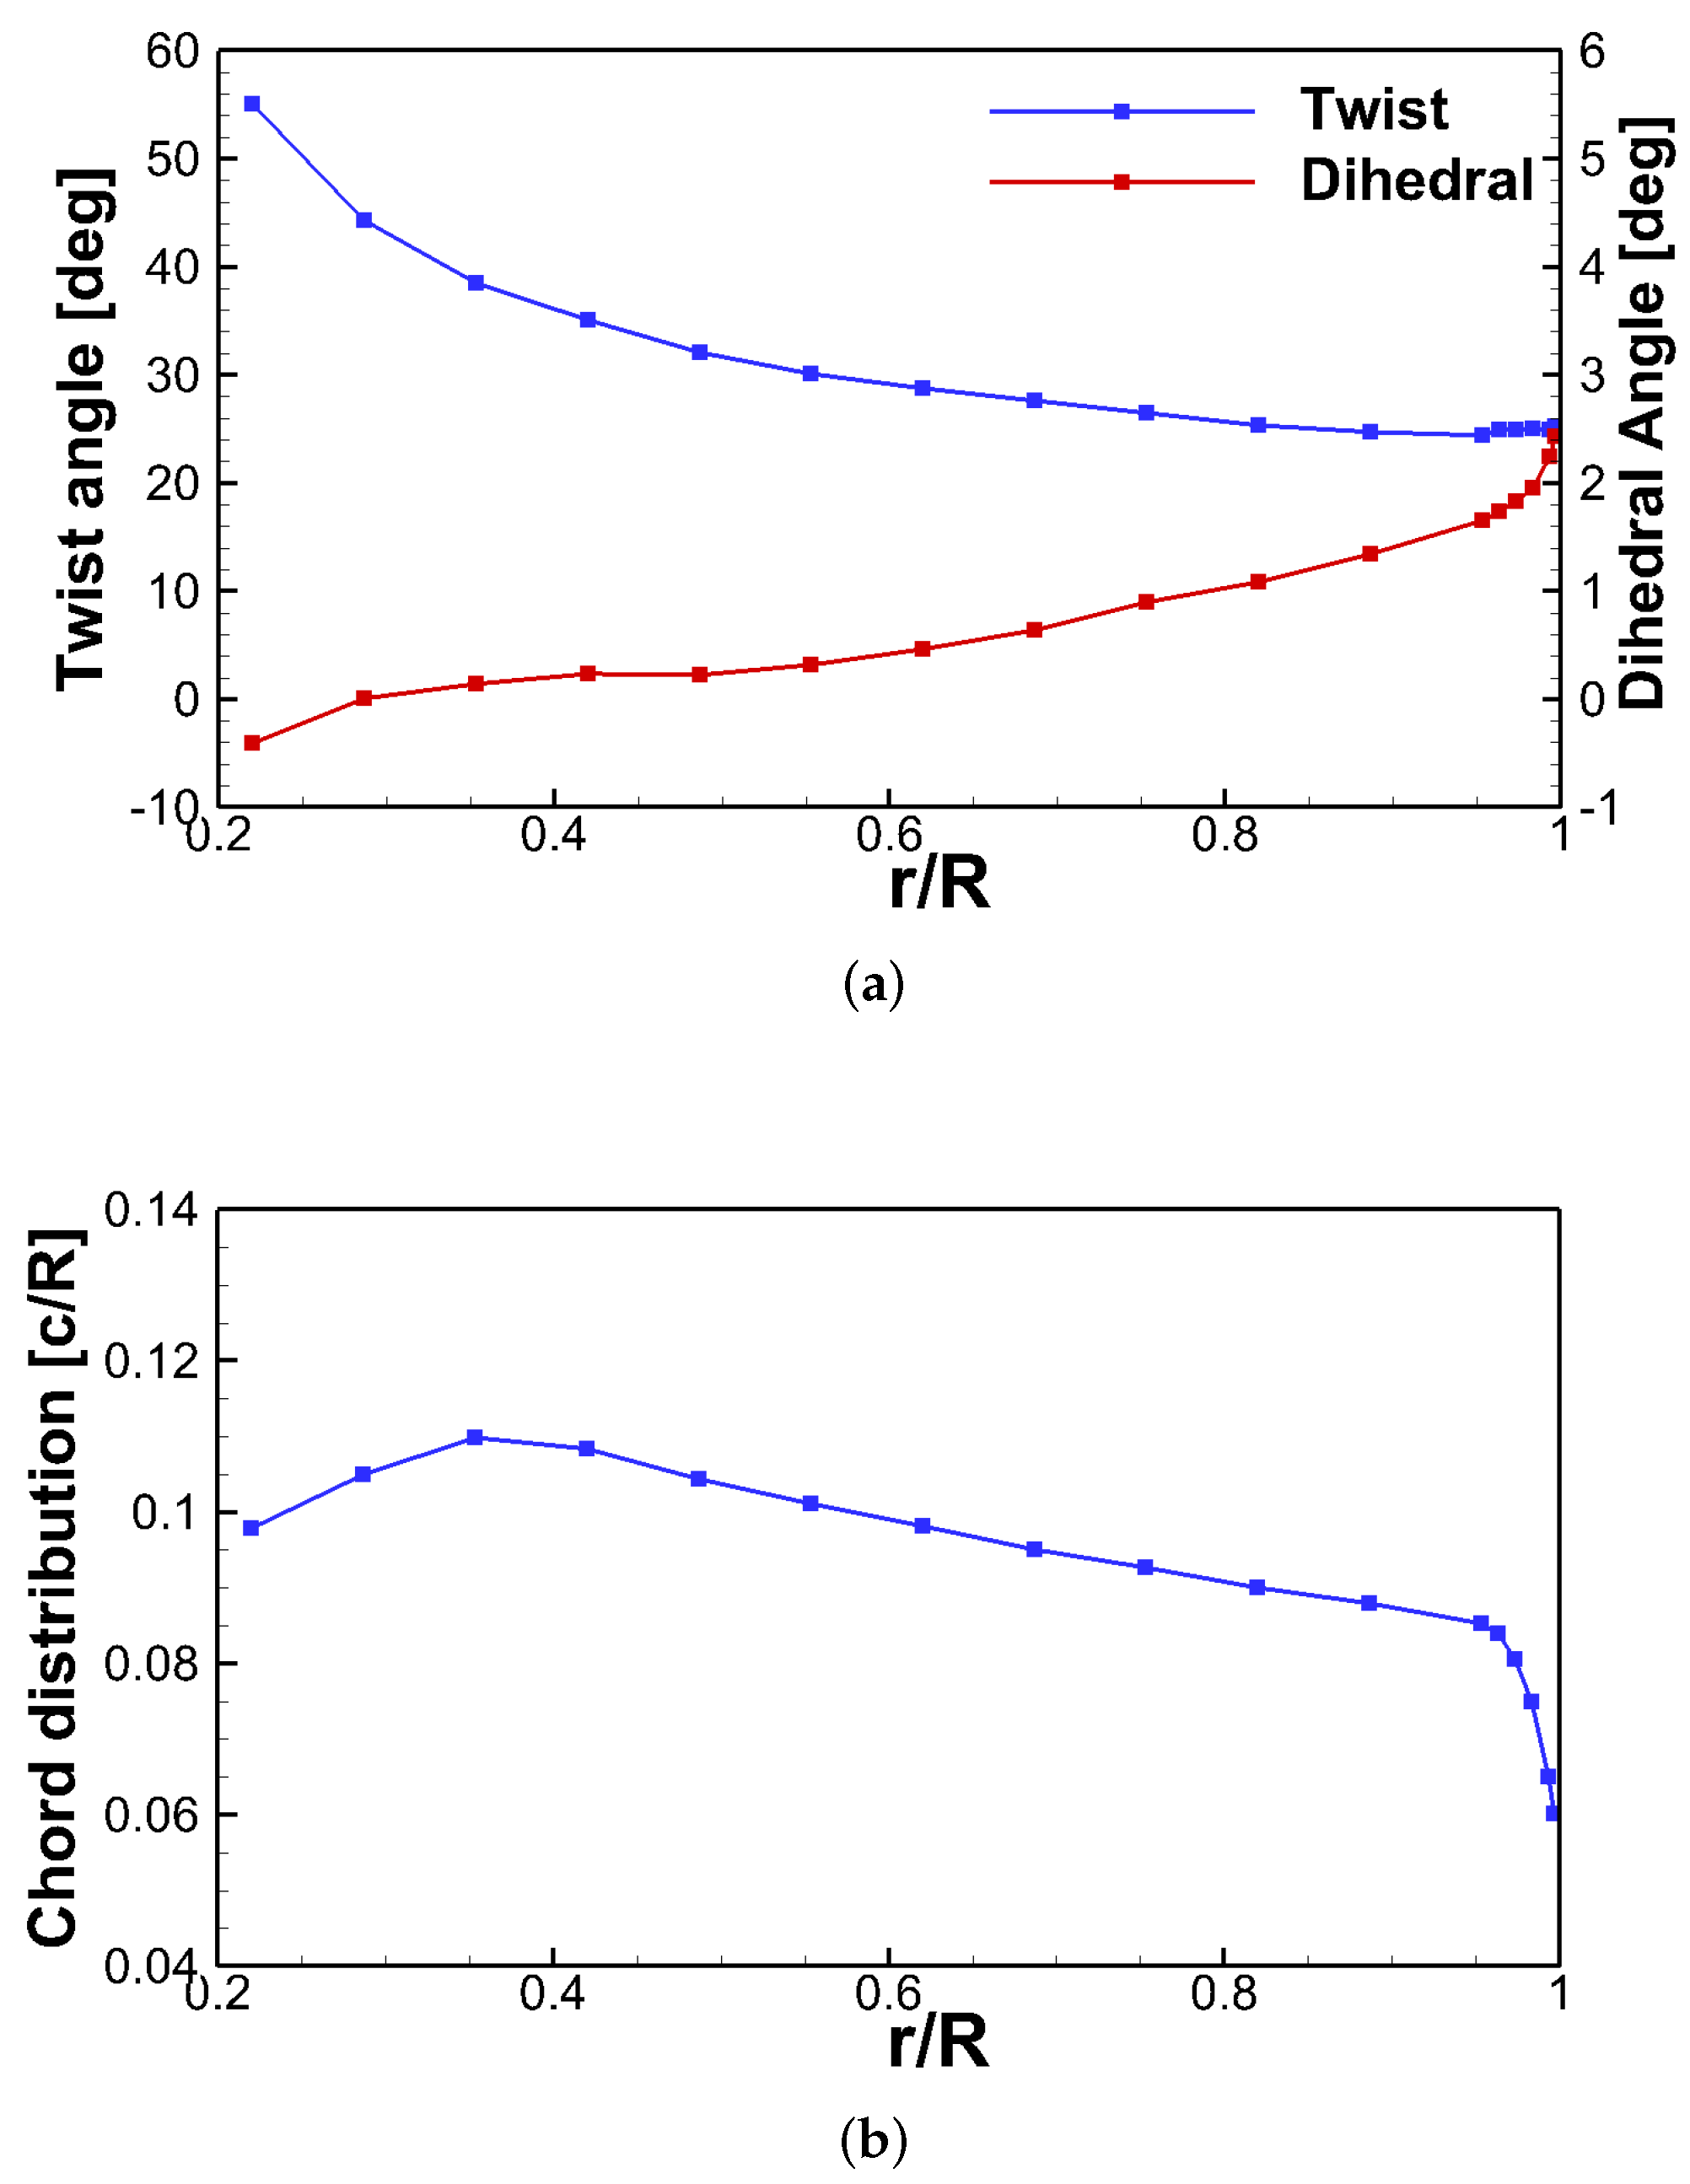
A three-bladed propeller hub, equipped with left-handed VarioProp 12C-L blades, was used in the model design. The diameter D of the propeller model disk was equal to 300 mm. The geometry of the blades was not provided by the manufacturer; thus, a 3D scan of the blade was performed. The distributions of twist, dihedral angle, and chord distributions of the Varioprop 12C propeller blade along the spanwise radial coordinate are shown in Figure 3. The blade airfoil geometry can be disseminated to readers upon request to the author. The propeller hub equipped with a 65 mm diameter aluminium spinner was mounted on an internal aluminium frame that supports the driving system propelled by a Scorpion brushless motor with 5.3 kW continuous power. The motor shaft is connected directly to the propeller hub. The propeller’s RPM was controlled to provide a PWM signal to an external inverter. During the tests, the blade azimuth angles of the two propellers in a side-by-side configuration were not synchronised while the rotational speed of the two propellers was controlled to maintain the same RPM value. Indeed, the implementation of a fast closed-loop control to synchronise the phase angles between the two propeller models at a high RPM selected to reproduce the typical tip Mach number of eVTOLs in cruise flight conditions was not feasible due to hardware limitations of the hobby-grade external inverter available for the tests. Nevertheless, the present set-up reproduced the same experimental approach used by Zhou et al. [5] to investigate a similar test case in the hover condition. Thus, the present experiment is aimed at providing novel info with respect to this recent reference article by investigating the side-by-side interaction in cruise flight conditions.
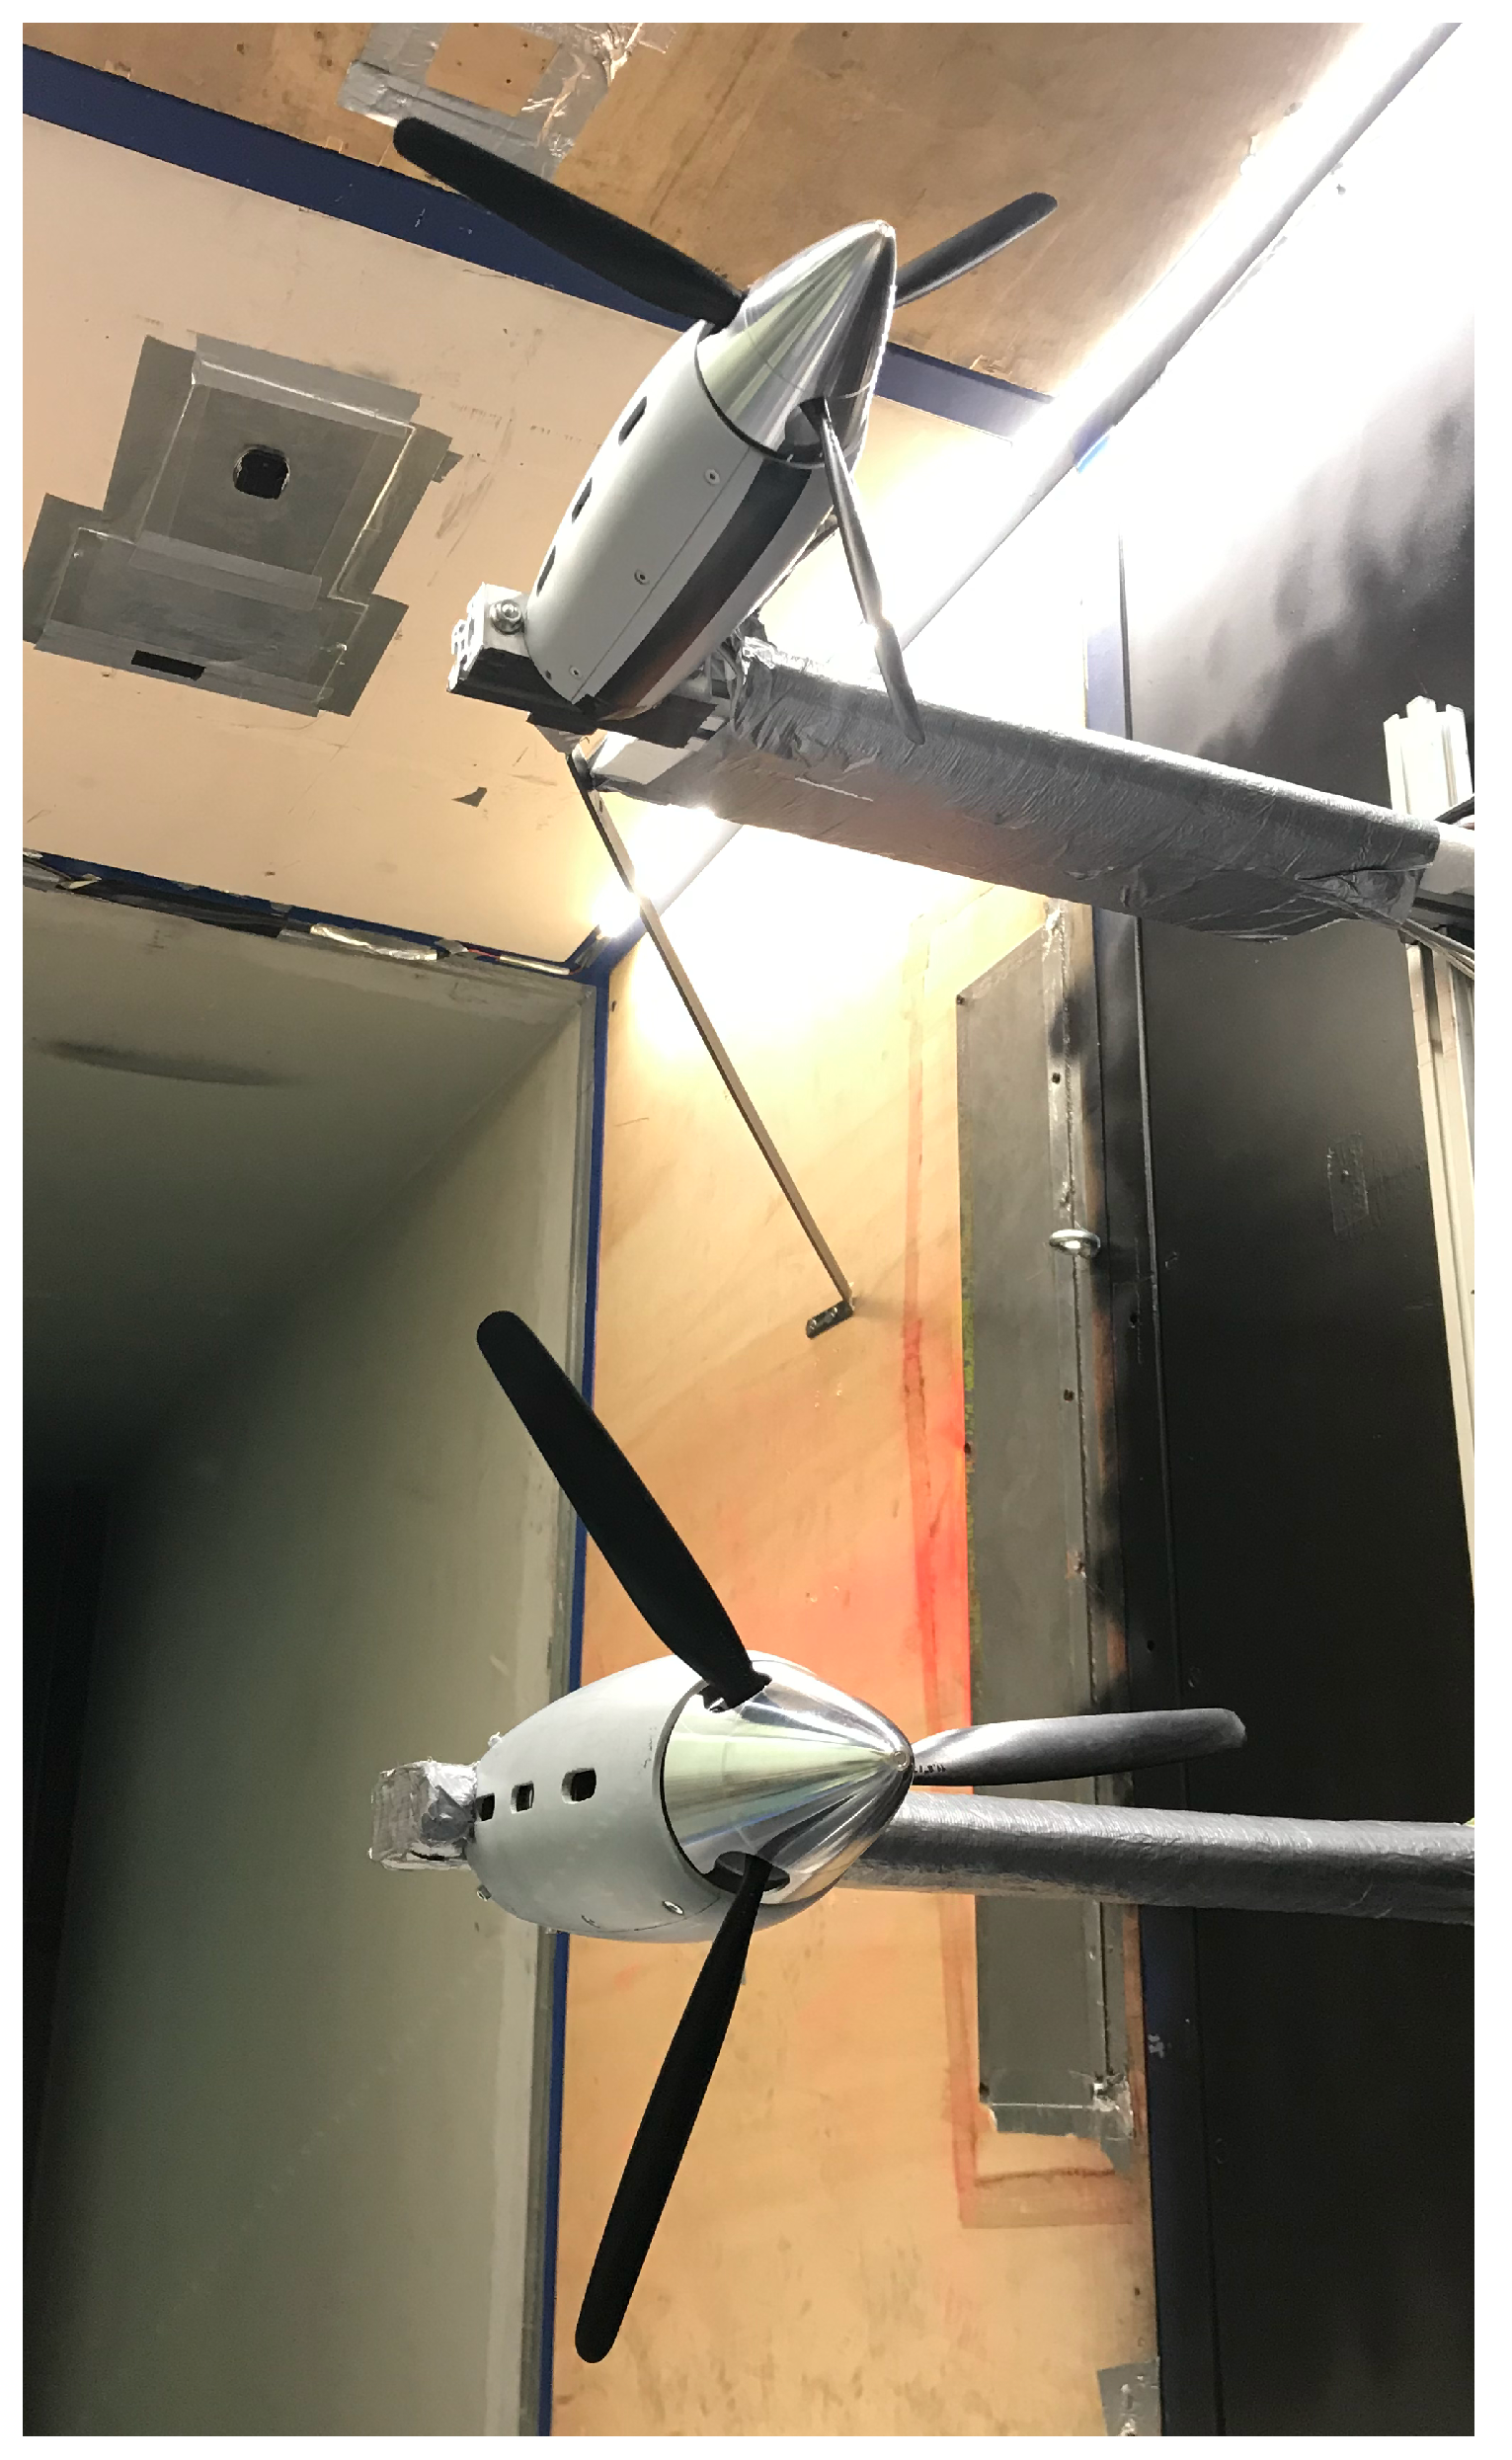
A polycarbonate nacelle manufactured with the FDM technique and with a 270 mm length was mounted on the metallic frame. A Hall-effect sensor was attached on the internal metallic structure of one propeller model and was equipped with a magnet mounted on the motor rotating frame. The Hall-effect sensor was used to provide a 1/rev signal for triggering the phase-locked PIV measurements. The rotational speed was acquired simultaneously with wind tunnel parameters (i.e., dynamic pressure, air temperature, air relative humidity, and atmospheric pressure) by a custom software developed using LabView. The two propeller models were mounted on a thin metallic strut made by 30 mm × 30 mm squared section aluminium profiles. A NACA 0025 fairing was placed over the aluminium strut during the tests. The motors cabling was embedded into the airfoil fairing. The two propellers were mounted in a side-by-side configuration on an aluminium strut with the same section of propellers supported and attached to one of the lateral walls of the wind tunnel test section. This strut, acting as a rail, enabled us to manually modify the separation distance between propellers. A metallic bracing was used during the tests to stiffen the propeller support, avoiding undesired rotations of the twin propellers disks. A picture of the side-by-side propeller models inside the wind tunnel test section is shown in Figure 4.

2.2. Stereo PIV Set-Up

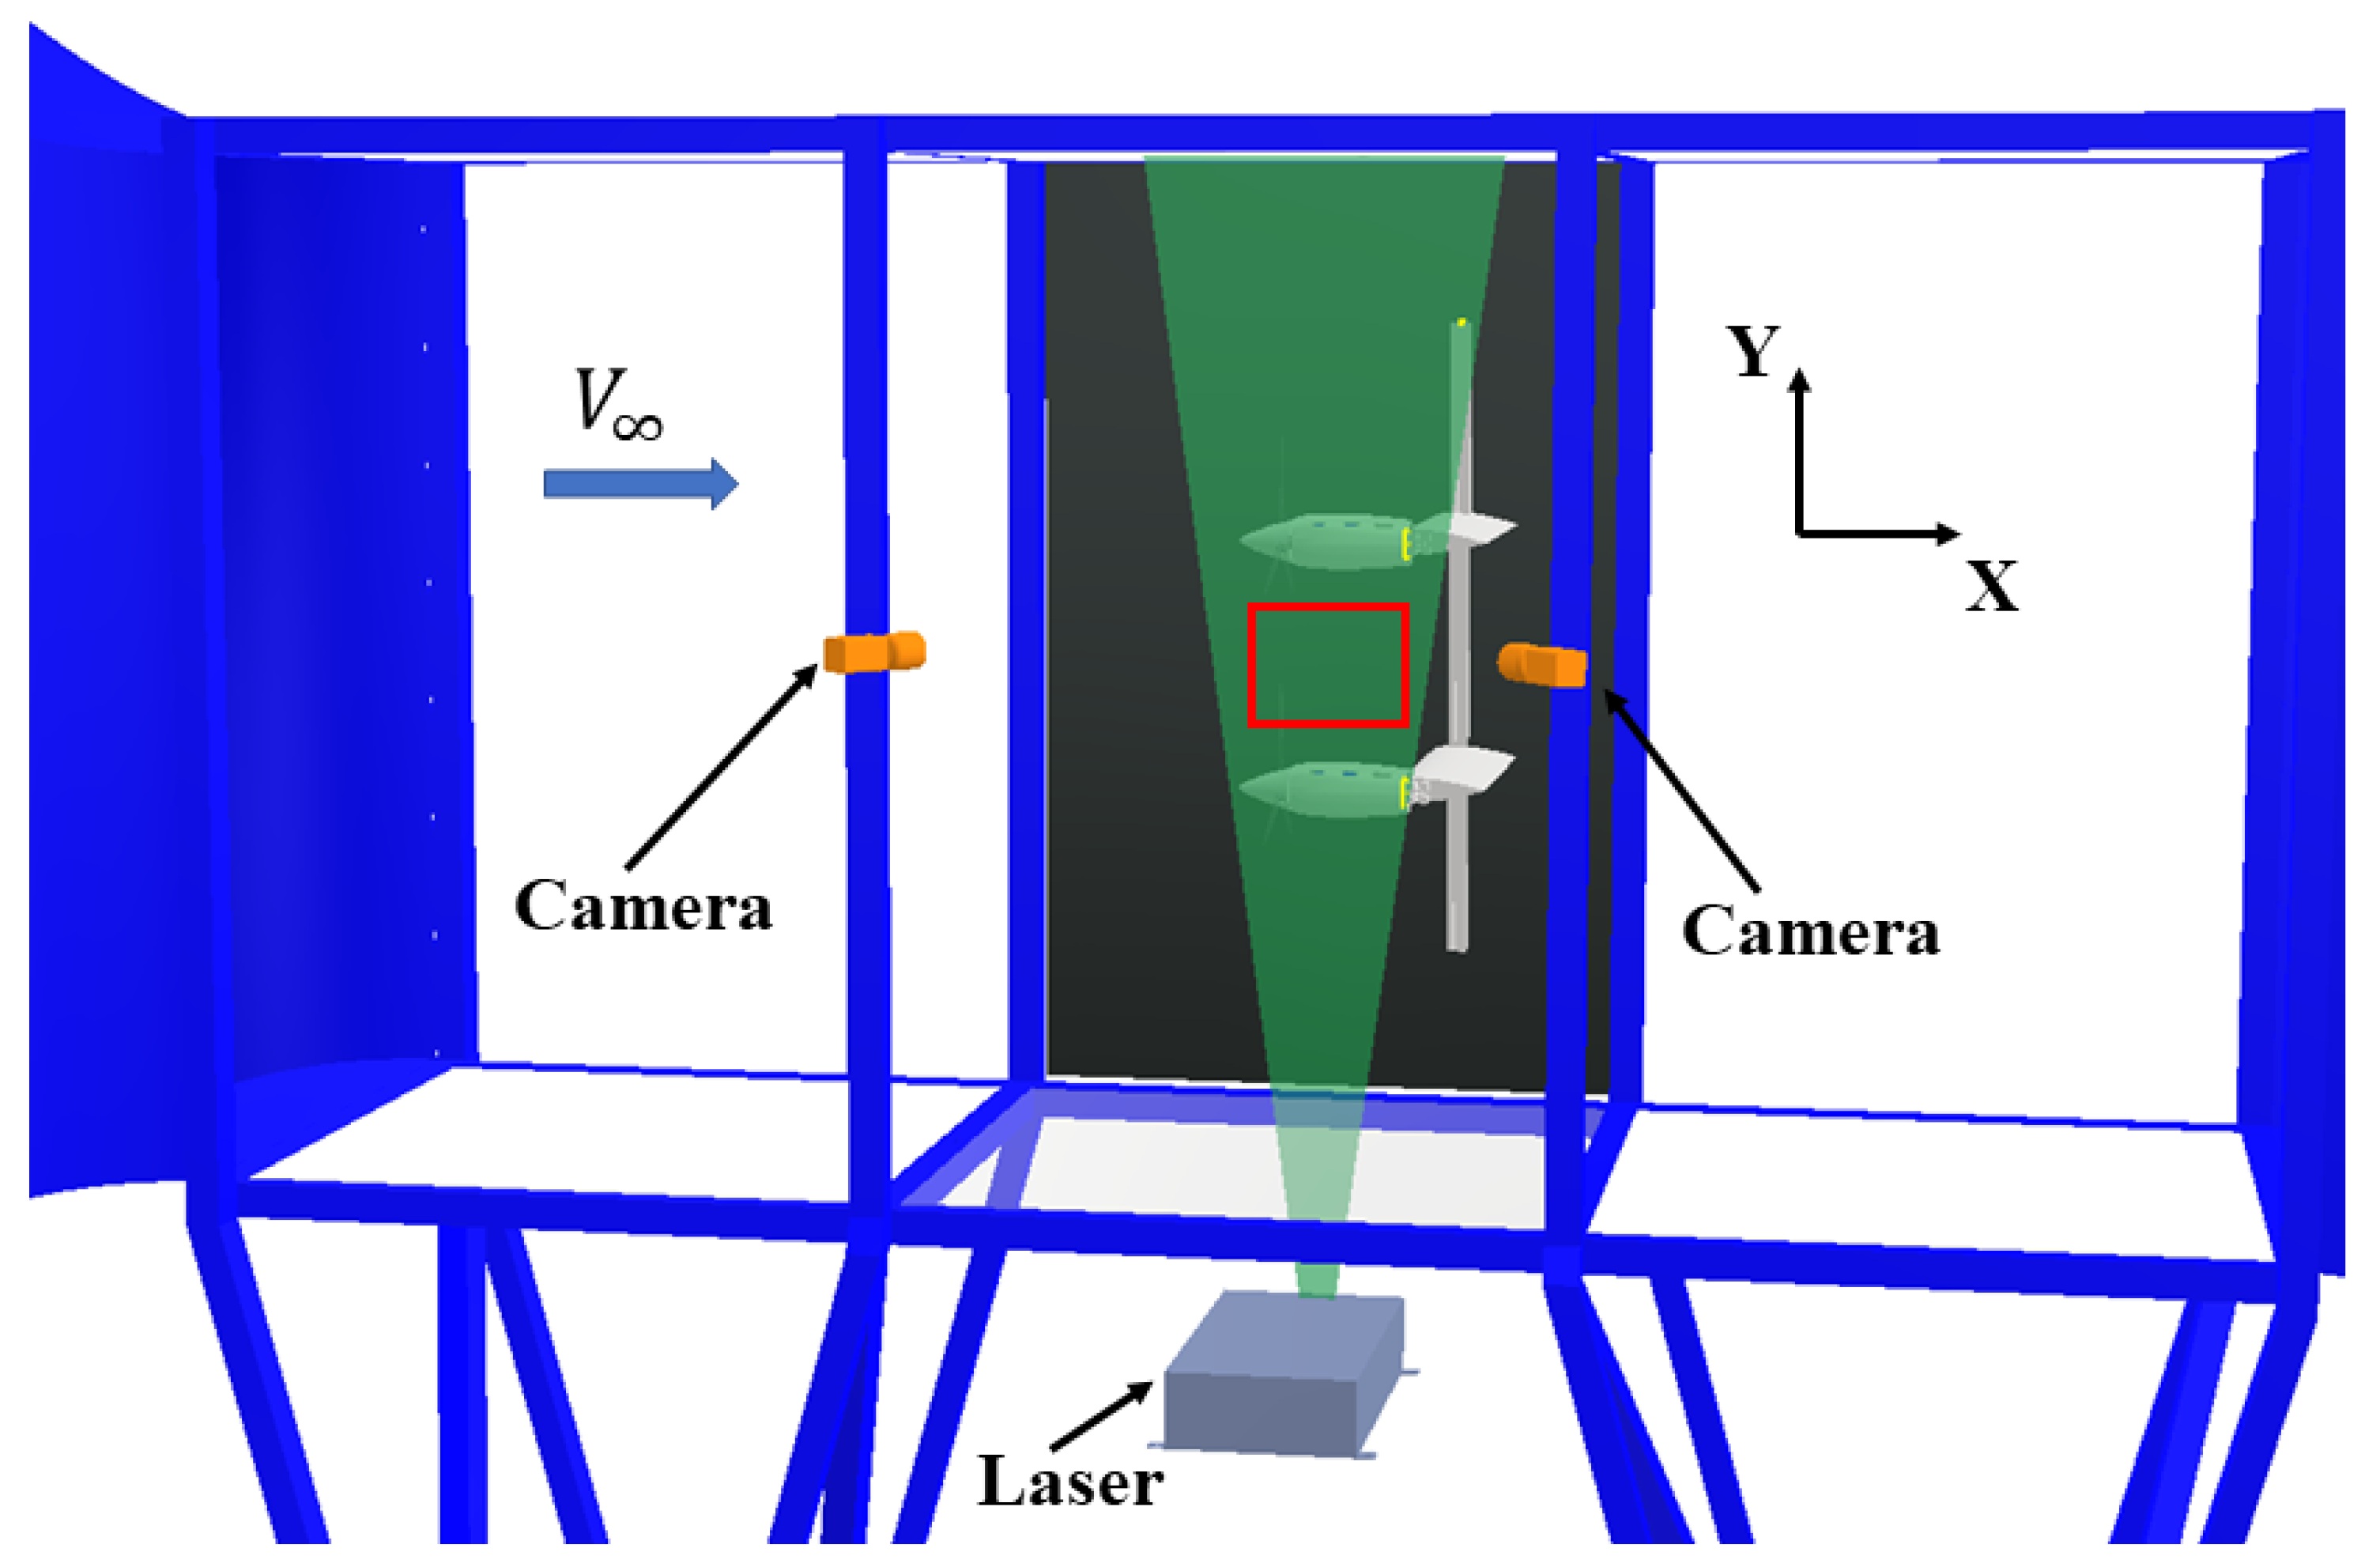
The PIV system is constituted by a Litron NANO-L-200-15 Nd:Yag double-pulse laser with an output energy of 200 mJ and a wavelength of 532 nm, and two Imperx ICL-B1921M CCD cameras with a 12-bit, 1952 × 1112 pixel array. The laser was positioned under the plexiglass floor of the wind tunnel test section and provided a laser sheet aligned with the longitudinal X Y plane by means of a 90 mirror. The laser sheet was shifted by 50 mm with respect to the midspan plane of wind tunnel test section to avoid light obstruction due to the lower propeller nacelle (see layout in Figure 5). The cameras were mounted in stereoscopic mode with a separation angle that was limited to 30 , owing to the optical access limitation of the wind tunnel test section. Each camera was equipped with a Nikkor 28 mm lens and a tilting type lens to correctly focus the measurement window. The tilting lens mountings were adjusted in order to achieve the Scheimpflug condition [16]. As the azimuthal blade angle of the two propellers were not synchronised, phase-locked 3C measurements were performed with respect to the blade azimuthal angles of the upper propeller (see details in Section 3.1). Consequently, the lower propeller in the side-by-side configuration was considered as in the free-run condition, as in the phase-locked PIV surveys by Zhou et al. [5]. The area of investigation was 228 mm wide and 148 mm high and was positioned past the twin propeller disks between the nacelles, as indicated by the red rectangular zone depicted in Figure 5. The synchronisation of the two laser pulses with the image pair exposure was controlled by a six-channel Quantum Composer QC9618 pulse generator. The pulse generator received as input the signal of the Hall-effect sensor mounted on the upper propeller model to trigger the laser pulses and image acquisition from the camera with respect to the propeller blade azimuthal angle requested for the test. A particle generator (PIVpart30 by PIVTEC) equipped with Laskin atomizer nozzles was used to fulfill the wind tunnel test section with seeding. The seeding particles consisted of small oil droplets with a diameter in the range of 1–2 μ m.
The image pairs analysis was performed by PIVview 3C software developed by PIVTEC. In particular, the multigrid interrogation method [16] was used, starting from a 128 pixel × 128 pixel to a 16 pixel × 16 pixel interrogation window. An effective overlap of 50% of the interrogation window was considered in the PIV image pair post-processing, thus resulting in a spatial resolution of 1.7 mm between adjacent measurement points. Two hundred image pairs were acquired for each of the four azimuthal blade angles of the upper propeller considered by phase-locked measurements. The resulting velocity fields presented in the paper were both phase-averaged over the image pairs acquired for a single azimuthal propeller blade angle and ensemble-averaged over all image pairs acquired at the different blade azimuthal angles (total amount of 800 image pairs). The accuracy of the PIV measurements can be estimated by considering a maximum displacement error of 0.1 px, as verified in a previous work performed with the same instrumentation set-up [17]. Taking into account the pulse-separation time and the optical magnification used for the present tests, the maximum in-plane velocity error was about 1% of the maximum in-plane velocity component [18].

3. Results and Discussion

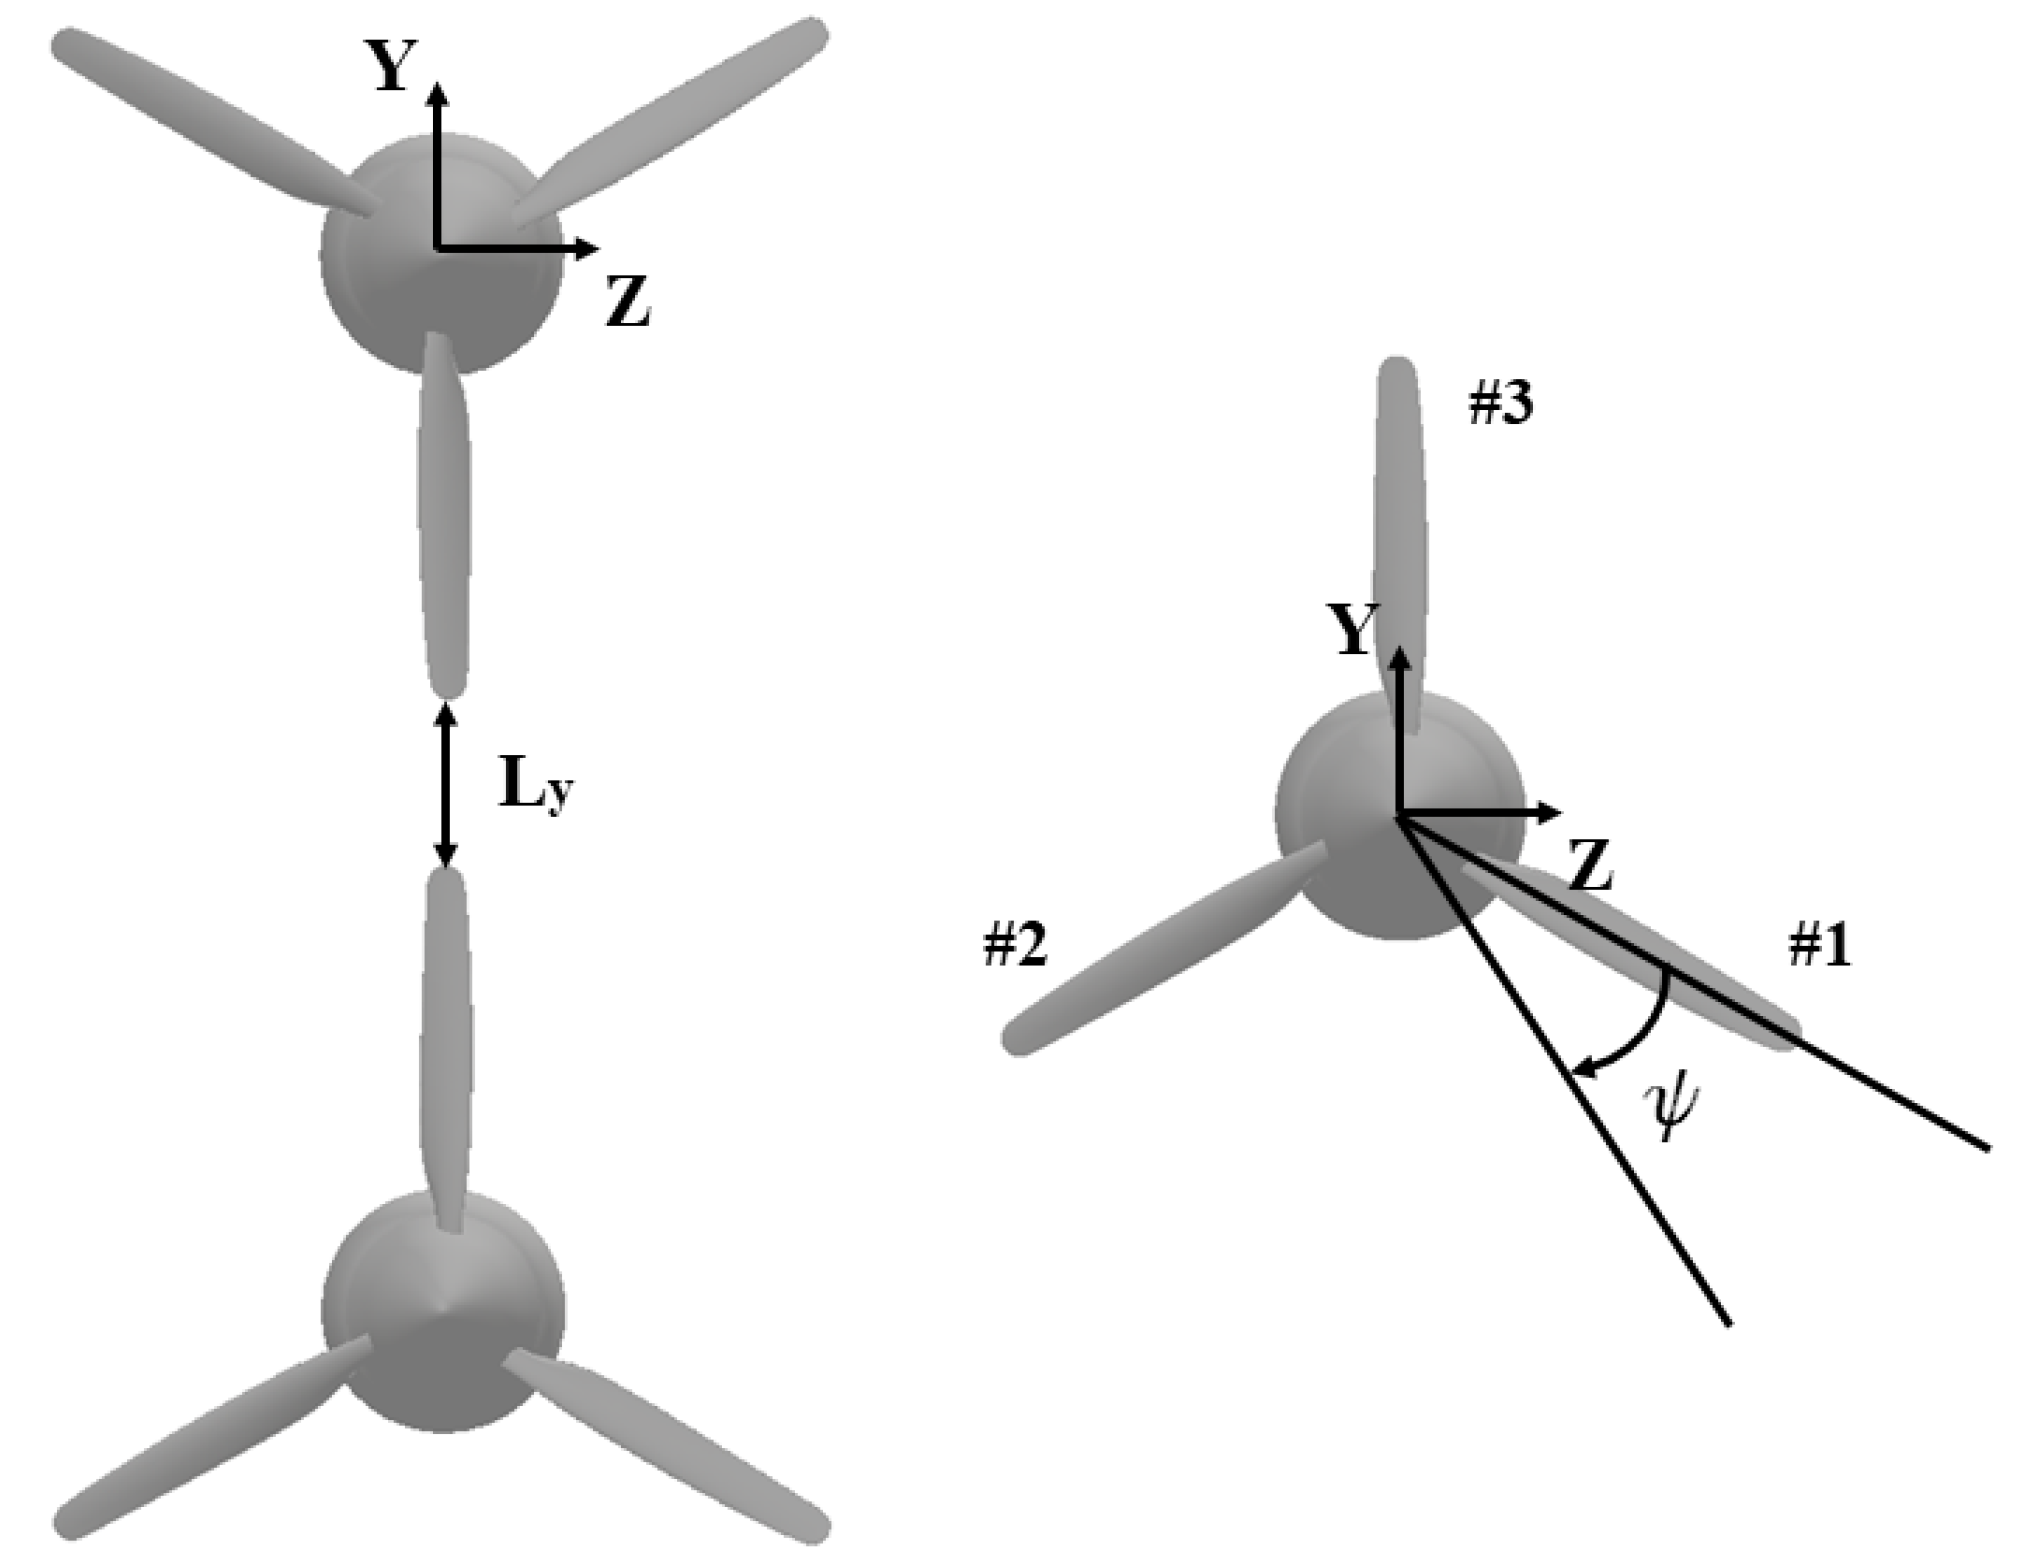
The experimental campaign aimed to study the interactional flow field between side-by-side propellers in forward flight, with a focus on the typical target cruise flight velocities considered for eVTOL in an urban environment. The reference system X Y Z used to present the experimental results is presented in Figure 6, where the X axis is directed as the wind tunnel freestream velocity direction (see Figure 5). The origin of the reference system is positioned on the upper propeller disk center.

3.1. Test Matrix

The wind tunnel campaign consisted of runs performed with side-by-side co-rotating clockwise propellers with rotational speed controlled to 7050 RPM. This RPM target value was considered to reproduce the typical full-scale tip Mach number ( M t = 0.325 ) of a eVTOL aircraft while cruising [2]. The propeller RPM time histories acquired during wind tunnel runs showed variations below 1.5% of the target value. The Reynolds number based on the propeller disk diameter and on the rotational velocity evaluated at 70%R was R e D = 1.96 × 10 6 .
The nacelle axis of both propeller models was aligned to the wind tunnel freestream velocity to reproduce the cruise flight conditions. During the tests, both propellers had the same blade pitch angle so that they could perform equivalently (i.e., θ = 26 . 5 evaluated at 75%R). In order to maximise the interactional effects, flow surveys were performed with lateral distance L y , defined as the blade tip distance between side-by-side propellers (see Figure 6), equal to 0.05D. This separation distance, which is the same one used in the stereo PIV experiments by Zhou et al. [5], was considered the minimum distance to warrant safety during the tests, avoiding possible mechanical interference between side-by-side blades due to vibrations or instabilities triggered by aerodynamic wake interaction. Two advance ratios, i.e., J = 0.4 , corresponding to wind tunnel freestream velocity V = 14.1 m/s, and J = 0.8 , corresponding to V = 28.2 m/s, were considered for the side-by-side propeller tests to reproduce a moderate and a fast cruise flight speed of eVTOL aircraft, respectively. Preliminary PIV surveys were performed over a single propeller operating at same conditions and advance ratios to evaluate interactional flow effects by comparison with side-by-side propellers results. Stereo PIV surveys were performed phase-locked with four azimuthal angles of the upper propeller #1 blade (see the definition in Figure 6), i.e., ψ = 0 , ψ = 30 , ψ = 60 , and ψ = 90 , while the lower propeller works as in the free run during the tests. The stereo PIV measurement test matrix is reported in Table 1.

3.2. Flow Field Analysis

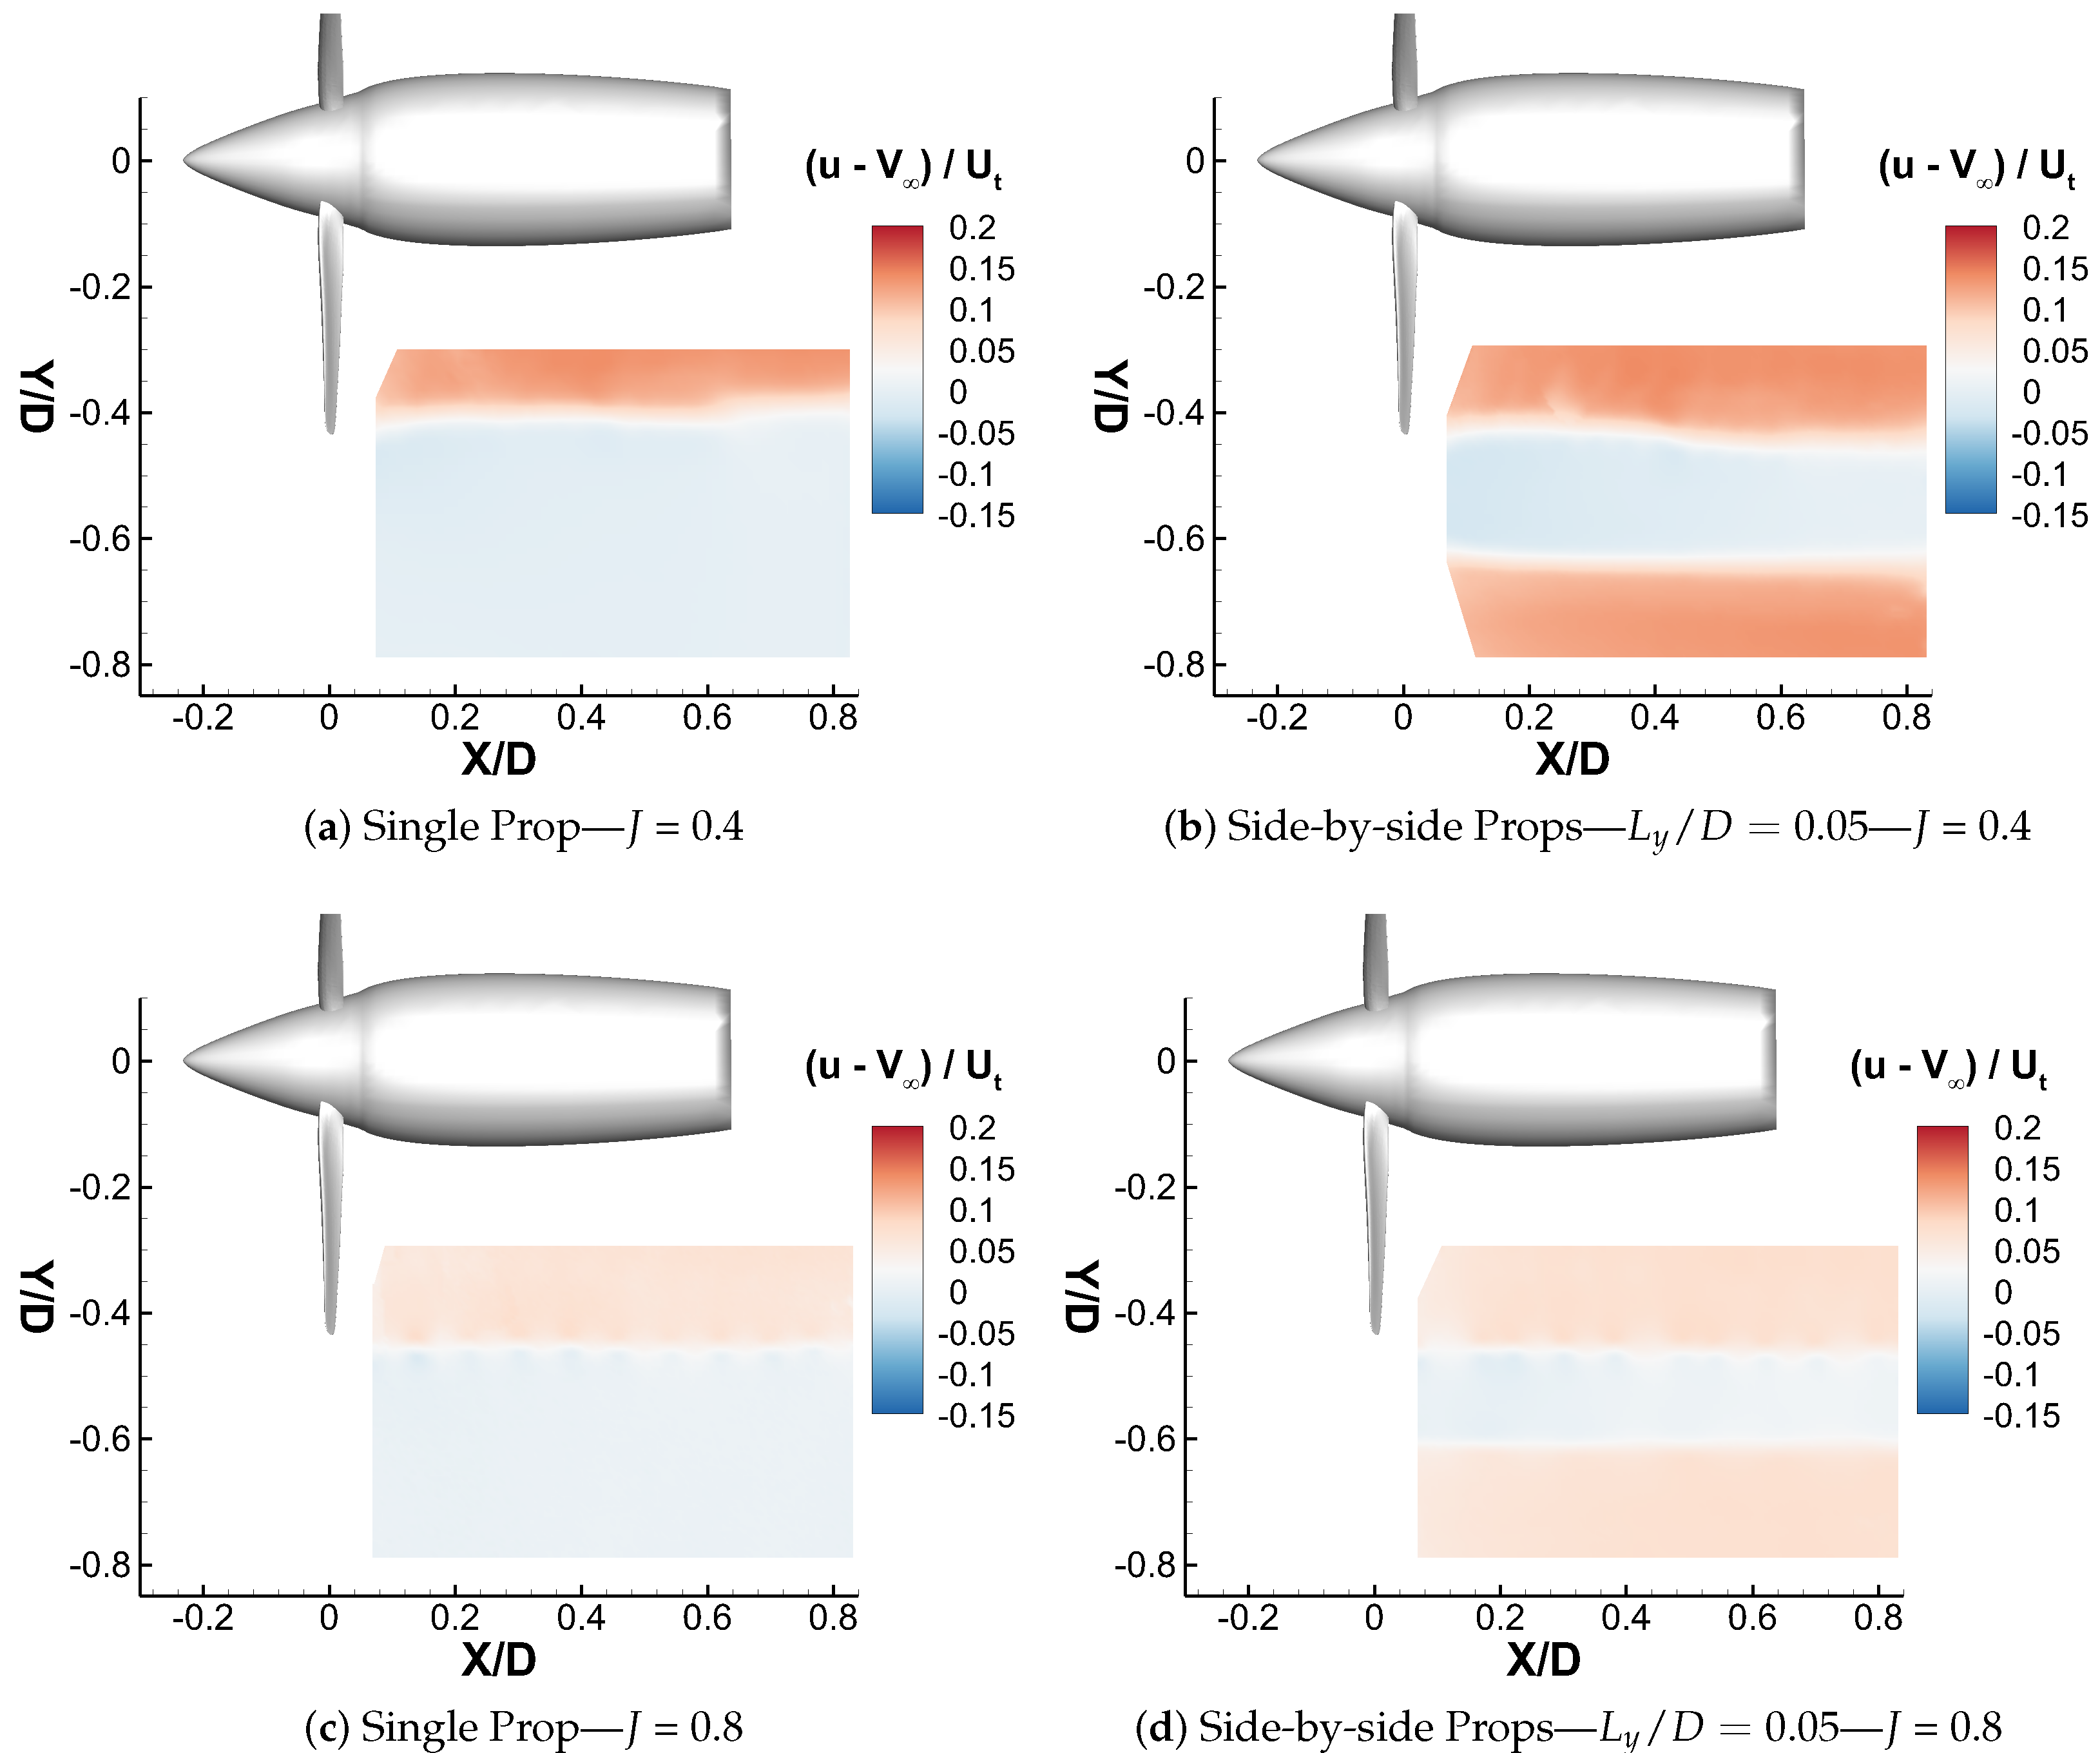
This section presents a discussion of the main results obtained by the stereo PIV flow surveys. Figure 7 shows a comparison of the ensemble-averaged non-dimensional freestream velocity component ( u V / U t ) between the single propeller and side-by-side propellers for both advance ratios tested.
For the lower advance ratio test case (i.e., J = 0.4), the upper propeller wake boundary in side-by-side configuration shows an expansion with respect to the single propeller test case (see Figure 7b). Indeed, the aerodynamic interaction of the nearby rotating propeller avoids a natural contraction of the wake boundary profile (see Figure 7a). Moreover, due to the interaction and to the co-rotation of the two propellers, the flow field of the side-by-side propellers observed in the measurement region is not completely symmetric. For the higher advance ratio tested (i.e., J = 0.4), the wake boundaries of the single propeller case and the upper propeller in the side-by-side configuration are almost similar (see Figure 7c,d). Indeed, the aerodynamic interaction at fast cruise speed is negligible, as confirmed by the quite symmetrical behavior of the flow field for the side-by-side propeller configuration.
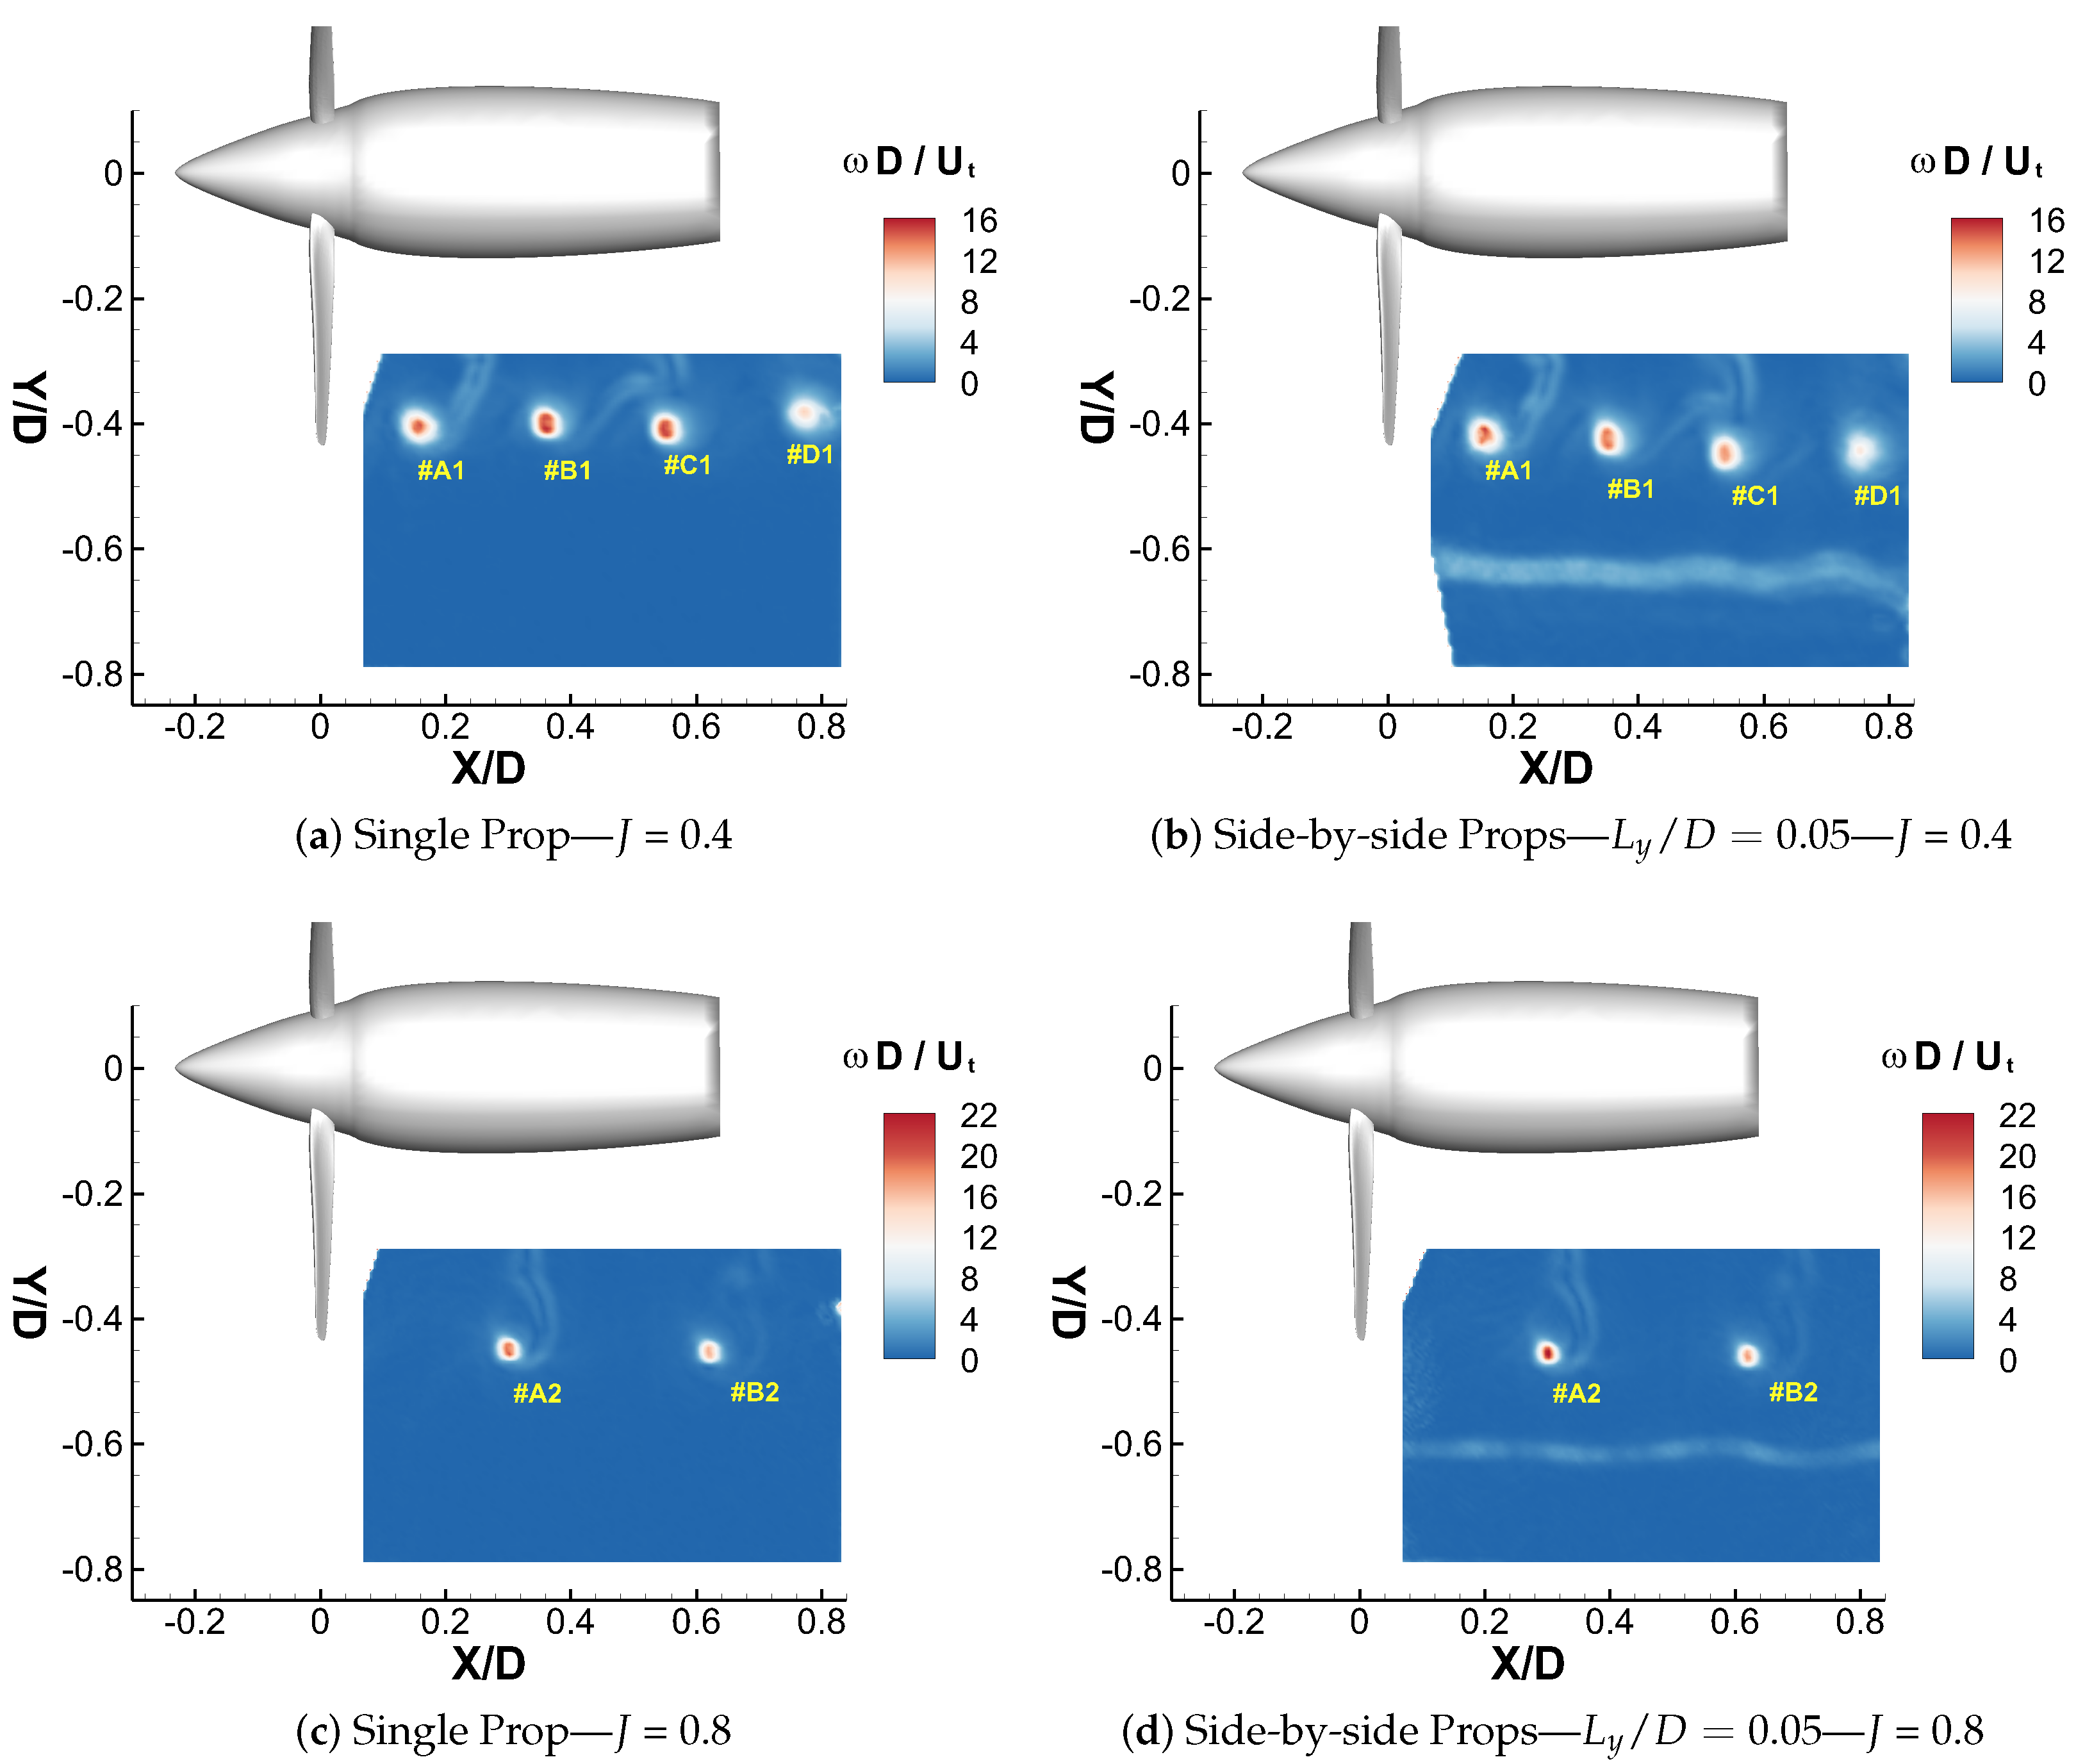
Detailed insight about the effects of the side-by-side aerodynamic interaction on the tip vortex topology and distribution is provided in the following using the flow fields evaluated by phase-locked stereo PIV measurements. The choice to present the phase-locked measurement results for a singular blade azimuthal angle is for the sake of consistency but does not affect the main findings of the work. As the PIV surveys were phase-locked with the upper propeller blade azimuthal angle, the phase-averaged flow fields show consistent tip vortex structures issued by the upper propeller blades in the higher region, while the lower region is characterised by a uniform flow region bounded by traces of the tip vortices issued by the lower propeller, as the lower propeller works in the free-run condition, analogously to what was observed from the ensemble-averaged results. Nevertheless, the focus of the following discussion is on investigating the effects of an aerodynamic interaction on the tip vortex topology of the upper propeller by comparison with the phase-locked results obtained for the single propeller configuration. Figure 8 shows a comparison of the phase-averaged non-dimensional vorticity magnitude ( ω D / U t ) between the single propeller and side-by-side propellers computed by phase-locked PIV surveys performed at blade azimuthal angle ψ = 90 for both advance ratios tested.
The flow features in the upper propeller wake are characterised by consistent tip vortex structures that were periodically issued by rotating blades (i.e., identified by numbered yellow capital letters in the figures). As expected, the number of tip vortices captured by the PIV investigation window for the low advance ratio J = 0.4 is doubled with respect to the high advance ratio J = 0.8 due to the different freestream velocities dragging the vortices downstream (see Figure 8a,c). As also shown by the flow surveys performed by Zhou et al. [5] in hover for a similar test case and an equal separation distance between propellers, a wave-shaped flow structure related to the periodical shedding of lower propeller tip vortices is highlighted by the vorticity contour representation for the side-by-side propeller configuration at both advance ratios (see Figure 8b,d).
For the low advance ratio J = 0.4, the vorticity field representation shows that the side-by-side interaction does not alter the vorticity magnitude of the vortices in the inner part of the upper propeller wake (i.e., vortices #A1 and #B1) while the tip vortices in the outer wake (i.e., vortices #C1 and #D1) are more diffused due to the interaction with respect to the single propeller test case (see Figure 8a,b). Indeed, for the low advance ratio, the upper propeller wake was attracted and bent toward the adjacent side-by-side propeller. This interactional effect, particularly apparent in the outer region of the wake, provides a higher diffusion of the tip vortices in this region. Nevertheless, the vortex structures for the test cases characterised by a low wind tunnel freestream velocity do not loose their coherence, different from the results in Zhou et al. [5] in the hover condition. For the high advance ratio J = 0.8, the effect of the side-by-side interaction on the upper propeller wake is negligible both in terms of vorticity magnitude level and core displacements of the tip vortices (see Figure 8c,d). Due to the higher freestream velocity that characterises the test case at J = 0.8, the vorticity magnitude level observed for the tip vortices is higher than the one evaluated for low advance ratio test cases (i.e., J = 0.4). Moreover, the vorticity contour representation clearly shows the presence of pairs of shear layers generated by merging the boundary layers from blades upper and lower surfaces. No interactional effects on vorticity sheets can be observed for both advance ratio test cases considered by the wind tunnel campaign, as shown by the negligible differences of their topology observed between a single propeller and the side-by-side propeller test case.
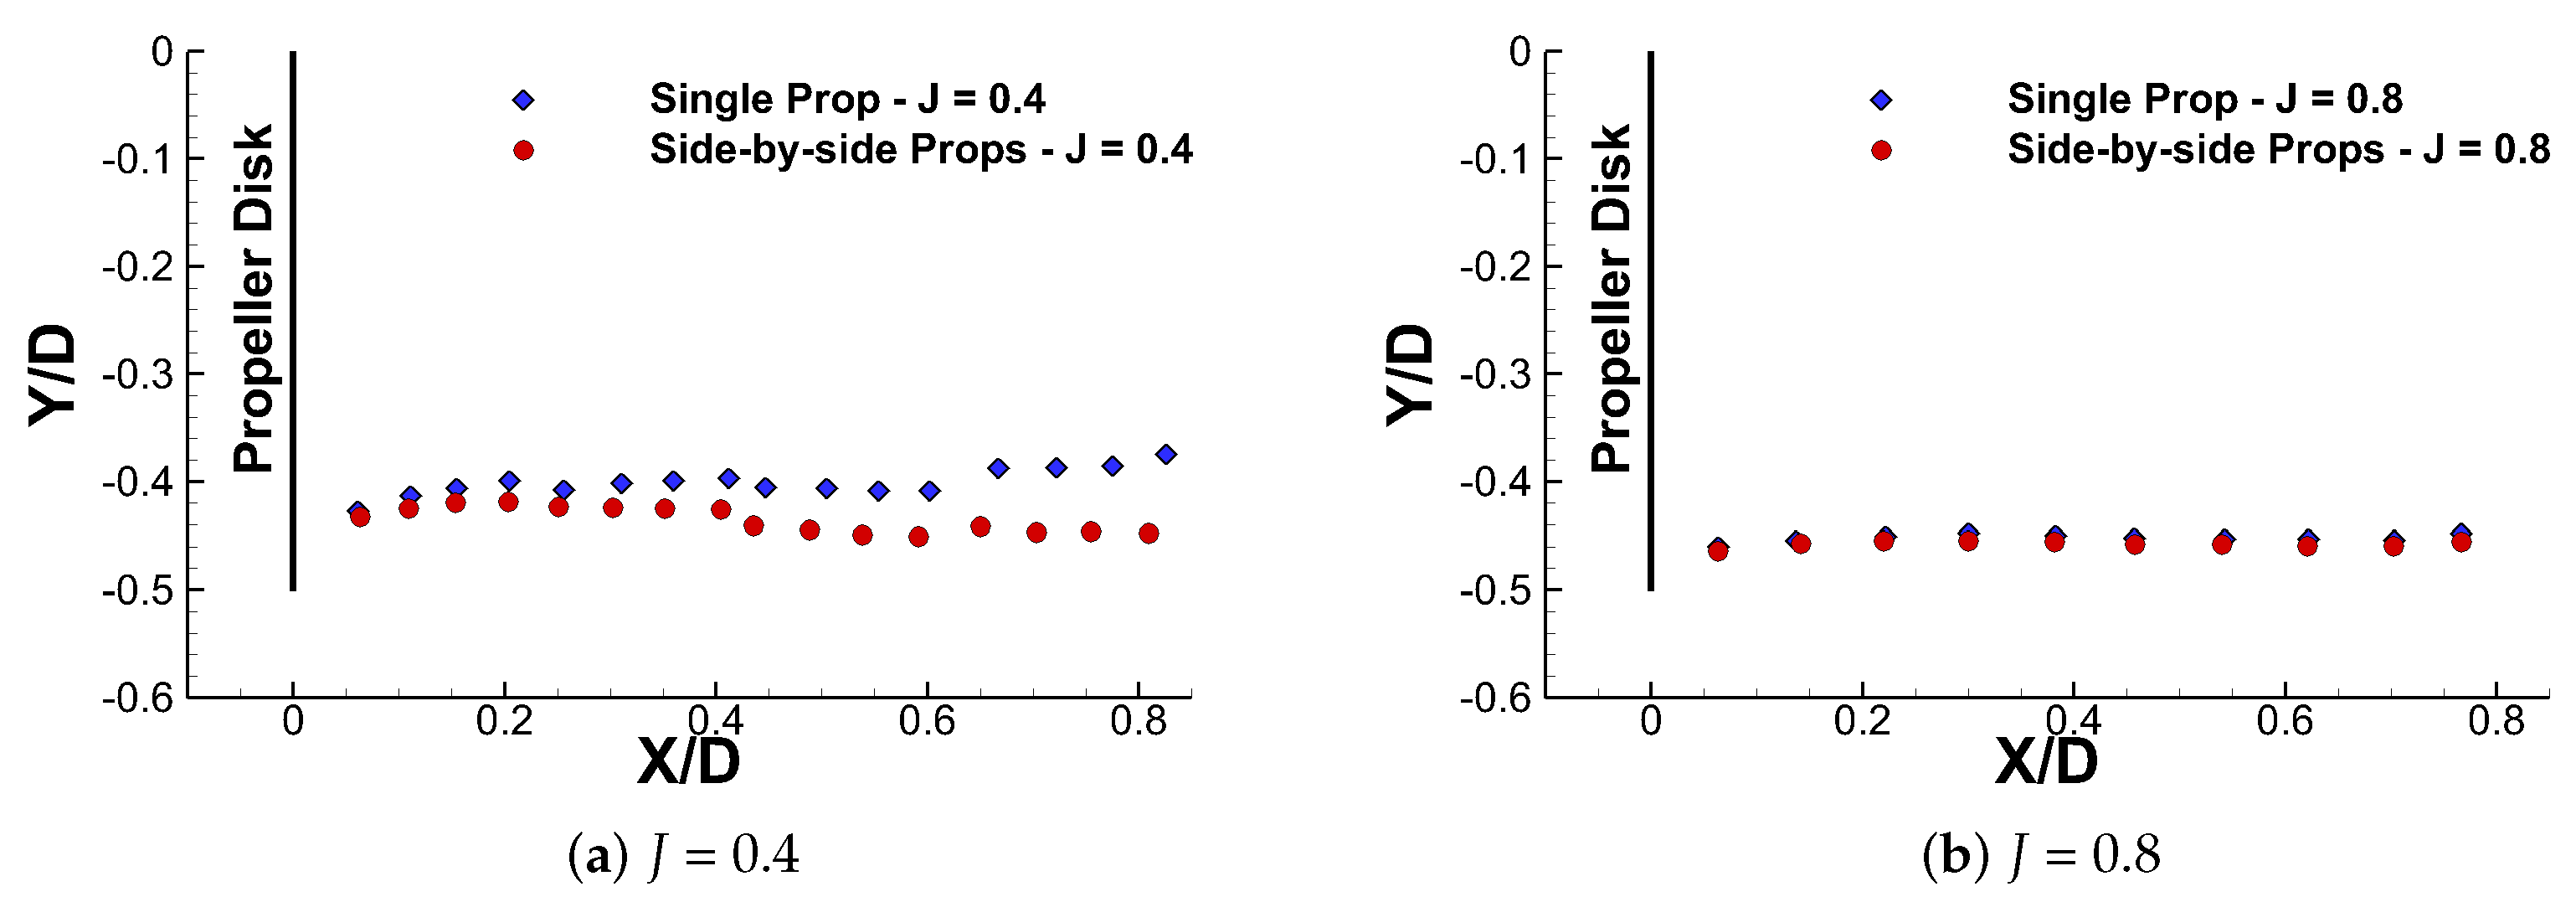
In order to quantitatively evaluate the effect of a side-by-side interaction on wake boundaries, Figure 9 shows a comparison of the tip vortex core displacements for both advance ratios tested. The vortex core positions were evaluated in correspondence with the peaks of vorticity magnitude [19]. The vortex core positions were plotted for all phase-locked blade positions considered by PIV measurements, i.e., ψ = 0 , ψ = 30 , ψ = 60 , and ψ = 90 . A maximum displacement of the vortex core position below 1% D was found both in the horizontal and vertical directions by considering the instantaneous flow fields collected for each phase-locked measurement. These small displacement values were found to be common for both single and side-by-side propeller configurations, thus slightly affecting the following discussion concerning wake boundary comparisons.
As previously indicated by the ensemble-averaged PIV results, for the lower advance ratio test case, Figure 9a shows a quite apparent expansion of the upper propeller wake boundary profile in the side-by-side configuration with respect to the single propeller test case. In particular, for this advance ratio, the wake boundary profile resumes almost the same single propeller profile behavior in the inner region up to X / D = 0.1, while an 8% propeller diameter increase in the wake boundary is observed downstream from the propeller disk at X / D = 0.8. On the other hand, for the higher advance ratio tested, the wake boundary profiles of the single and side-by-side propeller show the same pattern, confirming the negligible effect of this interaction on the wake topology at fast cruise speed. Generally, the wake dragging effect provided by the influence of the flow field generated by nearby propellers is reduced by increasing the flight speed. This result is consistent with the outcomes of the PIV surveys performed by Zhou et al. [5] in the hover condition, showing a higher dragging effect due to the aerodynamic interaction.
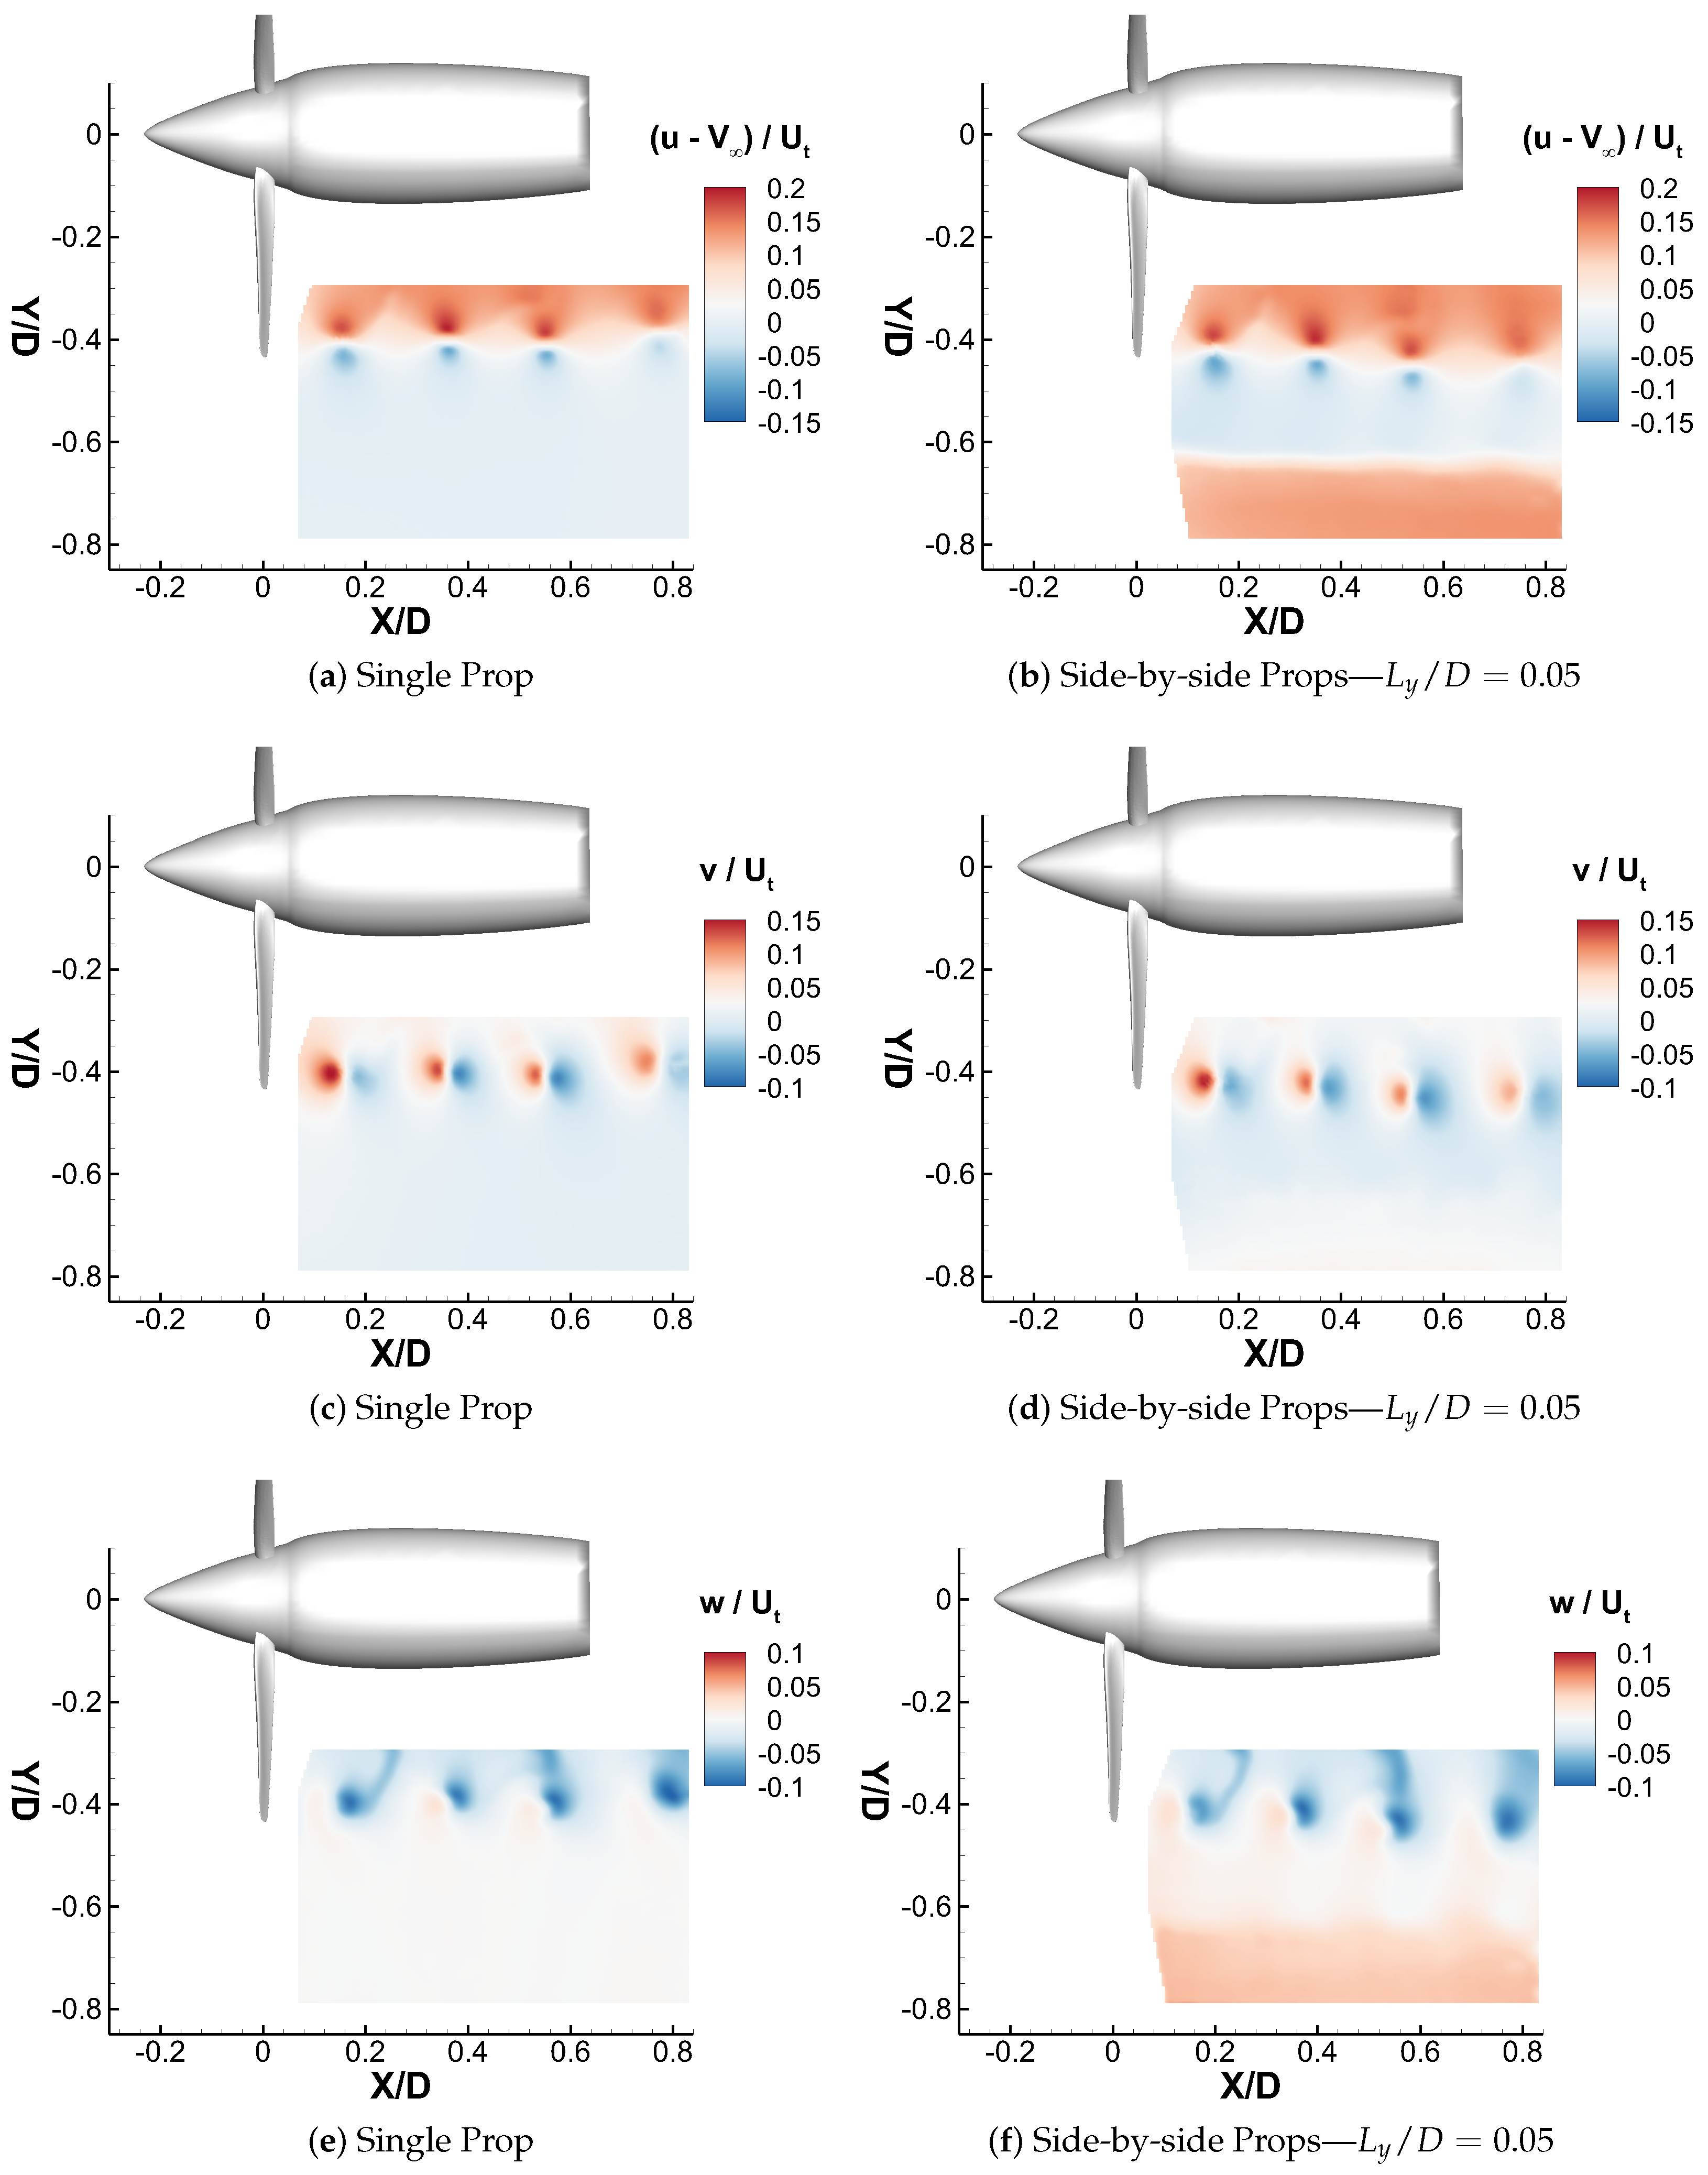
Detailed insight on the flow physics characterising side-by-side interaction can be achieved from the comparison of the contours of the phase-averaged non-dimensional three velocity components (u, v, w) shown in Figure 10 and Figure 11 measured at blade azimuthal angle ψ = 90 for both advance ratios tested.
The freestream velocity component representation of the flow field clearly highlights the presence of the tip vortices issued by the upper propeller rotating blade and the wave-shaped wake boundary provided by the lower side-by-side propeller. The freestream velocity component variations with respect to flight speed ( u V ) provided by the rotating blades inside the propeller wakes are lower for the test case with a higher advance ratio (J = 0.8). In order to quantitatively investigate the effect of the lower propeller on the upper propeller tip vortices, Figure 12 and Figure 13 show a comparison of the freestream velocity component profiles extracted in correspondence with the tip vortex core locations ( X v , Y v ), evaluated as in Figure 9, for blade azimuthal angle ψ = 90 . The standard deviations in the velocity components computed considering the instantaneous flow fields collected during phase-locked measurements were added as error bars on the velocity profiles.
For the lower advance ratio test case J = 0.4, the comparison of the freestream component velocity profiles extracted in the inner wake of the upper propeller at tip vortex core location #A1 shows that the aerodynamic interaction of the nearby propeller produces an increase of the lower peak of velocity value with respect to single propeller case, while the slope of the profiles remains unaffected (see Figure 12a). The error bars among the vortex region and particularly around the lower peak are similar for both single and side-by-side propellers, thus confirming the findings concerning interactional effects in this area. The velocity profile for the side-by-side configuration approaches a lower value of the freestream velocity V outside the wake boundary of the upper propeller, while a large positive variation in u velocity is experienced while going through the lower propeller wake boundary, where also an increase in the velocity standard deviation is observed with respect to the single propeller test case. The analysis of velocity profiles extracted at the tip vortex core positioned downstream of the upper propeller disk shows that the nearby propeller aerodynamic interaction produces a decrease in both the peak-to-peak velocity values and the curve slope with respect to the single propeller test case. This effect increases for tip vortices further downstream from the propeller wake (see Figure 12b,c,d for vortices #B1, #C1, and #D1, respectively). Consequently, due to the side-by-side interaction, the tip vortices in the outer wake of side-by-side propellers are characterised by lower circulation and a lower vorticity level with respect to the single propeller test case. Nevertheless, a slightly higher standard deviation of the velocity is observed among the outer vortices region (i.e., #C1 and #D1) for the side-by-side propeller. Thus, the interactional effect concerning vorticity level could be affected by the higher level of unsteadiness observed in this flow region. Moreover, the velocity profiles extracted towards the outer propeller wake approaches the freestream velocity value V outside the wake boundary of the upper propeller more rapidly, while the amplitude of the positive variation in the u velocity experienced through the lower propeller wake boundary remains almost the same.
For the higher advance ratio test case J = 0.8, the comparison of the freestream velocity component profiles extracted at tip vortex core locations, i.e., #A2 and #B2, shows negligible effects for the nearby propeller aerodynamic interaction. Indeed, the profiles extracted for the side-by-side propeller configuration through the vortex core resemble both the peak-to-peak velocity values and slopes of the curves observed for the single propeller test case (see Figure 13a,b). This behavior is consistent with the similar vorticity magnitude observed in Figure 8c,d for the single and side-by-side propeller configurations. Additionally, in this case, the error bars for the side-by-side propellers are slightly higher among the vortex region with respect to a single propeller, confirming a higher unsteadiness level for the interaction. Nevertheless, the main finding concerning negligibility of the interactional effects for the fast cruise speed should not be affected. Moreover, for both tip vortices #A2 and #B2, the velocity profiles rapidly approach the freestream velocity value V in the flow field region between the side-by-side propeller wake boundaries, while as previously anticipated, the positive variation in the u velocity experienced by the lower propeller wake boundary has a lower amplitude with respect to the test case at a lower advance ratio. Additionally, for the higher advance ratio, an increase in the velocity standard deviation is observed for the lower propeller wake boundary.
The comparison of vertical velocity component v contours shown in Figure 10c,d and Figure 11c,d clearly indicates that, for both advance ratios tested, the side-by-side aerodynamic interaction provides negligible effects on this variable. Indeed, no effective variations in the vertical velocity component v can be observed inside the upper propeller wake boundary, while a slight positive variation in this velocity component is appreciable for J = 0.4 in the lowest part of the PIV investigation area, locally related to the lower propeller wake boundary region (see Figure 10d). Thus, a quantitative comparison of the v velocity profiles at tip vortex cores locations is not presented for the sake of consistency.
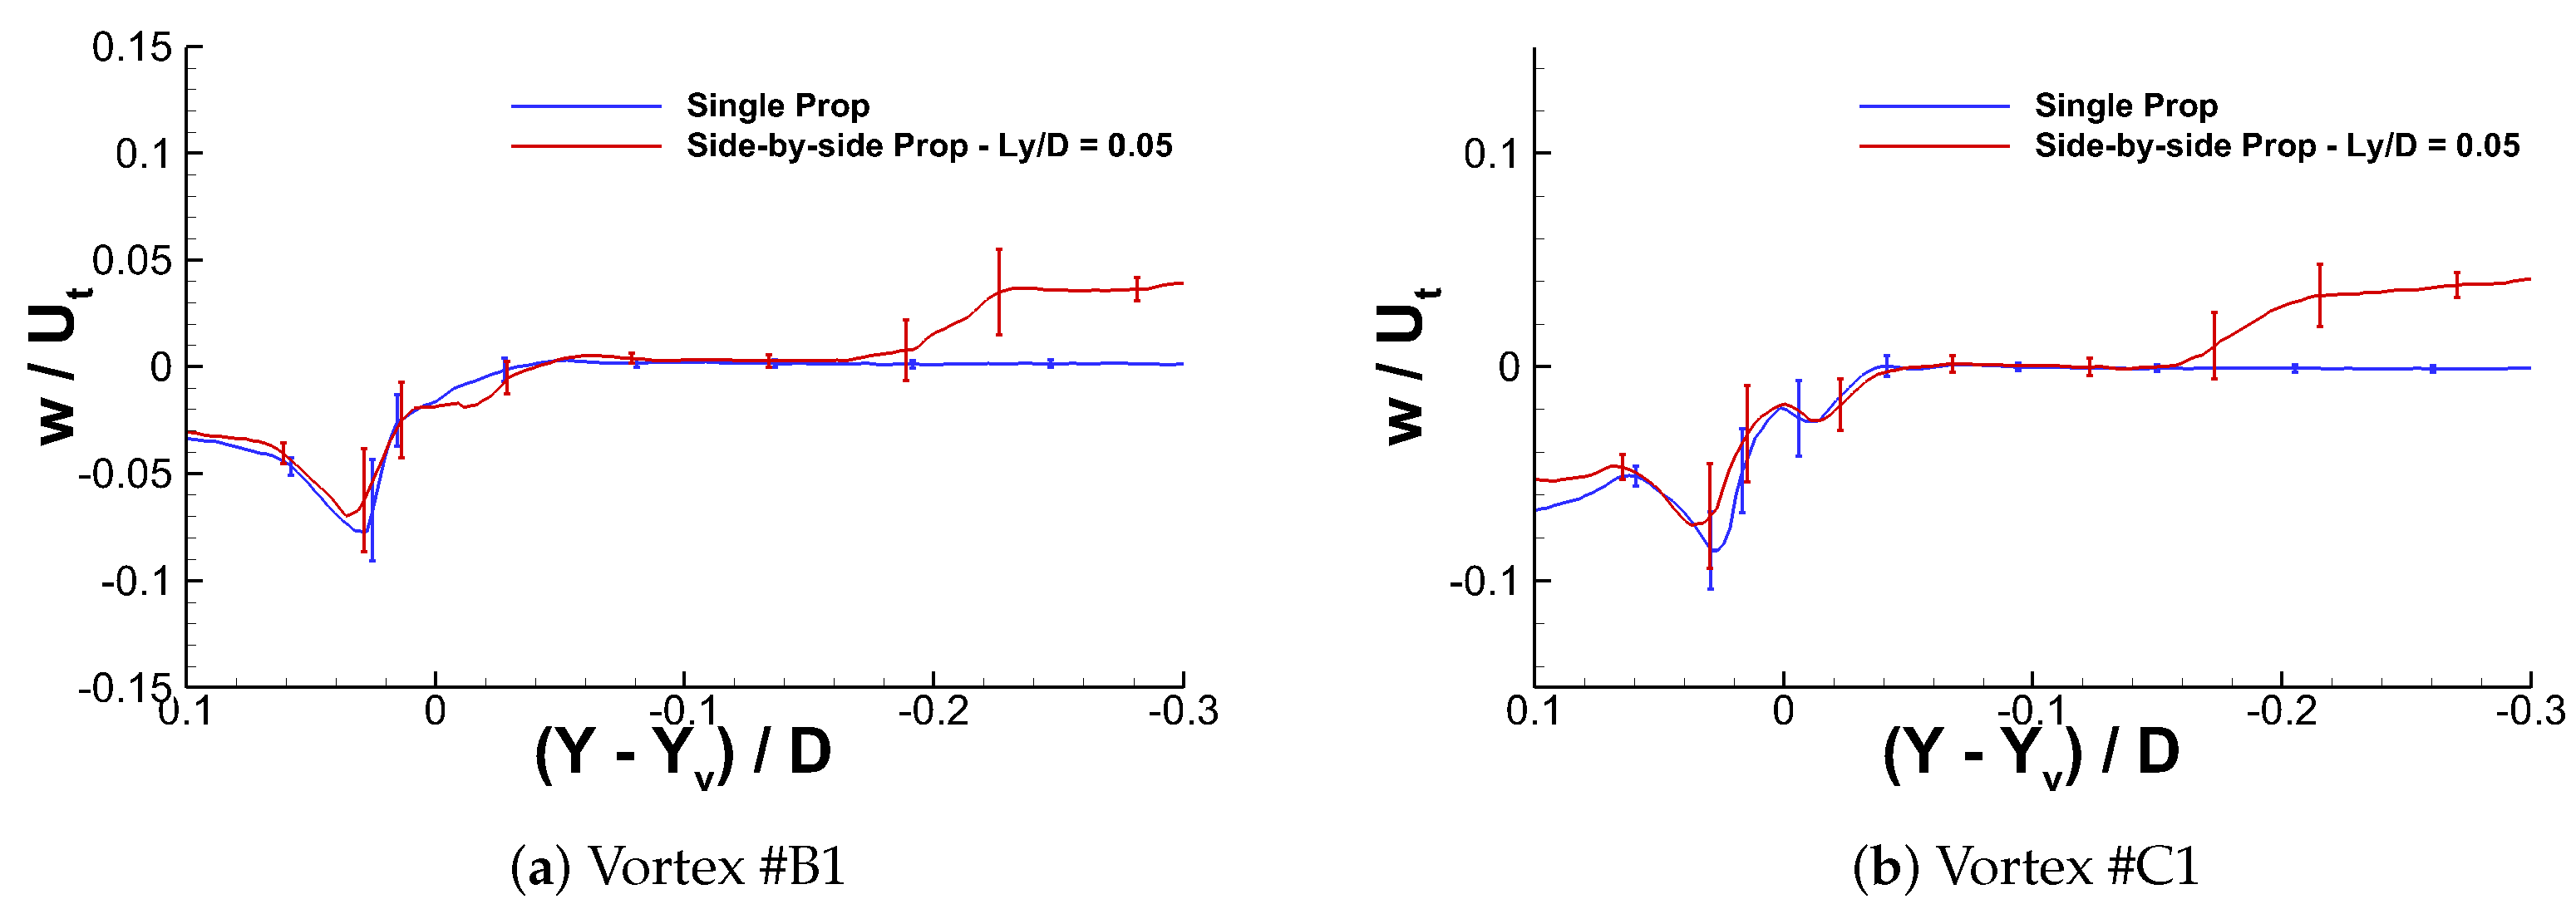
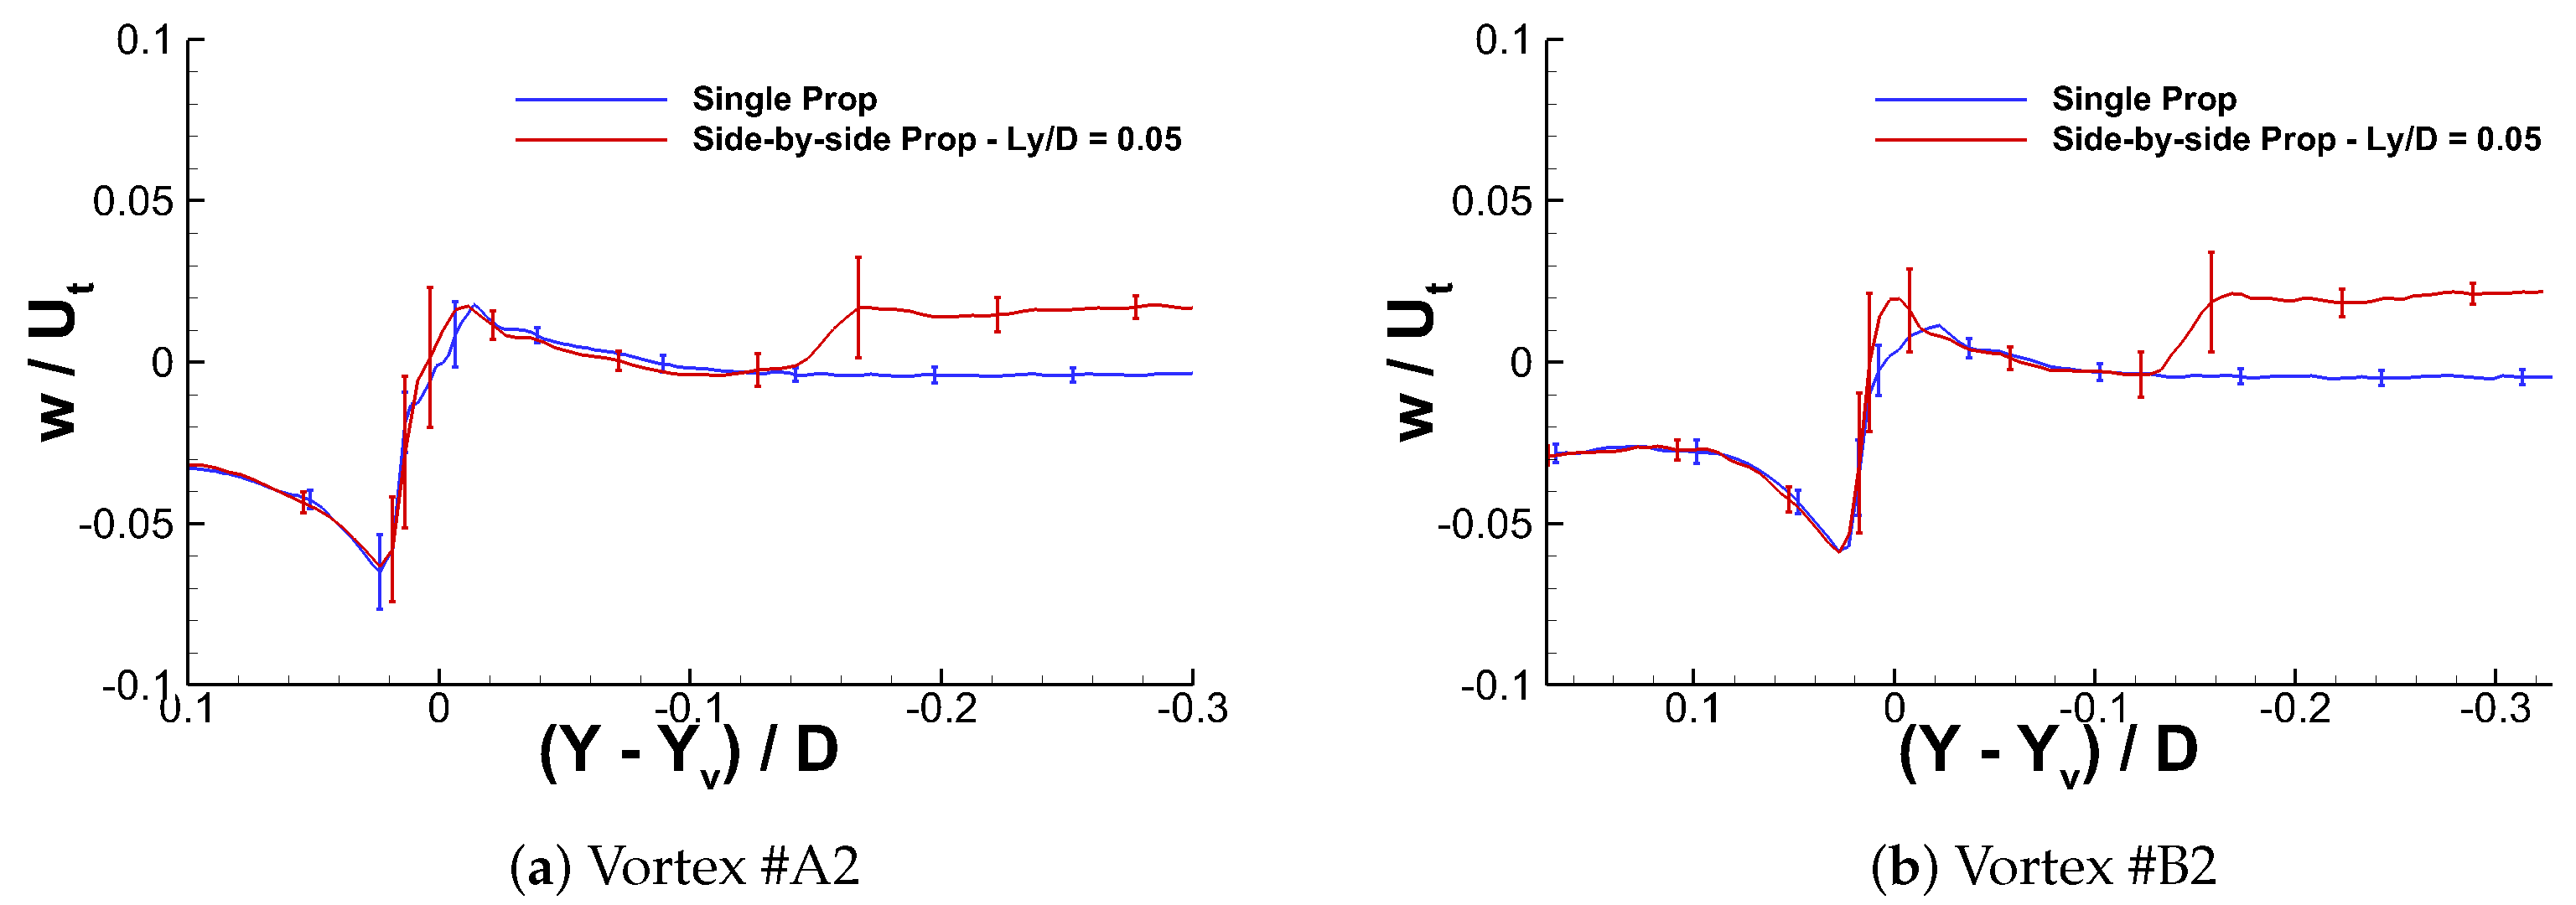
On the other hand, the comparison of the out-of-plane velocity component w contours presented in Figure 10e,f and Figure 11e,f, clearly shows, for both advance ratios tested, a region with remarkable positive w velocity in the lower propeller wake boundary related to the swirl provided by propeller blade rotations. In particular, a higher positive value of w is observed in this flow region for the lower advance ratio tested. Moreover, for J = 0.4, a more pronounced effect on the out-of-plane velocity can be observed on the upper propeller tip vortices due to the nearby lower propeller rotation (see Figure 10f). In order to achieve a quantitative evaluation on the side-by-side aerodynamic interaction on the out-of-plane velocity component, Figure 14 and Figure 15 show a comparison of the w velocity component profiles extracted in correspondence with the tip vortex core locations ( X v , Y v ) for both advance ratios tested. In particular, for J = 0.4, the velocity profiles extracted for the two intermediate tip vortices only, i.e., #B1 and #C1, are presented, as analogous findings can be deduced from the analysis of the outer tip vortices captured by the PIV investigation area.
For the lower advance ratio test case J = 0.4, a comparison of the out-of-plane component velocity profiles shows that the aerodynamic interaction of the nearby propeller produces a reduction in the negative w velocity peak value with respect to the single propeller case in the upper flow region of both the #B1 and #C1 vortices (see Figure 14a,b). An opposite effect is observed in the lower flow region of vortex #B1, while the flow region the between side-by-side propeller wake boundaries is characterised by an almost null out-of-plane velocity. The standard deviations of the out-of-plane velocity assume almost the same values throughout the vortex region, thus slightly affecting the main findings concerning side-by-side interactional effects.
For the higher advance ratio test case J = 0.8, the w velocity profiles for the upper propeller tip vortex core is quite similar between the side-by-side and single propeller configurations. A slight increase in the positive peak of the w velocity is observed for vortex #B2 due to a nearby propeller interaction (see Figure 15b). Analogous to what was observed for the free-stream velocity profile comparison showing higher unsteadiness among the vortex regions for the higher advance ratio, the error bars for the side-by-side propellers are slightly higher with respect to a single propeller, thus indicating that the small effects observed for the out-of-plane velocity profiles due to the interaction should be negligible. Moreover, also for the out-of-plane velocity component, the positive variation experienced by lower propeller wake boundary is lower at J = 0.8 with respect to the test case at a lower advance ratio.

4. Conclusions

A wind tunnel test campaign was performed to investigate the flow physics of the aerodynamic interaction between side-by-side propeller configurations. In particular, the experimental activity involving the use of stereoscopic PIV surveys provided novel insights about the interactional effects on propellers wake while cruising, filling the gap in the literature concerning a flow field investigation for this flight condition.
The analysis of stereo PIV results indicated that, even if the two side-by-side propellers are at very low separation distance, the interactional effects in cruise flight condition on propeller wake is quite limited compared with a single propeller test case. Nevertheless, the PIV surveys highlighted detailed differences between the interacting flow field for two different advance ratios reproducing a moderate and a fast cruise flight speed typical of eVTOL aircrafts. In particular, comparisons between flow fields measurements highlighted that, at low advance ratio, a nearby propeller interaction altered the tip vortices trajectory, avoiding the natural contraction of a propeller wake. This effect was similar, even if less pronounced, to what was found in the literature for side-by-side propellers in hover mode with the same separation distance. On the other hand, this downward dragging effect on propeller wake became negligible at a high advance ratio, where due to the fast free-stream velocity, the wake boundary of the side-by-side propellers remains unaltered with respect to the single propeller configuration. Moreover, at lower advance ratios, in addition to tip vortex trajectory alteration, a nearby propeller interaction provides a slight decrease in the vorticity level. Indeed, the tip vortices become more diffused with respect to the single propeller configuration, particularly in the outer region of the wake, as also confirmed by the quantitative analysis of the velocity profiles extracted at tip vortex core locations. A negligible effect of the aerodynamic interaction at the higher advance ratio tested was confirmed by the analogous vortex topology observed for this flight condition with and without a nearby rotating propeller.
Consequently, these experimental results confirmed the negligible effects observed by recent literature on the performance of side-by-side propellers and do not indicate particular drawbacks on the use of distributed electric propulsion configurations characterised by very low separation distances. Nevertheless, the differences between the flow features observed for lower and higher advance ratios as well as compared with the results in the literature for the hover condition highlighted different possible aeroacoustic issues that could arise in the different flight conditions characterising an eVTOL aircraft mission. The study of acoustic implications of side-by-side propellers in cruise mode represents a novel and interesting future work in this research field to be performed both with numerical and experimental activities. In particular, a future improvement in the present test set-up including the capability to synchronise the propeller models would be suitable in performing acoustic measurements aimed at evaluating the effects of phase lag between propellers blades on acoustic footprint.
Moreover, the experimental database produced by this study, providing results with a high level of detail, can be considered an important benchmark for the validation of numerical tools with increasing levels of fidelity. Indeed, the recent increasing interest provided by the rotorcraft research community on the development of mid-fidelity aerodynamic solvers for the preliminary design of innovative VTOL vehicles necessitates a thorough comparison of simulation outcomes against the robust experimental flow field data obtained over test cases representative of the key features of these novel vehicle architectures characterised by multi-propellers aerodynamic interactions.

Funding

This research received no external funding.

Institutional Review Board Statement

Not applicable.

Informed Consent Statement

Not applicable.

Data Availability Statement

Not applicable.

Acknowledgments

The author acknowledges Davide Algarotti, Donato Grassi, and Luca Riccobene for their technical support during the wind tunnel campaign.

Conflicts of Interest

The author declares no conflict of interest.

Abbreviations

The following nomenclature and abbreviations are used in this manuscript:
CFDComputational Fluid Dynamics
Dpropeller diameter (m)
eVTOLelectrical Vertical Take Off and Landing aircraft
Jadvance ratio = V / ( n D )
L y lateral blade tips distance between side-by-side propellers (m)
M t tip Mach number
nrotation rate (1/s)
PIVParticle Image Velocimetry
Rpropeller blade radius (m)
R e D Reynolds number based on propeller diameter
ufreestream velocity component (m/s)
vvertical velocity component (m/s)
wout-of-plane velocity component (m/s)
U t blade tip velocity (m/s)
UAMUrban Air Mobility
VPMVortex Particle Method
V wind tunnel freestream velocity (m/s)
X Y Z propeller reference system
( X v , Y v )in-plane coordinate of tip vortices core
ψ blade azimuthal angle (deg)
ρ air density (kg/m 3 )
θ blade pitch angle at 75% of the rotor radius (deg)
| ω | vorticity magnitude (1/s)

References

  1. Polaczyk, N.; Trombino, E.; Wei, P.; Mitici, M. A Review of Current Technology and Research in Urban On-Demand Air Mobility Applications. In Proceedings of the Vertical Flight Society’s 6th Annual Electric VTOL Symposium, Mesa, AZ, USA, 29–31 January 2019. [Google Scholar]
  2. Droandi, G.; Syal, M.; Bower, G. Tiltwing Multi-Rotor Aerodynamic Modeling in Hover, Transition and Cruise Flight Conditions. In Proceedings of the 74th Annual Forum, Phoenix, AZ, USA, 14–17 May 2018. [Google Scholar]
  3. Harris, F. Technical Note: Twin Rotor Hover Performance. J. Am. Helicopter Soc. 1999, 44, 34–37. [Google Scholar] [CrossRef]
  4. Ramasamy, M. Hover Performance Measurements Toward Understanding Aerodynamic Interference in Coaxial, Tandem, and Tilt Rotors. J. Am. Helicopter Soc. 2015, 60, 1–17. [Google Scholar] [CrossRef]
  5. Zhou, W.; Ning, Z.; Li, H.; Hu, H. An Experimental Investigation on Rotor-to-Rotor Interactions of Small UAV Propellers. In Proceedings of the 35th AIAA Applied Aerodynamics Conference, Denver, CO, USA, 5–9 June 2017. [Google Scholar]
  6. Shukla, D.; Komerath, N. Multirotor Drone Aerodynamic Interaction Investigation. Drones 2018, 2, 43. [Google Scholar] [CrossRef] [Green Version]
  7. Stokkermans, T.; Usai, D.; Sinnige, T.; Veldhuis, L.L. Aerodynamic Interaction Effects between Propellers in Typical eVTOL Vehicle Configurations. J. Aircr. 2021, 58, 1–19. [Google Scholar] [CrossRef]
  8. Yin, J.; Ahmed, S. Helicopter Main-Rotor/Tail-Rotor Interaction. J. Am. Helicopter Soc. 2000, 4, 293–302. [Google Scholar] [CrossRef]
  9. Tugnoli, M.; Montagnani, D.; Syal, M.; Droandi, G.; Zanotti, A. Mid-fidelity approach to aerodynamic simulations of unconventional VTOL aircraft configurations. Aerosp. Sci. Technol. 2021, 115, 106804. [Google Scholar] [CrossRef]
  10. Wentrup, M.; Yin, J.; Kunze, P.; Streit, T.; Wendisch, J.; Schwarz, T.; Pinacho, J.; Kicker, K.; Fukari, R. An overview of DLR compound rotorcraft aerodynamics and aeroacoustics activities within the CleanSky2 NACOR Project. In Proceedings of the 74th AHS Annual Forum & Technology Display, Phoenix, AZ, USA, 14–17 May 2018. [Google Scholar]
  11. Tan, J.; Zhou, T.; Sun, J.; Barakos, G. Numerical investigation of the aerodynamic interaction between a tiltrotor and a tandem rotor during shipboard operations. Aerosp. Sci. Technol. 2019, 87, 62–72. [Google Scholar] [CrossRef] [Green Version]
  12. Cottet, G.H.; Koumoutsakos, P.D.; Petros, D. Vortex Methods: Theory and Practice; Cambridge University Press: Cambridge, UK, 2000. [Google Scholar]
  13. Winckelmans, G.S. Topics in Vortex Methods for the Computation of Three-and Two-Dimensional Incompressible Unsteady Flows. Ph.D. Thesis, California Institute of Technology, Pasadena, CA, USA, 1989. [Google Scholar]
  14. Alvarez, E.; Ning, A. Modeling Multirotor Aerodynamic Interactions Through the Vortex Particle Method. In Proceedings of the 54th AIAA Aviation Forum, Dallas, TX, USA, 17–21 June 2019. [Google Scholar]
  15. Alvarez, E.; Ning, A. High-Fidelity Modeling of Multirotor Aerodynamic Interactions for Aircraft Design. AIAA J. 2020, 58, 4385–4400. [Google Scholar] [CrossRef]
  16. Raffel, M.; Willert, C.; Wereley, S.; Kompenhans, J. Particle Image Velocimetry—A Practical Guide; Springer: Berlin, Germany, 2007. [Google Scholar]
  17. Zanotti, A.; Ermacora, M.; Campanardi, G.; Gibertini, G. Stereo particle image velocimetry measurements of perpendicular blade—Vortex interaction over an oscillating airfoil. Exp. Fluids 2014, 55, 1–13. [Google Scholar] [CrossRef]
  18. De Gregorio, F.; Pengel, K.; Kindler, K. A comprehensive PIV measurement campaign on a fully equipped helicopter model. Exp. Fluids 2012, 53, 37–49. [Google Scholar] [CrossRef]
  19. Gibertini, G.; Mencarelli, A.; Zanotti, A. Oscillating Aerofoil and Perpendicular Vortex Interaction. Proc. Inst. Mech. Eng. Part G J. Aerosp. Eng. 2014, 228, 846–858. [Google Scholar] [CrossRef]
Figure 1. Examples of side-by-side propeller configurations in an eVTOL aircraft (pictures from https://evtol.news/aircraft, accessed on 28 August 2021).
Aerospace 08 00239 g001
Figure 2. Layout of the propeller model.
Aerospace 08 00239 g002
Figure 3. (a) Twist, dihedral angle, and (b) chord distributions of the Varioprop 12C propeller blade along the spanwise radial coordinate.
Aerospace 08 00239 g003
Figure 4. Layout of the side-by-side propeller models test rig at S. De Ponte wind tunnel.
Aerospace 08 00239 g004
Figure 5. Stereo PIV set-up for measurements of side-by-side propellers interaction at the S. De Ponte wind tunnel. The area of investigation is depicted by red the rectangular zone.
Aerospace 08 00239 g005
Figure 6. Sketch of the side-by-side propeller configuration including the reference system (left) and the blade azimuthal angle definition (right).
Aerospace 08 00239 g006
Figure 7. Comparison of the ensemble-averaged non-dimensional free-stream velocity component contours at R e D = 1.96 × 10 6 and M t = 0.325 .
Aerospace 08 00239 g007
Figure 8. Comparison of the phase-averaged non-dimensional vorticity magnitude ω D / U t contours at blade azimuthal angle ψ = 90 , R e D = 1.96 × 10 6 , M t = 0.325 .
Aerospace 08 00239 g008
Figure 9. Comparison of the tip vortex core displacements at advance ratios J = 0.4 and J = 0.8 between a single propeller and an upper side-by-side propeller at L y / D = 0.05, R e D = 1.96 × 10 6 , and M t = 0.325 .
Aerospace 08 00239 g009
Figure 10. Comparison of the phase-averaged non-dimensional velocity component contours at blade azimuthal angle ψ = 90 for advance ratio J = 0.4, R e D = 1.96 × 10 6 , and M t = 0.325 .
Aerospace 08 00239 g010
Figure 11. Comparison of the phase-averaged non-dimensional velocity component contours at blade azimuthal angle ψ = 90 for advance ratio J = 0.8, R e D = 1.96 × 10 6 , and M t = 0.325 .
Aerospace 08 00239 g011
Figure 12. Comparison of the phase-averaged non-dimensional freestream velocity component profiles u extracted in correspondence with the tip vortex core locations ( X v , Y v ) for blade azimuthal angle ψ = 90 and advance ratio J = 0.4, R e D = 1.96 × 10 6 , and M t = 0.325 .
Aerospace 08 00239 g012
Figure 13. Comparison of the phase-averaged non-dimensional freestream velocity component profiles u extracted in correspondence with the tip vortices core locations ( X v , Y v ) for blade azimuthal angle ψ = 90 and advance ratio J = 0.8, R e D = 1.96 × 10 6 , nad M t = 0.325 .
Aerospace 08 00239 g013
Figure 14. Comparison of the phase-averaged non-dimensional out-of-plane velocity component profiles w extracted in correspondence with the tip vortices core locations ( X v , Y v ) for blade azimuthal angle ψ = 90 for advance ratio J = 0.4, R e D = 1.96 × 10 6 , and M t = 0.325 .
Aerospace 08 00239 g014
Figure 15. Comparison of the phase-averaged non-dimensional out-of-plane velocity component profiles w extracted in correspondence with the tip vortices core locations ( X v , Y v ) for blade azimuthal angle ψ = 90 for advance ratio J = 0.8, R e D = 1.96 × 10 6 , and M t = 0.325 .
Aerospace 08 00239 g015
Table 1. Stereo PIV measurement test matrix of the wind tunnel campaign.
R P M J L y /D ψ [deg]
Single Propeller70500.4, 0.8- 0 , 30 , 60 , 90
Side-by-side Propellers70500.4, 0.80.1 0 , 30 , 60 , 90
Publisher’s Note: MDPI stays neutral with regard to jurisdictional claims in published maps and institutional affiliations.