Article

Velocity Obstacle Based Conflict Avoidance in Urban Environment with Variable Speed Limit

Control and Simulation, Faculty of Aerospace Engineering, Delft University of Technology, Kluyverweg 1, 2629 HS Delft, The Netherlands
*
Author to whom correspondence should be addressed.
Aerospace 2021, 8(4), 93; https://doi.org/10.3390/aerospace8040093
Submission received: 4 February 2021 / Revised: 23 March 2021 / Accepted: 29 March 2021 / Published: 1 April 2021
(This article belongs to the Special Issue Application of Data Science to Aviation)

Abstract

:
Current investigations into urban aerial mobility, as well as the continuing growth of global air transportation, have renewed interest in conflict detection and resolution (CD&R) methods. The use of drones for applications such as package delivery, would result in traffic densities that are orders of magnitude higher than those currently observed in manned aviation. Such densities do not only make automated conflict detection and resolution a necessity, but will also force a re-evaluation of aspects such as coordination vs. priority, or state vs. intent. This paper looks into enabling a safe introduction of drones into urban airspace by setting travelling rules in the operating airspace which benefit tactical conflict resolution. First, conflicts resulting from changes of direction are added to conflict resolution with intent trajectory propagation. Second, the likelihood of aircraft with opposing headings meeting in conflict is reduced by separating traffic into different layers per heading–altitude rules. Guidelines are set in place to make sure aircraft respect the heading ranges allowed at every crossed layer. Finally, we use a reinforcement learning agent to implement variable speed limits towards creating a more homogeneous traffic situation between cruising and climbing/descending aircraft. The effects of all of these variables were tested through fast-time simulations on an open source airspace simulation platform. Results showed that we were able to improve the operational safety of several scenarios.

1. Introduction

If current predictions become reality, the aviation domain must prepare for the introduction of large numbers of mass-market drones. According to the European Drones Outlook Study [1], roughly 7 million consumer leisure drones are expected to be operating across Europe, and a fleet of 400,000 is expected to be used for commercial and government missions in 2050. Moreover, at least 150,000 are expected to operate in an urban environment for multiple delivery purposes. More recently, even more urban unmanned aerial system (UAS) applications have been explored, specifically the inspection and monitoring of several urban infrastructures [2,3]. Safety automation within unmanned aviation is a priority, as drones must be capable of conflict detection and resolution (CD&R) without human intervention. Both the Federal Aviation Administration (FAA) and the International Civil Aviation Organization (ICAO) have ruled that an UAS must have “sense and avoid” capability in order to be allowed in the civil airspace [4,5]. Over the past three decades, conflict detection and resolution methods have already been widely explored for manned aviation. However, there are several aspects that set the currently considered urban applications apart from the concepts investigated in these previous studies. The most consequential difference with conventional aviation is the presence of constraints in an urban environment, such as obstacles and hyperlocal weather, which will bring additional considerations in the design of conflict detection and resolution logic.
While these differences set urban air traffic apart from conventional aviation, they provide several similarities to the operation of road traffic that make it relevant to investigate research for the prevention of the traffic congestion of road vehicles [6,7]. First, in many of the current urban airspace concepts, unmanned aviation is expected to follow existing road infrastructure. Additionally, the prevention of congestion is comparable to the prevention of “hotspots” of conflicts. Finally, collisions are reduced by guaranteeing at all times a safe distance between road vehicles, comparable to safekeeping the minimum separation distance in aviation. Nevertheless, directly applying these methods poses new challenges: drones are (mostly) non-stationary as opposed to road vehicles, where minimum separation is a bigger margin than normally employed with road vehicles. Additionally, we prefer not to employ prevention of traffic “hotspots” through path planning, which increases in complexity with the number of operating agents. As such, real-word scenario, with the expected number of UASs operating simultaneously [8], would result in a system slow to respond to changes, as well as with limited capacity [9]. Instead, we focus on setting rules directly into the operational environment to guarantee safety.
In the current study, we employed an urban environment where aircraft must go through pre-set “delivery points” simulating a delivery operation. Conflicts with static obstacles are immediately resolved by following a planned route around these obstacles. Conflict resolution (CR) is used to further prevent losses of minimum separation with dynamic obstacles. Normally, most conflict detection and resolution (CD&R) methods use heading changes as preferred by air traffic controllers. However, an urban environment requires a different approach to an unconstrained airspace. We favour a speed-based conflict resolution approach to guarantee that the borders of the surrounding urban infrastructure are always respected. Heading–altitude rules will be used to separate traffic into different layers, reducing the likelihood of aircraft meeting in conflict. Additionally, we add intent-information to conflict resolution. Multiple works [10,11,12,13] have used waypoint information to improve a single intruder’s trajectory prediction with favourable results. Given the high number of turns necessary when moving through an urban setting, studies on the use of intent are of interest. Naturally, sharing intent information in a real-case scenario requires a mechanism for data transfer between aircraft or intent inference through trajectory prediction [14]. Both are a challenging problem. This work will analyse whether the improvements in safety from adding intent information warrant its implementation. Finally, reinforcement learning is used to set variable speed limits (VSLs) in sections where altitude transitions are expected, towards creating a more homogeneous traffic situation during these transition phases.
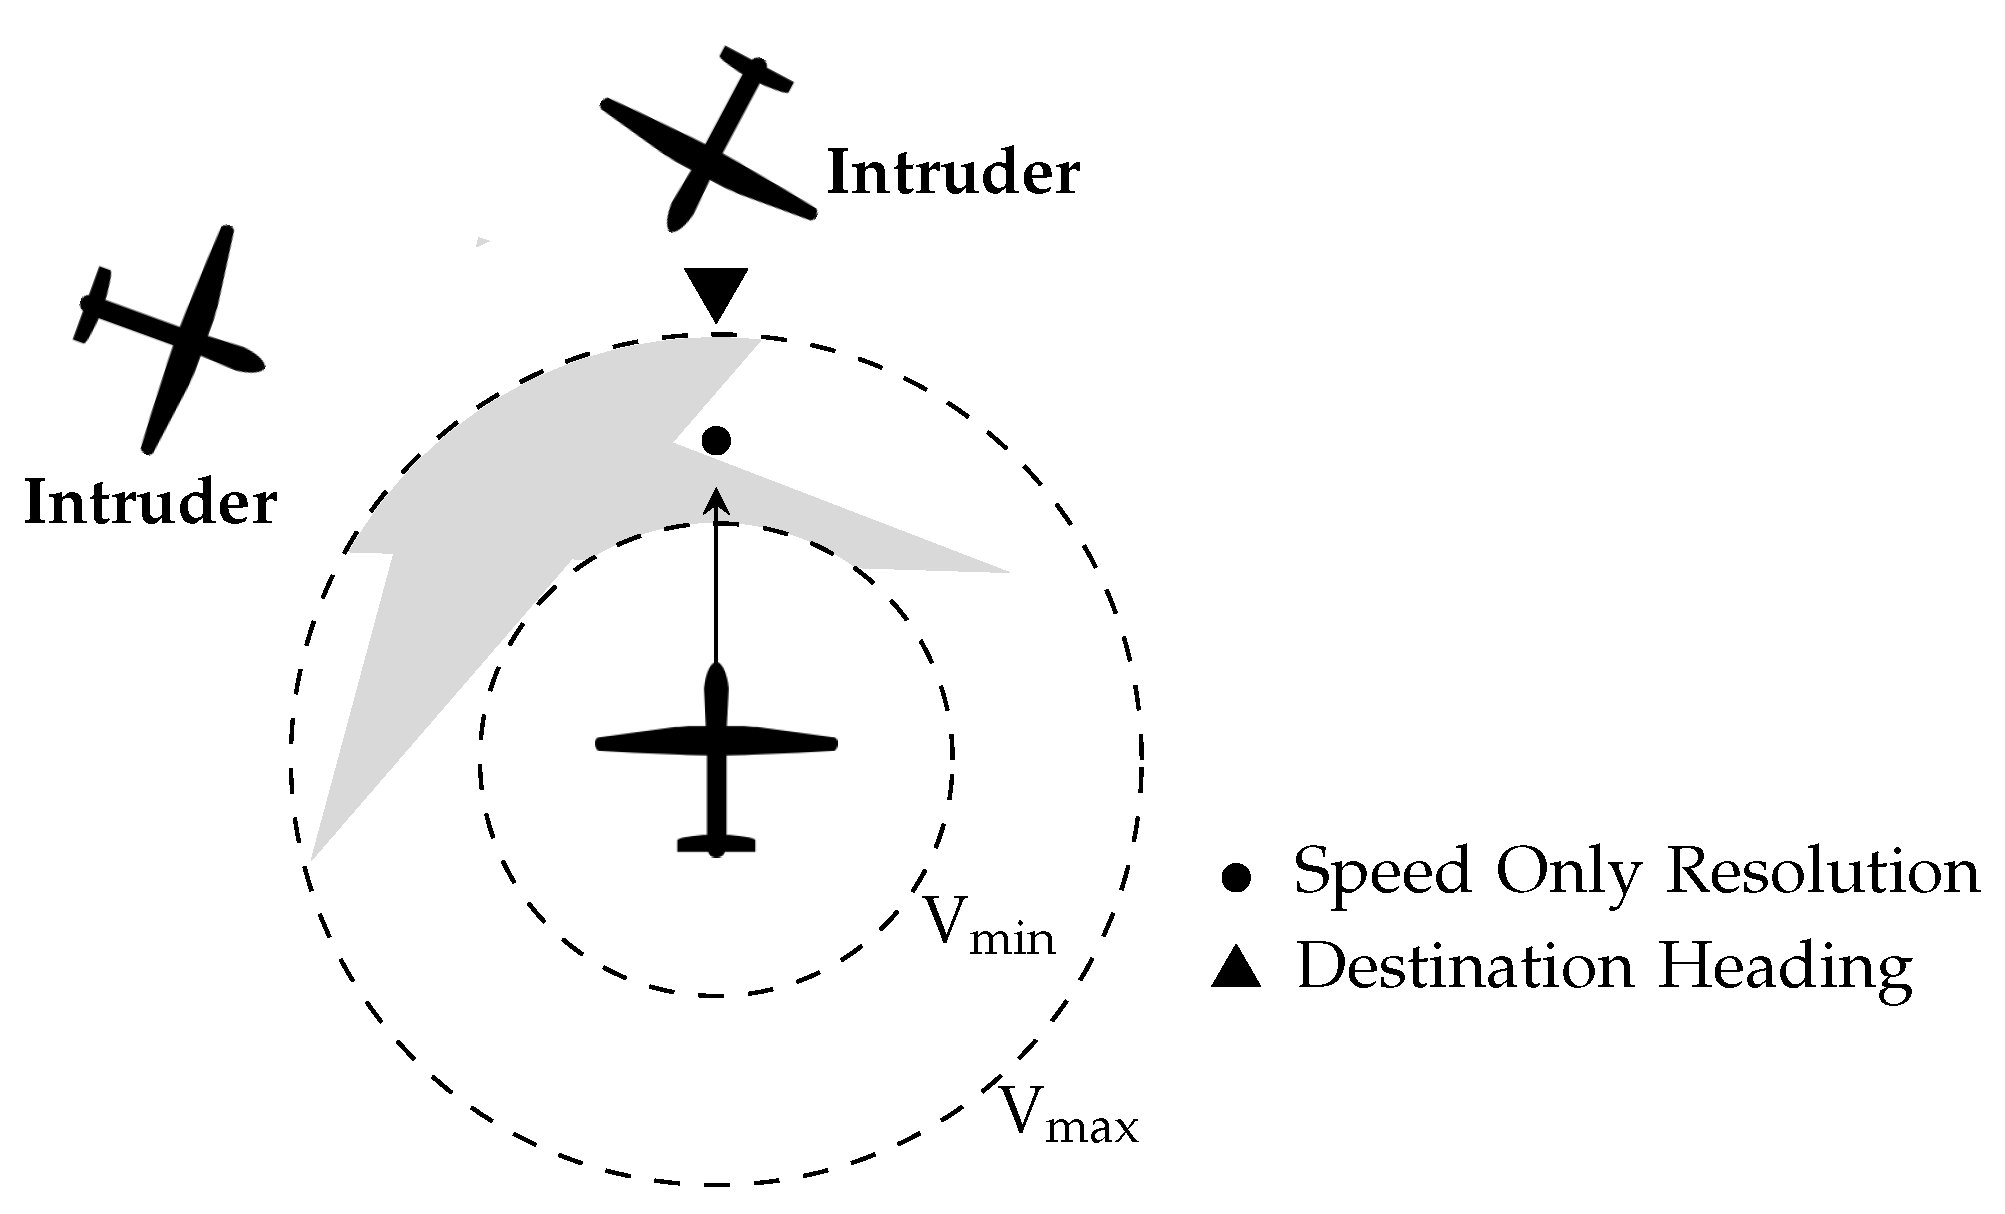
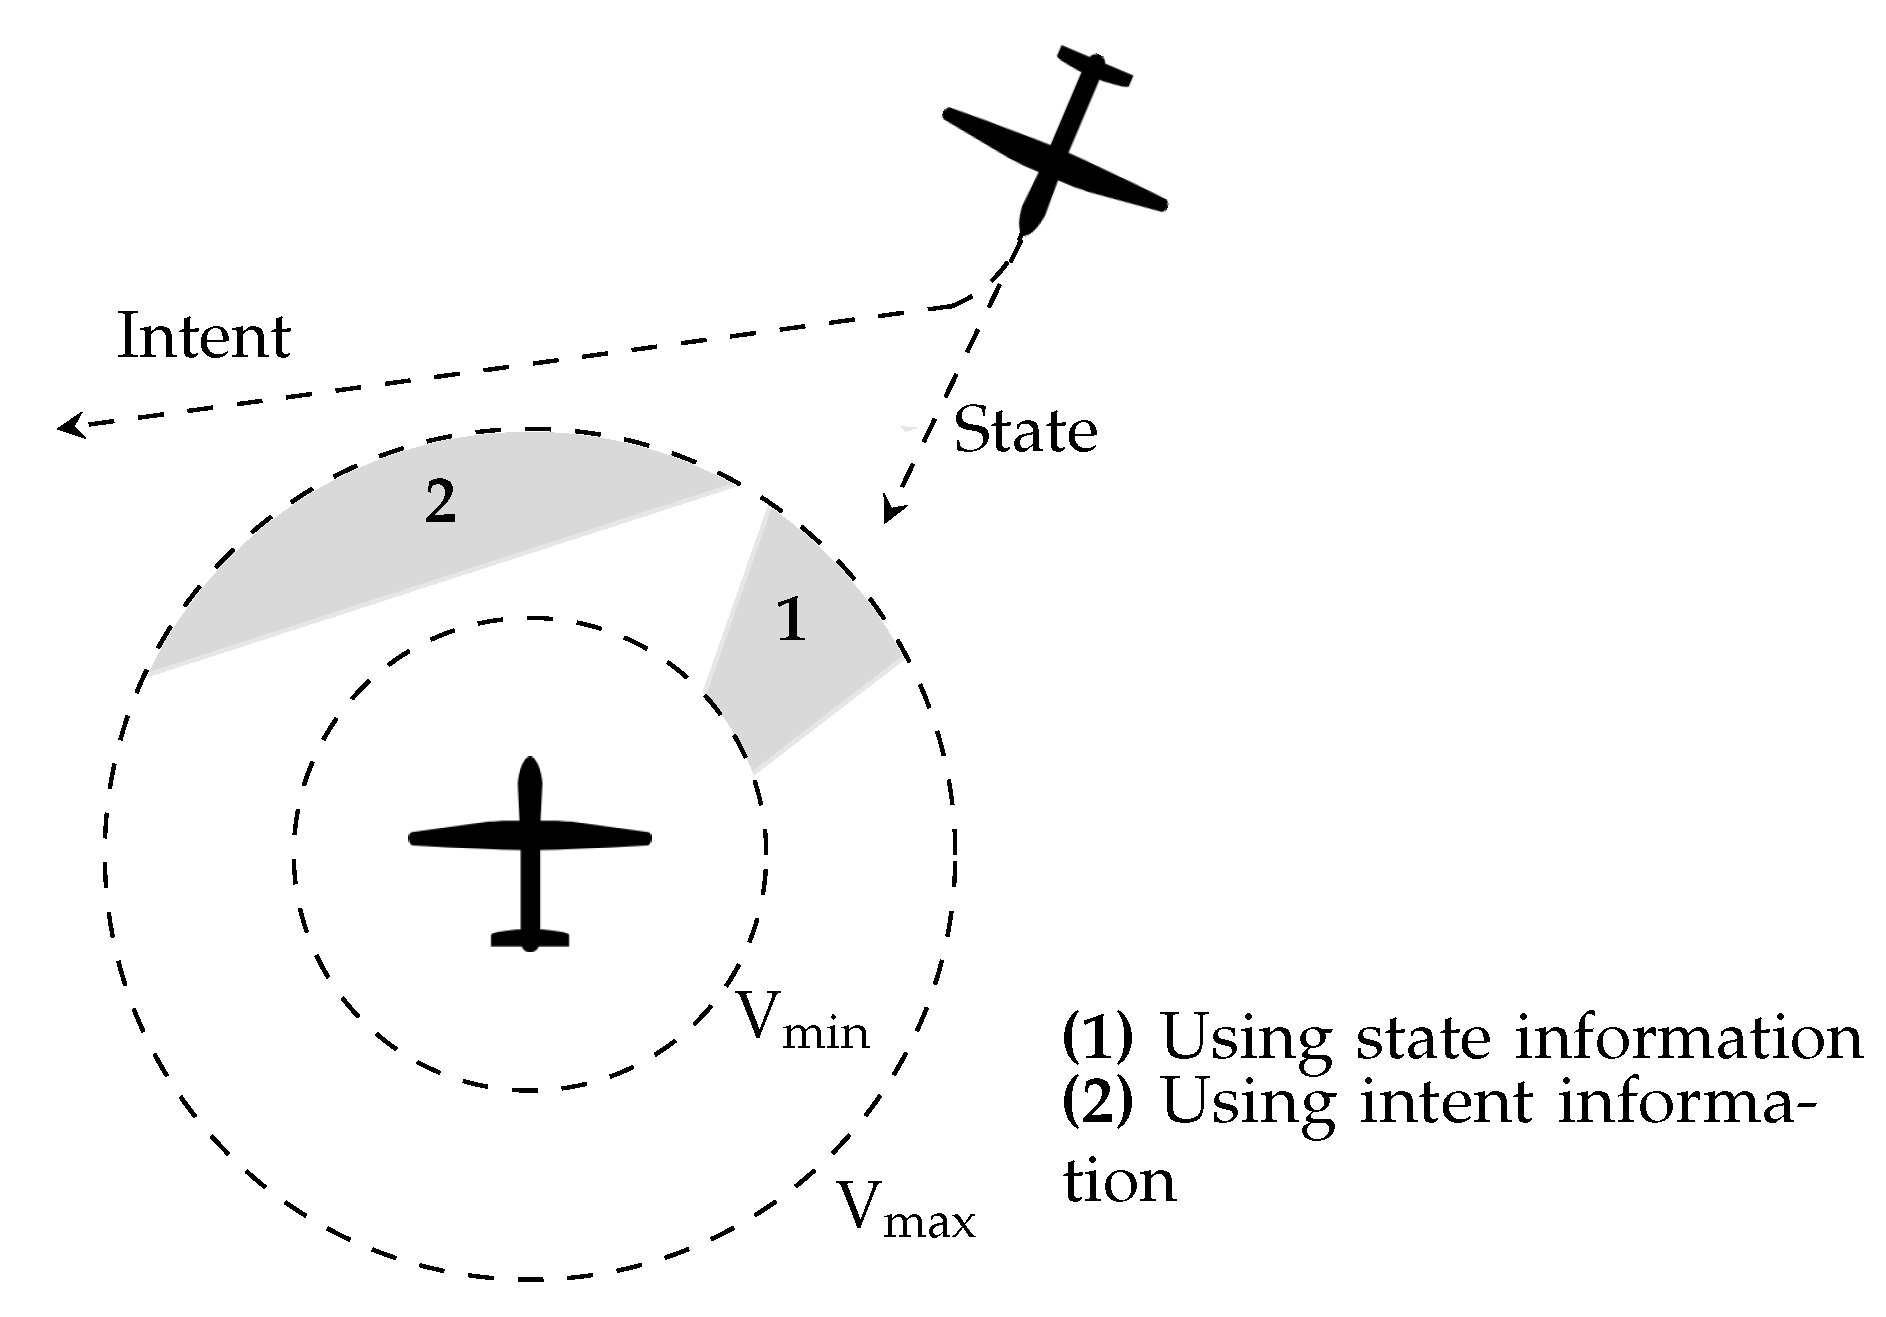
Section 2 defines the urban environment. Section 3 and Section 4 can be read interchangeably. The former describes how aircraft avoid conflicts by modifying their current speed. We use a velocity obstacle-based CR approach (called solution space diagram (SSD) in related work [15,16,17,18]), which has proven to be efficient in reducing the effect of resolution manoeuvres on flight efficiency while still guaranteeing minimal losses of separation (LoSs) [18]. Section 4 refers to VSL implementation. As shown in Figure 1, this sets an upper limit to the speeds aircraft may select from. The deep deterministic policy gradient (DDPG) reinforcement learning (RL) model [19], which has shown promising results in other studies [20], was used to determine the optimal variable speed limits. Section 5, Section 6, Section 7 and Section 8 describe the experimental independent variables, design, hypotheses, and results, respectively. Finally, Section 9 and Section 10 present discussions and the conclusion. This study employed the open source, multi-agent ATC simulation tool BlueSky [21]. The implementation code can be accessed online at [22]; the scenarios and result files are available at [23].

2. Urban Setting

An urban setting was simulated in this work using Open Street Map network data [24]. We used an excerpt from the San Francisco Area, with a total area of 1.708 NM2, as represented in Figure 2. In the dataset, roads and intersections are represented by nodes. Each road is defined per two adjacent nodes representing the edges of the road. With the intention of reducing complexity, each node was considered to have at most four connecting roads. Naturally, some nodes may have fewer, as only existing roads are used. Additionally, we assumed that each road only had one lane. Having more lanes would signify that the road would need to be large enough to guarantee proper separation between the multiple lanes. As we make no such assumptions or requirements from the urban setting, we defined each road as having only one lane of traffic.

2.1. Freedom of Movement

The exploration of an environment with static obstacles has gained new focus with the growth of unmanned aviation. Operations such as package delivery in an urban environment require collision avoidance with the surrounding urban infrastructure. The latter is non-trivial. Most of the existing research on tactical conflict detection and resolution is directed at manned aviation, as methods are used to detect other dynamic traffic when manned aircraft are flying at cruise altitude. It is not guaranteed that a model directed at dynamic obstacles can also (simultaneously) avoid static obstacles. First, while most of these CD&R models assume obstacles as a circle with a radius equal to the minimum separation distance, a static object can have different sizes and shapes. These may be much larger than other traffic and/or non-convex, requiring a route with multiple waypoints as a solution. Second, most models also assume some sort of coordination and non-zero speed.
The limited existing research on tactical conflict resolution with static obstacles is mostly based on defining the static obstacles as objects that the ownship must go around, as opposed to these limiting the area accessible to the ownship [25]. Recently, a new branch of research is resorting to integrating LIDAR technology into UASs in order to detect the distance to the closest obstacles [26,27]. However, such systems do not protect against static obstacles with non-uniform shapes. For example, an aircraft might follow the edge of a static obstacle until it finds itself in a dead-end, in case this edge ends in a closed space. We consider that, when the environment is known in advance, the most efficient way to resolve conflicts with static obstacles is to strictly follow a known safe route around all static obstacles. This work assumes that waypoints are set at the centre of the roads, from which aircraft do not deviate.

2.2. Turn Estimation

In an urban environment, the speed at which aircraft perform turns is limited by the turn radius, as collision with buildings needs to be prevented within the limited space available at intersections. In our experimental simulations, turns were assumed to have a fixed bank angle, ϕ n o m , of 25 . The same conservative value was used for all aircraft. Naturally, in a real-case scenario, differences in turn performance can be expected between rotors and fixed-wing aircraft. Rotors may be able to hover in a stationary position and provide (almost) vertical take-off and landing.
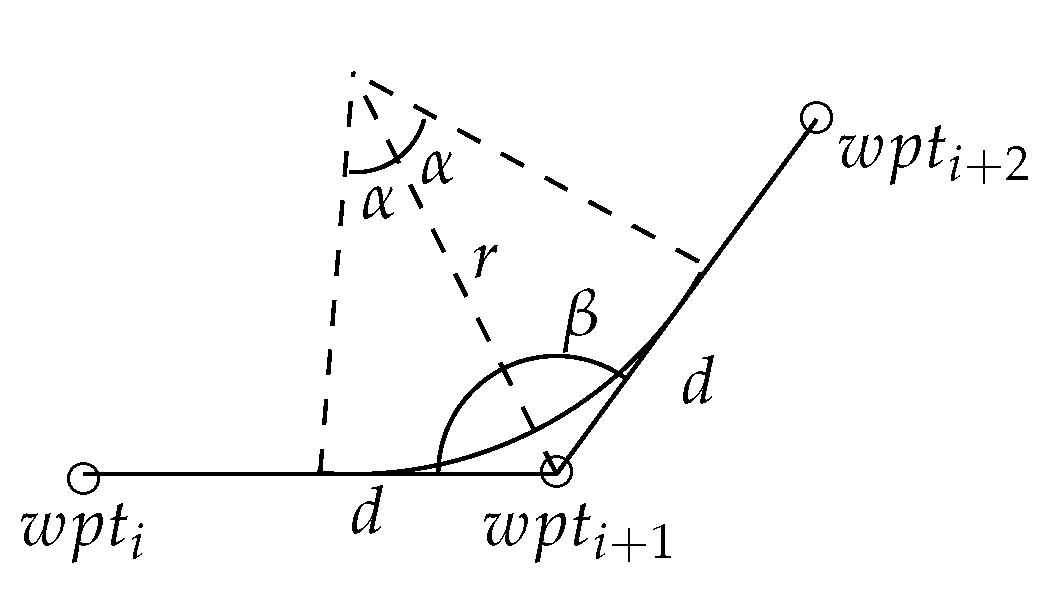
We assumed that, during turns, aircraft remain at the same flight level and have constant speed throughout. In Figure 3, the aircraft’s waypoints are identified. As the heading post- w a y p o i n t i + 1 , Ψ i + 1 , is different than the current heading, Ψ i , the aircraft initiates a turn assumed to start and end at a pre-determined distance, d, from w a y p o i n t i + 1 .
The radius of the turn, r, can be calculated by
r = V 2 g × tan ( ϕ n o m ) ,
where V represents the speed of the aircraft, and g the gravitational acceleration. Based on the geometry of Figure 3:
α = Δ Ψ 2 .
The distance from w a y p o i n t i + 1 at which the aircraft starts and ends the turn is thus given by
d = r × tan ( α ) .
The turn rate, Ψ ˙ , can be determined by
Ψ ˙ = g tan ( ϕ n o m ) V .

2.3. Speed Changes throughout the Route

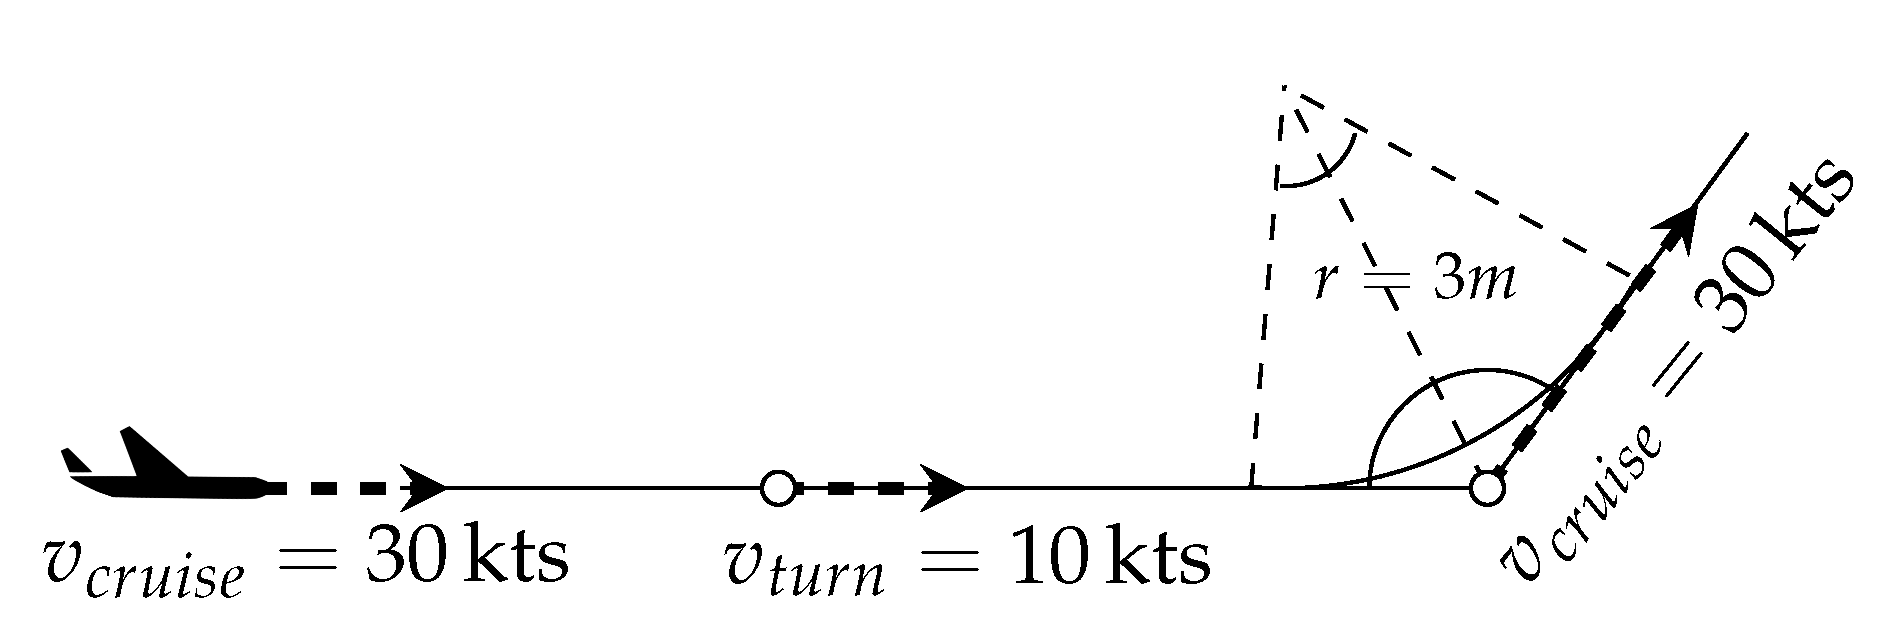
We assumed that aircraft prefer to adopt a high speed in order to reduce travel time and complete their delivery route as soon as possible. However, due to the limitation imposed upon the turn radius, aircraft will reduce their speed prior to a turn to conform to the confined space of the intersection. Figure 4 shows the assumed behaviour of aircraft during experimental simulations. When possible, aircraft will employ the maximum set cruise speed of 30 kts. Prior to a turn, aircraft will start decreasing their speed, in order to initiate the turn at 10 kts. With such low speed, it is guaranteed that the maximum turn radius of 3 m is respected. As soon as the turn is completed, the aircraft will again accelerate towards their desired cruising speed.
These speed variations result in a speed heterogeneity between aircraft, which is recognised as a causal factor for increased complexity in air traffic operations [28]. Part of the work performed herein is aimed at reducing relative speeds, which is expected to improve safety.

2.4. Heading–Altitude Rules

Head-on (or near-head-on) conflicts are practically impossible to resolve in a restricted airspace where aircraft cannot considerably alter their heading. The best way to prevent this situation is to separate aircraft into different layers in accordance with their current heading, creating a more homogeneous traffic situation in each layer. Similar concepts were employed in [29,30,31,32]; results showed that a vertical segmentation of airspace, by separating traffic with different travel directions into different flight levels, resulted in a lower rate of conflicts, and thus enabled higher capacity. Two factors contributed to this reduction in the conflict rate. First of all, by dividing the aircraft over separate layers of airspace, different groups of aircraft are created that remain separated from each other (segmentation effect). Second, within each layer, heading limitations enforce a degree of alignment between aircraft, thereby reducing the relative speed between aircraft cruising at the same altitude, which in turn reduces the likelihood of conflicts within a layer of airspace (alignment effect) [33].
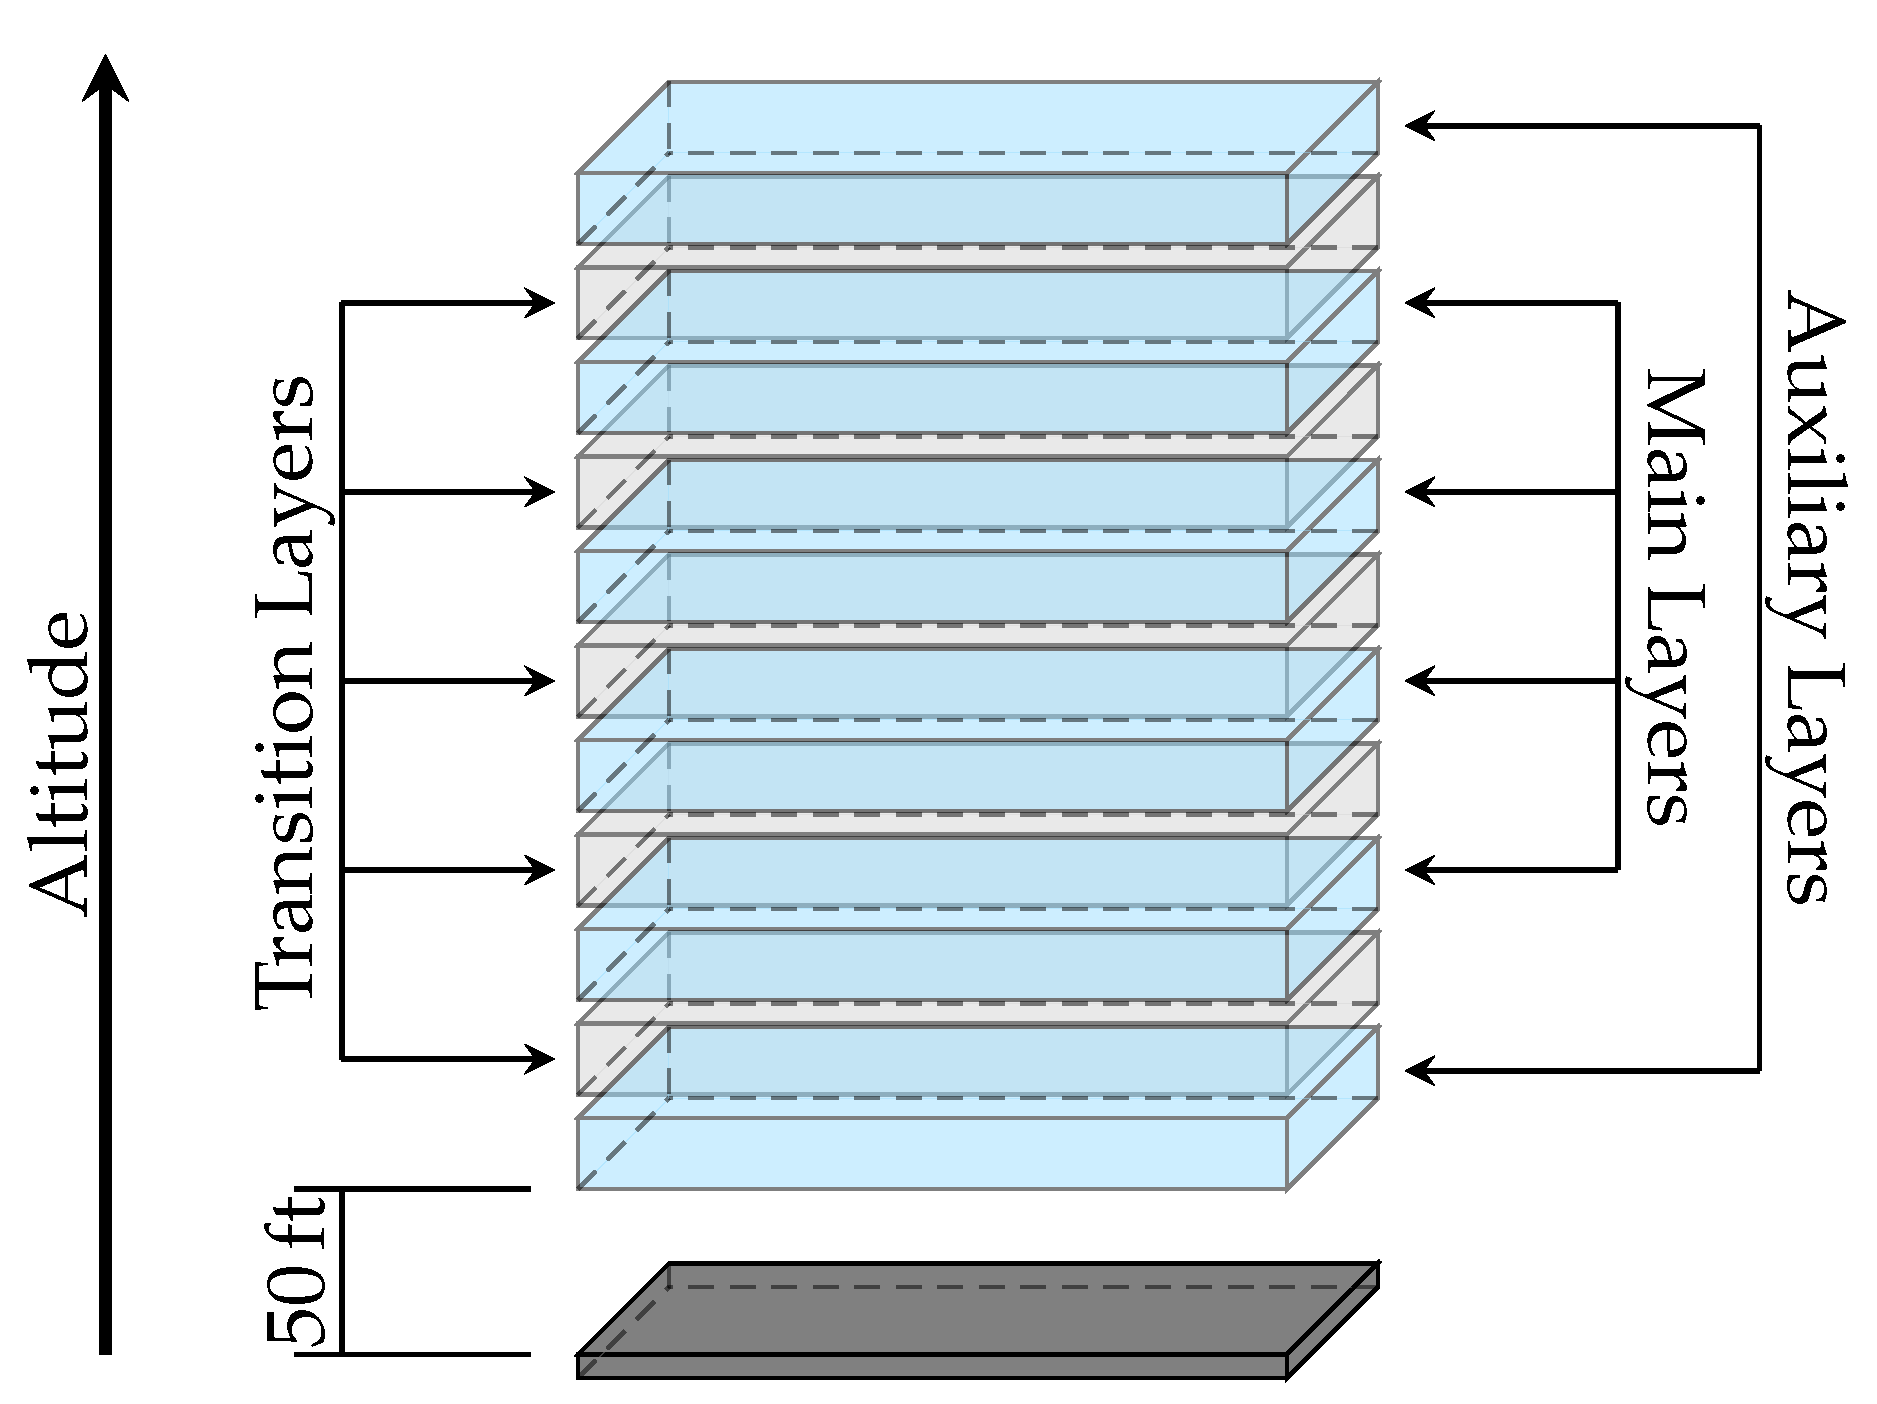
In this work, six altitude (traffic) layers were employed as per Table 1. Heading–altitude rules were applied, defining the headings permitted per altitude band. As aforementioned, each node was assumed to have a maximum of four connecting edges. On each of these edges, traffic was assumed to have (near) equal headings. Therefore, we started by adopting one vertical layer for each possible direction, creating the four main traffic layers. In addition, two auxiliary layers were employed to allow aircraft, travelling in a main layer, to cross into a perpendicular road in any direction just by climbing or descending to the next layer. Given the defined layers, a heading turn will result in a transition of a maximum of three layers (i.e., when climbing from the first to the fourth layer or descending from the sixth to the third layer).
To move to a different layer, aircraft climb or descend into the traffic lane of that layer. Previous works [29] suffer from a considerable number of conflicts between cruising and climbing/descending aircraft, and between pairs of climbing/descending aircraft, as climbing and descending aircraft are exempted from the heading–altitude rules, and can violate them to reach their cruising altitude or destination. This means that aircraft are free to directly climb/descend to the final layer without respecting the heading ranges allowed in the mid layers. In these cases, the safety benefits from vertical layer separation only apply to cruising aircraft, as there are no procedural mechanisms to separate climbing/descending aircraft from each other or from cruising aircraft [33]. In this study, we added to this work by implementing rules during the climbing/descending process. First, during climb/descent, aircraft need to adapt to the heading ranges allowed at each layer traversed. Second, aircraft continue to be restricted to a safe route through the surrounding urban infrastructure. Finally, we employed variable speed control aimed at improving speed homogeneity between cruising and climbing/descending aircraft.

Transition Layers

We employed transition layers to accommodate traffic slowing down before a turn. A transition layer was set between two traffic layers to be used only when transitioning between the latter. Aircraft perform the necessary heading turns within these transition layers, preventing conflicts resulting from heterogeneous speed situations caused by an aircraft decelerating in preparation for a turn. Naturally, conflicts can still occur in the transition layers. However, transition layers are expected to have a much smaller number of aircraft than traffic layers at any point in time, reducing the likelihood of aircraft meeting in conflict.
Figure 5 displays the different layers used in the experimental simulations. The traffic layers (in blue) were used for the cruising traffic; the transition layers (in grey) were only used for transitioning between traffic layers. Traffic and transition altitudes are set with a height of 30 ft. Note that there is an offset of 10 ft between the layers to prevent false conflicts.
Finally, turn mechanics are in place to enforce that aircraft perform the necessary climb/descent actions without crossing the borders of the surrounding urban infrastructure and/or violating the heading ranges allowed per traffic layer. Independently of the flight altitude, aircraft must respect the surrounding infrastructure as we make no assumptions regarding its height. As a result, this mechanism may be used independently of the maximum height of the urban architecture, the number of traffic layers, and/or the altitude of each layer.

3. Velocity Obstacle Based, Speed-Only Conflict Resolution

The biggest hindrance when ensuring minimum separation between aircraft in an urban environment is the limitation of movements caused by the limited available space. Most conflict prevention methods operate in the horizontal plane, and rely on turns to resolve conflicts. However, to guarantee safety in the presence of static obstacles (e.g., buildings, trees), movement within the horizontal plane is severely limited. In this work, we employed a speed-only conflict resolution method, guaranteeing that aircraft do not deviate from their safe pre-set route. Vertical conflict resolution is not used as the available airspace, which is segmented into different flight levels reserved for different flight directions. For safety of operation, aircraft must remain at their assigned flight level. Although variations on this vertical layer assignment are possible, since these are considered out of scope for the current study.

3.1. Velocity Obstacle (VO) Theory

The conflict resolution model used in this work was based on the velocity obstacle theory [34,35]. In Figure 6, a situation in which the ownship (A) is in conflict with an intruder (B) is represented. A so-called collision cone (CC) can be defined by the lines tangential to the intruder’s protected zone (PZ). A and B are in conflict when the relative velocity between these two aircraft lies inside the CC. By adding the intruder’s velocity, the CC is translated forming the intruder’s velocity obstacle (VO). This VO represents the set of ownship velocities which result in a loss of separation with the intruder. R represents the radius of the PZ. P O w n s h i p ( t 0 ) and P I n t r u d e r ( t 0 ) denote the ownship’s and the intruder’s initial positions, respectively. P I n t r u d e r ( t c ) identifies the intruder’s position at the moment of collision. Each intruder in the vicinity of an ownship results in a separate VO.

3.2. Solution Space Diagram (SSD) Resolution Model

The SSD model consists of finding the intersection between the VOs from all intruders and the performance limits of the ownship, in order to identify which sets of achievable velocity vectors result in a future LoS with intruders. Two concentric circles, representing the minimum and maximum velocities of an aircraft, bound by all reachable speed vectors. Within this reachable velocity space, VOs are constructed for each proximate aircraft, each representing the set of speed vectors that would result in a conflict with the respective aircraft. When all relevant VOs are subtracted from the set of reachable velocities, what remains is the set of reachable, conflict-free speed vectors. A new advised speed vector is then picked from this set and used for conflict avoidance. SSD is thus able to solve multiple conflicts simultaneously. In two-aircraft situations, this model is implicitly coordinated as the conflict geometry, represented by the velocity obstacle, can be used to select complimentary measures to evade each other.
The algorithm herein used is the solution space diagram (SSD) method as implemented by Balasooriyan [36]. The identification of a conflict-free avoidance vector consists of finding a point inside the set of spaces within the velocity limits which does not intersect with the VOs [37].

3.3. Conflict Resolution with Speed Variation

In this work, we employed speed-only conflict resolution with the SSD method. For reference, Figure 7 depicts the selection of a speed vector for conflict resolution which does not alter the heading of the aircraft; only the speed is altered. Note that the conflict-free speed vector resulting in the smallest speed change was selected for conflict avoidance.
Speed-only resolution has been previously explored with flight-level assignments in [8,38,39,40]. Results show that speed-only conflict resolution is only efficient when aircraft in conflict have similar headings. For example, (near-)head-on conflicts require heading variations; a speed change is not sufficient to guarantee minimum separation. The likelihood of the latter kind of conflicts is dependent on the airspace structure and the heading difference between aircraft flying at similar flight levels. The introduction of heading–altitude rules is expected to favour the efficiency of this SSD method. First, (near-)head-on conflicts during the cruising phase are no longer expected as, in each altitude layer, aircraft have similar headings. Second, when using SSD for speed resolution, having more surrounding aircraft will likely result in fewer solutions within the solution space. In extreme cases, a single joint solution may not even exist. As a result, the behaviour of the SDD method is severely hindered on a high traffic density layer. Dividing all traffic into several layers is likely to reduce the saturation of the solution space.

3.4. State-Based vs. Intent-Based Resolution

Most tactical conflict resolution models rely on nominal state-based extrapolations to determine the closest point of approach (CPA) between aircraft. State-based methods assume a projection based on the aircraft’s current position and velocity vector. However, when future trajectory changes of all involved aircraft are not taken into account, false alarms may occur and future LoSs may be overlooked. A state-based model can only adapt to a heading change once the aircraft completes the change and the new heading is the new state. A model which employs intent trajectory prediction can compute this future heading change before it starts and therefore, prevent last minute risk prone situations resulting from the change. Given the high number of turns necessary to move within an urban setting, research into the usage of intent information in this type of environment is relevant.
Intent is commonly used in multi-agent coordination to improve safety [41]. For example, in road vehicles, light signalling is used to indicate an imminent turn. With aircraft, explicit intent sharing is not so trivial. Future trajectory is defined by connecting future trajectory change points (TCPs), which must be shared and processed by other aircraft. As a result, only aircraft which have sufficient technology to transmit and handle these data without considerable delay have access to the airspace. The complete TCP plan may be shared with one data transmission, reducing the number of necessary data exchanges. However, uncertainties increase throughout the flight time as aircraft progressively deviate from their nominal intent to avoid conflicts. Another option is to share future TCPs up to a pre-defined look-ahead time. Such is done in this work; we consider that future TCPs up to the conflict detection look-ahead time are known by all aircraft.
Nevertheless, state information can never be completely removed from the computation as, for imminent losses of minimum separation, it is often preferable to minimise the state change (“shortest-way-out” principle) than to follow the nominal intent. There are situations where considering the propagation of both state and intent information result in non-intersection trajectories (e.g., near an almost reverse turn). In cases where considering both possibilities results in no available conflict-free solutions, one may have to be prioritised. Thus, the combination of state and intent information, and when to prioritise one of these, must be accounted for in advance. Speed-only conflict resolution, as used in this work, has the advantage of not moving aircraft away from their TCPs. However, it can delay or advance its crossing. Finally, the use of TCP points may limit conflict resolution coordination. Aircraft may be expected to move towards their next TCP instead of taking opposite directions to avoid each other. As a result, safety improvements resulting directly from using intent must always be considered in conjunction with the expense of its implementation.
Intent information can be added to the VOs considered in the SSD based on the work of Velasco [16]. Such will alter their shape, thus resulting in a different set of velocity vectors which do not intersect the intruders’ VOs (see Figure 8). This section depicts how a VO can be built with intent information.
The velocity, v c , which will make the ownship occupy the same position as the intruder at a given time, t c , is equal to:
v c ( P A ( t c ) = P B ( t c ) ) = P B ( t c ) P A ( t 0 ) t c t 0 = d ( t c ) t c t 0 ,
where d c ( t c ) represents the distance the ownship aircraft must travel in order to collide with the intruder at time t c . In theory, the VO of an intruder can be built from t c = t 0 to t c . For each t c , the distance d ( t c ) that the ownship would have to travel, and the necessary velocity to do so within t c t 0 , can be identified. As | v c | increases, t c decreases from t c towards t c = t 0 . However, in practice, the upper limit of the VO is set as the look-ahead time value for conflict detection. Given the symmetrical relationship between the radius of the circular set of velocities r and the radius of the protected zone R (see Figure 6), the former can be determined:
r ( t c ) | v c ( t c ) | = R d ( t c ) .
Given Equations (5) and (6) can be transformed into:
r ( t c ) = R t c t 0 .
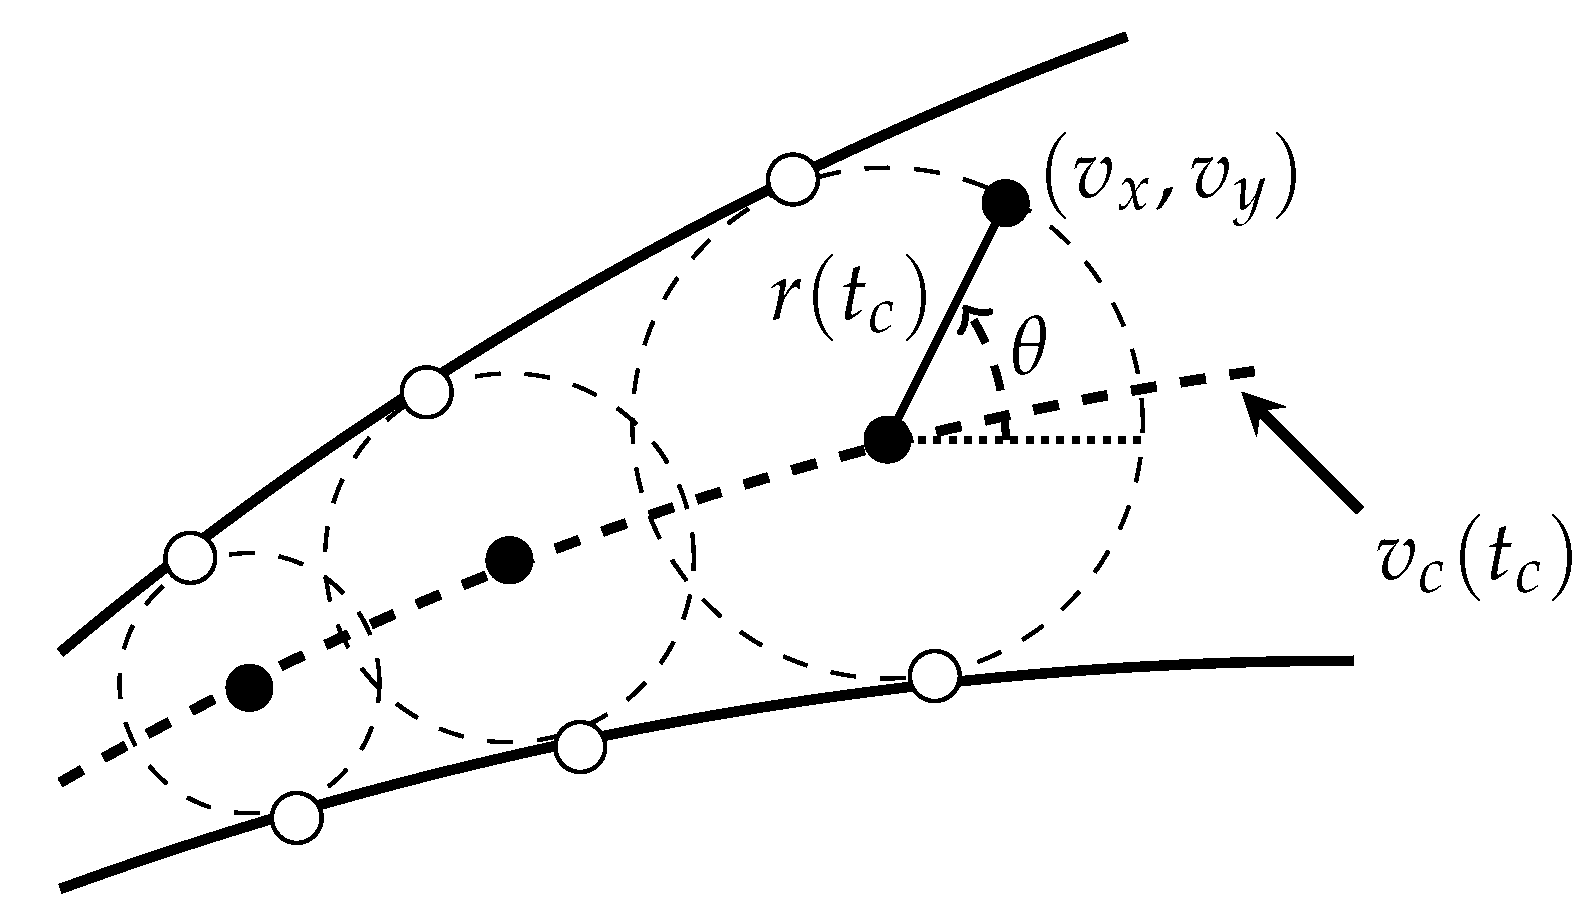
For each time to collision, t c , a new VO circle can be calculated according to the predicted heading, velocity and acceleration of the intruder at that moment. The VO will then be formed by connecting these circles (see Figure 9). For a VO without intent, lines connecting all the circles in the VO will be straight, maintaining the same direction and size progression over time. However, when considering intent, circles will not follow the same progression.
Considering that time can be expressed along the bisector of the VO, the VO itself can be identified as a family of circular curves, with their center at v c ( t c ) along the VO bisector. The envelope of a family of curves is defined as [42]
v x v y = v c ( t c ) + r c ( t c ) c o s ( θ ) s i n ( θ ) , θ [ π , π ] , t c [ t c , ] ,
where v x , v y are the components of the velocity vector for each VO circle, and θ the angular coordinate. Deriving the envelope equation will result in the values of θ for which v x , v y are the tangent points on the envelope curve.
By assuming that the collision vectors are differentiable, the envelope of the family of circles defined in Equation (8), is [42]:
v x t c v x θ v y t c v y θ = 0 .
By resorting to the following notation:
v ˙ c x = V c x t c , v ˙ c y = V c y t c , r ˙ = d r d t c = R ( t c t 0 ) 2 , Θ tan θ 2 ,
we can rewrite Equations (8) and (9):
Θ 2 ( v ˙ c y + r ˙ ) + Θ ( 2 v ˙ c y ) + ( v ˙ c x + r ˙ ) = 0 ,
which can be solved as a second order polynomial. The solutions identify the values of Θ for the tangent points of the envelope. However, these are real coordinates only when the discriminant, | v c ˙ | 2 r ˙ 2 , is greater than zero, i.e., | v c ˙ | r ˙ . As a result, VO circles can only be calculated when the variation of the radius of the VO circles is smaller than the variation of the centre of the circles. Through Equation (7), we can consider that VO circles are only possible when:
| v c ˙ | < R ( t c t 0 ) 2 .
One important case to consider is that when minimum separation has already been lost, no tangent solutions are possible. Therefore, intent VOs are only possible before LoS.

4. Variable Speed Limit (VSL) with Reinforcement Learning (RL)

VSL systems set speed limits to prevent unstable traffic conditions. The objective is to create a more homogeneous traffic situation leading to fewer congestion “hotspots”. VSL has been successfully implemented with road vehicles in order to prevent crashes. More specifically, Wu [43] has shown that VSL improves safety when employed on highway entrances. There are common aspects between the behaviour of agents at highway entrances and altitude transitions, that make applying VSL systems in the latter appealing. First, an outsider vehicle is joining the main traffic lane in both situations. Second, similar to highway entrances, agents are not expected to stop or to reduce their speed significantly during layer transitions. Finally, while safety is paramount in both cases, it is also favourable to improve efficiency by reducing travel times. This section describes how VSL was implemented for layer transitions.

4.1. Agent

Multiple works that have applied reinforcement learning within air traffic control define aircraft as agents [44,45,46,47,48]. However, for air traffic control flow, preference for defining the agent is often given to some structural element within the operational environment [49]. This allows for a general control over aircraft, without having to directly control each single aircraft. The latter approach is not feasible within the high traffic densities expected, for example, for package delivery drone operations [8]. Such an approach would result in a large multi-agent system where with each action, the next state depends not only on the action performed by the ownship, but on the combination of that action with the actions simultaneously performed by the intruders. Current research [50,51] shows that emerging behaviour and complexity arise, not as a result of the number of agents, but from the agents interacting and co-evolving. From the point of view of each agent, the environment is non-stationary, and as training progresses, modifies in a way that cannot be explained by the agent’s behaviour alone. Additionally, in a real-world scenario, having a fixed point is expected to facilitate the collection of data. Finally, aircraft may not have complete observability over the environment, more specifically over spaces they will travel to in the future. Fixed zones are expected to have sufficient knowledge within a surrounding radius, and can be distributed in a way (almost) covering the entire environment.
We employed an RL agent whose objective was to learn to set optimal speed limits in the “roads” of the environment, creating an homogeneous speed situation that guarantees minimum separation between cruising and climbing/descending aircraft. These roads do not have hard set delimiting points as in other works, where physical entrances to the roads are used as limits [49]. We chose to let aircraft transition at whatever road better benefits their trajectory. As a result, the roads at which speed limits are applied depend on the route of climbing/descending aircraft. Figure 10 displays the following sub-sections:
  • Detection section: where cruising traffic is detected;
  • Control section: in this section, aircraft adjust to the maximum speed set by the VSL agent;
  • Entrance/exit section: section where aircraft from adjacent traffic layers are expected to enter the current layer and/or cruising aircraft are expected to exit the current layer. Aircraft are expected to comply with the maximum speed set by the VSL agent.
The entrance/exit sections of two different roads may not immediately follow each other. First, there would not be enough space for aircraft to adjust to the maximum speed on the second road. Second, it would not be possible to correctly assess the effect of each speed limit individually. As a result, one control section separating the two must be guaranteed. Figure 11 shows an example of entrance/exit sections formed around climbing/descending aircraft, while still retaining minimum distance between each other. When it is not possible to set the sections between two nodes, as it is the case with the first and third roads, the length of the entrance/exit section is increased to include additional spatial nodes.
Although the performance limits of the aircraft are not taken into account, it is assumed that all aircraft are able to adopt the set maximum speed. A maximum speed has a duration of 60 s. Afterwards, if there are still aircraft climbing/descending to/from the road, a new maximum speed is requested with the state of the traffic in the road at that point. A 60 s time period was considered sufficient to correctly assess the consequences of the chosen maximum speed, while still allowing the RL agent to adequately respond to the changes in traffic flow over time.

4.2. Learning Algorithm

An RL model consists of an agent that interacts with an environment E in discrete timesteps. At each timestep, the agent receives the current state s of the environment and performs an action a in accordance, for which it receives a reward s t . An agent’s behaviour is defined by a policy, π , which maps states to a probability distribution over the available actions. The goal is to learn a policy which maximizes the reward. Many RL algorithms have been researched in terms of defining the expected reward following the action a. In this work, we used the deep deterministic policy gradient (DDPG), defined in Lillicrap [19].
Policy gradient algorithms first evaluate the policy, and then follow the policy gradient to maximise performance. DDPG is a deterministic actor–critic policy gradient algorithm, designed to handle continuous and high-dimensional state and action spaces. It has been proven to outperform other RL algorithms in environments with stable dynamics [20]. However, it can become unstable, being particularly sensitive to reward scale settings [52,53]. As a result, rewards must be carefully defined. The pseudo-code for DDPG is displayed in Algorithm 1.
Algorithm 1: Deep Deterministic Policy Gradient
  • Initialize critic Q ( s | a μ ) and actor μ ( s | θ μ ) networks
  • Initialize replay buffer R
  • for all episodes do
  •  Initialize action exploration
  • while episode not ended do
  •   Select action a t according to the current state s t from environment and the current actor network
  •   Perform action a t in the environment and receive reward r t and new state s t + 1
  •   Store transition ( s t , a t , r t , s t + 1 ) in replay buffer R
  •   Sample a random mini-batch of N transitions from R
  •   Update critic by minimizing the loss
  •   Update actor policy using the sample policy gradient
  •   Update target networks
  • end while
  •  Reset the environment
  • end for
DDPG uses an actor–critic architecture. The actor produces an action given the current state of the environment. The critic estimates the value of any given state, which is used to update the preference for the executed action. DDPG uses two neural networks, one for the actor and one for the critic. The actor function μ ( s | θ μ ) (also called policy) specifies the output action a as a function of the input (i.e., the current state s of the environment) in the direction suggested by the critic. The critic Q ( s , a | θ Q ) evaluates the actor’s policy, by estimating the state–action value of the current policy. It evaluates the new state to determine whether it is better or worse than expected. The critic network is updated from the gradients obtained from a temporal-difference (TD) error signal from each time step. The output of the critic drives learning in both the actor and the critic. θ μ and θ Q represent the weights of each network. Updating the actor and critic neural network weights with the values calculated by the networks may lead to divergence. As a result, target networks are used to generate the targets. The target networks are time-delayed copies of their original networks, μ ( s | θ μ ) and target critic Q ( s , a | θ Q ) , that slowly track the learned networks. All hidden neural networks use the non-sigmoidal rectified linear unit (ReLU) activation function, as this has been shown to outperform other functions in statistical performance and computational cost [54].
The neural network parameters used in our experimental results are based on Lillicrap [19]. Experience replay is used in order to improve the independence of samples in the input batch. Past experiences are stored in a replay buffer, a finite sized cache R. At each timestamp, the actor and critic are updated by sampling data from this buffer. However, if the replay buffer becomes full, the oldest samples are discarded. Finally, exploration noise is used in order to promote the exploration of the environment; an Ornstein–Uhlenbeck process [55] is used in parallel to the authors of the DDPG model.

4.3. State

The state should provide enough information on the evolution of the traffic flow to allow the RL model to correctly respond to the emergent behaviour. Due to the complexity of the dynamics of traffic flow, it is non-trivial to precisely define this evolution. As suggested by other works [43], traffic flow is herein defined as the number of aircraft passing through a first measure point at the beginning of the road and exiting at a second measure point at the end of the road. In this work, these correspond to the start of the detection section and the end of the entrance/exit section represented in Figure 10, respectively. Additionally, it is assumed that there is enough information available on the aircraft and speed limits in each road. A fixed state array (dim = 4) is used, with each position of the array identifying the following:
  • Number of aircraft expected to transition vertically into the entrance/exit section in the next 60 s;
  • Number of aircraft expected to transition vertically out of the entrance/exit section in the next 60 s;
  • Cruising aircraft expected to travel from the detection area into the entrance/exit section in the next 60 s;
  • Current maximum speed in the detection section.

4.4. Action

A softmax activation function was used for classification. This function normalizes an input vector, z , of K real values into a vector of K real values between 0 and 1 that sum up to 1. As a result, these values can be interpreted as probabilities. The mathematical definition of the softmax function is as follows:
σ ( z ) i = e z i j = 1 K exp ( z j ) ,
where z i are the elements of the input vector to the softmax function.
Probability values are set for the discrete options for maximum speed: 10 kts, 15 kts, 20 kts, 25 kts, or 30 kts. The speed value with the highest probability value is used.

4.5. Reward

The reward given to the RL agent is primarily based on safety. However, within safety, several factors may be considered. The paramount objective is to lead the agent to favour maximum speeds that reduce the likelihood for LoSs. In a previous work [46], we saw that focusing mainly on the total number of LoSs is the best reward structure to reduce it. However, the number of LoSs per call to the RL agent might be too sparse to favour a fast convergence to an optimal solution. As a result, to complement the number of LoSs, we considered near-LoSs, i.e., aircraft encounters that nearly resulted in a loss of minimum separation. Near-LoSs are identified based on the time to LoS. However, naturally, a near-LoS has a lower weight than an LoS.
Although VSL is primarily used to improve safety and not efficiency [56], by favouring higher speeds, it is possible to reduce travel times. With this in mind, two elements favouring higher speeds are added to the reward structure: (1) a positive reward for when the final detected outflow matches/surpasses the expected outflow, and negative when it is inferior; and (2) a positive reward when higher travelling speeds are selected. The expected outflow is calculated as follows:
o u t f l o w = a i r c r a f t c r u i s e a i r c r a f t o u t + a i r c r a f t i n
where a i r c r a f t o u t represents the aircraft transitioning vertically out of the section, a i r c r a f t c r u i s e represents the aircraft detected at the start of the detection section, and a i r c r a f t i n is the aircraft expected to vertically merge into the section. Note that the expected outflow is only calculated for the 60 s period that the maximum speed is set at. The final outflow is then verified by checking the aircraft that cross the end of the entrance/exit section.
In brief, the final reward value is obtained by summing the following components:
  • A negative reward for a LoS within the road (−10 per LoS);
  • A negative reward for near-LoS within the road (−4 when time to Los < 10 s; −2 when time to LoS > 10 s);
  • The difference between the final detected and the expected traffic flow. A higher traffic outflow is rewarded positively (+1 for each extra aircraft that exits the road). An inferior traffic flow is rewarded negatively (−1 for each each aircraft that has not exit the road as it was expected);
  • A positive reward for higher maximum speeds (0 for 10 kts; +1 for 15 kts; +2 for 20 kts; +3 for 25 kts; +4 for 30 kts).

4.6. Aircraft Compliance with the Maximum Speed

Naturally, the success of the VSL implementation is directly related to the percentage of aircraft that comply with the maximum speeds. Otherwise, speed heterogeneity in the environment is not mitigated and thus no improvement can be achieved. The effect of non-compliance per part of the operating aircraft will be analysed within the experimental results.

5. Experiment: Conflict Resolution in Urban Environment with Variable Speed Limits

5.1. Apparatus and Aircraft Model

The Open Air Traffic Simulator Bluesky [21] was used in order to test the efficiency of speed-only based conflict resolution with SSD in an urban environment. Bluesky has an Airborne Separation Assurance System (ASAS) to which CD&R models can be added, allowing for different CD&R implementations to be tested under the same scenarios and conditions. A DJI Mavic Pro model was used for the simulations. Speed and mass were retrieved from the manufacturer’s data, and common values were assumed for turn rate (max: 15 / s) and acceleration/breaking ( 1.0 kts / s ).

5.2. Independent Variables

Four independent variables were included in this experiment: state/intent information usage; heading–altitude rules; variable speed limits compliance; and traffic density.

5.2.1. State/Intent Information Usage

Two different situations with using the state and intent information will be tested in order to establish how to maximise the effect of using intent information:
  • Only state (S) information: common application which will be used as a performance baseline for comparison;
  • State and intent information is used simultaneously ( S I ). Conflicts are detected and resolved preparing for both situations: whether intruding aircraft continue in their current state or follow their intent. This is a conservative approach, with aircraft working to prevent all possible risk situations. The disadvantage is that more VOs are included in the solution space and the amount of velocity vectors which can prevent all conflicts becomes smaller; it can potentially even reach a situation where no solution exists.

5.2.2. Heading–Altitude Rules

Two different rules settings will be tested with:
  • All aircraft travel at the same altitude layer, independently of heading. Used for baseline comparison;
  • Multiple altitude layers are used. In each layer, aircraft have similar headings.

5.2.3. Variable Speed Limits Compliance

When multiple altitude layers are used, three different situations of VSL usage will be tested with:
  • No variable speed limits are applied, aircraft to follow the maximum cruise speed. Used for baseline comparison;
  • Variable speed limits are applied by the RL agent. Aircraft have a compliance rate of 100%;
  • Variable speed limits are applied by the RL agent. Aircraft have a compliance rate of 90%.

5.2.4. Traffic Density

The traffic density varies from low to high as per Table 2. High densities spend, at least, more than 10% of their flight time avoiding conflicts [57].
Regarding the RL agent used for setting variable speed limits, it will initially be trained at a medium traffic density. Afterwards, testing will use all three traffic densities: low, medium and high. This way it is possible to assess the efficiency of an agent trained in a different traffic density.

6. Experiment: Experimental Design and Procedure

6.1. Minimum Separation

The value of the minimum safe separation distance may depend on the density of air traffic and the region of the airspace. For unmanned aviation, there are no established separation distance standards yet, although 50 m for horizontal separation is a value commonly used in research [58] and will therefore be used in the experiments performed herein. For vertical separation, 30 ft was assumed.

6.2. Conflict Detection

The experiment will employ state-based conflict detection for all conditions. This assumes the linear propagation of the current state of all involved aircraft. Using this approach, the time to CPA (in seconds) is calculated as
t C P A = d r e l · v r e l v r e l ,
where d r e l is the Cartesian distance vector between the involved aircraft (in metres), and v r e l the vector difference between the velocity vectors of the involved aircraft (in metres per second), pointed towards the intruder’s protected zone.
The distance between aircraft at CPA (in metres) is calculated as
d C P A = d r e l 2 t C P A 2 · v r e l 2 .
When the separation distance is calculated to be smaller than the specified minimal horizontal spacing, a time interval can be calculated in which separation will be lost if no action is taken:
t i n , t o u t = t C P A ± R P Z 2 d C P A 2 v r e l
These equations will be used to detect conflicts, which are said to occur when d C P A < R P Z , and t i n t l o o k a h e a d , where R P Z is the radius of the protected zone, or the minimum horizontal separation, and t l o o k a h e a d is the specified look-ahead time. A look-ahead time of 30 s is used for conflict detection and resolution.

6.3. Simulation Scenarios

The geographic area used in the experiment was a small section of San Francisco with an area of 1.708 NM2, as was illustrated in Figure 2. Roads and intersections are represented by edges and nodes, which aircraft can use to build their route. Aircraft can only travel from one node to another if there is a road connection between the two. The aircraft spawn locations (origins) and destinations were placed in alternating order on the edge of this area, with a spacing equal to the minimum separation distance plus a 10% margin, to prevent conflicts between spawn aircraft and aircraft arriving at their final destination. In the case of only one traffic layer, aircraft are spawned at that corresponding altitude. When multiple layers are used, aircraft spawn at the altitude of the layer that corresponds to the initial heading. In terms of climbing rate, aircraft are expected to climb almost vertically. Take-off and landing are not simulated.
Each aircraft has three delivery points (or waypoints) it must pass through. The delivery points are always nodes of the map. The exact nodes are randomly assigned. However, the pool of nodes to pick from are spread in a way that each aircraft is made to cross the map. The total flight distance and time depends on the location of these nodes. During the generation of the scenario files, the total flight path/time of the already created aircraft was taken into account so the desired instantaneous traffic densities were respected. These values will be presented in the experimental results for reference. Each scenario ran for 2 h. Each traffic density was tested with three different repetitions, each with different trajectories.
Between the set delivery points, it was assumed that aircraft will favour safety and efficiency in their route planning, in this order. The main priority of any aircraft would be to limit the number of altitude transitions as crossing multiple layers is likely to result both in an increase in the total number of conflicts and of the travel time. Then, adoption of routes with the fewest turns is also preferable, as in our scenarios, more turns lead to more altitude transitions. Lastly, routes with shorter distances are preferable in terms of efficiency. As a result, aircraft calculate their trajectory prioritising, in decreasing order of preference:
  • Fewer altitude variations;
  • Fewer turns;
  • Shortest distance.
Ultimately, an aircraft was removed from the simulation once it left the simulation area. To prevent aircraft being removed incorrectly when travelling through an edge road, aircraft were set to move out of the map once they finished their route and were removed once they moved away from an edge node.

6.4. Dependent Variables

Three different categories of measures were used to evaluate the effect of the different operating rules set in the simulation environment: safety; stability; and efficiency.

6.4.1. Safety Analysis

Safety was defined in terms of the number and duration of conflicts and losses of separation, where fewer conflicts and losses of separation were considered to be safer. Additionally, losses of separation were distinguished based on their severity according to how close aircraft got to each other:
L o S s e v = R d C P A R .
A low separation severity is preferred.

6.4.2. Stability Analysis

Stability referred to the tendency for tactical conflict avoidance manoeuvres to create secondary conflicts. In the literature, this effect has been measured using the Domino Effect Parameter (DEP) [59]:
D E P = n c f l O N n c f l O F F n c f l O F F ,
where n c f l O N and n c f l O F F represent the number of conflicts with CD&R ON and OFF, respectively. A higher DEP value indicates a more destabilising method, which creates more conflict chain reactions.
Naturally, conflict resolution manoeuvres which deviate from the nominal path are expected to create more secondary conflicts, due to the scarcity of free space at high travelling densities. Herein, speed-only-based avoidance manoeuvres were applied, and thus aircraft did not deviate from their path due to conflict resolution. As a result, the effect on stability from avoiding conflicts was not expected to be as pronounced. However, when multiple traffic layers were employed, aircraft increased their path to correctly adjust to the heading range of the crossed layers. The negative effect on stability resulting from this increase in flight path/time was analysed.

6.4.3. Efficiency Analysis

Efficiency was evaluated in terms of distance travelled and duration of flight. Significantly increasing the path travelled and/or the duration of the flight was considered inefficient.
The effect on total flight path/time resulting from layer transitions was analysed and compared with the baseline case of having only one traffic layer. Additionally, conflict resolution and the application of variable speed limits with the RL agent was expected to have an effect on the average speed of the aircraft. The added flight time will be compared to the baseline case where no conflict resolution was performed and no speed limits were set.

7. Experiment: Experimental Hypotheses

7.1. Speed-Only Conflict Resolution

Speed-only conflict resolution naturally has its limitations: there are not so many options for avoidance manoeuvres as when heading and/or altitude variations are also possible. It was hypothesized that the SSD method would have better efficiency when applying heading–altitude rules. (Near-)head-on conflicts are not expected as aircraft, in the same altitude layer, have similar headings. Independently of the airspace structure, the efficiency of the speed-only based conflict resolution model was expected to deteriorate as the traffic density increased. Existing research [38,39] shows that the efficiency of speed-only resolution depends on the nominal minimal separation between the aircraft and on the time available to the loss of separation. As traffic density increases, the space between the aircraft is expected to reduce, and consequently, so is the time to loss of separation.

7.2. State vs. Intent Information in Conflict Resolution

It was hypothesized that using intent information alone is not sufficient for an efficient conflict avoidance. At high traffic transitions, aircraft spent a considerable amount of time in conflict, where the speed vector output by the conflict resolution model was used instead of the intent speed vector. Ultimately, the current state information is the best indication of the state during conflict avoidance as aircraft will try to differ from it as little as possible (i.e., the conflict-free speed vector that constitutes the smallest deviation from the current state is always picked for conflict avoidance).
However, it was expected that considering intent information would improve safety. With state information only, heading/altitude variations would only be detected once intruders had completed the change, which may be too late to prevent LoSs. It was hypothesised that using both state and intent information simultaneously ( S I ) would increase the number of detected conflicts (i.e., false negatives are added and false positives are not discarded), but would prevent more LoSs as all possible future cases (i.e., intruder following intent or entering conflict avoidance) are defended from in advance.
It is not clear in which structure (i.e., with one layer or multiple layers) using intent is more beneficial. There are advantages and disadvantages in both cases. On one hand, when all traffic operates at the same altitude, intent has the biggest impact, as it allows for removing false positive and adds false negative conflicts resulting directly from turns. However, given the high traffic density, adding intent may saturate the solution space and render finding an optimal solution impossible. On the other hand, with multiple layers, the structure itself already defends from turns as these are performed within the transitions altitudes. In this case, intent information aids by removing false positives from intruders which are about to climb/descend and adds false negative conflicts from intruders about to join the layer of the ownship. However, here, resolving all conflicts is non-trivial as there are conflicts in both horizontal and vertical layers. Even though the ownship is better informed regarding conflicts, this may not be enough to actually find a solution that successfully resolves them all. As a result, adding intent might not have a pronounced effect on safety.

7.3. Heading–Altitude Rules

Applying heading–altitude rules is expected to strongly reduce the number of LoSs and conflicts as both the traffic density and the likelihood of aircraft meeting in conflict decreases compared to having only one traffic layer. The weakness of this method is the added conflicts resulting from the vertical transitions between the layers. Having to resolve conflicts on both the horizontal and vertical dimensions increases the complexity of finding a solution to resolve all conflicts. Having a high number of altitude transitions, which is expected at high traffic densities, hinders conflict resolution efficiency. Efficiency-wise, heading–altitude rules are expected to increase 3D flight travel distance and consequently, flight travel distance.

7.4. Variable Speed Limits with Reinforcement Learning

It was hypothesised that setting variable speed limits would improve the speed homogeneity of the environment, which in turn improves the safety between cruising and climbing/descending aircraft. Between the former and the latter, speeds differences are expected. However, it was also hypothesised that VSL only improves safety when a large majority of the operating traffic complies with the speed limits. Safety levels are expected to decrease directly with the compliance rate.
The testing of the RL agent will be done with similar and different traffic densities to the training conditions. It is naturally expected that the agent will perform better at the densities it was trained in. However, applying the agent on different densities allows for assessing the dependency of maximum speed solutions on traffic densities. It was hypothesized that the agent may be the least efficient at densities higher than the one it was trained in, as the complexity of the emergent behaviour, and of the consequent solution, increases proportionally with the density.

8. Experiment: Results

The final best scenario expected is when all the structural rules are applied to the environment: (1) heading–altitude rules are used to divide aircraft into multiple layers; (2) variable speed limits are in place to improve speed homogeneity between cruising and climbing/descending aircraft; and (3) intent trajectory propagation is added to conflict resolution, allowing the CR model to prepare for all possible future cases (i.e., intruders following intent or entering conflict avoidance mode). However, in order to properly analyse the effect of the multiple independent variables on the dependent measures, several baseline situations are presented alongside this scenario: (a) a one-layer scenario (e.g., all traffic operates at the same altitude); (b) a multi-layer situation without variable speed limits; and (c) a multi-layer situation with only a 90% compliance rate to the variable speed limits. All of the previous situations were tested with different traffic densities, and different state/intent information usage for conflict resolution as well as a situation without conflict resolution (CR-OFF).
Box-and-whisker plots are used in multiple occasions to visualise the sample distribution over the several simulation repetitions. Efficiency, stability, and time in conflict values present outliers; the number of outliers is consistent throughout (<10% of the total data). As these do not contribute to the comparison between the different states, we decided not to display them for clarity.

8.1. Training of the RL Agent for Variable Speed Limits

The RL agent responsible for setting the variable speed limits was trained at a medium traffic density. In total, 300 episodes were run. One episode is a full execution of the simulation environment, which runs for 2 h. During training, conflict resolution was used with state information only.

Safety Analysis

The episodes do not all have the same number of calls to the DDPG model. This is proportional to the maximum speeds set. Each maximum speed was set for 60 s. In case lower speeds were used during the transition progress, traffic will move slower. As a result, after the 60 s, the DDPG may be called again for the same section if aircraft transitioning between layers have not finished their transition yet. Figure 12 shows the evolution of the total number of calls to the DDPG per episode during training. The trained RL agent stabilized at around 1755 calls.
Figure 13 shows the evolution of the total number of LoSs per episode during training. The model was able to converge to a stable value after around 250 episodes.
Figure 14 shows the speed limits applied in one episode that led to a decrease in the total number of LoSs. At each step, the RL agent picks a speed limit from the set of discrete options displayed in the y axis. Almost 95% of the time, a maximum speed of 25 kts was chosen. Favouring one speed value is a result of aircraft being able to climb/descend at any point. Consequently, the sections are very close together, and keeping a homogeneous maximum speed between neighbouring sections is beneficial. The other discrete options were employed in similar numbers, with no clear preference between the four options. From our experiments, we saw that those singular cases where smaller maximum speed values (10kts to 20kts) are used are crucial. These lead to better final results safety-wise than an episode where all maximum speeds are set at 25 kts. However, from the results, it is not clear how or when the agent decides to apply lower speeds as limits.
Why 25 kts? The reinforcement learning agent found this value to be the best balance between desiring a high speed, in order not to considerably increase travel time, while improving safety. This is naturally related with the performance limits of all aircraft, separation between traffic layers, and the rate of climbing. All these factors contribute to the best decision; different values will likely yield different maximum speeds.
Figure 15 shows the average reward per call to the RL agent in the same episode shown in Figure 14. In most steps, the RL agent achieves a positive reward. However, outliers indicate that, in some occasions, preventing LoSs/near-LoSs is practically impossible. Naturally these rewards are directly related to the traffic density the agent is trained in, and consequently, the number of LoSs and near misses.
Figure 16 shows the evolution of the total number of pairwise conflicts per episode during training. Comparing with Figure 13, the total number of conflicts is not directly correlated with the total number of LoSs. During training, not all episodes with the fewest conflicts also had the fewest LoSs.

8.2. Testing of the RL Agent for Variable Speed Limits

8.2.1. Safety Analysis

Figure 17 displays the mean total number of pairwise conflicts. A pairwise conflict is only counted once independently of its duration. As hypothesised, applying heading–altitude rules reduces the total number of conflicts—by 80% on average. As aircraft are dispersed per the several altitude layers, there is more free space in each layer. Additionally, conflict resolution only reduces the total number of conflicts in the one layer situation, with a bigger efficiency at a high traffic density. However, the lack of a strong reduction on the total number of conflicts is not necessarily a sign of poor efficiency, since conflicts are a necessary element of propagating speed reductions backward at intersections. Furthermore, as expected, when using both state and intent information, more conflicts are considered than when using state information alone. Finally, applying variable speed limits (VSL) on a multi-layer structure does not have a pronounced effect on the number of conflicts.
Figure 18 shows the amount of time spent in “conflict mode” per aircraft. An aircraft enters “conflict mode” when it adopts a new state computed by the CR method. The aircraft will exit this mode once it is detected that it is past the previously calculated time to CPA (and no other conflict is expected between now and the look-ahead time). At this point, the aircraft will redirect its course to the next waypoint. The time to recovery is not included in the total time in conflict. Based on this information and Figure 17, the number of conflicts is not directly correlated with the amount of time in conflict. The considerable increase in teh number of conflicts with a high traffic density compared to a medium traffic density does not have a direct correlation in the average time in conflict. Employing heading–altitude rules reduces the average time in conflict, albeit more significantly with a lower traffic density. Additionally, there is no pronounced difference in the time-of-conflict resulting from employing variable speed limits. Finally, adding intent information only increases the time in conflict with a one-layer structure.
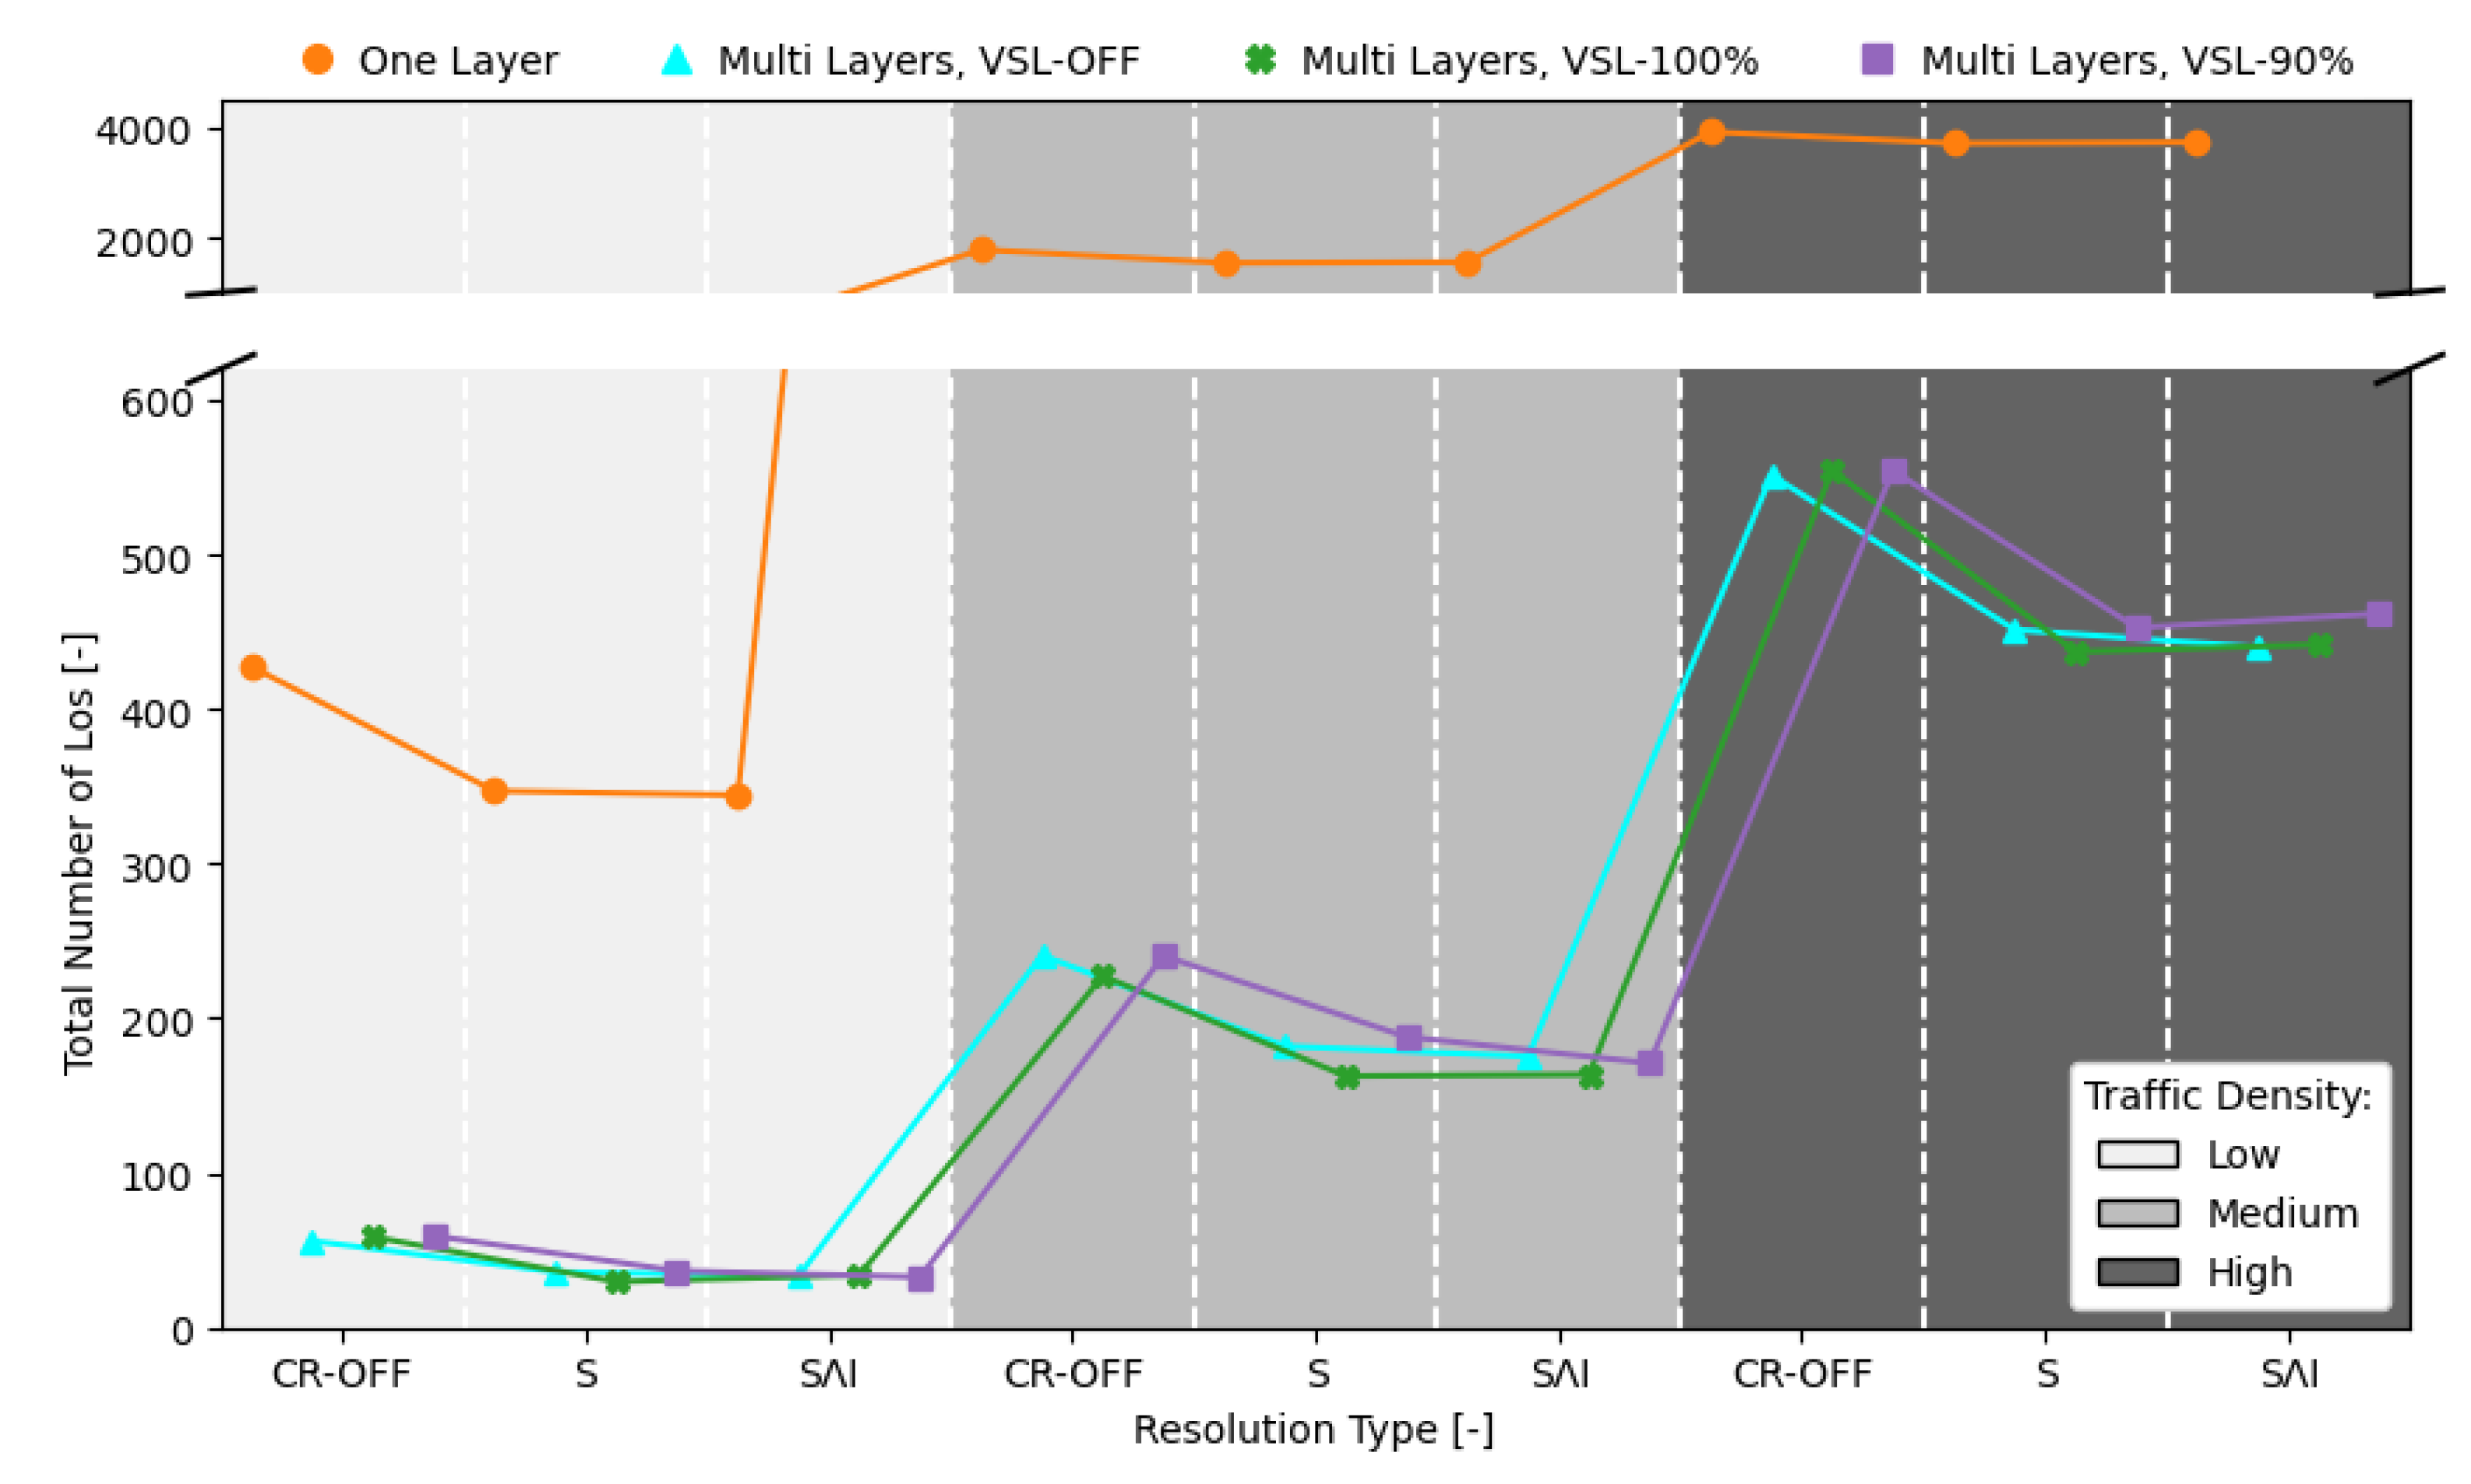
Figure 19 shows the mean total number of LoSs. As hypothesised, applying heading–altitude rules reduces the total number of LoSs—by 85% on average. When all traffic is contained in one layer, speed-only-based conflict resolution is hardly capable of an improvement. At medium and high traffic densities, only about 5% of the total number of LoSs are prevented compared with a CR-OFF situation. With the high likelihood of aircraft meeting in conflict increasing with traffic density, it is progressively harder for the SSD method to find a solution which resolves all conflicts. Additionally, by comparing Figure 17 and Figure 19, we see that the relation between the total number of LoSs and conflicts is not linear; as fewer conflicts do not necessarily equal fewer LoSs.
Unfortunately, adding intent results in a negligible reduction in the total number of LoSs with a one-layer structure. As hypothesised, at these high densities, the benefit of adding intent information is outweighed by the increase in saturation of the solution space. With a multi-layer structure, the benefit is more pronounced, albeit still small: adding intent reduces the total number of LoSs in about 5% at high traffic densities compared to a state-only conflict resolution. Adding intent allows aircraft to better assess the danger of climbing/descending intruders. However, speed-only-based conflict resolution can do little with simultaneous horizontal and vertical conflicts. Additionally, note that a small look-ahead time reduces the differences between state and intent information. In these simulations, a look-ahead time of 30 s was used for conflict detection and resolution. With a higher look-ahead time, as the state of intruders is projected further into the future, thus increasing uncertainties, and the difference between intent and state information is greater. Intent is thus progressively more beneficial as the look-ahead time increases. On the other hand, a bigger look-ahead time results in more conflicts being accounted for, thus saturating the solution space and increasing the number of situations where no solutions are available. All these factors should be taken into account.
Decreasing the number of losses of minimum separation is the paramount objective of employing variable speed limits with a reinforcement learning agent. With full compliance, there is an average decrease of 15% in the total number of LoSs at the medium traffic density that the agent was trained in. With different traffic densities, as it was hypothesised, the agent is more efficient with a lower density than with a higher one. As traffic densities increases, so does the complexity of the emergent behaviour, and more complex solutions need to be developed. Additionally, as the compliance rate decreases, the benefit is lost. A 90% compliance rate is already not sufficient. Consequently, a 100% compliance rate must be guaranteed.
Figure 20 displays the intrusion severity. No direct correlation between intrusion severity and the traffic density was observed. As the one-layer situation has a much greater number of total LoSs (see Figure 19), there is a more heterogeneous set of values and the average severity is closer to the median of the total range. However, it is interesting to note that, with multiple layers, intrusion severity has a high average, meaning that aircraft in a LoS situation become very close to CPA. This is likely to be due to conflicts resulting between cruising and climbing/descending aircraft, which are very hard to defend from with only speed-based conflict resolution.
Figure 21 and Figure 22 focus on the multiple layers configuration in order to obtain more insight into how to further prevent LoSs between cruising and climbing/descending aircraft. Figure 21 shows the relative speed between pairwise aircraft in an LoS situation. More LoSs occur when there is a higher relative speed between aircraft. As expected, with an heterogeneous distribution of speed between aircraft, it is harder to keep adequate spacing between them. Interestingly, at both low and medium traffic densities, variable speed limits appear to have the same effect of reducing relative speeds as applying conflict resolution.
Figure 22 shows where LoSs occur in a multi-layer situation without VSL. As expected, most of the LoSs occur during transition to different altitude layers. Improving safety during these transitions should thus be the focus when using a multi-layer structure.

8.2.2. Stability Analysis

Figure 23 displays the mean DEP value. A high positive value indicates the occurrence of conflict chain reactions causing airspace instability. As seen previously with the total number of conflicts (see Figure 17), speed-only-based conflict resolution does not greatly influence the stability of the environment.

8.2.3. Efficiency Analysis

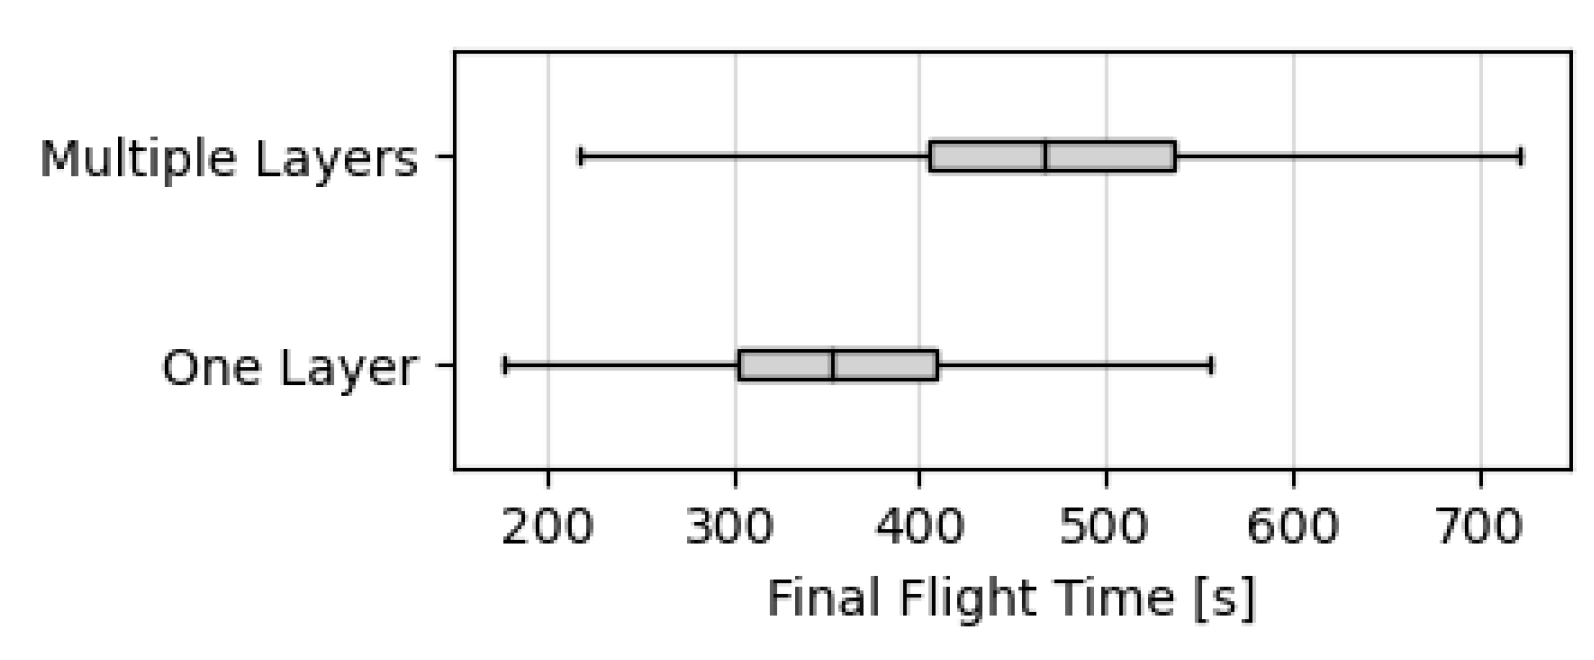
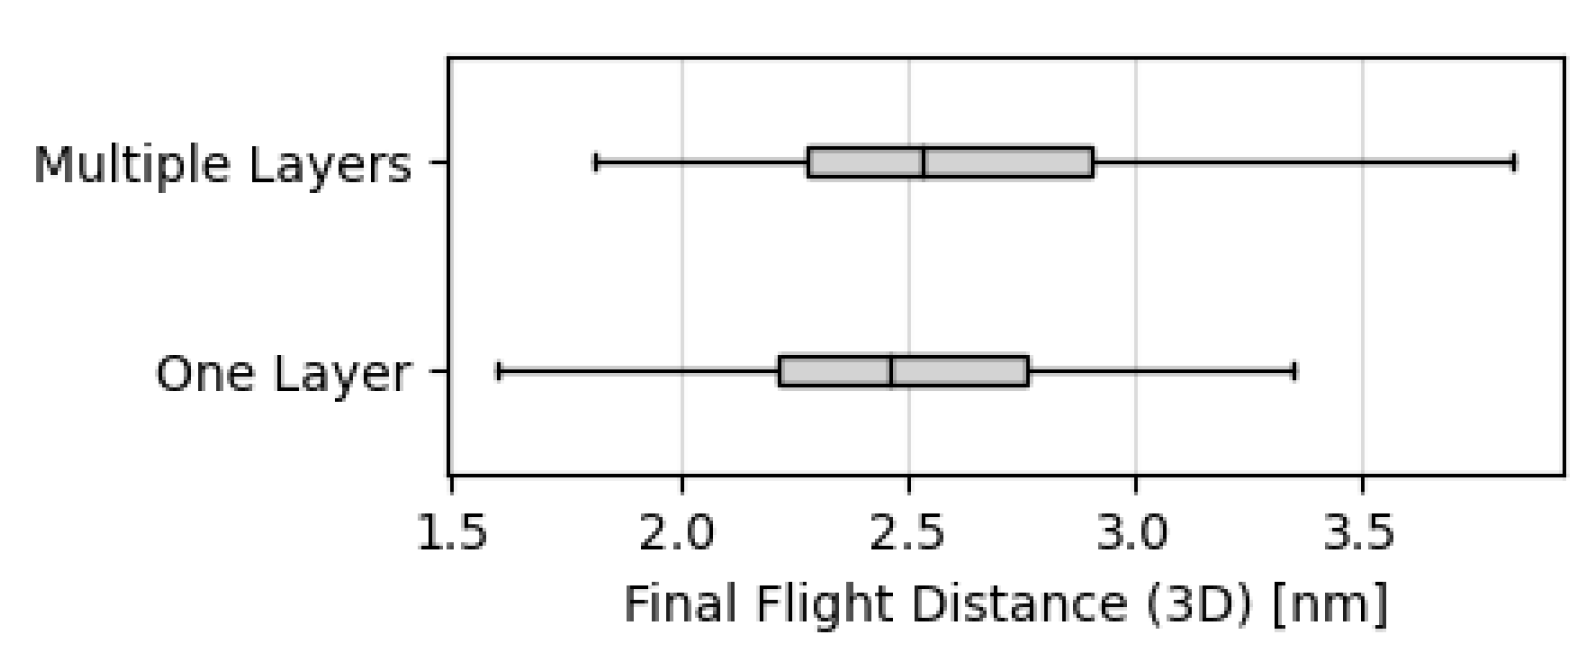
For reference, Figure 24 and Figure 25 show the average flight time and flight path per aircraft, respectively, without conflict resolution. As expected, with multiple layers aircraft travel longer. Adding to their route, aircraft have to transition between layers which increases their 3D flight distance and consequently their flight time.
Figure 26 shows the average number of instantaneous aircraft per timestep of an episode. The simulation scenarios were built taking into account an intended instantaneous traffic density of 25, 50, and 75 aircraft per low, medium and traffic density, respectively. These values were calculated for a CR-OFF, one-layer situation. With a multi-layer situation, as seen in Figure 24, the average flight time increases as a result of extra climbing/descending actions as well as of the extra horizontal path to correctly adjust to the traffic heading at each traversed layer. As a result, the average instantaneous traffic density also increases. Additionally, it was expected that applying conflict resolution increases flight time, as aircraft employ avoidance speeds instead of their preferred cruising speed, which is usually higher in order to decrease travel time. However, this effect is only pronounced in a one-layer structure.
Figure 27 shows the extra flight time as a result of employing conflict resolution vs. a CR-OFF situation. Both situations, one-layer and multiple layers, have naturally different CR-OFF values, as previously displayed in Figure 24 and Figure 25. With only one layer, conflict resolution has worse efficiency. With a higher number of conflicts and time in conflict (see Figure 17 and Figure 18, respectively) conflict resolution tends to pick solutions with lower speeds, which increases flight time. When state and intent information are used simultaneously ( S I ), more conflicts are considered; the increase in flight time is visible below.

9. Discussion

Applying heading–altitude rules, VSL, and combining intent with state information had a positive effect in reducing the total number of LOSs (in decreasing order of effect). However, there are questions regarding their implementation: (1) the benefit of adding intent information is lost as traffic density increases, and thus its usage should be weighted against the expected densities and cost of implementation; (2) VSL implementation resulted in the same maximum speed value being employed in the majority of times, which raises questions regarding the ability of the method to adapt and personalise maximum speed values. Comparison with previous VSL research indicates that this might be due to the environment characteristics: adjacent sections, one unique lane with uniform cruising traffic, and rewards based on a safety factor which improves with speed homogeneity. Further work with different airspace structures is needed for a better understanding. The following sub-sections dwell further into these subjects.

9.1. State vs. Intent Information in Conflict Resolution

Combining intent and state information reduces the number of LoSs compared with using state information alone. The efficiency of this model is due to combining both the information of the current state and intent which provides guidance regarding the future state. However, a disadvantage of using both intent and state information simultaneously with the SSD model is that the solution space becomes saturated faster, especially as the traffic density increases. As a result, combining state and intent was more efficient when more traffic layers were in place, as there are fewer conflicts per layer to consider.
In addition, the benefit of using intent is directly associated with the type of variations allowed for conflict resolution. In a previous work [60], intent information was added to a no-boundary setting, with heading/speed variations for conflict avoidance, and a higher look-ahead time. The previous characteristics improved the benefit of adding intent information. Being allowed to modify heading for conflict avoidance greatly increases the number of conflict-free speed vectors which can be selected from the solution space. Consequently, the reduction in the amount of these vectors when intent information is added is not as detrimental as when only speed variation is possible. Thus, when using a conflict resolution model such as SSD, using intent information might be beneficial only at low traffic densities and/or when both heading and speed variation is allowed, as more conflict-free avoidance speed vectors are available.
Finally, the efficiency of all resolution manoeuvres is dependent on the speed/ acceleration of the involved aircraft. Applying different resolution methods, and/or aircraft types, may naturally produce different results. This may still be of interest to research how other conflict detection and resolution methods react to adding intent information, and which differences may exist in the final avoidance speeds selected. However, safety improvements resulting directly from using intent information must be considered in conjunction with the expense of its implementation. The first deterioration of the safety improvements must be hypothesized in a real-case scenario. Delays in data transmission and processing may delay the reaction to state changes in neighbouring aircraft. Second, the effect on safety is directly associated with the number of aircraft which can share and analyse intent information. To achieve the desired improvement, the majority of aircraft in the airspace would require such capability.

9.2. Heading–Altitude Rules

The paramount factor in safety is the number of minimum separation violations. Here, the airspace design can be seen as a first layer of protection, where structure is used to reduce the likelihood of aircraft meeting and, consequently, the likelihood of conflicts. The segmentation of the operating traffic into multiple altitude layers reduces both the number of conflicts and the number of losses of minimum separation. Moreover, these rules allow for the prevention of (near-)head-on conflicts, which would otherwise be impossible to resolve when heading variation for conflict resolution is not possible.
The improvement in safety comes at the cost of decreasing efficiency, as aircraft must now add transition between altitude layers to their route. However, the decrease in efficiency was small compared to the reduction in the number of losses of separation. Ultimately, improving safety increases the number of aircraft allowed into the airspace. Thus heading–altitude rules are a good option from an operational perspective.

9.3. Variable Speed Limit with Reinforcement Learning

Experimental results have shown that the DDPG-based control of the maximum speeds allowed in sections where vertical transitions are taking place reduces losses of minimum separation. However, the benefit of variable speed limits is dramatically limited by the following:
  • Compliance rate of 90% already cancels out the benefit of employing speed limits. Consequently, the necessary infrastructure should be in place to make sure that aircraft can identify and correctly react to these variable speed limits;
  • Training in a specific traffic density proved somewhat inefficient for higher densities. The RL agent should at least be trained at the highest traffic density expected under actual operations. It may also be that different traffic densities require different resolution strategies, as also hypothesised in the Metropolis project [29]. In this case, the RL model must learn different responses per complexity of emergent behaviour resulting from increasing traffic densities.
The excerpt of actions picked by the RL model during one episode of training shows a recommendation of the same speed value for the majority of the episode. We assumed this to be due to the following reasons:
  • Aircraft were able to climb/descend at any point, setting variable speed sections in close proximity. A homogeneous maximum speed value between all sections proved beneficial;
  • Reward values were based on the efficiency of conflict resolution. Having aircraft (rapidly) accelerating greatly reduces the efficiency of conflict resolution, as it increases uncertainty regarding the intruders’ trajectory propagation;
  • A uniform distribution of the traffic density was favoured to establish a relation between the allowed traffic density and resulting safety level. Throughout one episode, the number of instantaneous aircraft is expected to remain (almost) constant, with variations resulting only from conflict avoidance and/or the randomisation of trajectories.
Previous research [43,61,62] commonly employed freeway sections far apart. Thus, these do not hold as great of an influence on each other. Moreover, traffic variation was more pronounced (off-peak vs. peak hours traffic). Additionally, in a real-case scenario, vehicles slow down to a halt to prevent collision. In these cases, lower maximum speeds are applied in order to limit frequent speed breaks. This behaviour is not present in our simulations, and thus the RL model is free to favour higher speeds which optimise traffic outflow. From Wu [43], we learned that maximum speed variability is influenced both by the reward formulation, and the traffic scenario in the lane. We advise for future work to focus on the validation of VSL behaviour with different airspace rules (e.g., pre-defined, fixed climb/descent points; non-uniform traffic scenarios) for a better understanding of the relation between airspace properties and speed control.

9.4. Advice for Future Work

In this work, a DDPG model was employed. As seen with previous research, this model showed fast convergence to an optimal solution. However, past research also proved it to be sensitive to unstable dynamics [20]. This should be taken into consideration when applying it to different types of agents. In terms of further improvements with the reinforcement learning model, the following is also advised:
  • The exploration of more powerful states and reward formulations;
  • The exploration of different time periods for the duration of a maximum speed on a section. Duration may be based instead on observable changes of the traffic scenario in the section;
  • The current implementation is oblivious to a congestion building up some distance ahead. A greater observability over the environment could be obtained by adding knowledge within a larger surrounding radius to the state formulation. Such a strategy introduces more complexity to the system, but should be considered in favour of a more homogeneous traffic situation throughout the entire environment;
  • Further testing with more heterogeneous environments (e.g., different aircraft types, different performance limits, different separation between layers, different climbing/descending rates, different minimum separation).
Finally, when employing a multi-layer structure, most of the LoSs result from interactions between cruising and climbing/descending aircraft. Speed-based conflict resolution is not sufficient to defend from simultaneous vertical and horizontal conflicts. More operating rules can be added to the environment in order to improve the safety between cruising and climbing/descending aircraft. For example: (1) airspace structuring can be extended to warrant sufficient space for vertical avoidance manoeuvres; and (2) setting multiple steps during climb/descent in order to delay the final approach in case the upcoming layer is too congested.

10. Conclusions

This paper looked into enabling a safe introduction of drone operations into an urban airspace. The results show that the separation of traffic into different altitude layers by employing heading–altitude rules greatly reduced the total number of conflicts and losses of minimum separation. With this structure, interactions between cruising and climbing/descending aircraft should be the main focus in order to improve safety. The training of a reinforcement learning (RL) agent to apply variable speed limits (VSL) enabled a more homogeneous traffic situation during the layer transition phase. When aircraft fully comply with these speed limits, these increase the distance between aircraft, reducing the total number of violations of minimum separation.
As the traffic densities increases, so does the complexity of emergent behaviour from neighbouring aircraft. In these cases, the simple sets of rules and analytical methods implemented by common conflict detection and resolution models are no longer sufficient. Next to VSL, future work may consider using RL to also improve the structure of the operational environment. The number of traffic layers, and the heading ranges permitted in each, can potentially be defined by an RL agent. Additionally, movement within the transition layers can also be further enhanced. For example, the implementation of several steps during climb/descent, the delay of the final approach to the main traffic lane, can reduce the likelihood of cruising and climbing/descending aircraft meeting in conflict. Finally, the research presented herein can be extended towards more competitive operational environments, in terms of differences in the performance limits, as well as preference for efficiency over safety.

Author Contributions

Conceptualisation M.R., J.E. and J.H.; software M.R., J.E. and J.H.; original draft preparation M.R.; review J.E. and J.H. All authors have read and agreed to the published version of the manuscript.

Funding

This research received no external funding.

Institutional Review Board Statement

Not applicable.

Informed Consent Statement

Not applicable.

Data Availability Statement

The data presented in this study are openly available: the implementation code can be accessed online at [22], the scenarios and result files are available at [23].

Conflicts of Interest

The authors declare no conflict of interest.

References

  1. Sesar Joint Undertaking. European Drones Outlook Study—Unlocking the Value for Europe; Technical Report; Sesar Joint Undertaking: Brussels, Belgium, 2016. [Google Scholar]
  2. Rakha, T.; Gorodetsky, A. Review of Unmanned Aerial System (UAS) applications in the built environment: Towards automated building inspection procedures using drones. Autom. Constr. 2018, 93, 252–264. [Google Scholar] [CrossRef]
  3. Besada, J.A.; Campana, I.; Bergesio, L.; Bernardos, A.M.; de Miguel, G. Drone Flight Planning for Safe Urban Operations: UTM Requirements and Tools. In Proceedings of the 2019 IEEE International Conference on Pervasive Computing and Communications Workshops (PerCom Workshops), Kyoto, Japan, 11–15 March 2019; pp. 924–930. [Google Scholar] [CrossRef]
  4. FAA. FAA Modernization and Reform Act of 2012, Conference Report; Technical Report; FAA: Washington, DC, USA, 2012. [Google Scholar]
  5. ICAO. ICAO Circular 328—Unmanned Aircraft Systems (UAS); Technical Report; ICAO: Montreal, QC, Canada, 2011. [Google Scholar]
  6. Walraven, E.; Spaan, M.T.; Bakker, B. Traffic flow optimization: A reinforcement learning approach. Eng. Appl. Artif. Intell. 2016, 52, 203–212. [Google Scholar] [CrossRef]
  7. Li, Z.; Liu, P.; Xu, C.; Duan, H.; Wang, W. Reinforcement Learning-Based Variable Speed Limit Control Strategy to Reduce Traffic Congestion at Freeway Recurrent Bottlenecks. IEEE Trans. Intell. Transp. Syst. 2017, 18, 3204–3217. [Google Scholar] [CrossRef]
  8. Doole, M.; Ellerbroek, J.; Hoekstra, J. Drone Delivery: Urban airspace traffic density estimation. In Proceedings of the Eighth SESAR Innovation Days, Salzburg, Austria, 3–7 December 2018. [Google Scholar]
  9. Agogino, A.K.; Tumer, K. A multiagent approach to managing air traffic flow. Auton. Agents Multi-Agent Syst. 2012, 24, 1–25. [Google Scholar] [CrossRef] [Green Version]
  10. Yang, L.C.; Kuchar, J.K. Using intent information in probabilistic conflict analysis. In Proceedings of the 1998 AIAA Guidance, Navigation, and Control Conference and Exhibit, Boston, MA, USA, 10–12 August 1998; American Institute of Aeronautics and Astronautics Inc.: Reston, VA, USA, 1998; pp. 797–806. [Google Scholar] [CrossRef] [Green Version]
  11. Hwang, I.; Seah, C.E. Intent-Based Probabilistic Conflict Detection for the Next Generation Air Transportation System. Proc. IEEE 2008, 96, 2040–2059. [Google Scholar] [CrossRef]
  12. Porretta, M.; Schuster, W.; Majumdar, A.; Ochieng, W. Strategic conflict detection and resolution using aircraft intent information. J. Navig. 2010, 63, 61–88. [Google Scholar] [CrossRef]
  13. Liu, W.; Hwang, I. Probabilistic trajectory prediction and conflict detection for air traffic control. J. Guid. Control Dyn. 2011, 34, 1779–1789. [Google Scholar] [CrossRef]
  14. Liu, Y.; Li, X.R. Intent Based Trajectory Prediction by Multiple Model Prediction and Smoothing. In Proceedings of the AIAA Guidance, Navigation, and Control Conference, Kissimmee, FL, USA, 5–9 January 2015. [Google Scholar] [CrossRef]
  15. Dam, S.V.; Mulder, M.; Paassen, R. The Use of Intent Information in an Airborne Self-Separation Assistance Display Design. In Proceedings of the AIAA Guidance, Navigation, and Control Conference, Chicago, IL, USA, 10–13 August 2009; American Institute of Aeronautics and Astronautics: Reston, VA, USA, 2009. [Google Scholar] [CrossRef] [Green Version]
  16. Velasco, G.; Borst, C.; Ellerbroek, J.; van Paassen, M.M.; Mulder, M. The Use of Intent Information in Conflict Detection and Resolution Models Based on Dynamic Velocity Obstacles. IEEE Trans. Intell. Transp. Syst. 2015, 16, 2297–2302. [Google Scholar] [CrossRef]
  17. d’Engelbronner, J.; Borst, C.; Ellerbroek, J.; Van Paassen, M.; Mulder, M. Solution-space–based analysis of dynamic air traffic controller workload. J. Aircr. 2015, 52, 1146–1160. [Google Scholar] [CrossRef]
  18. Ribeiro, M.; Ellerbroek, J.; Hoekstra, J. Review of conflict resolution methods for manned and unmanned aviation. Aerospace 2020, 7, 79. [Google Scholar] [CrossRef]
  19. Lillicrap, T.P.; Hunt, J.J.; Pritzel, A.; Heess, N.; Erez, T.; Tassa, Y.; Silver, D.; Wierstra, D. Continuous control with deep reinforcement learning. In Proceedings of the 4th International Conference on Learning Representations (IICLR), San Juan, Puerto Rico, 2–4 May 2016. [Google Scholar]
  20. Henderson, P.; Islam, R.; Bachman, P.; Pineau, J.; Precup, D.; Meger, D. Deep Reinforcement Learning that Matters. arXiv 2017, arXiv:1709.06560. [Google Scholar]
  21. Hoekstra, J.; Ellerbroek, J. BlueSky ATC Simulator Project: An Open Data and Open Source Approach. In Proceedings of the 7th International Conference on Research in Air Transportation, Philadelphia, PA, USA; 2016. [Google Scholar]
  22. Ellerbroek, J.; ProfHoekstra; MJRibeiroTUDelft. Bluesky Implementation: Underlying the Publication “Velocity Obstacle Based Conflict Avoidance in Urban Environment with Variable Speed Limit”; Zenodo: Geneve, Switzerland, 2021. [Google Scholar]
  23. Ribeiro, M.; Ellerbroek, J.; Hoekstra, J. Bluesky Data: Underlying the Publication “Velocity Obstacle Based Conflict Avoidance in Urban Environment with Variable Speed Limit”; 4TU.ResearchData: Delft, The Netherlands, 2021. [Google Scholar]
  24. Boeing, G. OSMnx: New methods for acquiring, constructing, analyzing, and visualizing complex street networks. Comput. Environ. Urban Syst. 2017, 65, 126–139. [Google Scholar] [CrossRef] [Green Version]
  25. Irvine, R. The GEARS Conflict Resolution Algorithm; Technical Report; EUROCONTROL: Paris, France, 1997. [Google Scholar] [CrossRef] [Green Version]
  26. Park, J.; Cho, N. Collision Avoidance of Hexacopter UAV Based on LiDAR Data in Dynamic Environment. Remote Sens. 2020, 12, 975. [Google Scholar] [CrossRef] [Green Version]
  27. Zheng, L.; Zhang, P.; Tan, J.; Li, F. The Obstacle Detection Method of UAV Based on 2D Lidar. IEEE Access 2019, 7, 163437–163448. [Google Scholar] [CrossRef]
  28. Yang, L.; Han, K.; Borst, C.; Mulder, M. Impact of aircraft speed heterogeneity on contingent flow control in 4D en-route operation. Transp. Res. Part C Emerg. Technol. 2020, 119, 102746. [Google Scholar] [CrossRef]
  29. Sunil, E.; Hoekstra, J.; Ellerbroek, J.; Bussink, F.; Nieuwenhuisen, D.; Vidosavljevic, A.; Kern, S. Metropolis: Relating Airspace Structure and Capacity for Extreme Traffic Densities. In Proceedings of the 11th USA/EUROPE Air Traffic Management R&D Seminar (ATM Seminar 2015), Lisbon, Portugal, 23–26 June 2015. [Google Scholar]
  30. Doole, M.; Ellerbroek, J.; Knoop, V.L.; Hoekstra, J.M. Constrained Urban Airspace Design for Large-Scale Drone-Based Delivery Traffic. Aerospace 2021, 8, 38. [Google Scholar] [CrossRef]
  31. Samir Labib, N.; Danoy, G.; Musial, J.; Brust, M.R.; Bouvry, P. Internet of Unmanned Aerial Vehicles—A Multilayer Low-Altitude Airspace Model for Distributed UAV Traffic Management. Sensors 2019, 19, 4779. [Google Scholar] [CrossRef] [PubMed] [Green Version]
  32. Cho, J.; Yoon, Y. Extraction and Interpretation of Geometrical and Topological Properties of Urban Airspace for UAS Operations; Korea Advanced Institution of Science and Technology: Daejeon, Korea, 2019. [Google Scholar]
  33. Tra, M.; Sunil, E.; Ellerbroek, J.; Hoekstra, J. Modeling the Intrinsic Safety of Unstructured and Layered Airspace Designs. In Proceedings of the Twelfth USA/Europe Air Traffic Management Research and Development Seminar, Seattle, WA, USA, 27–30 June 2017. [Google Scholar]
  34. Fiorini, P.; Shiller, Z. Motion Planning in Dynamic Environments Using Velocity Obstacles. Int. J. Robot. Res. 1998, 17, 760–772. [Google Scholar] [CrossRef]
  35. Chakravarthy, A.; Ghose, D. Obstacle avoidance in a dynamic environment: A collision cone approach. IEEE Trans. Syst. Man Cybern. Part A Syst. Humans 1998, 28, 562–574. [Google Scholar] [CrossRef] [Green Version]
  36. Balasooriyan, S. Multi-Aircraft Conflict Resolution Using Velocity Obstacles. Master’s Thesis, Delft University of Technology, Delft, The Netherlands, 2017. [Google Scholar]
  37. Haines, E. Point in Polygon Strategies. In Graphics Gems IV; Academic Press Professional, Inc.: Point Pleasant, NJ, USA, 1994; pp. 24–46. [Google Scholar]
  38. Gawinowski, G.; Garcia, J.L.; Guerreau, R.; Weber, R.; Brochard, M. ERASMUS: A new path for 4D trajectory-based enablers to reduce the traffic complexity. In Proceedings of the 2007 IEEE/AIAA 26th Digital Avionics Systems Conference, Dallas, TX, USA, 21–25 October 2007. [Google Scholar] [CrossRef]
  39. Chaloulos, G.; Crück, E.; Lygeros, J. A simulation based study of subliminal control for air traffic management. Transp. Res. Part C Emerg. Technol. 2010, 18, 963–974. [Google Scholar] [CrossRef]
  40. Vela, A.; Solak, S.; Singhose, W.; Clarke, J.P. A Mixed Integer Program for Flight-Level Assignment and Speed Control for Conflict Resolution. In Proceedings of the 48h IEEE Conference on Decision and Control (CDC) held jointly with 2009 28th Chinese Control Conference, Shanghai, China, 15–18 December 2010; pp. 5219–5226. [Google Scholar] [CrossRef]
  41. Huang, R.; Liang, H.; Zhao, P.; Yu, B.; Geng, X. Intent-Estimation- and Motion-Model-Based Collision Avoidance Method for Autonomous Vehicles in Urban Environments. Appl. Sci. 2017, 7, 457. [Google Scholar] [CrossRef] [Green Version]
  42. Lawrence, J.D. A Catalog of Special Plane Curves; Guilford Publications: New York, NY, USA, 2013. [Google Scholar]
  43. Wu, Y.; Tan, H.; Qin, L.; Ran, B. Differential variable speed limits control for freeway recurrent bottlenecks via deep actor-critic algorithm. Transp. Res. Part C Emerg. Technol. 2020, 117, 102649. [Google Scholar] [CrossRef]
  44. Brittain, M.; Yang, X.; Wei, P. A Deep Multi-Agent Reinforcement Learning Approach to Autonomous Separation Assurance. arXiv 2020, arXiv:2003.08353. [Google Scholar]
  45. Li, S.; Egorov, M.; Kochenderfer, M. Optimizing Collision Avoidance in Dense Airspace using Deep Reinforcement Learning. arXiv 2019, arXiv:1912.10146. [Google Scholar]
  46. Ribeiro, M.; Ellerbroek, J.; Hoekstra, J. Determining Optimal Conflict Avoidance Manoeuvres At High Densities With Reinforcement Learning. In Proceedings of the Tenth SESAR Innovation Days, Virtual Conference, 7–10 December 2020. [Google Scholar]
  47. Vonk, B. Exploring Reinforcement Learning Methods for Autonomous Sequencing and Spacing of Aircraft. Master’s Thesis, Delft University of Technology, Delft, The Netherlands, 2019. [Google Scholar]
  48. Van der Hoff, D. A Multi-Agent Learning Approach to Air Traffic Control. Master’s Thesis, Delft University of Technology, Delft, The Netherlands, 2020. [Google Scholar]
  49. Cruciol, L.L.; de Arruda, A.C.; Weigang, L.; Li, L.; Crespo, A.M. Reward functions for learning to control in air traffic flow management. Transp. Res. Part C Emerg. Technol. 2013, 35, 141–155. [Google Scholar] [CrossRef]
  50. Lowe, R.; Wu, Y.; Tamar, A.; Harb, J.; Abbeel, P.; Mordatch, I. Multi-Agent Actor-Critic for Mixed Cooperative-Competitive Environments. In Proceedings of the 31st Conference on Neural Information Processing Systems (NIPS 2017), Long Beach, CA, USA, 4–9 December 2017. [Google Scholar]
  51. Matignon, L.; Laurent, G.J.; Le Fort-Piat, N. Independent reinforcement learners in cooperative Markov games: A survey regarding coordination problems. Knowl. Eng. Rev. 2012, 27, 1–31. [Google Scholar] [CrossRef] [Green Version]
  52. Duan, Y.; Chen, X.; Edu, C.X.B.; Schulman, J.; Abbeel, P.; Edu, P.B. Benchmarking Deep Reinforcement Learning for Continuous Control. arXiv 2016, arXiv:1604.06778. [Google Scholar]
  53. Islam, R.; Henderson, P.; Gomrokchi, M.; Precup, D. Reproducibility of Benchmarked Deep Reinforcement Learning Tasks for Continuous Control. arXiv 2017, arXiv:1708.04133. [Google Scholar]
  54. Glorot, X.; Bordes, A.; Bengio, Y. Deep Sparse Rectifier Neural Networks. In Proceedings of the Fourteenth International Conference on Artificial Intelligence and Statistics (AISTATS), Fort Lauderdale, FL, USA, 11–13 April 2011. [Google Scholar]
  55. Uhlenbeck, G.E.; Ornstein, L.S. On the theory of the Brownian motion. Phys. Rev. 1930, 36, 823–841. [Google Scholar] [CrossRef]
  56. Papageorgiou, M.; Kosmatopoulos, E.; Papamichail, I. Effects of Variable Speed Limits on Motorway Traffic Flow. Transp. Res. Rec. 2008, 2047, 37–48. [Google Scholar] [CrossRef]
  57. Golding, R. Metrics to Characterize Dense Airspace Traffic; Technical Report 004; Altiscope: Sunnyvale, CA, USA, 2018. [Google Scholar]
  58. Alejo, D.; Conde, R.; Cobano, J.; Ollero, A. Multi-UAV collision avoidance with separation assurance under uncertainties. In Proceedings of the 2009 IEEE International Conference on Mechatronics, Malaga, Spain, 14–17 April 2009. [Google Scholar] [CrossRef]
  59. Bilimoria, K.; Sheth, K.; Lee, H.; Grabbe, S. Performance evaluation of airborne separation assurance for free flight. In Proceedings of the 18th Applied Aerodynamics Conference, Denver, CO, USA, 14–17 August 2000; American Institute of Aeronautics and Astronautics: Reston, VA, USA, 2000. [Google Scholar] [CrossRef] [Green Version]
  60. Ribeiro, M.; Ellerbroek, J.; Hoekstra, J. The Effect of Intent on Conflict Detection and Resolution at High Traffic Densities. In Proceedings of the International Conference on Air Transportation (ICRAT), Virtual Format, 15 September 2020. [Google Scholar]
  61. Weikl, S.; Bogenberger, K.; Bertini, R.L. Traffic Management Effects of Variable Speed Limit System on a German Autobahn: Empirical Assessment Before and After System Implementation. Transp. Res. Rec. 2013, 2380, 48–60. [Google Scholar] [CrossRef] [Green Version]
  62. Mott MacDonald. Atm Monitoring and Evaluation, 4-Lane Variable Mandatory Speed Limits 12 Month Report (Primary and Secondary Indicators); Technical Report; European Commission; Directorate General Energy and Transport: London, UK, 2008. [Google Scholar]
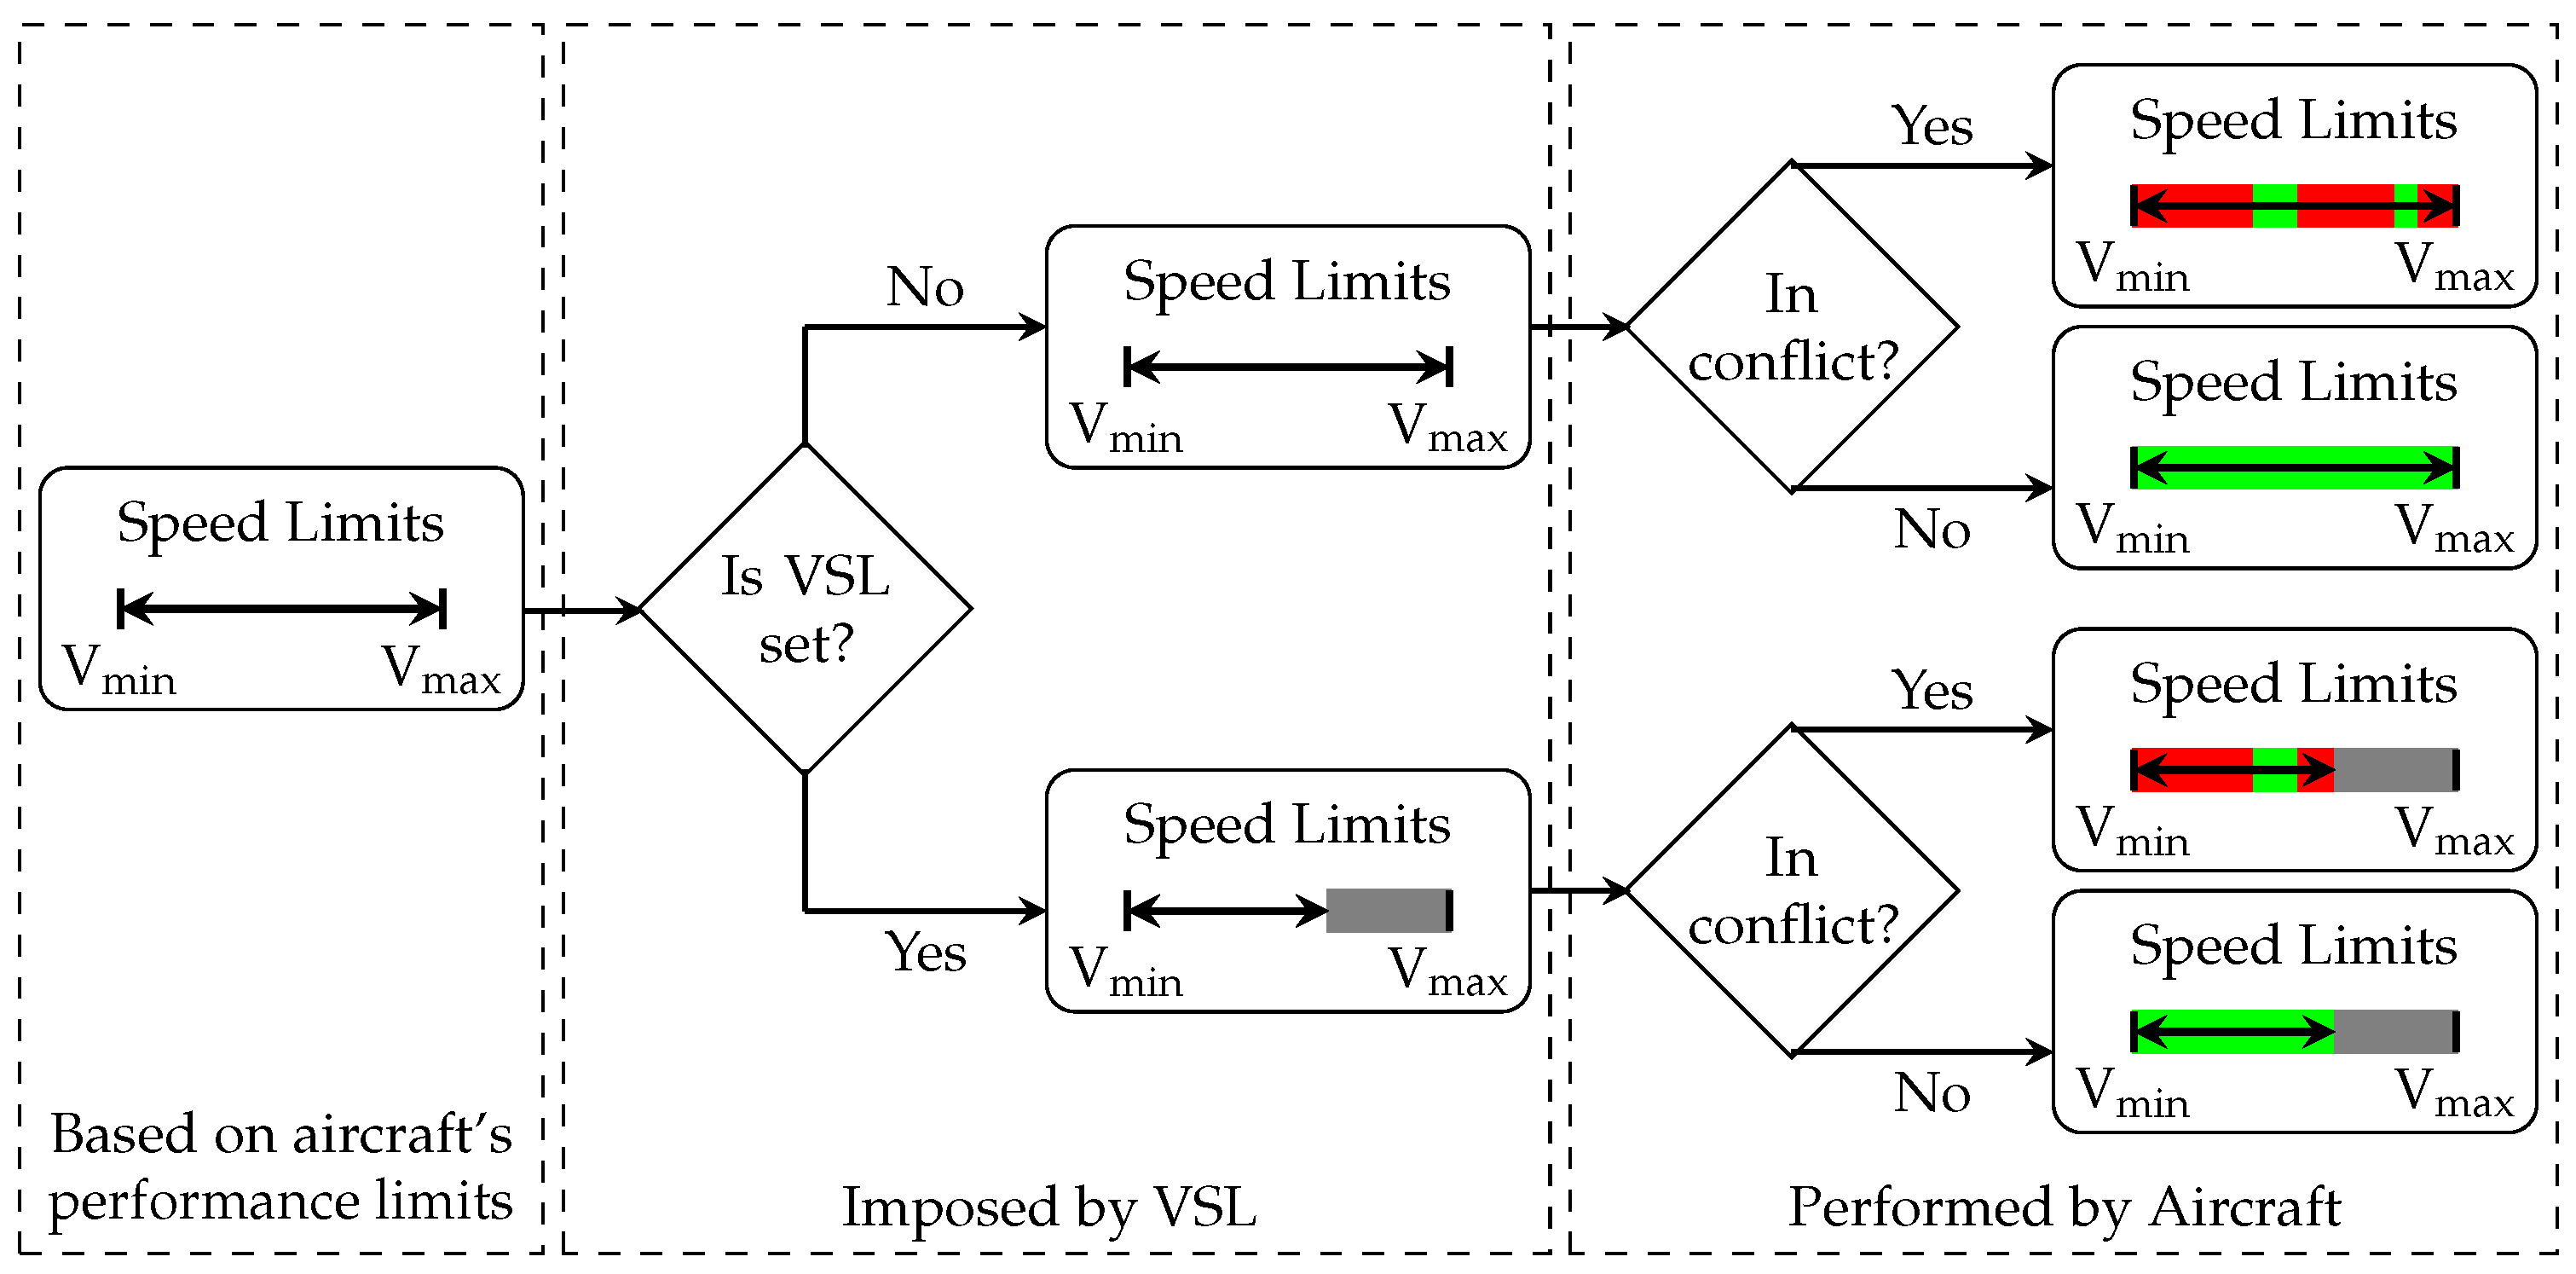
Figure 1. Prioritisation of rules over speed choice. Hard limits are first imposed by an aircraft’s performance limits. If set, the variable (maximum) speed limit (VSL) must be respected. Additionally, aircraft perform conflict avoidance. A conflict-free (displayed in green), allowed speed value is then picked.
Aerospace 08 00093 g001
Figure 2. Urban setting used in this work. Data obtained from Open Street Map [24].
Aerospace 08 00093 g002
Figure 3. Geometry of a turn between waypoints. No wind assumed.
Aerospace 08 00093 g003
Figure 4. Speed changes employed by an aircraft in preparation for a turn.
Aerospace 08 00093 g004
Figure 5. View of the different altitude layers used in the experimental simulations performed in this study.
Aerospace 08 00093 g005
Figure 6. Representation of a velocity obstacle (VO) imposed by intruder B, and the relationship between a circular velocity vector set and the protected zone (PZ) [16]. By adding the intruder’s velocity, the collision cone (CC) is translated forming the intruder’s VO.
Aerospace 08 00093 g006
Figure 7. Representation of speed-only based conflict resolution using the solution space diagram (SSD) method.
Aerospace 08 00093 g007
Figure 8. Shape of the VO depending on whether state or intent information is used to propagate the current trajectory of the intruder into the future.
Aerospace 08 00093 g008
Figure 9. VO built with intent information. The VO circles are centered at v c ( t c ) .
Aerospace 08 00093 g009
Figure 10. Sub-sections forming a road constructed around the movement of a climbing/descending aircraft. The reinforcement learning agent sets a maximum speed limit for the entrance/exit section.
Aerospace 08 00093 g010
Figure 11. Two entrance/exit sections cannot follow each other. At least one control section must be set between the two.
Aerospace 08 00093 g011
Figure 12. Number of calls to the RL agent per episode during training.
Aerospace 08 00093 g012
Figure 13. Total number of losses of separation per episode during the training of the RL agent.
Aerospace 08 00093 g013
Figure 14. All maximum speeds set in one training episode.
Aerospace 08 00093 g014
Figure 15. Average reward per action obtained by the RL agent in one training episode.
Aerospace 08 00093 g015
Figure 16. Total number of pairwise conflicts per episodes during the training of the RL agent.
Aerospace 08 00093 g016
Figure 17. Mean total number of pairwise conflicts.
Aerospace 08 00093 g017
Figure 18. Total time in conflict per aircraft.
Aerospace 08 00093 g018
Figure 19. Mean total number of losses of separation.
Aerospace 08 00093 g019
Figure 20. Intrusion severity rate.
Aerospace 08 00093 g020
Figure 21. Relative speed between pairs of aircraft during losses of separation with multiple layers.
Aerospace 08 00093 g021
Figure 22. Schematic view of the altitude at which losses of separation (LoSs) occur with multiple layers. The size of the points varies between a maximum value of 182 and a minimum value of 3 LoSs.
Aerospace 08 00093 g022
Figure 23. Domino effect parameter values.
Aerospace 08 00093 g023
Figure 24. Flight time per aircraft without CR.
Aerospace 08 00093 g024
Figure 25. Flight path per aircraft without CR.
Aerospace 08 00093 g025
Figure 26. Mean number of instantaneous aircraft per timestep throughout the simulation scenarios.
Aerospace 08 00093 g026
Figure 27. Extra flight time per aircraft.
Aerospace 08 00093 g027
Table 1. Quadrant rules per altitude layer.
1st Layer2nd Layer3rd Layer4th Layer5th Layer6th Layer
Aerospace 08 00093 i001 Aerospace 08 00093 i002 Aerospace 08 00093 i003 Aerospace 08 00093 i004 Aerospace 08 00093 i005 Aerospace 08 00093 i006
Auxiliary LayerMain LayersAuxiliary Layer
Aerospace 08 00093 i007
Altitude
Table 2. Traffic volume used in the experimental simulations.
ParameterLowMediumHigh
Traffic density [ a c /10,000 NM 2 ]81,247162,495243,744
Number of instantaneous aircraft [-]255075
Number of spawned aircraft [-]4539261366
Publisher’s Note: MDPI stays neutral with regard to jurisdictional claims in published maps and institutional affiliations.