Abstract
The problem of flight delay prediction is approached most often by predicting a delay class or value. However, the aviation industry can benefit greatly from probabilistic delay predictions on an individual flight basis, as these give insight into the uncertainty of the delay predictions. Therefore, in this study, two probabilistic forecasting algorithms, Mixture Density Networks and Random Forest regression, are applied to predict flight delays at a European airport. The algorithms estimate well the distribution of arrival and departure flight delays with a Mean Absolute Error of less than 15 min. To illustrate the utility of the estimated delay distributions, we integrate these probabilistic predictions into a probabilistic flight-to-gate assignment problem. The objective of this problem is to increase the robustness of flight-to-gate assignments. Considering probabilistic delay predictions, our proposed flight-to-gate assignment model reduces the number of conflicted aircraft by up to 74% when compared to a deterministic flight-to-gate assignment model. In general, the results illustrate the utility of considering probabilistic forecasting for robust airport operations’ optimization.
    1. Introduction
On-time flight performance is an important measure of the service quality of airports and airlines. During the period 2013–2019, while the number of flights in Europe increased by 16% [], the average departure delay of European flights increased by 41% []. Such an increase has a negative impact on the airports’ and airlines’ quality of service. As Eurocontrol forecasts the number of flights to be restored to 2019 levels by 2024 [], large increases in delay can be expected again in the future. Accurate flight delay predictions will therefore remain central to support airports and airlines in offering a high-quality service.
In the past years, several machine learning algorithms have been proposed to predict flight delays. Most studies predict flight delays using (i) binary classifiers (delayed/not delayed flight), (ii) multi-class classifiers (multiple delay classes), or (iii) regression (estimating the delay value).
Binary classifiers are proposed in Kim et al. [] where recurrent neural networks are used to predict flight delays at airports in the US. The prediction horizon is several hours before the operation. Using this approach, delays are predicted with an accuracy of 0.87 (i.e., the rate of correctly predicted samples). In Lambelho et al. [], binary classification of flight delays and cancellations is performed for Heathrow airport using three different classification algorithms: LightGBM, Multilayer Perceptron, and Random Forests. The authors predict flight delays and cancellations with an average F1-score of 0.56 using the LightGBM classifier. In Choi et al. [], the authors propose binary classifiers for flight delays assuming a prediction horizon of five days and one day. The obtained flight delay predictions have an accuracy of 0.80 using the Random Forest classifier.
Multi-class departure delay predictions are obtained in Alonso and Loureiro [] for Porto airport for a prediction horizon of several hours before the operation. In Chen and Li [], flight delay is predicted using multi-label Random Forests classification. Flight delay values from routes flown by an aircraft earlier in a day are used to predict flight delay for the routes flown later in a day.
In Kalliguddi and Leboulluec [], flight delays are estimated hours ahead of the operation using machine learning algorithms that perform regression. The authors consider delay states of the aviation network as features, in addition to flight schedule-related features. The results obtained using Random Forests have a root mean square error (RMSE) of 12.5 min. It is also shown that the delay states have the largest effect on on-time performance. In Manna et al. [], the obtained flight delay predictions have an RMSE of 8.2 min and 10.7 min when considering departure delays and arrival delays, respectively. In Yu et al. [], a deep-belief network is used to predict flight delays several hours before the operation. A reduction of 21% in the RMSE is obtained compared to the best benchmark algorithm, the k-Nearest Neighbours. Thiagarajan et al. [] propose both classification and regression algorithms to predict flight delay. Here, the regression approach using Random Forests produced an RMSE of 8.7 min. Ayhan et al. [] and Shao et al. [] introduce features based on flight trajectory data. Ayhan et al. [] predict flight delays for domestic flights in Spain within an RMSE of 4 min. A range of prediction algorithms is employed, of which AdaBoost performs best. Shao et al. [] find that the features based on trajectory data contribute the greatest to the predictive accuracy, and the best result is found using LightGBM.
The classification and regression results obtained in these studies generate an estimate for individual flight delay in the form of a class or a point estimate, respectively. The estimates are often evaluated using metrics based on the confusion matrix and metrics such as RMSE/MAE (Mean Absolute Error), respectively. In order to plan flight operations such as gate allocation or runway allocation in a robust manner, however, it is necessary to also consider the uncertainty of the predicted delays of individual flights. Such measures are not included when obtaining delay classes or point estimates, nor can they be derived directly from the commonly used evaluation metrics. Therefore, in this paper, we propose to estimate the probability distribution of flight delays on an individual flight basis, using machine learning algorithms. Such probability distributions can support planners to robustly plan flight operations.
Very few studies estimate the probability distribution of flight delays. The common approach is to fit historical delays to one probability distribution which is assumed to be representative for all considered flights [,,,,]. In Mueller and Chatterji [] and Novianingsih and Hadianti [], airport and airline delay distributions are obtained by fitting historical delays to classes of probability distributions. Tu et al. [] introduce a more complex model, where the national airspace delay distribution is assumed to be the sum of seasonal trends, a daily propagation pattern and random residuals. To the best of our knowledge, however, no studies have been performed that estimate a probability distribution for flight delays on an individual flight basis, i.e., probabilistic flight delay prediction.
To illustrate how probabilistic flight delay prediction on an individual basis can be useful for operation optimisation, we integrate these predictions into a probabilistic flight-to-gate assignment problem (FGAP). Şeker and Noyan [] were among the first ones to incorporate probabilistic effects in their solution method for the FGAP. The authors evaluate the robustness of FGA’s by modelling the departure and arrival flight delays as random variables. A set of scenarios is created, each with random disruptions to flight arrival and departure times. The number of gate conflicts is then minimized for each scenario. The random disruptions utilized in this study model flight delay; however, they are not based on delay predictions. The results of this study provide a general overview of the robustness of the used optimization methods, but it is not possible to directly evaluate the robustness using the actual delay experienced at the airport. Van Schaijk and Visser [] and L’Ortye et al. [] determine the probability that a given arriving/departing aircraft is present at a gate, for a range of time values. This is called the aircraft presence probability, and it is obtained using a regression model based on historic data of aircraft gate presence, using the features ’airline identity’ and ’origin/destination region of flight.’ The aircraft presence probability of an arriving aircraft is in fact the cumulative distribution function (cdf) of the aircraft’s delay. The presence probability of a departing aircraft is the inverted cdf of the aircraft’s delay. Using these presence probabilities, robust flight-to-gate assignments are developed. The approach taken by Van Schaijk and Visser [] makes use of only two features, leading to a limited variation in the constructed presence probabilities. It is possible to use many more features of the flights that need to be assigned to gates, leading to a more accurate prediction of their gate presence.
In this paper, we obtain probabilistic delay predictions for flights arriving and departing at a regional reference airport. To the best of our knowledge, this is the first time probabilistic predictions for flight delays on an individual flight basis are obtained. We employ two machine learning algorithms: Mixture Density Networks and Random Forest regression. We consider features based on flight schedules available at the reference airport, as well as the weather conditions recorded at the origin/destination airport of the flights. Suitable metrics are proposed to evaluate the performance of the considered machine learning algorithms, which estimate delay probability density functions (pdf). Furthermore, the impact of the choice of hyperparameters for these algorithms is analyzed.
The use of the obtained probabilistic predictions is demonstrated in the context of a robust flight-to-gate assignment problem. First, probabilistic predictions for arrival flight delays and departure flight delays are obtained using machine learning algorithms. These predictions are then used to estimate the probability of an aircraft being present at the reference airport. Lastly, these presence probabilities are integrated into a probabilistic FGAP model that aims to robustly assign arriving/departing aircraft to the gates of the reference airport. Here, robustness refers to the assignment model’s ability to account for potential flight delays. The results show that, by considering flight delay predictions, flights are allocated to gates more robustly relative to the case when no information about flight delays is considered.
The remainder of this paper is structured as follows: in Section 2, the datasets, machine learning algorithms for probabilistic flight delay predictions, and several performance metrics for these algorithms are introduced. The prediction results are then presented and discussed. In Section 3, the obtained probabilistic flight delay predictions are integrated into a flight-to-gate assignment model. Both a deterministic and a probabilistic model for the optimization of the FGAP are formulated. The models are both applied on a short and long term, and the results regarding the robustness of the obtained solutions are presented and discussed. In Section 4, conclusions and recommendations for future work are provided.
2. Data-Driven Probabilistic Flight Delay Predictions
In this section, we obtain probabilistic flight delay predictions using two machine learning algorithms, Mixture Density Networks and Random Forests Regression.
2.1. Data Description
2.1.1. Flight Schedule Dataset
For this analysis, flight schedules available at Rotterdam The Hague Airport (RTM) between 1 January 2017 and 29 February 2020 are considered. In total, 17,365 departing and 17,336 arriving flights are considered. These flights arrive from and depart to 42 airports across Europe and North Africa. The shortest route included is to London City Airport (LCY), and the longest to Tenerife South Airport (TFS), with an average of 1300 km. Figure 1 shows a map indicating all airports to or from which flights depart or arrive. The delay distribution of these flights is shown in Figure 2. The departing flights have an average absolute delay of 17.8 min with a standard deviation of 25.1 min, and the arriving flights have an average absolute delay of 15.4 min with a standard deviation of 26.4 min. Here, the delay is considered to be the positive or negative time difference from the scheduled time of arrival/departure.
      
    
    Figure 1.
      Map of origin/destination airports for Rotterdam Airport during the period January 2017–February 2020.


    Figure 2.
      Histogram of the flight departure and arrival delays in the period January 2017–February 2020 at Rotterdam Airport.
  
2.1.2. Weather Dataset
Using [], we also consider the weather conditions, such as the temperature, pressure, and wind speed, measured at the origin/destination airport of all flights arriving/departing at RTM in the period 2017–2020. Measurements are available every 30 min.
2.2. Feature Selection
In this section, features are extracted and selected from the datasets described in Section 2.1. Feature selection is performed using the Pearson Correlation Coefficient. The correlation between any two features and the correlation between the features and the target (the flight delay) are calculated for a given training set. The features are selected as follows: for any two features that are correlated by more than the threshold value of 0.7, the feature that has the smallest correlation with the target variable is removed. Table 1 shows the features that have been selected for flight delay prediction. In Table 2, a description is provided for each of the selected features.
       
    
    Table 1.
    Feature encoding and selection for flight delay prediction.


    Table 2.
    Description of features selected for flight delay prediction.
  
The features Airport, Airline, Season, Time of day, Day of week, Day of month, Day of year, Airport latitude and longitude, Distance, Month, Year and Scheduled flights 2h and day are obtained or calculated from the flight schedule dataset. The feature Seats is derived from the aircraft type assigned to perform a flight. The features Temperature, Dewpoint, Visibility, Pressure, and Wind speed are obtained from the weather dataset.
The features are either categorical, time-related, or numerical. The categorical features are target encoded based on a binary delay threshold of 15 min. The encoded value of the sample feature is the delay rate of the category to which the sample belongs. For example: if 8 out of 20 samples flying on Tuesdays are more than 15 min delayed, all Tuesday flights are encoded with value 0.4 for the feature Day of the week. The time features are encoded using trigonometric functions to preserve the periodicity. Two features (sine and cosine) are extracted from every time feature. For example, the features Month sine and cosine are calculated using  and  for a given month m.
The remaining features are numerically encoded, i.e., the encoded value is the same as the original feature value. Note that the time features are both trigonometrically and numerically encoded. For example, the data field Day of the week yields the features Day of the week sine, Day of the week cosine, and Day of the week. The encoding method of every selected feature is denoted in Table 1. After encoding, all feature values are scaled to the interval  to eliminate undesired feature domination in neural network classifiers.
Table 1 shows that most features are selected for at least one of the departure/arrival pair, and that the trigonometrically encoded time features are selected more often than the non-encoded time features.
2.3. Machine-Learning Algorithms to Estimate the Probability Distribution of Flight Delays
Following feature selection, two algorithms are proposed to estimate the distribution of flight delays: Mixture Density Networks (MDN) and Random Forests regression (RFR). These algorithms belong to different classes of machine learning algorithms, neural networks, and decision trees, respectively.
2.3.1. Mixture Density Networks (MDNs)
A Mixture Density Network [] is a combination of a neural network and a Gaussian mixture model. Given feature values  of flight i, an MDN outputs the parameters for each Gaussian in the mixture: the weight , the mean , and the standard deviation . With these parameters, the probability density function  of the target variable , the flight delay, is determined. In general, the MDN is particularly suitable to estimate multimodal probability distributions [,,,,,,]. It is therefore able to predict a distribution with peaks at, for example, two separate likely delay values.
The flight delay probability distribution is constructed as the weighted sum of Gaussian distributions as follows: 


          where  is the probability distribution of delay value  given feature values  from flight sample i, while ,  and  are the weight, mean, and standard deviation of the  Gaussian component,  with m the total number of Gaussian components considered for the mixture.
For any given flight, the features obtained in Section 2.2 are the input to the MDN, while the parameters , , and  are the output of the MDN. Thus, there are  outputs of the MDN. The weights use a softmax activation function, and the standard deviations use an exponential activation function, while the means are unrestricted.
The neural network is trained using backpropagation, i.e, the network parameters, the weights and biases of each node are updated using an error function E, which is the negative logarithm of the likelihood that the model derived from the output of the current network gives rise to the training data []. This likelihood is the product of the likelihood of every data point, given the current network parameters. Formally [],


          where  is the total number of samples in the training set.
For every data point fed to the neural network, the derivatives of the error with respect to all network parameters are used to update the weights and biases of the network. Following training, the MDN is applied to a test set and multimodal probability distributions for the delay of each flight in the test set are estimated. The MDN method is illustrated schematically in Figure 3.
      
    
    Figure 3.
      Schematic representation of a Mixture Density Network: parameters for a multimodal Gaussian distribution are obtained using a Neural Network.
  
2.3.2. Random Forests Regression and Kernel Density Estimation
Random Forests regression (RFR) is a class of decision tree-based machine learning algorithms []. The regular RFR algorithm is an ensemble method that combines the results of a number of decision trees. When building each tree, a random subset of the feature values of each training data point is used to make branches. The algorithm outputs a point estimate for the target variable (flight delay) of every test sample by averaging the output values of all considered decision trees. However, for our analysis, we are interested in estimating the probability distribution for the delay of the given flight, rather than a point estimate.
In order to obtain the flight delay distribution of a flight in the test phase, the output values of the decision trees are not averaged, but collected, and a kernel density estimation (KDE) is performed []. A KDE results in a normalized probability density function. Two settings of the KDE are the kernel type and the bandwidth. In our analysis, a bandwidth of  is used to render the estimated distribution smooth. Gaussian kernels have been selected for their generality.
Random Forests regression is a well-established technique that has been applied in many research areas. However, there are very few examples of studies utilizing the algorithm to obtain probability distributions. Förster et al. [] use quantile values, obtained from Quantile Random Forests, to construct a right-continuous cumulative distribution function of aircraft’s time-to-fly from the turn onto the final approach course to the runway threshold. Schlosser et al. [] and Rahman et al. [] use Random Forests algorithms to obtain probability distributions for precipitation forecasts and drug sensitivity, respectively. Both studies make use of feature probability distributions estimated via maximum likelihood to make splitting decisions when constructing the decision trees. Stochastic variables are introduced during or before the growing of the decision trees. In contrast, in this study, the feature values and splitting decisions are kept deterministic throughout the Random Forests algorithm. In this way, the probability density function is estimated from deterministic feature values without the need for stochastic variables. Furthermore, the working of the original Random Forests regression algorithm need not be changed.
In Figure 4, an example of obtained probability distributions is shown for both methods. For both distributions, the actual delay value of the flight example is indicated.
      
    
    Figure 4.
      An example of probabilistic prediction curves obtained from MDN and RFR for departure flight samples. Blue vertical lines indicate actual sample delay, orange curves depict the probability distribution obtained using MDN, green bars the histogram of RFR estimators, and green curves the probability distribution obtained from this histogram by KDE.
  
2.4. Hyperparameter Tuning
The hyperparameters of the MDN and the RFR prediction algorithms have been optimized using a grid search. The hyperparameters leading to the lowest mean CRPS scores have been selected. Table 3 shows the selected hyperparameters and their search range. For MDN, a network with three hidden layers of 50 nodes is selected. The output layer of the network consists of 24 nodes, with which an 8-modal Gaussian distribution function is constructed. For RFR, 200 decision trees with a maximum depth of 10 layers are constructed. For every branch split, three out of four features are considered of at least seven training samples.
       
    
    Table 3.
    Hyperparameters for MDN and RFR.
  
2.5. Performance Metrics for Probabilistic Forecasting
As discussed before, many studies perform point estimate prediction on flight delays, such as [,,,]. The most pervasive metrics for point estimate prediction are the root mean square error (RMSE) and mean absolute error (MAE), measured between the actual point and the predicted point. In this study, probabilistic forecasting is performed. Thus, metrics such as the RMSE and MAE cannot be applied, since they cannot be used to compare an entire delay distribution with a point value for actual delay. In this paper, the following six metrics are proposed to evaluate the performance of the MDN and RFR algorithms.
2.5.1. Continuous Ranked Probability Score
Since our aim is to estimate probability distributions for flight delays, a metric is needed that evaluates these distributions. The algorithms aim to obtain a distribution centered on the actual flight delay value, with a small standard deviation. To measure the extent to which the probabilistic prediction algorithms are able to achieve this, the Continuous Ranked Probability Score (CRPS) [] is proposed. For an estimated flight delay probability distribution  and actual delay value , we define:


          where  is the cumulative distribution function of  and  is the Heaviside step function.
The CRPS is a generalization of the MAE for probabilistic predictions. It measures the deviation of the estimated delay cumulative distribution function from a step function at the actual delay value. This means that the CRPS attains the value 0 in the limit of a correct point prediction with absolute certainty. Since the CRPS is minimized if the model outputs the ideal distribution, the CRPS is a proper scoring rule. Therefore, it is an indication of both the sharpness and the calibration of the probabilistic forecast []. Figure 5 shows a case where the actual delay is 10 min, and includes examples of cumulative distributions with varying sharpness and calibration. Both a reduced sharpness and a reduced calibration in the distribution will increase the CRPS value. Since the CRPS is calculated for every flight in the test set, we introduce the metrics ‘CRPS mean’ and ‘CRPS std’, the mean and standard deviation of all CRPS values, respectively.
      
    
    Figure 5.
      Illustration of the relation between the shape of the delay cumulative distribution function and the Continuous Ranked Probability Score (CRPS). The step function at the actual delay value (green dotted) corresponds with a CRPS value of 0. An example of a cdf with nonzero CRPS is plotted in blue. The black dash-dotted and yellow dashed lines show the same cdf with reduced sharpness and calibration, respectively.
  
2.5.2. and
Since the RMSE and MAE are not suitable to assess an estimated flight delay distribution, we propose the variants  and , which are calculated by comparing the mean value of the estimated distribution against the actual delay value. Before introducing the formal notation of these metrics, it is necessary to define the mean value of the estimated distribution. For MDN, the mean is defined as the weighted average of the component means, i.e.,  is the distribution mean of flight sample i, with  and  the weight and mean of component j. When using RFR, the mean  is defined as the mean of the point estimates obtained from each decision tree. The distribution means are referred to as  with .
The  and  are then defined as:


The  and  are used to characterize the average deviation of the mean of the estimated distribution from the actual delay  and thus measure only the calibration of the distribution and not the sharpness.
2.5.3. Metrics Based on the Standard Deviation
For MDN, the standard deviation of a multimodal probability density function for a flight sample  is calculated as follows []:


          with  the weight,  the mean and  the standard deviation of component j.
For the RFR algorithm, the standard deviation of the delay distribution is calculated in a similar fashion: a Kernel Density Estimation can be considered a multimodal Gaussian as well. This Gaussian has equal weights , the RF regression point estimates as means and  as the standard deviation. This leads to the following expression for :


          with  the number of estimators used in the algorithm, and  the jth point estimate for the delay of flight sample i. The distribution standard deviations are referred to as  with . Having obtained the distribution standard deviations in Equations (7) and (8), we can introduce the two metrics based on these. The first metric is the sample average of the standard deviation:


          where  is the number of flights in the test set. In order to define the second metric, we first introduce : the fraction of samples for which the actual delay  lies within one standard deviation  from the distributional mean  of that sample. The second metric  is then defined as the average of this quantity over all  samples. It measures the ability of the probabilistic algorithm to predict a narrow delay distribution on or near the correct delay value. Together with the , it characterizes the spread of the estimated distribution and thus measures only the sharpness of the distribution and not the calibration. Formally,


          with


2.6. Results—Probabilistic Flight Delay Predictions
We analyze both departing and arriving flights. For both, train and test sets are constructed using a 5-fold Cross Validation. The MDN and RFR algorithms have been used to estimate the distribution of the arrival and departure flight delays. The use of weather measurements implies that the prediction horizon associated with these flight delay predictions is at most several days long. Table 4 shows the performance obtained using these algorithms.
       
    
    Table 4.
    Performance metrics for probabilistic flight delay prediction.
  
Table 4 shows that both MDN and RFR are able to predict departure and arrival delays within an average CRPS of 11 min. The RFR algorithm results in a smaller prediction error than the MDN algorithm. In addition, the delays of the arriving flights are predicted with larger error than those of the departing flights. This is explained by the fact that the bulk of the arriving flights has a considerably smaller delay than the bulk of the departing flights, as seen in Figure 2. Because the algorithms are trained mostly using arrival samples having a small delay, they have a decreased prediction performance for test samples with large delays. This decreased performance contributes greatly to the larger CRPS values.
Furthermore, Table 4 shows that the MDN algorithm predicts flight delays with a larger standard deviation than the RFR algorithm, and in turn the actual delay falls within this standard deviation more often. This is explained by the fact that the RFR algorithm produces a more narrow prediction curve than the MDN algorithm, on average.
2.7. Impact of the Choice of the Hyperparameters
In this section, the influence of the values of important hyperparameters on the probabilistic flight delay prediction performance is assessed. The focus lies on the ability of the algorithms to construct a representative delay distribution; therefore, the mean CRPS is used to quantify the performance.
An important hyperparameter of the MDN algorithm is the number of modes. A distribution with more modes allows for more complex shapes, while a distribution with only one mode corresponds to a regular Gaussian distribution. In Figure 6a, the performance of the MDN algorithm for a varying number of modes is shown. Using multiple modes leads to a better performance than using a regular Gaussian function. When adding more than three modes, this improvement stagnates.
      
    
    Figure 6.
      CRPS values obtained when varying hyperparameters in the MDN and RFR algorithms.
  
An important hyperparameter of the RFR algorithm is the maximum tree depth. A greater tree depth leads to a better distinction between different flights in the training set, but a tree depth that is too large can lead to overfitting. In that case, the error on the test set is not further reduced, while the computational time still increases. In Figure 6b, the performance of the RFR algorithm for varying values of the tree depth is shown. By analyzing a range of values between 10 and 30, it is found that a consistent performance is obtained from a max depth value of roughly 20.
3. Integrating Probabilistic Delay Predictions into the Flight-to-Gate Assignment Problem
At an airport, a daily recurring operation is to assign arriving/departing flights to a gate. This is known as the flight-to-gate assignment problem. The FGAP has been addressed extensively in literature []. An important quality of a given flight-to-gate assignment is its robustness. A greater robustness implies that, when faced with a disturbance (for example a flight is delayed), the model is able to handle this situation without introducing more disturbances. The aim of this section is to use the flight delay predictions obtained in Section 2 to obtain a robust flight-to-gate assignment. First, the FGAP is introduced, after which the flight delay predictions are integrated in this problem.
3.1. Mathematical Formulation of the Deterministic FGAP Model
In the past few decades, the FGAP has been modelled as a linear programming problem, having objectives such as the minimization of the number of towing procedures [], the minimization of passenger walking distance [], or obtaining robust flight-to-gate assignments by minimizing the number of gate conflicts [,,,,].
These optimization models use a set of scheduled flights with deterministic flight arrival and departure times as input. Let us first introduce the following deterministic FGAP model [].
Let N denote the set of n scheduled aircraft at the airport during a planning horizon, let M denote the set of m gates available at the airport, and let K denote the set of k time slots in the planning horizon. Let  denote the cost of assigning aircraft  to gate . Let  denote the following binary presence indicator:


The decision variables in this model are denoted as:


Then, the deterministic FGAP model is: 


In this problem, the assignment costs over the total assignment are minimized (see Equation (12)) under the following conditions: Constraint (13) enforces that any aircraft i scheduled to be at the airport at time slot t, is assigned to exactly one gate j. Constraint (14) ensures that at most one aircraft i is assigned to a gate j at any time slot t. Lastly, Constraint (15) makes sure that an aircraft i cannot switch gates during its presence at the airport.
In this paper, we consider a planning horizon of 24 h, separated in time slots. Every time slot consists of 5 min, therefore . The cost  is assumed to be equal to 1 for any combination of gate and aircraft.
3.2. Mathematical Formulation of the Probabilistic FGAP
In Section 3.1, the deterministic FGAP model was introduced. In this model, the aircraft presence is modelled by the binary, deterministic variable . In this section, we introduce a probabilistic FGAP model, where the variable  is replaced by a presence probability function  of an aircraft, i.e.,  is the probability that aircraft i is present at the airport at time slot t. In Van Schaijk and Visser [], this aircraft presence probability is estimated based on a statistical analysis of a set of historical flights. In contrast, in this study, the presence probability is obtained using the machine learning prediction algorithms in Section 2, which provide an estimate of the delay for each individual flight.
Constraint (14), which refers to a deterministic aircraft presence in the deterministic FGAP model, is replaced by []:


        where


        with r a maximum overlap probability threshold between any two aircraft assigned to the same gate j at any time slot t. In other words, instead of Constraint (14), which ensures in the deterministic FGAP model that at most one aircraft is assigned to a gate in a time slot, Constraint (16) in the probabilistic FGAP model ensures that the probability that two aircraft are assigned to the same gate does not exceed a maximum threshold r at any time slot. Constraint (16) considers the overlap probability between two aircraft. In the case that the probability that three or more aircraft that are assigned to the same gate at the same time slot exceeds r, the probabilistic FGAP model is solved iteratively: for any instance where the value of r is exceeded, the number of aircraft assigned to the respective gate and time slot is iteratively decremented [].
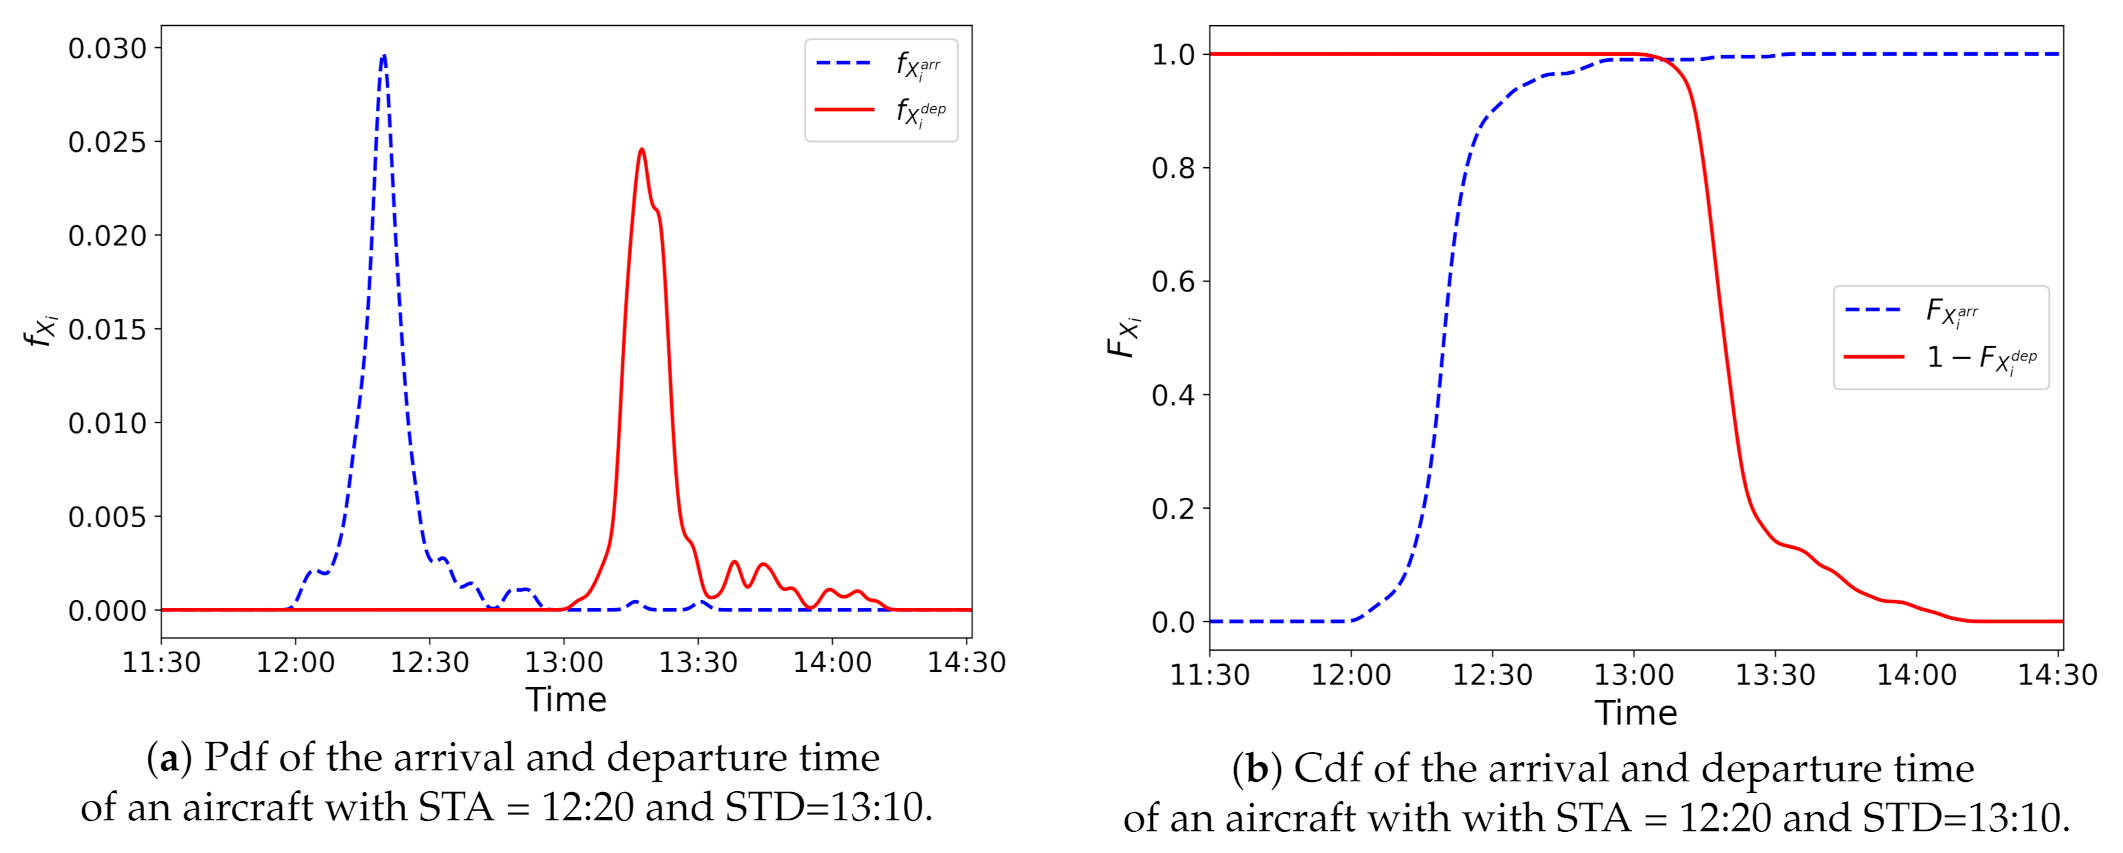
3.3. Aircraft Presence Probability Function
The aircraft presence probability function  is an input to the probabilistic FGAP model given in Equations (12), (13), (15) and (16).
Let  and  denote the arrival delay and departure delay of aircraft i. We determine the probability distributions of  and  using the machine learning algorithms introduced in Section 2. These distributions are further used to obtain the aircraft presence probability  as follows.
Let  and  be the scheduled times of arrival and departure of aircraft i. Then, the predicted arrival and departure times are  and , respectively. Let  and  denote the pdf of  and , respectively. Let  and  denote the cdf of  and , respectively. Figure 7a shows the pdf of the arrival and departure times of an aircraft with STA = 12:20 and STD = 13:10. The cdf of these arrival and departure times is given in Figure 7b.
      
    
    Figure 7.
      Probability density function and cumulative distribution functions of arrival and departure times for an example aircraft.
  
Using the cdf of  and , we determine  as follows:


        i.e., the aircraft presence probability  is calculated as the product of the probability that the aircraft has arrived and the probability that the aircraft has not yet departed, at time t. Figure 8 shows the aircraft presence probability  of an aircraft having STA = 12:20 and STD = 13:10, calculated using Equation (18).
      
    
    Figure 8.
      Aircraft presence probability () of an aircraft with STA = 12:20 and STD = 13:10.
  
If the aircraft has an overnight stay, i.e., does not arrive and depart at and from the reference airport on the same day, then the aircraft presence probability  is calculated as follows:
Case 1: The aircraft has stayed at the airport during the night before the day of interest, and departs at the beginning of the day. The aircraft presence probability is formed using only the cdf of departure time:


Case 2: The aircraft arrives at the airport in the evening and stays during the night after the day of interest. The aircraft presence probability is formed using only the cdf of arrival time:


Having obtained the aircraft presence probability  for an aircraft i and  for an aircraft j, we determine the overlap probability between aircraft i and j at timestep t as . Figure 9 shows an example of an overlap probability for aircrafts 1 and 2.
      
    
    Figure 9.
      Two aircraft presence probability functions with , , , , and their overlap probability.
  
3.4. Results—Flight-to-Gate-Assignment Integrating Probabilistic Flight Delay Predictions
In this section, the results obtained from the deterministic and probabilistic FGAP models introduced in Section 3.1 and Section 3.2 are outlined. The flight-to-gate assignment is generated at RTM airport for one day of operations: 14 July 2019. On this day, a total of 25 departures and 24 arrivals were scheduled. This day is referred to as the date of interest. The collection of all flights scheduled on the date of interest forms the test set for the delay predictions obtained using the machine learning algorithms in Section 2. All flights scheduled in the period from 1 January 2017–13 July 2019 form the training set of the machine learning algorithms. For our FGAP model, we assume eight gates, to which aircraft can be assigned.
Figure 10 shows the assignment of aircraft to gates for the date of interest obtained using the deterministic and probabilistic FGAP models. For the assignment obtained with the deterministic model, the presence as indicated by a solid line shows the period of time an aircraft occupies a gate, based on its scheduled arrival and departure time, i.e., based on . For the assignment obtained with the probabilistic FGAP model, the presence indicated by a solid line shows the period of time for which the aircraft presence probability  is larger than .
      
    
    Figure 10.
      Flight-to-gate assignments for 14 July 2019 obtained using the deterministic and probabilistic models.
  
Figure 10a shows that, in the flight-to-gate assignment obtained using the deterministic FGAP model, aircrafts 1 and 5 are assigned to the same gate (6). However, Figure 10b shows that, in the assignment obtained using the probabilistic FGAP model, aircrafts 1 and 5 are assigned to different gates (4 and 7). This is because the overlap probability between aircrafts 1 and 5 exceeds the maximum overlap probability threshold r. The same situation occurs for aircrafts 10 and 13.
The deterministic and probabilistic flight-to-gate assignments obtained are evaluated using the actual aircraft presence of the aircraft that flew on the date of interest. The actual aircraft presence is the time between the actual arrival and  and actual departure time and .
Figure 11 shows the aircraft presence probability  for all the aircraft assigned to gates 7 and 8 in the solution obtained using the probabilistic FGAP model, as shown in Figure 10b, versus the actual times the aircraft were present at gates 7 and 8. The overlap probability between any two aircraft is plotted in red. We consider a maximum permissible overlap probability .
      
    
    Figure 11.
      Flight-to-gate assignment for gates 7 and 8 on 14 July 2019 obtained using the probabilistic model with maximum overlap probability  combined with actual aircraft presence.
  
Following Constraint (16) in the probabilistic FGAP model, Figure 11 shows that the overlap probability of any two aircraft assigned to either gate 7 or 8 does not exceed the threshold r. The overlap probabilities between aircrafts 19 and 2 (at gate 8) and aircrafts 7 and 6 (at gate 7) are near the maximum overlap probability threshold r. The actual presence periods of these pairs of aircraft do not overlap, showing that a threshold of  was sufficient to prevent aircraft conflicts for these aircraft pairs. The actual presence periods of aircrafts 3 and 7 (at gate 7) do overlap, leading to an aircraft conflict. In this case, the conflict is caused by the fact that the predicted presence of aircraft 7 is later than the actual presence.
3.5. Results—Long Run Performance
In order to evaluate the long run performance of the deterministic and probabilistic FGAP model, they are applied to test data comprising a period of 30 days: from 14 July 2019 up to and including 12 August 2019. Two metrics are used for evaluation:
- An aircraft is defined as a conflicted aircraft if there is at least one time slot at which this aircraft and any other aircraft are both present at the same gate.
 - For the probabilistic FGAP model, a gate time slot is defined as a used gate time slot if there is an aircraft present at the gate at this time with a probability of more than —for the deterministic FGAP model, if there is an aircraft present at the gate at this time. Note that the maximum amount of used gate time slots is equal to .
 
The number of conflicted aircraft (CA) is a metric that measures the robustness of the FGA against delay when in operation. The number of used gate time slots (UGT) is a metric that measures to which extent an increase in robustness induces the need for a larger utilization of the available gate capacity.
To evaluate the flight-to-gate assignments, the means and standard deviations of these metrics over all testing days are used. The probabilistic FGAP model has been run with a range of possible conflict probabilities r, namely . Since the RFR algorithm has proven to yield the most accurate results in Section 2, RFR is used to obtain the presence probabilities. Table 5 summarizes the metric values obtained when evaluating the flight-to-gate assignments obtained from the deterministic and probabilistic FGAP model.
       
    
    Table 5.
    Metric results for the FGA’s at RTM airport, averaged over the days from 14 July until 12 August 2019 (30 days). The mean and standard deviation of the number of conflicted aircraft (CA) and the number of Used Gate Time slots (UGT) are shown for all methods. For reference, the total number of aircraft per day and the total number of available gate time slots are added. The presence probabilities were constructed using RFR.
  
When considering the probabilistic FGAP model, Table 5 shows that the average number of conflicted aircraft is smaller for all values of the maximum overlap probability threshold r, when compared to the deterministic FGAP model. The probabilistic FGAP model results in a more robust assignment than the deterministic FGAP model. The gate usage increases by 25%, while the number of conflicted aircraft is reduced by up to 74%. The number of conflicted aircraft does not decrease further when decreasing r further than . The maximum overlap probability threshold can thus be used by airport operators to adjust the robustness of the flight-to-gate assignment to the desired level.
4. Conclusions
In Section 2, two probabilistic forecasting algorithms, Mixture Density Networks and Random Forest regression, have been applied to the problem of flight delay prediction. The algorithms were trained using features extracted from a flight schedule dataset and a weather dataset, which contained data from Rotterdam The Hague Airport. Six performance metrics were defined to evaluate the probabilistic predictions, and the influence of the hyperparameters on the probabilistic prediction performance was investigated.
The results show that it is possible to estimate probability distributions for future flight delays within a CRPS of 11 min, several days in advance. The probabilistic flight delay predictions can provide airport coordinators not only with an estimate for the flight delays of all incoming flights, but also with a measure of the certainty of these estimates. In this way, better informed decisions regarding strategic flight schedules can be made, and on-time performance prediction can be improved.
Subsequently, in Section 3, the probabilistic predictions were used as input to a probabilistic linear programming model optimizing the flight-to-gate assignment problem, with the goal of increasing the robustness of this assignment. The results for the flight-to-gate assignment problem show a reduction of up to 74% in the average number of conflicted aircraft per day by incorporating the probabilistic flight delay predictions. The robustness can be adjusted by varying the maximum permissible overlap probability threshold in the probabilistic optimization model. The application of flight delay predictions to the flight-to-gate assignment problem provides a framework for increasing robustness for flight-to-gate operations at airports.
Future work includes the application of the introduced approach to increasing the robustness of flight-to-gate assignments to a larger airport, taking into account e.g., varying assignment costs and airline gate usage, and, secondly, the integration of probabilistic flight delay predictions into models for other airport operations. Examples are arrival/departure sequencing and scheduling, and electric taxiing operational planning.  
Author Contributions
Conceptualization, M.Z. and M.M.; Methodology, M.Z. and M.M.; Software, M.Z.; Formal analysis, M.Z.; Writing—original draft preparation, M.Z. and M.M.; Writing—review and editing, M.Z. and M.M.; Visualization, M.Z. All authors have read and agreed to the published version of the manuscript.
Funding
This research was funded by the European Regional Development Fund (ERDF) with Grant No. KVW-00235.
Institutional Review Board Statement
Not applicable.
Informed Consent Statement
Not applicable.
Data Availability Statement
Not applicable.
Conflicts of Interest
The authors declare no conflict of interest. The funders had no role in the design of the study; in the collection, analyses, or interpretation of data; in the writing of the manuscript, or in the decision to publish the results.
Abbreviations
The following abbreviations are used in this manuscript:
        
| RTM | Rotterdam The Hague Airport | 
| MDN | Mixture Density Networks | 
| RFR | Random Forests Regression | 
| FGAP | Flight-to-Gate Assignment Problem | 
| MAE | Mean Absolute Error | 
| RMSE | Root Mean Squared Error | 
| CRPS | Continuous Ranked Probability Score | 
| KDE | Kernel Density Estimation | 
| CA | Conflicted Aircraft | 
| UGT | Used Gate Time slots | 
| Probability Density Function | |
| cdf | Cumulative Distribution Function | 
References
- Eurocontrol Network Manager Annual Report. 2019. Available online: https://www.eurocontrol.int/publication/network-manager-annual-report-2019 (accessed on 24 February 2021).
 - Eurocontrol Annual Network Operations Report. 2019. Available online: https://www.eurocontrol.int/publication/annual-network-operations-report-2019 (accessed on 24 February 2021).
 - Eurocontrol Five-Year Forecast 2020–2024. Available online: https://www.eurocontrol.int/publication/eurocontrol-five-year-forecast-2020-2024 (accessed on 24 February 2021).
 - Kim, Y.J.; Choi, S.; Briceno, S.; Mavris, D. A deep learning approach to flight delay prediction. In Proceedings of the AIAA/IEEE Digital Avionics Systems Conference, Sacramento, CA, USA, 25–29 September 2016; pp. 1–6. [Google Scholar] [CrossRef]
 - Lambelho, M.; Mitici, M.; Pickup, S.; Marsden, A. Assessing strategic flight schedules at an airport using machine learning-based flight delay and cancellation predictions. J. Air Transp. Manag. 2020, 82, 101737. [Google Scholar] [CrossRef]
 - Choi, S.; Kim, Y.J.; Briceno, S.; Mavris, D. Prediction of Weather-Induced Airline Delays Based on Machine Learning Algorithms. In Proceedings of the IEEE/AIAA 35th Digital Avionics Systems Conference (DASC), Sacramento, CA, USA, 25–29 September 2016. [Google Scholar] [CrossRef]
 - Alonso, H.; Loureiro, A. Predicting flight departure delay at Porto Airport: A preliminary study. In Proceedings of the 2015 7th International Joint Conference on Computational Intelligence (IJCCI), Lisbon, Portugal, 12–14 November 2015; IEEE: New York, NY, USA, 2015; Volume 3, pp. 93–98. [Google Scholar]
 - Chen, J.; Li, M. Chained predictions of flight delay using machine learning. In Proceedings of the AIAA Scitech 2019 Forum, San Diego, CA, USA, 7–11 January 2019; pp. 1–25. [Google Scholar] [CrossRef]
 - Kalliguddi, A.M.; Leboulluec, A.K. Predictive Modeling of Aircraft Flight Delay. Univers. J. Manag. 2017, 5, 485–491. [Google Scholar] [CrossRef]
 - Manna, S.; Biswas, S.; Kundu, R.; Rakshit, S.; Gupta, P.; Barman, S. A statistical approach to predict flight delay using gradient boosted decision tree. In Proceedings of the ICCIDS 2017—International Conference on Computational Intelligence in Data Science, Chennai, India, 2–3 June 2018; pp. 1–5. [Google Scholar] [CrossRef]
 - Yu, B.; Guo, Z.; Asian, S.; Wang, H.; Chen, G. Flight delay prediction for commercial air transport: A deep learning approach. Transp. Res. Part E Logist. Transp. Rev. 2019, 125, 203–221. [Google Scholar] [CrossRef]
 - Thiagarajan, B.; Srinivasan, L.; Sharma, A.V.; Sreekanthan, D.; Vijayaraghavan, V. A machine learning approach for prediction of on-time performance of flights. In Proceedings of the AIAA/IEEE Digital Avionics Systems Conference, St. Petersburg, FL, USA, 17–21 September 2017; pp. 5–10. [Google Scholar] [CrossRef]
 - Ayhan, S.; Costas, P.; Samet, H. Predicting estimated time of arrival for commercial flights. In Proceedings of the 24th ACM SIGKDD International Conference on Knowledge Discovery & Data Mining, Data Mining, London, UK, 19–23 August 2018; pp. 33–42. [Google Scholar]
 - Shao, W.; Prabowo, A.; Zhao, S.; Tan, S.; Koniusz, P.; Chan, J.; Hei, X.; Feest, B.; Salim, F.D. Flight delay prediction using airport situational awareness map. In Proceedings of the GIS: Proceedings of the ACM International Symposium on Advances in Geographic Information Systems, Chicago, IL, USA, 5–8 November 2019; pp. 432–435. [Google Scholar] [CrossRef]
 - Mueller, E.; Chatterji, G. Analysis of aircraft arrival and departure delay characteristics. In Proceedings of the AIAA’s Aircraft Technology, Integration, and Operations (ATIO) 2002 Technical Forum, Los Angeles, CA, USA, 1–2 October 2002; p. 5866. [Google Scholar]
 - Novianingsih, K.; Hadianti, R. Modeling flight departure delay distributions. In Proceedings of the 2014 International Conference on Computer, Control, Informatics and Its Applications (IC3INA), Bandung, Indonesia, 21–23 October 2014; IEEE: New York, NY, USA, 2014; pp. 30–34. [Google Scholar]
 - Itoh, E.; Mitici, M. Queue-based modeling of the aircraft arrival process at a single airport. Aerospace 2019, 6, 103. [Google Scholar] [CrossRef]
 - Kleinbekman, I.C.; Mitici, M.; Wei, P. Rolling-Horizon Electric Vertical Takeoff and Landing Arrival Scheduling for On-Demand Urban Air Mobility. J. Aerosp. Inf. Syst. 2020, 17, 150–159. [Google Scholar] [CrossRef]
 - Tu, Y.; Ball, M.O.; Jank, W.S. Estimating flight departure delay distributions—A statistical approach with long-term trend and short-term pattern. J. Am. Stat. Assoc. 2008, 103, 112–125. [Google Scholar] [CrossRef]
 - Şeker, M.; Noyan, N. Stochastic optimization models for the airport gate assignment problem. Transp. Res. Part E Logist. Transp. Rev. 2012, 48, 438–459. [Google Scholar] [CrossRef]
 - Van Schaijk, O.R.; Visser, H.G. Robust flight-to-gate assignment using flight presence probabilities. Transp. Plan. Technol. 2017, 40, 928–945. [Google Scholar] [CrossRef]
 - L’Ortye, J.; Mitici, M.; Visser, H.G. Robust flight-to-gate assignment with landside capacity constraints. Transp. Plan. Technol. 2021, 44, 1–22. [Google Scholar] [CrossRef]
 - Iowa State University. ASOS-AWOS-METAR Data Download. 2020. Available online: https://mesonet.agron.iastate.edu/request/download.phtml (accessed on 1 March 2020).
 - Bishop, C.M. Mixture Density Networks. 1994. Available online: http://publications.aston.ac.uk/id/eprint/373/ (accessed on 14 July 2020).
 - Schuster, M. Better Generative Models for Sequential Data Problems: Bidirectional Recurrent Mixture Density Networks. In Proceedings of the Advances in Neural Information Processing Systems, Denver, CO, USA, 29 November–4 December 1999; pp. 589–595. [Google Scholar]
 - Zen, H.; Senior, A. Deep mixture density networks for acoustic modeling in statistical parametric speech synthesis. In Proceedings of the 2014 IEEE International Conference on Acoustics, Speech and Signal Processing (ICASSP); IEEE: New York, NY, USA, 2014; pp. 3844–3848. [Google Scholar]
 - Xu, J.; Rahmatizadeh, R.; Bölöni, L.; Turgut, D. Real-time prediction of taxi demand using recurrent neural networks. IEEE Trans. Intell. Transp. Syst. 2017, 19, 2572–2581. [Google Scholar] [CrossRef]
 - Carney, M.; Cunningham, P.; Dowling, J.; Lee, C. Predicting Probability Distributions for Surf Height Using an Ensemble of Mixture Density Networks. In Proceedings of the 22nd international conference on Machine learning, Bonn, Germany, 7–11 August 2005. [Google Scholar]
 - Vossen, J.; Feron, B.; Monti, A. Probabilistic Forecasting of Household Electrical Load Using Artificial Neural Networks. In Proceedings of the 2018 IEEE International Conference on Probabilistic Methods Applied to Power Systems (PMAPS), Boise, ID, USA, 24–28 June 2018; pp. 1–6. [Google Scholar]
 - Felder, M.; Kaifel, A.; Graves, A. Wind power prediction using mixture density recurrent neural networks. Eur. Wind Energy Conf. Exhib. 2010, 5, 3417–3424. [Google Scholar]
 - Zhang, J.; Yan, J.; Infield, D.; Liu, Y.; Lien, F.s. Short-term forecasting and uncertainty analysis of wind turbine power based on long short-term memory network and Gaussian mixture model. Appl. Energy 2019, 241, 229–244. [Google Scholar] [CrossRef]
 - Breiman, L. Random forests. Mach. Learn. 2001, 45, 5–32. [Google Scholar] [CrossRef]
 - Zhang, L.; Xie, L.; Han, Q.; Wang, Z.; Huang, C. Probability Density Forecasting of Wind Speed Based on Quantile Regression and Kernel Density Estimation. Energies 2020, 13, 6125. [Google Scholar] [CrossRef]
 - Förster, S.; Schultz, M.; Fricke, H. Probabilistic Prediction of Separation Buffer to Compensate for the Closing Effect on Final Approach. Aerospace 2021, 8, 29. [Google Scholar] [CrossRef]
 - Schlosser, L.; Hothorn, T.; Stauffer, R.; Zeileis, A. Distributional regression forests for probabilistic precipitation forecasting in complex terrain. arXiv 2018, arXiv:1804.02921. [Google Scholar] [CrossRef]
 - Rahman, R.; Haider, S.; Ghosh, S.; Pal, R. Design of probabilistic random forests with applications to anticancer drug sensitivity prediction. Cancer Inform. 2015, 14, CIN-S30794. [Google Scholar] [CrossRef]
 - Matheson, J.E.; Winkler, R.L. Scoring rules for continuous probability distributions. Manag. Sci. 1976, 22, 1087–1096. [Google Scholar] [CrossRef]
 - Gneiting, T.; Katzfuss, M. Probabilistic forecasting. Annu. Rev. Stat. Its Appl. 2014, 1, 125–151. [Google Scholar] [CrossRef]
 - Daş, G.S.; Gzara, F.; Stützle, T. A review on airport gate assignment problems: Single versus multi objective approaches. Omega 2020, 92, 102146. [Google Scholar] [CrossRef]
 - Ascó, A. Steady State Evolutionary Algorithm and Operators for the Airport Gate Assignment Problem. Int. J. Adv. Robot Automn. 2019, 4, 24. [Google Scholar] [CrossRef]
 - Mangoubi, R.S. A Linear Programming Solution to the Gate Assignment Problem. 1980. Available online: https://dspace.mit.edu/handle/1721.1/67926 (accessed on 29 August 2020).
 - Yu, C.; Zhang, D.; Lau, H.Y. MIP-based heuristics for solving robust gate assignment problems. Comput. Ind. Eng. 2016, 93, 171–191. [Google Scholar] [CrossRef]
 - Kim, S.H.; Feron, E.; Clarke, J.P.; Marzuoli, A.; Delahaye, D. Airport gate scheduling for passengers, aircraft, and operations. J. Air Transp. 2017, 25, 109–114. [Google Scholar] [CrossRef]
 
Publisher’s Note: MDPI stays neutral with regard to jurisdictional claims in published maps and institutional affiliations.  | 
© 2021 by the authors. Licensee MDPI, Basel, Switzerland. This article is an open access article distributed under the terms and conditions of the Creative Commons Attribution (CC BY) license (https://creativecommons.org/licenses/by/4.0/).