Article

Experimental Heat Loads for Electrothermal Anti-Icing and De-Icing on UAVs

by
Richard Hann
1,2,*,
Adriana Enache
3,4,
Mikkel Cornelius Nielsen
2,
Bård Nagy Stovner
2,
Jeroen van Beeck
4,
Tor Arne Johansen
1 and
Kasper Trolle Borup
2
1
Centre for Autonomous Marine Operations and Systems, Department of Engineering Cybernetics, Norwegian University of Science and Technology, 7491 Trondheim, Norway
2
UBIQ Aerospace, 7011 Trondheim, Norway
3
Aero-Thermo-Mechanics Department, Faculty of Applied Sciences, Universitè Libre de Bruxelles, 1050 Brussels, Belgium
4
Environmental and Applied Fluid Dynamics Department, Von Karman Institute for Fluid Dynamics, 1650 Sint-Genesius-Rode, Belgium
*
Author to whom correspondence should be addressed.
Aerospace 2021, 8(3), 83; https://doi.org/10.3390/aerospace8030083
Submission received: 29 September 2020 / Revised: 9 March 2021 / Accepted: 12 March 2021 / Published: 18 March 2021
(This article belongs to the Special Issue Deicing and Anti-Icing of Aircraft (Volume II))

Abstract

:
Atmospheric in-flight icing on unmanned aerial vehicles (UAVs) is a significant hazard. UAVs that are not equipped with ice protection systems are usually limited to operations within visual line of sight or to weather conditions without icing risk. As many military and commercial UAV missions require flights beyond visual line of sight and into adverse weather conditions, energy-efficient ice protection systems are required. In this experimental study, two electro-thermal ice protection systems for fixed-wing UAVs were tested. One system was operated in anti-icing and de-icing mode, and the other system was designed as a parting strip de-icing system. Experiments were conducted in an icing wind tunnel facility for varying icing conditions at low Reynolds numbers. A parametric study over the ice shedding time was used to identify the most energy-efficient operation mode. The results showed that longer intercycle durations led to higher efficiencies and that de-icing with a parting strip was superior compared to anti-icing and de-icing without a parting strip. These findings are relevant for the development of energy-efficient systems in the future.

1. Introduction

In manned aviation, the history of in-flight icing research dates back to the 1940s [1]. For unmanned aerial vehicles (UAVs), icing research has a much shorter history and can be considered an emerging research field. Although the first analysis and reports of at mospheric icing on UAVs date back to the 1990s [2], the research in this area has only recently gained momentum [3]. The reason UAV icing is becoming a trending topic is partly linked to the rise of commercial applications of UAV technologies [4]. In particular, small and medium-sized fixed-wing UAVs with wingspans of a few meters are in the focus of new business opportunities. Examples for the application of such UAVs are package deliveries, search and rescue, environmental monitoring, and agriculture [4]. In addition, UAV technology is adapted by many defense forces around the world [5]. Many UAV missions require operations of unmanned aircraft in adverse weather conditions [6]. One of the main barriers to achieving an all-weather capability of UAVs is to mitigate the risk of atmospheric in-flight icing [3].
Atmospheric icing, or in-cloud icing, occurs when an aircraft travels through a cloud containing supercooled liquid droplets that freeze upon impact with the airframe [1]. The resulting ice accretions on the airframe have several hazardous effects: clogging of pitot tubes, adding weight, reducing propeller thrust, and degrading aerodynamic performance [7,8]. Ice that forms on the leading-edge of lifting surfaces changes the airfoil geometry and leads to a decrease in lift, increase in drag, and a higher stalling risk [9].
There are several key differences between icing on manned and unmanned aircraft. An overview of the special technical and operational challenges of UAVs in icing conditions is given in [3]. Differences are for example related to airframe size, velocity, meteorological environments, mission objectives, propulsion type, and more. One important difference between manned and unmanned icing is the disparity in the Reynolds number regime. While manned aircraft typically operate at high Reynolds numbers (Re = 107–108), most UAVs fly at significantly lower Reynolds numbers (Re = 105–106). This difference in the Reynolds number regime can have a significant impact on icing processes [10]. It is therefore important that dedicated research for icing matter on UAVs is conducted at low Reynolds numbers.
Ice protection systems (IPSs) mitigate the adverse effects of ice on aircraft and are a relatively new technology on UAVs [3]. Electrothermal IPSs are one type of system that can actively mitigate the hazards of icing and allow aircraft to operate in all-weather conditions. The advantage of such systems is that they are lightweight and a mature technology. Other active IPS systems that may be suitable for UAVs rely on mechanical or chemical (freezing point depressants) principles for ice protection. Passive systems are an emerging technology that aim to use special surfaces to reduce or prevent ice accretions.
An IPS can generally be operated in two different modes [11]: anti-icing and de-icing. In anti-icing mode, the surface of the airfoil is heated continuously to avoid any ice accretion at any time [12]. In de-icing mode, the surface is heated periodically, allowing for ice to build up in between the heating cycles. This intercycle ice is removed from the airframe by two processes [13,14]. First, ice at the interface to the surface is melted, resulting in a liquid water layer. Second, ice is shed from the airframe with the aid of the aerodynamic forces. The ice shedding efficiency is mainly depending on the geometry of the ice shape and the airspeed [15]. The energy amount required for de-icing is typically lower compared to anti-icing, but the intercycle ice generates additional drag [16].
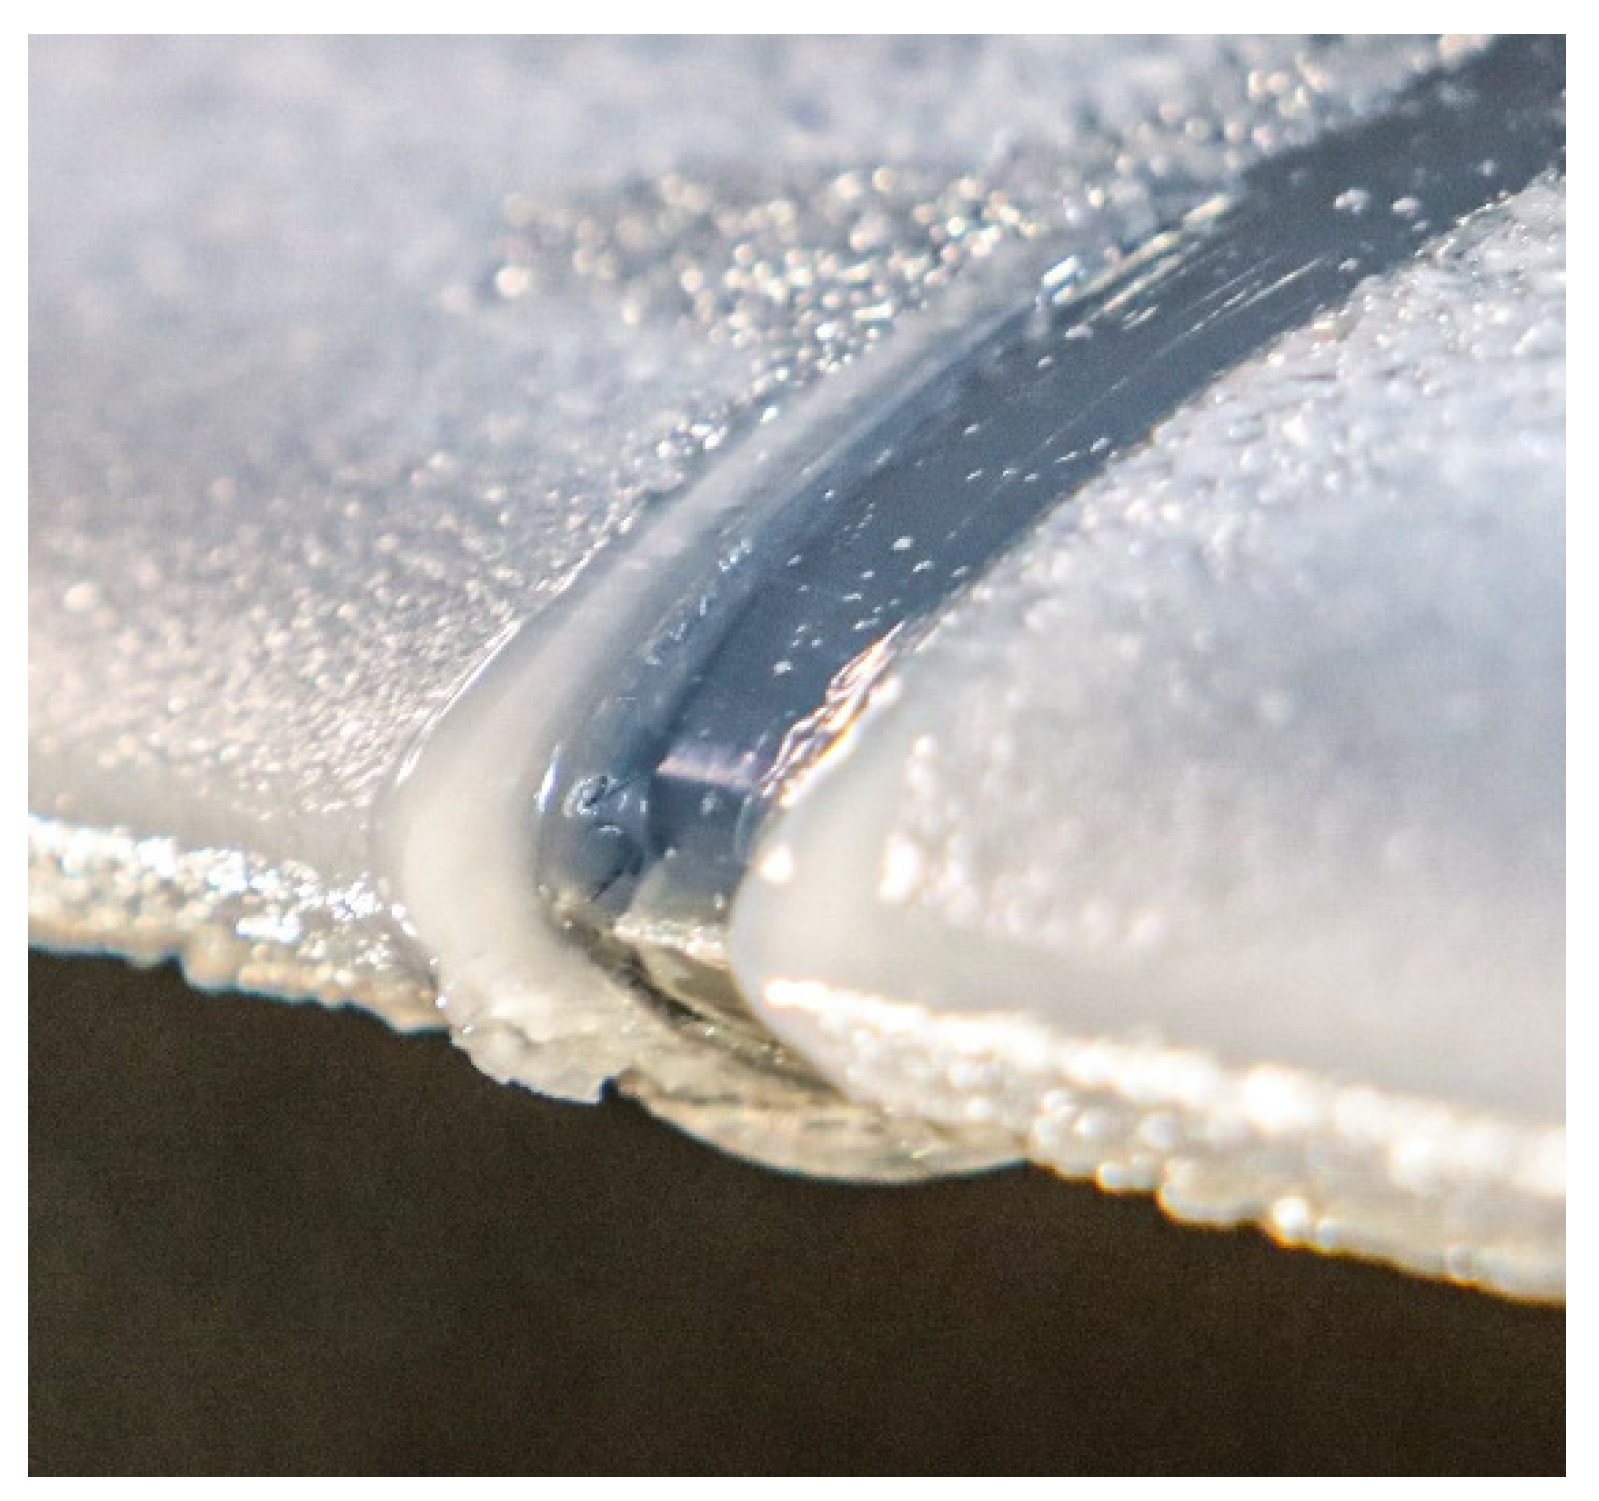
A parting strip (PS) is a special heating zone that is continuously heated and can be used to reduce the required energy for de-icing [11]. Without a parting strip, the entire leading-edge will be covered by ice (Figure 1). A parting strip located near the stagnation point at the leading-edge will separate the ice into an upper and a lower part (Figure 2). This separation increases the aerodynamic forces on the ice (Figure 3) and consequently increases ice shedding efficiency. The gap has a size of typically 2 to 3 mm.
There are several special design requirements for UAV IPSs [3]. Most importantly, the systems need to be lightweight and energy-efficient. Electrothermal systems are well suited for UAVs since they are mature, lightweight, and can easily be retrofitted to existing airframes [17,18,19,20,21]. Energy-efficiency is, however, a central challenge for electrothermal systems, as they require relatively high amounts of energy, compared to other IPSs like chemical or mechanical systems [13]. The energy used for ice protection is energy lost for the propulsion system—using an electrothermal IPS consequently reduces the range and endurance of the UAV. Icephobic coatings can reduce the ice adhesion forces and are a relatively new technology that is currently under research [22]. In the future, these systems may be especially energy-efficient in combination with an active IPS [23].
Electrothermal systems for UAVs must be carefully designed to minimize the required heat to operate the system. The goal must be to run an IPS with the minimum required heat loads for each specific icing condition. To achieve this, a good understanding of the underlying physical processes of anti-icing and de-icing is required. In particular, the influence and interlinkage of icing and IPS parameters on the required heat loads are of significance for the design of energy-efficient systems.
D·ICE is an electrothermal IPS that has been developed at the Centre for Autonomous Marine Operations and Systems at the Norwegian University of Science and Technology (NTNU AMOS) and commercialized by UBIQ Aerospace. The technology is based on an electrothermal heating system and an ice detection algorithm using thermal signals [19]. The systems use heating zones made of carbon fibre fabrics.
In this study, two prototypes of the D·ICE system were tested in the icing wind tunnel facility at the Technical Research Centre of Finland (VTT) during fall 2019. This study aimed to determine the required heat loads for anti-icing and de-icing for a selection of meteorological icing conditions. De-icing loads for two IPS layouts (conventional and parting strip) were compared. A parametric study over the ice shedding time was conducted for both configurations in order to better understand the effect of certain parameters on the de-icing efficiency. The experiments were conducted at low Reynolds numbers (Re = 8–9 × 10⁵) that are typical for small to medium-sized fixed-wing UAVs.

2. Methods

2.1. Test Setup

The VTT icing wind tunnel [24] is an open-loop wind tunnel (Figure 4) situated inside a large climate test chamber [25]. The tunnel was originally designed for investigations of wind turbine icing at low velocities, up to a maximum airspeed of v = 50 m/s. The internal test section has a size of 0.65 × 0.65 × 1.0 m. The icing wind tunnel facility can operate in the temperature range of T = −25 … +30 °C. A 3 × 3 spray nozzle grid generates a droplet cloud with a liquid water content range of LWC = 0.1 … 1.0 g/m³ and a median (droplet) volume diameter range of MVD = 12 … 30 μm.
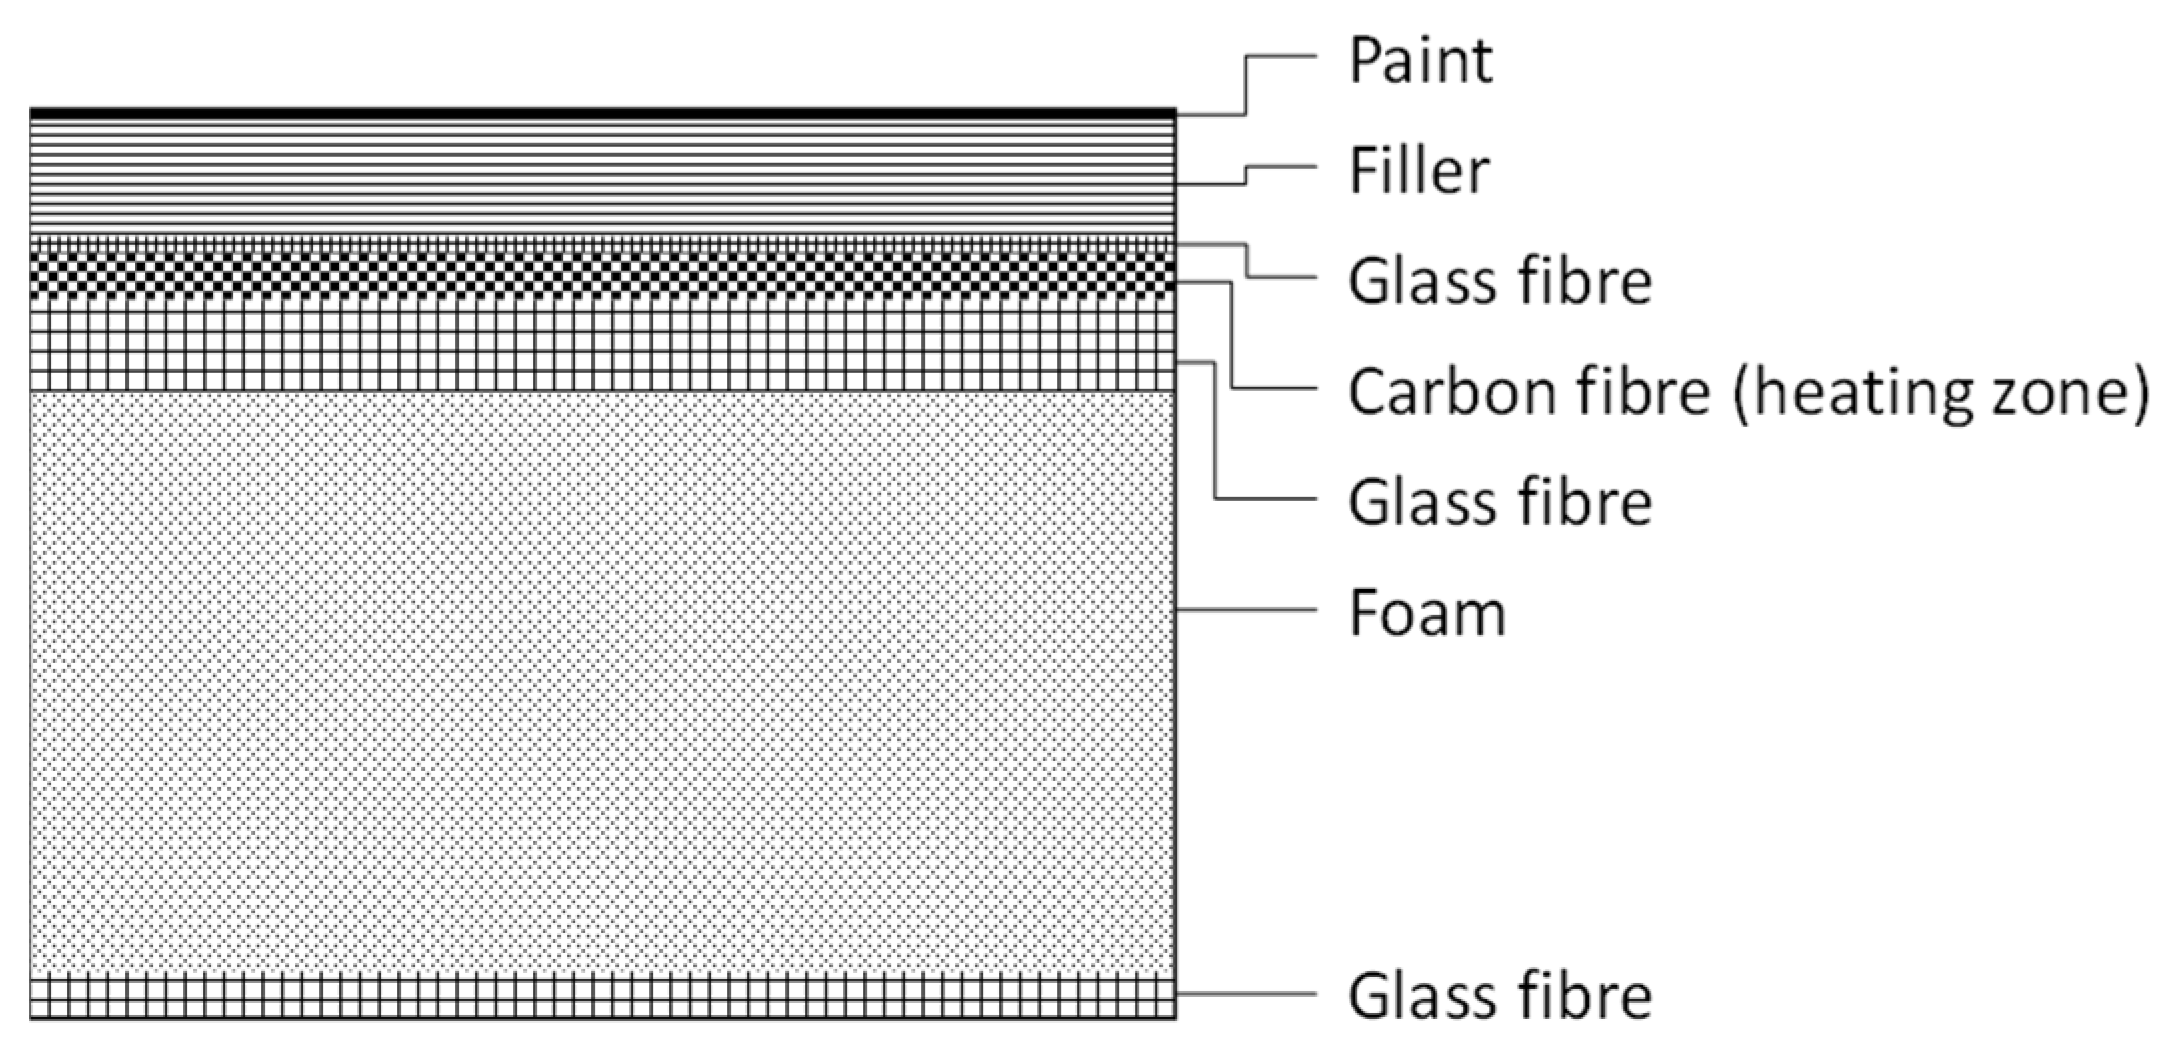
The test wing is a rectangular wing with a chord c = 0.45 m and a span b = 0.65 m. The wing is based on the RG-15 airfoil, which is a low-Reynolds airfoil specifically designed for UAVs and model aircraft. The wing was manufactured from fibre-reinforced epoxy. In this study, we placed the wing at the end of the tunnel for better accessibility to the IPS during testing (Figure 4). The rectangular wing spans the entire test section, and therefore the results are representative of a 2D IPS model. The electrothermal heating for the IPS was supplied by carbon-fibre heating zones that were integrated into the wing structure (Figure 5). Power was supplied and monitored for each zone individually. Power delivery to the heating was regulated via a control board using pulse-width modulation (PWM) [19].
Two D·ICE prototypes were used in this study: a conventional design and a parting strip design. The conventional design (Figure 3a) consisted of one primary heating-zone extending over the leading edge, with a total width of 5 cm. A secondary heating-zone with a width of 5 cm was located on the upper and lower side of the airfoil. The parting strip (Figure 3b) design had two primary zones at the leading edge, each with a width of 2.5 cm and two secondary zones with a width of 5 cm each. A thin heating element acting as a parting strip was located between the two primary zones.
Icing conditions were chosen to represent in-cloud icing environments that can be expected during typical UAV operations [3,26]. These conditions can be considered moderately severe conditions.

2.2. Anti-Icing

This study aims to determine the minimum required heat loads for anti-icing and de-icing. For anti-icing, the minimum required load was determined by iteratively reducing the power to the heating system until the point when ice accretions became visually observable on the heated surfaces. The tests were conducted on a wing with a conventional IPS design. A flowchart of the iterative procedure is shown in Figure 6. The process started with a heating load qstart that was high enough that in the first step no ice accretion occurred. The value is then halved repeatedly until a heat flux was found where ice occurs. The subsequent heat load was chosen as the mean between the load where ice occurs (qlow) and the load where no ice occurred (qhigh). The procedure continued until the difference between the two loads became smaller than a limit (qlimit ≈ 0.3 kW/m2). In this study, the limit was determined by the smallest step size of the power control unit. This method was applied for the conditions specified in Table 1. Each point was repeated at least two times to verify repeatability.

2.3. De-Icing

For de-icing, the situation is more complex, as there are a total of three parameters that can be adjusted: the heat load during the heating cycle qde-ice, the duration of the de-icing cycle tde-ice, and the intercycle time between heating cycles tintercycle, time in which ice accretes on the airfoil. To determine the optimal combination of these, a parameter study has been performed for the conditions specified in Table 2. In these tests, the de-icing load qde-ice and the intercycle time tintercycle were set and the resulting de-icing time tde-ice was then measured manually. The de-icing time was defined as the duration from the moment the heating was turned on until the moment when ice started visually shedding from the wing. Furthermore, the effect of the angle of attack and airspeed on shedding times was investigated.

2.4. Measurement Errors

An error propagation analysis was performed to estimate the measurement uncertainty for all the physical parameters presented in this study. The analysis accounts for random errors which are caused by unpredictable variations in the measurement system [27]. In these experiments, the considered random error sources were the human reading of instrumentation (the stopwatch reading for de-icing time measurements and caliper readings of ice thickness) and the precision of the measuring instrumentation. Systematic errors are considered negligible in this analysis, as several procedures were followed to reduce them (keeping the measuring instrumentation at testing conditions to avoid thermal influences or using two operators and stopwatches for shedding time measurements). To reduce random errors, several test repetitions in similar experimental conditions were conducted. The results presented in this study are the averaged values of generally three repetitions (in a few cases this number was reduced to two due to testing time constraints). Each repetition was an independent observation of the studied experimental condition. The estimation of random errors was reduced to a computation of uncertainty of the mean value, assuming a normal distribution of the errors (as a physical phenomenon is studied [28]), and statistical independence of the measurements.
Given the small number of samples, the Student’s t-distribution was employed to obtain an estimation of the error in the mean. The calculation considered the number of samples and the standard deviation of the data points multiplied by Student’s t-factor [27], for a 90% confidence interval. The choice of 90% confidence interval was considered to give sufficiently accurate error estimation as the present study aims to compare the performance of several de-icing solutions and to show a proof of concept of the techniques.
The described errors were added to form the measurement’s uncertainty, depicted in figures in absolute values by error bars, and reported in percentages of the measured values as following: the imposed temperature relative uncertainty ranged between ~2 and 10% for temperature values of −10 to −2 °C, respectively; the relative uncertainty of the airfoil’s angle of attack was estimated to ~1% for values of 0° to 8°, and the wind speed uncertainty varied in the range of ~4 to 10% for values of 25 to 10 m/s. These uncertainties are based on the precision of the experimental set-up.
For the anti-icing tests, the heat flux uncertainties extended between ~10 and 45% for measured values of 8 to 1.4 kW/m2, respectively, while for ice thickness the uncertainty ranged between ~5 and 25% for measured values of 13 to 1.4 mm, respectively. Regarding the de-icing experiments, the applied heat flux was imposed in a range of ~8 to 28 kW/m2 with a relative uncertainty of 3 to ~0.5. The measurement uncertainty of ice shedding time generally varied between ~4 and 42% as the measured values ranged between 80 and 5 s, respectively. One case was an exception, where the relative uncertainty of the shedding time was estimated at 125% (parting-strip de-icing at −2 °C ± 10%, 17.6 kW/m2 ± 3%). The considered contributing factors to this high uncertainty were a combination of low measured values (within 6 to 9 s) where factoring in for human error has a higher impact, high standard deviation within the test samples, and a limited number of samples. An increased number of test repetitions is required to decrease this measurement uncertainty; however, the measurement point is considered to present a general trend estimate.

3. Results

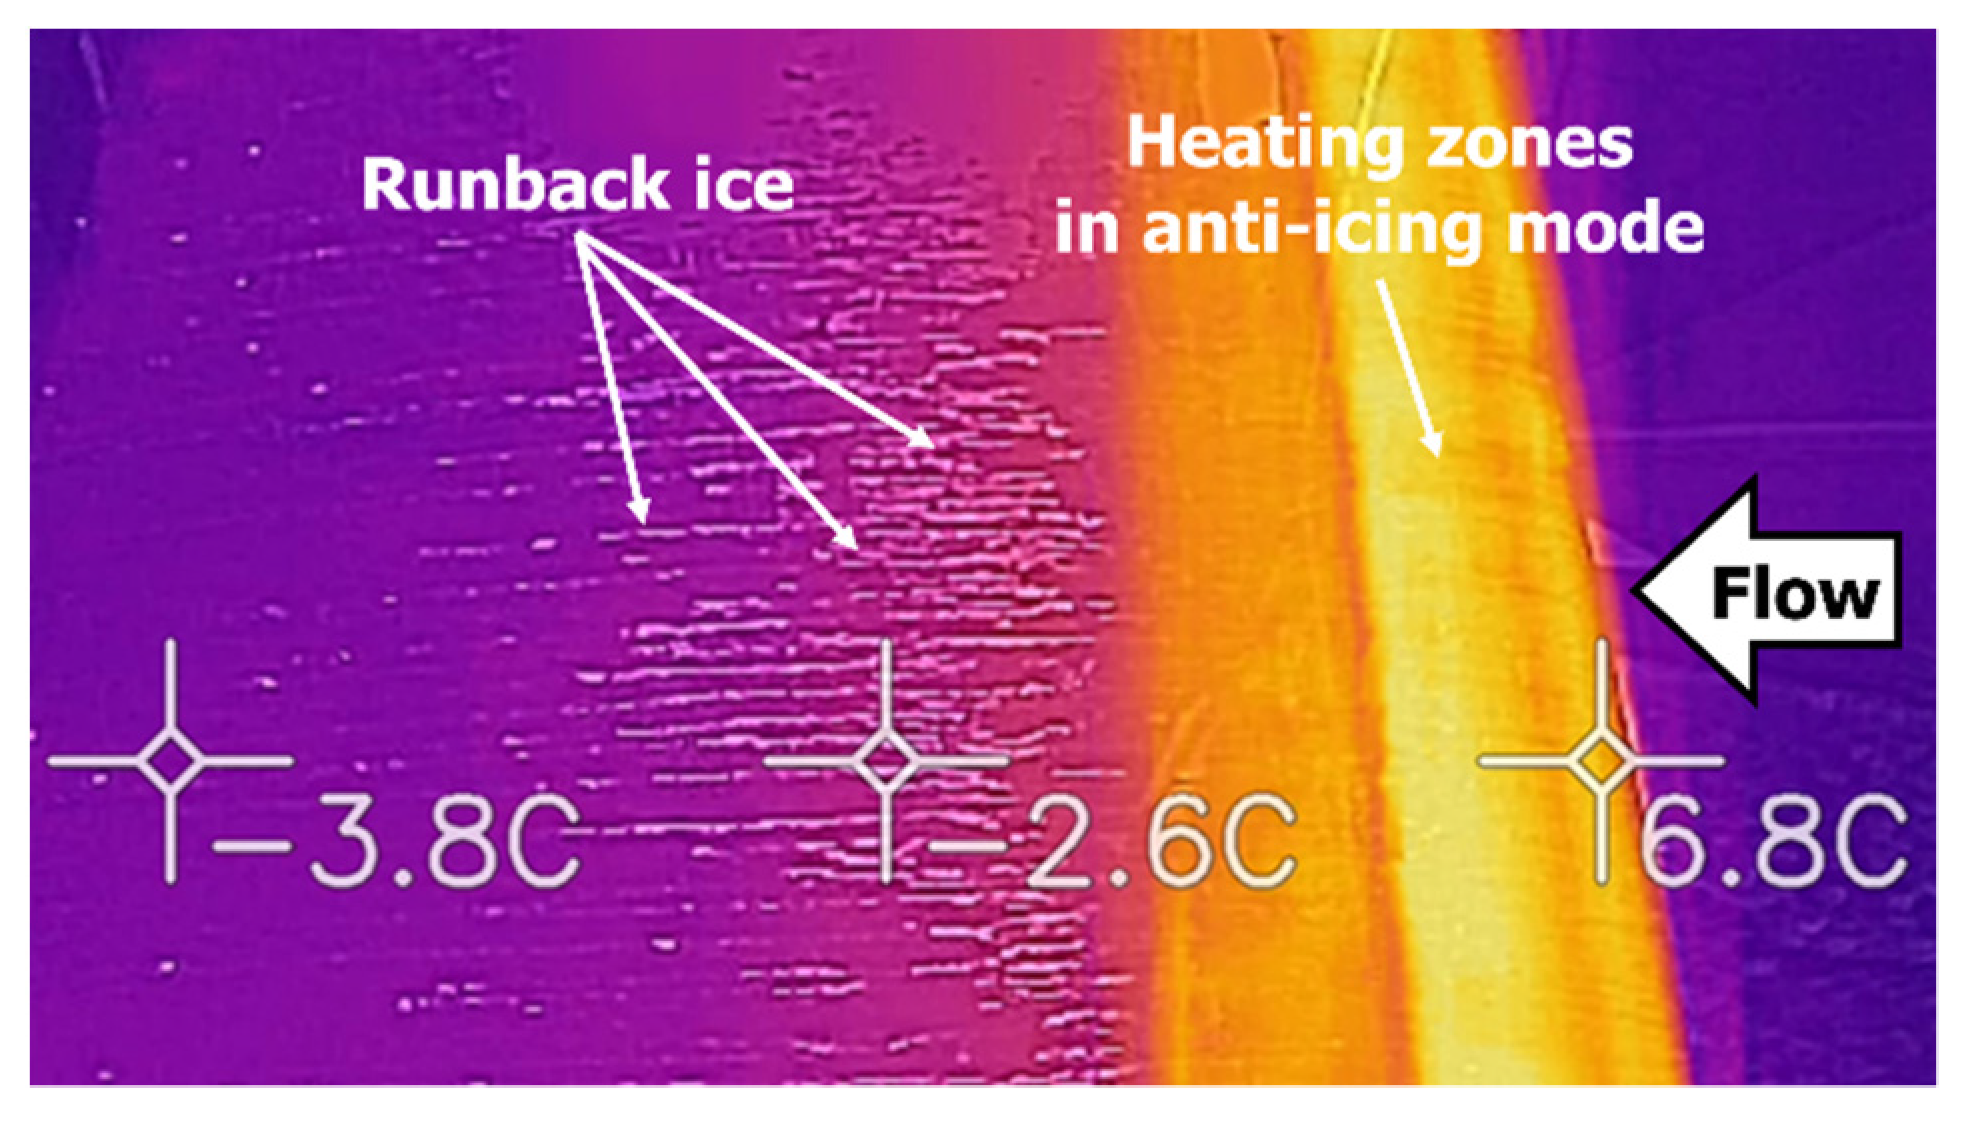
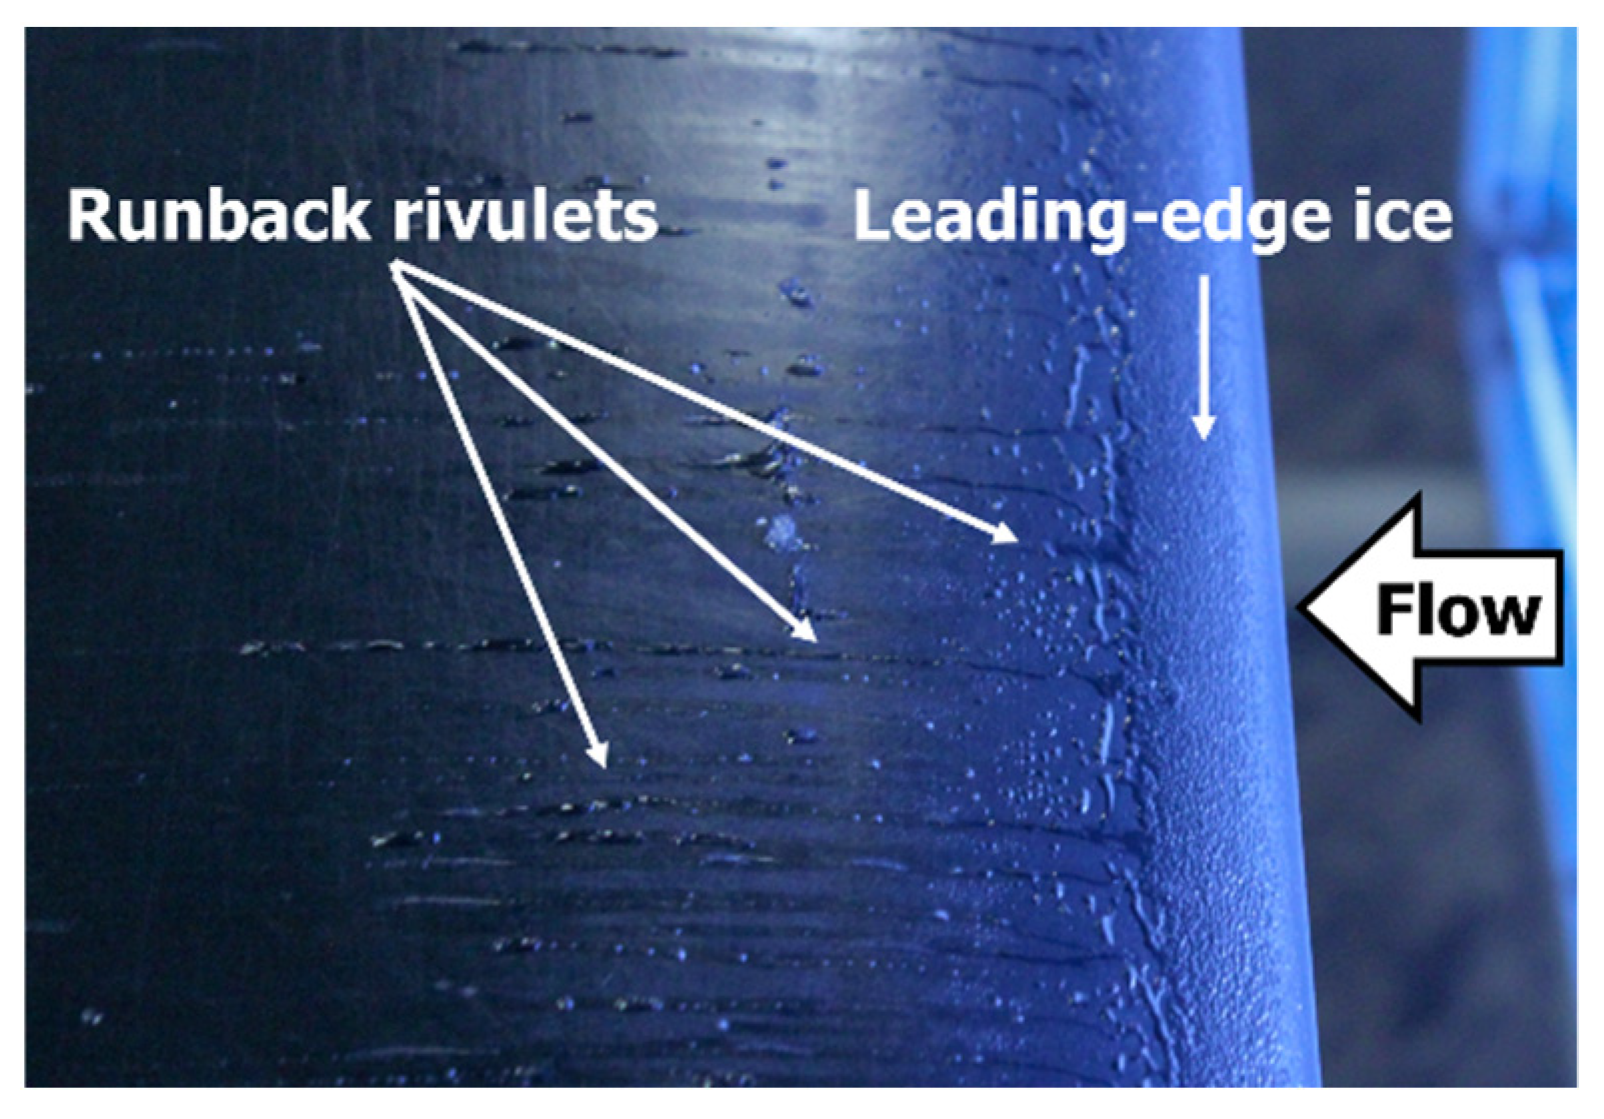
This section presents the results of the test on the IPS. Figure 7 displays a thermal image of the activated IPS during anti-icing operation. The picture shows the small gap between the primary and secondary heating zones, as well as a uniform heat distribution. Runback ice has formed downstream of the heating zones. Figure 8 shows a de-icing case, moments before the leading-edge ice shape would shed. Several runback rivulets with liquid water can be observed. These would freeze downstream of the airfoil.

3.1. Anti-Icing

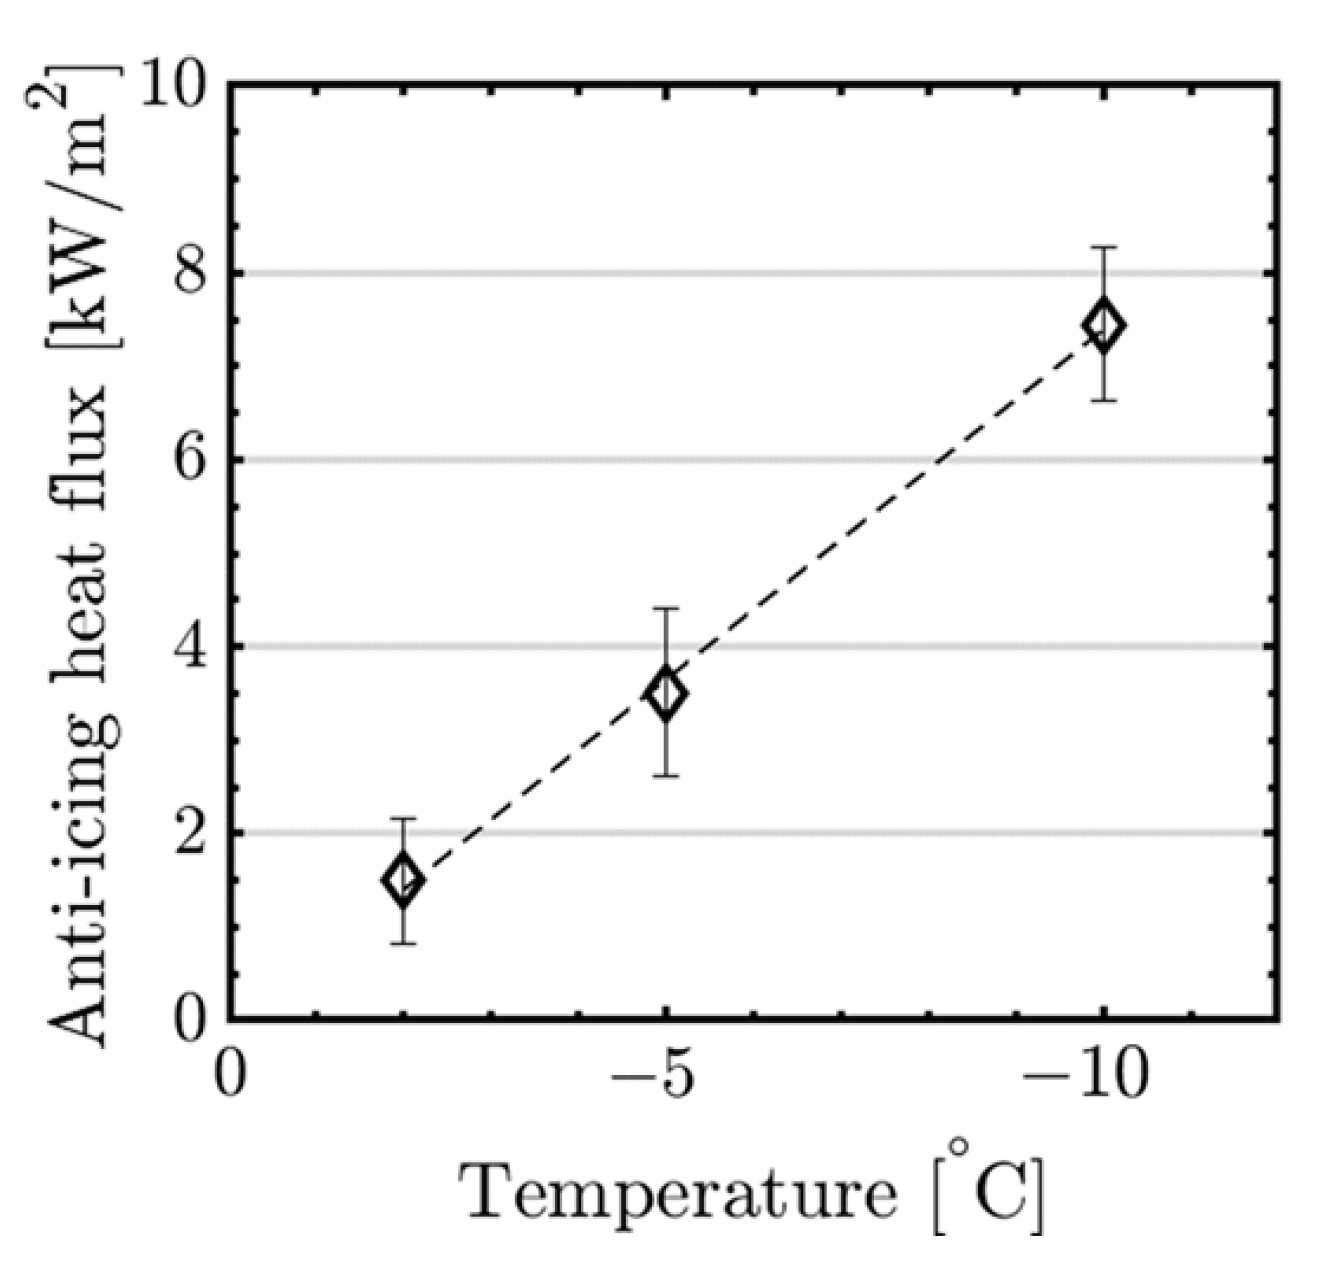
The results for the anti-icing loads are shown in Figure 9. Two runs were conducted each for T = −2 °C and T = −5 °C. Four runs were conducted at T = −10 °C, since it showed a larger variation of the required heat fluxes. This large variation was likely related to the difficulty to identify the exact heat flux when steady-state anti-icing is achieved. The results show a strong linear correlation with the temperature. This behavior was expected and can be explained with the larger temperature difference (between ambient and the freezing point) that needs to be overcome by the anti-icing system at lower temperatures.

3.2. Ice Thickness

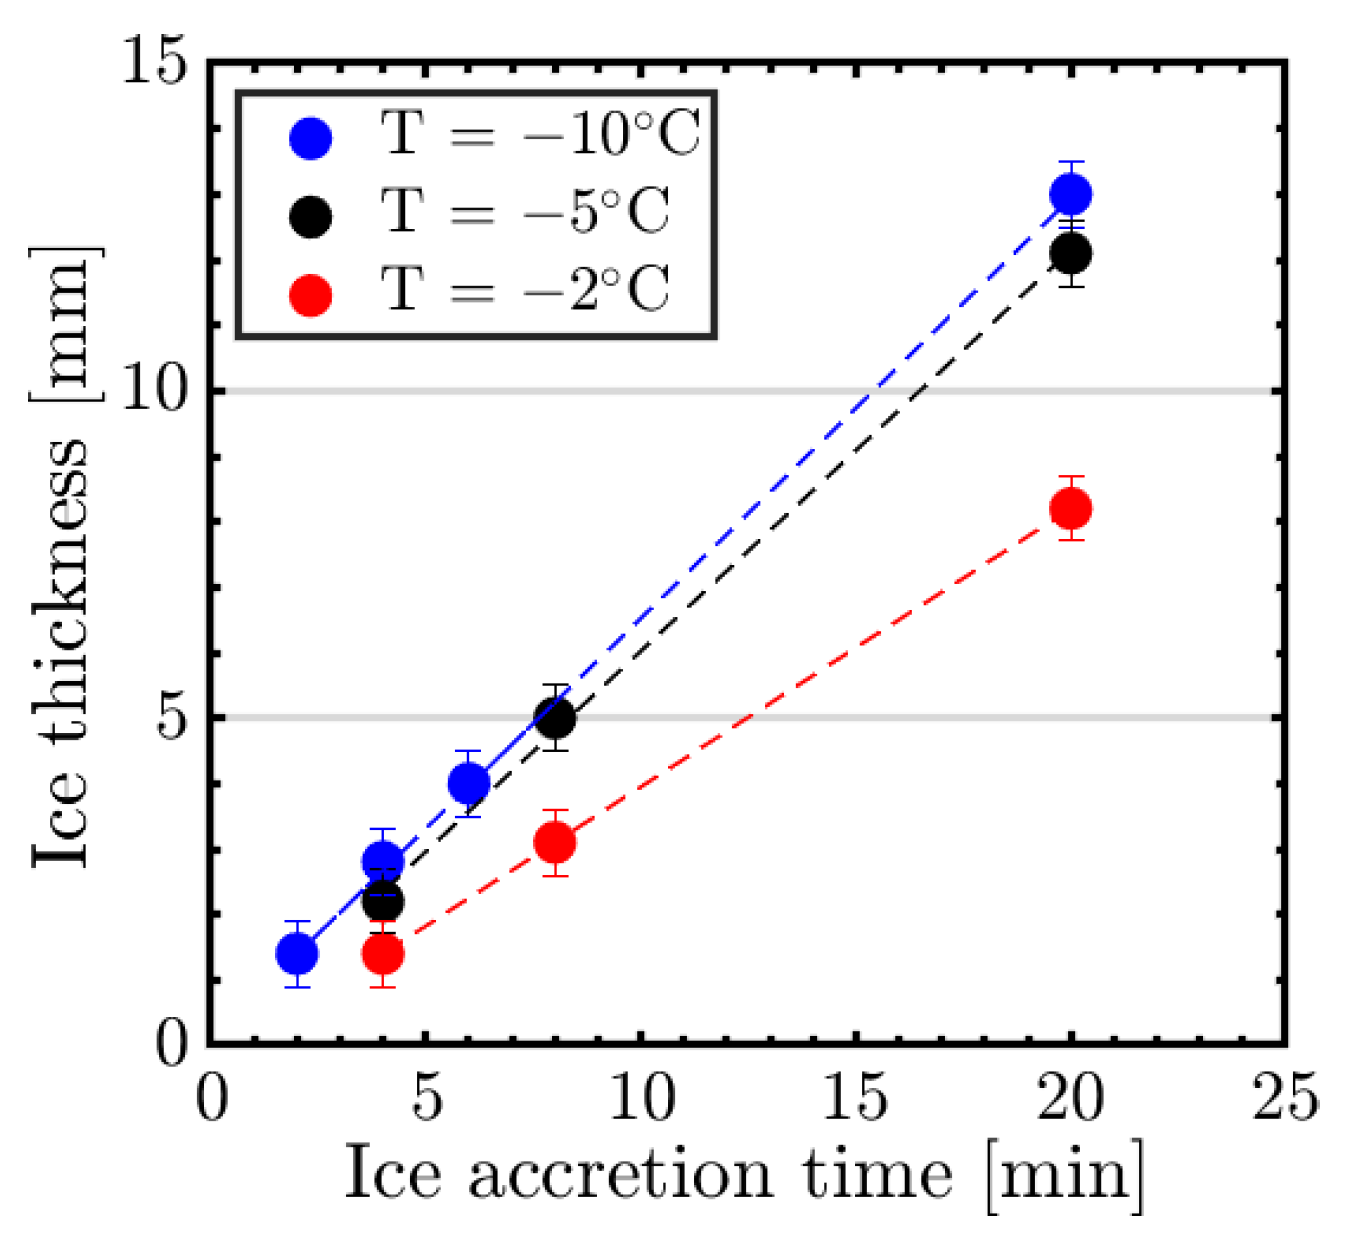
The ice thickness is a key parameter for de-icing and depends on ice accretion time and temperature for v = 25 m/s (Figure 10). The ice thickness showed a good linear fit with the ice accretion time for all temperatures. The highest ice accretion rate occurred at T = −10 °C, and was closely followed by T = −5 °C. At temperatures close to the freezing point (T = −2 °C), the ice accretion efficiency was lower most likely due to the formation of glaze ice. The resulting difference in ice thickness between the temperature was one parameter that affected the shedding times for both IPSs. A remark is that together with thickness, other ice properties have varied (shape, density, and adhesion strength) for the tested temperature range.

3.3. Conventional De-Icing

Shedding times for the conventional de-icing system were investigated for a range of ice accretion times, temperatures, and power settings (Figure 11). The results revealed three mechanisms. First, an increase in de-icing heat flux led to a decrease in shedding times. This was most likely related to a more rapid melting process at the ice/structure interface. Second, an increase in ice accretion time led to an increase in shedding time. A 2 min increase in ice accretion time led to an approximate 50% increase in shedding time. This indicated that an increase in ice thickness, and likely consequently higher aerodynamic shedding forces, did not lead to faster shedding times. Instead, a large ice thickness at the leading-edge might be acting as an ice bridge between the upper and lower ice accretion regions. Moreover, the ice was likely kept in place by the stagnation pressure, and longer melting times were needed to achieve shedding. Third, the shedding times increase at lower temperatures. This was most likely related to the larger temperature difference that had to be overcome by the IPS.

3.4. Parting Strip De-Icing

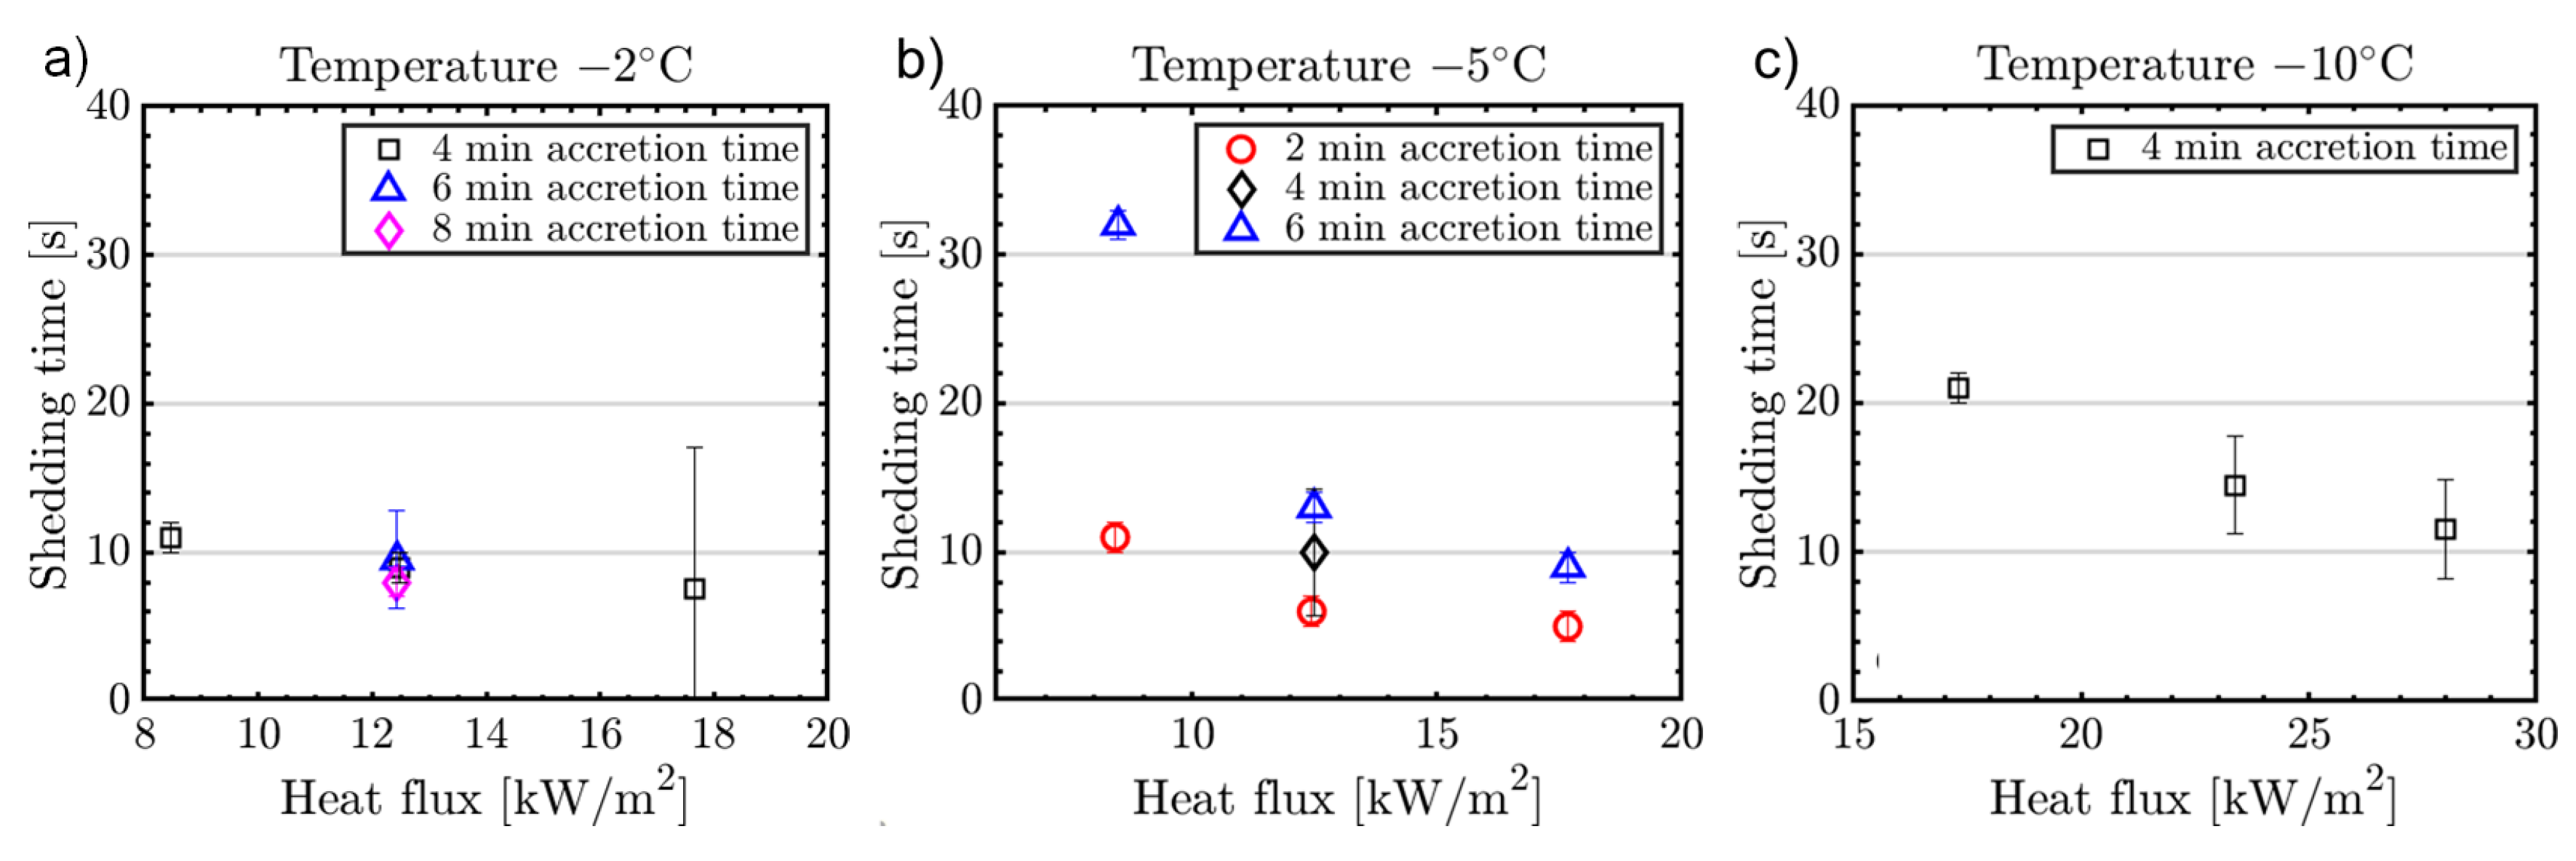
Further tests were conducted with variations of intercycle time, heat fluxes, and temperatures (Figure 12). Similar to the conventional IPS, decreasing heat fluxes increased shedding time. At T = −2 °C the shedding times between the lowest and the highest heat flux settings varied significantly less compared to lower temperatures. Furthermore, while an increase in intercycle time seemed to lead to increased ice shedding times for T = −5 °C (in accordance with the conventional IPS—although with a smaller impact), for T = −2 °C it led to decreased shedding times. We were not able to fully explain this behavior without further tests, but these effects may be related to measurement uncertainties (as the values vary in a range of ± 1 s), the difference in ice shapes, or the low adhesion forces of glaze ice cases. The continuous power requirement of the parting strip scaled linearly with ambient temperature as Pparting strip = [7.1, 20.2, 45.6 W] for temperatures T = [−2, −5, −10 °C], respectively. The values for the parting strip were obtained in a similar approach as the minimum heat fluxes for anti-icing of the IPS.

3.5. Parting Strip vs. Conventional De-Icing

To showcase the effect of the parting strip on ice shedding, a comparison between the conventional system, the parting strip system with deactivated parting strip, and activated parting strip were conducted (Figure 13). The tests were performed at T = −2 °C and tintercycle = 4 min at relatively similar heat fluxes q = [10.5 … 12.5 kW/m2]. The results showed that there is little difference between the conventional system and the deactivated parting strip. The latter shed ice slightly later compared to the conventional system even though it used almost 20% higher heat loads. This was likely related to the unheated gap on the parting strip system (as the parting strip itself was deactivated) which delayed the melting process. The ice/surface interface near the gap needed longer to heat which resulted in the increased shedding time. Also, that area might have been acting as an anchor point of ice, likely reducing aerodynamic shedding efficiency.
In contrast, shedding times for the system with activated parting strip were substantially lower compared to the conventional system. The parting strip system shed ice more than three times faster than the conventional system. As discussed before, this can be explained by significantly increasing the shedding forces related to the aerodynamic drag of the ice shapes.

3.6. Airspeed

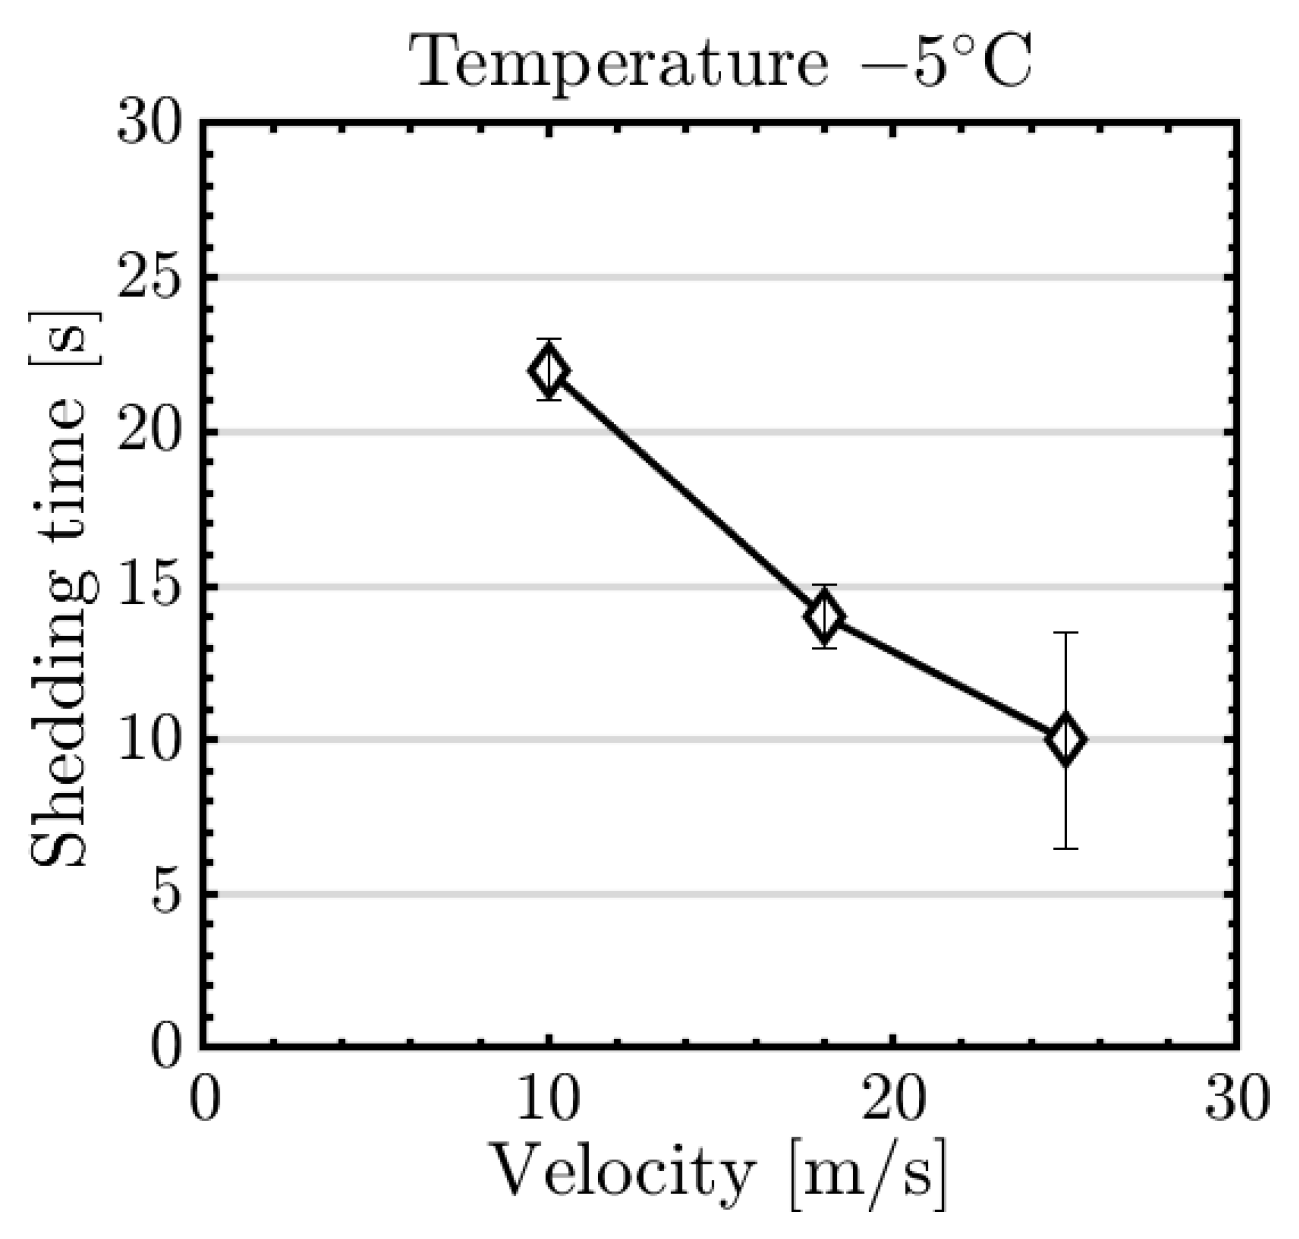
The influence of the airspeed was tested at T = −5 °C on the parting strip system for three airspeeds v = [10, 18, 25 m/s]. The water flow rate of the droplet spray nozzles was kept constant, meaning that the LWC was coupled to the airspeed. The corresponding values for each airspeed are LWC = [0.96, 0.69, 0.44 g/m³]. The results (Figure 14) showed a clear trend of a decrease in de-icing time with increasing velocity. This is most likely related to the substantial increase in aerodynamic shedding forces at higher velocities. The aerodynamic forces are kinetic forces and are thus quadratically related to the airspeed [15]. This effect is dominating over secondary effects that would result in a tendency to decrease shedding times for lower airspeeds: first, the increase in LWC leads to larger ice accretions that may lead to a decrease shedding times due to increased drag. Second, the lower airspeeds lead to lower heat convection and thus more efficient heating from the IPS—although this effect might be offset by the higher LWC and larger ice thicknesses. Both these effects were likely subdued by the decrease in aerodynamic forces. In addition, we visually observed that more melting seemed to occur for the lower airspeeds compared to the higher airspeeds.

3.7. Angle of Attack

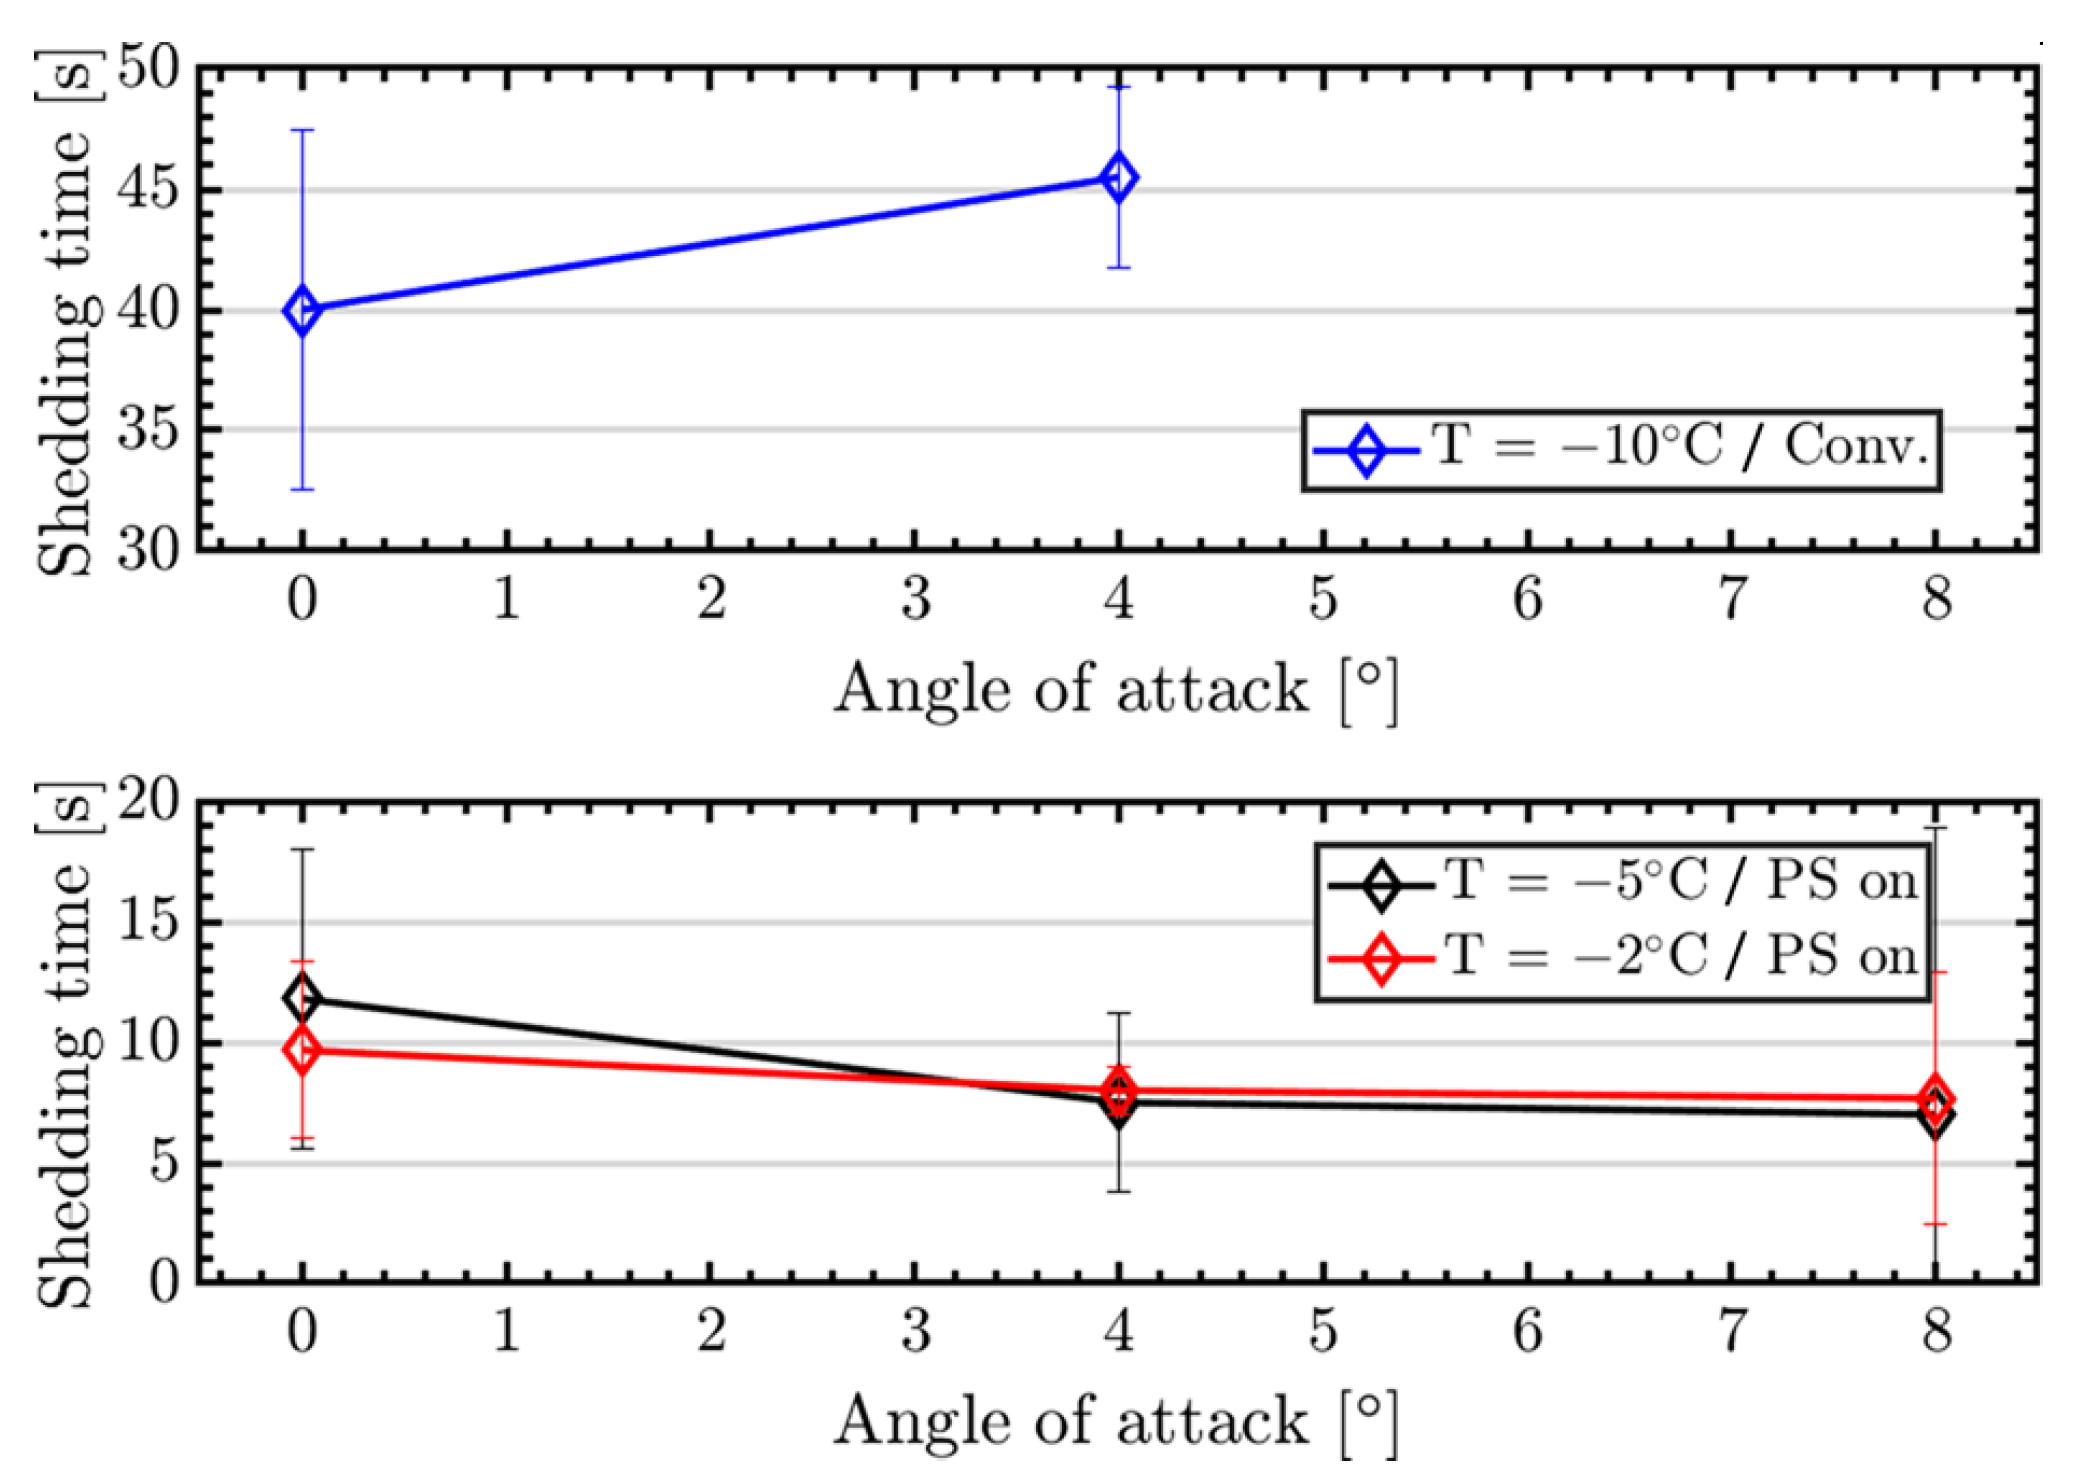
Three test series were conducted to investigate the effect of the angle of attack (AOA) during icing on de-icing efficiency. For the parting strip system, three AOAs, with α = [0, 4, 8°] were tested each at T = [−2, −5 °C]. The conventional de-icing system was tested at two AOAs, with α = [0, 4°] and T = −10 °C. All three results are shown in Figure 15. For the parting strip system, a higher AOA resulted in about 20 to 30% reduced de-icing times. This might be related to an increased convective heat transfer over the parting strip, which resulted from the local wind speed increase at higher AOAs. This was likely to accelerate the transversal ice melting and to lead to a faster and enlarged water layer formation at the ice-airfoil interface. This would allow a faster redistribution of external pressure in the liquid layer, which would induce a lift force over the ice, followed by shedding, as described in [29]. The air temperature seemed to play only a minor role in this mechanism.
For the conventional system, a de-icing time increase of about 10% occurred. This was in line with previous experiences that showed an increase in the de-icing time at higher AOAs. This effect was likely linked to the fact that at higher AOAs a larger area of the airfoil is iced and that the increased aerodynamic forces are likely contributing less to shedding on the fully iced leading-edge.

4. Discussion

4.1. General

The main objective of this study was to compare three different IPS methods: anti-icing, conventional de-icing, and parting strip de-icing. For de-icing, several variations of ice accretion time and heat fluxes were tested. In order to identify the most energy-efficient IPS, a time-averaged energy consumption q ¯ is calculated for each case:
q ¯ = q de - icing · t shedding + q parting   strip · t intercycle t intercycle + t shedding   =   [ J s · m 2 ]   =   [ W m 2 ]
This value calculates the total energy that has been spent on IPS in relation to the total cycle time. The unit of q ¯ is the same unit as for heat fluxes and can thus be directly compared to anti-icing heat loads.
The comparison is performed for each ambient temperature separately (Figure 16). Heat flux levels were indicated with “low”, “mid”, and “high” and their numeric value can be identified from Figure 11 and Figure 12. The first observation was that anti-icing required significantly more energy than all other cases. There was a strong temperature dependency on this effect, which implied that de-icing methods became more efficient compared to anti-icing for lower temperatures. The reason for this was that anti-icing systems need to continuously provide enough heat to compensate for the temperature difference between ambient and freezing point, whereas de-icing systems do this periodically.
The second conclusion was that parting strip de-icing was more energy-efficient than conventional de-icing, for any given intercycle time. The advantage of the parting strip was temperature-dependent, requiring approximately half of the energy compared to the conventional IPS for T = −2 °C and −5 °C. For the lowest temperature T = −10 °C, the advantage decreased. The reason for this was not clear. It could be related to the higher ice adhesion forces at a lower temperature or to insufficient heating of the parting strip and a too-small gap in the ice.
Third, a longer ice accretion time led to lower energy requirements for both conventional and parting strip IPS. The system was more efficient since the ratio of ice accretion time to active IPS time was larger, resulting in a larger denominator in q ¯ .
Last, no clear trend could be observed for the influence of the level of the heat flux on the time-averaged energy consumption. It remains unclear if a high heat flux over a shorter time is more energy-efficient compared to a lower heat flux over a longer time. This was explained by the formulation of q ¯ where the deicing heat flux is linked to the shedding time. Their inverse proportionality made them partly compensate for their behavior.
The outcome of this study strongly indicated that the most energy-efficient method of IPS is a parting strip de-icing system. However, there were several limitations to this study that should be noted. An assessment of IPS efficiency cannot be based solely on its energy consumption. Secondary effects, that add to the overall power consumption of the UAV need to be considered as well. This includes aerodynamic performance degradations by intercycle ice and runback icing. These ice forms introduce aerodynamic penalties by decreasing lift and increasing drag [30,31]. The UAV needs to compensate for these, by increasing thrust and AOA. This will require additional power consumption that needs to be considered for the overall assessment of IPS efficiency.
Runback icing occurred during both, anti-icing and de-icing, and can be observed in Figure 7 and Figure 8. In addition to the aerodynamic penalties, runback icing introduces the risk of freezing on downstream control surfaces. This can block their movement and is a severe risk for the UAV [32]. Control of runback icing with an IPS can be achieved for example by multiple heating zones that are operated sequentially.
De-icing also introduces the risk of shed ice hitting critical components downstream. This is a risk for equipment like antennas, sensors, propellers, or engine inlets that are located downstream of protected surfaces [13]. This risk is non-existent for anti-icing IPS and needs therefore careful evaluation for de-icing IPS.
There are several limitations to the experimental methods that add uncertainty to this study. First, the calculation of the heat fluxes was based on the electric power provided to the heating zones. In reality, only a part of this power is effectively used by the IPS. The largest loss occurs due to heat conduction into the wing. Furthermore, losses due to the electric system were not accounted for. We recommend that for future tests the actual heat flux generated by the heating panels should be measured. Second, the ice shedding times were observed manually. This added subjectivity to the test (based on the experimenter’s reaction time) and limited the accuracy of the time measurement.
Video data were collected during these tests, but to process this data takes substantial work. High-speed flow visualizations of the de-icing experiments were recorded at 60 and 120 frames per second from 3 viewpoints. The video-data results could highly increase the shedding time measurement accuracy and give more information about the ice shedding mechanism. Filmed in high-resolution, these visual observations show the liquid layer formation under the ice. This could give more information about the detachment mechanism and could be used for a qualitative runback ice investigation.

4.2. Measurement Uncertainties

As described in the methodology section, the uncertainty estimations of the imposed experimental conditions (temperature, wind speed, de-icing heat flux, etc.) were low, which ensured good test repeatability. For these parameters, the instrumentation precision was the predominant source of error, the errors increasing in significance for lower measurement values.
For measured quantities (anti-icing heat flux, ice thickness and ice shedding time) the estimated relative uncertainties were between 2 to 5 times higher than for the imposed test parameters. For these quantities, the measured values variation was the predominant source of error. This could have been caused by one or both of the following: decreased measurement precision due to human observation/reading of instrumentation or variations of the physical phenomenon between test repetitions, such as slightly different ice accretion shapes, ice cracking during de-icing tests etc.
For measured quantities, it is generally observed that for smaller measured values the human reading error is more significant. For example, considering the conventional de-icing tests (Figure 12), at temperature −5 °C and −10 °C the maximum absolute uncertainty is ~9 s, while the reported ice shedding times ranges differ from a maximum 45 s (at −5 °C) to 76 s (same test conditions at −10 °C). In the first case, the relative uncertainty is ~28%, while for the second it is only ~12%. Another example is the relative uncertainty variation in determining the anti-icing heat fluxes (Figure 9). An absolute uncertainty of ~0.8 kW/m2 represents ~10% of relative error for the 7.44 kW/m2 measurement, but ~45% for the 1.5 kW/m2 measurement. The same observation applies to the ice thickness measurements, where the absolute uncertainties are ~0.5 mm but the relative uncertainties vary between ~5 and 25%.
Regarding the de-icing tests, the most important uncertainty factor observed was the standard deviation of the test sample, compared to which the other sources of error were almost negligible. The spread of ice shedding times around the mean value was more pronounced at higher testing temperatures (higher standard deviations were observed at −2 °C temperatures than at −10 °C for both de-icing configurations). An explanation for this might be the formation of glaze ice, which has a higher shape variation between two repetitive runs, therefore it might induce an increased random variation between tests.
Another observation is that estimated uncertainties are significantly higher for the hybrid de-icing configuration (neglecting one extreme case, ~42% relative uncertainty, while for conventional de-icing the maximum reported was ~28%). This is partially due to the decreased absolute values in ice shedding time, but most of the uncertainty is due to the standard deviation of the samples. The variations between test repetitions might be related to the parting strip operation in anti-icing mode. This generates the existence of a water film on the airfoil’s surface, and a wetter ice accretion than the conventional configuration. Water presence might increase the ice shape’s variability and change the ice adhesion properties between two test repetitions. Although the measurements’ relative uncertainties are high in some cases, affecting the absolute values, the data aspect (generally non-overlapping of error margins between experimental conditions) allows for the observation of general trends. A few sensitive cases are the ice shedding time measurements of the hybrid configuration for −2 °C, at medium heat flux (Figure 12). As the uncertainty margins overlap, little can be said about the differences between these tests. To improve measurement accuracy, one should increase the number of repetitions of a testing configuration. By doing so, the obtained mean would be closer to the true value, and the Student’s t-factor would reduce, therefore reducing the random uncertainty.

5. Conclusions

Atmospheric icing imposes limitations on UAVs that can be overcome with IPS. An electrothermal IPS was tested at the icing wind tunnel facilities of VTT. The main objective of this study was to identify which IPS method was the most energy-efficient and to investigate the effect of angle of attack and airspeed on de-icing. The results suggest that anti-icing was the least energy-efficient method of IPS. De-icing has proven to require substantially lower heat loads at all temperatures. A conventional IPS, with a periodically heated leading-edge, and a parting strip IPS, with a continuously heated small area, were tested for de-icing. De-icing with the parting strip has shown to require up to 50% less energy compared to a conventional de-icing system.
This study showed that the energy-efficiency of an IPS is determined by the IPS method chosen. An efficient IPS needs, therefore, to be carefully engineered and controlled. There are a large number of parameters that influence IPS efficiency, which need to be balanced and adjusted depending on the icing conditions. This experimental work offered additional insights into the interrelation of these parameters and can be used for comparison with numerical methods.
Under the assumption that the ice shedding mechanism for a de-icing case results from a force imbalance between the aerodynamical and viscous forces at the substrate surface—future work will be to couple these experiments with phase change and aerodynamical simulations, the latter validated against simplified force measurements. This would increase the understanding of the de-icing mechanisms and help to further improve the electrothermal IPS efficiency.
Author Contributions

Conceptualization, R.H., T.A.J. and K.T.B.; methodology, R.H. and A.E.; software, M.C.N. and B.N.S.; validation, R.H.; formal analysis, R.H. and A.E.; investigation, R.H., A.E., M.C.N. and K.T.B.; resources, T.A.J. and K.T.B.; data curation, B.N.S.; writing—original draft preparation, R.H.; writing—review and editing, R.H., A.E., J.v.B. and T.A.J.; visualization, R.H. and A.E.; supervision, T.A.J.; project administration, R.H.; funding acquisition, A.E., J.v.B., T.A.J., K.T.B. All authors have read and agreed to the published version of the manuscript.

Funding

This project has received funding from the Research Council of Norway under grant number 237906, Centre for Integrated Remote Sensing and Forecasting for Arctic Operations (CIRFA). The research was also funded by grant number 223254, Centre for autonomous marine operations and systems (NTNU AMOS). Further funding was received from the Norwegian Research Council FORNY, grant number 284649, from the Regionalt Forskningsfond Midt-Norge, grant number 285248, from the F.R.S.-FNRS mobility funding—grant number 35699386, and from the VKI Alumni Association Research Travel grant. A. Enache is supported by the Belgian F.R.S-FNRS with an FRIA fellowship—grant number 35484427.

Institutional Review Board Statement

Not applicable.

Data Availability Statement

Data available upon request.

Acknowledgments

We thank Artur Piotr Zolich and Kim Lynge Sørensen from UBIQ Aerospace for supplying the D·ICE system and their general contribution to this work. Also, we thank Tuomas Jokela, Mikko Tiihonen, and Timo Karlsson from VTT—their support during the wind tunnel tests was an integral part of this work.

Conflicts of Interest

The authors declare no conflict of interest.

References

  1. Gent, R.W.; Dart, N.P.; Cansdale, J.T. Aircraft icing. Philos. Trans. R. Soc. A Math. Phys. Eng. Sci. 2000, 358, 2873–2911. [Google Scholar] [CrossRef]
  2. Siquig, A. Impact of Icing on Unmanned Aerial Vehicle (UAV) Operations; Naval Environmental Prediction Research Facility Report; Naval Environmental Prediction Research Facility: Monterey, CA, USA, 1990. [Google Scholar]
  3. Hann, R.; Johansen, T. Unsettled Topics in UAV Icing; SAE Edge Research Report; SAE International: Warrendale, PA, USA, 2020. [Google Scholar]
  4. Shakhatreh, H.; Sawalmeh, A.H.; Al-Fuqaha, A.; Dou, Z.; Almaita, E.; Khalil, I.; Othman, N.S.; Khreishah, A.; Guizani, M. Unmanned Aerial Vehicles (UAVs): A Survey on Civil Applications and Key Research Challenges. IEEE Access 2019, 7, 48572–48634. [Google Scholar] [CrossRef]
  5. Peck, L.; Ryerson, C.C.; Martel, C.J. Army Aircraft Icing; Cold Regions Research and Engineering Laboratory Report; Cold Regions Research and Engineering Laboratory: Hanover, NH, USA, 2002. [Google Scholar]
  6. Haulman, D.L. U.S. Unmanned Aerical Vehicles in Combat 1991–2003; Air Force Historical Research Agency Report; Air Force Historical Research Agency: Maxwell AFB, AL, USA, 2003. [Google Scholar]
  7. FAA. Pilot Guide: Flight in Icing Conditions; Advisory Circular AC 91-74B; Federal Aviation Administration: Washington, DC, USA, 2015.
  8. Cao, Y.; Tan, W.; Wu, Z. Aircraft icing: An ongoing threat to aviation safety. Aerosp. Sci. Technol. 2018, 75, 353–385. [Google Scholar] [CrossRef]
  9. Bragg, M.B.; Broeren, A.P.; Blumenthal, L.A. Iced-airfoil aerodynamics. Prog. Aerosp. Sci. 2005, 41, 323–362. [Google Scholar] [CrossRef]
  10. Szilder, K.; McIlwain, S. In-Flight Icing of UAVs—The Influence of Reynolds Number on the Ice Accretion Process; SAE Technical Paper 2011-01-2572; SAE International: Warrendale, PA, USA, 2011. [Google Scholar]
  11. SAE International. Ice, Rain, Fog, and Frost Protection; Aerospace Information Report AIR1168/4; SAE International: Warrendale, PA, USA, 2016. [Google Scholar]
  12. Uranai, S.; Fukudome, K.; Mamori, H.; Fukushima, N.; Yamamoto, M. Numerical Simulation of the Anti-Icing Performance of Electric Heaters for Icing on the NACA 0012 Airfoil. Aerospace 2020, 7, 123. [Google Scholar] [CrossRef]
  13. Thomas, S.K.; Cassoni, R.P.; MacArthur, C.D. Aircraft anti-icing and de-icing techniques and modeling. J. Aircr. 1996, 33, 841–854. [Google Scholar] [CrossRef]
  14. Enache, A.; Bernay, B.; Glabeke, G.; Planquart, P.; van Beeck, J. Ice shedding phenomenon: An experimental and numerical investigation. In Proceedings of the Atmospheric and Space Environments Conference, AIAA, Virtual Event, 15–19 June 2020. [Google Scholar]
  15. Scavuzzo, R.J.; Chu, M.L.; Ananthaswamy, V. Influence of aerodynamic forces in ice shedding. J. Aircr. 1994, 31, 526–530. [Google Scholar] [CrossRef]
  16. Kind, R.; Potapczuk, M.; Feo, A.; Golia, C.; Shah, A. Experimental and computational simulation of in-flight icing phenomena. Prog. Aerosp. Sci. 1998, 34, 257–345. [Google Scholar] [CrossRef]
  17. Lawson, C.P. Electrically powered ice protection systems for MALE UAVs—Requirements and integration challenges. In Proceedings of the ICAS-Secretariat—25th Congress of the International Council of the Aeronautical Sciences, Hamburg, Germany, 3–8 September 2006. [Google Scholar]
  18. Yao, X.; Hawkins, S.C.; Falzon, B.G. An advanced anti-icing/de-icing system utilizing highly aligned carbon nanotube webs. Carbon 2018, 136, 130–138. [Google Scholar] [CrossRef] [Green Version]
  19. Hann, R.; Borup, K.; Zolich, A.; Sorensen, K.; Vestad, H.; Steinert, M.; Johansen, T. Experimental Investigations of an Icing Protection System for UAVs; SAE Technical Paper 2019-01-2038; SAE International: Warrendale, PA, USA, 2019. [Google Scholar]
  20. Yugulis, K.; Chase, D.; McCrink, M. Ice Accretion Analysis for the Development of the HeatCoat Electrothermal Ice Protection System. In AIAA Aviation 2020 Forum; American Institute of Aeronautics and Astronautics: Reston, VA, USA, 2020. [Google Scholar]
  21. Idris, M.K.; Qiu, J.; Melenka, G.W.; Grau, G. Printing electronics directly onto carbon fiber composites: Unmanned aerial vehicle ({UAV}) wings with integrated heater for de-icing. Eng. Res. Express 2020, 2, 25022. [Google Scholar] [CrossRef]
  22. Huang, X.; Tepylo, N.; Pommier-Budinger, V.; Budinger, M.; Bonaccurso, E.; Villedieu, P.; Bennani, L. A survey of icephobic coatings and their potential use in a hybrid coating/active ice protection system for aerospace applications. Prog. Aerosp. Sci. 2019, 105, 74–97. [Google Scholar] [CrossRef] [Green Version]
  23. Morita, K.; Kimura, S.; Sakaue, H. Hybrid System Combining Ice-Phobic Coating and Electrothermal Heating for Wing Ice Protection. Aerospace 2020, 7, 102. [Google Scholar] [CrossRef]
  24. Tiihonen, M.; Jokela, T.; Makkonen, L.; Bluemink, G. VTT Icing Wind Tunnel 2.0. In Winterwind Conference; VTT Technical Research Centre of Finland Ltd.: Espoo, Finland, 2016. [Google Scholar]
  25. Laurikko, J. Emissions Performance of Current TWC Vehicles at Low Ambient Temperature over FTP and ECE Test Cycles. In International Congress & Exposition; SAE International: Warrendale, PA, USA, 1994. [Google Scholar]
  26. Cober, S.G.; Isaac, G.A. Characterization of Aircraft Icing Environments with Supercooled Large Drops for Application to Commercial Aircraft Certification. J. Appl. Meteorol. Climatol. 2012, 51, 265–284. [Google Scholar] [CrossRef]
  27. Morris, A.S.; Langari, R. Measurement Uncertainty. In Measurement and Instrumentation; Elsevier: Amsterdam, The Netherlands, 2012; pp. 39–102. [Google Scholar]
  28. Jaynes, E.T. Probability Theory: The Logic of Science; Cambridge University Press: Cambridge, UK, 2003. [Google Scholar]
  29. Bennani, L. Two Dimensional Modelling of Electro-Thermal Ice Protection Systems. Ph.D. Thesis, Institut Supérieur De L’aéronautique Et De L’espace, Toulouse, France, 2014. [Google Scholar]
  30. Broeren, A.P.; Bragg, M.B.; Addy, H.E. Effect of intercycle ice accretions on airfoil performance. J. Aircr. 2004, 41, 165–174. [Google Scholar] [CrossRef]
  31. Whalen, E.A.; Broeren, A.P.; Bragg, M. Characteristics of Runback Ice Accretions and Their Aerodynamic Effects; Federal Aviation Administration: Washington, DC, USA, 2007.
  32. Lynch, F.T.; Khodadoust, A. Effects of ice accretions on aircraft aerodynamics. Prog. Aerosp. Sci. 2001, 37, 669–767. [Google Scholar] [CrossRef]
Figure 1. Chordwise cut into an ice shape that formed after 6 min of icing, shows how the entire leading-edge is covered by ice.
Aerospace 08 00083 g001
Figure 2. Closeup of the leading-edge after 4 min of ice accretion with active parting strip heating.
Aerospace 08 00083 g002
Figure 3. Schematic layout of the heating-zones for the conventional de-icing (a) and de-icing with a parting strip (b).
Aerospace 08 00083 g003
Figure 4. Schematics of the icing wind tunnel facility with the ice protection system.
Aerospace 08 00083 g004
Figure 5. Schematic layout of the composite wing structure.
Aerospace 08 00083 g005
Figure 6. Flowchart of the minimum required anti-icing heat load procedure.
Aerospace 08 00083 g006
Figure 7. Thermal image of an anti-icing test. The leading-edge is continuously heated, producing runback water that refreezes downstream.
Aerospace 08 00083 g007
Figure 8. De-icing test, moments before the ice shedding. Liquid water is produced from the leading-edge and refreezes downstream.
Aerospace 08 00083 g008
Figure 9. Minimum required heat fluxes for anti-icing at different temperatures.
Aerospace 08 00083 g009
Figure 10. Ice thickness over ice accretion time at different temperatures.
Aerospace 08 00083 g010
Figure 11. Shedding times of the conventional de-icing ice protection system for three different temperatures: T = −2° (a), T = −5° (b), and T = −10° (c).
Aerospace 08 00083 g011
Figure 12. Shedding times of the parting strip de-icing ice protection system for three different temperatures: T = −2° (a), T = −5° (b), and T = −10° (c).
Aerospace 08 00083 g012
Figure 13. Comparison of shedding times between conventional (Conv.) and parting strip (PS) IPS, with activated (PS on) and deactivated parting strip (PS off).
Aerospace 08 00083 g013
Figure 14. Comparison of shedding times of the parting strip IPS at different velocities.
Aerospace 08 00083 g014
Figure 15. Comparison of shedding times between conventional (Conv.) and parting strip (PS) IPS for different angles of attack.
Aerospace 08 00083 g015
Figure 16. Overview of the time-averaged total energy consumption for all IPS runs.
Aerospace 08 00083 g016
Table 1. Anti-icing test matrix.
ParameterRange
Velocity v25 m/s
Temperature T−2, −5, −10 °C
Reynolds number Re9 × 105
Liquid water content LWC0.44 g/m3
Droplet diameter MVD24 μm
Angle of attack α
Table 2. De-icing test matrix.
ParameterRange
Velocity v10, 18, 25 m/s
Temperature T−2, −5, −10 °C
Reynolds number Re3 × 105, 6 × 10⁵, 9 × 10⁵
Heat load qde-ice (approx.)9, 12, 18 kW/m2
Intercycle time tintercycle120, 240, 360, 480 s
Angle of attack α0, 4, 8°
Liquid water content LWC0.44 g/m3
Droplet diameter MVD24 μm
Publisher’s Note: MDPI stays neutral with regard to jurisdictional claims in published maps and institutional affiliations.