Article

Characterization of Vacuum Arc Thruster Performance in Weak Magnetic Nozzle

Aerospace Plasma Laboratory, Faculty of Aerospace Engineering, Technion—Israel Institute of Technology, Haifa 3200003, Israel
*
Authors to whom correspondence should be addressed.
Aerospace 2020, 7(6), 82; https://doi.org/10.3390/aerospace7060082
Submission received: 24 April 2020 / Revised: 5 June 2020 / Accepted: 16 June 2020 / Published: 19 June 2020
(This article belongs to the Special Issue Electric Propulsion)

Abstract

:
Vacuum arc thruster performance in a magnetic nozzle configuration is experimentally characterized. Measurements are performed on a miniature coaxial thruster with an anode inner diameter of 1.8 mm. The magnetic field B is produced by a single air coil, 18 mm in diameter. Direct measurement of thrust, mass consumption and arc current are performed. To obtain statistically viable results 6000 arc pulses are analyzed at each operational point. Cathode mass erosion is measured using laser profilometry. To sustain thruster operation over several measurement cycles, an active cathode feeding system is used. For 0 < B 0.2 T, performance increase over the non-magnetic case is observed with the best thrust to arc power ratio T / P 9 μ N/W obtained at B 0.2 T. A parametric model is provided that captures the performance enhancement based on beam collimation and acceleration by the magnetic nozzle. For B > 0.2 T, the arc discharge is shown to be suppressed nullifying any additional gains by the nozzle effect.

1. Introduction

Vacuum arc thrusters (VAT) are promising propulsion devices for nano-satellites and CubeSats [1,2], with a few examples experimentally operated in space. VAT are pulsed-dc devices that utilize an arc discharge, across an insulator, between two electrodes to produce thrust. The main advantages of the VAT compared to other electric propulsion devices is its simplicity and scalability to very low power 1 W without loss to performance [3]. In a VAT, the cathode electrode is consumed as propellant during the discharge. The cathode is eroded in localized regions, where the discharge is attached, known as cathodic spots [4]. The metal plasma emitted from these micrometer sized spots is self-consistently accelerated via gas-dynamic expansion [5]. There are two established VAT configuration: coaxial [6] and ring shaped [7], termed according to the shape and placement of the cathode with respect to the anode. These thruster configurations are shown schematically in Figure 1. It is well known that addition of external magnetic field can improve VAT performance [8,9] and the micro-cathode VAT [10,11], a ring shaped device, is a well studied case. However, for a magnetically enhanced coaxial VAT, only limited results are documented in the literature [12]. A VAT is a very low thrust device and requires many hours of operational time to impart its total impulse [2]. Since VATs use the cathodes as solid propellant, they are consumed by erosion and require replenishment. In particular, when the cathode surface area in contact with the insulator is small, constant mechanical feeding of the electrode is needed. Due to the pulsed nature of the VAT, its electrode erosion and very low power and thrust operation, obtaining performance figures that are statistically meaningful is not trivial.
Recently a coaxial VAT with an active feeding mechanism was introduced, known as the inline-screw-feeding VAT (ISF-VAT) [13,14]. The ISF-VAT enables for the first time a large scale data collection to evaluate the performance of coaxial VATs. This paper utilizes the ISF-VAT to study weak magnetic nozzles affect on coaxial-VAT performance. Here, for the first time to our knowledge, time averaged thruster performance is provided measured over 1000’s of pulses and many minutes of operation, representing actual operational conditions for a CubeSat thruster. The layout of the paper is as follows: Section 2 describes the experimental setup including description of the thruster and thrust measurement; Section 3 details the experimental results focusing on thruster performance in varying magnetic induction; Section 4 provides a semi-empirical model for thrust enhancement based on magnetic nozzle theory and geometrical considerations of plume shape.

2. Experimental Setup

2.1. Thruster and Magnetic Setup

The ISF-VAT concept [15] is shown in Figure 2. It is a coaxial vacuum arc thruster with an active feeding mechanism. A central cathode rod is freely disposed within a concentric insulator tube. A second electrode, positioned at the outer edge of the insulator, functions both as the anode of the dc circuit and as the exit plane of the thruster. To keep the VAT geometry constant during long duration operations, the cathode, connected to a metallic headless screw, is advanced at a precise rate inside the insulator in a helical path. The screw provides also an electrical contact with the thruster body that is under negative potential. With the correct selection of the linear advance rate and screw pitch, a balance between cathode erosion and feeding can be achieved. The helical motion both compensates for the radial as well as the azimuthal cathode erosion patterns. This allows for maintaining near constant thruster geometry throughout the operational life of the thruster as well as improved uniformity of the re-coating process, i.e., the process of replenishing the conducting layer on the cathode-insulator-anode interface. To generate magnetic nozzle, a magnetic system comprising of an air coil wound around the anode was selected.
In the present work an ISF-VAT propulsion module (PM) was used. The PM integrates an ISF-VAT with a power processing unit (PPU) and an active feeding system. When operating the PM over multiple firing cycles, the following steps are taken in each cycle:
(a)
operating the thruster for several minutes with a pre-selected number of firing-pulses.
(b)
discharge turned off by switching off the dc/dc converter that powered the main coil and a cool down the PM for few minutes.
(c)
cathode is advanced by a predetermined length using the feeding mechanism. Operation takes few seconds.
(d)
the dc/dc converter that powers the main coil is turned on for the next discharge. See stage (a).
The PM is being developed at the Aerospace Plasma Laboratory (APL), Technion, and is intended for CubeSat use with a total volume of 2.5 cm × 9.6 cm × 9.6 cm and a “wet” mass of 200 g. A Ti cathode of 0.7 mm diameter and a non-magnetic stainless steel (SS-304) anode, with inner diameter of 0.9 mm, are used in all the tests. The thruster magnetic system is comprised of a magnetic coil formed from a 45 turns of 24 AWG copper wire wound around a teflon bobbin, with an inner diameter of 18 mm, length of 10 mm along with a measured inductance L c o i l ≈ 54 μH and resistance R ≈ 390 mΩ. The magnetic coil is fitted around the ISF-VAT anode and can be relocated along the axis. To achieve maximum magnetic induction, the coil mid length is aligned flush with the cathode surface. The FEMM software [16] is used to calculated the magnetic field topology for a given magnetic coil current I c o i l , an example is shown in Figure 3.

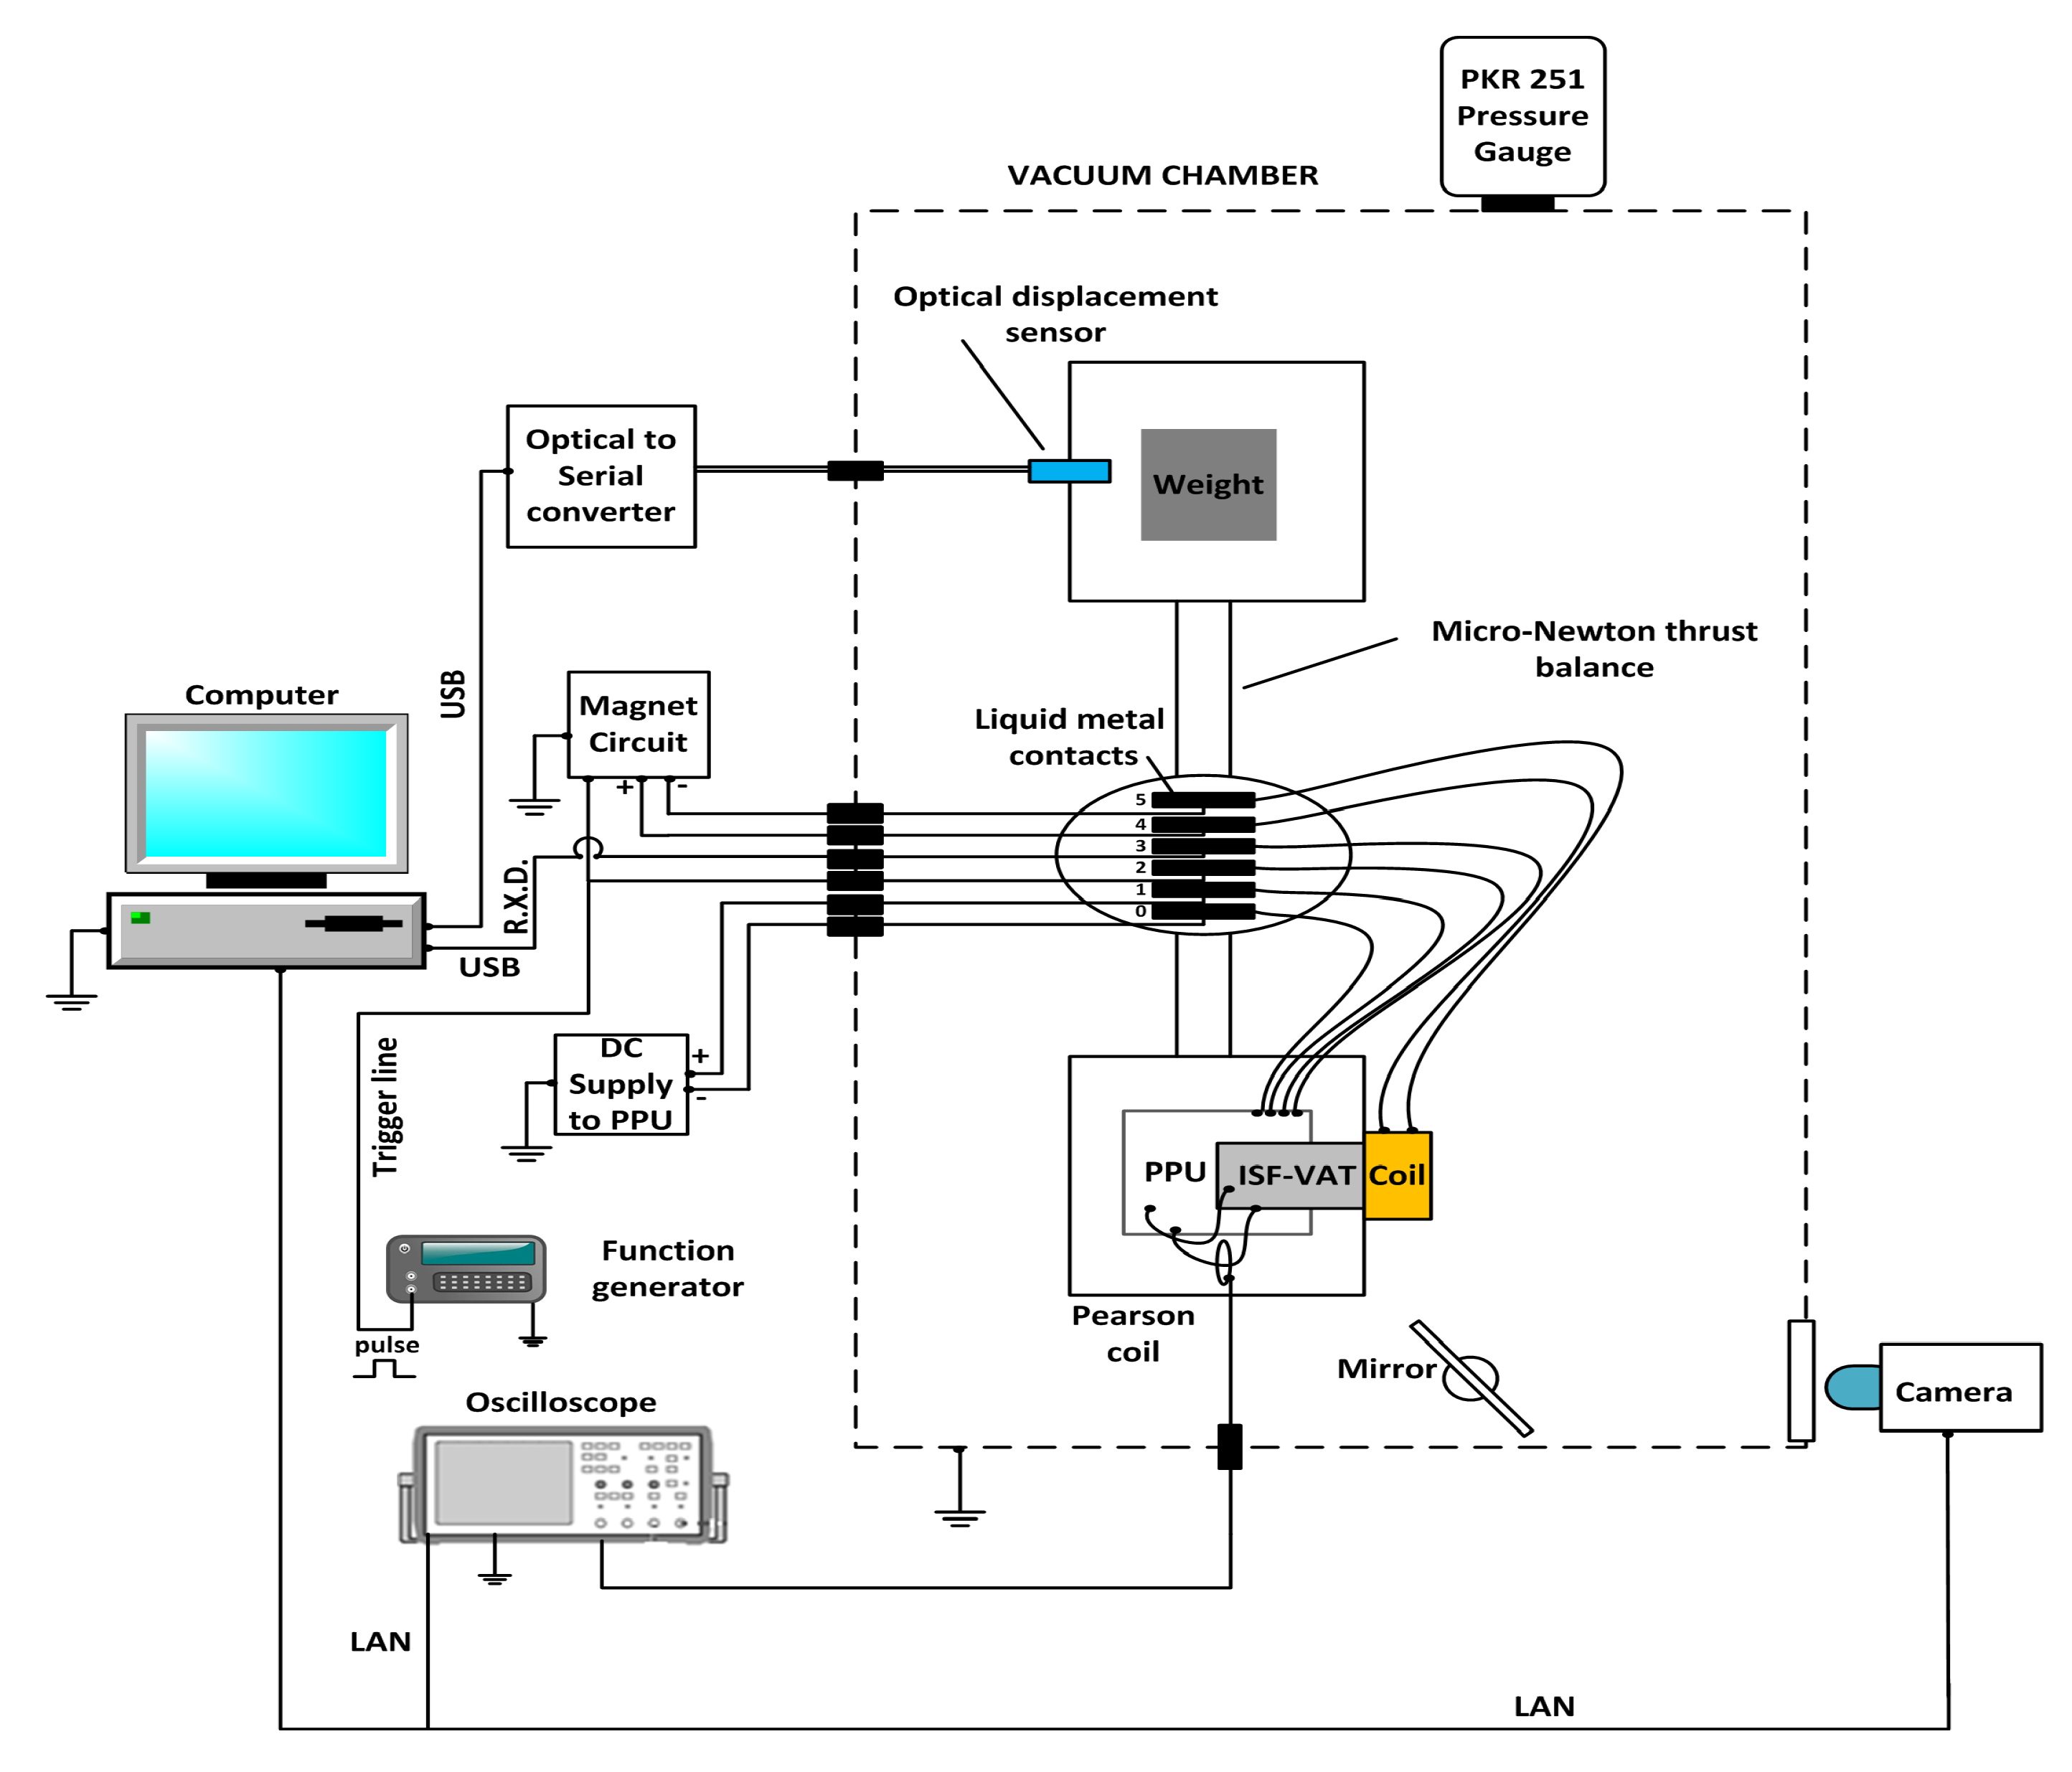
2.2. Experimental Electrical Setup

A schematic of the thruster and PPU circuit is shown in Figure 4. A 16 V dc laboratory power supply is use to power the PPU dc/dc converter that raises the voltage to ≈40 V. The PPU is comprised of three main components, a capacitor, a discharge coil, and a switch. The PM has a capacitor C 1 0.6 mF and a ferrite inductor L 1 ≈ 200 μ H. An insulated-gate bipolar transistor (IGBT) switch SW-1 is used to charge/discharge the inductor coil. The IGBT can be triggered either by an on board clock or by an external function generator. The triggering signal is a rectangular pulse with amplitude 0–10 V and a frequency f a r c . The “on” state determines the coil charging duration and is set at 120 μ s. The stored PPU coil energy can be calculated using ε L 1 = 1 / 2 L 1 I 2 160 mJ. L 1 may reduce below rated value due to ferrite saturation, affecting actual arc pulse energy.
The magnetic coil is powered by a dedicated magnetic circuit. A commercial dc power supply (Lambda, Zup-120) is used as capacitor to discharge through the magnetic coil. It is synchronized with the thruster firing pulses using a separate IGBT switch SW-2 having inverted logic compared to SW-1. The time dependent response of magnetic coil current I c o i l , hence the magnetic induction B, is determined by the power supply voltage and the R-C of the magnetic circuit.
Time dependent measurements of arc current I a r c and arc voltage V a r c were performed using a Pearson current monitor (Model 150) and a differential high voltage probe. In addition I c o i l was also measured using a hall current monitor. These signals are simultaneously recorded on a 5 GS/s oscilloscope.

2.3. Experimental Thrust Measurement Setup

The experiments were performed in APL’s vacuum chamber, a cylindrical chamber of 1.2 m long and 0.6 m in diameter. Two 700 L/s turbo-molecular pumps, each backed by 300 L/m rotary vane pump, are used to maintain a pressure 10 6 mbar throughout the test. The chamber pressure is measured by a full Range gauge (model PKR-251, Pfeiffer). As shown in Figure 5 the PM is placed inside the vacuum chamber on a commercial torsion thrust balance (FOTEC) [17] with 0.2 μ N thrust resolution and 500 μ N maximum range. The balance was operated in deflection mode with a counter weight on the opposite side of the balance arm. The deflection signal is transmitted optically and recorded on a PC at a sample rate of 2 Hz. Liquid metal contacts are used to decouple the thruster wires from the chamber feedthroughs. The magnetic circuit electronics is placed outside the vacuum chamber. An electrostatic force actuator producing known force was used for thrust calibration. Thrust bias was shown to be negligible at all tested magnetic coil currents. During the experiments video recording of the plume was performed using a 1 MP charged coupled device (CCD) camera set at 60 fps and 1 ms integration time.

3. Experimental Results

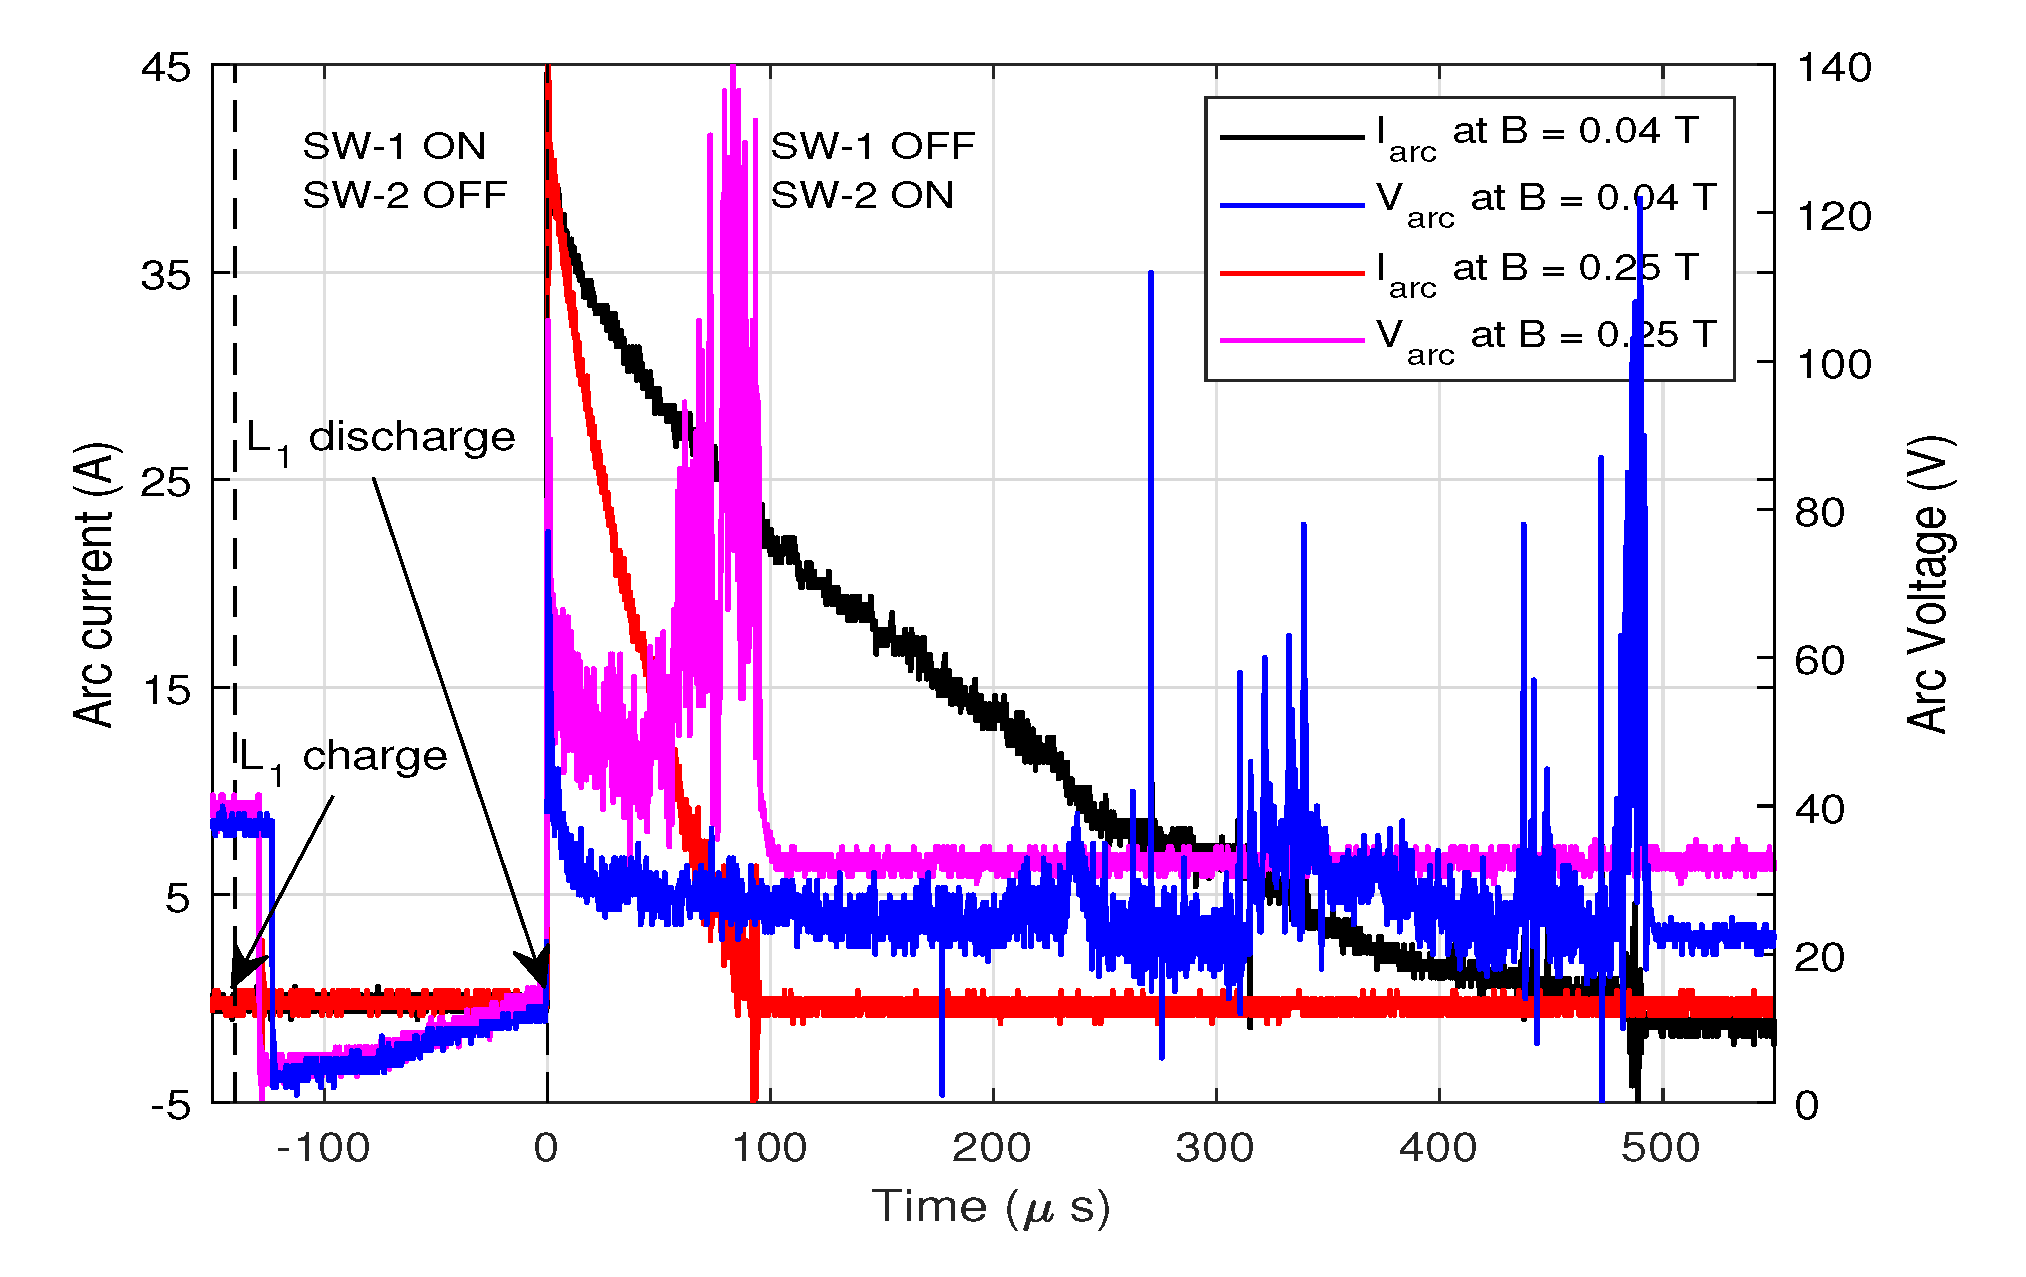
3.1. Single Pulse Results

At first the electrical characteristics of single pulse discharge were measured. The I a r c and V a r c were measured simultaneously with a sampling rate of 2.5 MS/s. Figure 6 shows a typical measurement result.The following stages are observed: (1) SW-1 is in “on” state to charge the PPU discharge coil; (2) then SW-1 is set to “off” state, at this moment the rapid change in d I / d t produces a voltage spike reaching 1 kV; (3) then an arc is formed ≈1 μ s and then starts to decay.
The initial I a r c is determined by the coil charging time and is same for every pulse. Therefore, the magnetic energy stored in the coil is also same for each pulse. However, as we observe in Figure 6, the arc current duration is not constant and is strongly depend on the applied magnetic field. This can be explained by the fact that arc energy is ε a r c = 0 t a r c I a r c V a r c d t ε L 1 = c o n s t . Assuming fixed energy, higher arc voltage V a r c that is associated with higher magnetic induction limits the arc current duration.
Due to the nature of cathodic arc formation [4], vacuum arc operation is characterized by statistical fluctuation and therefore fluctuation in arc duration t a r c are expected. In order to characterize a mean arc duration in each magnetic case, we have analyzed 1000’s of pulses. Using 20 μ s binning, a Weibull probability distribution function (PDF) was fitted with the data and the mean and error in arc duration are calculated. These results are presented in Table 1. During arc discharge the V a r c is also not constant, notwithstanding a mean value can be calculated and is presented in Table 1. A Gaussian statistics is used to calculate the accumulated charge during the arc pulse Q i and the arc pulse duration t a r c . Using the fact that the arc voltage is nearly constant during the arc pulse, the arc pulse energy can be calculated as ε a r c Q i V a r c .
The time evolution of the I c o i l during a pulse is shown in Figure 7. As we observe that I c o i l itself changes during the arc discharge. For comparison, the measured duration of 10 % reduction from maximum magnetic induction (from arc ignition) is provided in Table 1.
The thruster plume luminosity is shown in Figure 8. Images are taken in color without any filtering, the integration time is sufficient to capture only a single pulse. The largest contribution to the luminosity in the images are from excited T i + and T i + + lines, as average charge state is Z 2.1 [18,19]. The plume exhibits significant change in geometry at different magnetic induction values. The plume is hemispherical at B = 0 T whereas at B 0.12 T the plume is larger and has a diamond like shape, wider at the base and is pointed in downstream. At the highest magnetic induction tested B 0.25 T the plume becomes beam like.

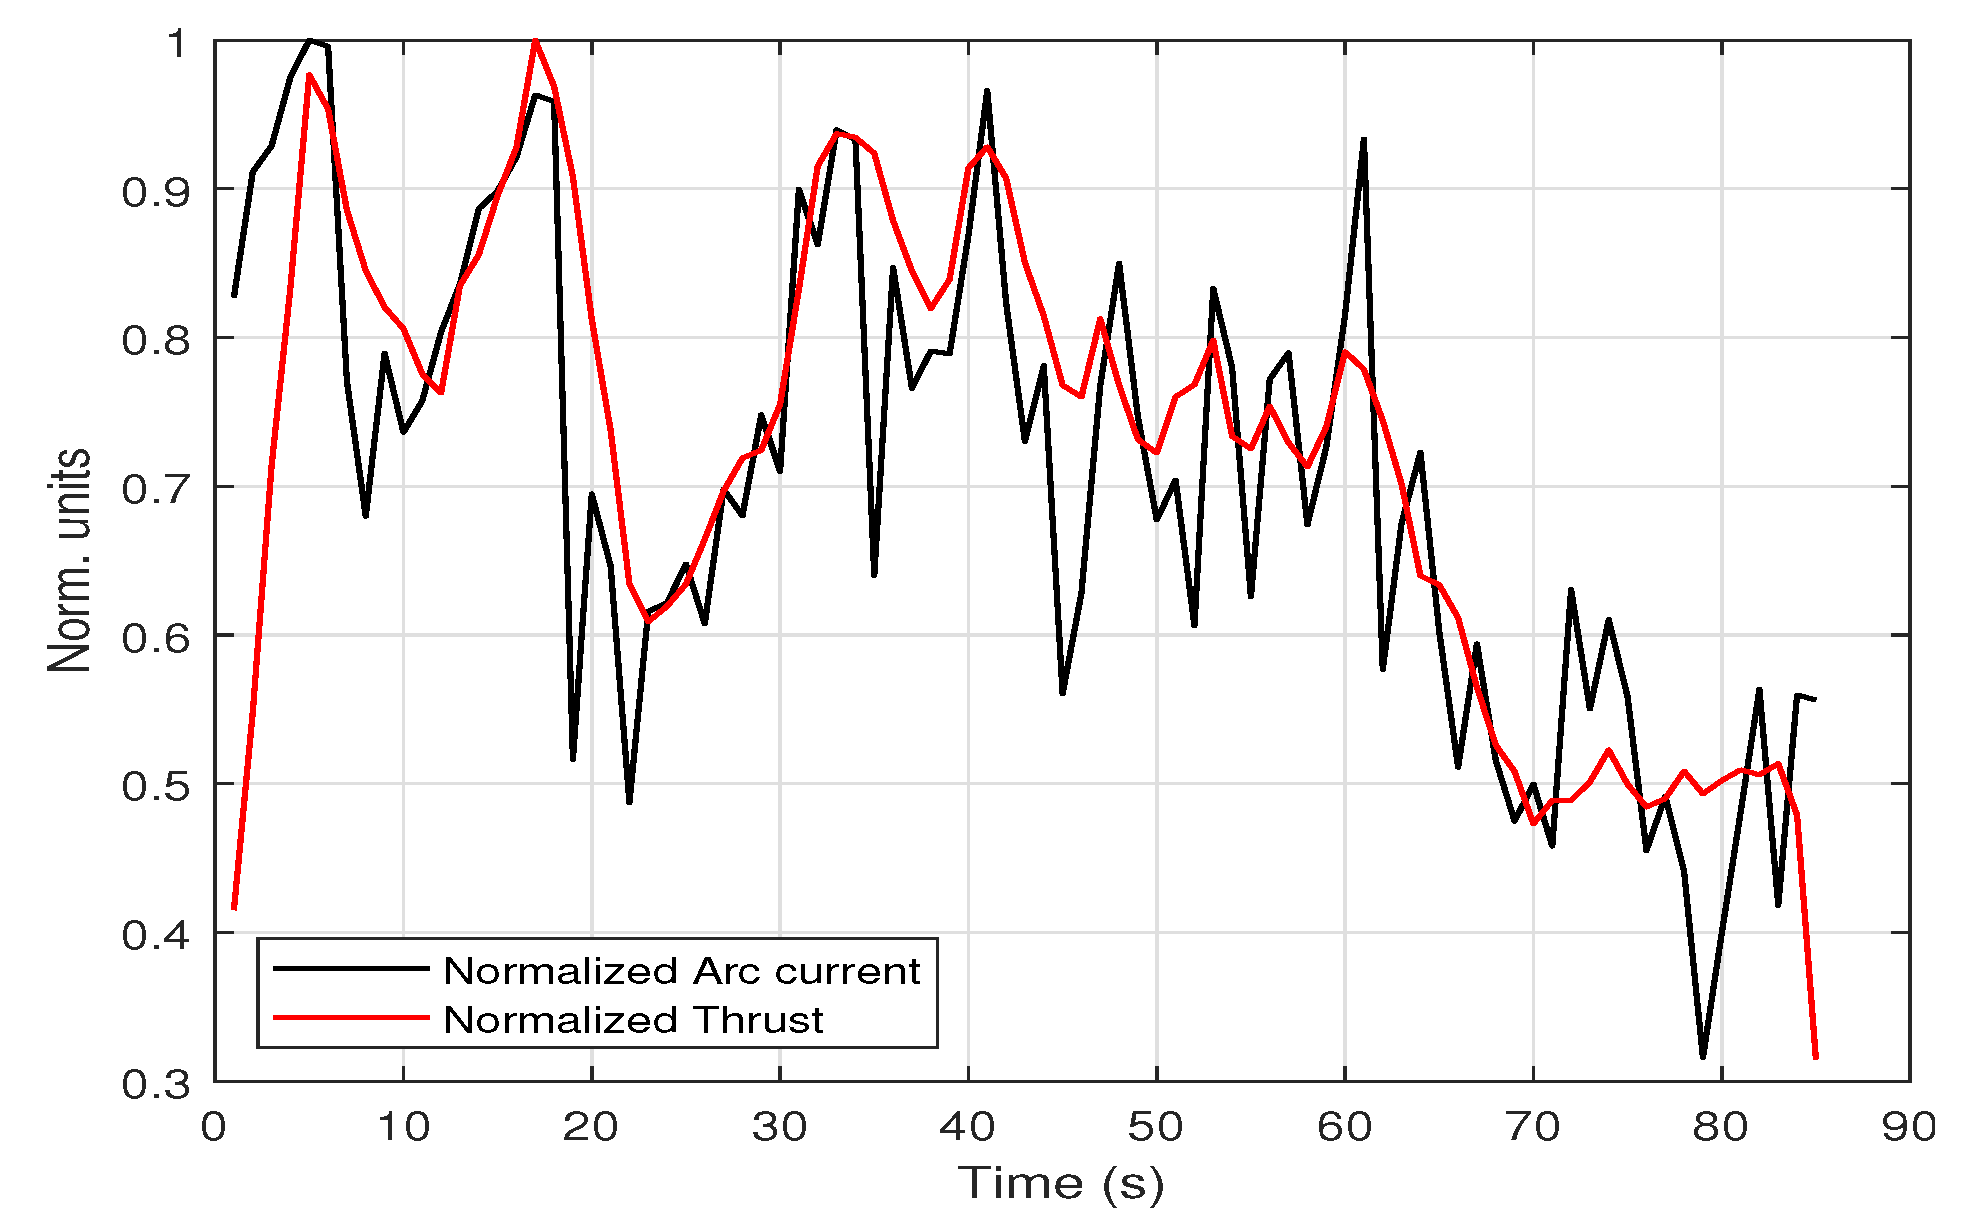
3.2. Single Firing Cycle Results

The thruster was operated for a firing cycle duration of t f c 90 s at a pulse repetition rate of f p = 17 Hz for a total number of N p = f p t f c 1500 pulses. Between each firing cycle the cathode was set to advance at an equivalent cathode mass flow rate m ˙ f e e d 2.1 μ g/s. Both thrust and I a r c are measured in each firing cycle.
During these tests the I a r c was recorded using an oscilloscope. Due to the limited oscilloscope buffer size, I a r c was recorded with a maximum sampling rate of 50 kS/s. This measurement was fully automated using a PC running matlab to acquire I a r c data via the oscilloscope and then post process using software edge detect. A valid pulse is considered between currents of 10–40 A. This provided us with 10–40 samples per pulse depending on arc duration t a r c . Using trapezoid integration, the software calculates the accumulated charge per pulse Q i . The Q i statistics, taken during a single firing cycle, at different B are shown in Figure 9. We observe that the mean Q i value increases with B and approaches a normal distribution. However at B = 0.25 T, Q i reduces to 2.7 ( ± 0.86 ) mC. In all cases miss-firings comprise less than 5% of the population.
Thrust measurements were performed at several magnetic induction values. During the tests, thrust data are continuously recorded at a frequency of 2 Hz. These data are then post processed using matlab. As shown in Figure 10b the raw data is corrected by fitting a linear drift and then subtracting it. The corresponding drift corrected thrust output for same cases are shown in Figure 10a. We observe that in all cases thrust is gradually decreases with firing time. This behavior can be explained by the gradual erosion of the cathode, since cathode advance is performed only after the firing cycle. It is the reason why cathode feeding is necessary for long duration operation.
Since both the thrust T and I a r c are measured independently, it is interesting to correlate them. In order to do so we first calculate I ^ a r c , that is computed by averaging I a r c over 0.5 s period, to match the sampling time with thrust. An example result for a single firing cycle is shown in Figure 11. For this specific data set the cross correlation value between T and I ^ a r c is:
ρ T I ^ a r c = σ T I ^ a r c σ T σ I ^ a r c 81 % ,
where, σ T I ^ a r c is the covariance, σ T and σ I ^ a r c are the thrust and arc current variance.

3.3. Multiple Firing Cycle Results

In order to investigate the thruster time-averaged-performance, thrust T, arc power P, and mass consumption were measured in a sequence of at least 4 firing cycles. These parameters were then averaged over entire data set. The time averaged results for the thrust < T ( B ) > is shown in Figure 12a. We observe that the thrust increases significantly for 0 < B < 0.07 T and reaches a maximum value at B 0.2 T, then significantly reduces at B 0.25 T. For the B = 0 T case two results are shown: one without the magnetic coil and the other with it fitted on the thruster anode (as shown in Figure 3).
The total charge per firing cycle is given by:
Q = i = 1 N p Q i .
The average arc power is calculated by:
< P ( B ) > = Q t f c < V a r c ( B ) > ,
where the mean arc voltage < V a r c > is taken from Table 1. The results are shown in Figure 12b. Q is increasing with magnetic induction in the range 0 < B < 0.04 , maintains constant value within 0.04 < B < 0.12 and then decreases as magnetic induction becomes stronger. We observe that < P ( B ) > depends weakly on the magnetic induction. The result is expected as it represents that the PPU output power ε L 1 f p = c o n s t and does not depend on the discharge.
The average thrust to power ratio < T / P > and thrust to charge < T / Q > can be calculated, and the results are shown in Figure 13. At B = 0 T, the no coil case is significantly higher in < T / P > with respect to the with-coil case. With application of magnetic induction, < T / P > increases rapidly between 0 < B < 0.07 T. The maximum < T / P > is obtained at B = 0.2 T and then reduces at B = 0.25 T. Whereas, the average < T / Q > is increases with B.
The thruster actual mass flow rate m ˙ m e a s , that is potentially different than the imposed cathode feeding rate m ˙ f e e d , was also evaluated by measuring the cathode erosion after each test. Precise mass consumption measurements were obtained using laser profilometry of the cathode surface, measuring its shape and depth, before and after test. This technique is described in detail in Ref. [20]. The results are provided in Table 2.
Additional thruster parameters can be calculated, for example the effective specific impulse:
I s p = < T > m ˙ m e a s g 0 ,
where g 0 = 9.81 m/s2. The results are shown in Figure 14a. We observe that the I s p increases steadily with magnetic induction and that between 0.12–0.2 T the rate of increase is lower. At 0.25 T there is a significant jump in I s p , this is due to lower mass erosion (see Table 2).
The thruster efficiency can be defined as:
η t h r u s t e r = < T > 2 2 m ˙ m e a s < P > .
As shown in Figure 14b the thruster efficiency is monotonically increasing with magnetic induction, increasing from ∼1.1% at B = 0 T to 4.5 % at B = 0.25 T.

4. Discussion

The performance enhancement of the ISF-VAT with application of external magnetic field can be attributed to both beam collimation and plasma ion acceleration in the magnetic nozzle. Models for both effects are discussed in this section.

4.1. Performance Enhancement by Beam Collimation

It is well known that, beam collimation is an important factor in thruster performance and efficiency [21]. From optical observation of the plume (Figure 8), we note a change in plume shape from hemispherical to beam like. Since the arc power is nearly constant, at least some of the thrust enhancement can be explained by beam collimation. We can express the total ion current spatial distribution by:
d I p = I p π cos θ sin θ d θ d φ ,
where, sin θ d θ d φ is the solid angle differential, θ and φ are the azimuthal and polar angles defined with respect to the z direction (i.e., perpendicular to the anode-cathode plane). Therefore the differential ion current in the z direction can be defined as:
d I p , z = d I p cos θ = I p π cos 2 θ sin θ d θ d φ .
By integrating Equation (7) over a solid angle we can obtain the plume’s geometrical enhancement factor:
C t = I p , z I p = 1 π φ = 0 2 π θ = 0 π 2 θ 0 cos 2 θ sin θ d θ d φ .
For θ 0 = π / 2 we obtain C t 0 = 2 / 3 , the well known beam divergence factor for cosine distribution [4].
For a fully collimated plasma with C t = 1 we expect that the thrust will increase by 50 % compared to cosine distribution. For the geometry shown in Figure 3 where the magnetic coil partially blocks the anode and θ 0 = tan 1 ( L / r c o i l ) the factor becomes C t = 0.52 . Therefore, < T / P > 0 , c o i l = ( 4.4 / 0.67 ) × 0.52 = 3.4 μ N/W and < T / Q > 0 , c o i l = ( 2.12 / 0.67 ) × 0.52 = 1.65 μ N/C, which are indeed the measured values as shown in Figure 13. However, the improvement in performance at high magnetic induction is greater and can only be explained by additional acceleration of the beam.

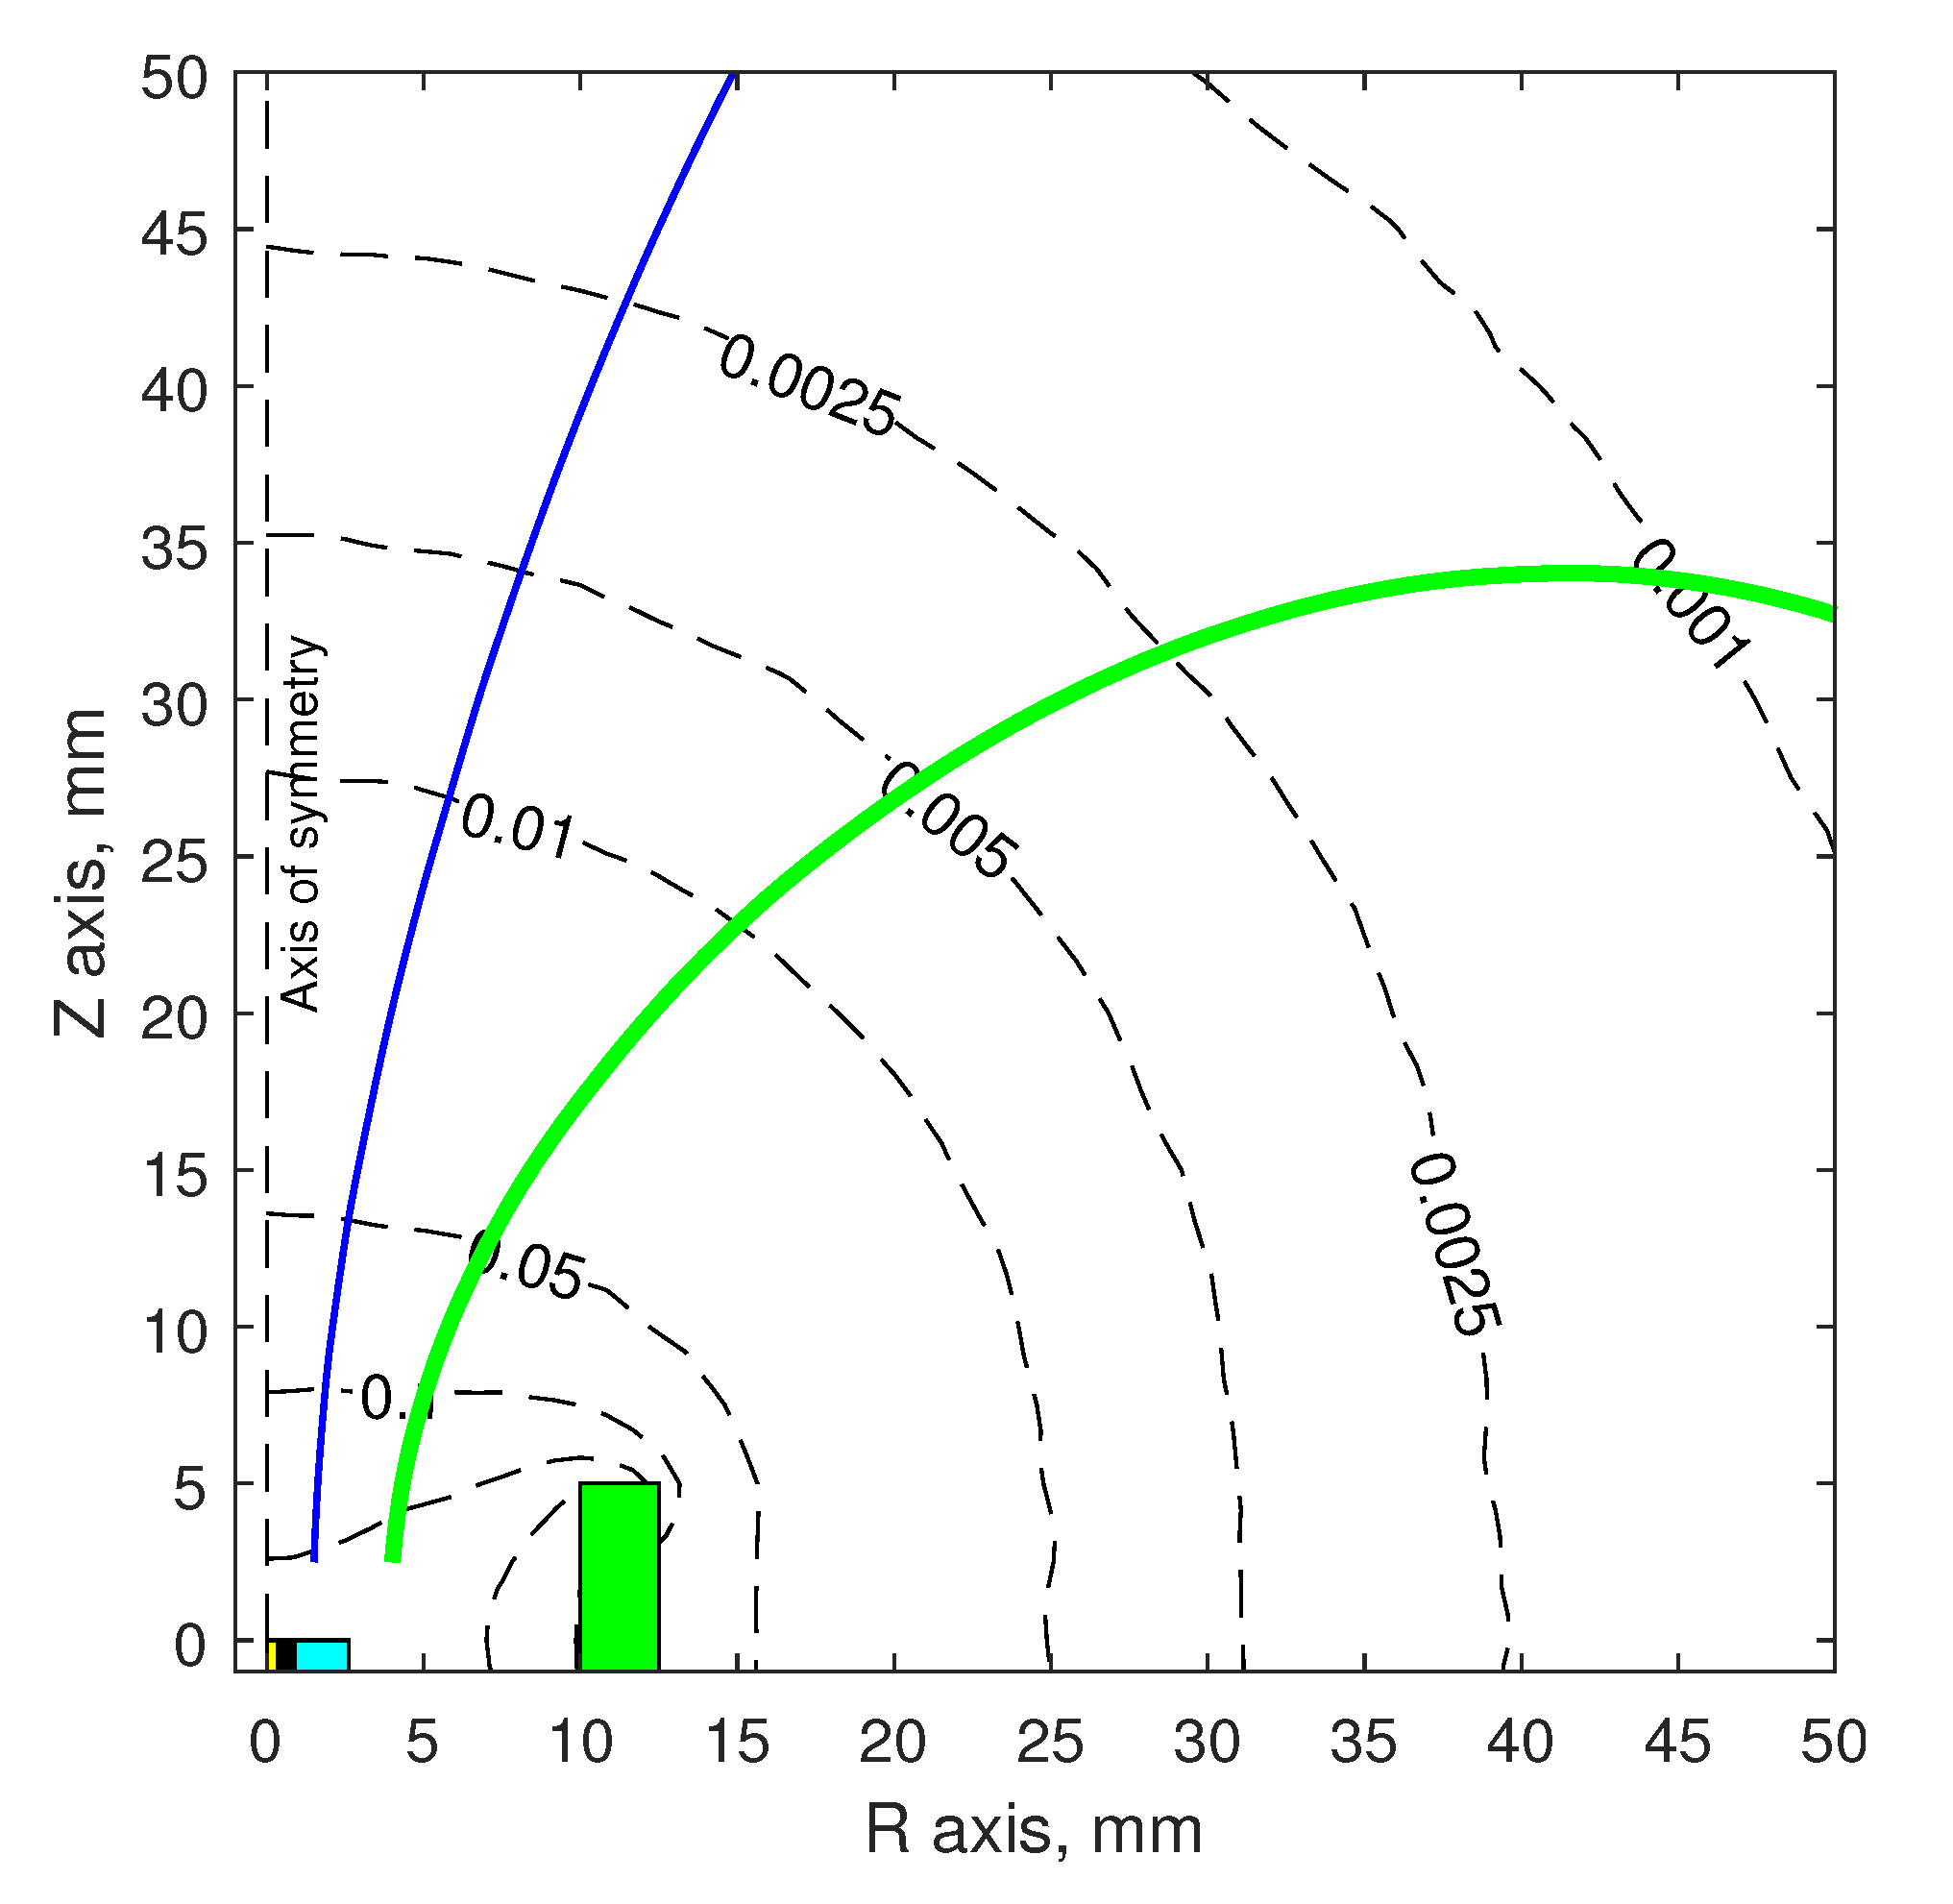
4.2. Performance Enhancement by Magnetic Nozzle Effect

As observed in ring VATs [8] ions can be accelerated in the plume. This acceleration can be explained by the magnetic nozzle effect on the plasma ions. In a magnetic nozzle, electron thermal energy is converted to directed (axial) ion energy via ambipolar electric field. Here we follow a 1D magnetic nozzle model detailed in Ref. [22]. We assume that, for elevated magnetic induction, the plasma emitted from the cathode is fully collimated. In addition we also assume a fully ionized and collision-less plasma, where electrons are magnetized (but ions are unmagnetized) in the applied external B. In this case the plasma can be considered a quasi-1D fluid in a 1D magnetic nozzle [22]. The nozzle equations are:
R ^ v 2 ( z ^ ) n ^ M = M 0 ; n ^ = e ϕ ^ ; M = ( M 0 2 2 ϕ ^ ) ,
where, z ^ is the normalized axial distance, R ^ v is the normalized plasma cross-section radius, n ^ is the normalized density, M is the Mach number, and ϕ ^ is normalized electric potential. The Mach number is defined as M = u i , z / c s , where c s = Z T e / M i is the plasma ion acoustic speed. It is known that in vacuum arcs, electron temperature T e 3 eV [4,18], average ion charge state Z = 2.1 [18,19] and Ti ion mass M i 7.95 × 10 26 kg, therefore c s 3.6 km/s. Without magnetic field, the ion velocity u i , z 16 km/s [23], therefore for B = 0 T, M 0 = 4.49 . For B > 0 T, Equation (9) is used to calculate the Mach number at nozzle exit M f .
The nozzle shape is determined by the B-field lines that intersect the radial extent of the plasma R v , 0 . Optical observation of the plume in Figure 8b does not allow accurate determination of R v , 0 , instead, we denote two possible outliers: R v , 0 = 3.8 mm (green line) and R v , 0 = 1.6 mm (blue line). The two nozzle topologies (short and long correspondingly) are shown in Figure 15. The spatial variation of calculated Mach number M for the two nozzle configurations are shown in Figure 16 and from this, the maximum Mach number can be estimated as: M f , s h o r t 5.4 and M f , l o n g 5.75. We can define a velocity increment factor due to magnetic nozzle effect C M = M f / M 0 , the corresponding coefficients for the two nozzles are C M , s h o r t 1.2 and C M , l o n g 1.28.
The thrust to power ratio of the VAT can be estimated by:
< T / P > model = < T / P > 0 C t 0 C M C t ,
Similarly, the thrust to charge ratio is:
< T / Q > model = < T / Q > 0 C t 0 C M C t ,
where, < T / P > 0 and < T / Q > 0 are the no coil measurement. Equations (10) and (11) allow to evaluate the maximum performance of the thruster. Assuming full ion beam acceleration C M = 1.28 and beam collimation C t = 1 , the < T / Q > model 4.0 μ N/C and < T / P > model 9.0 μ N/W. These results are in good agreement with the maximum values obtained from the measurement where < T / Q > B = 0.25 T = 3.7 μ N/C and < T / P > B = 0.2 T = 8.6 μ N/W. For B = 0.25 T case, the measured < T / P > result is worse than the calculated one. This can be explained by the significant increase in V a r c (Table 1). Here, V a r c is increased by ∼70% (w.r.t. no nozzle case) with corresponding reduction in arc duration and mass consumption.

5. Conclusions

The thrust to power ratio of co-axial VAT in weak magnetic nozzle increases substantially over the no magnetic version, 8.6 μ N/W versus 4.5 μ N/W respectively. The improvement in thruster performance can be attributed to beam collimation and a weak magnetic nozzle effect that accelerates the plasma. A semi-empirical model was derived that provides good estimation of thruster maximum performance. However, it was empirically shown that further increase in magnetic induction B > 0.2 T causes the T / P to diminish, due to significant decrease in mass consumption at a given arc power. It is planned to further develop the model to include effects of changing ion charge state and erosion rate versus magnetic induction.

Author Contributions

Conceptualization, S.C. and I.K.; methodology, S.C. and I.K.; software, S.C.; validation, S.C. and I.K.; formal analysis, S.C.; investigation, S.C.; resources, I.K.; data curation, S.C.; writing–original draft preparation, S.C.; writing–review and editing, I.K.; visualization, S.C. and I.K.; supervision, I.K.; project administration, I.K.; funding acquisition, I.K. All authors have read and agreed to the published version of the manuscript.

Funding

This research was funded in part by Israeli Ministry of Science grant number 313569.

Acknowledgments

This work was funded in part by the Israeli Ministry of Science, Technology and Space.

Conflicts of Interest

The authors declare no conflict of interest.

References

  1. Levchenko, I.; Bazaka, K.; Ding, Y.; Raitses, Y.; Mazouffre, S.; Henning, T.; Klar, P.J.; Shinohara, S.; Schein, J.; Garrigues, L.; et al. Space micropropulsion systems for Cubesats and small satellites: From proximate targets to furthermost frontiers. Appl. Phys. Rev. 2018, 5, 011104. [Google Scholar] [CrossRef]
  2. Kronhaus, I.; Schilling, K.; Pietzka, M.; Schein, J. Simple orbit and attitude control using vacuum arc thrusters for picosatellites. J. Spacecr. Rockets 2014, 51, 2008–2015. [Google Scholar] [CrossRef]
  3. Schein, J.; Qi, N.; Binder, R.; Krishnan, M.; Ziemer, J.; Polk, J.; Anders, A. Low mass vacuum arc thruster system for station keeping missions. In Proceedings of the 27th International Electric Propulsion Conference, Pasadena, CA, USA, 15–19 October 2001. [Google Scholar]
  4. Anders, A. Cathodic Arcs: From Fractal Spots to Energetic Condensation; Springer Science & Business Media: New York, NY, USA, 2009; Volume 50. [Google Scholar]
  5. Boxman, R.L.; Sanders, D.M.; Martin, P.J. Handbook of Vacuum Arc Science & Technology: Fundamentals and Applications; Noyes Publication: Park Ridge, NJ, USA, 1996. [Google Scholar]
  6. Zhuang, T.; Shashurin, A.; Brieda, L.; Keidar, M. Development of micro-vacuum arc thruster with extended lifetime. In Proceedings of the 31st International Electric Propulsion Conference, Ann Arbor, MI, USA, 20–24 September 2009. [Google Scholar]
  7. Kolbeck, J.; Anders, A.; Beilis, I.I.; Keidar, M. Micro-propulsion based on vacuum arcs. J. Appl. Phys. 2019, 125, 220902. [Google Scholar] [CrossRef] [Green Version]
  8. Keidar, M.; Schein, J.; Wilson, K.; Gerhan, A.; Au, M.; Tang, B.; Idzkowski, L.; Krishnan, M.; Beilis, I.I. Magnetically enhanced vacuum arc thruster. Plasma Sources Sci. Technol. 2005, 14, 661. [Google Scholar] [CrossRef]
  9. Baranov, O.O.; Cvelbar, U.; Bazaka, K. Concept of a magnetically enhanced vacuum arc thruster with controlled distribution of ion flux. IEEE Trans. Plasma Sci. 2017, 46, 304–310. [Google Scholar] [CrossRef]
  10. Keidar, M.; Zhuang, T.; Shashurin, A.; Teel, G.; Chiu, D.; Lukas, J.; Haque, S.; Brieda, L. Electric propulsion for small satellites. Plasma Phys. Control. Fusion 2014, 57, 014005. [Google Scholar] [CrossRef]
  11. Zhuang, T.; Shashurin, A.; Denz, T.; Keidar, M.; Vail, P.; Pancotti, A. Performance characteristics of micro-cathode arc thruster. J. Propul. Power 2014, 30, 29–34. [Google Scholar] [CrossRef]
  12. Tang, B.; Idzkowski, L.; Au, M.; Parks, D.; Krishnan, M.; Ziemer, J. Thrust improvement of the magnetically enhanced vacuum arc thruster (MVAT). In Proceedings of the International Electric Propulsion Conference, IEPC, Princeton, NJ, USA, 31 October–4 November 2005; Volume 304, p. 2005. [Google Scholar]
  13. Kronhaus, I.; Laterza, M.; Maor, Y. Inline screw feeding vacuum arc thruster. Rev. Sci. Instrum. 2017, 88, 043505. [Google Scholar] [CrossRef]
  14. Kronhaus, I.; Chowdhury, S.; Laterza, M. Axial Magnetic Field Effect on Vacuum Arc Thruster Performance. In Proceedings of the 36th International Electric Propulsion Conference, IEPC-2019-662, Vienna, Austria, 15–20 September 2019. [Google Scholar]
  15. Kronhaus, I. Inline Screw Feeding Vacuum Arc Thruster. U.S. Patent App. 16/310,175, 31 October 2019. [Google Scholar]
  16. Meeker, D.C. Finite Element Method Magnetics; Version 4.2. User’s Manual; University of Virginia: Charlattesville, VA, USA, 2009. [Google Scholar]
  17. Seifert, B.; Reissner, A.; Buldrini, N.; Plesescu, F.; Scharlemann, C.; Bulit, A.; del Amo, J.G. Development and verification of a μN thrust balance for high voltage electric propulsion systems. In Proceedings of the 33rd International Electric Propulsion Conference, Washington, DC, USA, 6–10 October 2013. [Google Scholar]
  18. Grondona, D.; Kelly, H.; Minotti, F. Hydrodynamic model for a vacuum arc operated with background gas: Theory and experimental validation. J. Appl. Phys. 2006, 99, 043304. [Google Scholar] [CrossRef]
  19. Brown, I.G. Vacuum arc ion sources. Rev. Sci. Instrum. 1994, 65, 3061–3081. [Google Scholar] [CrossRef]
  20. Laterza, M.; Kronhaus, I. Analysis of Erosion and Redeposition Processes in Coaxial Vacuum Arc Thrusters. In Proceedings of the 36th International Electric Propulsion Conference, IEPC-2019-661, Vienna, Austria, 15–20 September 2019. [Google Scholar]
  21. Goebel, D.M.; Katz, I. Fundamentals of Electric Propulsion: Ion and Hall Thrusters; John Wiley & Sons: Hoboken, NJ, USA, 2008; Volume 1. [Google Scholar]
  22. Ahedo, E.; Merino, M. Two-dimensional supersonic plasma acceleration in a magnetic nozzle. Phys. Plasmas 2010, 17, 073501. [Google Scholar] [CrossRef]
  23. Kronhaus, I.; Laterza, M.; Linossier, A.R. Experimental Characterization of the Inline-Screw-Feeding Vacuum-Arc-Thruster Operation. IEEE Trans. Plasma Sci. 2018, 46, 283–288. [Google Scholar] [CrossRef]
Figure 1. A cross sectional schematic of the coaxial-VAT (a) and ring-VAT (b). The direction of plasma ejection from the cathode spot is indicated.
Aerospace 07 00082 g001
Figure 2. Schematics of the ISF-VAT with added magnetic air coil.
Aerospace 07 00082 g002
Figure 3. R-Z cross section of the thruster and magnetic coil showing calculated field lines. Magnetic induction calculated for I c o i l = 105 A is indicated by background color. r c o i l and L are the inner radius and blocked length of the coil.
Aerospace 07 00082 g003
Figure 4. Schematic of the ISF-VAT circuit along with the B field generation circuit, showing external trigger setup.
Aerospace 07 00082 g004
Figure 5. Schematic of the experimental setup and diagnostics system.
Aerospace 07 00082 g005
Figure 6. Arc current and voltage versus time at two magnetic induction values, each measured during a single pulse. Arrows indicate PPU coil charge and discharge time.
Aerospace 07 00082 g006
Figure 7. Measured arc current and magnet current for B = 0.25 T and B = 0.04 T case. Blue and green dotted lines represents the time duration for I c o i l variation within 10 % at corresponding B-field.
Aerospace 07 00082 g007
Figure 8. Photographs of the thruster plume (white region) at different magnetic induction values, red line indicate the anode plane (in Figure 8c the red line is near the right edge of the image). No coil case (a) and two cases with assembled magnetic coil: B = 0.12 T (b) and B = 0.25 T (c). Blue and green lines in (b) represent a selected plume diameter.
Aerospace 07 00082 g008
Figure 9. Charge per pulse Q i statistics over a firing cycle measured at different magnetic inductions.
Aerospace 07 00082 g009
Figure 10. Thrust versus time measurement for a single firing cycle at different magnetic inductions (a). Drift corrections are shown as dashed lines (b).
Aerospace 07 00082 g010
Figure 11. Normalized thrust and arc current versus time, measured during a single firing cycle.
Aerospace 07 00082 g011
Figure 12. Average thrust versus magnetic induction. B = 0 “no coil” result is indicated in red (a). Average arc power and total charge versus magnetic induction (b).
Aerospace 07 00082 g012
Figure 13. Thrust to arc power (a) and thrust to total charge (b) versus magnetic induction. B = 0 “no coil” results are indicated in red.
Aerospace 07 00082 g013
Figure 14. Thruster Isp (a) and efficiency (b) versus magnetic induction. B = 0 “no coil” results are indicated in red.
Aerospace 07 00082 g014
Figure 15. R-Z plot of magnetic field lines representing the nozzle topology for R v , 0 = 1.6 mm (long nozzle) indicated by thin blue line and R v , 0 = 3.8 mm (short nozzle) indicated by thick green line. Magnetic streamlines calculated for B = 0.2 T are indicated by dashed lines. The cathode tip is found at ( R , Z ) = ( 0 , 0 ) . The cathode (yellow-box), insulator (black-box), anode (Cyan box), and air coil (green-box) positions are also shown here.
Aerospace 07 00082 g015
Figure 16. Calculated Mach number versus axial position along the nozzle extent. The M f for each nozzle case are marked as well.
Aerospace 07 00082 g016
Table 1. Measured arc voltage < V a r c > , arc duration, total charge and arc energy per pulse versus maximum magnetic coil current I c o i l , m a x , shown results are for I a r c , m a x = 40 A.
Icoil,max (A)Δt10% of Icoil,max (μs)Bmax (T)< Varc > (V)tarc (μs/pulse)Qi (mC/pulse)εarc (mJ/pulse)
0N.A.0.0041.53 ± 1.63135 ± 792.70 ± 1.59112.13 ± 66
93000.0427.77 ± 0.50217 ± 684.34 ± 1.36120.52 ± 38
272500.0729.03 ± 1.73214 ± 694.29 ± 1.38124.54 ± 40
451500.1234.30 ± 1.01216 ± 584.32 ± 1.17148.18 ± 40
701200.2032.57 ± 0.93192 ± 593.85 ± 1.19125.39 ± 39
1051100.2551.23 ± 1.33133 ± 432.66 ± 0.86136.27 ± 44
Table 2. Comparison between cathode average mass flow consumption, calculated from active feeding and direct measurement.
B (T) m ˙ f e e d ( μ g/s) m ˙ m e a s ( μ g/s)
0.002.11 ± 0.081.71 ± 0.03
0.042.11 ± 0.082.54 ± 0.11
0.072.11 ± 0.082.63 ± 0.15
0.122.11 ± 0.082.23 ± 0.05
0.202.11 ± 0.082.23 ± 0.12
0.252.11 ± 0.081.09 ± 0.05

