1. Introduction
The
more electrical aircraft is one of the most challenging objectives of the aviation industry and its main stakeholders. A lot of researches are conducted in order to bring significant innovation on board with the main aim to increase performance and safety, to reduce fuel consumption and emissions [
1,
2]. Both industrial players and governments from all over the world are very active on latter topics, a lot of effort has been spent and many funds are and will be available in next years to achieve well defined goals. For example, in Europe, the European Parliament has allocated a huge budget to help the transition towards a greener and safer aviation [
3]. A helpful resource to get those goals, is the advent of digital revolution. The more relevant role of avionics in flight control and management have pushed aircraft technology towards new limits. Fly by wire (FBW), distributed architectures, are only two of the main results achieved by the aerospace community that are certified to fly in our skies. Within this scenario, the H2020—Clean Sky 2 (under SYS ITD area) project MIDAS [
4] is an example. Novel architectures, such as the FBW, are successfully applied to large (Airbus A380) or military aircraft (Leonardo M-346) and will be the new standard for civil aviation and small aircraft transport (SAT) communities in next years [
5,
6].
The novel digital avionic solutions enable advanced flight control systems to be available also on smaller aircraft (e.g., commuter category). One of the safety-critical segment of the A/C control system is the air data system (ADS) that provides information from the external environment. In fact, from a general point of view, a simplex (not redundant) ADS provides some safety-critical data (e.g., speed, altitude) to automatic control systems needed for correct control and navigation purposes. To this aim, a complete air data set is derived from the following measurements:
Total pressure
Static pressure
Air temperature
Angle of attack,
Angle of sideslip,
The current ADS state-of-the-art mainly enables two kinds of solutions: one based on single function probe (SFP) (
Figure 1a), the other one based on multi function probe (MFP) (
Figure 1b). As can be deduced from
Figure 1b, MFPs integrate the necessary transducers so that they can be directly connected to a FCC instead of using dedicated devices (e.g., air data computer ADC) as in the case of the SFP-based solution. Moreover, MFPs also provides a measurement of a local flow angle in addition to pressure measurement. A third innovative category is (partially) based on synthetic sensors and one possible example is shown in
Figure 1c inspired to the MIDAS project.
The MIDAS project aims to provide an innovative ADS partially based on synthetic sensors exploiting the Smart-Air Data, Attitude and Heading Reference System (Smart-ADAHRS) patent. In particular, the proposed ADS solution is based on direct measure of dynamic pressure, static pressure and air temperature using dedicated sensors (e.g., SFP in the MIDAS project). The aerodynamic angles (angle of attack and angle of sideslip) are estimated as an indirect measure by means of data fusion between measured air data available and inertial data as described in [
7]. This particular choice was taken considering that the high accuracy level required to pressure and air temperature measurements is hardly achievable with synthetic sensors [
8]. On the contrary, previous research shows that common aerodynamic angle requirements, derived from flight control performances, can be satisfied with synthetic sensors [
9].
As a first impact, the MIDAS solution will cut weight, costs and emissions with respect to the other possible ADS solutions. Moreover, the ADS architectures presented in
Figure 1 shall be replicated (in duplex or triplex solutions) in order to achieve the safety objectives defined by the airworthiness authorities for large airplanes [
10], general aviation [
11] and, for instance, for next generation Urban Air Mobility (UAM) aircraft [
12]. From applicable safety objectives, it is clear that the automatic control systems could benefit of synthetic sensors due to high reliability levels to be guaranteed. In recent years, synthetic sensors, or analytical redundancy, have become more familiar concepts, because the avionic background is today mature to welcome such innovations [
13,
14].
As a second impact, the redundant ADS partially based on synthetic sensors (e.g., estimating AoA and AoS) introduces dissimilarities for some air data. Dissimilarity is crucial to overcome some issues related to common failure modes or incorrect failure diagnosis of modern ADS [
15,
16]. A consequent advantage is related to simplification of the whole ADS architecture. Redundancy aspect is quite easy to be managed on large passenger aircraft where there are no particular limitations for air data sensors protruding from the fuselage and cable/tube displacement inside the fuselage. Whereas, the same operation can become very challenging when the fuselage dimensions reduce (business aircraft, SAT or UAM).
In the field of the analytical redundancy techniques, several solutions can be adopted to virtually synthesize air data sensors [
17]. For example, the current work deals with a patented technology, named Smart-ADAHRS, based on neural networks [
18,
19].
Focusing on the angle of attack, the present work describes a data-driven approach suitable for a smarter design of synthetic sensors based on machine learning when working with real flight data. Given the big amount of data and uncertainties related to real measurement taken on board, it is possible have larger errors than required. For example, when data set used for training is unbalanced as the case of real flight data where the steady state flight conditions are quite negligible (as flight data records) with respect to the dynamic ones. This particular aspect will be investigated in this work in order to propose a methodology to avoid lack of performance during the steady-state flight conditions in favor of high accuracy during dynamic maneuvers. In fact, the main objective of the proposed approach is to increase the synthetic sensor performance during steady-state flight conditions while guaranteeing acceptable performance during the dynamic ones.
Firstly, quasi-steady conditions are identified automatically from the whole flight data records and they are used for data regression. The regression function is then used to generate virtual flight test data points in order to artificially enrich the training data set with steady state flight conditions. Secondly, the training data set is pruned by those flight data records not considered unique. By means of this two actions, an augmented and pruned training set is obtained with the objective to drastically reduce the ratio between dynamic and stationary flight test points. This dataset allows to achieve the aforementioned target, i.e., increase the performance during steady-state flight conditions.
Previous research is presented in
Section 2, in order to provide a suitable background to the present work. An overview of the proposed methodology is presented in
Section 3. The quasi-steady conditions identification approach is presented from an analytical point of view in
Section 4. The prune method is presented in
Section 5. Finally, the proposed approach is validated comparing results with previous works in
Section 6.
2. Background
In this work, synthetic sensors for aerodynamic angles are based on neural network techniques, as presented in previous works [
20,
21]. The core of the Smart-ADAHRS patent relies in exploitation of the already available data measured from attitude and heading reference system (AHRS) and ADS to provide an estimation of the aerodynamic angles, angle of attack (
) and angle of sideslip (
), as described in
Figure 2b.
According to the Universal Approximation Theorem, a multilayer perceptron (MLP) is able to uniformly approximate any function inside the hypercube. The key-to-success to design an accurate MLP, obviously, is the training data set used for the learning process. The training stage, based on flight data, therefore, is crucial for the correct learning process of the synthetic sensors.
For this work, flight data collection is the result of a collaboration between different entities. The Smart-ADAHRS technological demonstrator was developed by Politecnico di Torino and it is able to record all the input signals needed by the MLP. Target values (AoA and AoS) are measured by the Flight Test Instrumentation (FTI) developed by the Politecnico di Milano [
22], which manages the flight test campaign of the ultra light machine (ULM). The test aircraft is the G-70 from Ing. Nando Groppo S.r.l. [
23].
In previous works, it emerged that the training data set needs some pre-processing manipulations in order to avoid common learning issues [
24]. The training procedure results in one of the several local minima and to increase the probability of selecting the most valid can be mitigated with several techniques: e.g., splitting flight data, re-training with different initial values, a quasi-uniform hypercube distribution. The latter is obtained by means of a dedicated flight test campaign, with maneuvers able to cover most of the flight envelope and exciting the natural modes of the A/C. Moreover, a uniform distribution of flight data inside the hypercube is beneficial to avoid that the MLP minimizes the error mainly in local area rather than on the entire hypercube.
It was noted that the flight data collected on the ULM are more numerous during dynamic rather than steady flight conditions. The ratio between quasi-static test points and dynamic ones is about
. This lead to a common error that authors documented in [
25]. Verification of synthetic sensors (or analytical estimators—observers, Kalman filters, etc.) is often carried out using dynamic source of data, such as those from flight tests. As aforementioned, this work is focused on the longitudinal dynamics and one of the objectives is to improve the estimation of the synthetic sensor (SS) during steady state conditions. A set of steady conditions can be manually generated given the A/C weight, pitch angle and dynamic pressure in order to fed the SS and verify its performance.
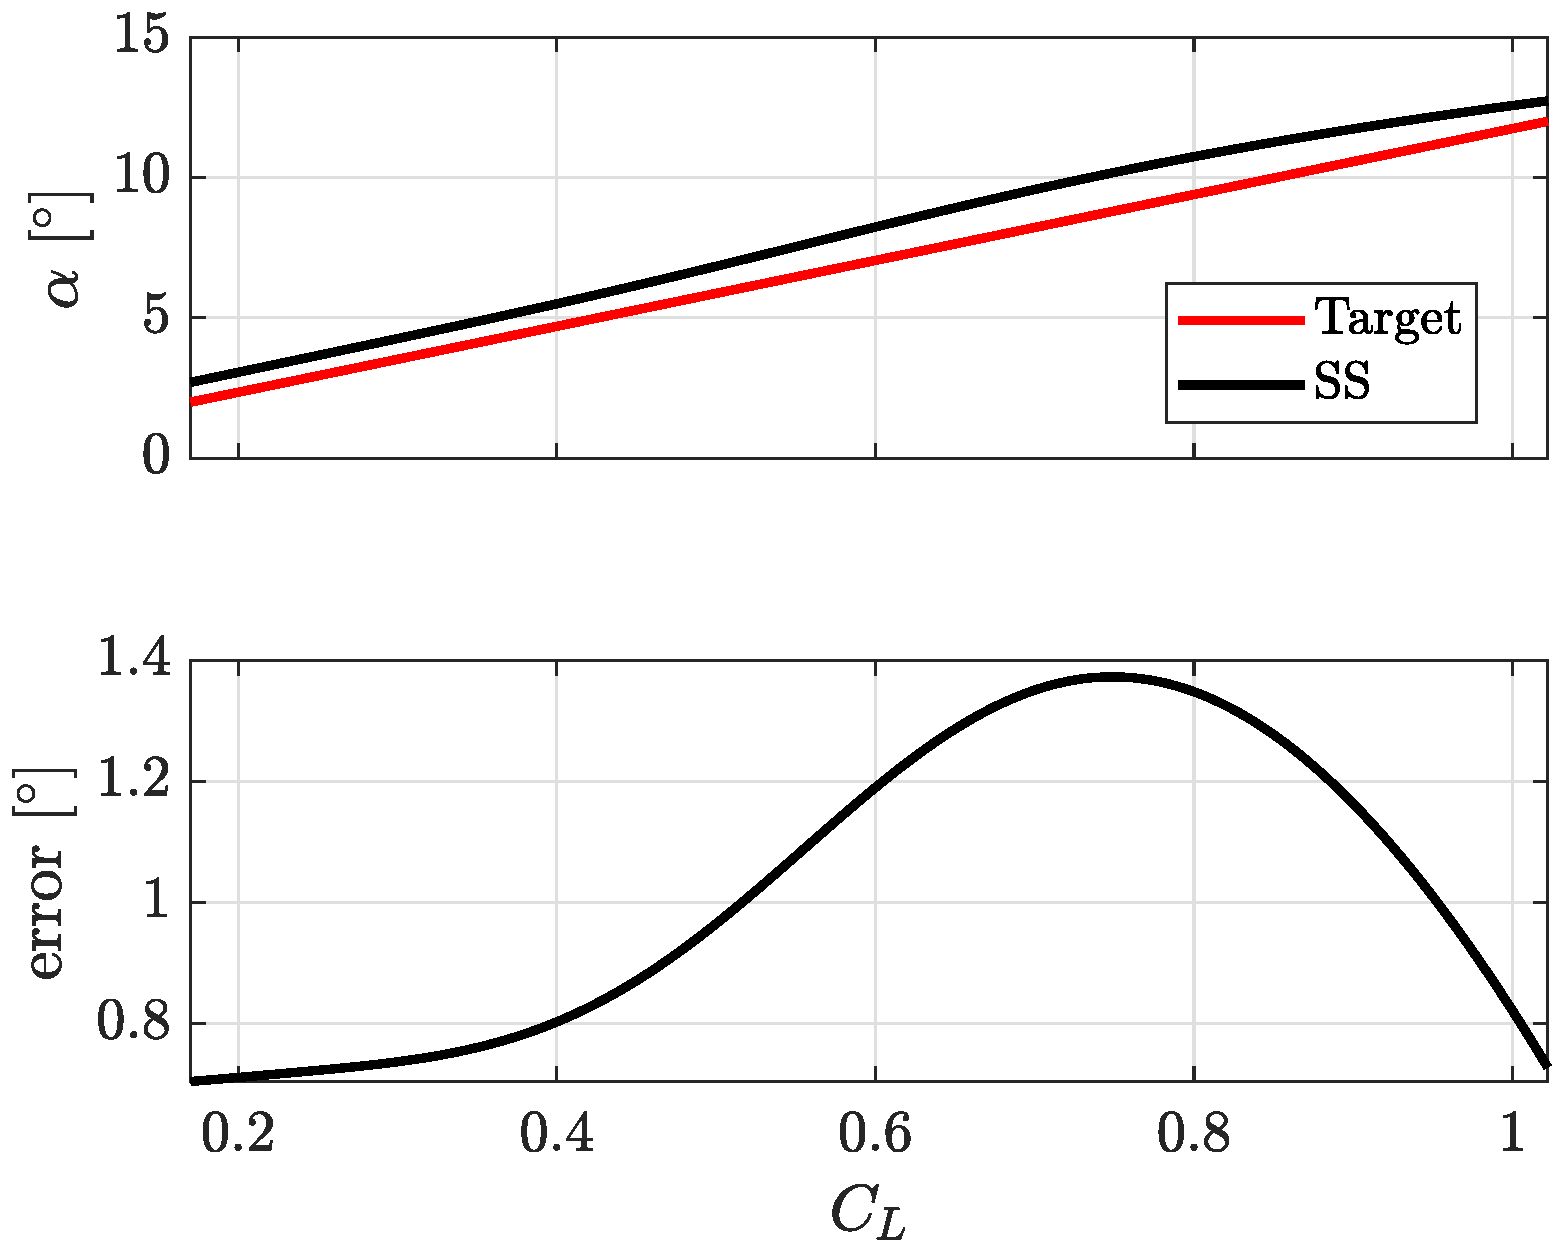
Figure 3 is an example of steady state results obtained from SS designed in previous works [
24]. Once the issue with static training was pointed out, authors designed a data-driven approach to improve the SS performance during steady state flight conditions.
The steady state flight conditions are reproduced using A/C manufacturer data (e.g.,
and
) and assuming that the aircraft is flying on uniform horizontal flight path. Starting from known A/C weight and considering a realistic interval of AoA, the dynamic pressure and pitch angle can be calculated, while all other quantities are set null.
Figure 3 represents the absolute values of reference AoA and the one estimated with the SS [
24]. Although the maximum absolute errors are limited, the mean error is quite large and it should be reduced. To this aim, a data-driven approach is proposed in this work to overcome this issue mainly due to an unbalanced training pattern between dynamic and steady state maneuvers. Before description of the proposed approach, a brief digression is presented in order to provide the necessary details of the neural network used in this work.
Neural Network Architecture
The Smart-ADAHRS project deals with a very straightforward model patented in 2012, suitable for real-time and cost effective innovative avionic systems. It is possible to write an aerodynamic angle as sum of two addends, defining the output of the synthetic sensor as in [
26]:
where
is the first estimation obtained with flight mechanics equations [
27] whereas
is the difference between a first estimation,
, and the true value,
. According to the patent [
7], the initial estimation of the angle of attack
is augmented with the evaluation of
obtained by one MLP. The
can be evaluated as follows:
where
stands for the pitch angle,
for the flight path angle. The neural network structure has one single hidden layer with 13 neurons and one linear output layer.
During the training procedure, the weights of the neural network are estimated solving the non-convex problem of the error function optimization. Different heuristic rules exist and the most common is the Levenberg–Marquardt (LM) algorithm. However, this application deals with a big amount of data, making the employment of the Levenberg–Marquardt (LM) rule not feasible. The training rule applied in this article is the Resilient Propagation (RPROP). The complete input vector needed by the SS includes data from the GPS, the ADS and the AHRS which provides body accelerations, angular rates and attitude, as can be seen in
Figure 4.
For the application considered in this work (ULM category) the control surfaces are neglected. The following feed-forward predictors are hence implemented:
where
is the impact pressure,
is the time derivative of
,
,
,
are the accelerations measured by the accelerometers respectively on
,
and
axes and
q is the pitch rate. Previous research activities on simulated turbulent environment in [
20] showed the possibility of considering previous time steps of the input vector in a Time Delay Network. This practice however is not here implemented because, at this phase, it does not bring any significant advantages.
The error is calculated as the difference between the estimated angle (
) and the real angle (
). Angle of attack’s target performance were established at the beginning of the MIDAS project [
28,
29]. The most relevant for this work are:
3. Proposed Approach
After the completion of the flight test campaign, a big amount of data is available for training and test. This section describes two practical methodologies in order to identify the most suitable points for training. The final goal is to guarantee a more uniformly distributed domain where the synthetic sensor is designed by means of:
- 1.
avoiding coarse areas (usually related to steady state flight conditions);
- 2.
reducing over populated areas (usually related to dynamic flight conditions).
The first method,
Data-Driven Identification and Generation of Quasi-Steady States (DIGS) is based on the following three pillars: (1) identification; (2) regression and (3) generation. The identification method, presented in [
25], is based on recognition of quasi-steady flight conditions from the whole flight record, therefore, exploiting also those maneuvers not explicitly flown for the flight trials (e.g., transfer between altitudes and re-alignment on desired heading). The regression step deals with definition of a regression function considering identified quasi-steady flight conditions. Finally, the DIGS regression function is used to generate artificial flight test points to be used to increase the training population where necessary. The DIGS method is limited to longitudinal steady flight conditions in this work.
The second method, Similar Flight Test Data Pruning (SFDP), is based on a pruning schemes that aims to avoid very similar flight records (usually dynamic flight conditions) with the aim to define a balanced definition domain where the synthetic sensor is defined.
Finally, adopting this approach, it can be avoided to require more flight test hours to populate the training data set with steady flight conditions in favor of virtual ones.
4. Data-Driven Identification and Generation of Quasi-Steady States (DIGS)
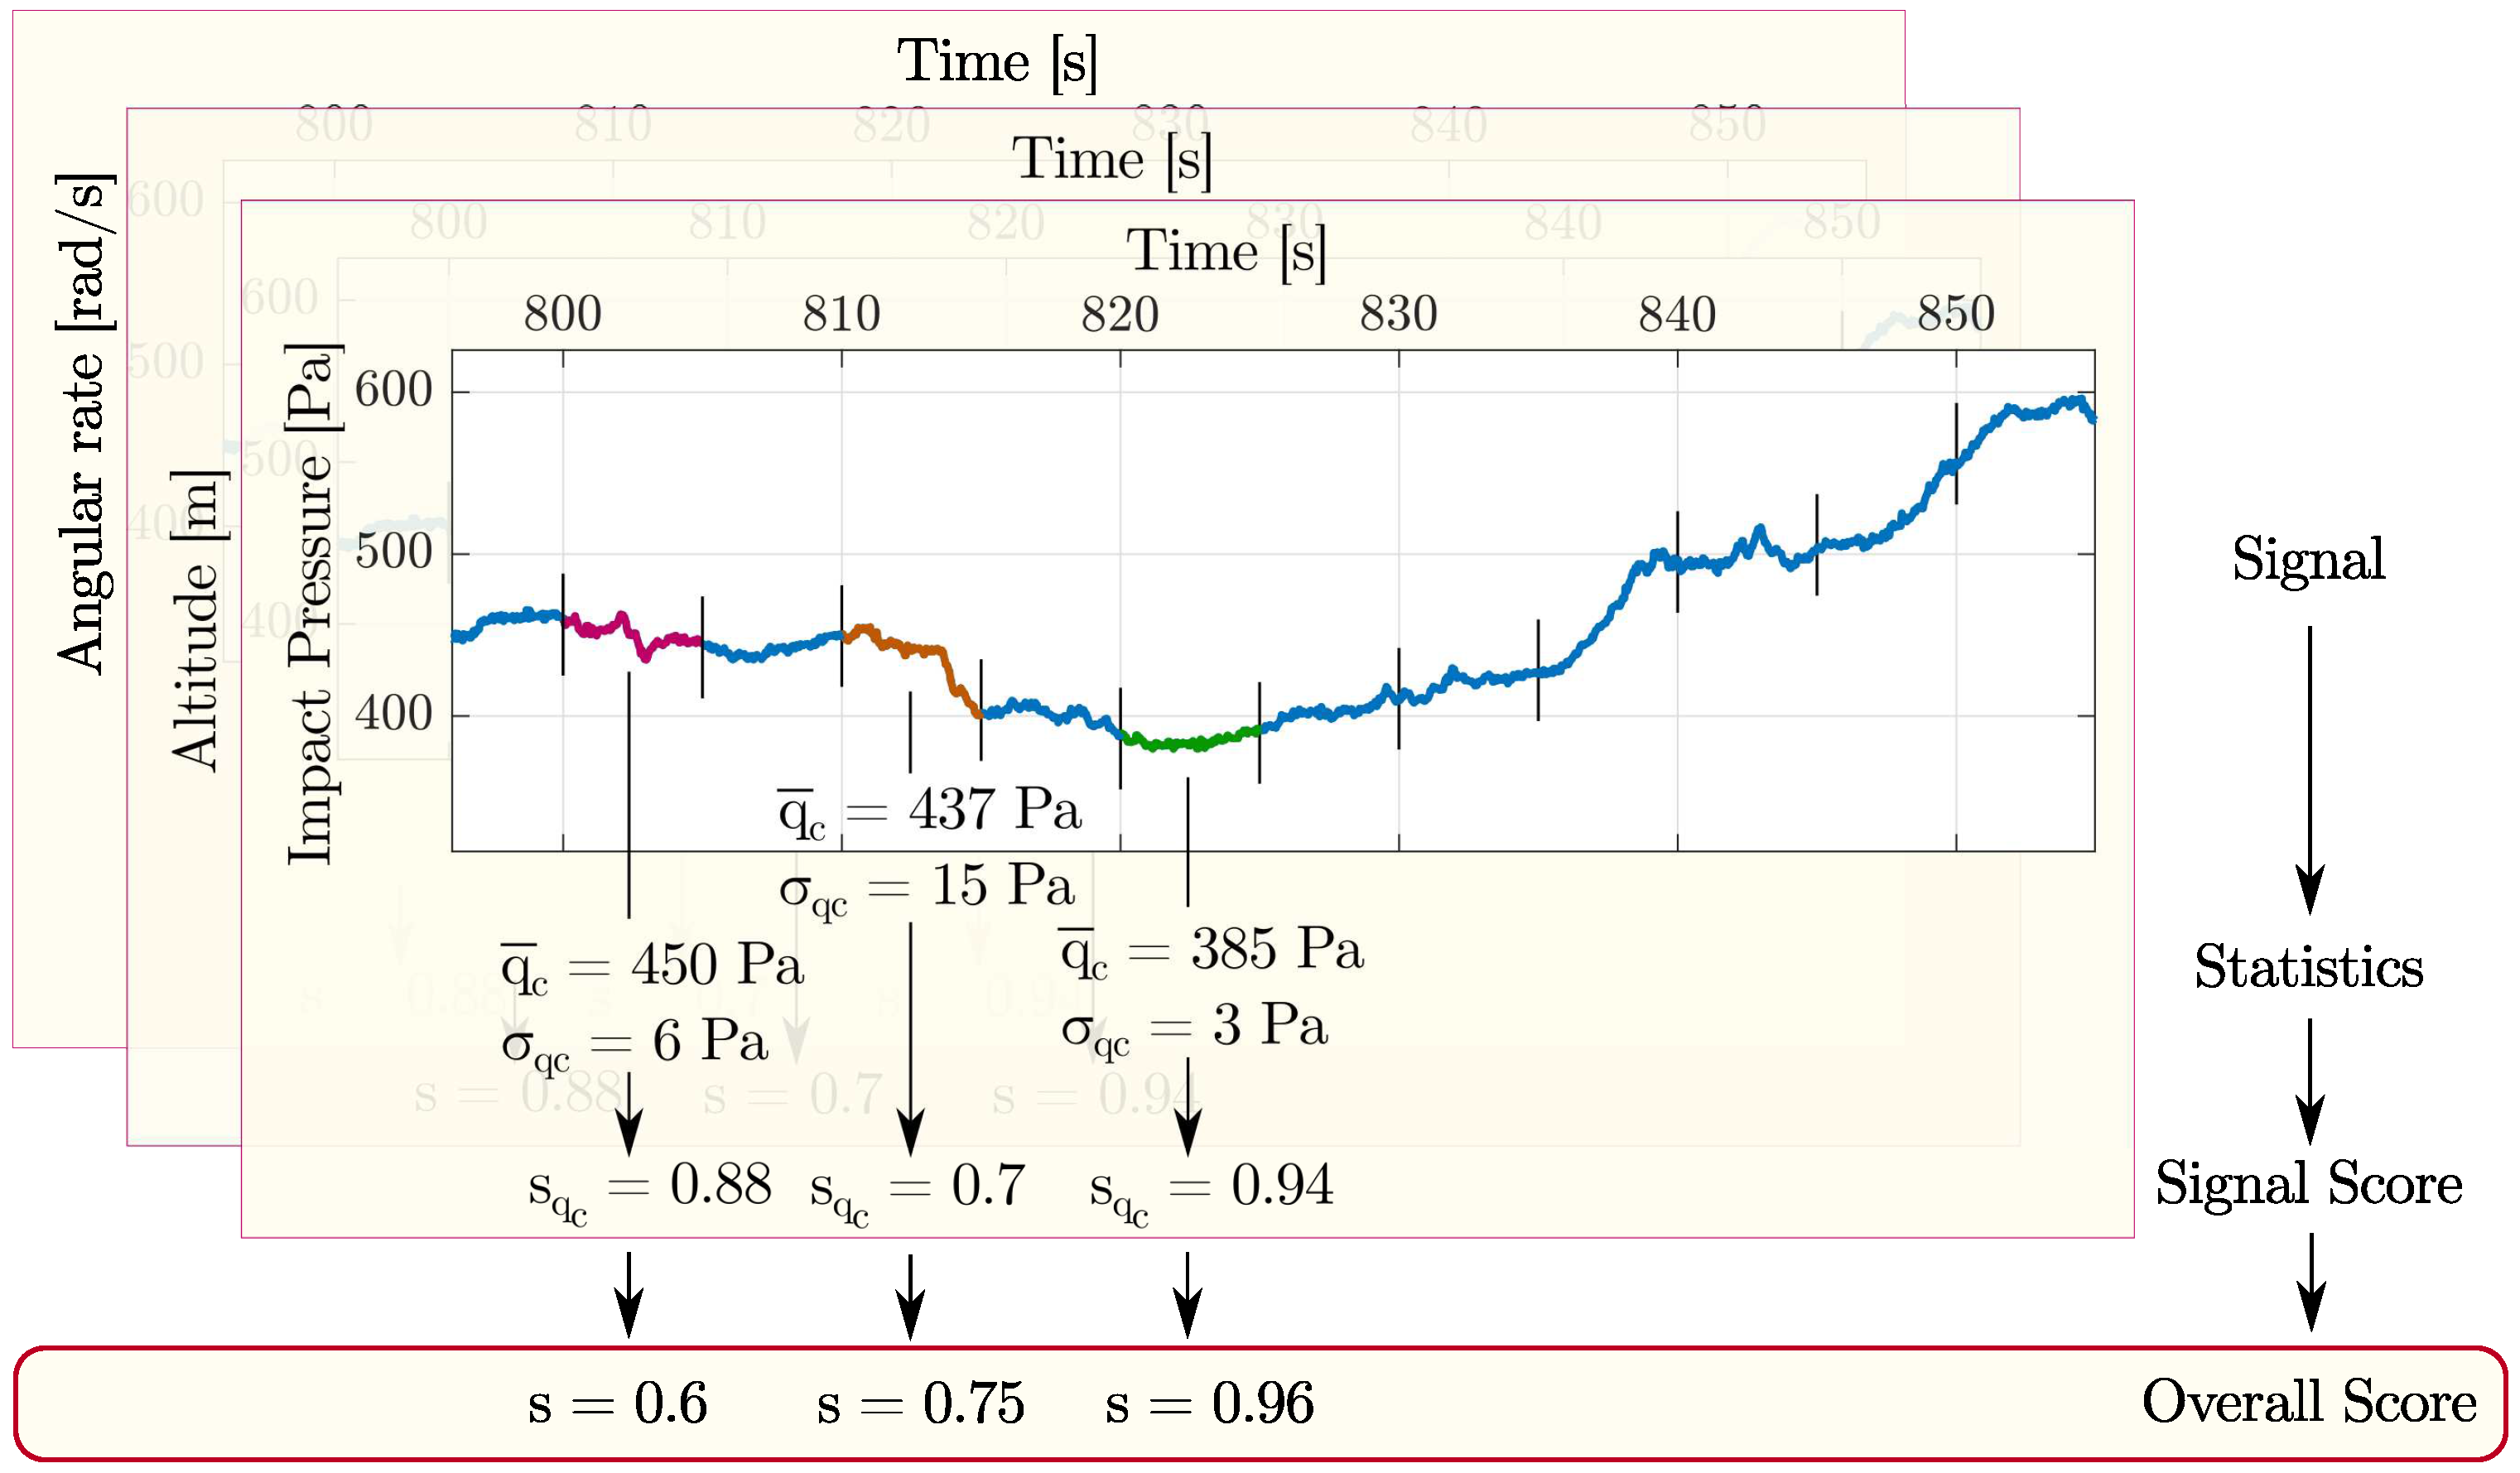
This section describes the method applied to find the stationary and quasi-stationary points in a generic flight data collection in order to augment the training set. A key aspect of this analysis is the definition of quasi-stationary and quasi-symmetric flight condition. Briefly, the main procedure is based on the assignation of a value called score considering only a selection of flight parameters important to this goal (see
Table 1). The whole flight time history is split in several non-overlapping time windows. In each time window, two values are calculated for each signal. The second parameter is always the standard deviation. The first one is defined according to the nature of the flight signal itself, as detailed below. For example, the mean value is considered for rates, whereas the maximum deviation is chosen for the altitude. All choices are reported in
Table 1 with corresponding thresholds to be compared with. From this comparison, a (single) signal score is assigned. Averaging the signal scores, an overall score is assigned to the time window. If the overall score is higher than a defined threshold, then the time window is tagged as steady-state one, otherwise is discarded. In
Figure 5 and Algorithm 1 are reported some details.
As mentioned above, the signals are divided in non-overlapping time windows. The length of the time windows is constant and it has been taken as 5 s. The length of the time-window is obtained as a trade-off between finding an actual stationary point and the efficiency of the algorithm. In fact, longer time window will bring to a more reliable evaluation of the flight condition whereas shorter time window will bring to extra points in the final result. Afterwards, some statistics of the signal during each time window are evaluated. As a result of this statistical analysis, the original sampling frequency of the signal can have an important influence on the final result. In fact, the number of elements in each subdivision must be sufficiently high such that the sample estimators are statistically valid. In this work, original sampling period is about 0.05 s, corresponding to 100 elements per interval, which is sufficiently high. The original sampling period comes from the sampling frequency of the FTI.
| Algorithm 1: Quasi-Stationary and Quasi-Symmetric flight conditions detection algorithm |
 |
For each interval sample mean, sample standard deviation and the deviation between the minimum and maximum values covered by the signal inside the sample are calculated. A score is hence assigned to each interval depending on the descriptive values calculated beforehand. The decision on which statistics consider for the score assignment grounds on the type of signal evaluated. In some cases, the score depends on how much the sample mean is close to a given value. For instance, the angular rates must be zero in stationary conditions. In other cases, when the interest falls in observing a constant signal, the sample standard deviation or the maximum deviation drives the score assignment. For instance, the closer the maximum deviation of the impact pressure is to zero, the higher is the assigned score.
The rules governing the score assignment to a given sample has not a unique solution. In this paper, a piecewise linear function is implemented but, according to the authors, several other possibilities exist. To enhance the score assignment, the standard deviation of the sample is always accounted in this work. This helps to increase the score of the stable sample with respect to sample affected by high variability. See
Section 4.1 for the complete description of the score assignment process.
When every signal has been sampled and the signal score has been assigned, the final sample score is evaluated as the mean of the scores among the signals. A weighted mean could be implemented here. However, it implies the definition of which signal is considered the most important during this evaluation and without this consideration a weighted mean cannot be implemented.
Once the scores have been obtained, the selection of the stationary and quasi- stationary points can be carried out. This procedure involves the definition of a minimum score threshold necessary to pick or not a sample, given the scores assigned to each sample. The previous steps are applied equally to each flight test. For this reason, the scores are comparable among different flights. However, it has been observed that a normalization procedure greatly simplifies the decision process. In fact, subtle differences exist between quasi-stationary and quasi-symmetric conditions. To better explain this, it must be recalled that this method can obtain a set of points on the flight envelope slightly relaxing the trim condition constraints. In some cases, very low time derivatives and deviations can be observed. However, the attitude could be too much asymmetric to be neglected. At the same time, a slightly more symmetric flight condition but corresponding to higher deviation on the measures than the previous case can be considered valid. The problem of defining when a flight condition is quasi-symmetric and quasi-stationary is obviously ill-posed. The authors have shown in [
25] that it can be converted on the problem of defining a threshold on the score, that unfortunately fails to be a metric. Moreover, if the score is normalized, the equivalence between asymmetry and stationarity in the score space seems to be well faced.
4.1. The Signal Score Assignment Process
This subsection shows more details on how a sample of a signal has been related to a scalar value. This step is crucial for the effective functioning of the algorithm. Two different solutions have been applied.
Mathematically speaking, given a signal
it is possible to extract a sample
with
. Various statistics
of the sample
can be measured. Eventually, the signal score
s is assigned to the
n-th sample based on the corresponding
as in the following relation:
The first approach on the functional form for
s is piecewise linear. The triangle function can be generally defined as in Equation (
5). An example can be seen in
Figure 6.
Setting a first evaluation of the sample score can be obtained. For instance, if the signal is considered, the maximum acceptable during 5 can be set to 100 . In this case, if the maximum deviation is higher than then a null score will be assigned. At the same time, if the maximum deviation is between 0 and 100 , then a proportional score will be assigned to that given sample.
However, it has been found that extending the previous analysis to more than one single statistic brings to higher coefficient of determination with respect to using only one statistic. To this aim, Equation (
5) can be modified considering similarities to a triangulation problem.
Given
with
and
it is possible to identify four regions as reported in
Figure 7 and
Figure 8. For convenience, each region is identified by the same index of one of the two border vertices.
Let
a point belonging to the
space, it is possible to write
where
stand for the 4 straight lines defining the border.
Once the
r-th region in which
P belongs to has been found, it is possible to write Equation (
8) which describes each planar face of the pyramid as follows:
where
represents the vector of coordinates of the point
P. Moreover,
For simplicity, Equation (
9) contains a little abuse of notation. In fact,
becomes 1 for
.
The following linear system can be written:
which brings to Equation (
8),
representing the two partial derivatives of the score function
s with respect to
and
, where
is the matrix at the LHS of Equation (
11).
Eventually, the score assigned to any sample
is evaluated as follows:
With this formulation, two statistics can be considered. In this paper, the standard deviation of the sample is always applied as second statistic. This help to increase the score for stable samples.
Table 1 shows the values used in this paper.
4.2. Methodology Verification
This section shows the results obtained by the DIGS method on a flight test campaign conducted in the north Italy during June 2017. A total amount of 18 flight tests have been collected on a ULM named G70
Figure 2a and manufactured by Ing. Nando Groppo. The G70 is a propeller driven aircraft with traditional wing-tail configuration, 2 seats, non-retractable landing gear. A fully-fledged FTI suite developed by Politecnico di Milano [
30,
31] is installed on-board. This FTI system, called Mnemosine, is capable of supporting certification procedures [
22]. Its design has been tailored for ULM and it consists of a low cost, low intrusive and flexible solution for flight testing.
A second equipment, the Smart-ADAHRS demonstrator, is installed on board. This system is equipped with an independent ADAHRS platform integrated with GNSS. The only parts shared by the Mnemosine and Smart-ADAHRS are the pressure ports, probes and the first segment of pneumatic links. The aerodynamic angles of the aircraft have been measured by two vanes mounted on a Pitot-boom structure. An example of the flight data recorded during one flight test can be seen in
Figure 9.
To evaluate the capability of the DIGS method, the
curve is identified from flight test records not performed for this scope. As a result that no engine measurement is available on-board, a fuel consumption linearly decreasing with time has been assumed. In this way, it is possible to evaluate the lift coefficient as
, where
m is the aircraft mass,
g is the gravitational acceleration,
is the impact pressure and
S is the wing surface area. It is interesting to note that the obtained samples organize on three straight lines in
Figure 10. In fact, some of them corresponds to flaps down in Take-Off (about 14
) and Landing (about 36
) conditions. As a result that the flap angle deflection, for leading edge plain flap, is equivalent to offset the null lift direction with an angle proportional to the
, it is possible to identify two analytic values of
to compare our results. In fact
In this work, to assess the accuracy of the method, the effect given by the flap on
has been evaluated. Considering a 2-dimensional
[
32] and a surface ratio
, the 3-dimensional value for
becomes
. Unfortunately, this value is valid up to 20
of flap deflection. The
parameter [
33] has been used to extend the evaluation beyond this limit, leading to the following more general formulation:
Therefore, the following values are used in this paper , .
Looking at the
Figure 10 it is possible to identify all the sample points obtained with a score
and
.
The samples resulted to be organized on a straight line, with slope
and zero
close to the independent analysis previously conducted by [
34]. To avoid non linear effects, only the samples with
have been taken in consideration. The quality of the linear regression has been measured with the coefficient of determination.
Actually, the effects of
and asymmetric flight condition should be accounted for in a post-processing correction. Shortly, according to [
35], the slope obtained by the regression should be properly called
. However, the difference between
and
has been here dropped for sake of clarity.
Figure 10 shows the samples corresponding to flaps in TO condition and it collects the samples in LND condition. It is important to notice that no flight control surface data has been directly applied into the score assignment. In fact, the flap deflection angle
has been used only in post-processing to distinguish clean, take-off and landing configurations in order to clearly identify the three linear regression.
Table 2 collects the results obtained. The comparison of the regression obtained with the DIGS identification method with respect to the independent analysis conducted in [
34] confirms the validity of the method. A difference about
% has been obtained on
with respect to the manual derivation, neglecting the effect of the elevator. For what concern the
, the difference is about
%.
Although the coefficient of determination of the linear regression is lower than for the TO and LND conditions, the results are in accordance with the manual estimation.
4.3. DIGS Training Pattern Augmentation
The DIGS identification method described in
Section 4 is used to define a regression function to be used to artificially generate quasi-steady state training points. The aim is to populate the training data set with steady-state flight test points if not already included. Although this action can be helpful in order to obtain a better data distribution, the hypercube (where the neural network is defined) is still unbalanced and another action is required as described in the following section.
5. Similar Flight Test Data Pruning (SFDP)
The SFDP main objective is to leave only the quasi-unique flight data records in the training data set by means of pruning similar ones.
The concept of similar, or quasi-unique, applied to flight test data records, is defined according to a threshold vector. The threshold vector,
, contains a well defined limit for each one of the training signals (e.g.,
is the threshold applied on the dynamic pressure). Then each time record is compared with all others. If each element (i.e., flight data recorded) of the vector comparison is within its corresponding threshold, than the time record is tagged as duplicate and pruned away, otherwise it is kept as unique as described in the Algorithm 2.
| Algorithm 2: Pruning approach of the training data set |
 |
The proposed approach for pruning leads to a lighter training data set avoiding over fitting issues (e.g., data concentration).
In this work, the threshold vector is based on previous sensitivity analysis [
36] and upon considerations on sensors’ uncertainties. The threshold vector associated to input vector (see
Section 2) for the present work is made up of the following components:
The threshold applied to the dynamic pressure, considering the altitudes flown by the present A/C, can be read as an absolute threshold
for speed higher than
. Whereas, the one applied to the time derivative of the dynamic pressure can be translated in an absolute threshold
for speed higher than
. All other thresholds are clear from Equation (
17).
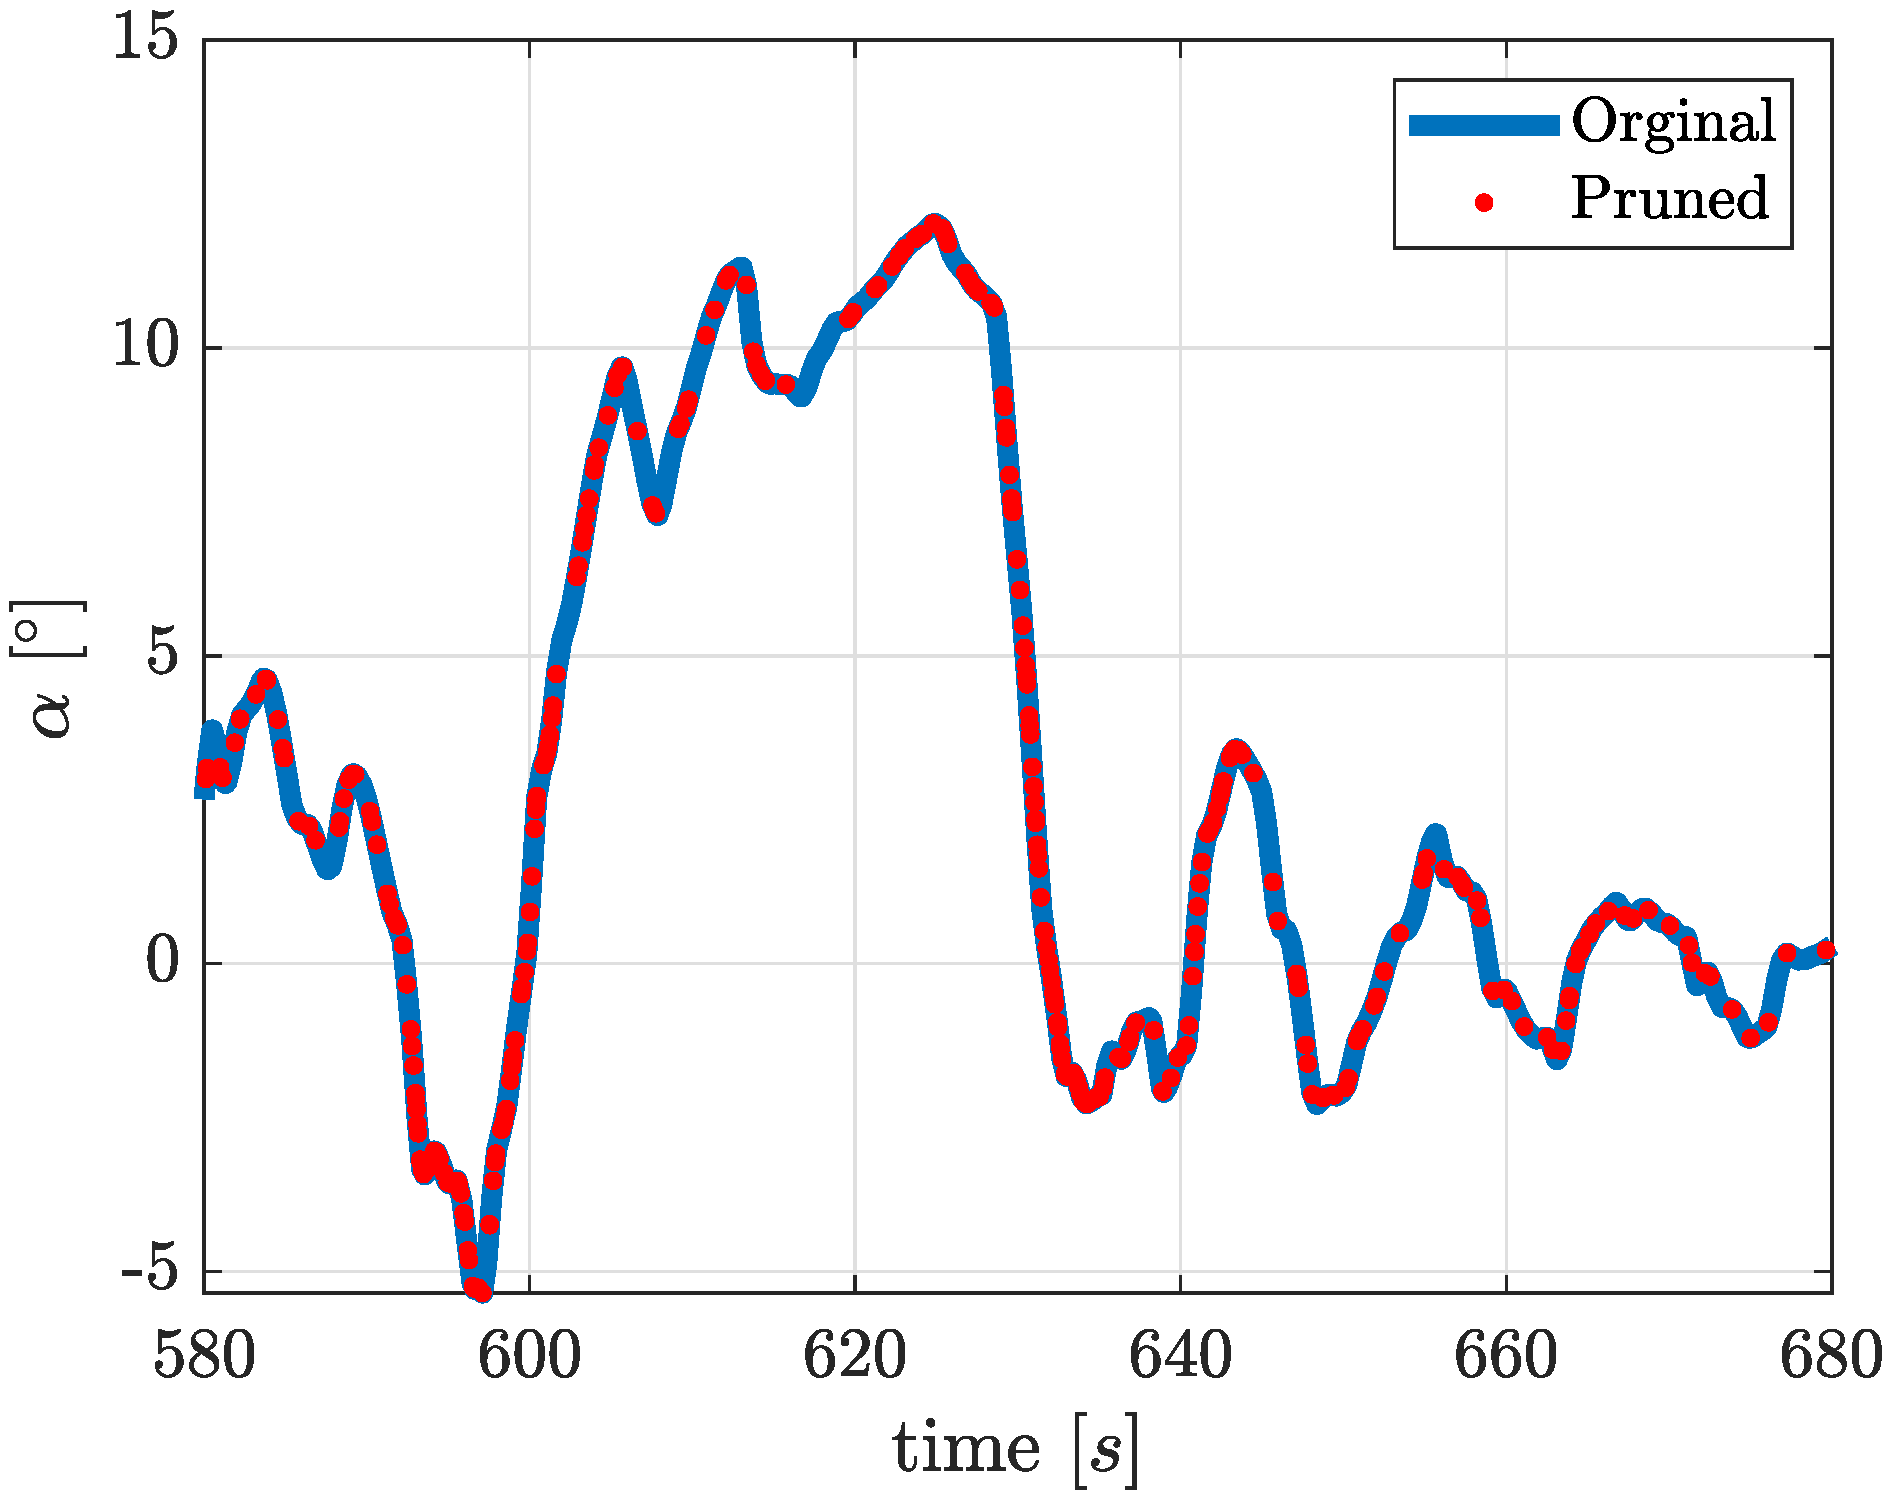
The
Figure 11 is an example of the results of the pruning process on training data. A beneficial data reduction of higher than
is observed during the present work.
Applying the threshold vector of Equation (
17) to distinguish quasi-unique element, the training hypercube is modified as in
Figure 12. For each single box, the central mark indicates the median and the bottom and top edges of the box indicate the 25th and 75th percentiles, respectively. The whiskers (dashed vertical lines) cover up to the most extreme data points not considered outliers whereas the outliers are plotted using the + symbol.
Quasi-unique points are only the of the original training data set (from 511,103 to 13,248), with extended areas of 25th and the 75th percentile. Another significant improvement is the outlier percentage: from to . An important weight should be given to outliers because they allow to cover the most of the flight envelope. This means that the original training set had the most of the points in the same region relying only a few importance to those points classified as outliers. The pruning process also overcomes this issue.
6. Results and Validation
Considering the SFDP method, the ratio between steady-state and dynamic conditions is increased to about . Moreover, 200 artificial steady state flight points from the DIGS method are added to the training in order to adequately increase the steady state population. It was noted that only 200 artificial steady state points are enough to keep a good balance between SS steady and dynamic accuracies. Anyway, this aspect could be further investigated.
With this set-up, new trainings are performed and the best one (selected according to criteria of [
24]) is used to define the SS for angle of attack estimation.
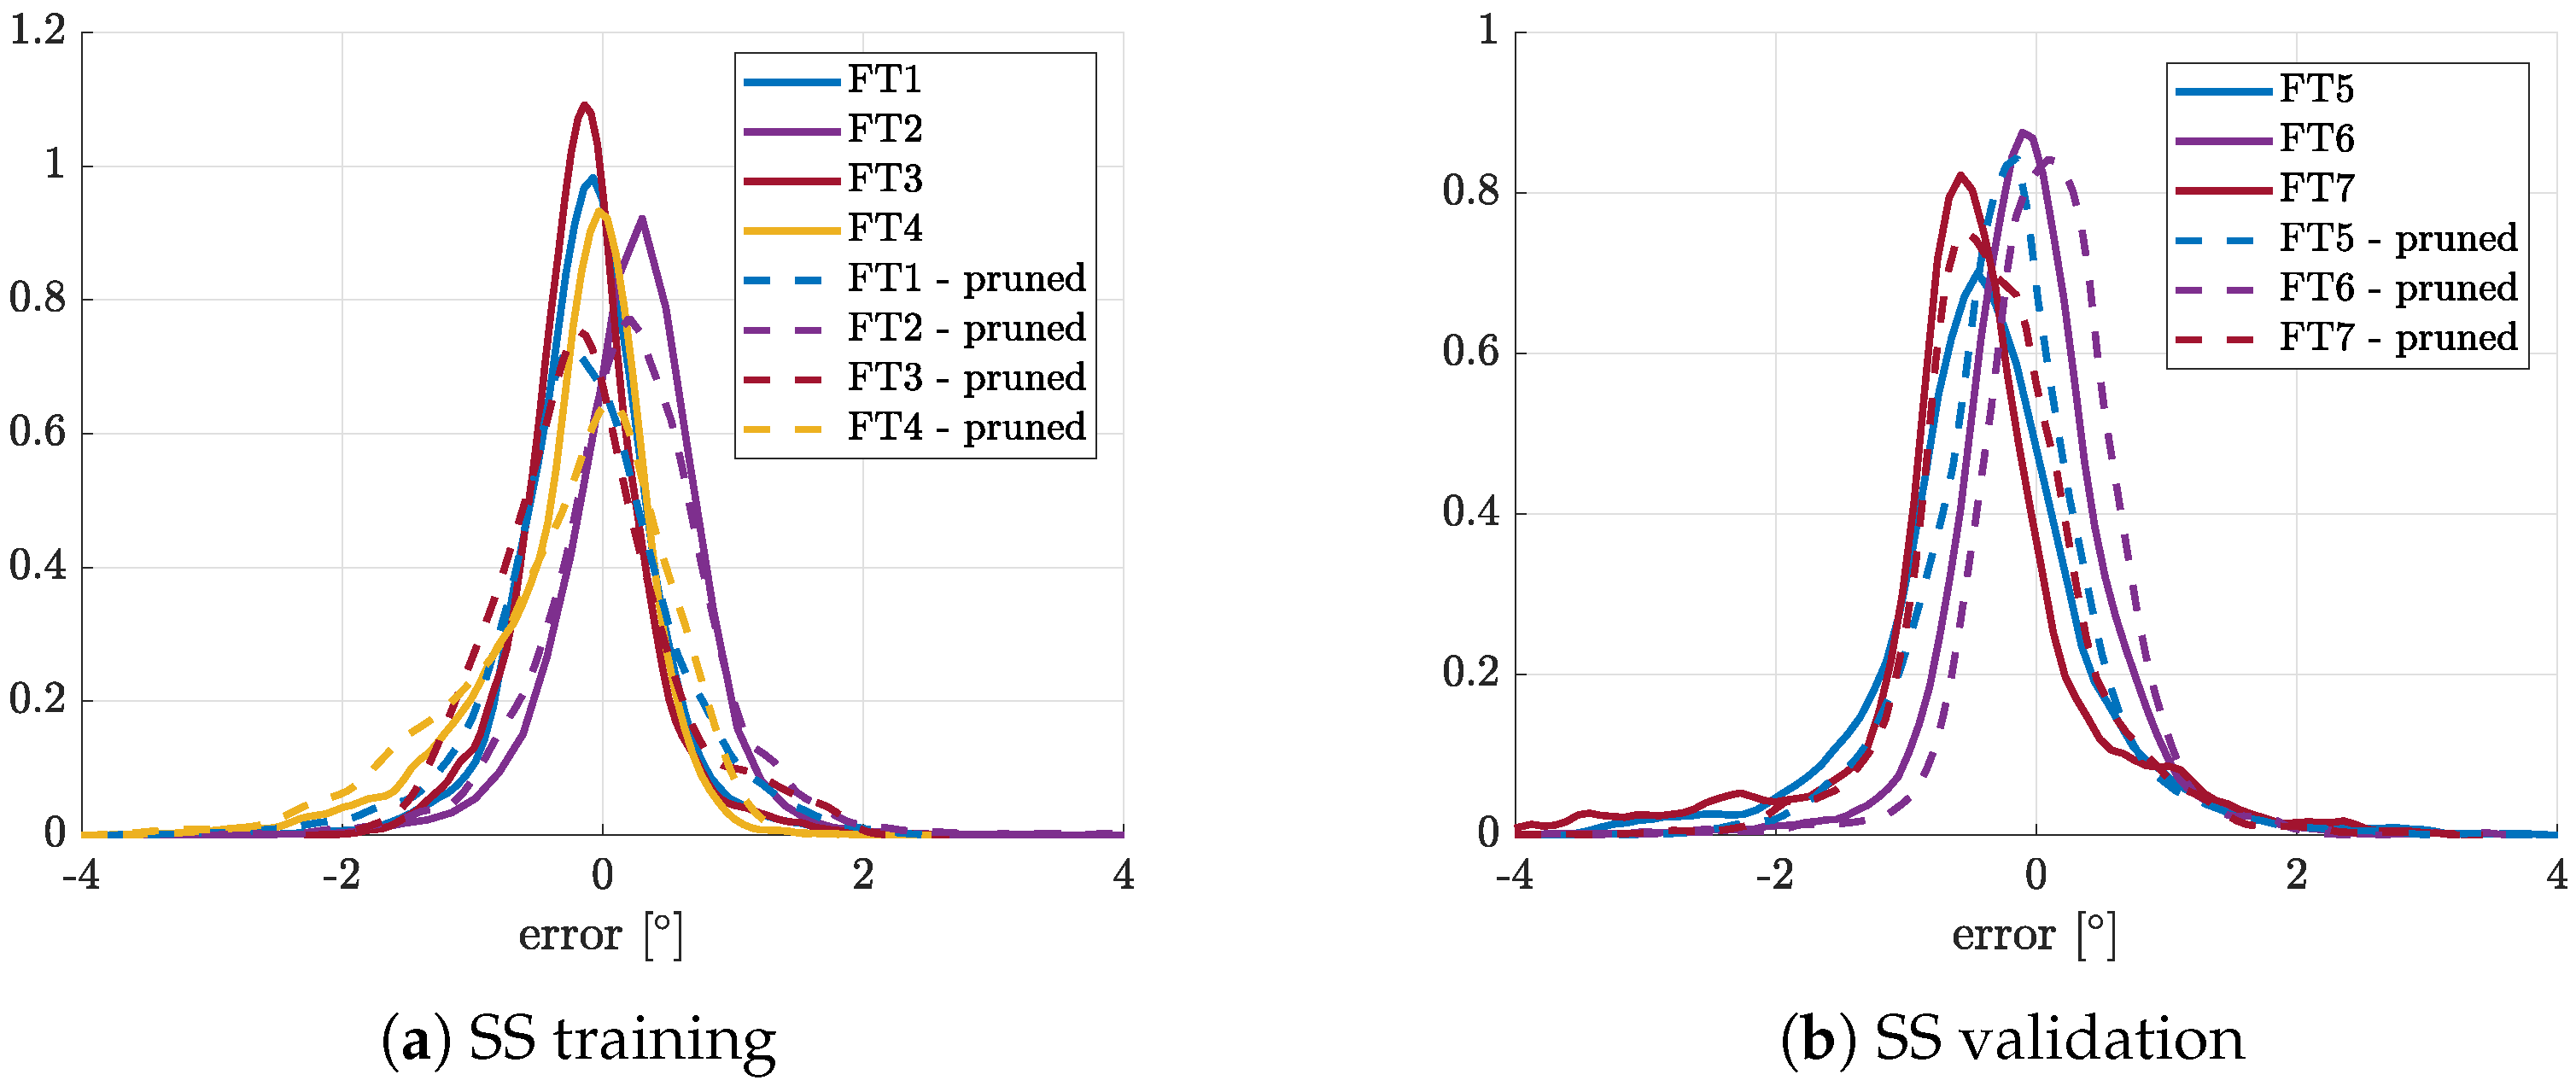
The
Figure 13 collects the error PDF for AoA estimation obtained both for the SS training and test. Obviously, the flight tests used for the training are pruned as described in
Section 5, whereas the flight test records used for SS test are not pruned and they are the same used in [
24].
From
Figure 13a can be noticed that the PDFs for pruned and augmented training show higher
errors. This behavior was expected as a consequence of the SFDP method because the error distribution has a strict relationship with the data reduction of the pruned training pattern. Anyway, this issue is negligible with respect to the improvement of the PDF on test maneuvers. From
Figure 13b it can be noted that the SS, trained with DIGS and SFDP, shows a PDF with lower standard deviation than the original ones for all test flights considered here. Main features are also summarized in
Table 3 that shows that the new SS (i.e., trained using both DIGS and SFDP methods) works better than the original one for all test maneuvers even though a light decrease of accuracy can be noted on the training data as said before. As far as the dynamic regime is considered, the proposed approach (DIGS + SFDP) can satisfy MIDAS dynamic accuracy requirements (see
Section 2) both for training and test maneuvers. Therefore, joining both DIGS and SFDP would lead to a synthetic sensor with enhanced generalization capabilities.
The final verification is performed on steady state conditions in order to check the MIDAS steady state performance of
Section 2. Performance of the SS trained with DIGS and SFDP are plotted in
Figure 14. Results obtained show a mean error of
and a maximum error of
at
. Even though the steady state performance is not achieved (max error
), these results are promising because the SS trained joining DIGS and SFDP methods can significantly improve the performance of the original SS that showed higher mean (
) and max (
) errors.
Results reported in this section highlight that the proposed approach (based on DIGS and SFDP methods) is valid and it is required when working with real flight test data in order increase the generalization capabilities.
As a side result, the proposed approach leads to an important CPU and time saving for the training stage. In fact, results presented in this section demonstrate that the same performance obtained with a very large amount of data (about
points) as used in the previous work [
24] can be achieved and improved with a reduced training pattern (about
points). This aspect is crucial for neural network training and can be considered valid even for simulated flight data. On a common laptop equipped with intel
-
and GPU NVIDIA
with 2
RAM reserved, the time saving for training 20 NNs is about of
, in terms of absolute time from
to
).
7. Conclusions
With the larger use of digital solution in avionics, analytical redundancy and synthetic sensors are more familiar concepts in flight control systems. The FBW solutions, successfully applied on larger passenger aircraft, will be even used by Small Air Transport community following the path towards a greener aviation. The present work is part of the MIDAS (funded in Clean Sky 2) project that has as final goal to design a simplex and complete ADS architecture partially based on synthetic sensors, exploiting a patented technology named Smart-ADAHRS. The synthetic sensors, based on neural networks, are dedicated to aerodynamic angle estimation. In order to achieve accurate and reliable synthetic sensors, the training stage is a crucial part of the design process. The Smart-ADAHRS technological demonstrator, mounted on a ULM test A/C and used in real time during flight tests, is presented and lesson learned will be transferred to the MIDAS project.
A common issue arising from use of real flight data for the SS training is presented: the ratio of dynamic points to steady-state ones is of the order of magnitude of . This situation leads to over fitting on dynamic flight maneuver with a significant lack of accuracy during the steady-state flight conditions. The flight trials, therefore, highlighted the need of flight manipulation before the learning process in order to achieve a more balanced distribution of the flight data among the n-space dimension of the SS definition. A two step approach is presented in this work to overcome this issue.
The DIGS method starts from the automatic identification of the quasi-stationary and quasi-symmetric situation in the entire flight test database. The method is based on a down sampling technique followed by a piecewise linear multi-variable score assignation. The validity of the method has been assessed with the estimation of and . The result comparison with respect to values estimated independently by means of classical flight test procedure and semi-empirical methods confirms the validity of the DIGS method. This proposed method worked also in flaps down conditions and the comparison on the corresponding has been conducted with analytical analysis, showing good accuracy. Although the method showed good performance, the new quasi steady state points are still limited if compared with the entire flight record. By means of using a suitable regression, the fitting can be used to provide the training pattern with artificial steady-state flight conditions in order to augment the training data set.
On the other hand, a pruning method for (quasi) duplicated training data points is necessary. The SFDP method is based on the observation that real flight data are mainly affected by measurement uncertainties, structural disturbances and sensor noise. The concept of unique flight test record was introduced and it enabled elimination of many quasi-duplicated training points. The SFDP method provides a pruned training pattern that is significantly reduced with respect to the starting one (about of the original set).
The proposed approach, based on data augmentation, using the DIGS method, and pruning, using the SFDP method, leads to a new training data set that has the same dynamic information of the starting one with less data records in addition to new artificial data for the steady-state flight conditions. Using the proposed approach, the training pattern is populated by about 500 dynamic points for each steady-state point. In this work, this set-up was considered adequate to guarantee a correct balance between dynamic and steady state accuracies. In order to find an optimum set-up, this particular aspect could be further investigated in future works.
Validation results show that the SS trained with the pruned and augmented data set has a significant performance improvement during the steady-state maneuvers and still acceptable accuracy during dynamic regimes.
To conclude, a synthetic angle of attack estimator based on neural network is introduced for flight control purposes. This work highlights that flight test data for training application are affected by several uncertainty factors that influences the ability of the neural network to generalize introducing some over-fitting issues. The proposed approach based on data pruning and artificial augmentation demonstrates beneficial effects: (1) better distribution within the hypercube where the neural network is defined; (2) consequent improved generalization capability; (3) save CPU time for training.


