1. Introduction
Airport operations have been of particular concern in recent disaster responses to Hurricane Katrina in 2005, the Haiti Earthquake in 2010, the Great East Japan Earthquake in 2011, and the Nepal Earthquake in 2015. The importance of air transportation is especially critical in the immediate response phase after a disaster because air transportation provides an alternative to road and rail transportation, which are often disrupted by earthquakes, tornadoes, and other disasters. Within the first 72 h of the immediate response phase, emergency medical care and ambulance transport is particularly dependent upon air transportation. The airport, which is considered to be a node, supports humanitarian activities and provides a base for the impacted area. Air routes, regarded as links, enable the delivery of aid goods, the transportation of evacuees, and other critical activities.
For these reasons, preparing airports to provide disaster responses has been a widely discussed topic in the last decade. The Federal Aviation Administration [
1] published its Airport Emergency Plan and checklist for airport emergency operation procedures, such as the handling of injured and uninjured accident survivors, the removal of disabled aircraft, emergency alarm systems, airport/control tower emergency action coordination, notification of support agencies, and water rescue procedures. Smith [
2] first introduced the role of airports and their coordination during emergencies. Guidelines for airport disaster preparation have been proposed, and regional mutual aid agreements have been developed, such as the Western Airports Disaster Operations Group (WESTDOG) and Southeast Airports Disaster Operations Group (SEADOG) [
3]. International organizations, such as the International Federation of the Red Cross (IFRC), the United Nations Humanitarian Response Depot (UNHRD), and the United Nations Development Programme (UNDP) have developed airport plans to enable international responses to regional disasters [
4,
5,
6,
7]. Polater [
8] conducted a systematic literature review of airport disaster-management capabilities in non-aviation related disasters and emphasized airport capacity utilization in airports.
However, as a point-of-entry, an airport will usually struggle to accommodate excessive demands within its limited capacity constraints, especially related to available airside space [
9]. Furthermore, airport congestion causes additional waiting for aircraft within the airport [
10]. An aircraft usually has to wait in the airport for a long time before starting its disaster response mission. The organizational complexity inherent to the tactical assignment of the tasks in an airport hinders humanitarian responses. In usual airside operations, an aircraft turnaround consists of five major tasks such as deboarding, catering, cleaning, fueling, and boarding as well as the parallel processes of unloading and loading [
11]. Aircraft turnaround has been accepted as significant for airside operation, so minimizing delay propagation was analyzed in the previous study [
12]. Due to its diverse composition of actors, this process is very complicated and therefore calls for Collaborative Decision Making (CDM), a concept that is accepted and has recently been shared globally [
13].
In a similar way, multiple stakeholders, such as medical helicopters, military, police, broadcasting, and others, are involved in different disaster response missions. Hanaoka et al. [
14] determined that bottlenecks in an airport originate both on the ground and in the air for several reasons: aircraft are operated by different organizations, certain operators are not prioritized, and location assignment is difficult. Considering these causes of congestion, this study focused on how to reduce extreme waiting times and resolve operational bottlenecks at airports immediately after the occurrence of a disaster.
Queuing theory has been applied to problems in transportation, manufacturing, computer science, emergency medical care, and other fields, with the goal of evaluating a wide range of performance measurements, such as mean response time, resource utilization, and throughput [
15]. By representing facilities and transportation modes as nodes and links, respectively, the queuing approach also enables the investigation of different network topologies in supply chain management and in humanitarian logistics. Kerbache and Smith [
16] further discussed transportation costs, capacities, resources, and processes regarding the facilities, providing meaningful insights into the operations.
In recent years, there has been a significant amount of research focused on disaster response planning. Krishnamurthy et al. [
17] suggested future research directions for pre-positioning inventory at strategic locations and routing supplies to affected areas and relief centers in the region. They developed an analytical queuing model to quantify the congestion of people receiving aid goods at relief centers and to investigate the impact of relief center layouts on operational efficiency. This was one of the first papers to apply the queuing theory in the field of humanitarian logistics.
Cochran and Roche [
18] described the advantages of applying queuing theory instead of other operational research approaches; in particular, queuing theory requires minimal data and can easily be applied using spreadsheets. In relation to emergency management systems, Iannoni and Morabito [
19] analyzed the balance between investment and the benefits of system layout modifications that must be implemented in these cases. In relation to health-care systems, Pons et al. [
20] modeled the prioritization of patients with urgent needs, which was necessary because the survival of those patients can be compromised by long waiting times.
A queuing network is a connected series of queuing systems. Au-Yeung et al. [
21] noted that the fast response times demanded by many real-world, resource-constrained complex processing systems are seldom delivered by queuing network theory. Nonetheless, Newell [
22] mentioned that the queuing network approach offers the important benefits of enabling the discovery of those parameters that are critical to the exit process, and determining the overall impact of varying these parameter values on the exit process. Among the queuing theory approaches, Jackson [
23] developed a queuing network model called an open Jackson network that presents the queuing characteristics as Poisson arrivals on a first-come first-served (FCFS) basis, with exponential service times and probabilistic routing, including steady-state joint probability and a product-form solution.
In addition to the open Jackson network approach, multiclass queuing network approaches have been studied with the aim of capturing the arrival, waiting time, and processing of customers who behave differently within the queuing network. One example that is explained by Schönlein et al. [
24] adopts a multiclass queuing network to model multiple product lines in a dynamic supply chain. The limitations imposed on this research are associated with the difficulty of depicting real-world systems using uncertain parameters. Regarding multiclass approaches in an open Jackson network, multiple prioritizing approaches have been examined in relation to waiting time management at emergency care centers. In particular, Kim and Kim [
25] modeled an emergency care center using a mixed priority model in an open Jackson network framework, applying an FCFS approach to some processes and a prioritizing approach to others. Harchol-Balter and Osogami [
26] further studied techniques for analyzing multiclass priority queuing networks to support calculation procedures.
In the present study, we found that the management of those nodes within a network that are utilized as points of entry by many nations is critically important to coordinating effective disaster responses. The objective of the present study is to devise a solution for relieving congestion in airports during emergencies with the ultimate goal of enhancing overall humanitarian responses. A methodological framework for modeling airport operations during disaster responses was developed, as was a model for estimating the waiting time of an aircraft in an airport during a disaster response. The latter was based on queuing theory, considering the effects of current and other proposed queuing disciplines. An open Jackson network model was used, and different queuing disciplines were applied to a case study of the Great East Japan Earthquake, which occurred in 2011. We investigated the effects of applying different policies, such as first-come first-served, priority, and a mixture of the two, and compared our estimations with the data acquired in the case study.
The rest of this paper is structured as follows:
Section 2 discusses a methodological framework for assessing aircraft waiting times in an airport based on queuing theory and details the model formulation, which applies an open Jackson network model. A case study of the Great East Japan Earthquake is discussed in
Section 3. The results of the study provide policy implications that are presented with the conclusions in
Section 4.
2. Data and Methods
Despite the assistance that queuing theory provides to system performance evaluations, the theory’s applicability to humanitarian logistics and disaster management has gained little attention. Moreover, the intersection between queuing theory and airport operations has been rarely discussed in the literature, even though a significant amount of research has addressed the improvement of airport operations immediately following a disaster, including both qualitative and quantitative determinations of bottleneck situations. Therefore, to begin this study, we compared certain features shared by airport operations during disaster responses and emergency department management in hospitals, as listed in
Table 1.
The entities arriving at airports during emergencies are the various aircraft of different operators. These aircraft have diverse purposes, and their degrees of urgency must be evaluated differently. In support of this methodology, Kim and Kim [
25] asserted that emergency departments in hospitals and airport operations during emergencies share this feature: Emergency departments in hospitals treat patients as arriving entities, and airports facing emergencies treat aircraft as arriving entities. Therefore, the above-mentioned background led to a need to develop a framework to be applied to airports in the immediate disaster response phase by applying queuing theory modeling to seek a means of enhancing operations.
As a result of the Great East Japan Earthquake of 2011, the Tohoku region of Japan was severely affected, and various operators assisted with disaster response activities at targeted airports, such as those at Hanamaki, Yamagata, and Fukushima [
27]. Different operators, such as the police and fire departments, and disaster management agencies (the Japan Coast Guard (JCG), the Japanese Self-Defense Forces (JSDF), the Ministry of Land, Infrastructure, Transport and Tourism (MLIT), and medical helicopter units), fulfilled different functions during the immediate disaster response. The types of aircraft operators and their roles in the disaster response are listed in
Table 2.
Table 2 lists five aircraft operators and six operational tasks, performed by airports, required for humanitarian logistics operations. MLIT publishes its Aircraft Landing and Take-off Data upon request. The data for 1–31 March 2011 was obtained to estimate the service rate of the runways, as well as the arrival rate, described below. The data in the table was extracted from the flight movement data immediately after the Great East Japan Earthquake of 2011; the total take-off and landing frequencies are summed up over the first four days following the disaster.
Time management is one of the most crucial factors influencing overall operations in humanitarian logistics, affecting multiple stakeholders involved in the disaster response activities, including airport operators, aircraft operators, and emergency workers. Specific attention has been paid to aircraft operators because prompt and exact aircraft operation significantly impacts the population in the disaster area.
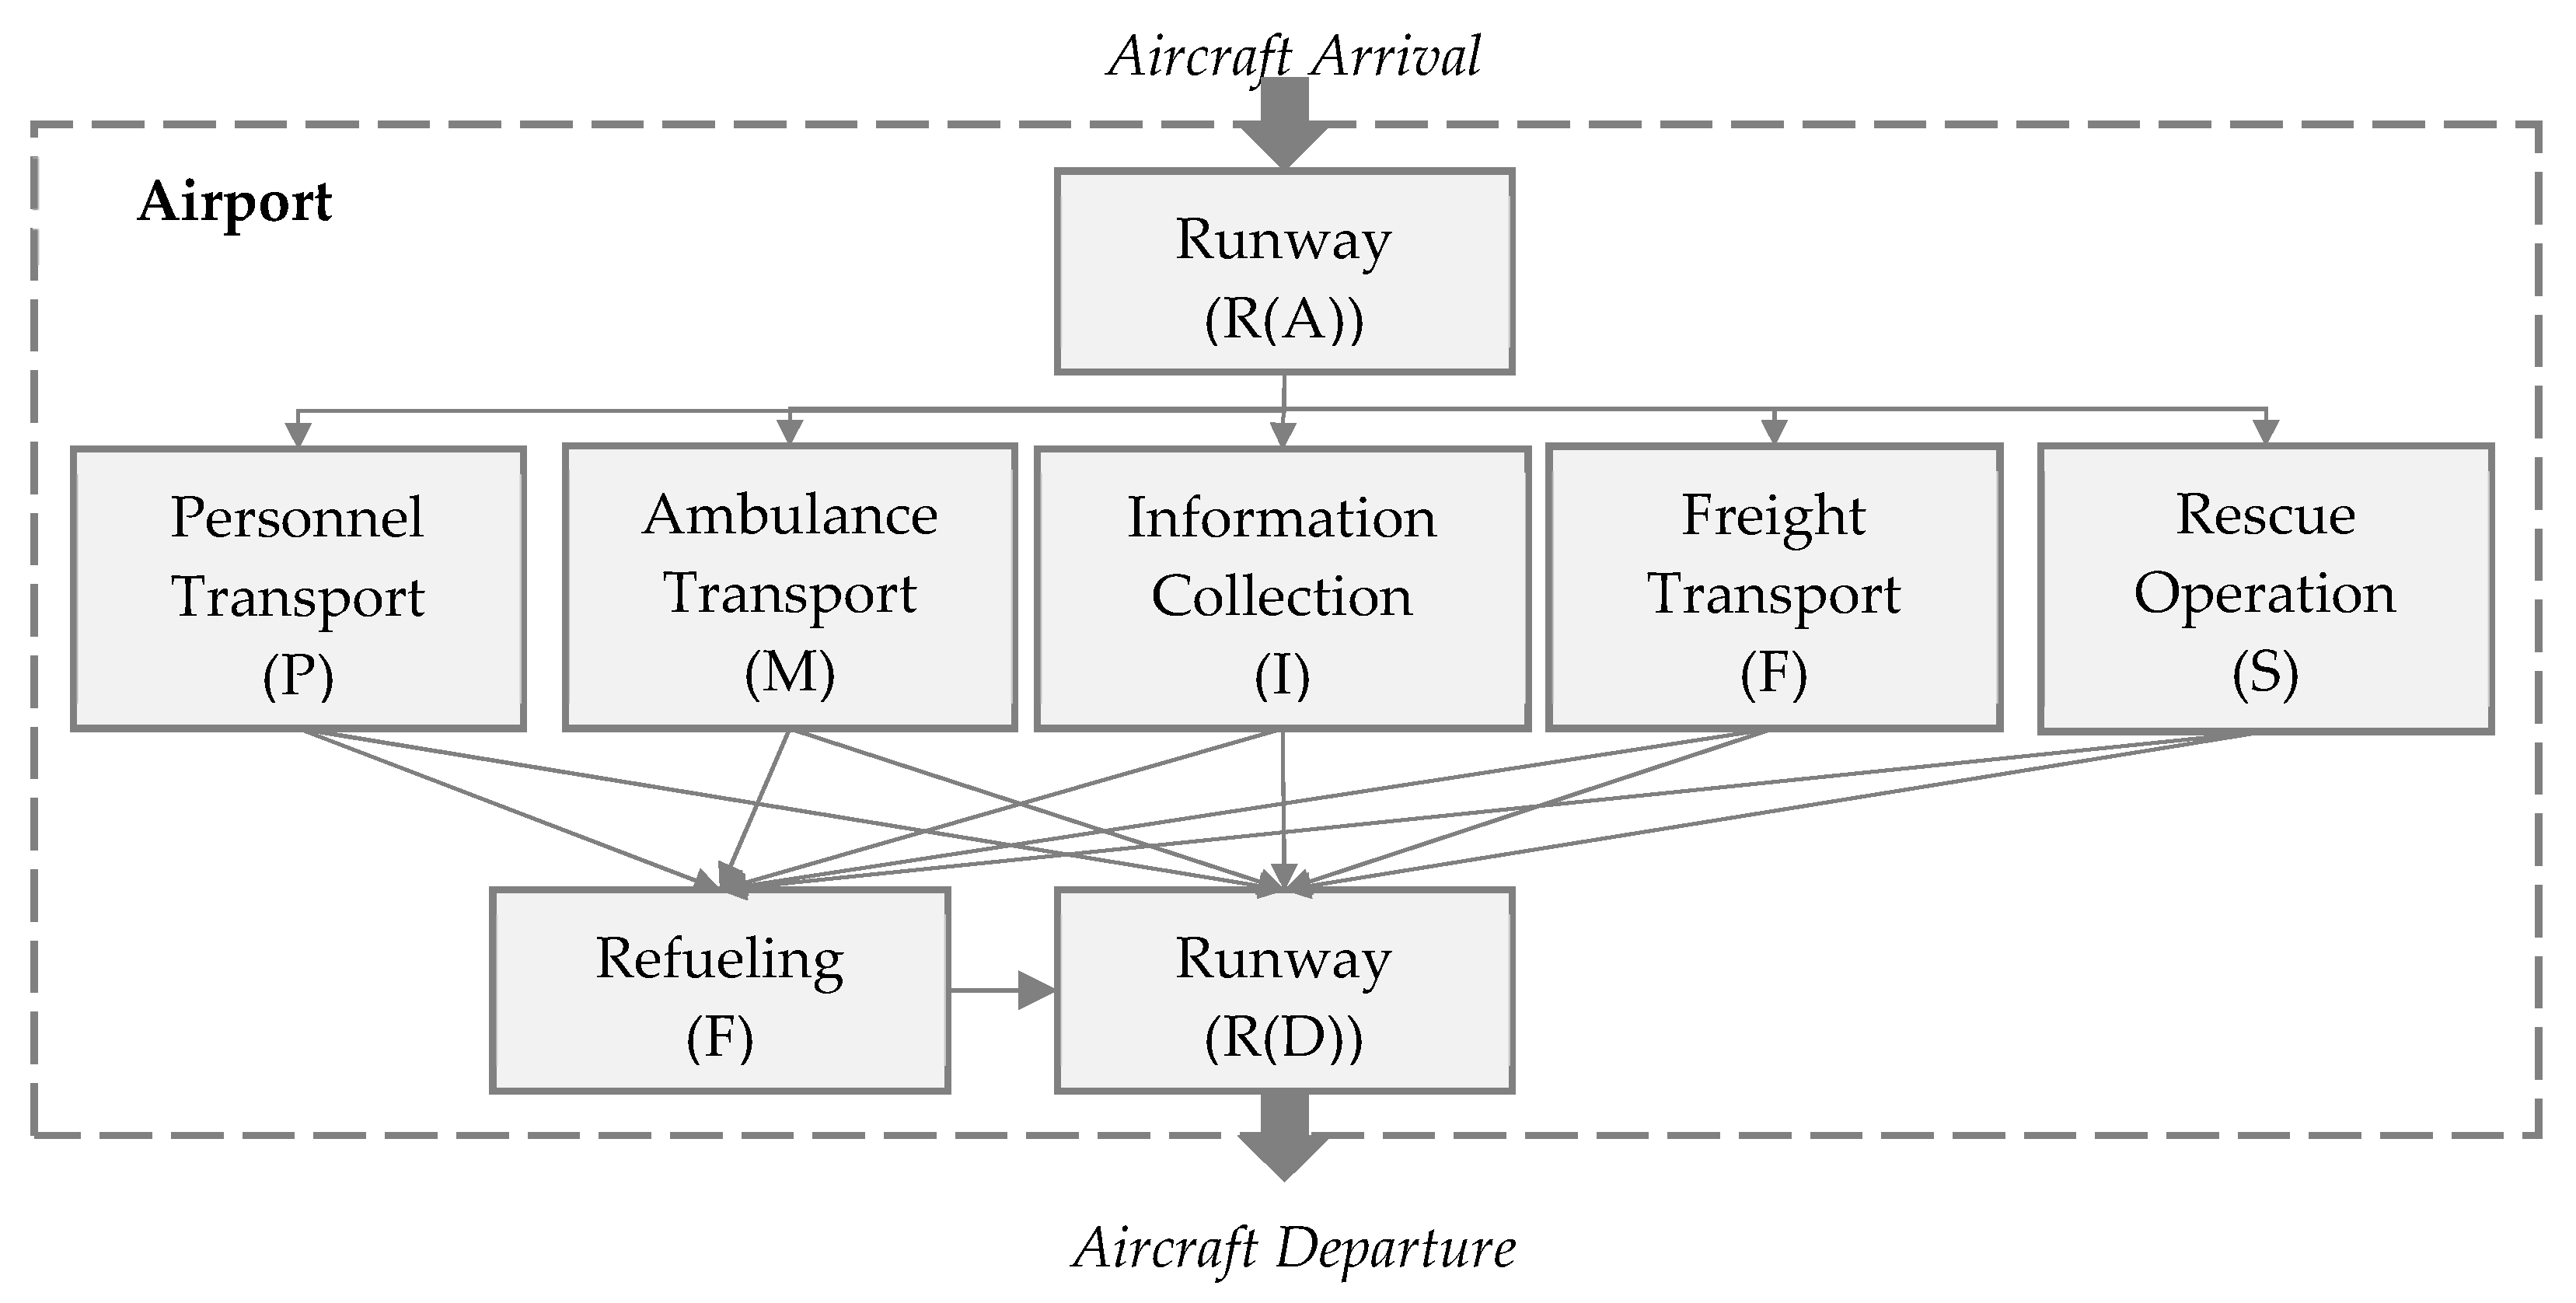
The queuing system consists of three main components: arriving customers, the queue, and the service mechanism. The present study defined the arriving customers as the aircraft arriving at the airport. The queue and service mechanism refer to the Poisson processes of the two mechanisms in the study. Here, the queuing modeling is applied to an airport by considering different disaster response activities as services in the queuing system. The proposed model considers these main disaster response roles: ambulance transport, rescue operations, disaster response, information collection, personnel transport, and freight transport. In an airport, numerous operators and aircraft are gathered, and all of their capabilities are valuable; however, medical treatment for critical patients and the provision of ambulance transport is regarded as being more urgent than any other response. For the queuing system components of the model, the arrival rate and service rate follow Poisson processes. The open Jackson network of the model contains eight servers, and this study treats aircraft as the sources of customers, following the infinite source case. The disaster response activities for different aircraft purposes are modeled as a single server in the network, as shown in
Figure 1. We especially focused on operations within a single airport which can be considered as a point of entry to the impacted region. In normal airport operations, aircraft behaviors conform to conventional rules. The aircraft operator enters the airport by landing on a runway, taxiing, and then parking in the apron area. The aircraft is then refueled, overseen by a maintenance review, and then leaves the airport for its next destination. We found that aircraft responding to emergencies also conform to similar fixed processes.
In general, any one flight has one purpose and ends at a base airport after the completion of the mission. The aircraft must be refueled before leaving for its next mission. Fueling is also critical for helicopters, especially to maximize the efficiency of their response characteristics by reducing the number of times they must land at an airport.
This model assumes the following: The airport has one runway and is controlled by air traffic control that is always available; in the immediate response phase (the three days after a disaster), all the operations are performed by helicopters; to ease the calculation, all the helicopters have identical specifications (a fuel capacity of 1251 L and a maximum load of 2313 kg (taken from the specifications of the BELL412 helicopter, which is often used for rescue and response operations)); all the helicopters have one purpose per flight mission; the airport operation hours are from 07:00 to 19:00 because aircraft, especially rotary-wing aircraft, become significantly more dangerous to operate at night.
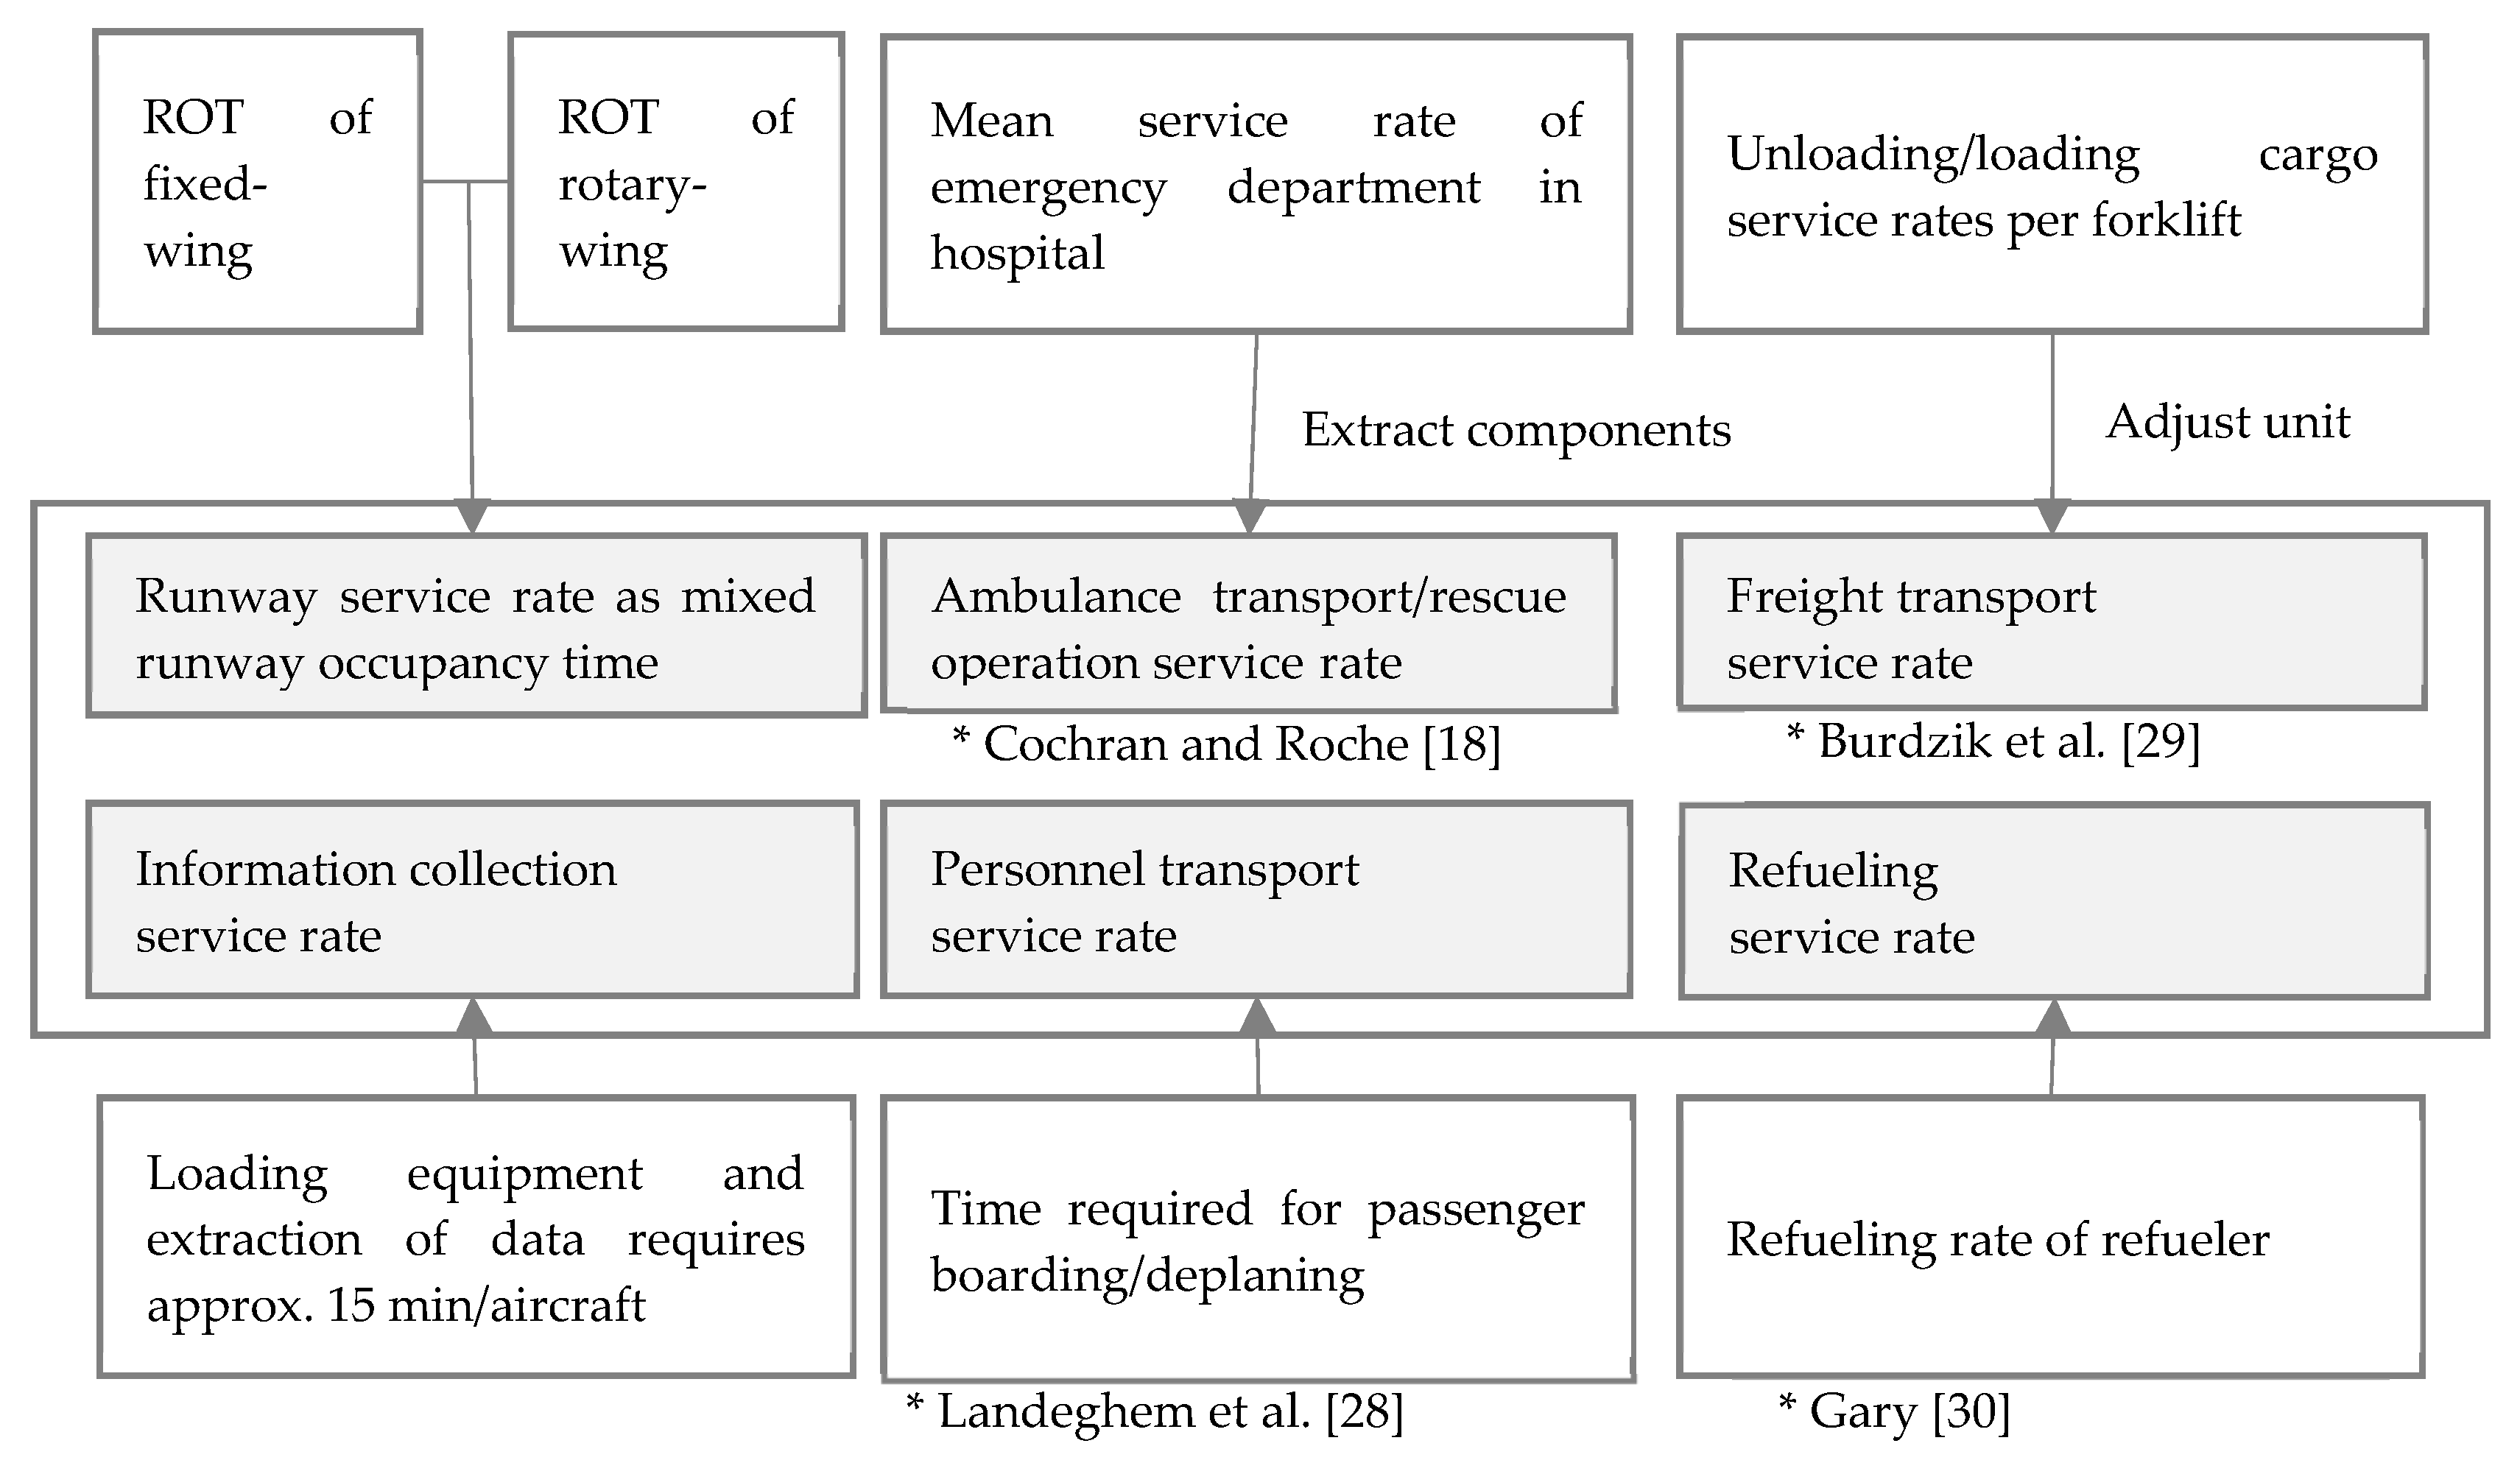
Data collected regarding the service rate of each disaster response activity are shown in
Figure 2. Activities that the airport undertakes during a disaster response include ambulance transport, personnel transport, the unloading and loading of freight, rescue activities, and refueling. It is not possible to determine the exact service rate for each individual activity in emergencies because of the lack of specific information and differences between emergencies. Therefore, service rate data was collected from relevant research as proxies for the service rate of each server.
Seven service rates were estimated: runway, personnel transport, ambulance transport and rescue service, information collection, freight transport, and refueling. The runway occupancy time was calculated from the number of rotary-wing and fixed-wing aircraft arrivals at the airport, using the mean runway occupancy time of the two different modes based on flight movement data from the Tohoku region immediately after the Great East Japan Earthquake of 2011. This data was provided by MLIT, as mentioned above. The personnel transport service rate refers to the loading and unloading of passengers from aircraft, as suggested by Landeghem and Beuselinck [
28]. Likewise, this study utilized the ambulance transport service rate data inferred from Cochran and Roche [
18]. The service rate data for ambulance transport is estimated by extracting emergency medical treatment data on critical patients and rescue activities that are considered as triage activities, as inferred from Kim and Kim [
25].
Information collection is usually conducted using rotary-wing aircraft operated by government or media agencies. From interviews conducted by the authors with airport operators involved with the Great East Japan Earthquake, approximately 10 to 15 min are required to unload and load broadcasting equipment and staff. Here, the unloading and loading time was set to 15 min. The freight transport service rate addresses the handling of humanitarian aid goods during disasters; in real-world situations, the processes are treated manually, mechanically, and sometimes both, depending on the airport facilities. Assuming that forklifts are widely used in an airport to lift goods, the forklift speed described by Burdzik et al. [
29] was used to determine the freight transport service rate. Gary [
30] provided the flow rates of a fueling truck and hydrant dispenser, which was used to determine the refueling service rate in this analysis.
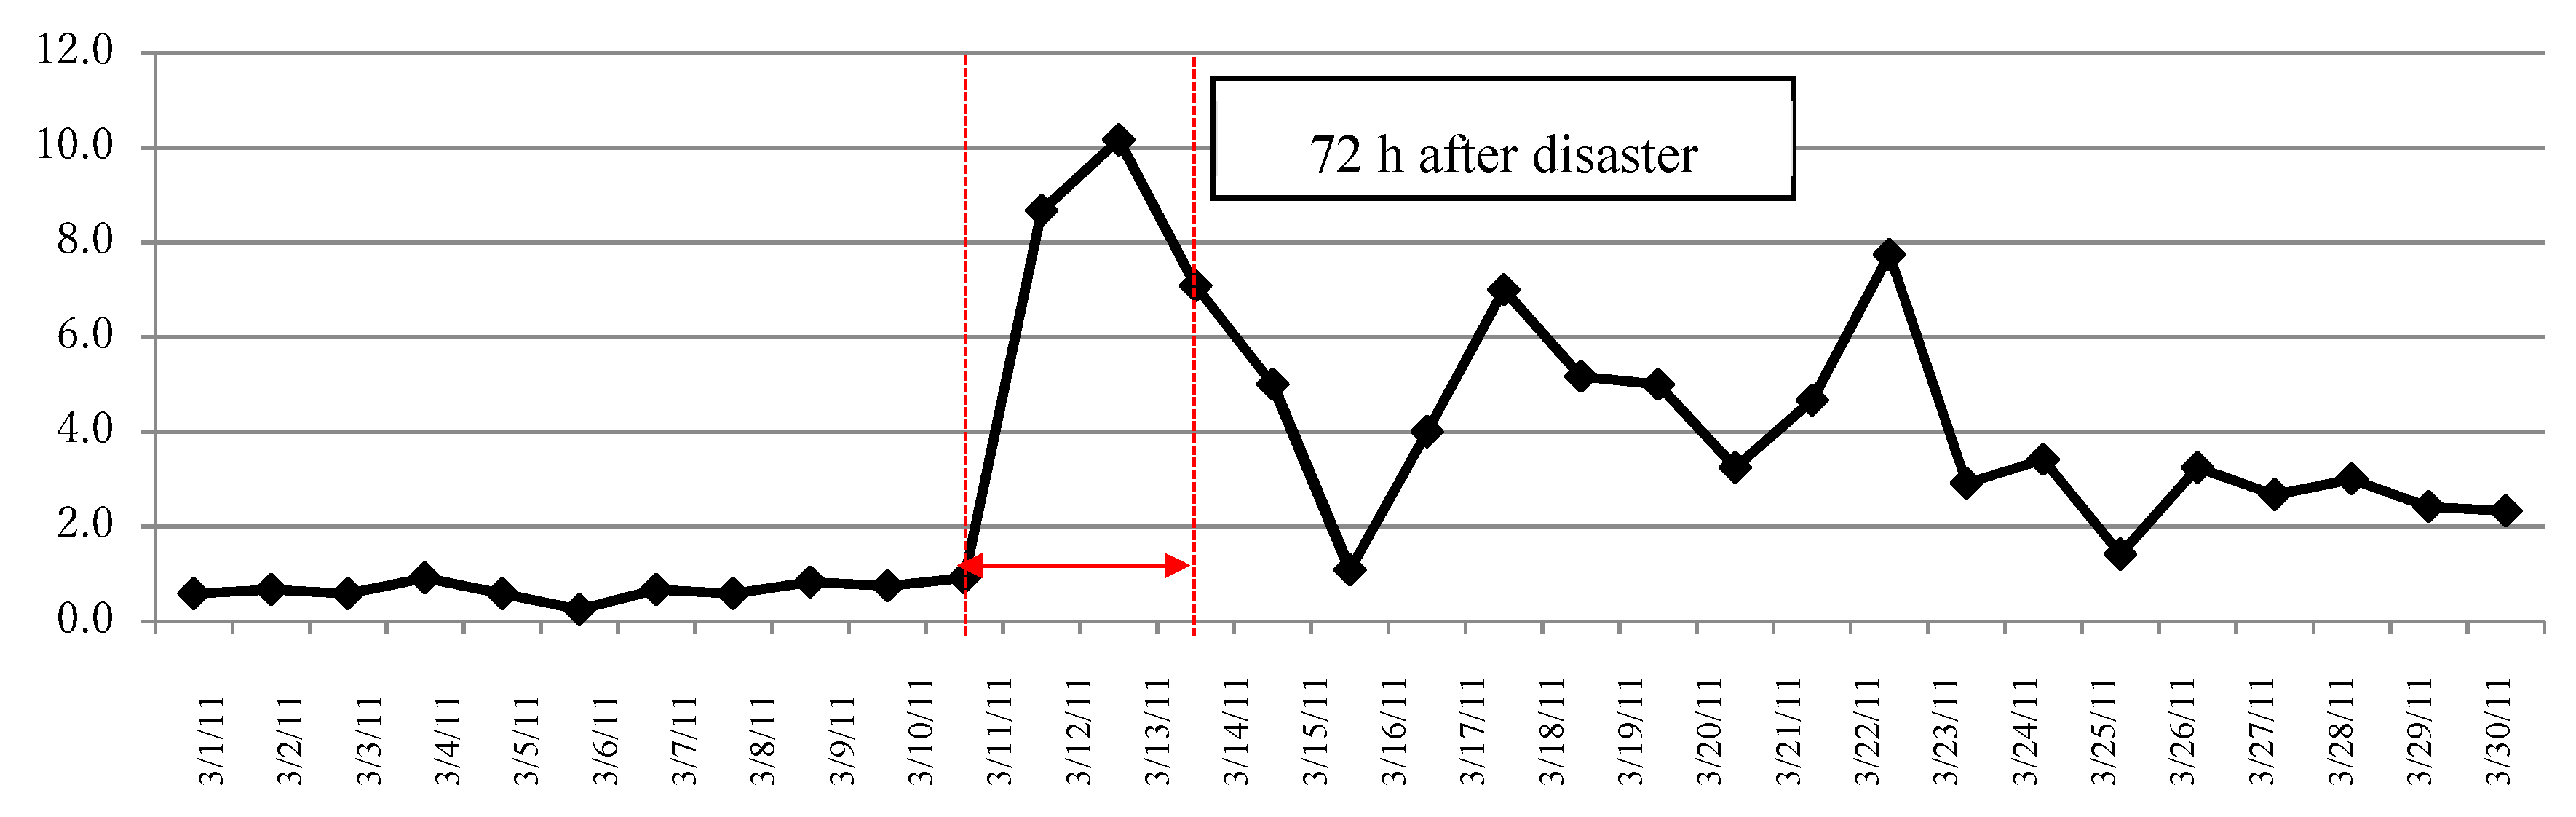
Flight movement data from the Tohoku region in response to the Great East Japan Earthquake in 2011 was provided by MLIT. The dataset includes 20,243 movements, including arrivals and departures of both rotary-wing and fixed-wing aircraft. Data were extracted from the period 1–31 March 2011, and the Hanamaki Airport’s operating hours were observed to extend from 07:00 to 19:00. Because this study focuses on the immediate disaster response phase, the mean hourly arrival rate over the time span within the first three days of the earthquake was derived, as shown in
Figure 3. This process can be applied to other airports involved in the Great East Japan Earthquake to acquire more numerical examples.
The first queuing discipline, FCFS, is used in real-world disaster response situations, in which no priority is assigned to different operators upon their arrival. The second queuing discipline is a non-preemptive priority discipline, in which priorities are assigned to operators by weighting their role in saving lives, although an aircraft being served cannot be returned to the queue if a higher-priority aircraft enters the queuing system. The third queuing discipline is a mixture, which uses both FCFS and non-preemptive priority disciplines for operators. In the mixed approach, priority is assigned to the top two operators, with the other operators pooled together as the third priority, which conforms to the FCFS discipline.
Table 3 shows the different priority assignments for each queuing discipline, where 1 represents the highest priority and 5 represents the lowest priority. The priorities were assigned to aircraft operators based on the degree to which an aircraft transported passengers who required life-saving urgency, which can critically affect the waiting time of passengers. Therefore, the highest priority was given to medical helicopter in priority and mixed queuing discipline.
A queuing network in an airport accommodates many different processes that are involved in disaster responses, starting from the runway and proceeding to the next process according to a given aircraft’s purpose. Each aircraft’s purpose is decided by the aircraft’s operator, and the aircraft usually delivers a single mission with each flight. Because aircraft are classified according to their purposes, the waiting time and the number of aircraft in each process can be calculated based on the Jackson network theorem.
An aircraft enters an airport with one or more operational purposes: runway, personnel transport, ambulance transport, information collection, freight transport, rescue operation, and refueling. The model proposed here assumes that all aircraft need to refuel before leaving for the next flight mission, and that each aircraft must follow a runway procedure to complete its mission because both fixed-wing and rotary-wing aircraft require runway access. Although rotary-wing aircraft offer more flexibility in terms of landing sites, they are nonetheless directed by the air traffic controller.
2.1. Base Case
Disaster response activities are defined by the server
i (
i = 1, 2, …, m) within a multiclass open Jackson network. Airport performance in a Jackson network model with FCFS and priority rules can be predicted by the models devised by Hillier and Lierberman [
31], and Kim and Kim [
25]. Equation (1) represents the business or utilization rate of server
i during the disaster response.
is defined as the total arrival rate of all operators into server
i, as given by Equation (2). An open Jackson network model normally represents the external arrival rate from outside the network as
; however, it is assumed that, because aircraft strictly conform to air traffic control rules, this external arrival rate is excluded from this calculation. Here,
represents the fraction of aircraft from server
j to server
i; the transition probability between servers is obtained, and the transition matrix is shown for all operators. Each server may contain multiple servers which conform to the M/M/s properties. When there is only a single server it conforms to the M/M/1 properties. As a result, the following performance data can be determined: the expected waiting time in the queue, the expected waiting time in the system (including the service time), and the expected number of aircraft. The number of servers at each node
i, represented as
, is set to 1 in this case. Equation (6) indicates the mean waiting time in an airport, which can be used to make a comparison with the waiting time at other airports.
Mean service rate of response activity i is notated as where mean aircraft arrival rate through response activity i is . Utilization rate for response activity i is derived from Equation (1) and noted as . Transition probability of aircraft from response activity i to response activity j is . Mean number of aircraft in response activity i is and mean waiting time in response activity i excluding service time is denoted as . Mean sojourn time in response activity i including service time is defined as where mean waiting time in airport including servicing time for each aircraft is T.
2.2. Priority Case and Mixed Priority Discipline
In the previous section, aircraft operators were not assigned a priority but were instead all assumed to have the same priority. To represent the priority discipline and mixed discipline, all of the performance measurements in the single server
i conform to the M/M/s spreadsheet template proposed by Hillier and Lierberman [
31]. The expected sojourn time in processes with no pre-emptive priority was calculated based on the following model. Class
k aircraft arrive at response activity
i at the same arrival rate as that assumed for Equation (1). When a non-preemptive priority discipline is applied in airport disaster response operations, this means that aircraft with priority
k are served according to their priority, while those having the same priority conform to the FCFS basis [
25]. The steady-state expected waiting time in the system, including the time required to service an aircraft of priority class
k, is defined by Equation (7) [
25]. Expected waiting time at the node
i including service time of priority class
k is denoted as
and
refers to number of servers in node
i. Since Little’s formula still applies to individual priority classes, applying the Jackson network theorem to calculate the arrival rate and transition matrix for all the operators, allows the total waiting time, including the service and queue waiting time, to be derived. When applying the mixed priority discipline, we can assume that some processes conform to the non-preemptive priority rule while others follow the FCFS rule.
3. Results
Data were collected by following the data collection procedures described in
Section 2. We focused on three airports that were actively involved in the response to the Great East Japan Earthquake in 2011: Hanamaki, Fukushima, and Yamagata. In particular, Hanamaki Airport was selected for the investigation described in the following section because its basic airport facilities sustained no severe damage in the earthquake. This airport had also prepared countermeasures for disasters based on the experience gained from the 2008 Iwate-Miyagi Nairiku Earthquake, ensuring cooperation between the disaster response aircraft operators and the prefectures [
14].
Although an airport is treated as a connected open Jackson network, there is no external arrival rate from outside the network because an aircraft cannot land at a server without passing through the runway. The input data used to derive the performance measurements were estimated as described in
Section 2. The runway occupancy rate of Hanamaki Airport after the Great East Japan Earthquake of 2011 was estimated to give a runway service rate of 15 aircraft/h. The service rates for each activity within the airport were as follows: personnel transport = 4.8, ambulance transport = 7.24, information = 4, freight transport = 4.5, rescue operation = 6.51, and refueling = 9.76 aircraft/h. According to the flow conservation law relating the queuing network’s input and output flows, the arrival rates determined by the number of runway arrivals and departures would be the same.
The model assumes that the service rates are the same for all airports, except for the refueling service rate at Fukushima airport, which does not have as much capacity as the other two airports. It is challenging to set specific service rates for all of the different activities at each airport. To take the smaller refueling capacity into account, we assumed that the fueling tank size was reduced to 60% of the normal capacity.
3.1. Effects of Different Queuing Disciplines: Hanamaki Airport
The arrival rates for different helicopter operators at Hanamaki Airport were estimated as shown in
Table 4. The total mean arrival rate of aircraft during the first 72 h at Hanamaki Airport was 8.64 aircraft/h. To maintain the necessary flow conservation in the queuing network, aircraft arrivals and departures through a single airport were assumed to be the same. The total arrival rate for each server is listed in the right-hand column of
Table 4.
The transition matrix for each operator was estimated based on the fraction of the total hourly arrivals taken up by that operator. Because the particular transition probability for each server is not known from the limited information available, this study assumes the following: Each aircraft should proceed to refueling and the runway before leaving for its next mission. However, there are aircraft that do not always follow this process, but instead immediately depart on their next disaster response missions, such that the refueling and runway transition probabilities are regarded as being 0.5. In addition, all the aircraft that have refueled must leave the airport, resulting in a transition probability of 1 for refueling to runway. Since one aircraft cannot move backward in the topology and carries a single disaster response purpose, it is 0. Following this approach, the transition matrix for a medical helicopter at Hanamaki Airport is estimated based on flight movement data by MLIT in
Table 5.
Table 6 depicts the number of aircraft undertaking each activity, the expected waiting time including the servicing time, the expected waiting time excluding the servicing time, and the utilization rate of each activity at Hanamaki Airport. Hanamaki Airport primarily served as a base for search and rescue activities; very few helicopters were involved in the broadcasting purpose, with most of the aircraft’s missions being focused on humanitarian logistics activities. The table shows that the longest waiting time is incurred for the rescue purpose; this is because many operators are initially dedicated to search and rescue activities in the response phase immediately after a disaster.
The total waiting time, including the service time, for the rescue purpose was the greatest, at 37.97 min/aircraft, when applying the FCFS queuing discipline. This is because, when operators are not weighted, every operator will be subject to the same waiting time in the system. Runway congestion may not be the biggest bottleneck obstructing entry into an airport: the waiting time on the runway, including the service time, was approximately 9.43 min in the network. In comparison, the waiting time, including the service time, for the freight transport system was 17.65 min, which was shorter than expected because the model considers only automatic assistance and does not consider the effect of the human workforce.
In addition, the queue waiting time for refueling was shown to be less than 5 min/aircraft. Although actual disaster response operations would ideally conform to this model, this is not always the case. In the Great East Japan Earthquake, the findings of Hanaoka et al. [
10] revealed that refueling was one of the biggest bottlenecks in the airport because the airport sometimes lacks the necessary fueling capacity, so that aircraft had to wait up to 60 min. The biggest waiting time difference, including service time, was 28.54 min, as obtained by subtracting the runway waiting time (9.43 min) from the rescue operation (37.97 min). Therefore, even if an aircraft enters the airport, it will not reduce the waiting time, indicating that the FCFS discipline is of limited value, given the urgent demands of humanitarian logistics.
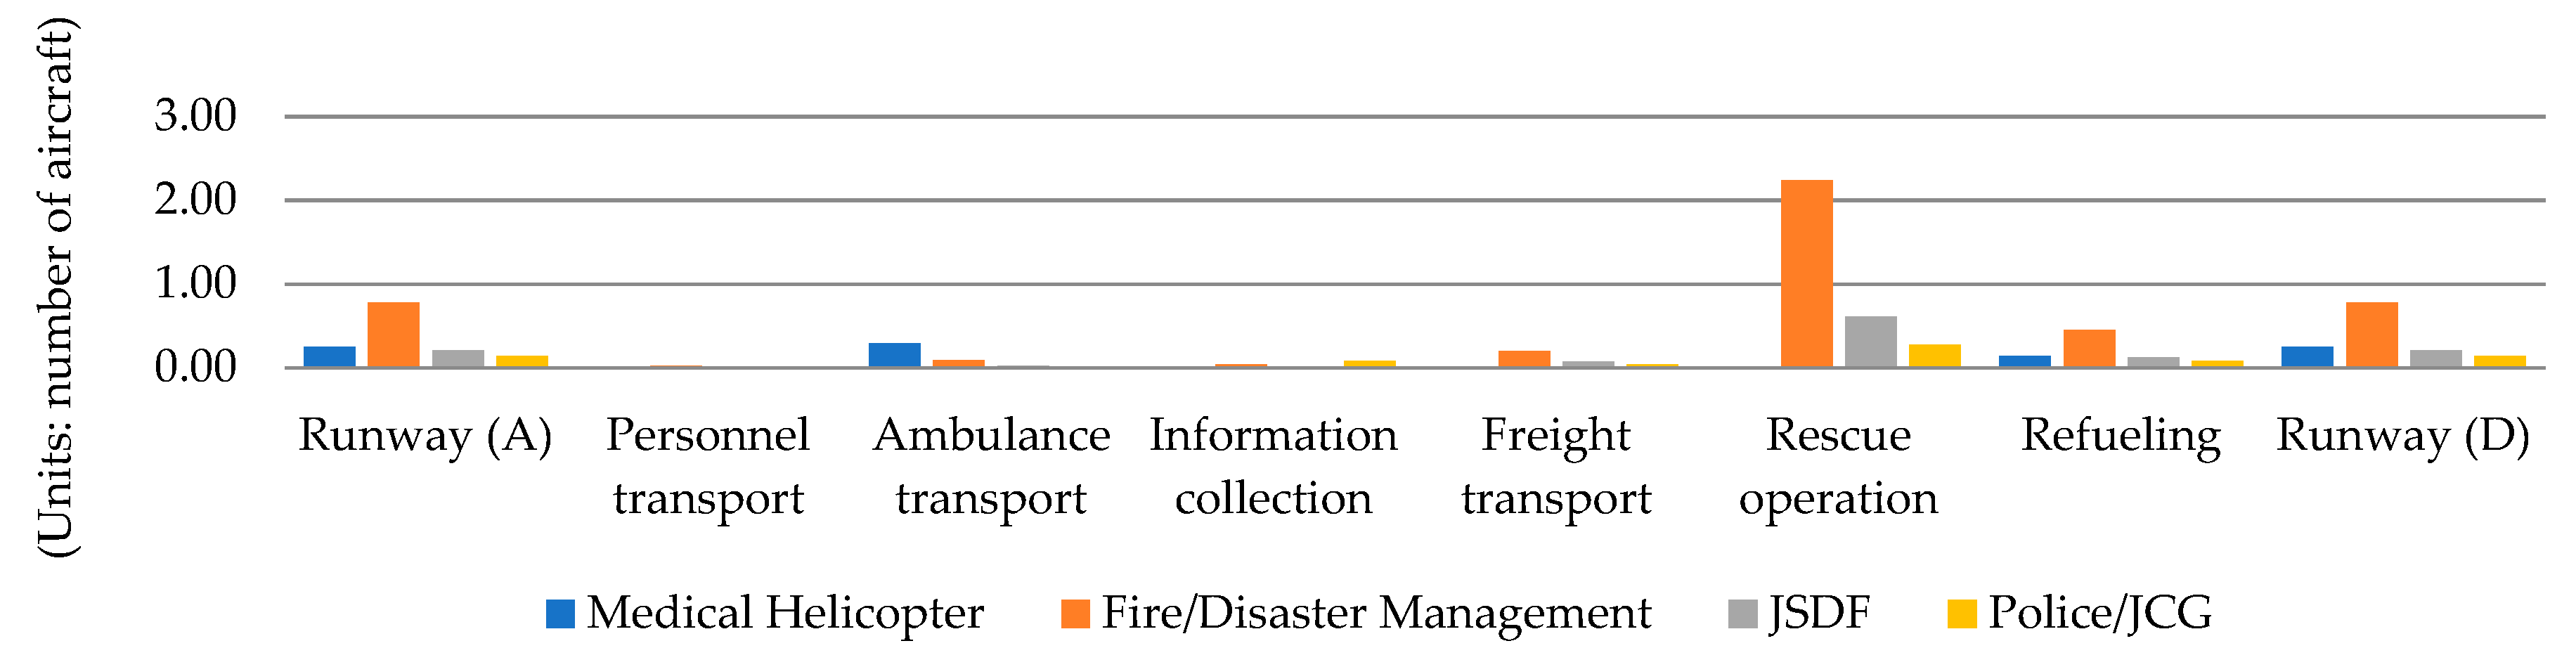
Figure 4 shows the mean number of aircraft involved in the response activity, as listed in
Table 6, with details on multi-class operators. It can be seen that the biggest number of aircraft in the server is 1.6, which occurred for the rescue shown in
Figure 4. The other purposes incur less than one aircraft in their waiting times. Because the operators convey most of their flight missions to assist humanitarian logistics, most of the activities are highly related to life-saving activities, such as rescue. It is natural that the waiting time of an aircraft in rescue is the highest after arrival since majority of operation was focused on rescue activity. We can conclude that the highest utilization of any one activity at the server gives rise to the biggest bottleneck among the different priority groups. The total expected number of aircraft is highest for the rescue server of an airport, with about six aircraft remaining in the network. Specifically, different operators’ roles duplicate certain rescue activities in a disaster response, especially between JSDF and the Fire/Disaster Management helicopter. There are relatively few waiting aircraft in the personnel transport, ambulance transport service, and information collection systems.
Therefore, this study investigated not only the FCFS rule, but also the priority rule and mixed rule; the results obtained using these different disciplines are compared in
Table 7. We evaluated the three discipline policies, and were able to draw the following conclusion. First, when comparing the FCFS and priority disciplines, a dramatic drop occurred in the waiting times for the medical helicopter and the Fire/Disaster Management helicopter. In general, the application of the priority rule reduces the waiting time in most servers for most operators. However, as mentioned in the previous section, because most disaster responses focus on rescue activities, the waiting times for the Police/JCG and broadcasting helicopters increase significantly when the priority rule is applied, relative to the FCFS case (up to 360% for Police/JCG activities and up to 606% for broadcasting activities). These results would not be acceptable in a real-world situation and, therefore, the priority rule and mixed rule were also compared.
The application of the mixed rule yields a shorter waiting time for the Police/JCG and broadcasting helicopters, with a significant decrease compared to the priority case. However, the mixed rule yields a longer waiting time for the JSDF if we cannot apply the FCFS rule. When considering the urgency of those activities that involve the medical helicopter and Fire/Disaster Management, adopting the priority rule is recommended among the three alternatives. However, a trade-off occurs between the lower- and higher-priority operators. We further examined another mixed discipline grouping of the medical helicopter, Fire/Disaster Management, and JSDF as priorities 1, 2, and 3, respectively, and grouping the Police/JCG and broadcasting activities as priority 4. However, this produced an even longer waiting time for the lower-priority groups.
3.2. Comparison of Observed and Estimated Data: Fukushima, Yamagata, and Hanamaki Airports
This section investigates the feasibility of applying the proposed Jackson network topology by simulating each airport’s estimated waiting time. In this investigation, the model’s parameters are deemed to have been optimized if they are set to yield estimated results that are close to the observed results. This optimization is often challenging, and the parameters can be difficult to adjust. A comparison of the total waiting time at each airport on each date at each of the three airports is given in
Table 8. The observed data is collected based on the mean waiting time of an aircraft in each airport, based on flight movement data provided by MLIT. The estimated data was calculated as the sum of the expected number of aircraft at node
i (
), divided by the mean hourly aircraft arrival rate according to Little’s Law [
30], as defined by Equation (6).
First, Yamagata Airport and Fukushima Airport, with the application of the FCFS queuing discipline, were discussed. The results are listed in
Table 8.
Table 8 shows the number of aircraft involved in each activity, the expected waiting time (including the service time), and the expected waiting time (excluding the waiting time), as well as the utilization rate of each activity at Yamagata Airport. The longest waiting time, including the service time, arose for the rescue purpose. This exhibits a similar tendency to Yamagata Airport since the many operators involved in the immediate response are first dedicated to search and rescue activities. The total waiting time for the rescue purpose was 16.09 min when the FCFS queuing discipline was applied. The shortest waiting time at Yamagata Airport was that for the runway, implying that the runway itself was not a bottleneck. The most congested server, for which the utilization rate was the highest, was refueling, at 0.43. The utilization rate of the other servers at Yamagata Airport was less than 0.30, with the lowest being 0.02 for the ambulance transport purpose.
The number of aircraft at Fukushima Airport was less than 1 on average for all the servers. The waiting time, including the service time, was greatest for the information purpose, being 17.58 min. The second highest was 16.09 min for the rescue purpose. This was caused by the airport mainly playing an accepting role for media helicopters being used for information collection. A comparison of the waiting times in the queue for each server revealed that the shortest waiting time was that for the ambulance transport, at 0.14 min, while the highest was that for rescue at 6.87 min. On the other hand, the utilization rates for the rescue and refueling purposes were both 0.43, given that the two servers had more congestion than the other servers.
Based on the interview results, refueling appeared to be more actively supported in those airports that served as a base for helicopters. Therefore, we increased the transition probability by 10% to observe its effect on the waiting time. The smallest discrepancy was found for Hanamaki Airport, where the estimated waiting time was 95 min and the observed waiting time was 93 min, assuming a transition probability from each activity to refueling of 0.7 on 13 March, 2011. From these results, we can conclude that a higher probability for refueling, such as 0.8, as shown in the right column in
Table 9, produces less of a discrepancy between the observed and estimated data. However, Fukushima Airport did not show this, since the arrival rates sometime exceeded the service rate of the refueling system, preventing us from deriving estimated results.
These results can be attributed to the following three factors.
The estimated data set considers fewer aircraft movements than the observed data. When deriving the transition probability for each airport operator’s movements within an airport, there were sometimes missing and/or unknown data, with the information relevant to which operator managed each transition being incomplete.
The estimated data for the service rate does not consider the exact behavior that is observed during a disaster. When gathering information on the service rate of each activity at the airport, some data, such as the information collection service rate, was based on actual interviews conducted after the Great East Japan Earthquake. However, because of the challenging data collection situation, other service rates were collected from previous literature reviews and reports. Even if specific numbers were set for the service rates, these would not include the uncertainties associated with disasters or the impacts of disasters on the normal service rates.
Uncertainties associated with disasters are not included in the simulation. Airport operations are affected by wind, precipitation, temperature, control systems, and other factors. In addition, the impact of a disaster on the airport operations was not considered; for example, air traffic control would experience a much higher workload after a disaster, compared to its normal operation.
In an emergency, the airport operation devised for use in a disaster may not necessarily be applicable, but we can determine the critical bottlenecks that will have a wide-ranging influence. Especially, airport operations in an emergency are highly dependent upon the decisions of the air traffic controller and management. These decisions are made based on conventional approaches, such as the FCFS rule. It is strongly recommended that stakeholders related to airport disaster response operations, such as local government, military, airport operators and air traffic controllers, medical teams, and others, discuss the optimal queuing rule, techniques enabling its implementation, and scenario planning in advance of any disaster.
4. Discussion and Conclusions
Aircraft arrivals at an airport during a disaster response were modeled using an open Jackson network model. Considering the different aircraft operators were multi-class, FCFS, priority, and mixed cases were investigated, and the open Jackson network model was applied to the disaster response of an airport in order to estimate the mean waiting times for an aircraft at an airport. A case study was conducted for the Great East Japan Earthquake of 2011. The research novelty lies in the development of disaster response activity topology in an airport through interviews and literature reviews, which has not yet been discussed in detail. The same topology was examined for Hanamaki, Yamagata, and Fukushima Airports through comparisons of the observed and estimated data. The estimated data was found to yield generally lower values than the observed data. The model’s accuracy was improved by increasing the transition probability from response activities to fueling.
The results showed that the application of a priority rule significantly reduced the mean waiting time of an aircraft for those operators who were assigned a higher priority. However, the lower-priority group experienced excessive waiting times compared to the base FCFS case. This would not be acceptable upon the occurrence of an actual disaster. Therefore, the study suggests the application of a mixed queuing rule that assigns a higher priority to those operators involved in life-saving activities and no priority to the lower-priority groups. The following paragraphs describe the key points that we were able to conclude.
There are three particularly significant implications related to the different queuing disciplines. First, current airport operations follow the FCFS rule on the runway, whereas the results of this study show that the mixed queuing discipline would be superior. Second, an operator’s priority has to be assigned according to the aircraft’s purpose, so that medical helicopters and Fire/Disaster Management agencies experience the most reduced waiting times. Although the numerical example presented in this study did not precisely reflect the uncertain conditions of emergency situations, the analytical model intuitively evaluated which rule should be applied for aircraft arriving at the airport. Finally, airport features and constraints can be considered as limited resources in humanitarian logistics, and extensive changes or additions to airport features require excessive investment costs. Therefore, it can be inferred that an airport’s responsiveness can be enhanced when appropriate operations are supported.
Since the model does not explicitly apply other constraints such as aircraft size, runway occupancy, refueling time, and ambulance transport time, this study barely achieves validation of the results compared to real conditions. Several future study directions are suggested. Building a scenario analysis to investigate the sensitivity of the model is recommended to examine which parameter has the greatest effect on the waiting time. Also, a comparison of different Jackson network topologies for different airports, and reflecting the dynamics of the disaster situation, will be necessary to achieve a degree of effectiveness for the model. The other aspect is the trade-off between the benefit of waiting time reduction and the cost incurred by having aircraft waiting at nearby airports, helicopter bases, or sometimes in the air. However, the findings here suggest that a simple and prompt analysis can enhance an aircraft’s operation during disaster response. This suggests that investigating a queuing network as a means of representing airport operation in the event of a disaster would be an acceptable approach to evaluating the waiting times of an aircraft and queuing disciplines until further developments of simulations considering variance, dynamics, and uncertainties become available.


