Article

Effect of Piezo-Embedded Inverted Flag in Free Shear Layer Wake

by
Sidaard Gunasekaran
*,† and
Grant Ross
Mechanical and Aerospace Department, University of Dayton, Dayton, OH 45469, USA
*
Author to whom correspondence should be addressed.
These authors contributed equally to this work.
Aerospace 2019, 6(3), 33; https://doi.org/10.3390/aerospace6030033
Submission received: 21 January 2019 / Revised: 20 February 2019 / Accepted: 25 February 2019 / Published: 7 March 2019
(This article belongs to the Special Issue Design and Analysis of Wind-Tunnel Models and Fluidic Measurements)

Abstract

:
The use of flexible inverted piezo embedded Polyvinylidene Difluoride (PVDF) as a simultaneous energy harvester and as a wake sensor is explored. The oscillation amplitude (characterized by voltage output) and oscillation frequency of the piezo-embedded PDVF was quantified in the wake of a 2D NACA 0012 model and SD7003 model at a Reynolds number of 100,000 and 67,000, respectively. The performance of the sensor was also quantified in the freestream without the presence of the wing. In order to quantify the sensor response to angle of attack and downstream distance, the amplitude and frequency of oscillations were recorded in the wing wake. Increase in angle of attack of the wing resulted in increase in oscillation frequency and amplitude of the PVDF. The results also indicated that the inverted flag configuration performed better in the wake under unsteady conditions when compared to freestream conditions. The results from Particle Image Velocimetry indicated that the wake signature was not affected by the presence of the PVDF in the wake. The root mean square voltage contours in the wake of SD7003 airfoil show remarkable free shear layer wake features such as upper and lower surface stratification and downwash angle which shows the sensitivity of the sensor to the unsteadiness in the wake. The capability of this device to act as a potential energy harvester and as a sensor has serious implications in extending the mission capabilities of small UAVs.

1. Introduction

The usage of drones (small scaled unmanned aerial vehicles) have increased exponentially in recent years, especially in personal, commercial, entertainment, industrial and military applications. The higher usage of drones is predicated on their capability to reach remote areas and require the least amount of time, effort and energy. However, some of the major hindrances in the use of drones are its lower battery life, less maneuverability and poor gust response. Due to restrictions in size and weight of the drones, increasing the flight time and stability remains a velleity. Any incremental gain in battery life will translate to longer flight time. In addition, achieving flight control through smart material actuation will save weight, which also translates to longer flight time. The current research explores the possibility of overcoming these shortcomings by employing flexible inverted piezo embedded Polyvinylidene Difluoride (PVDF) in the wake of a wing to
  • Harvest energy to increase battery life.
  • Sense changes in the wing wake for gust alleviation.
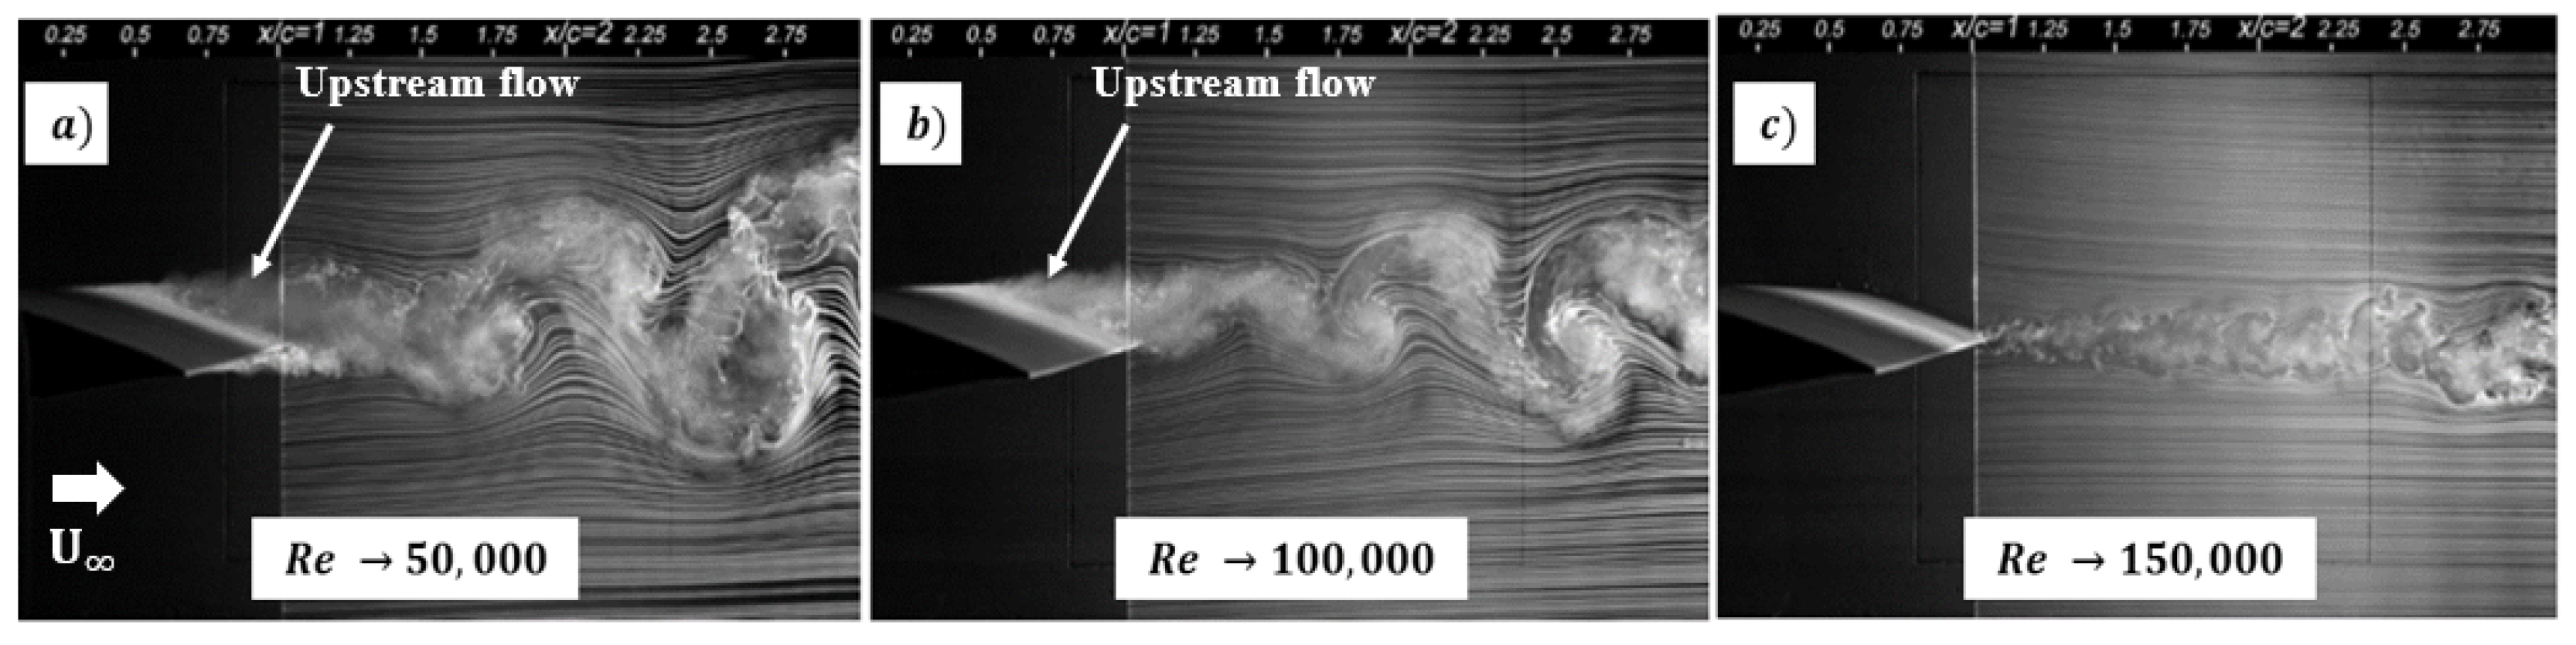
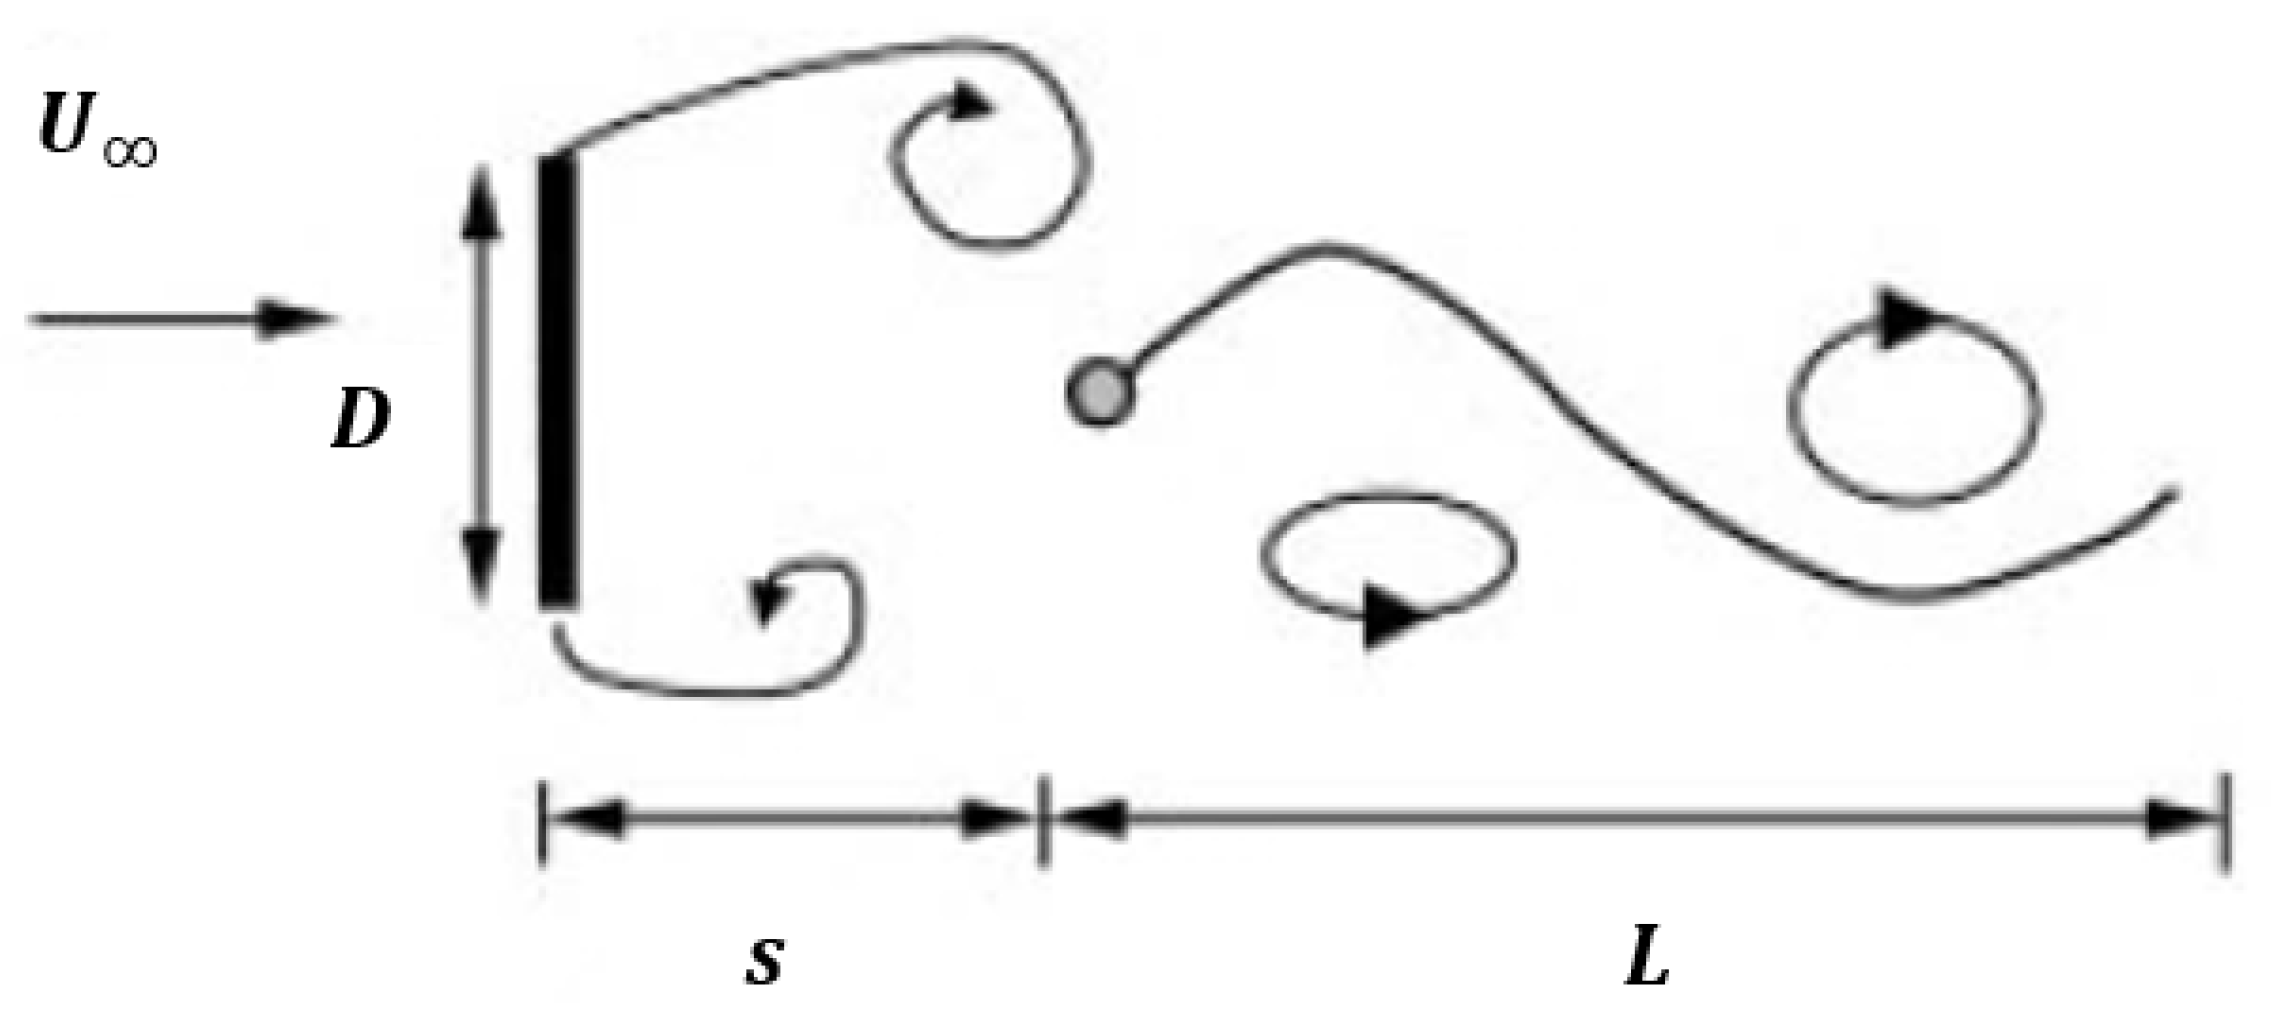
Globally, the use of small-scale drones has been increasing at an exponential rate. In 2018, the estimated investments in drones’ totals over 10 billion US dollars (as shown in Figure 1 and will continue to grow in the near future [1].
As such, increasing the reliability, endurance, range and flight time of the drones is given significant priority by government and non-government organizations. Therefore, it is prudent that continuous effort is put into developing technologies to improve the mission capabilities of the UAVs. The three areas of focus are:
(A) Battery Life: Most drones have a charge time of 50–120 min but can only stay in the air only for 15–30 min [2]. The flight time reduces even further if there is other equipment such as cameras, GPS, etc. Therefore, any incremental gain in battery life will translate to longer flight time.
(B) Gust Sensing and Response: Due to the small scale and low altitude flight, drones are highly susceptible to gust created by buildings, atmospheric boundary layer, thermal inversions and clear air turbulence (CAT). Without electronics, the drones are inherently unstable due to a low moment of inertia and high wind sensitivity [3]. Therefore, technology needs to be developed to sense the changes in the drone’s flight path, changes in wind speed and wing performance.
(C) Maneuverability: Depending on the type of drone (fixed wing or rotary), the maneuverability of the aircraft varies. Fixed wing drones use conventional control surfaces (ailerons, rudders and elevators) to maneuver, whereas rotary drones can maneuver by changing the thrust from each rotor. As such, rotary drones are more agile than fixed wing, but fixed wing drones can fly the farthest since most of the lifting work is done by the wings and not by the rotors. Therefore, a non-conventional distributed control system is needed to increase the maneuverability of fixed wing drones.
This research is an endeavor to address the listed shortcomings of the drones by exploring the use of piezo embedded Polyvinylidene Difluoride (PVDF) in the wing wake. Since PVDFs are smart materials, they produce capacitance when deformed but can also be intentionally actuated by applying voltage difference. The latter capability of the PVDF allows it to act as a potential control surface. However, the possibility of using PVDF for maneuvering is beyond the scope of this manuscript. The results presented in this paper will only focus on using the piezo-embedded PVDF for energy harvesting and gust sensing purposes.

1.1. Wing Wake

When flow from the upper surface meets the flow from the lower surface at the trailing edge, the resultant shear causes the air to roll up, creating vortices which shed at a given frequency. The vortex shedding frequency in the wake is known to vary with the Reynolds number (Figure 2) [4]. Therefore, with different flight speed and conditions, the wake signature changes for the same airfoil. Figure 2a,b shows prominent turbulent wake vortex shedding due to the separated upper surface shear layer. Experiments documented in [5,6] on NACA 0012 airfoil indicate that the vortex shedding is only observed at lower Reynolds numbers where boundary layer separation occurs without reattachment. Yarusevych et al. [4] amended this result and proved through hot-wire measurements that vortex shedding occurs even after the boundary layer attaches to the surface at a higher Reynolds number as shown in Figure 2c and that the vortex shedding frequency varies linearly with the Reynolds number.
The vortex shedding is also a function of trailing edge geometry. Guan et al. [7] experimented with multiple beveled trailing edge geometries and showed that even subtle changes in geometry can result in substantial changes in wake signatures. The vortex shedding is greater at the sharp trailing edge when compared to the smooth trailing edges. Even the smooth trailing edge was seen to have certain vortex shedding frequency found through two-point correlation of streamwise velocity components, which complements the results from [4]. Since the vortex shedding from wings is a function of a multitude of variables such as angle of attack, Reynolds number, trailing edge geometry, airfoils, etc., any changes in the wing performance and wing aerodynamics will present itself as changes in the wing wake and therefore can be detected. It is the unique and sensitive nature of the wake behind the wing that allows the potential for sensing and energy harvesting.

1.2. Flexible Smart Materials

Historically, smart materials have been used to harvest energy in a variety of applications. Allen and Smits [8] studied the feasibility of placing a piezoelectric membrane or eel in the wake of a flat plate at 90 deg angle of attack and using the Von Karman vortex street forming behind the bluff body to induce oscillations in the membrane (Figure 3). The oscillations result in a capacitive build up in the membrane that provides a voltage source that can be used for various purposes. The membrane is shown to have oscillated in the same frequency as the undisturbed vortex shedding in the wake.
A similar relationship between the vortex shedding frequency and the frequency of oscillations was observed in [9]. This dependency is a function of the Reynolds number based on the inflow velocity U , cylinder size, the geometric (cantilever length L and thickness t), material (structure density) and structural (Young’s modulus E, Poisson’s ratio ν ) properties. Based on these properties, the cantilevered membrane may develop complex vibration modes. Researchers who have also performed an LES study on the fluid—structure interaction of a thin membrane in the wake of a square cylinder were able to model the first mode of oscillations (closer to the natural frequency of the membrane) and the second mode of oscillation (kinematics resembling a traveling wave with a stagnation point) [9]. The differences in the input properties that contributed to the different modes of oscillations are highlighted in Figure 4. The 2nd oscillation mode was achieved by increasing the density of the membrane by a factor of 10 with minor changes in Young’s modulus, U and Reynolds number. Therefore, it is possible to tune the membrane to obtain oscillating conditions which are effective for energy production.
Similar to the studies above, there are a number of research papers where a flexible material is used to determine the interaction between the vortex shedding and the oscillations in the wake of a bluff body in order to harvest energy. The large vortex shedding behind bluff bodies provides large amplitude oscillations, which results in higher capacitance buildup in the material. Streamline bodies such as wings with lower thickness do not experience large vortex shedding as significant as that of bluff bodies at lower angles of attack. Therefore, more often than not, flexible material or smart materials are used to reduce drag [10] on a cylinder by 30% with a membrane length to chord (L/c) ratio of 1.2, [11], enhance lift [12,13,14,15] and suppress flutter [16] in a streamlined body and not particularly for energy harvesting purposes. Because of the lower vortex shedding magnitude, flexible extended trailing edges like the one shown in Figure 4 might not be effective in harvesting energy from the wake of a streamlined body. Therefore, the use of inverted flag configurations (free leading edge and fixed trailing edge) is explored as a potential option to harvest energy from the wake of a streamlined body. Recently, the inverted flag configuration has captured a lot of attention as an energy harvesting device. Depicted in Figure 5 [17], the oscillations of the inverted flag are a direct function of flow instabilities (destabilizing parameter) and the non-dimensional structural stiffness ( β ) (stabilizing parameter) [18]. The non-dimensional bending stiffness is determined by
β = B ρ U 2 L 3 ,
where ρ is the density of the fluid, U is the freestream velocity, L is the length of the flag and B is the dimensional flexural rigidity of the flag which can be determined by
B = E t 3 12 ( 1 ν 2 ) ,
where E is the modulus of elasticity, t is the thickness of the membrane and ν is the Poisson’s ratio.
The inverted flag configurations have been tested over a range of Reynolds numbers from 200 to 100,000 using experimental and computational techniques. Some features of conventional flag flapping were found to be dependent on the Reynolds number [19]. Experiments done at Re ∼10,000 [18], at Re ∼ 100–1000 [20] and computations done in [21] at Re ∼ 90,000 show similar dynamical regimes, which indicates that some features were independent from the Reynolds number. This independence can be seen in the non-dimensional amplitude ( A / L ) (Figure 6a) where the amplitude in the range of 1.7–1.8 is insensitive to Reynolds number. It is not surprising that the frequency (Figure 6b) changes with the Reynolds number as the inverted flag changes from equilibrium mode ( β = 0.5) to flapping mode ( β < 0.4) with increase in Reynolds number. However, the dependence of three dimensional flow on oscillations of the inverted flag is an open question which warrants further investigation [17].
By exposing the inverted flag configuration to the wing wake which is highly unsteady, the changes in frequency and amplitude of the oscillations can be quantified in a pseudo three-dimensional unsteady flow field. The piezo embedded PVDF in the inverted flag configuration was placed in the wake of SD7003 and NACA0012 airfoil to determine its performance and sensitivity with different angles of attack and downstream distances. If the dynamics of PVDF are sensitive to angle of attack and downstream distance, it will provide evidence that it can be used as an energy harvester and as a sensor for detecting changes in the wake simultaneously.

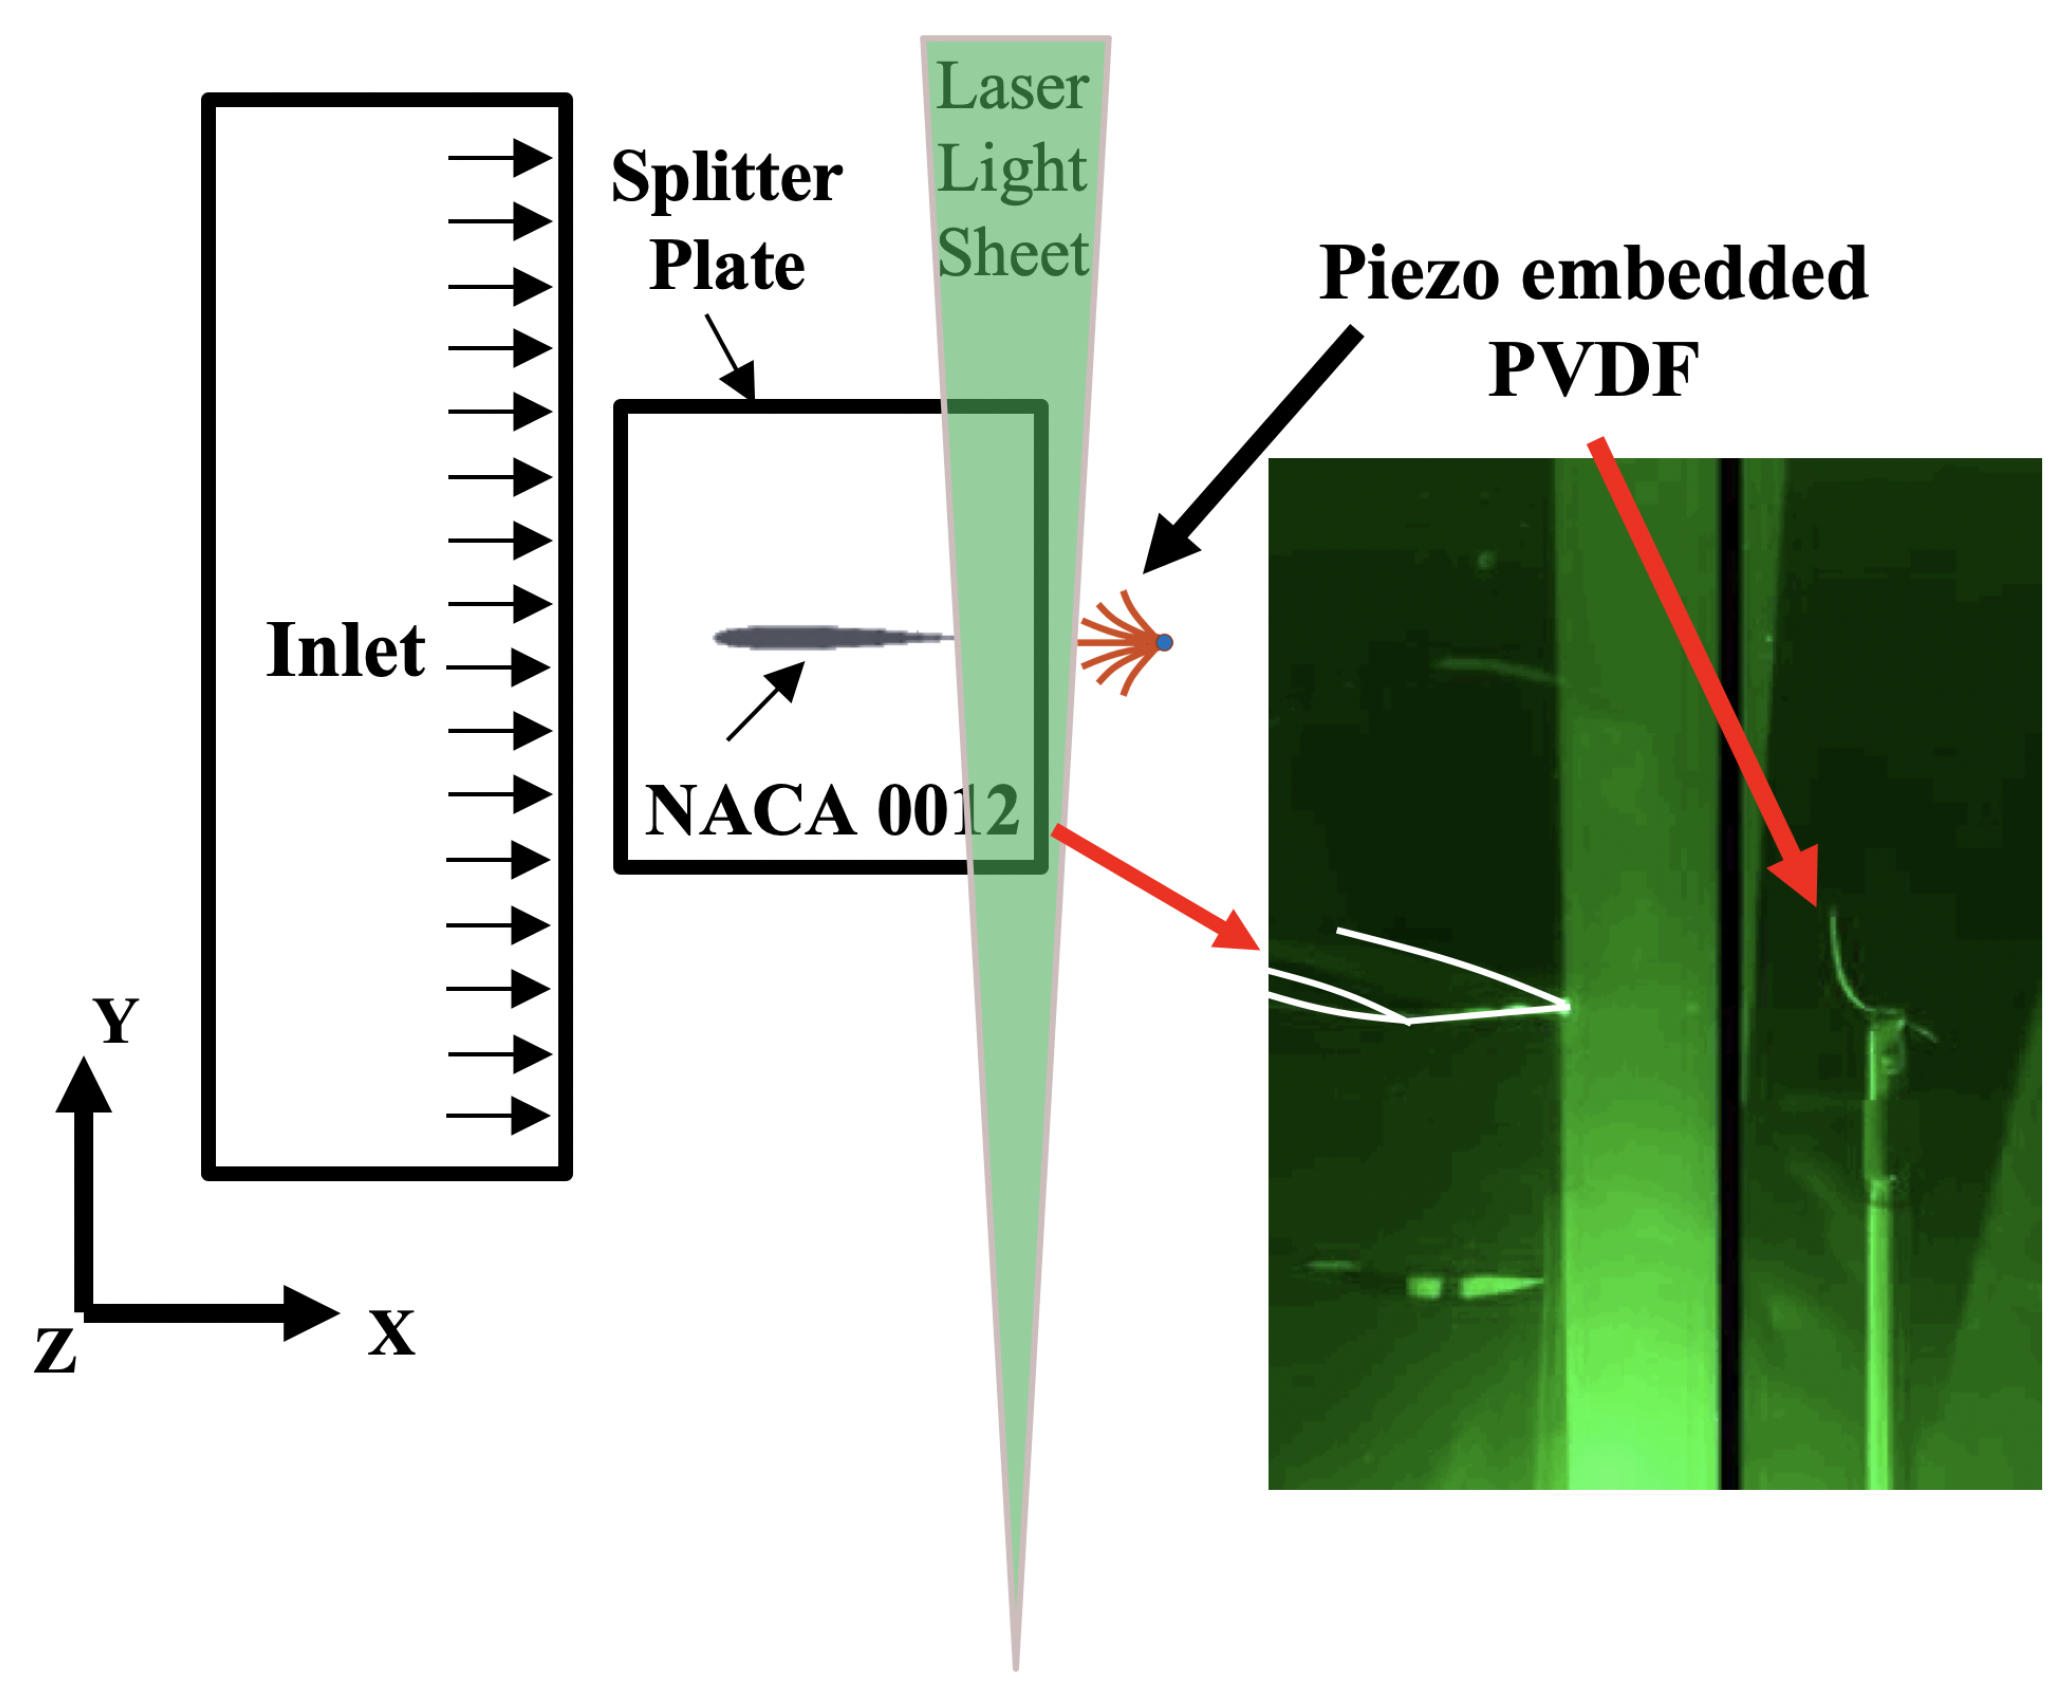
2. Experimental Setup

2.1. Wind Tunnel

All experiments mentioned in this paper were conducted at the University of Dayton Low Speed Wind Tunnel (UD-LSWT). The UD-LSWT has a 16:1 contraction ratio, six anti-turbulence screens and four interchangeable 76.2 cm × 76.2 cm × 243.8 cm (30” × 30” × 96”) test sections. A photo of the UD-LSWT test section is shown in Figure 7. The test section is convertible from a closed jet configuration to an open jet configuration with the freestream range of 6.7 m/s (20 ft/s) to 40 m/s (140 ft/s) at a freestream turbulence intensity below 0.1% measured by hot-wire anemometer. The tunnel also has the ability to vary the freestream velocity profile at up to 5 Hz and over 50% velocity amplitude using a downstream shuttering system.
All of the experiments mentioned in the paper were done in the open jet configuration where an inlet of 76.2 cm × 76.2 cm opens to a pressure sealed plenum. The effective length of the test section in the open jet configuration is 182 cm (72”). A 137 cm × 137 cm (44” × 44”) collector collects the expanded air on its return to the diffuser. The velocity variation for a given RPM of the wind tunnel fan is found using a Pitot tube connected to an Omega differential pressure transducer (Range: 0–6.9 kPa).

2.2. Wing Models

A 2D NACA 0012 model with a chord length of 10.16 cm (4”) was designed in SolidWorks (2017) and 3D printed Stratasys uPrint SE Plus printer (Eden Praire, MN, USA) at the University of Dayton. Since the test section has no side walls, the wing was designed to span across the test section width to simulate 2D configuration. This configuration is expressed as wall-to-wall model throughout the paper. The 3D printed wings were carefully sanded using a 300-girt sand paper to reduce the surface roughness. A similar method was used to design and print a SD7003 wall-to-wall model with the chord length of 10.16 cm (4”). Interfaces were designed to allow the wing to change the angle of attack using Griffin motor rotary stage.

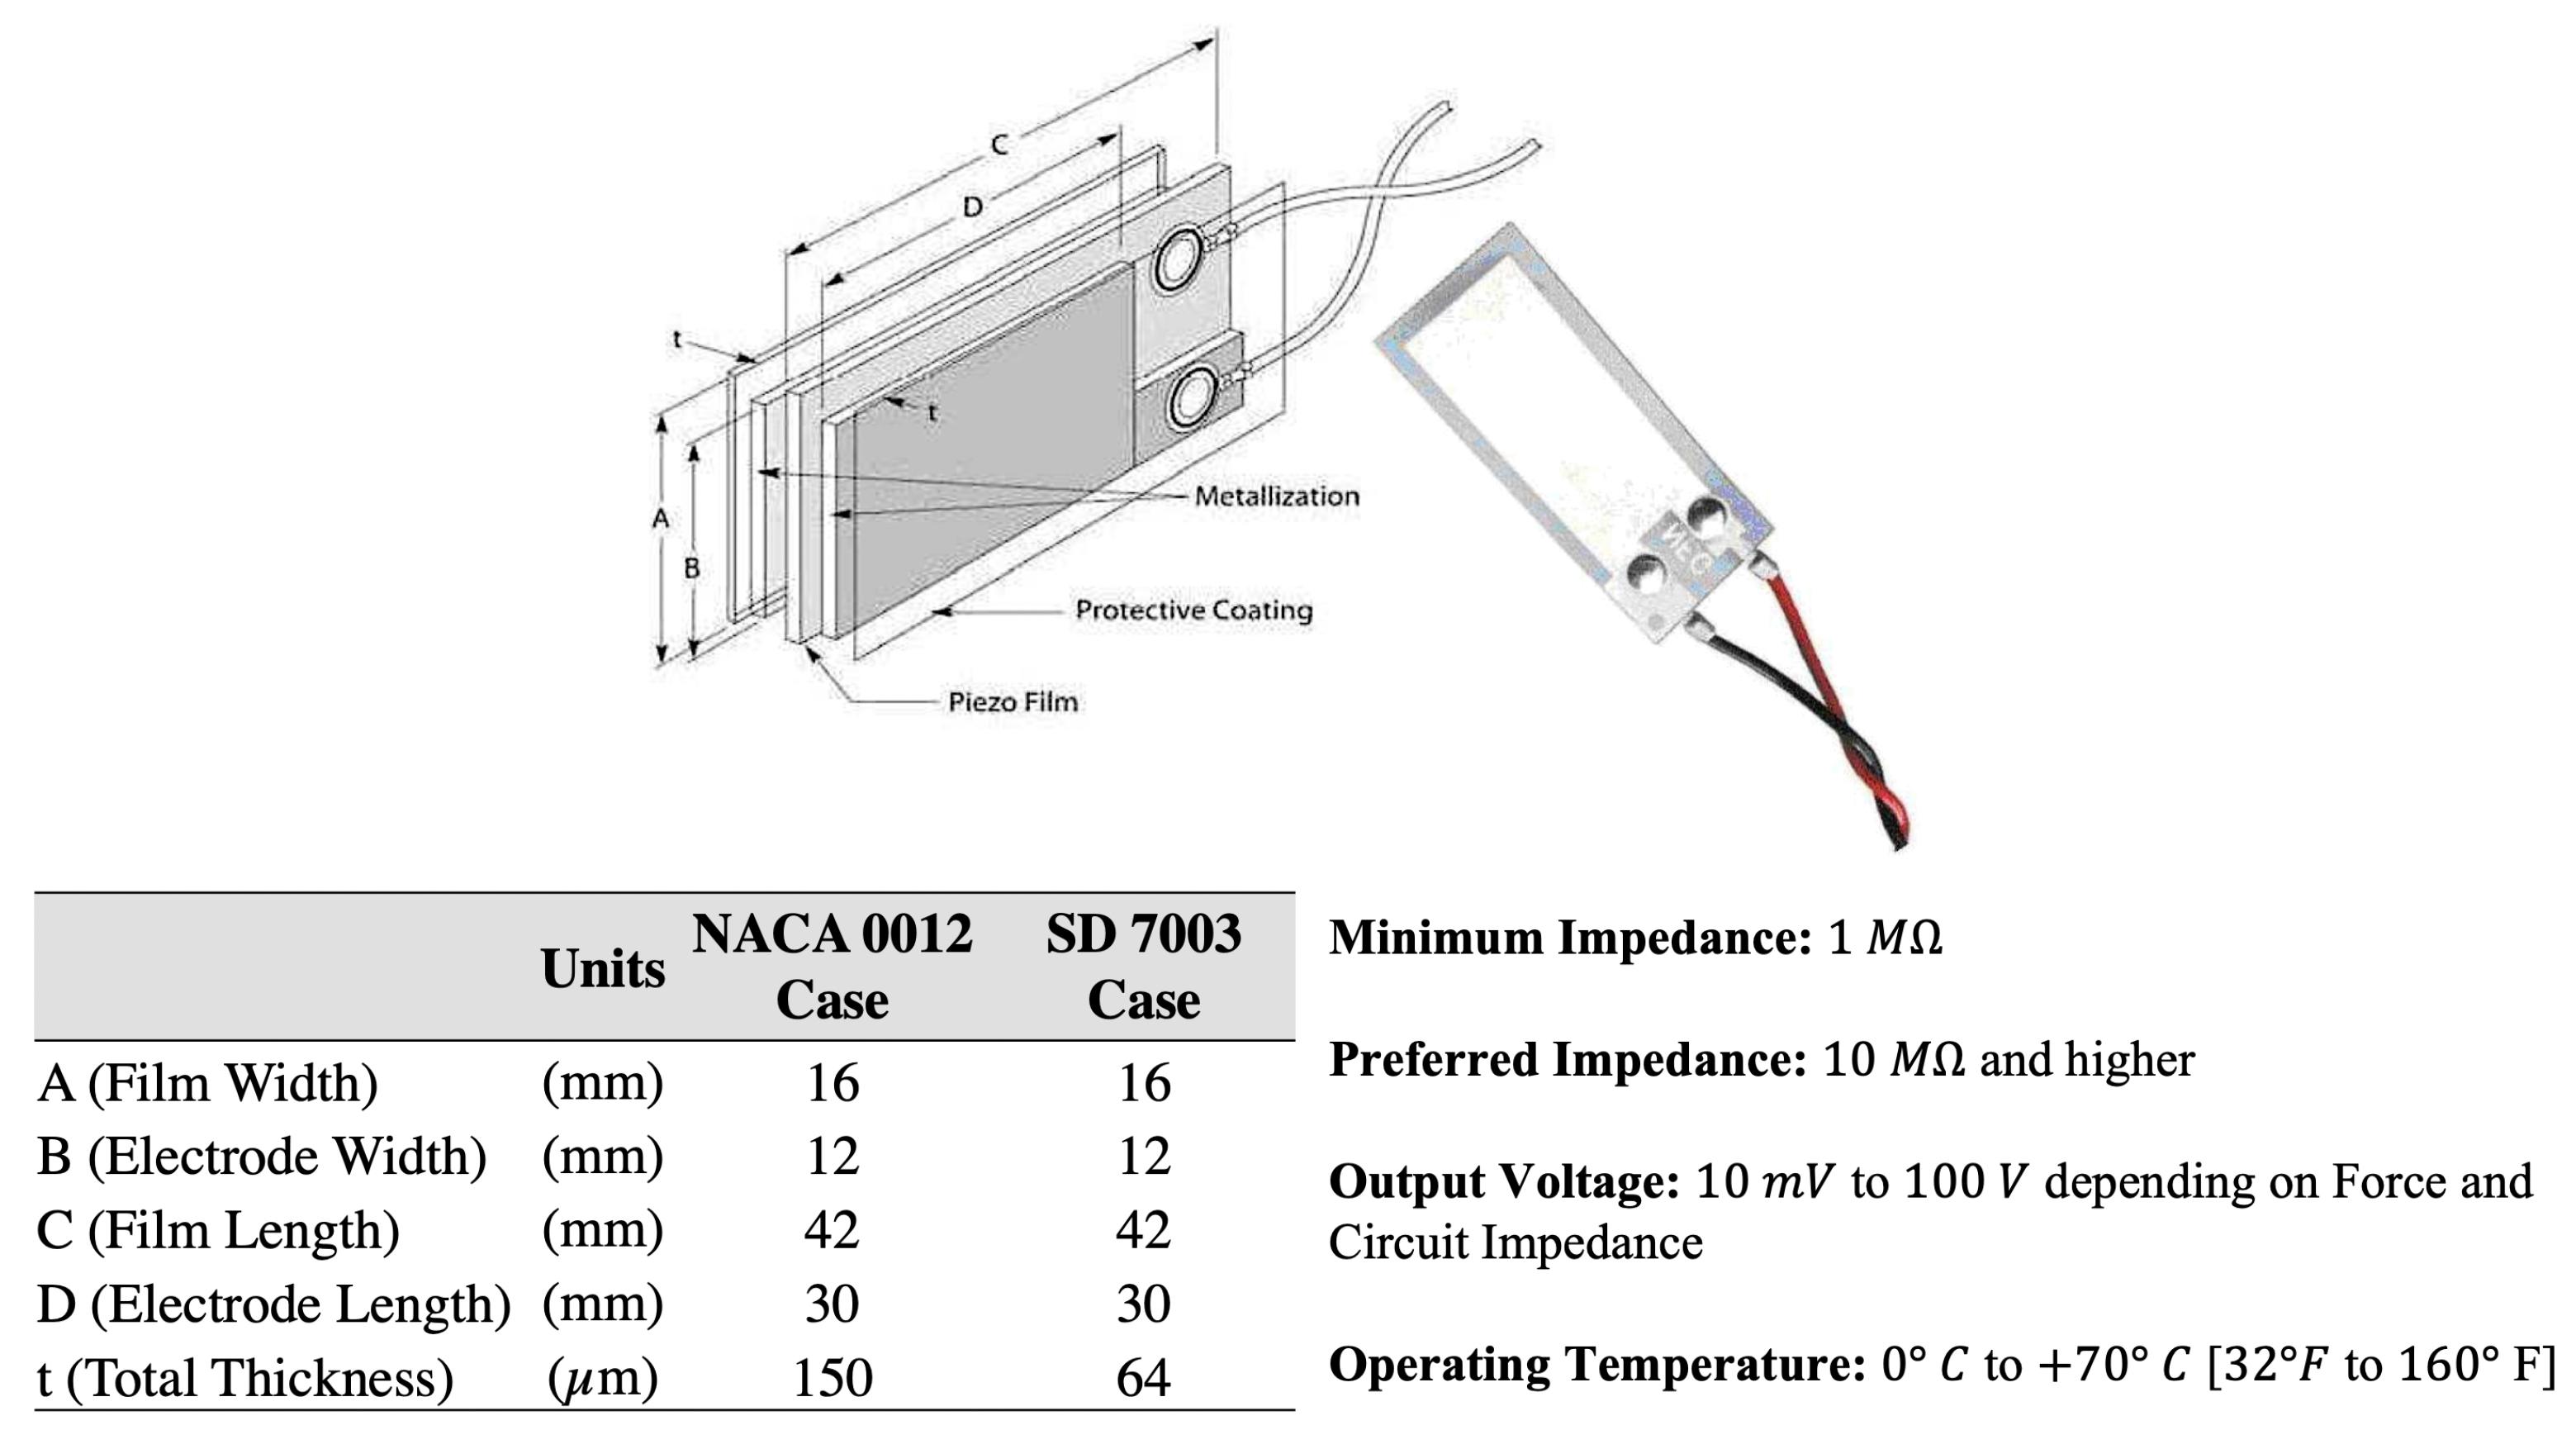
2.3. Piezo Embedded PVDF Material
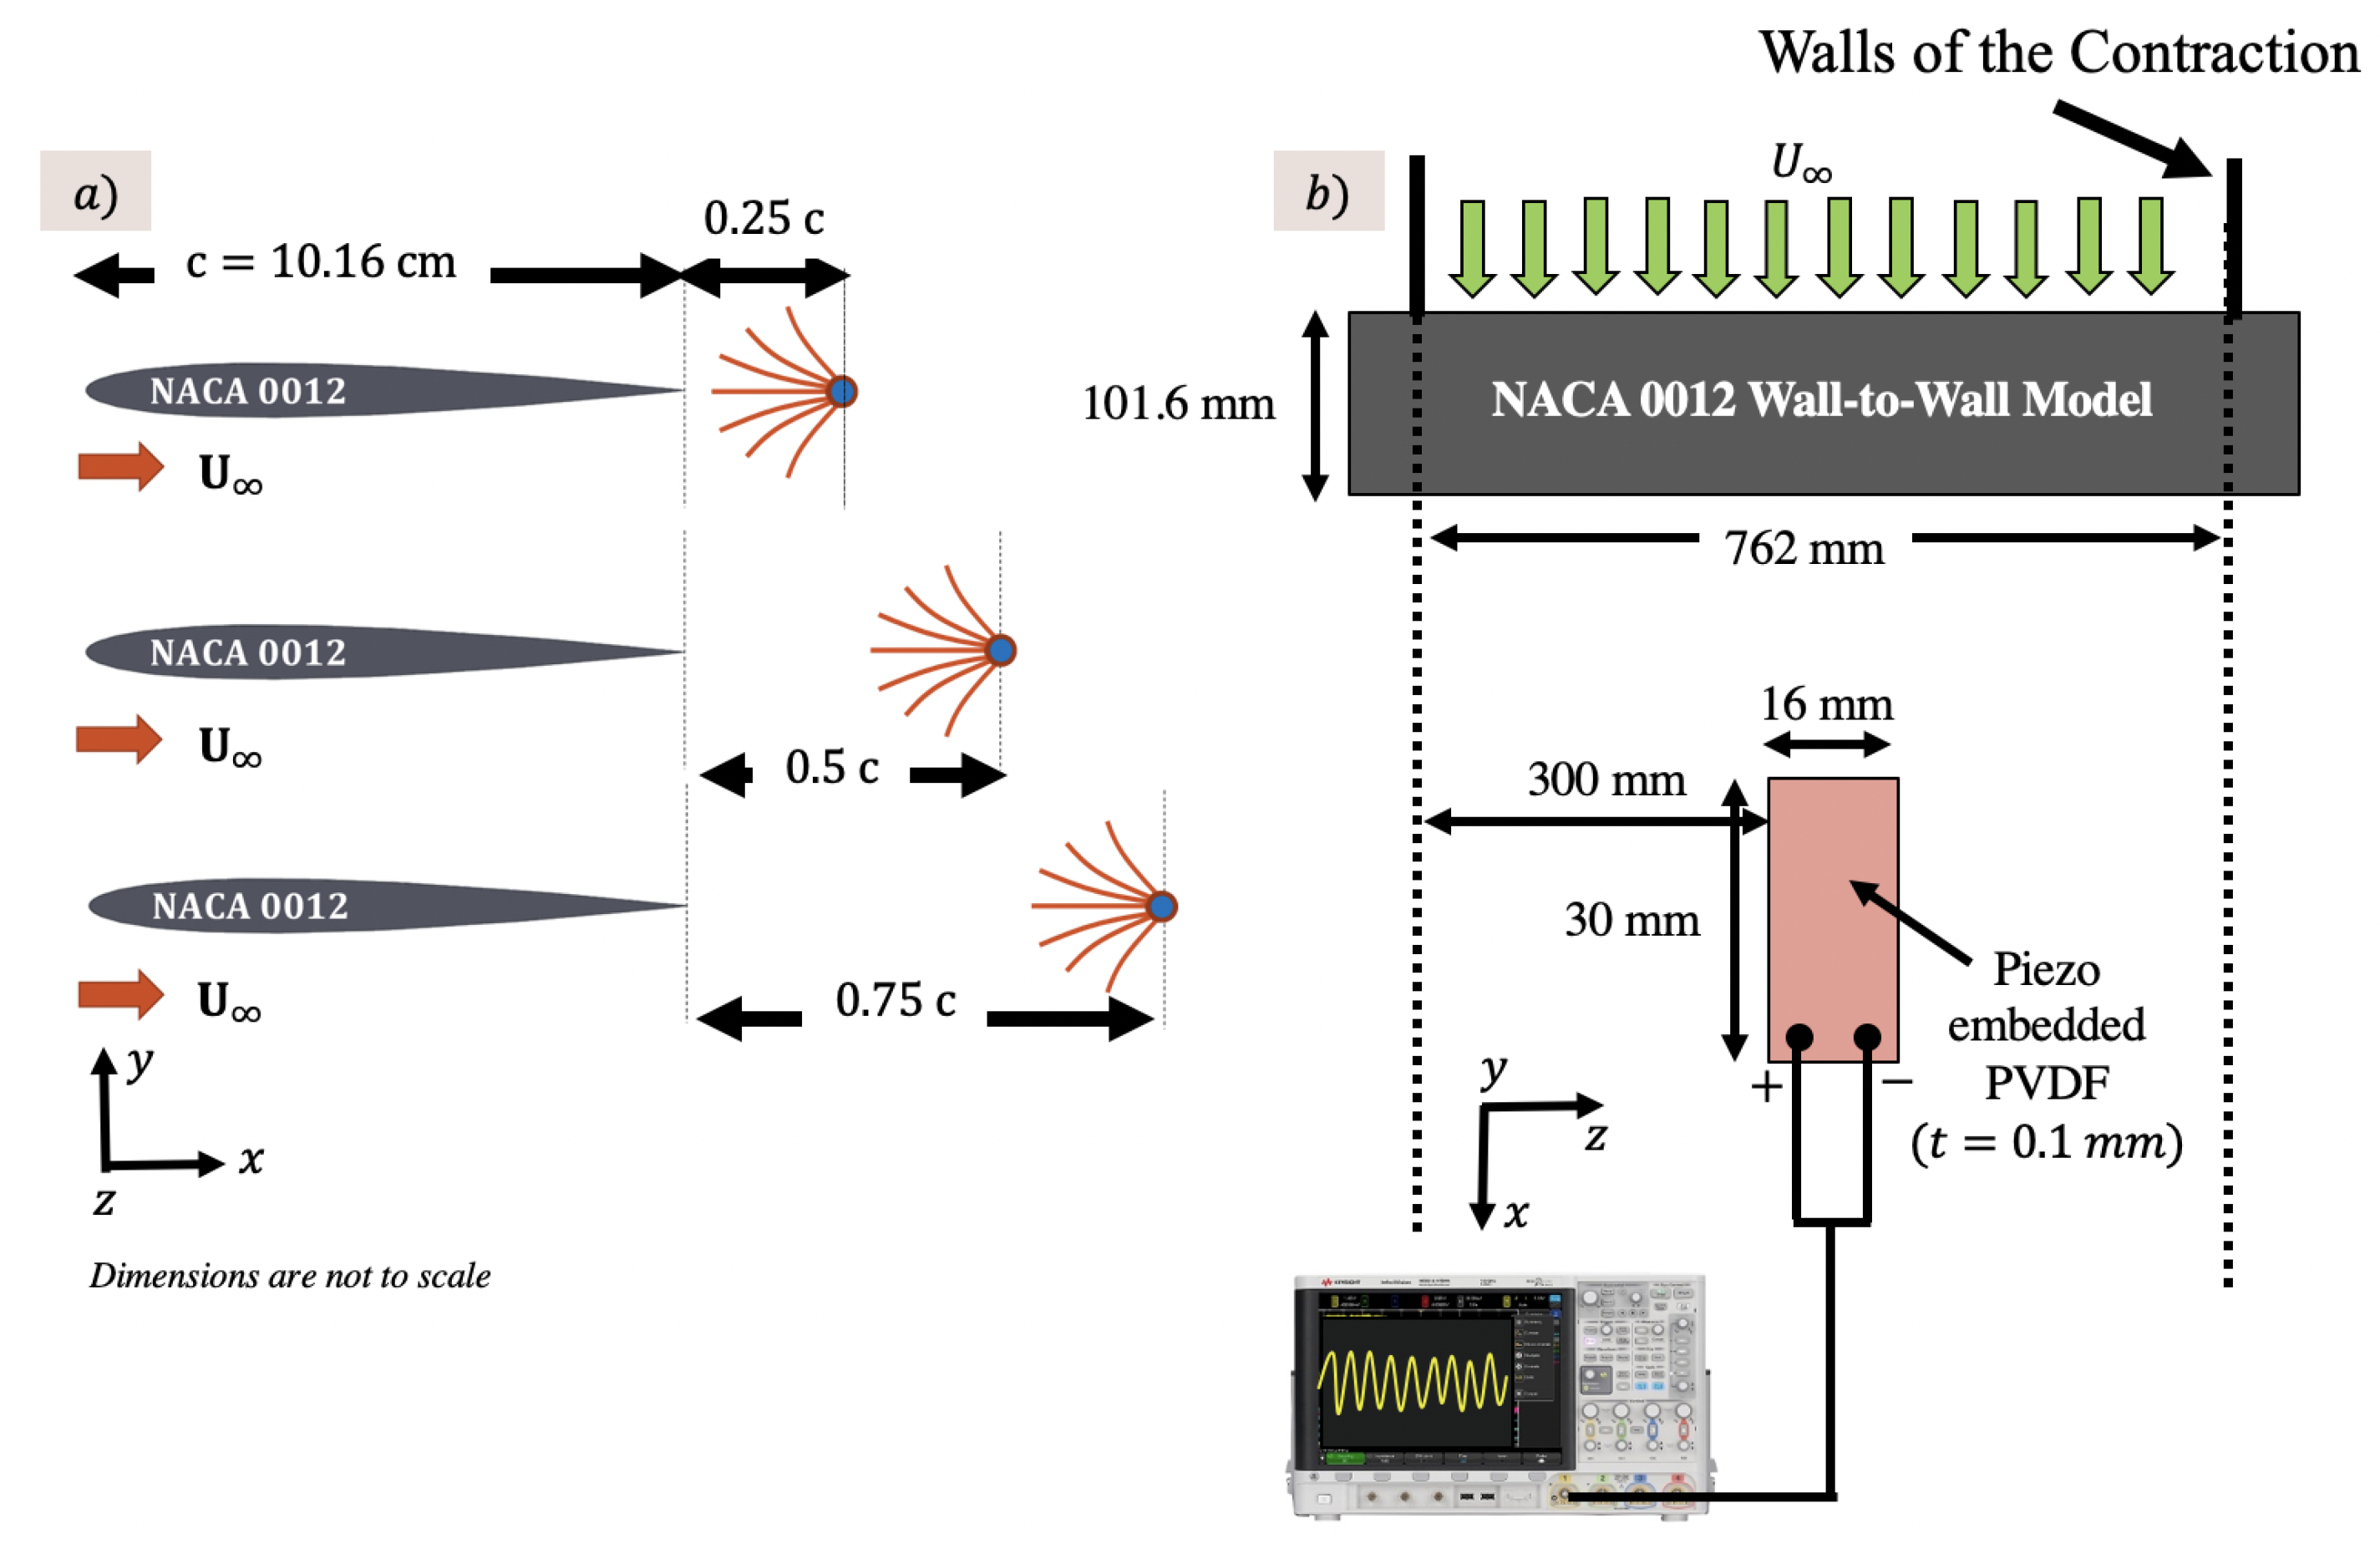
Off-the-shelf piezo embedded PVDFs manufactured by Measurement Specialties (Hampton, VA, USA) was acquired from Mouser electronics (www.mouser.com). These smart materials are intended to be used as vibration sensors to detect vibrations in a structure to which it is embedded. In this research, the sensor was used in an inverted flag configuration for extracting energy from the wake. The piezo embedded PVDF and its specifications are shown in Figure 8. For the NACA 0012 case, a piezo-embedded PVDF material with a film length of 42 mm and a thickness of 0.1 mm was used. However, for a SD7003 case, a thin PVDF film (64 μ m) was glued using a thin film of Epoxy resin on to a 0.3 mm polymer material (Polyethylene terephthalate (PET) polymer) and was placed in the wake. The intention of bonding piezo embedded PVDF to a polymer is to perform a sensitivity study on an inverted flag configuration as a function of membrane length and shape. However, a sensitivity study on the PVDF configurations are beyond the scope of the current manuscript. It should be noted that even though the PVDF material can generate higher voltage (10 mV to 100 V) upon actuation as shown in Figure 8, the amperage from the sensor is on the order of mA, which translates to very low power output. However, with multiple PVDFs in the wake, the power output could be amplified and stored in batteries.

2.4. Test Setup

A schematic of the test setup for NACA 0012 case is shown in Figure 9. The piezo embedded PVDF was placed at 0.25c, 0.5c and 0.75c downstream locations from the trailing edge of the model. The PVDF was then connected to an MSO-X 3012a oscilloscope (Allegaint Technologies, Overland Parks, KS, USA). The frequency and amplitude data were acquired at a sampling rate of 1000 Hz. The freestream velocity that rendered full amplitude oscillations were found to be 14.8 m/s.
Similar to NACA 0012, a piezo embedded PVDF-polymer combination was tested in the wake of SD7003 wall-to-wall model. It should be noted once again that, in this case, a 64 thick piezo embedded PVDF was attached to a thicker (0.3 mm) Polyethylene terephthalate (PET) polymer. The specifications and schematic of the PVDF-polymer setup is shown in Figure 10a along with the picture of the test setup in Figure 10b. The freestream velocity that rendered full amplitude oscillations of the PVDF-polymer combination was determined at 11.5 m/s. The comparison between the calculated velocity from non-dimensional stiffness and the velocity at which the full amplitude oscillations was achieved will be discussed in the results section.
In this case, the PVDF-polymer combination was placed at multiple measurement locations downstream of the trailing edge of the airfoil to determine the changes in amplitude and frequency due to spatial changes in the wing wake. Two axes of Aerolab traverse were used to move the PVDF-polymer combination on the x- and y-axes downstream of the trailing edge of the airfoil. As shown in Figure 11, the sensor oscillations and frequency were gathered at 56 measurement locations downstream of the wing. The PVDF was moved in the y-direction in increment of 0.125 x/c on both sides of the chord line, making the vertical traverse length of 0.75c. The PVDF was traversed along the x-direction in increment of 0.25 x/c until a maximum downstream distance of two chord lengths. Amplitude and frequency of the PVDF-polymer oscillations were obtained using MSO-X 3012a oscilloscope (Allegaint Technologies, Overland Parks, KS, USA) at a sampling rate of 1000 Hz. The amplitude of the oscillations was characterized by voltage output and not the physical amplitude of the sensor.

2.5. Particle Image Velocimetry (PIV) Setup

In order to determine the effect of piezo-embedded PVDF on the wake signature, Particle Image Velocimetry (PIV) was done in the wake of NACA 0012 with and without the presence of the PVDF. The results from PIV will also give insight into the relationship between the wake properties and the changes in the amplitude and frequency of the oscillations. The schematic of the PIV test setup is shown in Figure 12.
The PIV measurements were obtained using a smoke seeder (Concept Smoke Systems, Maindenhead, UK) with glycerin oil and a 200 mJ/pulse Nd:YAG frequency doubled laser (Quantel Twins CFR 300, Bozeman, MT, USA). A Cooke Corporation PCO 1600 camera (1600 × 1200 pixel array) with a 105 mm lens (Nikon) with an F2.8 aperture setting was used to capture the images. The dimensions of the field of view was 5.5 cm × 4.1 cm with a magnification factor of 0.21. This leads to the spatial resolution of 292 pix/cm in both axes. One plano-convex lens and one plano-concave lens were used in series to convert the laser beam into a sheet. The laser and the camera were triggered simultaneously through a Quantum composer pulse generator. In each test case, over 1000 image pairs were obtained and processed using Digital Particle Image Velocimetry (DPIV) software (Innovative Scientific Solutions, Dayton, OH, USA). A square interrogation window with two iterations, the first with 32 × 32 pixels and the second with 64 × 64 pixels, each with 50% overlap, was used in the post processing of the images.

2.6. Tensile Testing

In the case of smart material used in the wake of SD 7003 airfoil, since the piezo embedded PVDF was bonded with the Polyethylene terephthalate (PET) polymer, tensile testing was done in accordance with ASTM D638 on the polymer. Instron Tensile Testing machine (Load Frame number: 3365) with a 2 kN load cell was used to determine the modulus of elasticity since it plays a vital role in determining the non-dimensional bending stiffness as shown in Equation (1). The stress–strain graph of the polymer was determined along with the modulus of elasticity at 2% strain. Five different samples of the polymer were tested. The resultant modulus of elasticity of the polymer was determined to be 2.12 GPa ± 2%. It should also be noted that the modulus of elasticity of the PVDF used in the NACA 0012 case is 2 GPa as well.

3. Results

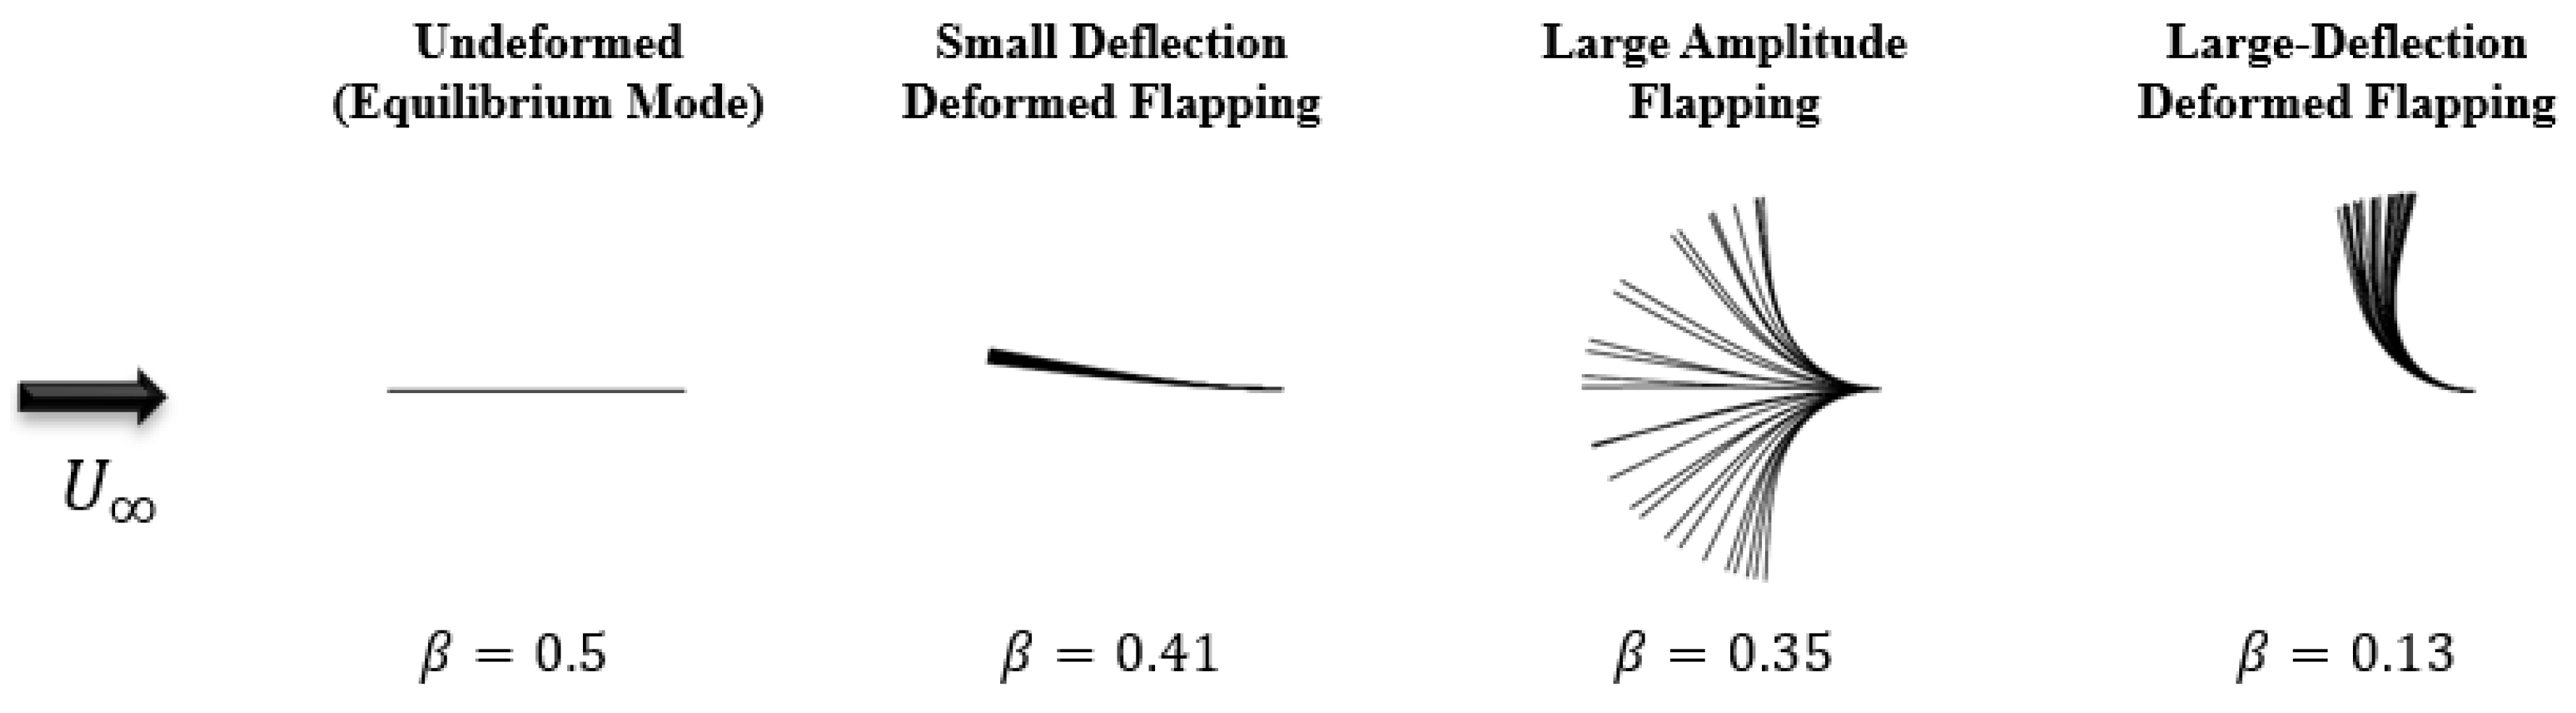
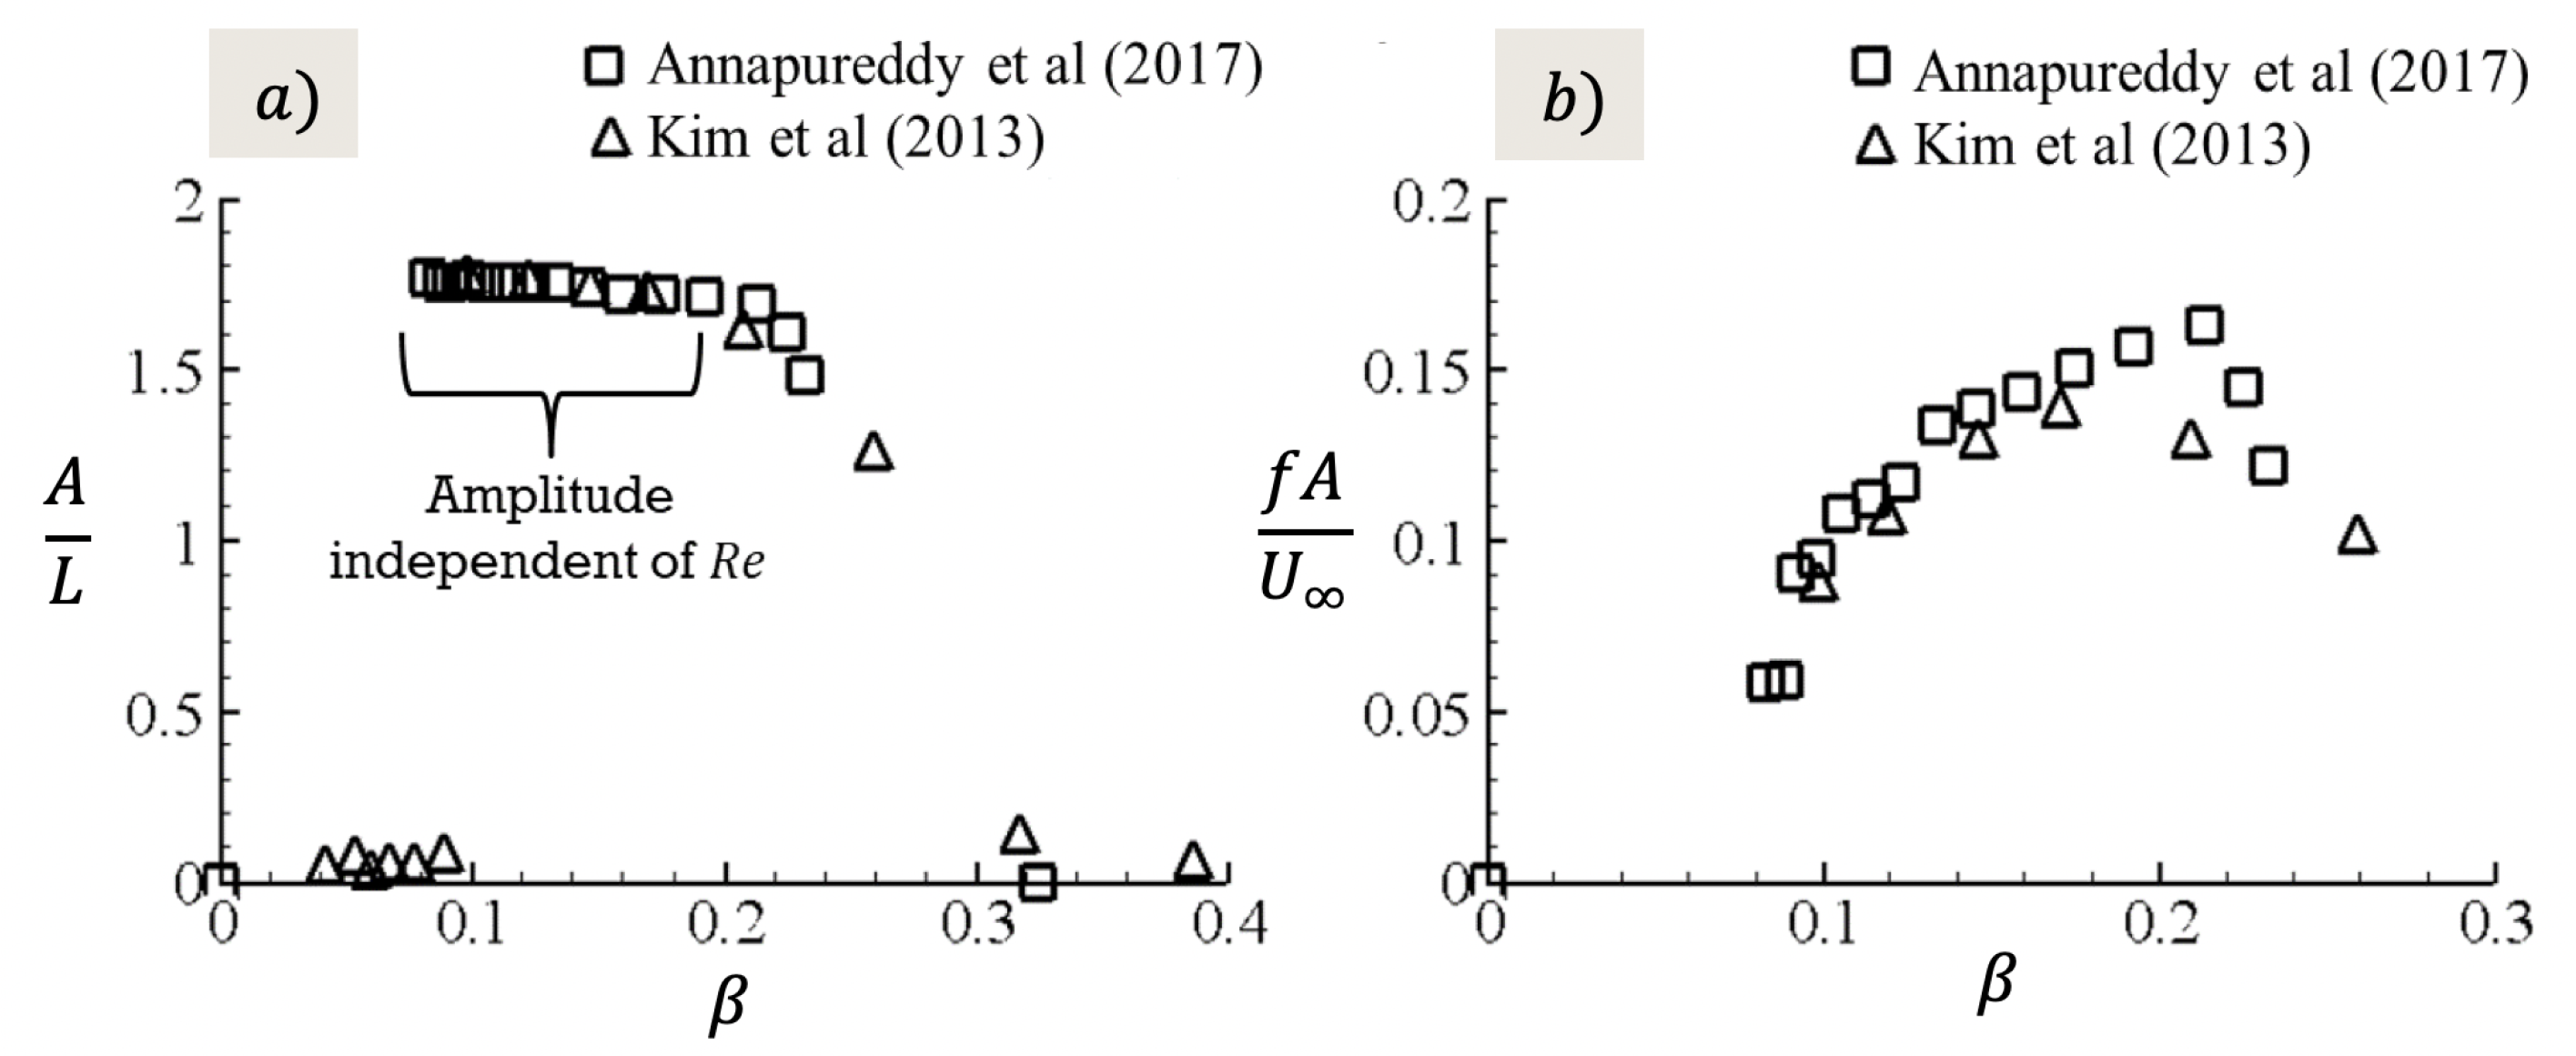
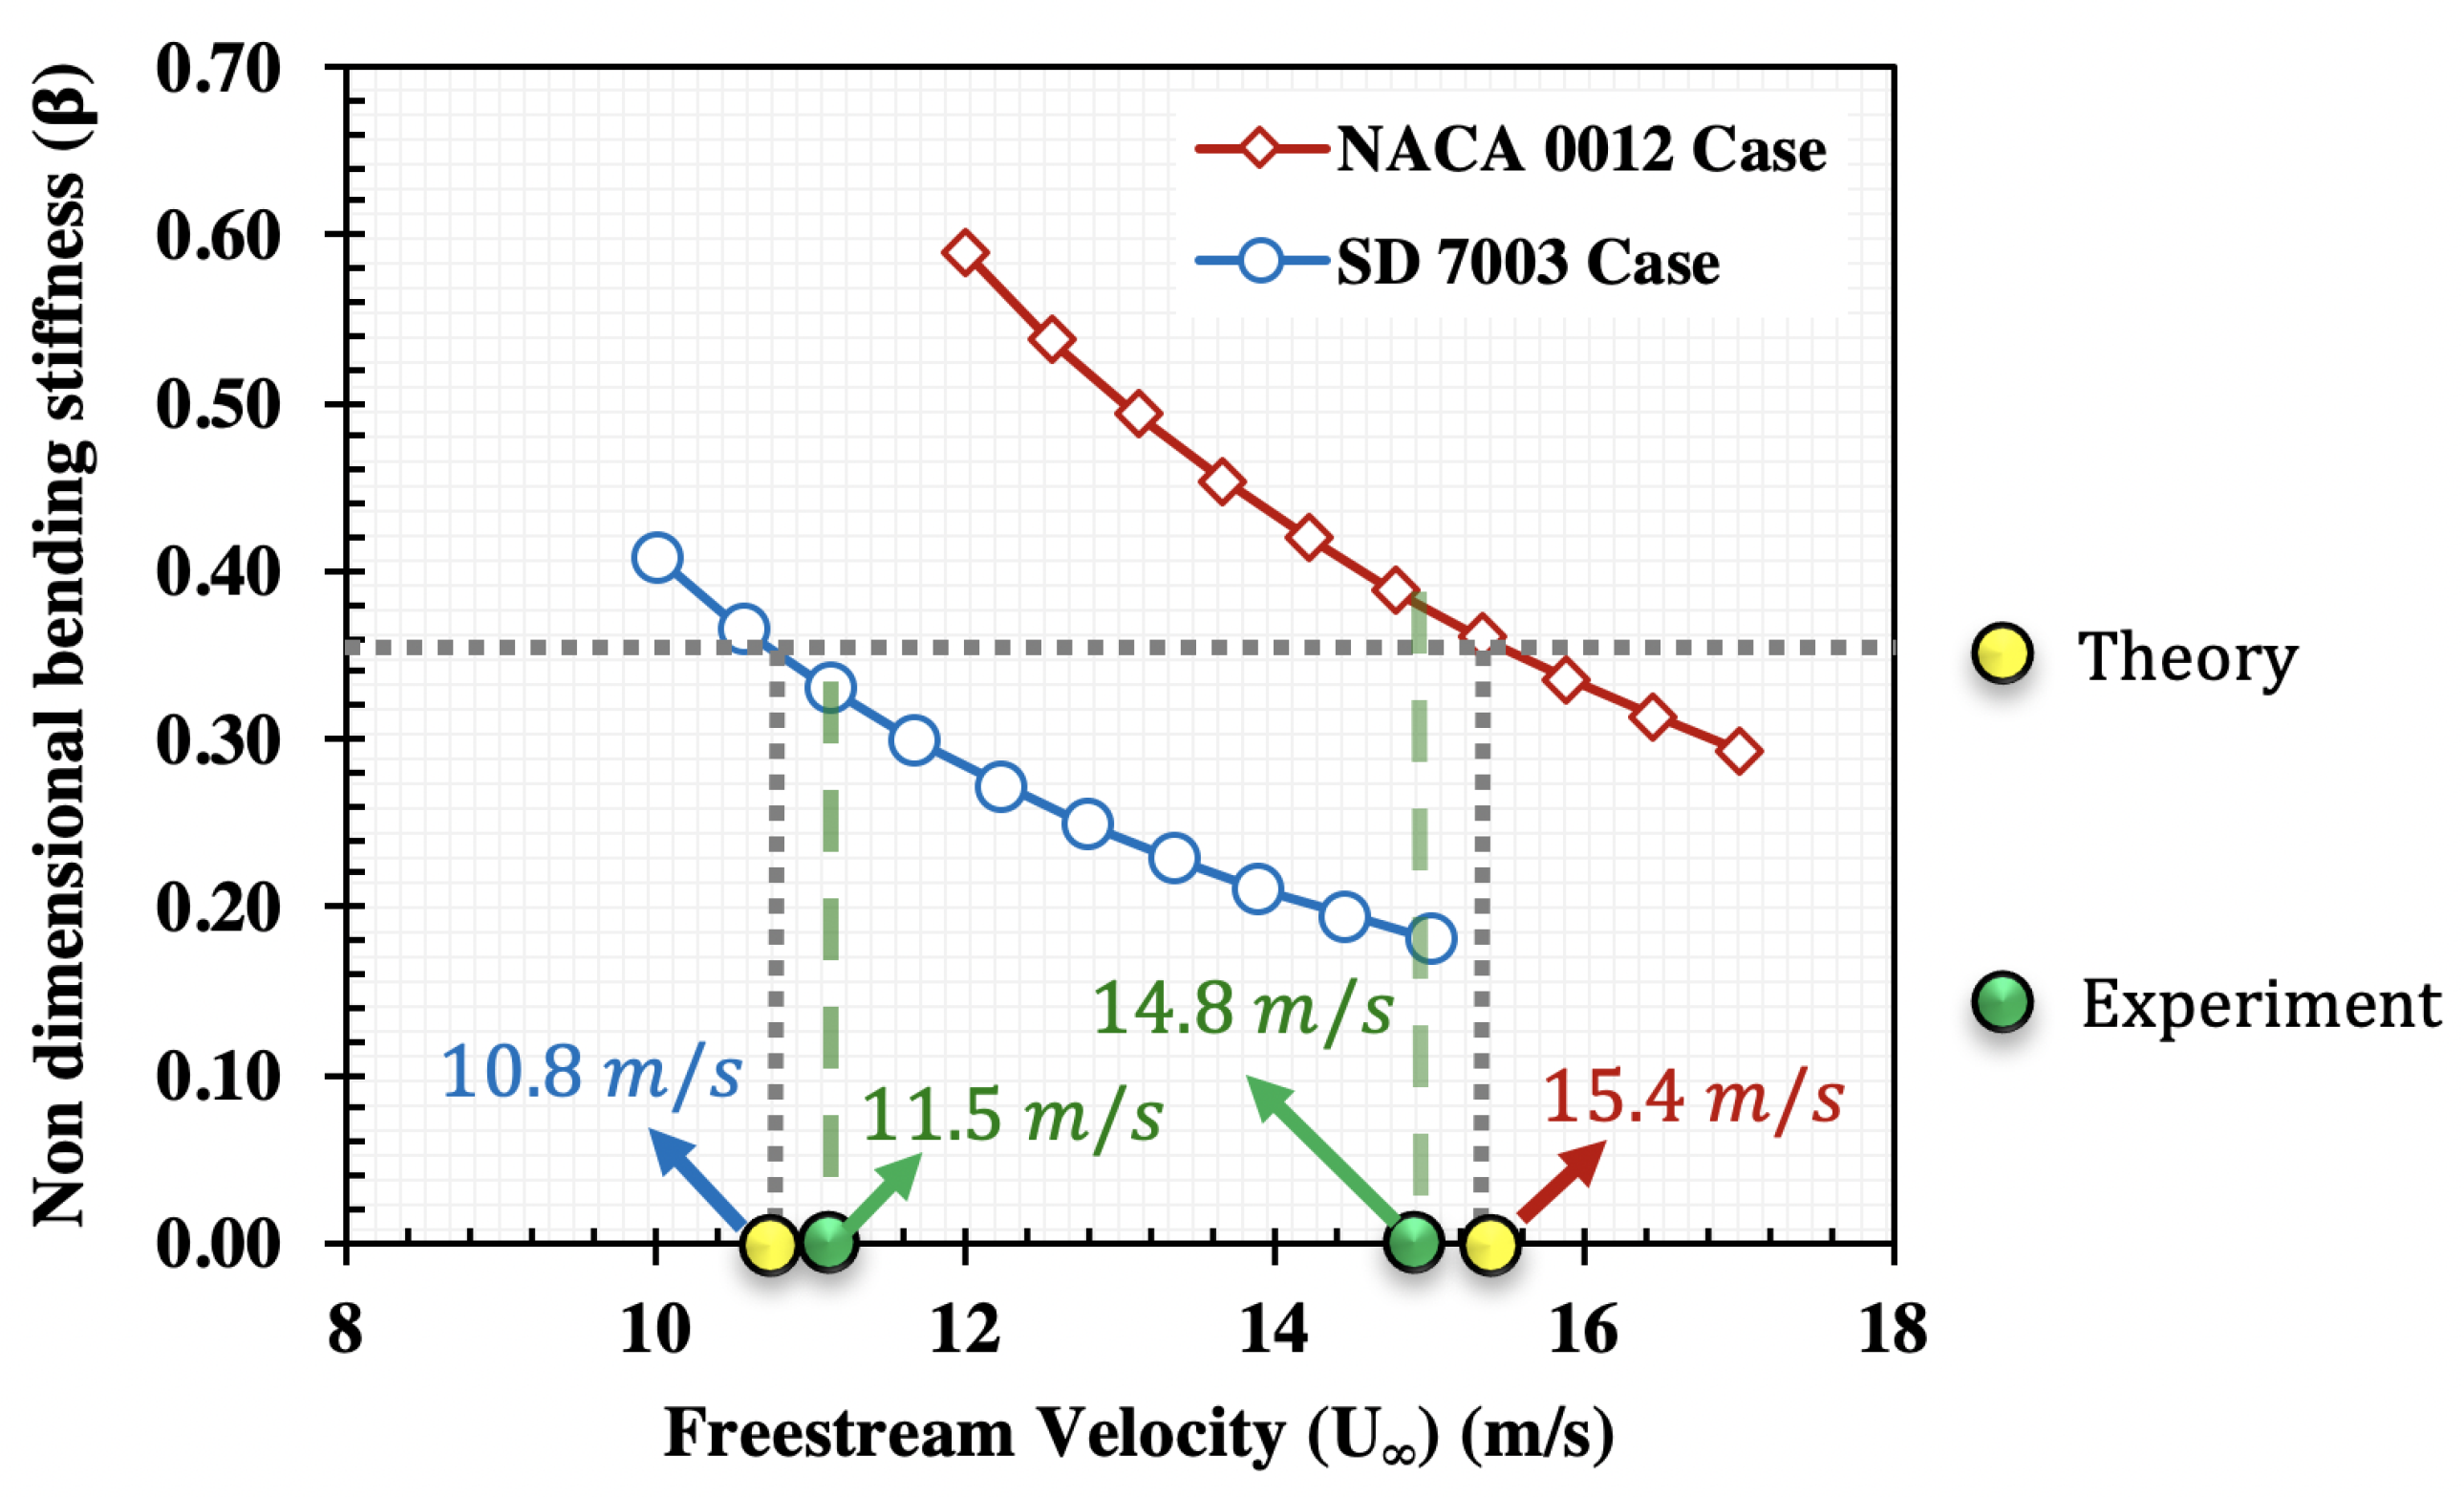
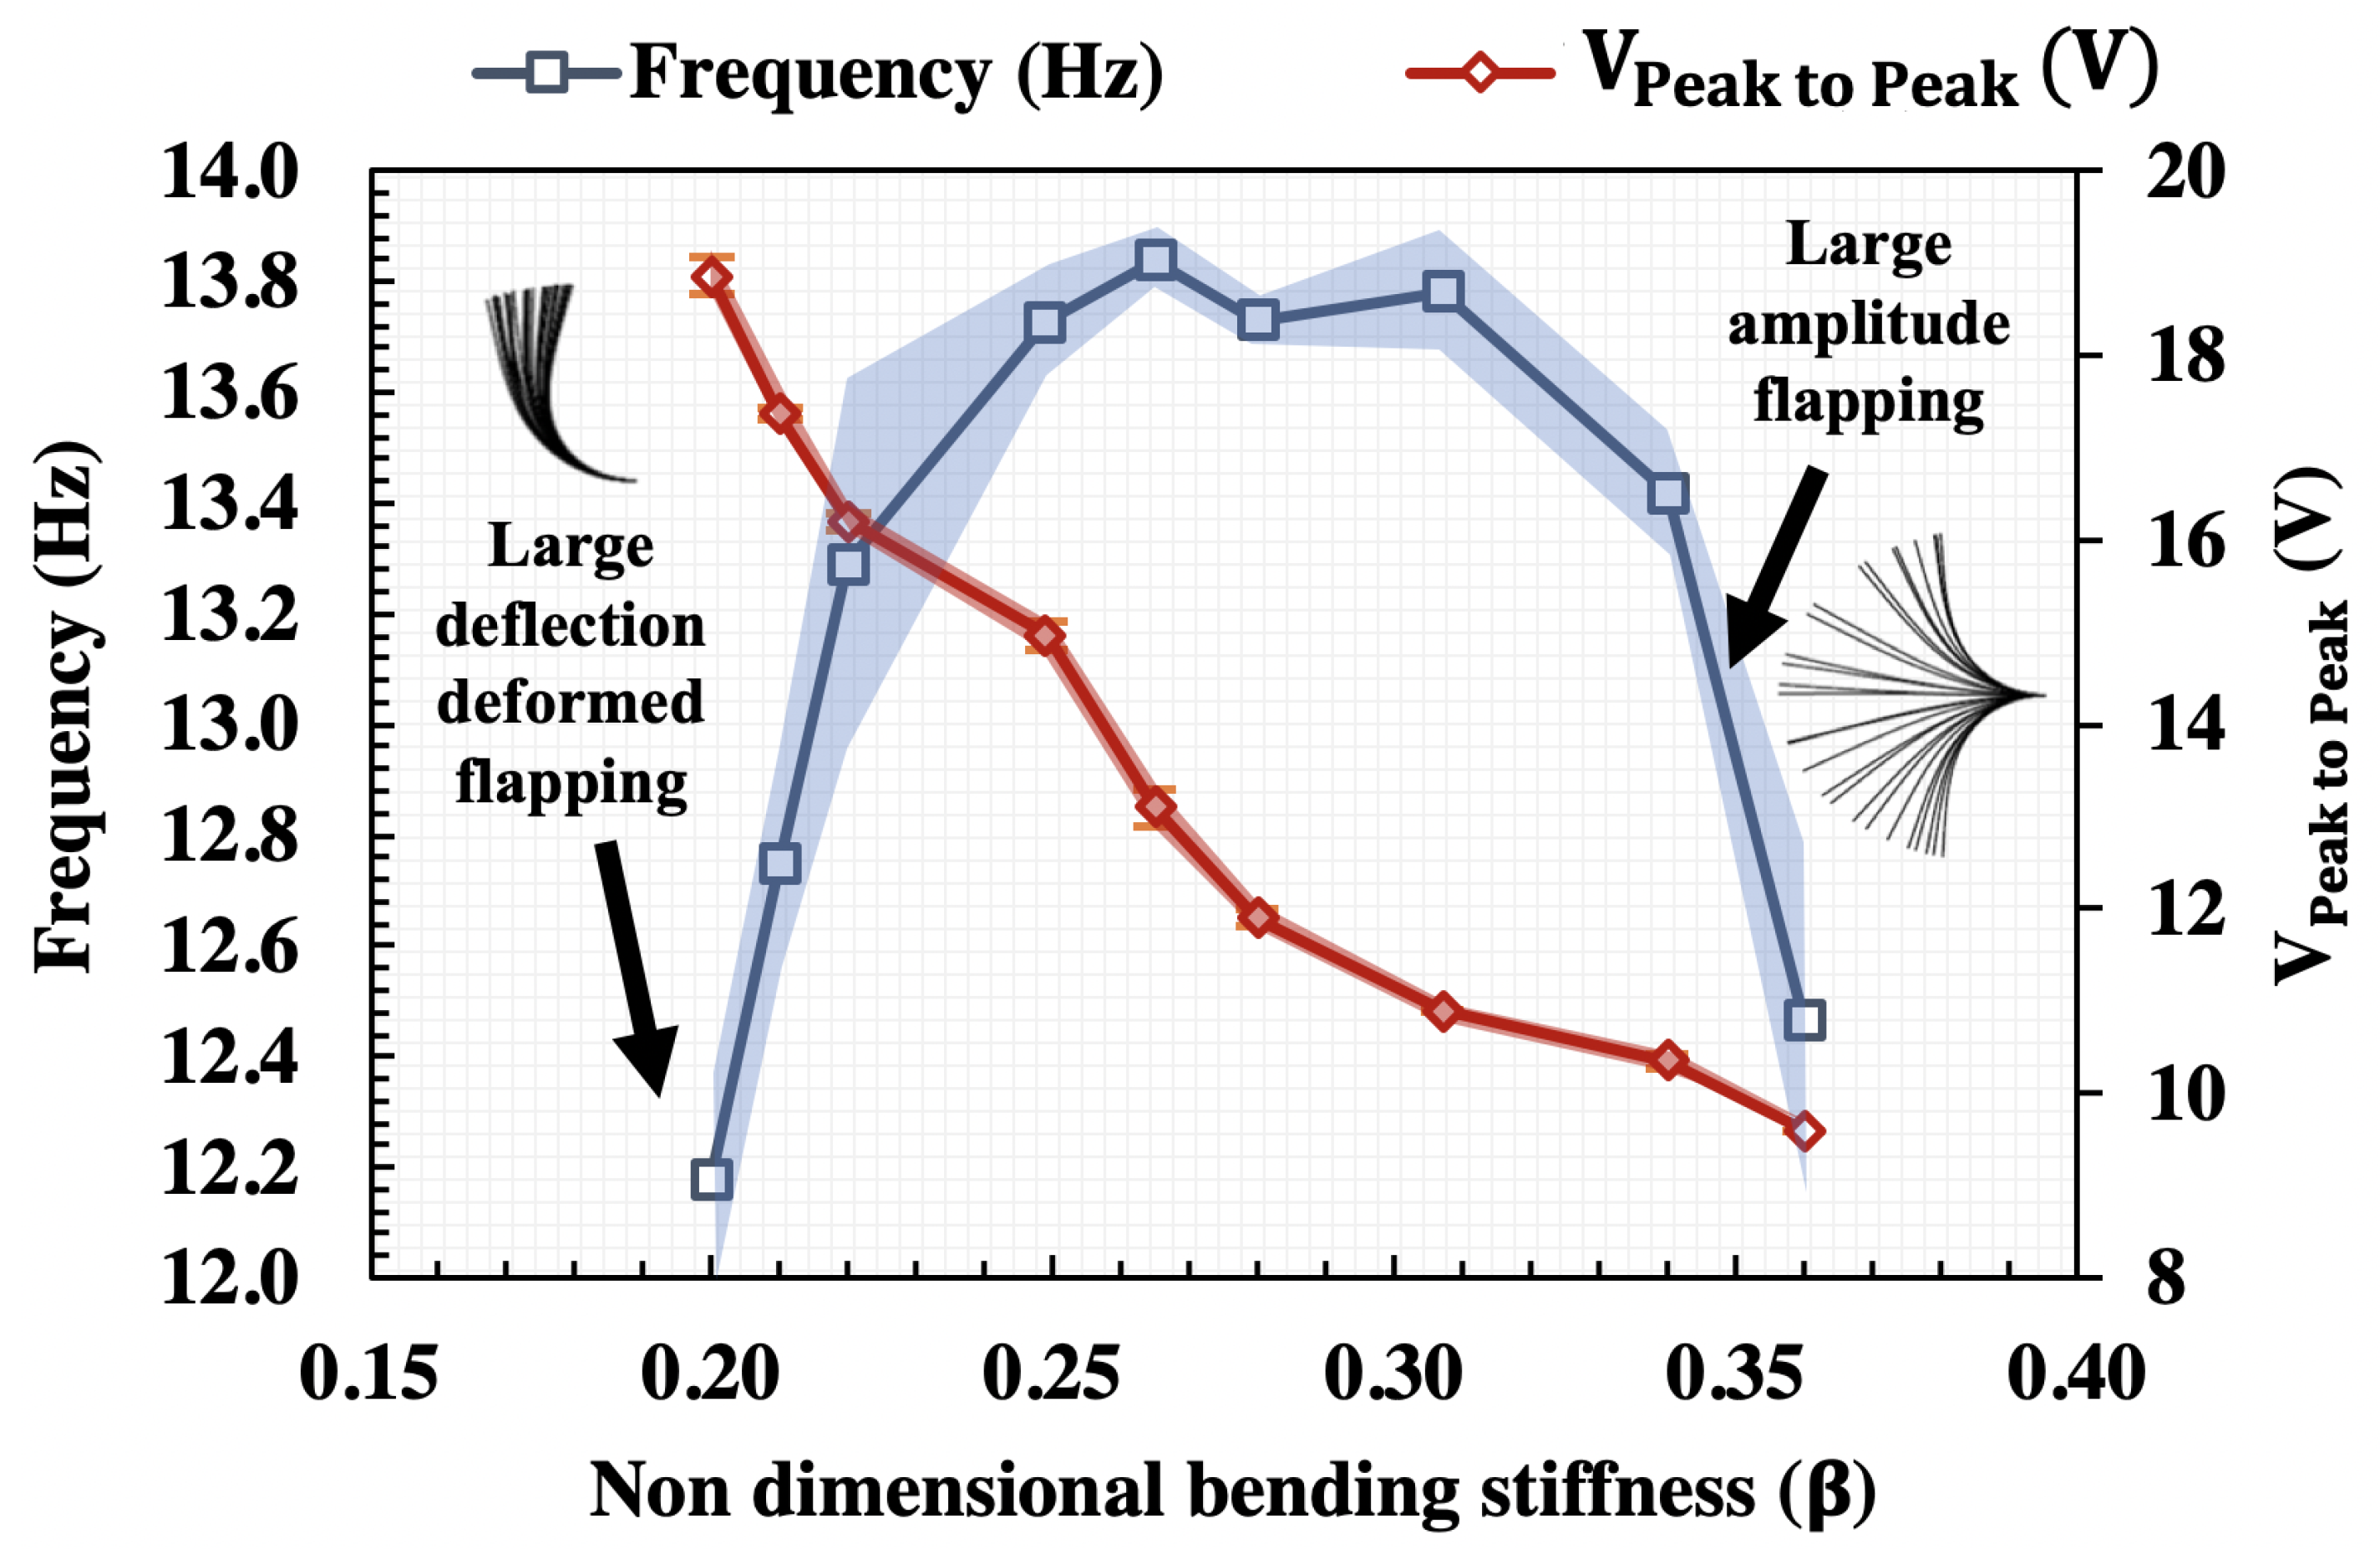
3.1. Non-Dimensional Bending Stiffness

Using the dimensions of the piezo embedded PVDF tested in the wake of the airfoils and the modulus of elasticity determined from tensile testing, the non-dimensional bending stiffness was quantified for both the PVDFs as a function of freestream velocity. The calculated values for the PVDFs used in NACA 0012 and SD 7003 cases are shown in Figure 13 as a function of freestream velocity. As the velocity increases, the non-dimensional bending stiffness decreases, which results in different dynamic modes of the inverted flag configuration as shown in Figure 5. Since the PVDF used in NACA 0012 case had a shorter length, the same values were achieved at higher freestream velocities when compared to the PVDF used in a SD7003 case. However, both PVDFs have similar trends, as can be seen in the figure. Theoretically, the threshold value of 0.35 where the inverted flag configuration experiences a large amplitude flapping mode was predicted at a freestream velocity of 10.8 m/s for the SD7003 case using Equation (1). The same condition was predicted at a velocity of 15.4 m/s for the NACA 0012 case.
Experimentally, however, the large amplitude flapping mode for the NACA 0012 case was observed at a freestream velocity of 14.8 m/s and, for the SD 7003 case, the large amplitude flapping mode was observed at a freestream velocity of 11.5 m/s. Since the wings were also placed in the same respective freestream velocity, the corresponding chord based Reynolds numbers are 100,000 for NACA 0012 airfoil and 67,000 for SD7003 airfoil. The uncertainty in the velocity measurements shown in Figure 13 is 0.1 m/s. The variation between the theoretical predictions and experimental data was 6% in the case of SD7003 and 4% in the case of NACA 0012. Given the complex aero-structure interactions and experimental intricacies, the agreement between theory and experiment within 4–6% was surprising.

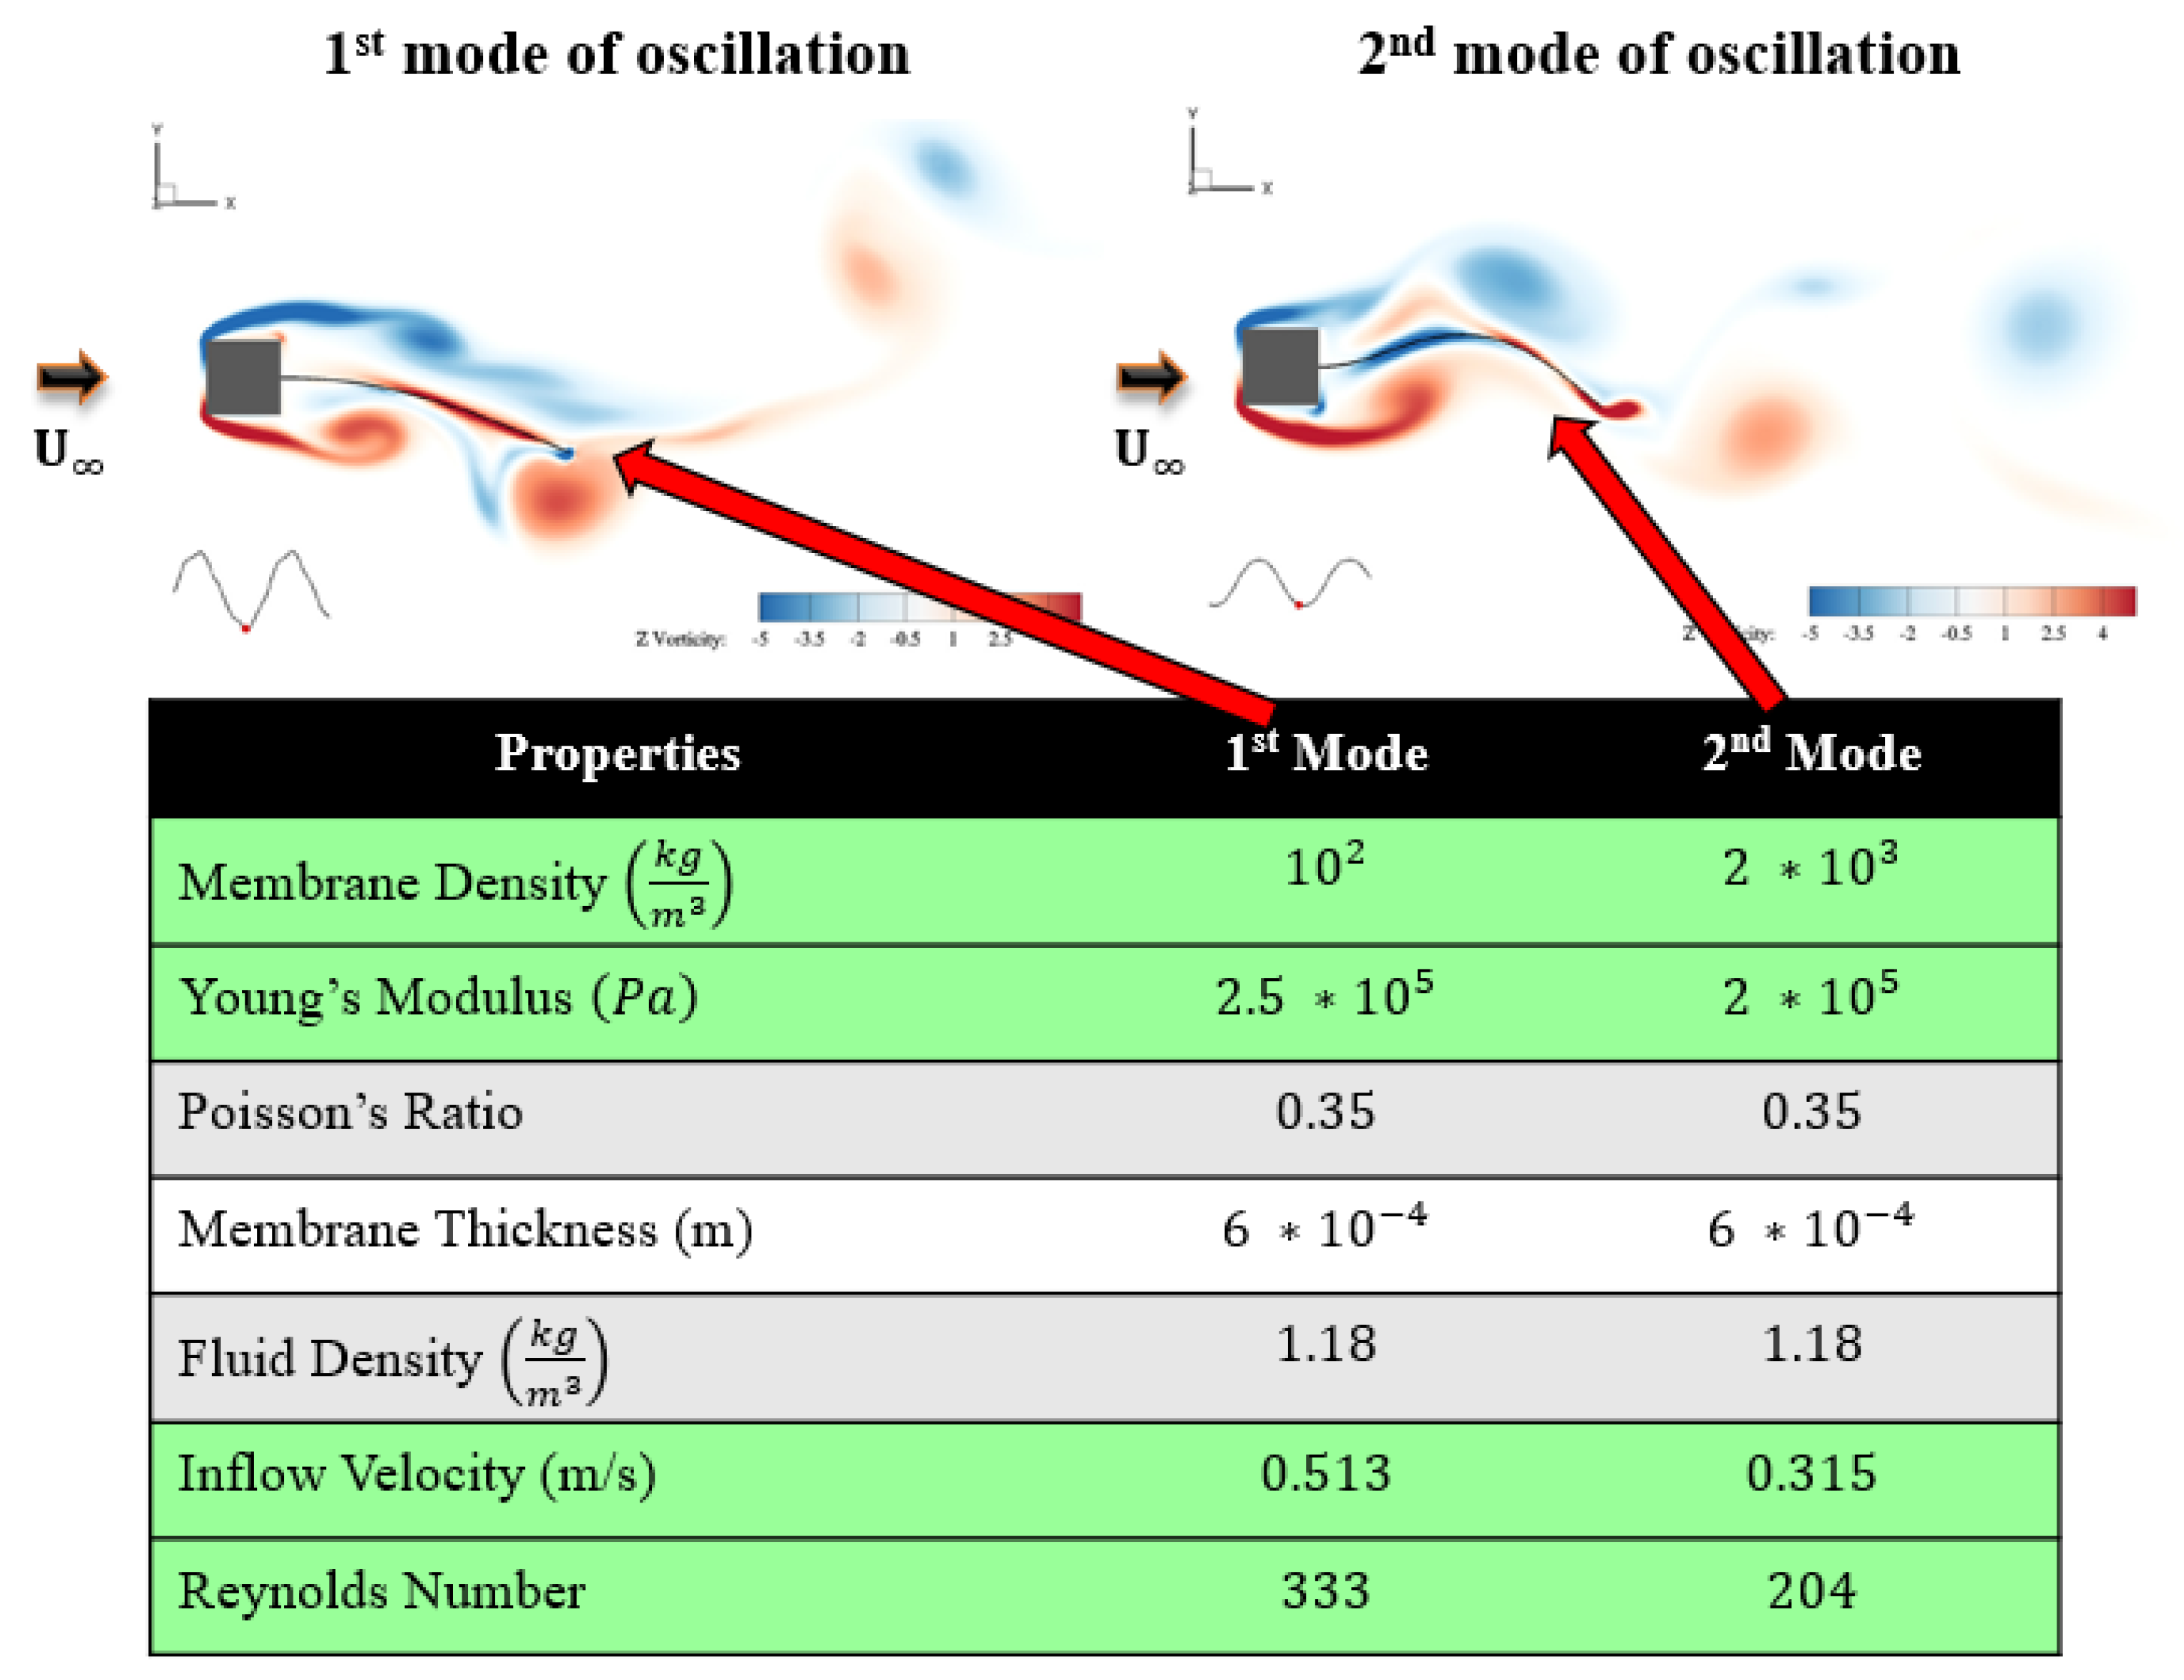
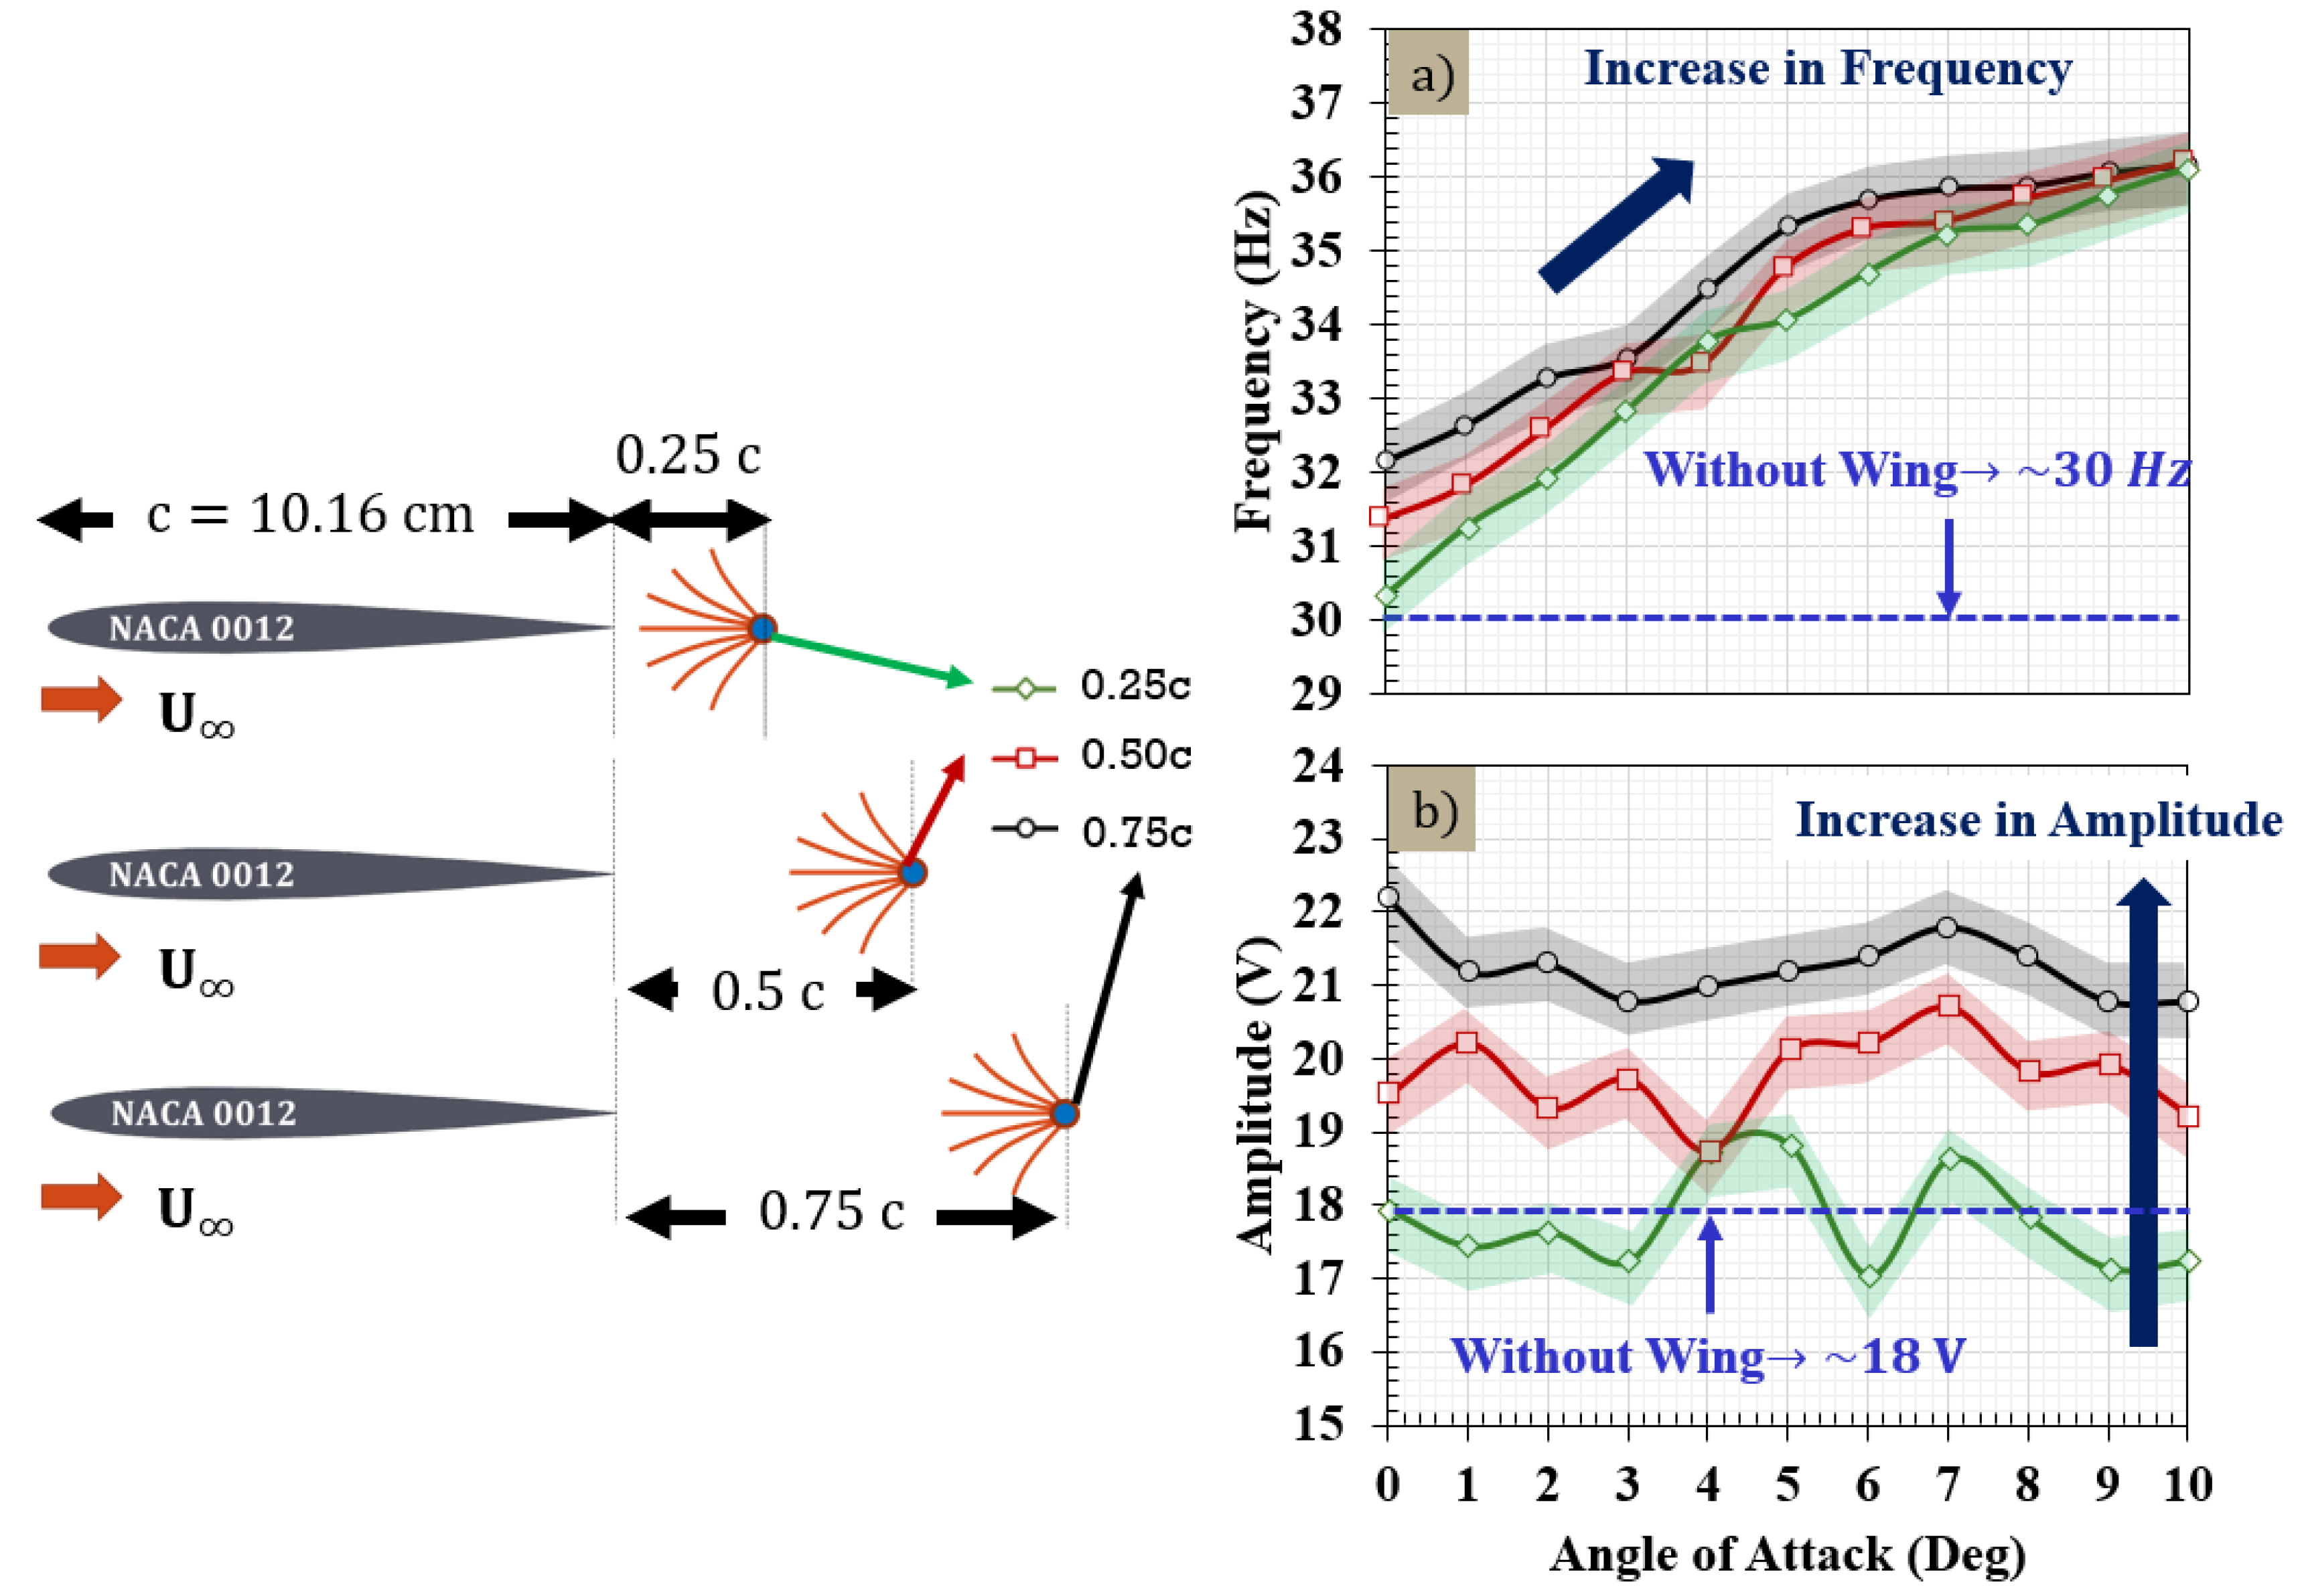
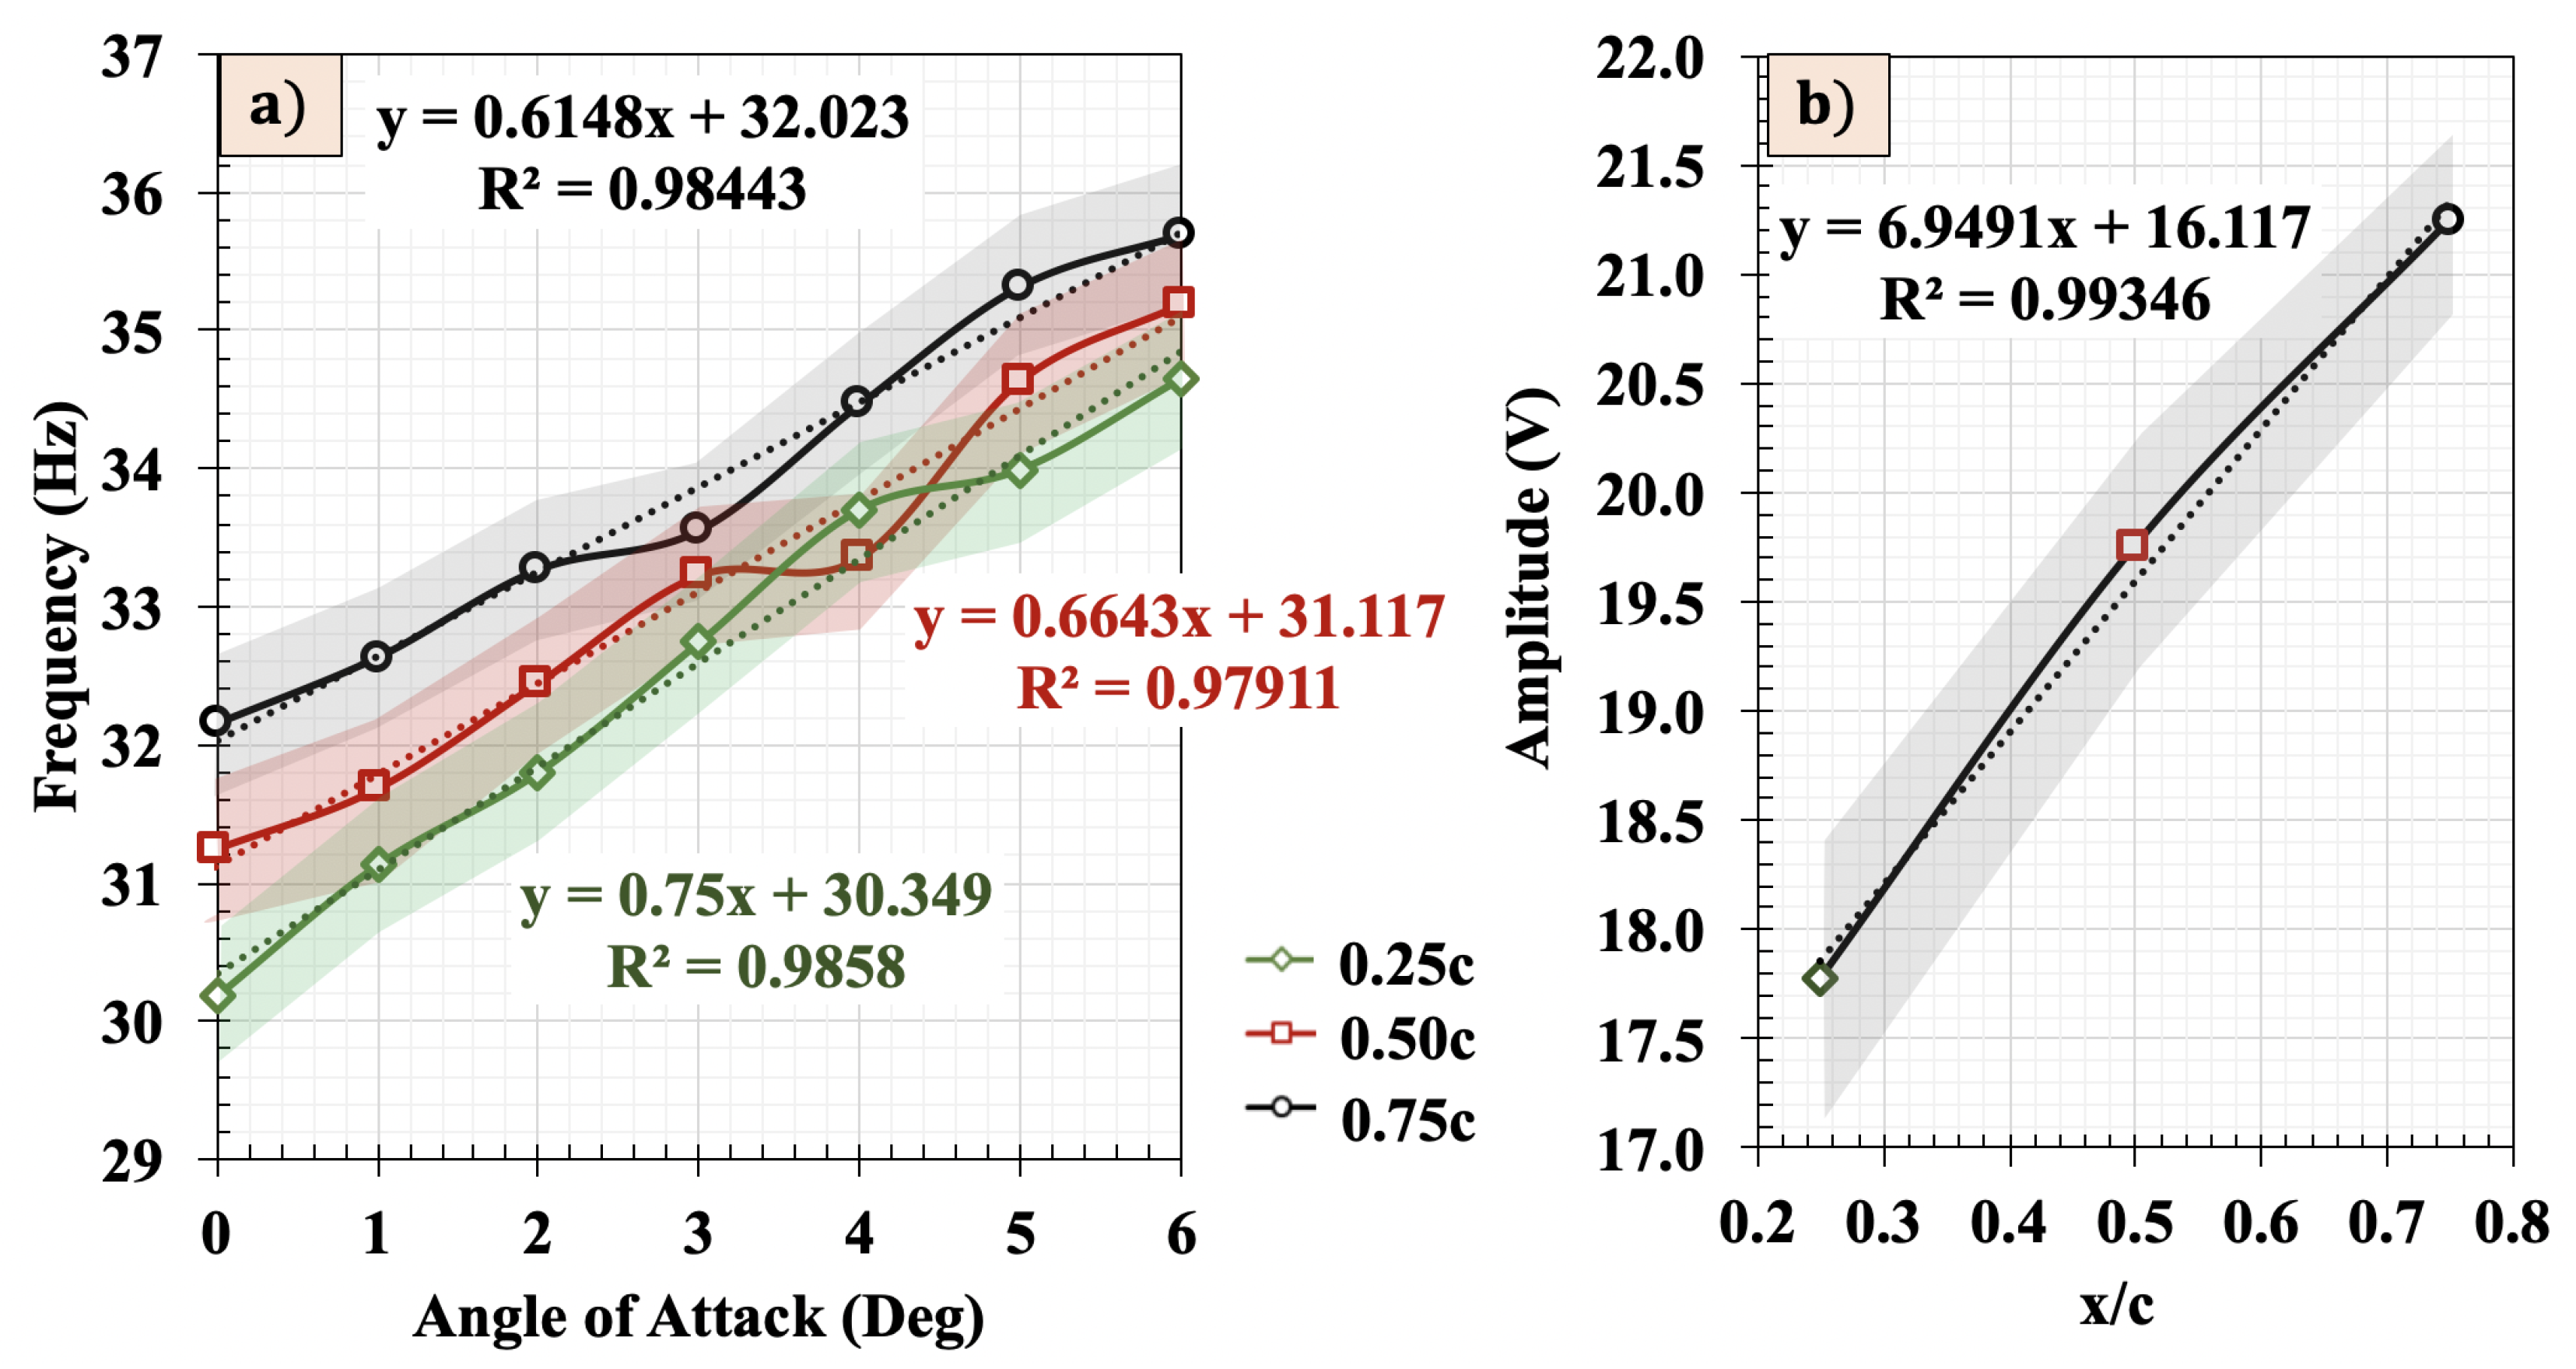
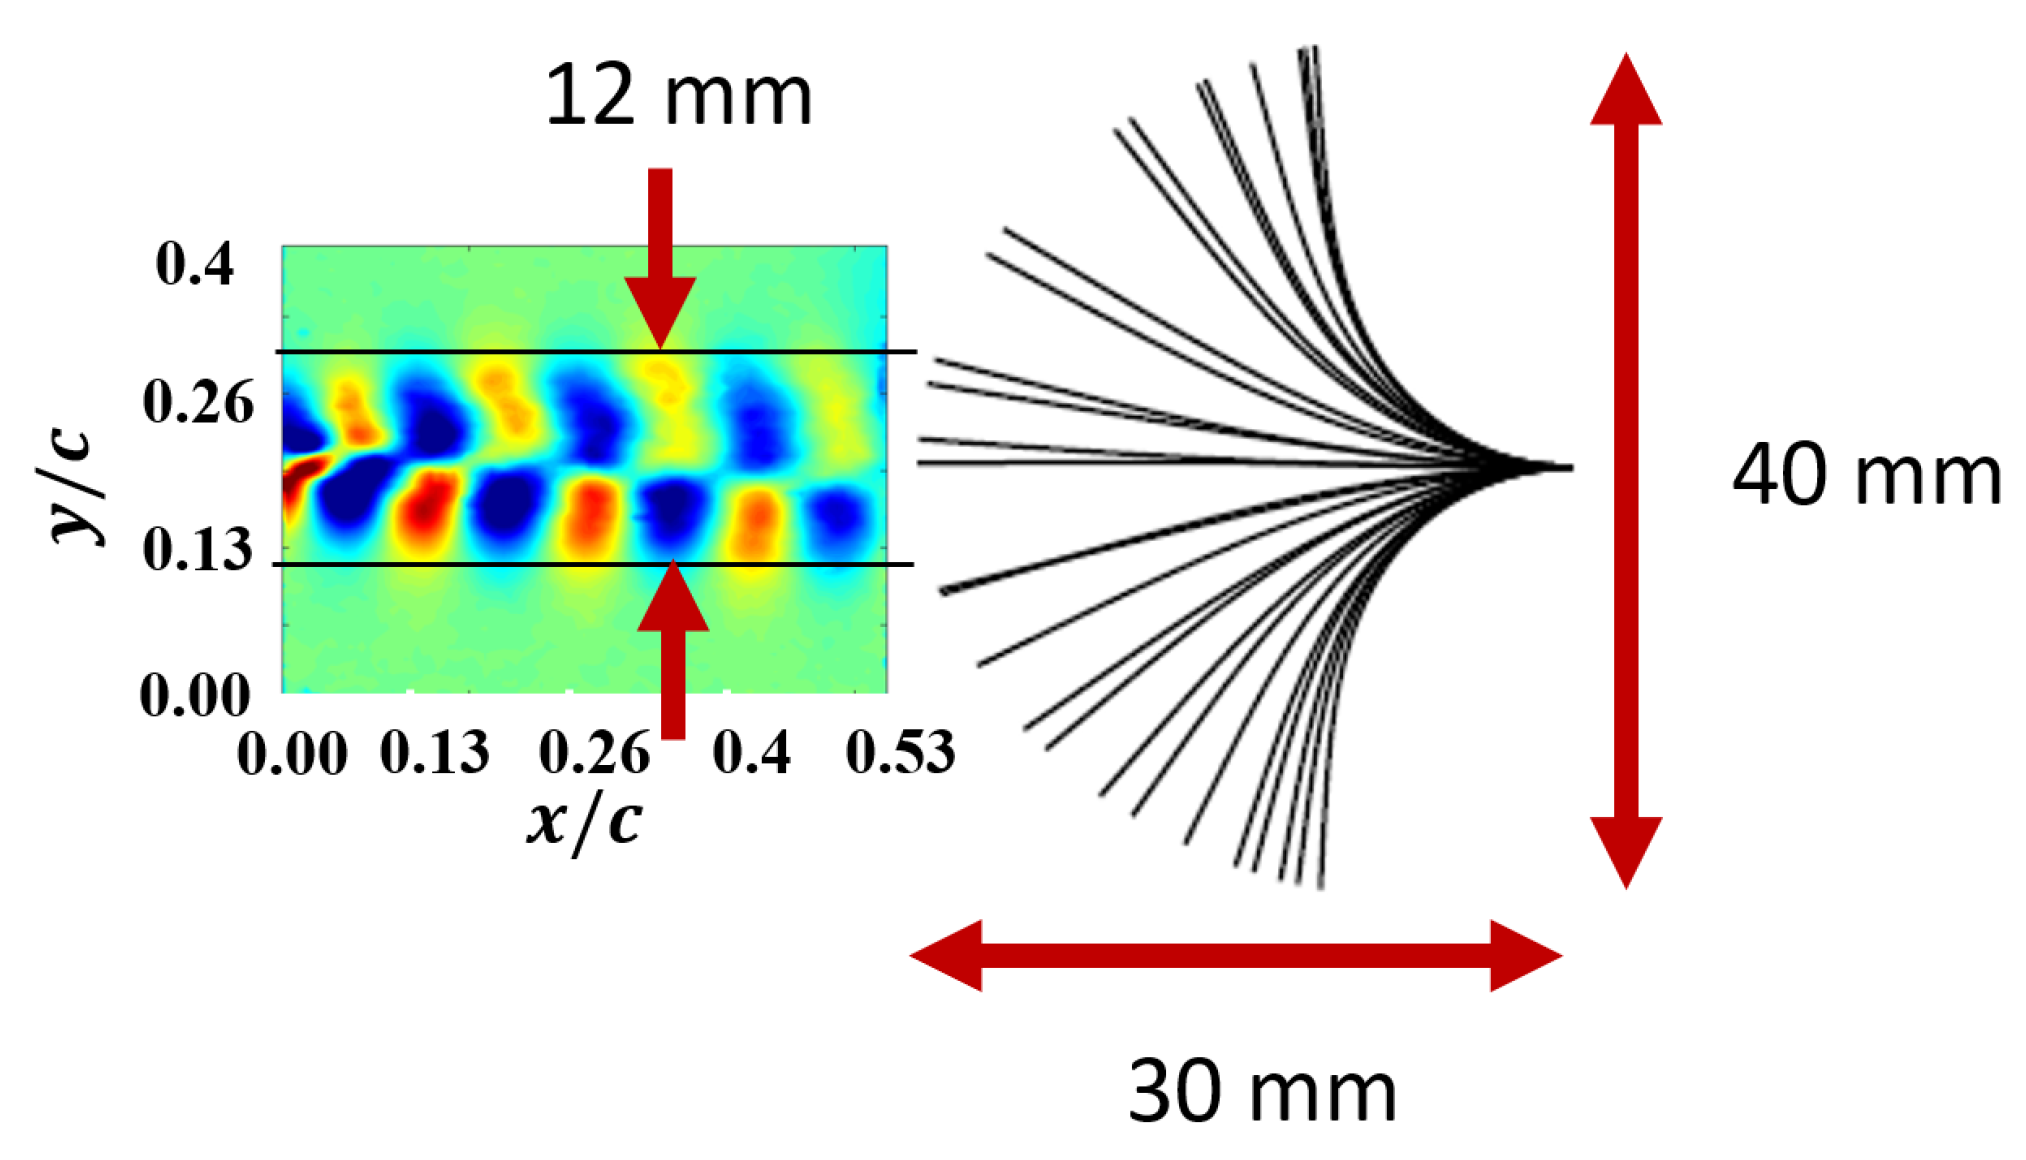
3.2. PVDF Oscillations in NACA 0012 Wake

The oscillations of the PVDF material in the wake of the NACA 0012 wall-to-wall model was quantified by measuring the frequency and the amplitude of the PVDF material as shown in Figure 14. Since the amplitude of the oscillations were characterized by the output voltage, non-dimensional oscillation frequency and amplitude could not be calculated. The PVDF material was placed at three different downstream locations from the trailing edge of the wing. The angle of attack was changed from 0 to 10 in increments of 1. When the PVDF was placed in the wind tunnel in a 14.8 m/s freestream velocity without the wing, full amplitude oscillations were observed. The frequency of the oscillation of the PVDF was around 30 Hz. The peak to peak voltage amplitude was 18 V as shown in Figure 14b. Once the PVDF was put in the wake of the wing, at 0 , the PVDF showed similar frequency and oscillation. However, as the angle of attack is increased, the frequency of the oscillations increased almost linearly until a 7 angle of attack and nonlinearly after a 7 angle of attack. At 10 , the frequency of the oscillations was found to be 36 Hz, which is an increase of 20% in the frequency when compared to the baseline. As the angle of attack increases, the wing acts similarly to the bluff body with greater vortex shedding, which, in turn, increases the frequency of the oscillations. It should be noted that the location of the PVDF was not changed with an increase in angle of attack. It is also found that the frequency increases with an increase in distance downstream. This can be attributed due to an increase in the wake width with increase in distance downstream.
Similar behavior is seen in the amplitude of the PVDF oscillations shown in Figure 14b. The amplitude is quantified in terms of peak to peak voltage output from a single PVDF sensor in the wake. The amplitude of the PVDF was also quantified without the wing. The oscillation amplitude of the PVDF without the presence of the wing was found to be 18 V. From Figure 14b, it can be seen that the amplitude of the oscillations remains almost constant with angle of attack. However, with increase in downstream distance, the oscillation amplitude seems to increase. Placed at a downstream distance of 0.25c, the mean amplitude of PVDF is similar to the amplitude without the wing at 18 V. With the increased downstream distance of 0.5c, the mean amplitude increased to 20 V, which is about an 11% increase from the 0.25c downstream case. With the increased distance of 0.75c, the mean amplitude further increased to 20 V, which is around a 20% increase from the 0.25c baseline case.
Figure 15 shows a direct correlation between the angle of attack and oscillation frequency and amplitude. The linear increase in the frequency until a 7 angle of attack is represented clearly in Figure 15a, which surprisingly resembles the linear increase in coefficient of lift with angle of attack. The slope of the frequency changes with angle of attack determined (by the linear regression equation) decreases with increase in downstream distance. A linear relationship is also found in the variation of amplitude of the oscillations with the downstream distance as shown in Figure 15b. Despite the highly complex flow structures that arises from the wake-PVDF interactions, the linear relationship between the frequency and angle of attack is surprising. This linear dependency could arise from the coherent structures present in the wake of the wing. In order to examine the relationship further, changes in coherent structures in the wake were correlated with the frequency increase in the section below.

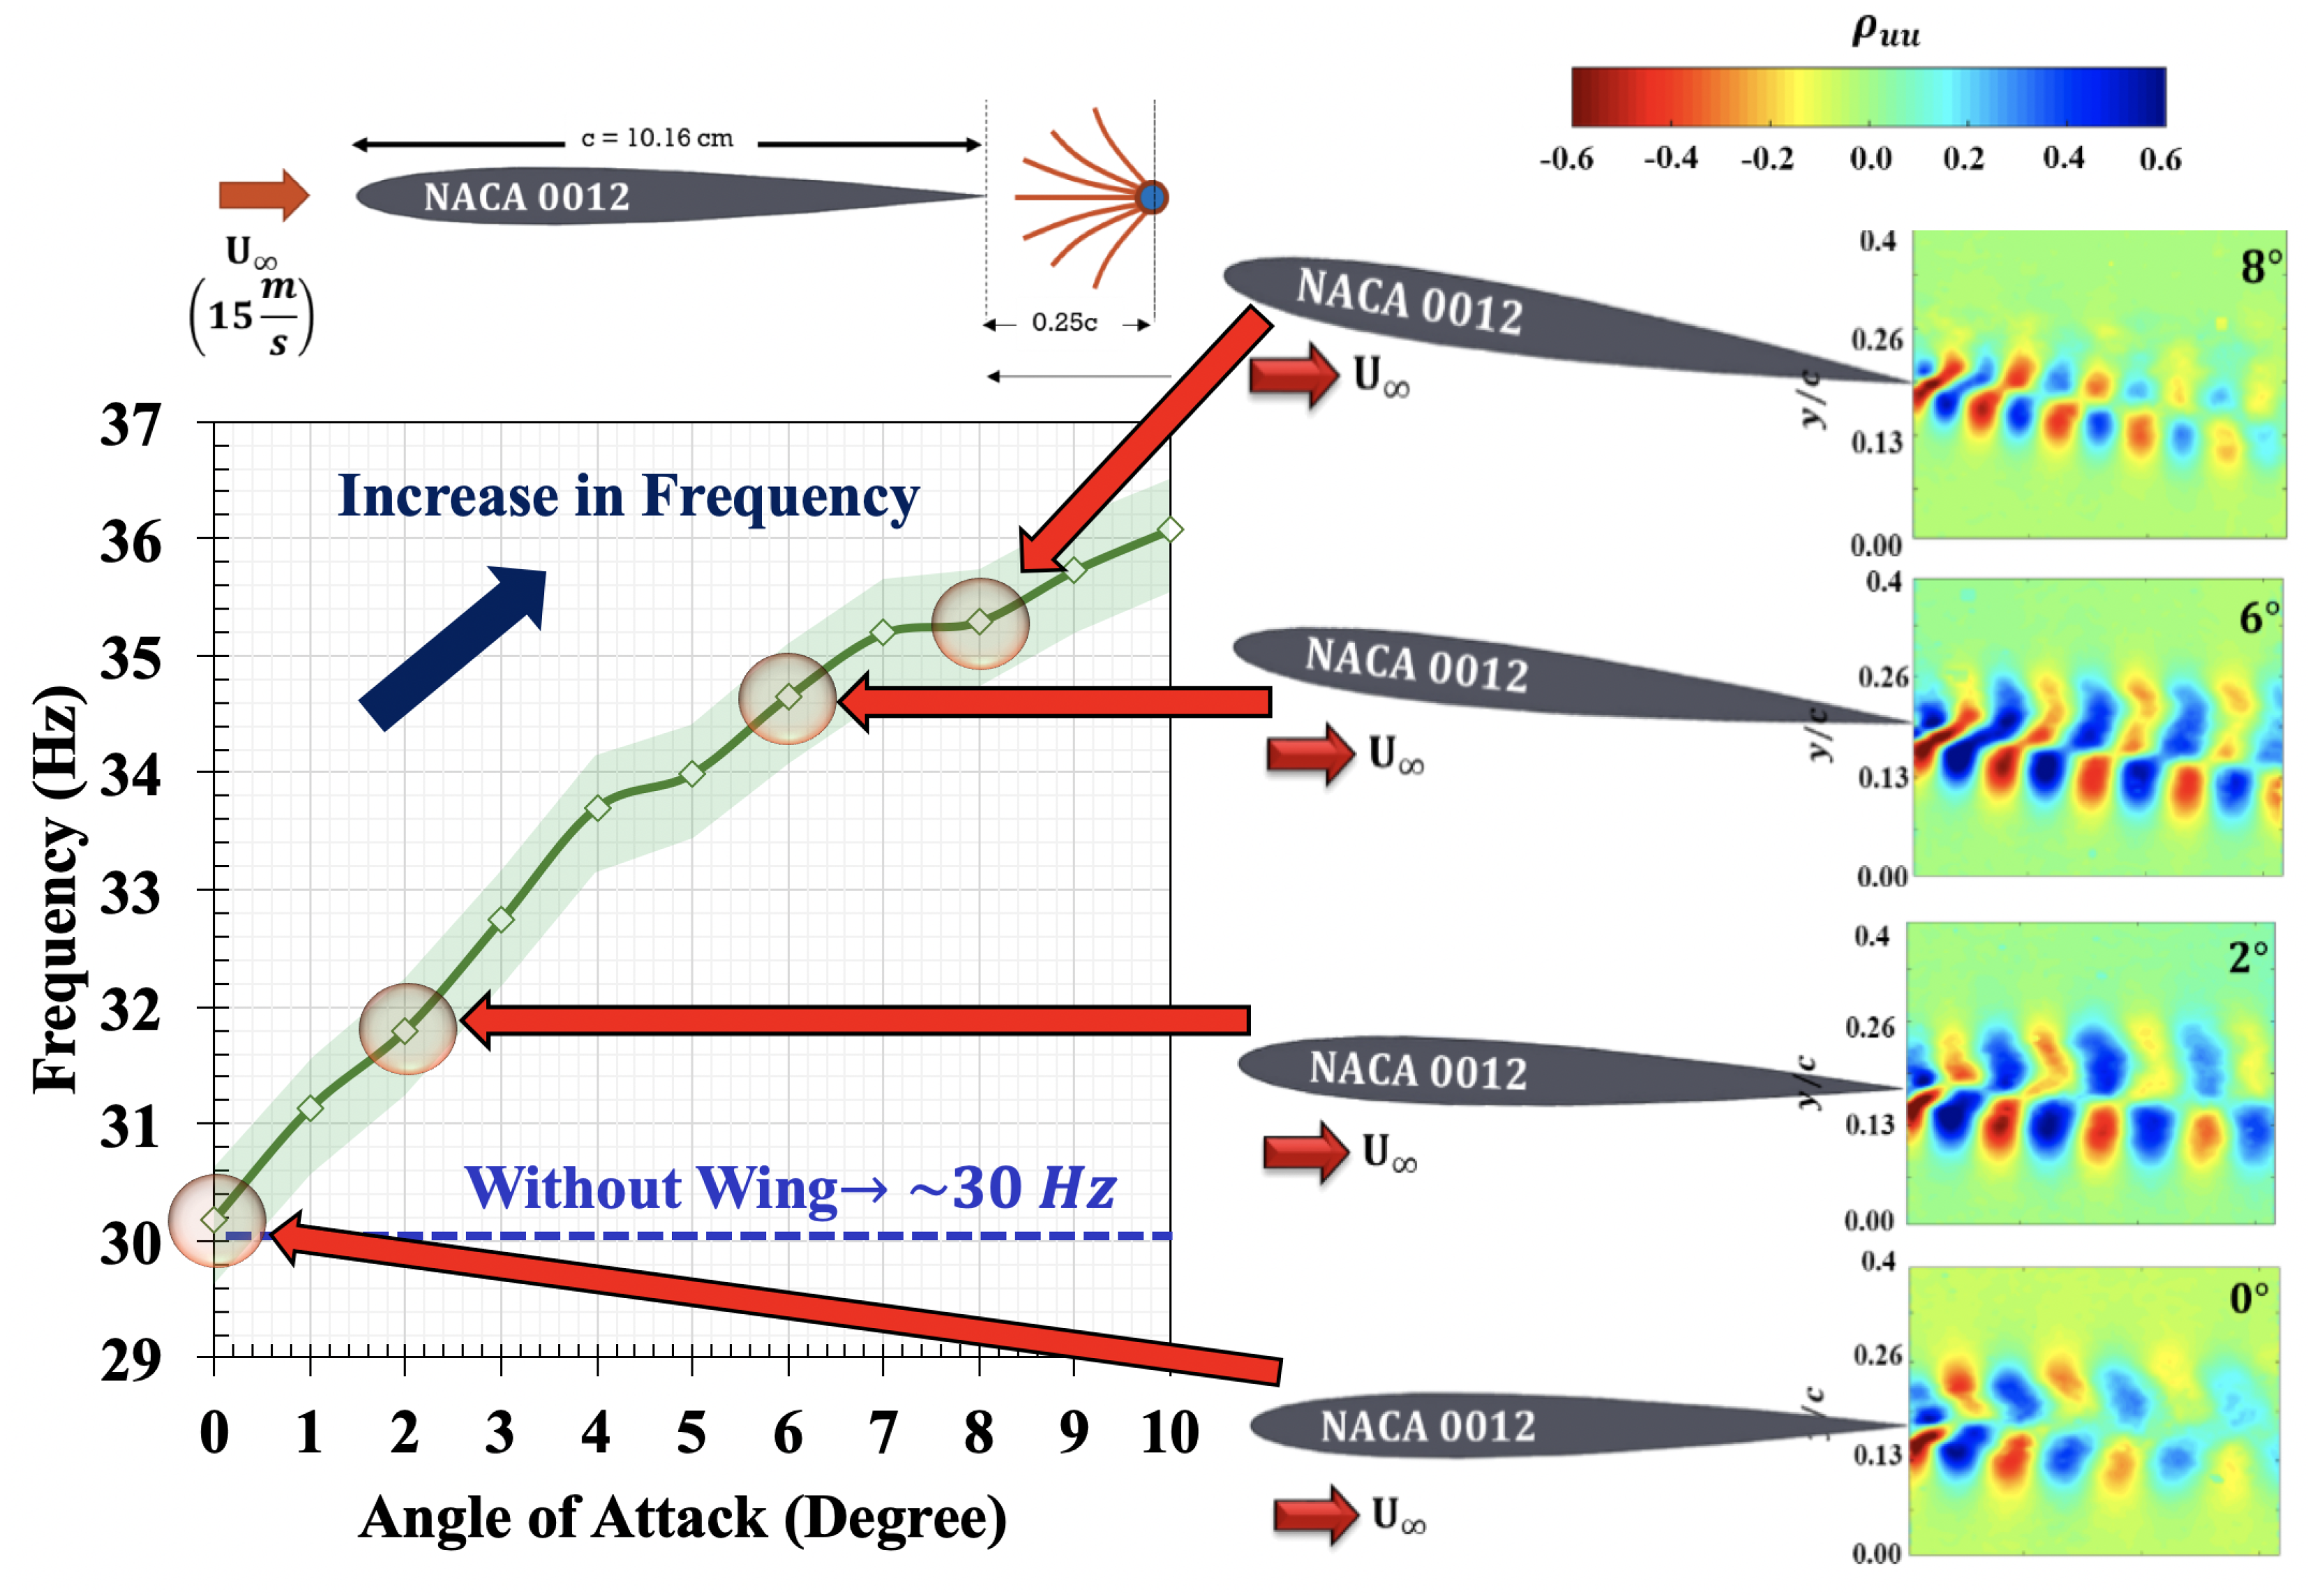
3.3. Relationship between Oscillation Frequency and Coherent Structures

As seen in the literature review sections, the conventional flexible trailing edge extensions [8,9] are excited by the vortex shedding from the wake, and the membrane oscillations frequency is consistent with the vortex shedding frequency. In order to understand the role of vortex shedding on the inverted flag configuration, two-point correlations of u and v velocity components were determined in the wake of the NACA 0012 airfoil with and without the presence of the piezo embedded PVDF. The two-point correlation allows for determining the length scales associated with the coherent turbulent motions (vortex shedding) in the wake which are responsible for pressure fluctuations, sound generation and structural vibration. The two point correlation is defined as
ρ u i u j = u i ( X 1 , t ) u j ( X 2 , t + τ ) u i ( X 1 ) 2 ¯ u j ( X 2 ) 2 ¯ ,
where X 1 and X 2 are two spatial locations in the PIV field of view, τ is the time delay (which is chosen to be zero for the results shown below), u represents the fluctuating velocities in i and j direction and ρ u i u j is the correlation coefficient. The reference point X 1 was chosen to be at the mid-point of the upper surface shear layer at the trailing edge of the wing.
The two-point correlation contours of fluctuating velocity in the streamwise direction at angles of attack of 0 , 2 , 6 and 8 are shown in Figure 16. It can be seen that, as the angle of attack increases, the coherent structures in the wake of the wing increase, which is observed by the alternating red and blue patterns in the contour. There are seven coherent structures in the upper surface wake at angle of attack, whereas, with increase in angle of attack, the number of coherent structures increased to 10 at 8 angle of attack. These patterns indicate the presence of vortices in the wake, which are shed from the upper and lower surface of the wing. It is surprising to see that, albeit being a highly unsteady motion of the PVDF, the changes in the coherent structures changed the frequency response of the PVDF. This result potentially indicates the possibility of using the piezo-embedded PVDF for wake sensing purposes. Therefore, when the wing experiences gusts, the changes in the effective angle of attack of the wing could be determined from the PVDF oscillation frequency which could then be used to control the wing. In order to determine if the presence of inverted PVDF changed the upstream wake signature, comparisons were made using wake signatures. The momentum deficit and two-point correlations were compared between the cases with and without the presence of PVDF. The results are shown in the section below.

3.4. Influence of PVDF on the Wake Structure—PIV Results

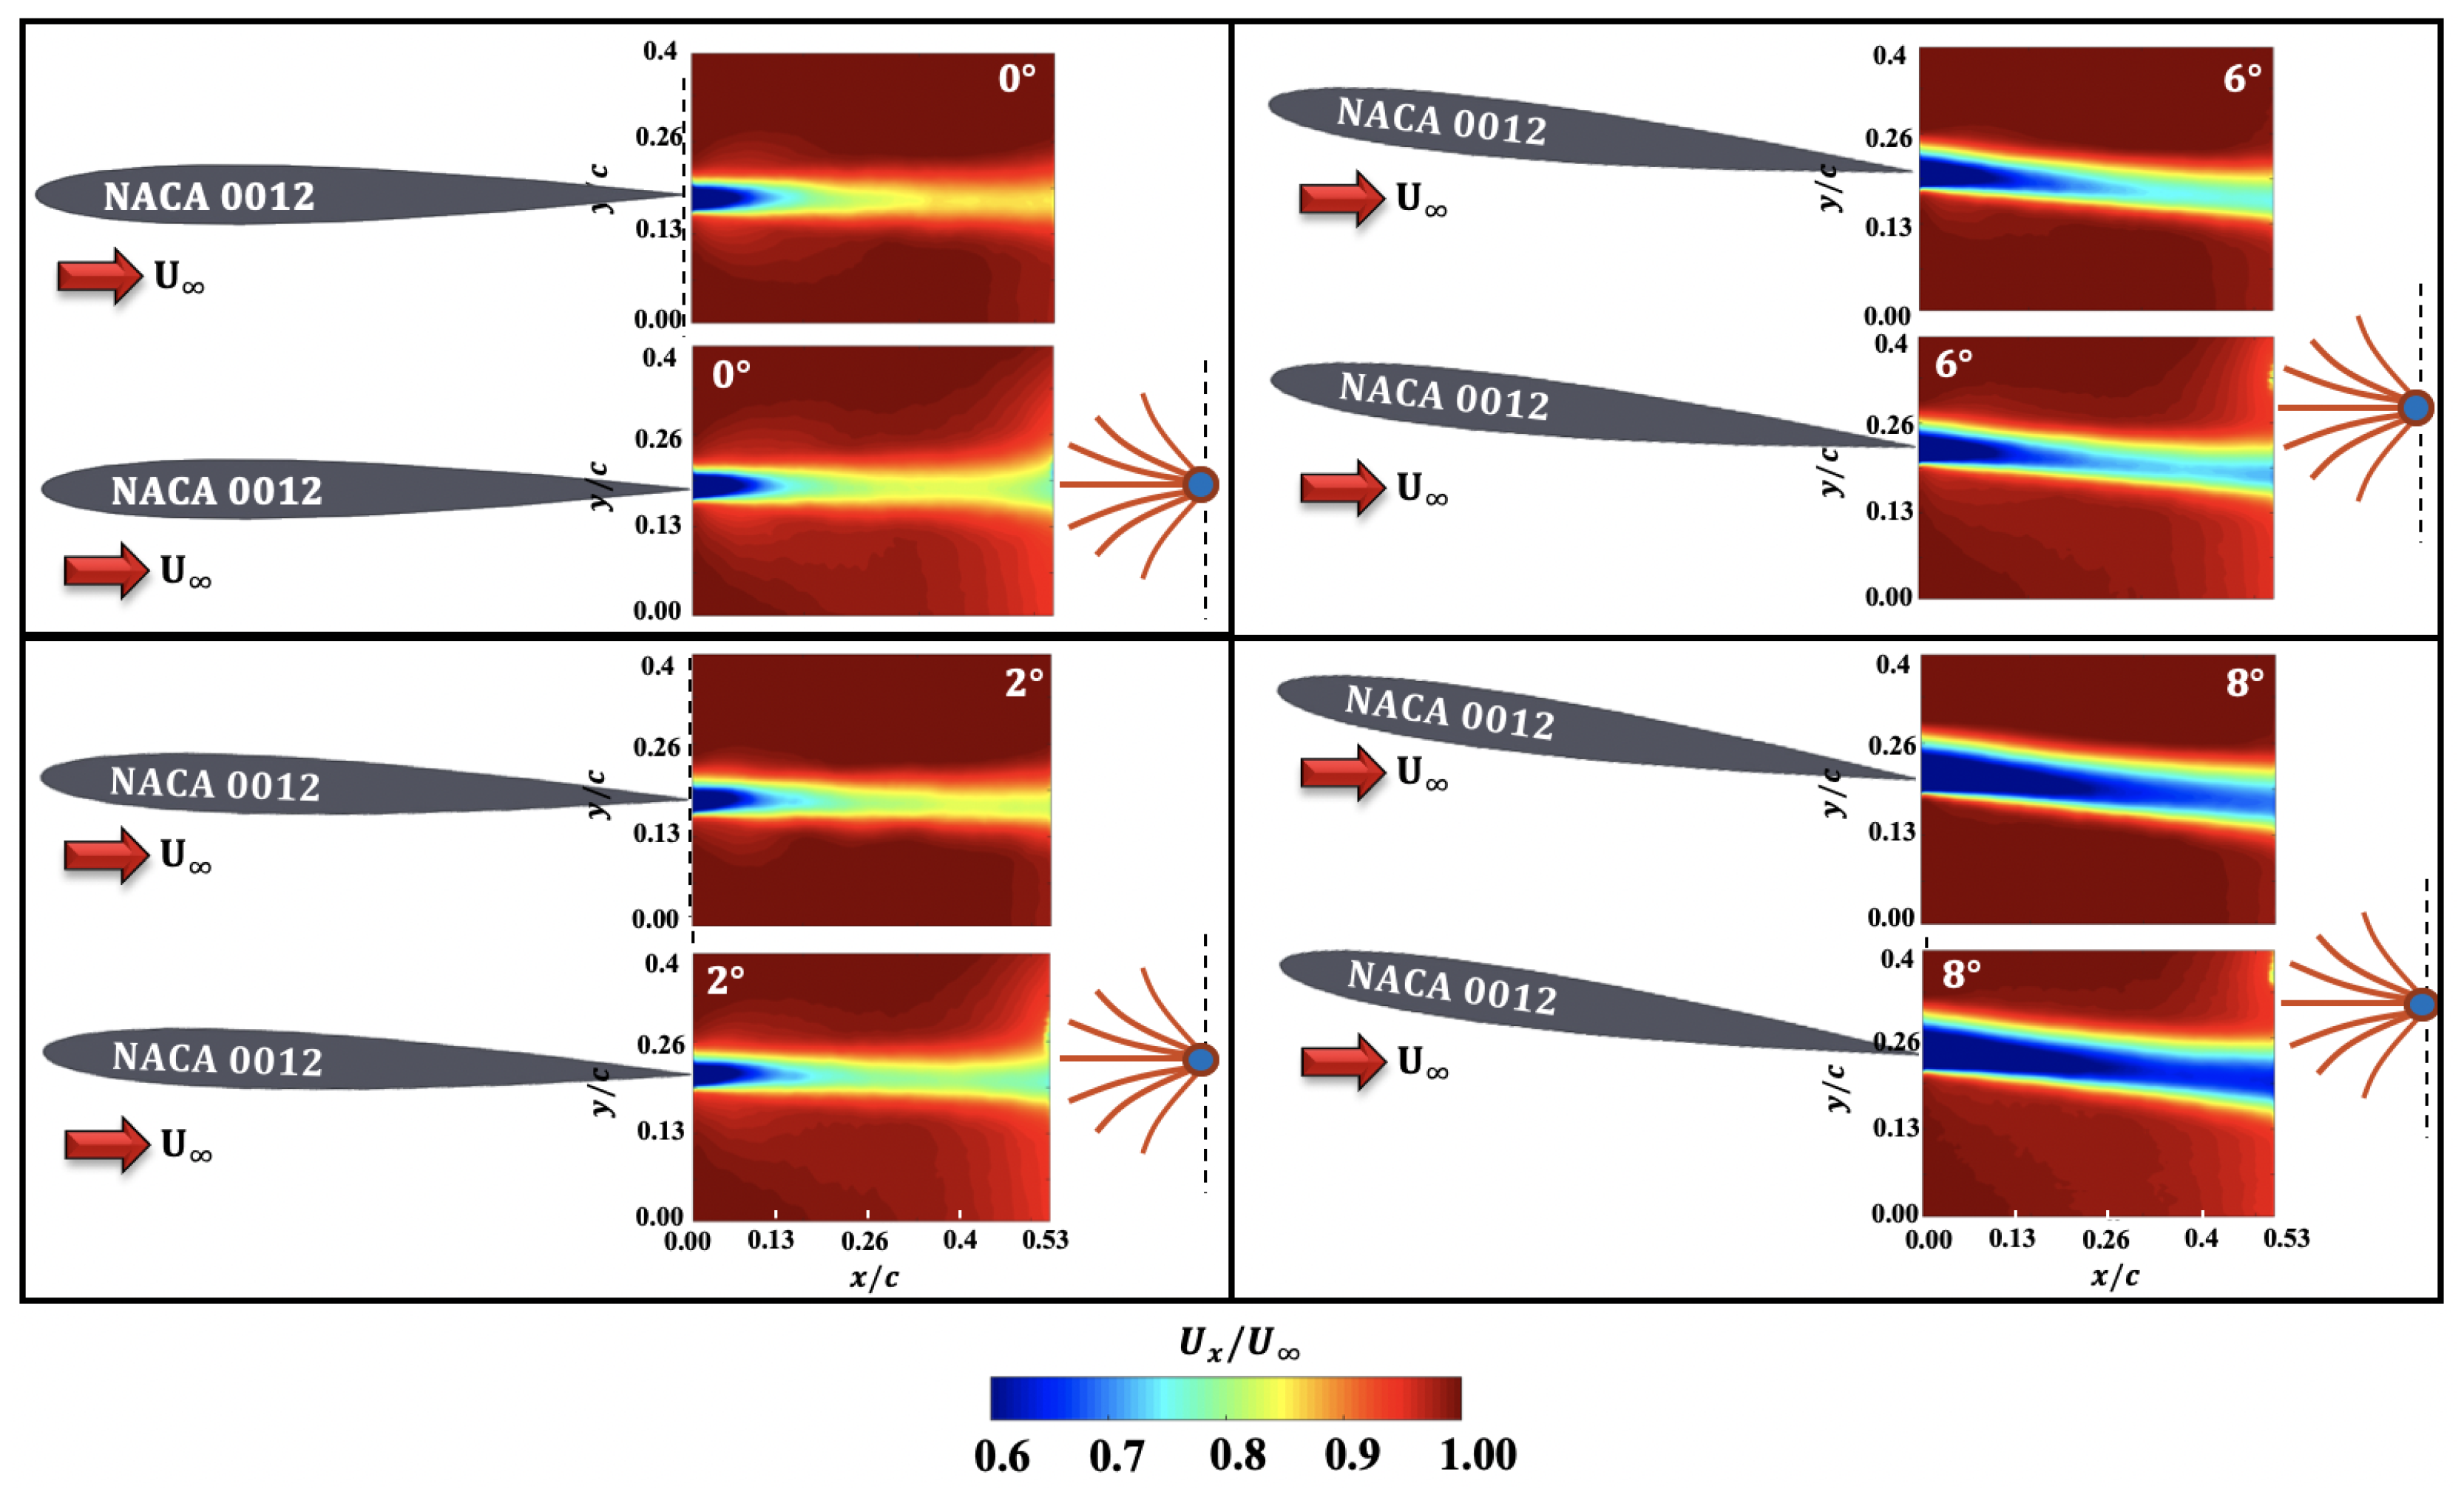
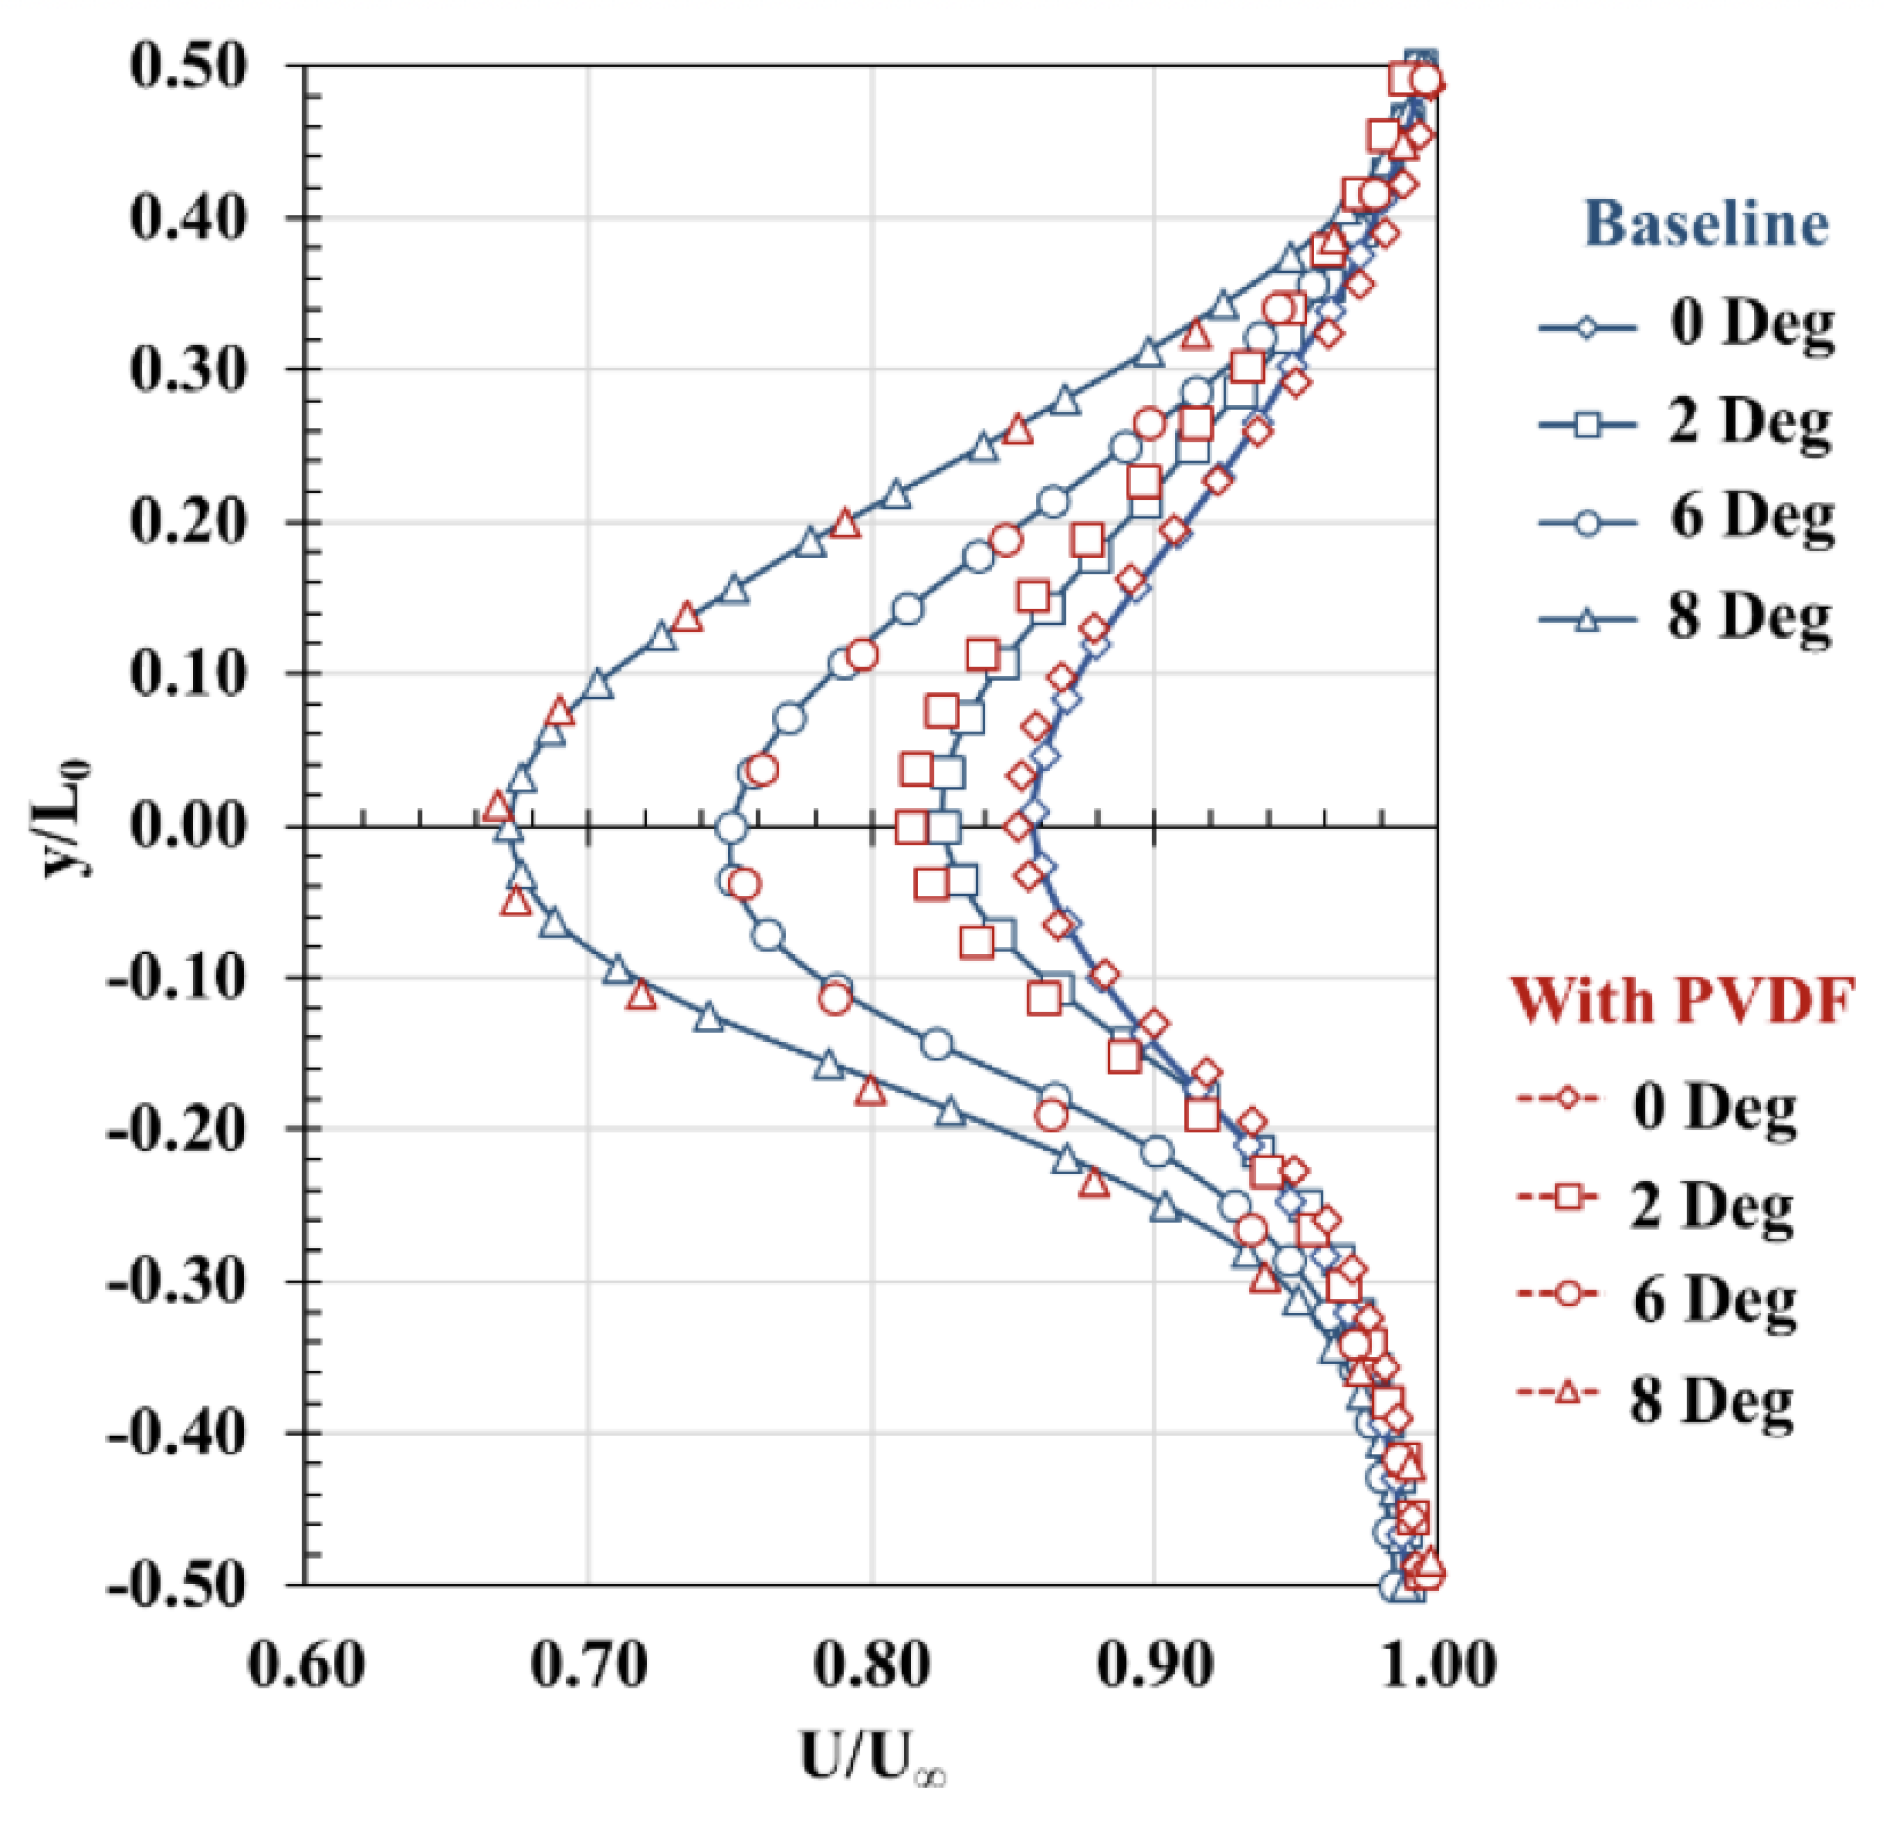
3.4.1. U-Velocity Contours

The increase in the PVDF frequency with the increase in coherent length scales shown in Figure 16 is only valid if the presence of PVDF did not alter the upstream wake structure itself. Therefore, the U-Velocity (aka Momentum Deficit) contours (Figure 17) and two-point correlation contours (Figure 20) are compared in the NACA 0012 wake with and without the piezo embedded PVDF. From Figure 17, at 0 and 2 angles of attack, the U-velocity near the leading edge of the PVDF increases by 2% when compared to the baseline. As the angle of attack is increased, the U-velocity behind the trailing edge increases as expected but the U-velocity ahead of the PVDF remains unchanged.
Similar trends are seen in the 6 and 8 angle of attack as well where the U-velocity is very similar in the wake with and without the PVDF. It should be noted that the location of the PVDF was not changed to be at the center of the shear layer with angle of attack as indicated in Figure 17. However, this wouldn’t affect the results seen in Figure 17 due to length scales involved. When undergoing large amplitude flapping mode, the vertical distance covered by the PVDF was calculated to be 40 mm as shown in Figure 18. The thickness of the wake was calculated to be around 12 mm at 2 angle of attack and 13 mm at 8 angle of attack. Therefore, given the large ratio of the oscillation distance when compared to the wake width, the placement of the PVDF in the upper, middle or the lower shear layer will contribute to similar results as shown in Figure 17.
The differences in the U-velocity between the baseline and the PVDF cases can be seen clearly in the U-velocity profiles shown in Figure 19. The U-velocity profiles shown in Figure 19 indicate small differences with and without the presence of the PVDF. These profiles were obtained from the U-velocity contour at the center of the field of view. The increase in U-velocity with angle of attack can be seen clearly in Figure 19 for both of the cases. At lower angles of attack, the presence of PVDF increased the peak U-velocity by 2%. At higher angle of attack, the U-velocity profiles show similar variation between the two cases. Any changes in the U-velocity observed at a high angle of attack falls within the uncertainty of the PIV measurements, which was calculated to be 0.1 m/s.

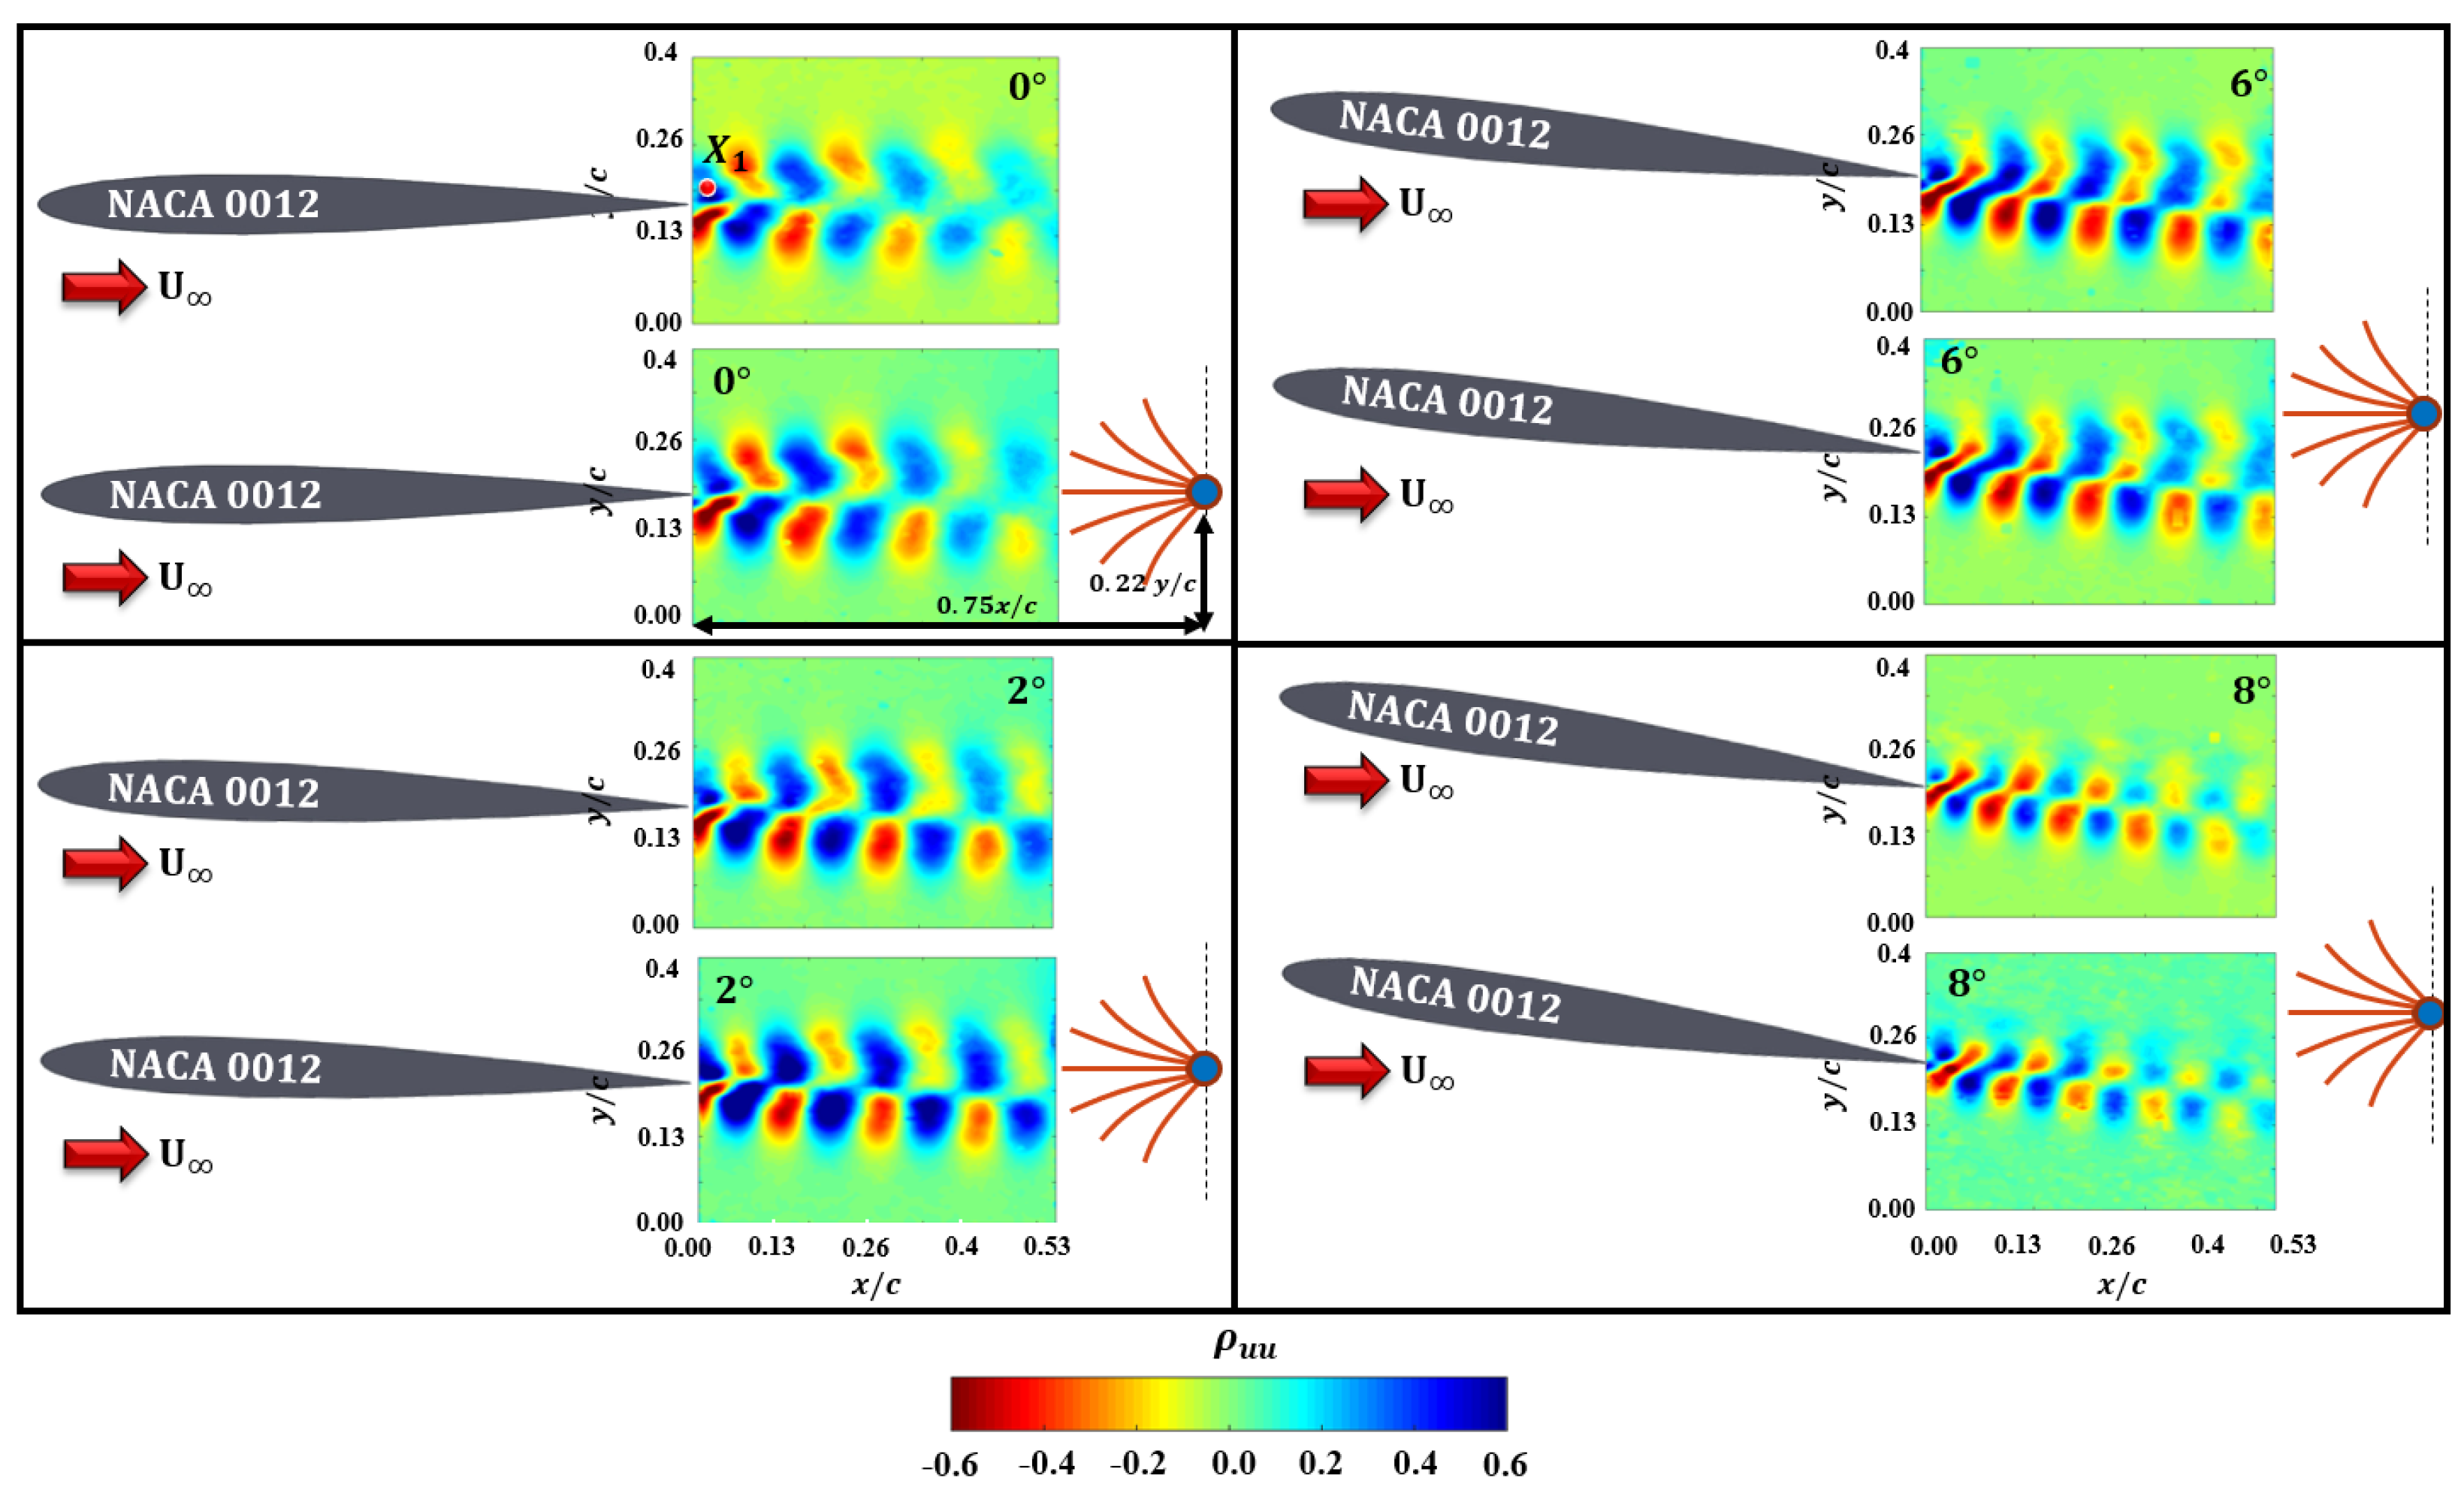
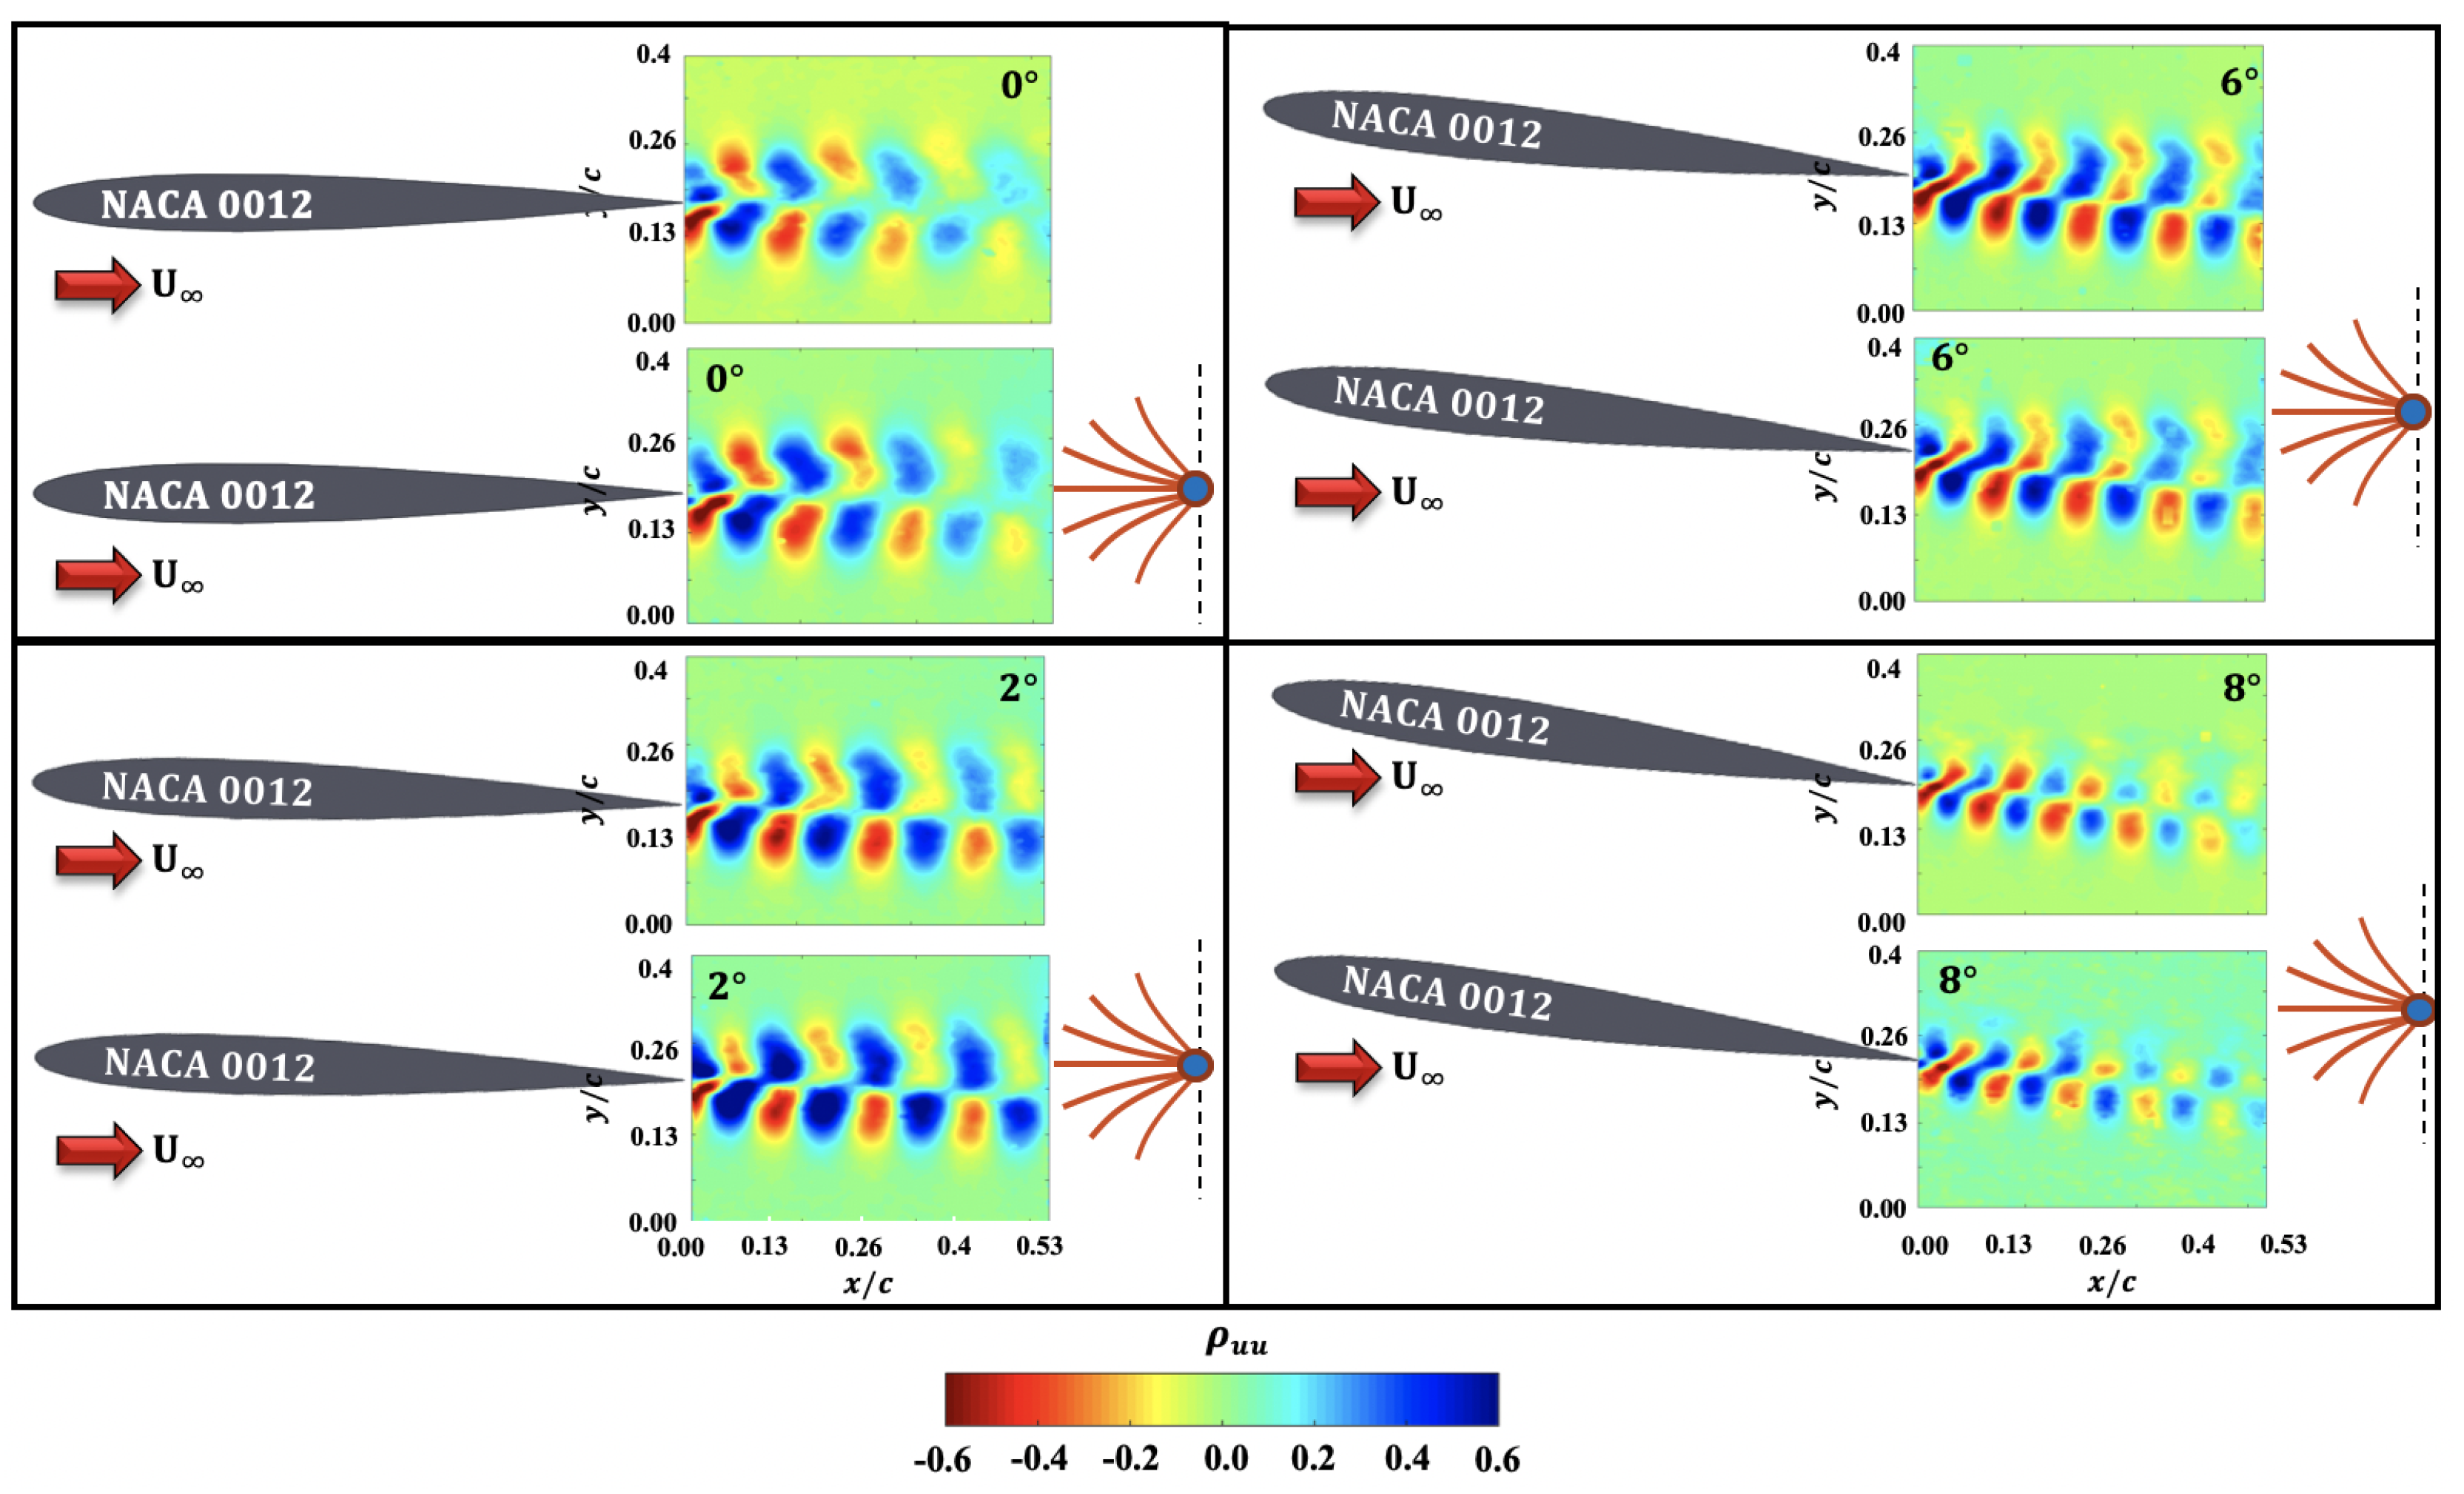
3.4.2. Two-Point Correlations

The normalized two-point correlation functions with zero-time delay of the streamwise ( u ) and transverse ( v ) fluctuating velocities are shown in Figure 20 and Figure 21, respectively, for angles of attack of 0 , 2 , 6 and 8 . In each case, the reference point ( X 1 ) in Equation (3) is chosen to be at the center of the upper shear layer. The coordinates of the ( X 1 ) location was (0.018 x/c, 0.248 x/c). The coordinates of the pivot point of the inverted PVDF was (0.75 x/c, 0.22 y/c). The contour images show extensive coherent structures of alternating positive and negative correlation values for both components of fluctuating velocity. Specifically, spatially alternating regions of positive and negative correlation are indicative of the spatially and temporally periodic motions that are related to the temporal character of fluctuations in the flowfield at the frequency of vortex shedding.
Very subtle differences can be observed in the correlations with and without the presence of the PVDF in the wake. The correlation of the velocity closer to the PVDF decreases slightly when compared to the baseline case at 0 and 2 angle of attack cases. At higher angles of attack, the correlations of the u and v fluctuating velocities between the baseline and the PVDF case is almost identical. This could be due to the PVDF not being in the center of the wake.
The coherent structures are highlighted clearly in the two-point correlation contours of transverse velocity components shown in Figure 21. The alternating pattern of red and blue bands indicate increase and decrease in velocity when compared to the velocity at the reference point ( X 1 ), respectively. The coherent structures clearly indicate that the presence of the PVDF did not change the nature of the rollup of the coherent structures across all angles of attack. A similar number of correlation bands can be seen for all angles of attack between the wake without the presence of PVDF and with the presence of the PVDF. Since both the mean and fluctuating component of the wake show similar variation between the two cases (with and without the PVDF), it conclusively shows that the presence of PVDF did not affect the nature of the wake, hence it can be used for sensing changes in the wake signature of a wing.

3.5. Performance of Piezo Embedded PVDF-Polymer Sensor in Freestream
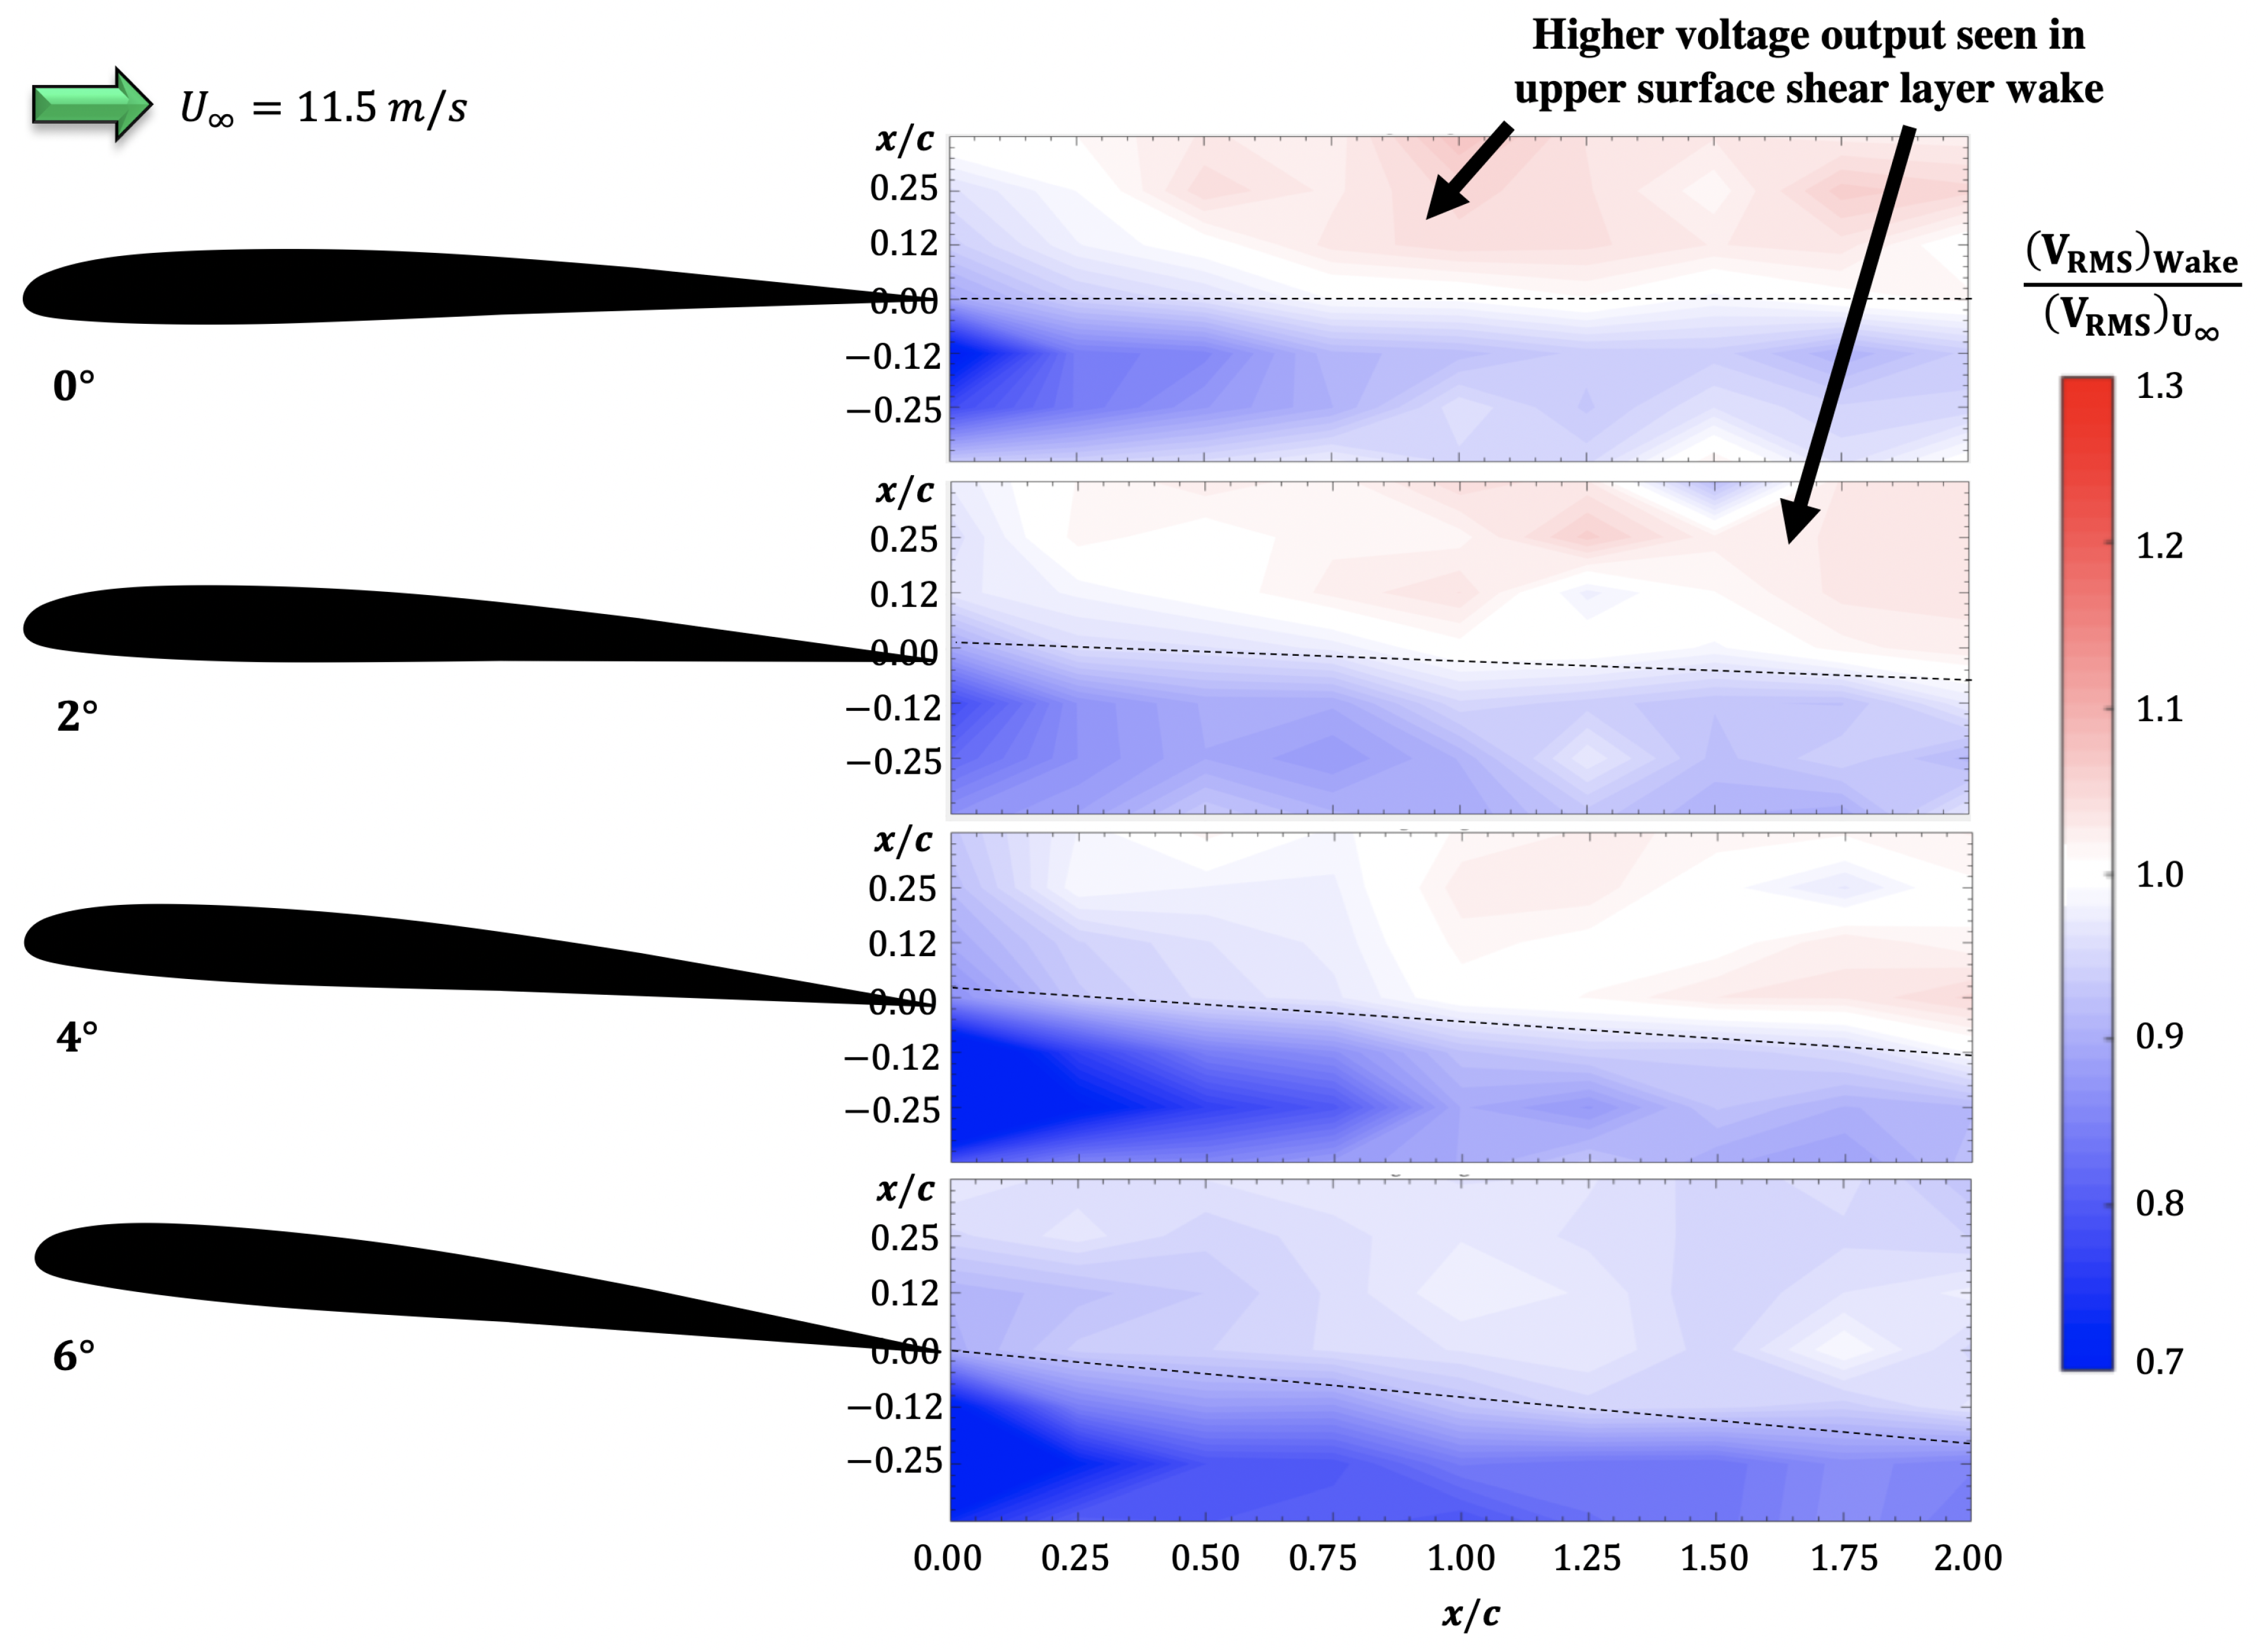
Before testing the PVDF—Polyethylene terephthalate (PET) polymer combination shown in Figure 10a in the wake of the SD7003 airfoil, its performance was quantified by placing it in the freestream to determine the average peak-to-peak voltage output and the oscillation frequency. The average peak-to-peak Voltage is determined by taking the peak voltages in the time history of the voltage output from the PVDF and averaging them for 2 s with sampling rate of 1000 Hz. The oscillation frequency was determined by taking the Fast Fourier Transform of the voltage signal similar to the frequencies shown in the previous section for the NACA 0012 case. The variation of the voltage and frequency of the inverted PVDF—Polymer configuration is shown in Figure 22. The sensor was placed in the freestream range between 10 m/s and 14.7 m/s to which the corresponding non-dimensional stiffness values ( β ) were calculated to be 0.36 and 0.21, respectively. At these velocities, the PVDF-polymer configuration underwent large amplitude flapping mode at 11.5 m/s ( β = 0.34). With an increase in freestream velocity, the large amplitude flapping reduced to large deflection deformed flapping mode at velocity of 14.7 m/s ( β = 0.20) as indicated in Figure 22.
The frequency of the oscillations varied highly nonlinearly as a function of β . High frequency in the PVDF-polymer oscillations was observed at β value of 0.26. However, the frequency results from Figure 22 matches the non-dimensional frequency results shown in Figure 6b where similar nonlinear behavior was seen as a function of β . It is also interesting to note that the variation of the voltage amplitude shown in Figure 22 resembles the same trend as the variation of the non-dimensional amplitude shown in Figure 6a. In both cases, the amplitude decreases as a function of β between the β values of 0.2 and 0.35. The similarity between results shown in the literature in Figure 6 and the results shown in Figure 22 is encouraging, especially since the amplitude and frequency information was obtained from a smart material which was attached to a PET polymer. From Figure 6 and Figure 22, it is seen that the maximum voltage is obtained when the flag is experiencing large deflection deformed flapping.

3.6. Voltage Root Mean Square ( V o l R M S ) in the Wake of SD7003 Wake

Once the performance of the PVDF-polymer combination was quantified in the freestream, it was then placed in the wake of SD7003 wall-to-wall model to determine the changes in oscillating frequency and output voltage RMS as a function of angle of attack and downstream distance. The sensor was placed at 56 grid point locations downstream of the wing as shown in Figure 11. The Voltage RMS was calculated using Equation (4). In all the downstream locations, the sensor experienced the oscillation mode between the large amplitude flapping mode and the large deflection deformed flapping mode.
V R M S = ( V I n s t a n t V M e a n ) 2 n ,
where V I n s t a n t is the instantaneous voltage, V M e a n is the mean voltage, and n is the number of data points collected. The V M e a n for most the cases was closer to zero since the PVDF-polymer sensor underwent large amplitude flapping mode in the wake of the wing. A normalized Voltage RMS contour from the measurement locations as a function different angles of attack is shown in Figure 23.
The Voltage RMS in the wake of the wing was normalized with the Voltage RMS when the PVDF-polymer sensor was placed in the freestream. The contours show very interesting patterns, which capture some of the wake characteristics. The voltage RMS contour is so surprisingly stratified that distinct red and blue regions indicate the upper and lower surface shear layers from the trailing edge of the wing. The normalized voltage RMS is higher in the upper surface shear layer wake as shown in red regions of the contour and comparatively lower in the lower surface shear layer wake. This states that, for energy harvesting purposes, the sensor performs better if it is placed in the upper surface shear layer. When the PVDF was placed at the mid-wake, the normalized voltage RMS was similar to that of the freestream, as indicated in white regions of the contour. The voltage RMS contours also indicates changes in downwash angle of the wake as a function of angle of attack. This changes in downwash angle in the voltage RMS contour is indicated by the dotted black line in the middle of each contour. This dotted line was drawn by closely following the white regions of the contour expect for the six angle of attack case. Due to the location of the grid measurement points and the downwash angle, it is possible that the sensor was not placed exactly at the wake center at higher angle of attack. Irrespective of the resolution of the grid location, Figure 23 shows remarkable correlation between the wake features and voltage RMS obtained from the sensor. The increase in voltage RMS with downstream distance mirrors the results seen in the NACA 0012 case in Figure 14b and Figure 15b as well. These results conclusively indicate that the inverted flag configuration could deliver higher voltage output under unsteady conditions when compared to freestream conditions. It is hypothesized that the increase in voltage RMS in the upper surface could be due to the increased shear and velocity from the upper surface of the wing.

4. Conclusions

The use of inverted flexible piezo embedded PVDF for energy harvesting and wake sensing purposes were investigated in the University of Dayton Low Speed Wind Tunnel. Two different PVDFs with different thickness and lengths were tested with two different airfoils: NACA 0012 and SD7003 at Reynolds numbers of 100,000 and 60,000, respectively. These Reynolds numbers were chosen from the velocity at which the PVDF sensor achieved a large amplitude flapping mode. From the experiments conducted, key conclusions are:
  • The inverted flag configuration is sensitive to unsteady flows. This dependency is shown by the increase in oscillation frequency and amplitude as a function of angle of attack and the downstream distance from the trailing edge of the airfoil. The oscillation frequency increased linearly with an increase in angle of attack similar to the linear trend of lift coefficient with angle of attack. The peak to peak voltage output was increased with an increase in downstream distances from the trailing edge of the wing.
  • The increase in sensor frequency with angle of attack could be due to the increase in coherent structures in the wake of the wing confirmed by the two-point correlations of fluctuating u and v velocity components.
  • Even with high unsteady wake, the presence of piezo embedded PVDF did not affect the upstream wake signature as evidenced by the momentum deficit contours and profiles as well as the two-point correlations of the fluctuating velocity components.
  • Higher peak-to-peak voltage output was seen when the PVDF-polymer configuration experienced large deflection deformed flapping mode at non-dimensional bending stiffness value of 0.21.
  • It is highly surprising that the voltage RMS contour in the wake of SD7003 airfoil shows distinct wake characteristics such as upper and lower surface shear layers and downwash angle. Higher voltage RMS values were observed in the upper surface shear layer wake when compared to the lower surface shear layer wake.
The increase in voltage output as well as the sensitivity of the sensor to the wake location and angle of attack changes in both NACA 0012 and SD7003 case shows that the inverted flag configuration can be used as an energy harvester as well as a sensor to detect changes in the wake signature.

Author Contributions

Conceptualization, S.G.; methodology, S.G. and G.R.; formal analysis, G.R.; investigation, S.G. and G.R.; resources, S.G.; data curation, S.G.; writing—original draft preparation, S.G.; writing—review and editing, S.G.; supervision, S.G.; funding acquisition, S.G.

Funding

The authors would like to thank the University of Dayton Research Institute (UDRI) for their partial funding of the research presented as well as the School of Engineering for funding the second author for Summer 2018 under the Summer Undergraduate Research Experience program.

Acknowledgments

The authors would like to acknowledge Timothy Reissman for his insight and advice regarding necessary circuits and electrical connections to obtain voltage output from the piezo embedded PVDF. The authors would also like to acknowledge Robert Lowe for his help and advice on polymer tensile testing at University of Dayton.

Conflicts of Interest

The authors declare no conflict of interest.

Abbreviations

The following abbreviations are used in this manuscript:
PVDFPolyvinylidene Difluoride
RMSRoot Mean Square
cChord Length (m)
x , y , z Coordinate System (m)
ρ Density (kg/m 3 )
U Freestream Velocity (m/s)
LMembrane Length (m)
tMembrane Thickness (m)
β Non-dimensional Bending Stiffness
AOscillation Amplitude (m)
fOscillation Frequency (Hz)
ν Poisson’s Ratio
u Streamwise Fluctuating Velocity (m/s)
U x Streamwise Velocity (m/s)
v Transverse Velocity Fluctuating (m/s)
VVoltage (V)
L 0 Wake Half Width (m)
EYoung’s Modulus (Pa)

References

  1. Joshi, D. Exploring the latest drone technology for commercial, industrial and military drone uses. Tech Insider, 13 July 2017. [Google Scholar]
  2. Flyntl, J. How Long Can a Drone Fly? 3D Insider, 28 August 2017. [Google Scholar]
  3. Schmidt, D.K. Stability augmentation and active flutter suppression of a flexible flying-wing drone. J. Guid. Control Dyn. 2016, 39, 409–422. [Google Scholar] [CrossRef]
  4. Yarusevych, S.; Sullivan, P.E.; Kawall, J.G. On vortex shedding from an airfoil in low-Reynolds-number flows. J. Fluid Mech. 2009, 632, 245–271. [Google Scholar] [CrossRef]
  5. Huang, R.F.; Lin, C.L. Vortex shedding and shear-layer instability of wing at low-Reynolds numbers. AIAA J. 1995, 33, 1398–1403. [Google Scholar] [CrossRef]
  6. Huang, R.F.; Lee, H.W. Turbulence effect on frequency characteristics of unsteady motions in wake of wing. AIAA J. 2000, 38, 87–94. [Google Scholar] [CrossRef]
  7. Guan, Y.; Pröbsting, S.; Stephens, D.; Gupta, A.; Morris, S.C. On the wake flow of asymmetrically beveled trailing edges. Exp. Fluids 2016, 57, 78. [Google Scholar] [CrossRef]
  8. Allen, J.; Smits, A. Energy harvesting eel. J. Fluids Struct. 2001, 15, 629–640. [Google Scholar] [CrossRef]
  9. Gilmanov, A.; Le, T.B.; Sotiropoulos, F. A numerical approach for simulating fluid structure interaction of flexible thin shells undergoing arbitrarily large deformations in complex domains. J. Comput. Phys. 2015, 300, 814–843. [Google Scholar] [CrossRef] [Green Version]
  10. Liou, W.; Pantula, S.; Liu, T.; Montefort, J.; Ludens, D. Flow past a cylinder with a flapping element attached to its end. In Proceedings of the 45th AIAA Aerospace Sciences Meeting and Exhibit, Reno, NV, USA, 8–11 January 2007; p. 1309. [Google Scholar]
  11. Stanewsky, E. Adaptive wing and flow control technology. Prog. Aerosp. Sci. 2001, 37, 583–667. [Google Scholar] [CrossRef]
  12. Neuhart, D.H.; Pendergraft, O.C., Jr. A Water Tunnel Study of Gurney Flaps; NASA Technical Report NASA-TM-4071; NASA: Washington, DC, USA, 1988.
  13. Jang, C.S.; Ross, J.C.; Cummings, R.M. Numerical investigation of an airfoil with a Gurney flap. Aircr. Des. 1998, 1, 75. [Google Scholar] [CrossRef]
  14. Storms, B.L.; Jang, C.S. Lift enhancement of an airfoil using a Gurney flap and vortex generators. J. Aircr. 1994, 31, 542–547. [Google Scholar] [CrossRef] [Green Version]
  15. Traub, L.W. Examination of Gurney Flap Pressure and Shedding Characteristics. J. Aircr. 2017, 54, 1990–1995. [Google Scholar] [CrossRef]
  16. Lee, H.T.; Kroo, I.; Bieniawski, S. Flutter suppression for high aspect ratio flexible wings using microflaps. In Proceedings of the 43rd AIAA/ASME/ASCE/AHS/ASC Structures, Structural Dynamics, and Materials Conference, Denver, CO, USA, 22–25 April 2002; p. 1717. [Google Scholar]
  17. Goza, A.; Colonius, T. A strongly-coupled immersed-boundary formulation for thin elastic structures. J. Comput. Phys. 2017, 336, 401–411. [Google Scholar] [CrossRef] [Green Version]
  18. Kim, D.; Cossé, J.; Cerdeira, C.H.; Gharib, M. Flapping dynamics of an inverted flag. J. Fluid Mech. 2013, 736. [Google Scholar] [CrossRef] [Green Version]
  19. Akcabay, D.T.; Young, Y.L. Hydroelastic response and energy harvesting potential of flexible piezoelectric beams in viscous flow. Phys. Fluids 2012, 24, 054106. [Google Scholar] [CrossRef]
  20. Gurugubelli, P.; Jaiman, R. Self-induced flapping dynamics of a flexible inverted foil in a uniform flow. J. Fluid Mech. 2015, 781, 657–694. [Google Scholar] [CrossRef]
  21. Annapureddy, S.; Acharya, S.; Gilmanov, A.; Stolarski, H. Experimental and Numerical Investigation of the Oscillation of an Inverted Flag; Tsfp Digital Library Online; Begel House Inc.: Danbury, CT, USA, 2017. [Google Scholar]
Figure 1. Estimated investment in drones in USD. As the need and application for drones increase over the years, the investment also increases [1].
Aerospace 06 00033 g001
Figure 2. Vortex shedding from trailing edge of NACA 0025 airfoil at Reynolds numbers of (a) 50,000 (b) 100,000 and (c) 150,000.
Aerospace 06 00033 g002
Figure 3. Geometry of oscillating membrane behind flat plate [8].
Aerospace 06 00033 g003
Figure 4. Comparison of the 1st and 2nd oscillation modes of the membrane in the wake of a square cylinder. Multiple parameters are responsible for changes in different modes of oscillations but the dominant being the material density [9].
Aerospace 06 00033 g004
Figure 5. A time lapse of the flag position of an inverted flag for different non-dimensional stiffness ( β ) at a Reynolds number of 200 [17].
Aerospace 06 00033 g005
Figure 6. Variation of (a) non-dimensional flapping amplitude (A) (b) non-dimensional flapping frequency (f) with stiffness of the flag.
Aerospace 06 00033 g006
Figure 7. Schematic of the University of Dayton low speed wind tunnel
Aerospace 06 00033 g007
Figure 8. Specifications of the piezo embedded PVDF material used in NACA 0012 and SD7003 cases.
Aerospace 06 00033 g008
Figure 9. Schematic of (a) side view; (b) top view of NACA 0012 wall-to-wall model test setup.
Aerospace 06 00033 g009
Figure 10. (a) Schematic of the SD7003 wall-to-wall model test setup; (b) picture of the test setup at UD-LSWT.
Aerospace 06 00033 g010
Figure 11. Downstream measurement grid locations in the wake of SD7003 wall-to-wall model.
Aerospace 06 00033 g011
Figure 12. Schematic and picture of the PIV test setup at UD-LSWT in the wake of NACA 0012 with and without piezo embedded PVDF.
Aerospace 06 00033 g012
Figure 13. Variation of non-dimensional bending stiffness as a function of freestream velocity.
Aerospace 06 00033 g013
Figure 14. Variation of (a) frequency and (b) amplitude of the PVDF oscillations with angle of attack at different downstream locations. The frequency increases with an increase in angle of attack, but the amplitude remains constant. However, both the frequency and the amplitude increase with increase in downstream distances.
Aerospace 06 00033 g014
Figure 15. (a) variation of PVDF oscillation frequency with angle of attack; (b) variation of amplitude of PVDF oscillation as a function of downstream distance.
Aerospace 06 00033 g015
Figure 16. Variation of PVDF oscillation frequency with angle of attack due to increase in coherent structures in the wake of NACA 0012 airfoil.
Aerospace 06 00033 g016
Figure 17. Momentum deficit contours in the wake of NACA 0012 airfoil with and without the inverted PVDF.
Aerospace 06 00033 g017
Figure 18. Momentum deficit contours in the wake of NACA 0012 airfoil with and without the inverted PVDF.
Aerospace 06 00033 g018
Figure 19. Momentum deficit profiles in the wake of NACA 0012 airfoil with and without PVDF at different angles of attack.
Aerospace 06 00033 g019
Figure 20. Two-point correlations of (streamwise fluctuating velocity component) in the wake of NACA 0012 with and without PVDF.
Aerospace 06 00033 g020
Figure 21. Two-point correlations of (transverse fluctuating velocity component) in the wake of NACA 0012 with and without PVDF.
Aerospace 06 00033 g021
Figure 22. Variation of PVDF-Polymer frequency and peak-to-peak voltage output from PVDF-Polymer combination as a function of non-dimensional bending stiffness β . The variation in the frequency and amplitude matches the trends shown in Figure 6.
Aerospace 06 00033 g022
Figure 23. Normalized Voltage RMS contours in the wake of SD7003 airfoil for multiple angles of attack. A surprising pattern in the voltage output was seen where V R M S increased in the upper surface shear layer and decreased in the lower surface shear layer.
Aerospace 06 00033 g023

