Abstract
Wind tunnel models are traditionally machined from high-quality metal material; this condition reduces the possibility to test different geometric variations or models as it corresponds to incremental cost. In the last decade, the quality of additive manufacturing techniques has been progressively increasing, while the cost has been decreasing. The utilization of 3D-printing techniques suggests the possibility to improve the cost, time, and flexibility of a wind tunnel model production. Possible disadvantages in terms of quality of the model finishing, stiffness, and geometric accuracy are investigated, to understand if the production technique is capable of providing a suitable test device. Additionally, pressure taps for steady surface pressure measurements are integrated during the printing procedure and the production of complex three-dimensional highly swept wings have been selected as targets. Computational fluid dynamics tools are exploited to confirm the experimental results in accordance with the best practice approaches characterizing flow patterns dominated by leading-edge vortices. The fidelity level of the experimental data for scientific research of the described flow fields is investigated. An insight of the most important guidelines and the possible improvements is provided as well as the main features of the approach.
1. Introduction
Additive manufacturing has been an innovative production technique introduced and has developed rapidly during the last years, opening new horizons in regards to the flexibility, complexity, and efficiency in the fabrication of prototypes. In the present work, the fused deposition modeling (FDM) prototyping technique is applied and investigated for the production of wind tunnel models with integrated pressure measurement taps. FDM offers the best compromise in terms of cost, printing time, and quality.
Wind tunnel models are routinely manufactured from steel or aluminum by means of Computer Numerical Control (CNC) machines, which involve significant production costs that increase for further geometrical complexities or additional production stages, e.g., the fabrication of pressure measurement taps. Additive manufacturing is commonly referred to as a “complexity for free” fabrication process [1,2], which means that additional geometrical complexity of the model brings no additional production cost. The cost is fixed by the weight of the product and the production process parameters. This is partially erroneous because additional complexity may result in additional building material requirements and time [3]. However, when compared to traditional fabrication processes, the increase in cost and time is negligible or widely favorable. This offers a great advantage to the production of single complex prototypes. The first investigations about rapid prototyping techniques for wind tunnel models were performed in 1998 by A. Springer [4], R. N. Chuk, and V. J. Thomson [5], pointing out the material strength of the plastic used in FDM techniques as a limitation. However, the authors highlighted the potential cost and time reduction of similar techniques. Hildebrand [6] proposed the usage of inner metal supports to improve the structural strength of the model. However, the pressure taps produced with FDM were not properly airtight. Aghanafi, in 2009 [7] and 2010 [8], compared rapidly prototyped models with traditional metal models, concluding that the accuracy was acceptable for a preliminary testing level but affected by reduced quality of roughness and precise geometry reproduction.
From a first evaluation of the methodology, the main limitations are confirmed but possibilities of improvement are recognized. Following an empiric direction, a series of test parts have been printed and investigated to understand the possibilities as regards geometrical and surface accuracy, stiffness and material strength, instrumentation procedure, and leakage of pressure measurement taps. Different parameters of the printing procedure are varied to converge to the best possible setup for full model production. In parallel, Computational Fluid Dynamics simulations are performed with the model geometry to study the flow feature and decide the positions of the pressure taps, so as to best capture the flow field of interest. For scientific research, experimental data is highly significant for validation of numerical results or extrapolation techniques to improve physical and statistical models. The production of large amounts of wind tunnel experimental data can be expensive for traditional models. The proposed method offers an attractive possibility to flank traditional models, to gather additional aerodynamic data with reduced cost.
The test cases chosen to evaluate the data by means of numerical simulations are delta wings, because the flow topology is challenging [9] and of great interest in aerodynamic research. A delta wing is characterized by a sweep angle higher than 45, at which, starting from small angles of attack, the flow cannot stay attached around the leading edge and separates in a vortex sheet, which rolls over the upper surface of the wing and creates a core of high axial and rotational velocities [10]. Around the inner core of this large-scale vortex, denoted as primary vortex, high tangential velocities increase the suction footprint on the wing surface. The flow below the vortex core in the outward direction provokes a secondary separation of the boundary layer, which rolls in a counter-rotating vortex, called a secondary vortex. Occasionally, a tertiary vortex can be generated with the same mechanism but induced now by the secondary one. The secondary vortex is also a source of limited additional suction and interacts with the main vortex. Delta wings show a nonlinear behavior of the lift coefficient over the angle of attack, because of the additional lift induced by the vortex footprint [9]. When the leading edge is sharp or has a relatively small radius, the vortex separates directly at the leading edge, and even at low angles of attack the vortex separation takes place along the whole extent of the leading edge, from the wing rear part to the apex. By increasing the angle of attack or reducing the sweep angle, the vortex becomes progressively more unstable, until a sudden instability occurs which is called vortex breakdown [9,11,12]. When vortex breakdown occurs, the structured type vortex degenerates into a chaotic and highly turbulent wake region, and the axial and rotational velocity are abruptly reduced as well as the suction footprint on the wing. Vortex breakdown prediction is crucial for the aerodynamic behavior of a delta wing, as it generates an immediate change in the forces acting on the planform. In addition, multiple vortices are present when the wing planform is composed by multiple sections with different sweep angles or leading-edge control surfaces. In this case, additional complexity characterizes the vortex flow field, as the vortices can interact and merge, and multiple breakdowns can take place.
The wind tunnel models investigated during this research are two sweep angle variations of a delta wing with deployed slat, namely, Model53 and Model56, with 53 and 56of sweep angle, respectively, as shown in Figure 1. The leading-edge radius, , of 1.2 mm is small enough for the wing to manifest a vortex separation along the whole length of the leading edge.
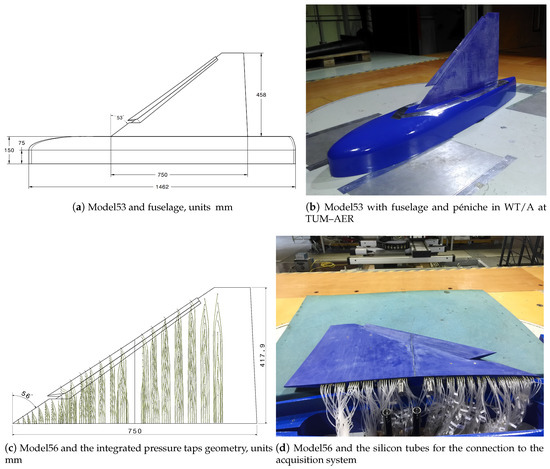
Figure 1.
Model53 and Model56 wind tunnel models
2. 3D–Printed Wind Tunnel Models
The investigated production technique is FDM, where polyactide (PLA) is used as filament with a diameter of mm. The utilized FDM printer during this reserach is the Raise3D N2-Plus™ [13] with PolyLite™ PLA from Polymaker [14]. PLA combines good mechanical properties and printing quality. Important mechanical properties of PLA are summarized in Table 1. Compared to different materials, e.g., ABS or PC, PLA allows easy handling during the FDM printer setup and deposition process. Four fundamental characteristics need to be achieved to consider the approach as valuable and relevant for research purposes:

Table 1.
Material properties of polyactide (PLA).
- Macroscopic geometric precision of the shape and outer surface.
- Microscopic geometric precision of the printed model surface roughness.
- Model stiffness and structural strength.
- Leakage level of the integrated tubes for steady pressure measurements.
The macroscopic geometry deviations are captured by comparing the original CAD geometry to the 3D-scanned printed model after production. The model is characterized by an anisotropic roughness that is dominant in the printing direction, along which the layers are deposited. The surface requires to undergo a sanding procedure to reduce the roughness. The process is investigated in order to obtain the best microscopic accuracy in comparison with traditional metal models. The stiffness of 3D-printed models is analyzed and an approach to increase the stiffness is presented. Furthermore, the model is produced with integrated pressure tubes for surface steady pressure measurements. The tubes are tested in order to find the entity of the pressure leakage and evaluate its impact on the pressure measurement quality. Several test parts have been designed, produced, and tested to investigate the dependence of the fundamental characteristics on the design and printing process parameters. The FDM parameters are set during the postprocessing of the slicer software, which reads the CAD file and returns a file as an output that is readable by the FDM printer. This output file contains the pattern of the extruder movement and all the parameters that handle print and bed temperature, speed, and several other options. Special attention is focused on the dependence of the leakage level to the slicer settings, as these where found to be a fundamental characteristic for the reduction of the pressure tap leakage. The minimization of the leakage level is obtained by the iterative production of sample parts with improved process or design parameters. The leakage values are measured for every test part prior to the wind tunnel measurements. A set of the guidelines for the design and the FDM parameters’ ranges and dependencies is established for future design and production tasks.
2.1. Steady Pressure Tap Leakage Analysis and Reduction
2.1.1. Error Estimation
The estimation of the error associated with leaking pressure taps during steady surface pressure wind tunnel measurement is presented. To perform this estimation, the leakage volume flow rate of the pressure taps needs to be determined. This has been done prior to wind tunnel testing. Each pressure tap has been statically tested by applying a certain pressure to the pressure tap while closing the surface hole. If leakage occurred, the leakage volume flow rate could be computed from the resulting pressure drop. This procedure has been performed for every test part prototyped in the iterative process of leakage analysis and optimization.
For the error estimation, the Bernoulli equation is employed in the y-direction, considering the case depicted in Figure 2, which shows a leaking pressure tap during wind tunnel measurement. The Bernoulli equation yields
where is the pressure embossed by the flow , the measured pressure, and v the velocity in the pressure taps induced by the leakage. The pressure, , is assumed to be constant as the pressure is permanently embossed by the flow. The pressure tap diameter at surface of the model is mm. The flow is incompressible and pressure losses for laminar flow are considered with the friction factor defined as
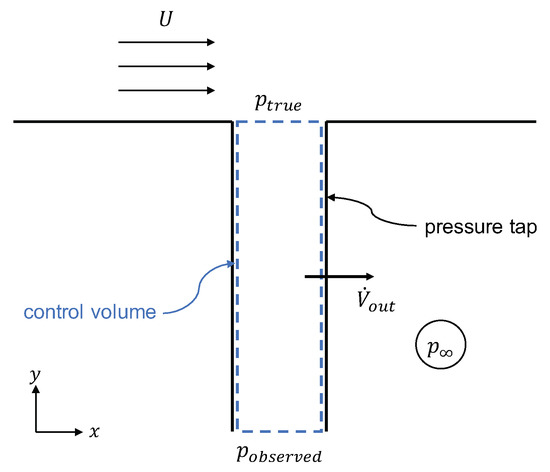
Figure 2.
Schematic drawing of the flow over a pressure hole with occurring leakage in the pressure tap.
The distribution of the outgoing volume flow rate of the pressure tap is not known. To depict the worst case scenario, it is assumed that the leakage occurs at the position farthest from the surface pressure tap. The sensitivity of the leakage to geometry changes and slicer setting variations are addressed in the following sections.
The velocity, v, inside the tap can be calculated with the known volume flow rate, , and the inner diameter, , of the pressure tap:
Equation (1) is rearranged with the pressure coefficient :
Equation (4) describes the pressure coefficient error due to the leakage of pressure taps. The error increases with decreasing pressure tap diameter, ; increasing pressure tap length, ; and increasing pressure tap velocity, .
2.1.2. Influence of Extruding Temperature
The influence of three extruding temperatures—C, C, and C—on the pressure tap leakage values is investigated. This temperature range is selected according to the lower and upper limiting extruding temperature specified by the material’s manufacturer. The performed investigations show that pressure tap leakage decreases with decreasing temperature (Figure 3). This can be explained with the higher viscosity of PLA extruded at lower temperatures. During the movement of the printer head, the filament slightly tends to decrease in local cross-sectional area due to shear stresses. With a lower printing temperature, and thus higher viscosity, the thinning of the filament is reduced, which results in a better adhesivity between the printed shells.
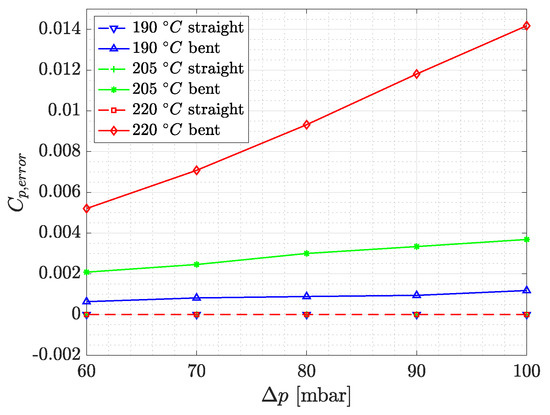
Figure 3.
against the pressure difference, , for a straight and bent pressure tap for different printing temperatures.
2.1.3. Influence of Wall Thickness
For the considered wind tunnel models, a maximum thickness of mm is chosen for the pressure tap walls. This value is considered a good compromise between the minimum distance of pressure taps and printing time. Figure 4 shows the due to leakage against the pressure difference for straight and bent pressure taps with different layer thicknesses. For wall thicknesses from 1.2 mm to mm, the leakage decreases with increasing wall thickness, as more shells offer support for the layers being printed in the bent region of the tap (Figure 5). The straight region of pressure taps are airtight for all considered wall thicknesses. However, completely straight pressure taps are not applicable to the complex geometries of the considered wind tunnel models.
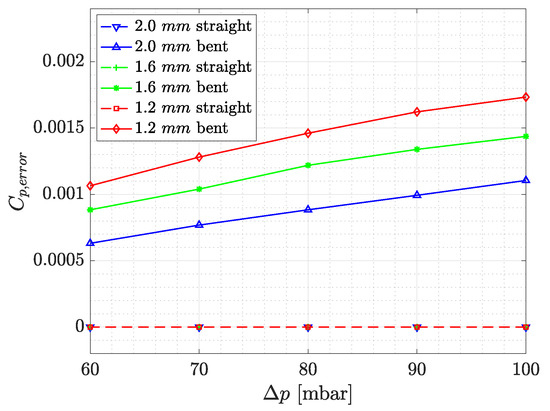
Figure 4.
against the pressure difference for a straight and bent pressure tap for different wall thicknesses.
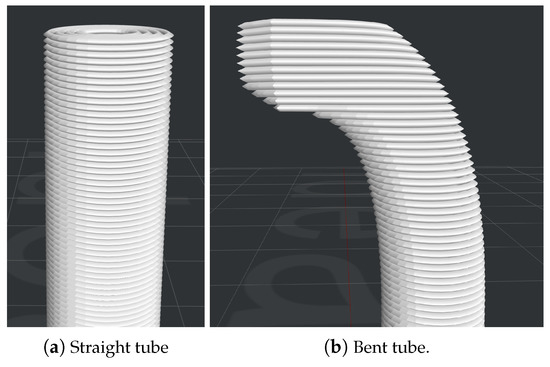
Figure 5.
Influence of curvature on the printed layers of a pressure tap.
2.1.4. Influence of Printing Speed
Figure 6 depicts the influence of printing speed on the shells around a pressure tap. If the printing speed is set too high, the extruder head cannot draw the shells around the tube precisely. Moreover, a higher printing velocity leads to increased necking of the filament being extruded. Therefore, gaps arise between the shells around the tube for higher printing speeds, such as 50 mm/s. On the contrary, the shells printed with 25 mm/s are properly connected with no gaps being visible which reduces the leakage flow rate.
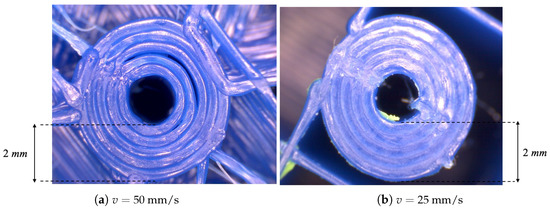
Figure 6.
Influence of printing speed on the shells quality and adhesivity around a tube.
2.1.5. Influence of Tube Wall Geometry
With regard to the FDM process, the layer deposition direction is inherently the best direction for a pressure tube to be aligned with, as shown in Figure 7, because of the higher overlapping precision of the circular shells, which enclose the pressure tube along the layers succession. As shown in Figure 4, the leakage volume flow rate is insignificant for straight tubes of any tested length. As soon as the curvature increases, to reach the surface perpendicularly, the alignment precision reduces and the probability of generating gaps between shells and layers increases (Figure 5). The first tube design iteration, shown in Figure 7a, has a relatively high leakage in the bent area, due to the low overlapping precision and the high probability of microscopical gaps generation between successive layers. Moreover, increased leakage is noticeable in the horizontal and highly curved segments near the wing surface. Therefore, different design iterations have been produced and tested to minimize the leakage value. The final tube wall design, Figure 7b, has a low curvature from bottom to top and a smoother transition to the smaller diameter near the wing surface with a minimum horizontal length.
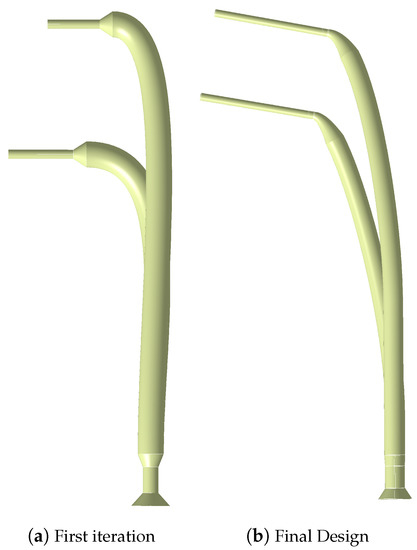
Figure 7.
Evolution of the tube wall geometry during leakage optimization.
2.1.6. Influence of Retraction Settings
Enabled retraction prevents the extruder from stringing by pulling the filament backwards into the nozzle before the extruder moves to a new location. As illustrated in Figure 8, stringing influences the shells around the tube by oozing plastic over the printed shell. By default, retraction inside the printed models is disabled for the slicer software. However, for parts where the inner structure is important, such as the considered wind tunnel models with pressure taps, retraction inside the model should be enabled. Figure 8 shows the effect of enabled and disabled retraction inside a part with two pressure taps.
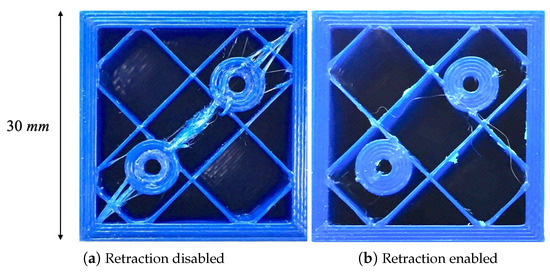
Figure 8.
Influence of retraction settings on pressure taps.
2.1.7. Conclusion
The leakage of 3D-printed parts incorporating pressure taps has been significantly reduced due to the optimization of the pressure tap geometry and the 3D-printing settings. Before the optimization, the resulting pressure coefficient error due to leakage has been . As a result of the leakage optimization, the error has been reduced by a factor of 300 to . This value is negligible compared to regular discrepancies between consecutive measurements registered for traditional metal models of similar configurations [15], which resulted between and .
2.2. Dimensional Accuracy
2.2.1. Macroscopic Accuracy
The macroscopic accuracy of 3D-printed models is determined by comparing the original CAD geometry to the equivalent 3D-scanned geometry. The considered geometry for this analysis is the Model53. The model is 3D-scanned after surface finishing, as well as before and after the wind tunnel campaign. The 3D-scanned geometry is shown in Figure 9a. The original CAD model of the wing is compared to the 3D-printed model by overlapping the CAD geometry to the 3D-scanned geometry, Figure 9b. The surfaces of the scanned and original geometry are overlapped in a way that the surfaces are coincident with a tolerance of 50 m. Areas with larger deviations can then be identified as brown regions visible in Figure 9b. For these regions, the mean deviation between the scanned and original geometry is mm. This value is smaller than the geometrical accuracy of the 3D scanner, that is, set to mm. Therefore, the accuracy of the 3D-printed Model53 is considered appropriate for wind tunnel models of the proposed fidelity. The biggest difference between 3D-scanned and the original geometry is observed at the trailing edge, with a maximum deviation of mm. This deviation results in a wing tip twist error of , which is considered acceptable.
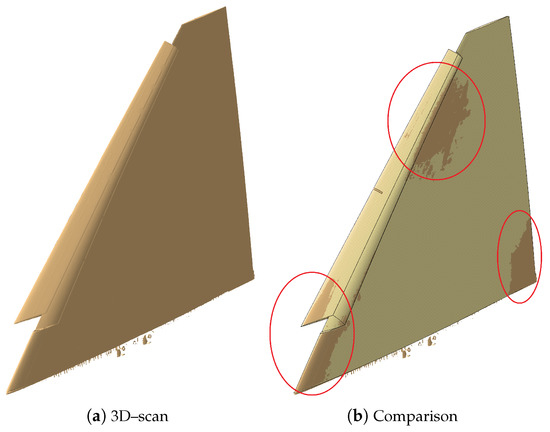
Figure 9.
Comparison of the 3D-scanned and the CAD geometry.
2.2.2. Microscopic Accuracy
In general, wind tunnel models have high demands on the surface roughness aiming for smooth surfaces. As 3D-printed parts are printed layer-by-layer, naturally higher surface roughness values are expected compared to conventional metal models, due to the small gaps that are present between the layers. To improve the surface roughness of 3D-printed wind tunnel models, the influence of sandpaper application to 3D-printed surfaces is investigated. The surface smoothness is determined with a portable profilometer, which employs a contact method for measuring the roughness by means of a stylus touching the surface of the sample along an arbitrary straight line. The resulting roughness parameters, and , of the 3D-printed model are compared to a state of the art metal wind tunnel model. Before sandpaper application, the value of the 3D-printed sample was determined to be m orthogonal and m parallel to the printed layers. The value was m orthogonal and m parallel to the printed layers. The effect of surface finishing is captured by monitoring the parameters and over the sanding cycles. The procedure has been performed manually. One sanding cycle is defined as a back-and-forth movement with the sanding paper over the surface, where a pressure of ~10 N is applied. After 200 sanding cycles, the roughness values are insensitive to additional cycles and converge to m and m. These values are significantly lower compared to the initial ones. Moreover, the roughness is isotropic after the procedure. Compared to the surface roughness parameters of a conventional state-of-art metal model with m and m, the value is three and the value is four times higher for the 3D-printed sample. In sum, the smoothness of 3D-printed models can be improved considerably with surface finishing and can reach a similar order of magnitude to conventional metal models.
2.3. Stiffness
The incorporation of metal inserts to the internal structure of 3D-printed parts offers the possibility of increasing the stiffness. To quantify and compare the stiffness of different 3D-printed configurations, an experimental set-up is established where a 3D-printed beam is fixed to a vise with weights applied to the free end of the beam. The weights are chosen so that a moment of Nm acts at the fixed end of the beam. This moment corresponds to twice the maximum moment that a comparable section would experience during low speed wind tunnel measurements at for the current wind tunnel models. By measuring the deflection at the tip of the beam under load, different beam configurations can be compared with each other.
Within the analysis, two 3D-printed beams with a length of 30 cm are considered, which are equal in terms of the outer geometry but are different in their internal structure. The outer geometry of the beam is shown in Figure 10c. For the analysis, a beam is considered with and without metal inserts in form of steel rods, see Figure 10a,b. The analysis showed that threaded rods decrease the deflection at the tip by a factor of approximately 3.8 from mm to mm. Therefore, the stiffness of 3D-printed wind tunnel models can be increased considerably with metal inserts, which consequently leads to less static deflection of the wing during wind tunnel measurements.
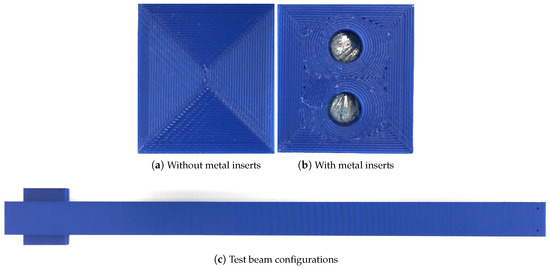
Figure 10.
Investigation of the stiffness of a test beam with and without metal inserts.
3. Wind Tunnel Experiments
3.1. Models and Production
The wind tunnel models considered for low speed wind tunnel measurements are Model53 and Model56. Model53 is a semi-span cropped delta wing with a leading-edge sweep angle of and the Model56 is a variation of the Model53 with an increased sweep angle of . Both models have a root chord length of m and are twisted by towards the wing tip. The leading-edge slat is deployed to , because such wing configuration is common for similar delta wing planforms at high angles of attack, at which the validation of the numerical solution of the vortex flow field acquires high relevance because of its complexity. The leading-edge radius for both configurations is small with a value of mm at the root chord. In order to reach the desired size of the wind tunnel model without exceeding the 3D-printers maximum build volume, each model is split at the of the root chord. Both parts are connected by four PLA prototyped rods and epoxy glue applied to the rods and contacting surfaces.
Model53 has 176 pressure taps distributed over 16 sections in the streamwise direction. All pressure taps are oriented normal to the wing surface with a diameter of mm at the surface. The taps are connected to the acquisition system by means of silicon tubes (Figure 1). With experience in the design and production of Model53, the Model56 production procedure has been refined with regard to the sanding and connection procedure. Furthermore, the positioning of the probes has been manually improved to fit more taps in the same amount of space. The number of pressure taps has been increased by over to 290 pressure taps distributed over 21 sections in streamwise direction, even though the wing area is smaller by . In addition, the pressure taps are positioned closer to the leading-edge compared to the Model53, which enables to resolve more details of developing vortices. This is a considerable advantage of 3D-printed wind tunnel models compared to traditional metal models in general, as it is complex to place pressure taps in the vicinity of the leading-edge for this kind of geometries. Furthermore, even if not necessary for the current wind velocity, initial tests have been performed for increasing the stiffness and strength of the model for supporting higher wind velocity. For this reason, the stiffness of the Model56 has been increased compared to the Model53 by incorporating metal inserts in the form of threaded rods, as well as by increasing the wall thickness.
3.2. Wind Tunnel Facility and Test Conditions
The facility used for the experiments is the wind tunnel W/T–A of the Technical University of Munich, Chair of Aerodynamics and Fluid Mechanics (TUM–AER) (Figure 11), which is a low-speed, Göttingen-type open-section wind tunnel. The dimensions are m × m × m (height × width × length). The freestream velocity can reach m/s, whereas the turbulence intensity level does not exceed . The temporal and spatial mean velocities have an uncertainty below , the freestream direction deviations are below , and static pressure varies at maximum by . The measurements for both models are taken at a Mach number, , of and a Reynolds number, , of based on the mean aerodynamic chord of m. The freestream velocity, , has been adjusted accordingly, in a range between 51 and 53 m/s, to compensate differences of the ambient temperature and pressure. The data compared with the numerical simulation for proving the proposed methodology are the surface steady pressure measurements. These data provide a direct insight into the vortex flow development by depicting the suction footprint induced by the vortices. Preliminary Computational Fluid Dynamics (CFD) simulations are performed with the goal of assessing position, number and resolution of the pressure taps. Furthermore, the possibility to print pressure taps close to the leading edge is tested as this is complicated to achieve with traditional metal models. Some pressure probes are also produced on the lower surface of the wing for monitoring the accuracy of the angle-of-attack positioning. In fact, the lower surface experiences attached flow for the complete angle-of-attack polar, resulting in numerical results suitable to be compared with a high fidelity level with the experimental results. An offset of the pressure level at the lower surface would give a first suggestion of a discrepancy in the experimental data or model positioning. We focus on the range of high angles of attack, which covers different conditions of the vortex development over the wing. For the angles of attack tested, no vortex interaction between the left and right sides is expected, thus a half wing configuration is chosen.
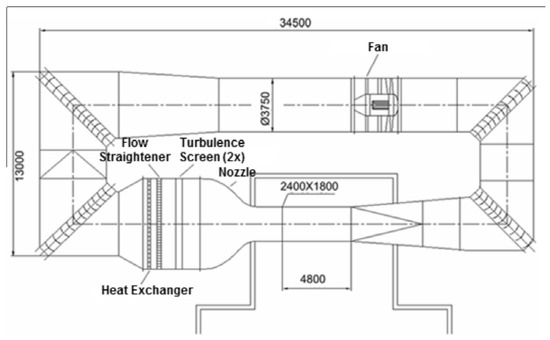
Figure 11.
W/T–A facility at Technical University of Munich, Chair of Aerodynamics and Fluid Mechanics (TUM–AER), units mm.
3.3. Fuselage and Péniche Design
As the flow enters the wind tunnel open section, a boundary layer develops on the floor and reaches a height of around mm in the proximity of the model. Therefore, the model needs to be mounted over a péniche to avoid any interactions with the vortex flow field of the boundary layer developing on the wind tunnel floor and the flow around the péniche. At first, a péniche is constructed by means of rapid prototyping. It consists of a mm high protrusion of the root aerodynamic profile in the direction perpendicular to the floor. However, preliminary test measurements with this configuration have shown that the vortex flow is influenced by the flow around the péniche already at moderate angles of attack. In particular, the separation position of the vortex at apex shows a deviation compared to numerical simulation, which is not associable with numerical discrepancies. To overcome this problem, a new mounting design has been studied. The wing is mounted on a generic fuselage provided with its own péniche (Figure 1). The péniche part is again 75 mm tall and allows avoidance of any influence with the boundary layer developed on the wind tunnel floor. Moreover, the generic fuselage is designed in order to provide an aligned flow when it encounters the apex of the wing and, therefore, to fix the onset of the vortex separation. With this solution it is possible to reduce the amount of uncertainties on the vortex flow evolution due to the model support.
Measurements Plan
The acquisition system used for the static pressure measurements is composed by three electronic scanning modules (Scanivalve ZOC33 [16]), which can capture a measurement range of maximum 345,000 Pa of pressure difference with a precision of above ± 17,000 Pa. The sampling rate of the pressure data acquisition consists of a frequency of 200 Hz, and an averaging time of 10 s is employed. The experiments are divided into a series of runs where every run corresponds to an angle-of-attack polar. The measurements are performed between 15 and 20 times depending on the angle of attack to verify their repeatability and, therefore, extract a relevant overview of the data consistency. Throughout the experiments, a very good repeatability is achieved for the pressure coefficient distribution (Figure 12). In conclusion, the repeatibility investigation (Table 2), for both Model53 and Model56, returns values that confirm the model suitability to subsonic experiments and suggest an appropriate level of data fidelity. This suggestion needs to be additionally proved by means of the comparison with CFD simulations. However, significant discrepancies are usually encountered for regions of the flow field, which are highly dominated by the large-scale vortex separation and development, in particular for high angles of attack. Therefore, the flow field portions that are not significantly affected by vortex breakdown and highly separating flows, which routinely return accurate results with the state-of-art methodologies for comparable flow typologies and conditions, are selected for estimating the data quality. In this regard, the initial structured part of the vortex, the inner part of the wing and the lower surface pressure are suitable examples of regions with low levels of numerical discrepancies. In order to properly compare fully-turbulent CFD simulations with the experimental results, a turbulent regime of the boundary layer needs to be assured during the wind tunnel testing. Therefore, trip dots are applied along a straight line for the whole leading-edge length on both upper and lower surfaces to force the transition position. This line connects the points at 5% of and at 9% of the wing tip length. The trip dots have a diameter of mm and a spacing equal to 50% of the diameter, as utilized for the trip dots configuration selected by Hövelmann [17,18,19] during his analysis of leading-edge roughness effects on the AVT-183 diamond wing configuration in the same wind tunnel at similar flow conditions.
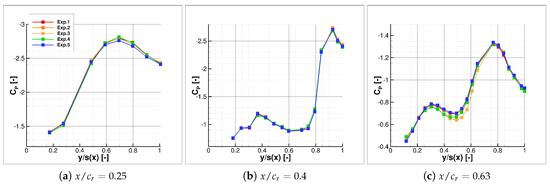
Figure 12.
Surface pressure coefficient distribution, , for repeated measurements against local semi-span at for Model56.
Table 2.
Mean absolute and standard deviation values of the variation of consecutive measurements of Models 53 and 56.
4. Numerical Results
4.1. Numerical Setup
The numerical simulations are performed with the DLR TAU-Code [20,21] which solves 3-D compressible steady or unsteady Reynolds-Averaged Navier–Stokes (RANS) equations on a cell-vertex finite volume discretization and is developed for high parallel efficiency on high-performance computers. Hybrid-unstructured grids have been used to combine the geometrical flexibility of unstructured grids during the mesh generation and the low dissipative behavior of prismatic grids for the boundary layer (Figure 13). The prism layers grid is constructed for a low- wall treatment, i.e., 1, to resolve the boundary layer.
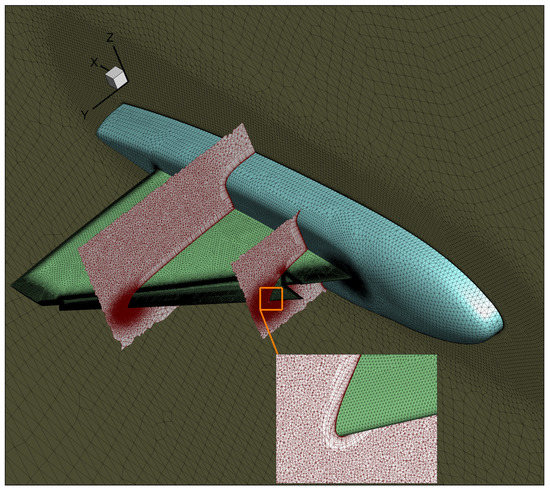
Figure 13.
Visualization of the hybrid-unstructured grid of 8.9 million points for the Model53.
In order to stabilize the solver, an implicit dual-time stepping approach is used. Multigrid relaxation with a Backward–Euler/LUSGS implicit smoother is chosen. An enhanced version of the Advection Upstream Splitting Method (AUSM) is employed which combines flux Difference and Vector splitting (AUSMDV). The simulations are performed with fully turbulent flow and the Spalart–Allmaras one-equation turbulence model [22] employing the Edwards modification [23] is used. In addition, to improve the vortex flow eddy–viscosity prediction, the Spalart and Shur [24] rotation correction is applied and compared to SAE and experiments. The flow domain is constructed in order to be consistent with the wind tunnel conditions, therefore a symmetry plane works as boundary condition parallel to the floor, positioned at m from the experimental setup in agreement with the boundary layer displacement thickness of m. The domain is enclosed in a hemisphere far-field boundary with a radius of 30 and centered in the wing apex.
4.2. Flow Field Description
The numerical solution is investigated to understand the occurrent vortex flow field. Figure 14 shows how the flow separates into the main first vortex at the apex of the wing. The separation onset is fixed at the apex at high angles of attack, whereas it moves downstream for lower ones. Furthermore, the deployed slat promotes the separation of a second vortex. The two vortices have different characteristics, as they separate at different positions and the local angle of attack relative to the slat is smaller due to its 20 deflection. At , only a weak separation is caused by the slat which does not result in a highly rotational vortex. However, at higher angles of attack, as shown for 25 in Figure 14, a second vortex separates around the slat. The two vortices interact as the first vortex axis is bent inboard in proximity of the slat vortex separation. The presence of two different types of vortices adds complexity to the turbulence modeling and the numerical simulation.
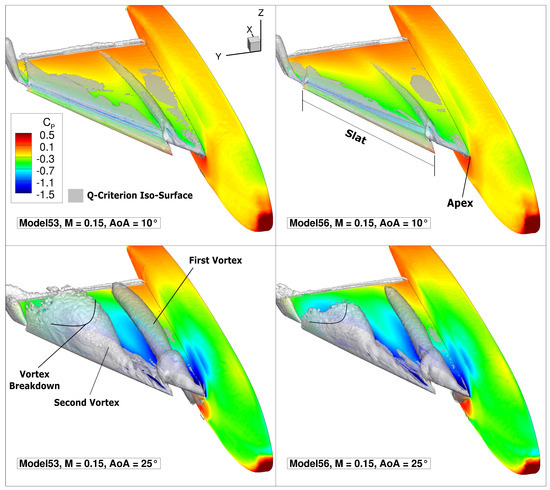
Figure 14.
Visualization of the vortical flow field by means of a Q-Criterion isosurface on Models 53 and 56 numerical simulations with the SAE turbulence model at = [10, 25]; showing also, the surface contour.
With regard to the sweep angle dependence, Figure 14 shows that with an increasing sweep angle, the vortices are more stable, which results in an upstream movement of the breakdown position. This phenomenon is clearly visible for the second vortex. The first vortex experiences a lower influence of the sweep angle variation. However, a consistent effect is present, as the higher swept wing causes a more stable vortex which evolves into a smaller vortex size. Therefore, a narrower suction footprint acts over the wing upper surface. The flow field is, therefore, consistent between the two models, but employs interesting dependencies on the geometrical variation and consists of a relevant example on how the proposed production approach is usable to investigate different planform or geometrical configurations for complex test cases.
4.3. Comparison with Experiments
A comparison of the results of the numerical simulations with the experimental data is carried out, to prove the quality of the rapid prototyped models and is performed by comparing the surface distribution. In this phase, it is fundamental to distinguish which local errors of the pressure distribution are identifiable as turbulence model discrepancies for highly rotating flows like vortices. A complete investigation of the turbulence model discrepancies would require the resolving of smaller scales by means of Detached Eddy Simulations or Large Eddy Simulations approaches; however, the exact quantification of the turbulence modeling discrepancies is out of the scope of the current study. Therefore, the application of the rotation correction employed by the SARC model, and its comparison to the standard turbulence model, provides important information about the sensitivity of the local values to the turbulence model and permit the identification of the zones with high dependence on the turbulence model. In this sense, it is expected to have higher discrepancies in the representation of the vortex suction peaks and the vortex breakdown predictions.
The comparison of the surface pressure coefficient distribution between the conducted experiments and numerical computations is presented subsequently for Model53 and Model56. Two angles of attack, and , have been chosen as representative for different leading-edge development stages. The surface pressure coefficient distribution along the local semi-span is shown for three sections at approximately 10%, 32%, and 73% of , see Figure 15 and Figure 16.
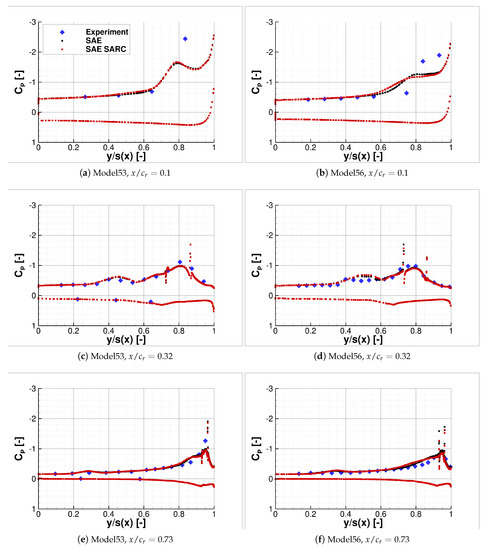
Figure 15.
Surface pressure coefficient distribution against local semi-span at for Model53 and Model56.
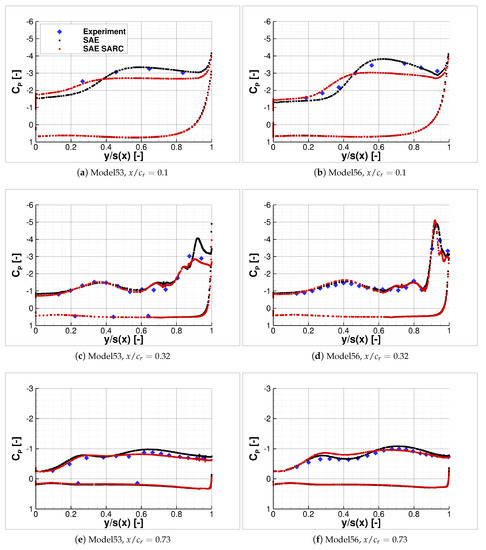
Figure 16.
Surface pressure coefficient distribution against local semi-span at for the Model53 and Model56.
A very good agreement between experiment and CFD can be observed for the Model53 and Model56 configuration at and = 0.32 and 0.73. The pressure coefficient values and distribution coincide well for both the suction and pressure side of the wing. This confirms the results of the model production which show good accuracy and negligible pressure tap leakage of the 3D-printed model. Larger deviations are present near the apex at = 0.10, since the flow separation occurs slightly further upstream in the CFD computations compared to the experiment. Concerning the SAE and SARC turbulence model only minor differences are visible, which indicates a low sensitivity to the turbulence model at .
Similarly to , the surface pressure coefficient distribution coincides very well between the experiment and CFD at . A higher sensitivity for turbulence model variations can be seen at the higher angle of attack of . The standard SAE model provides results near the apex, which are closer to the experimental data for both configurations. Further downstream, however, the results of the SARC model coincide better with the experimental data for a sweep angle of , as the breakdown of the slat vortex is captured more accurately. For the higher swept Model56 wing, vortex breakdown is shifted to higher angles of attack. Therefore, the standard SAE model predicts the pressure distribution more accurately for the Model56 at .
The fidelity of the experimental data is therefore confirmed and suggests high potential to further utilize the proposed model approach for new relevant data.
5. Conclusions
The possibility to extend the envelope of experimental data for geometric variations of a baseline test case has been investigated. The objective is a parallel methodology to traditional metal models at lower cost and production time that provides additional data with suitable fidelity for the design and/or the development phase of an aircraft. The production of wind tunnel models by means of additive manufacturing has been investigated. The Fused Deposition Modeling process using polyactide as material is employed. Integrated pressure taps for surface steady pressure measurements are integrated in the model. The geometry considered is a generic delta wing with a slat deployed and two sweep angle variations, indicated by the names Model53 and Model56. The leakage through the pressure tubes due to the presence of microscopical gaps between layers of deposited polyactide is minimized by means of the adjustment of the prototyping parameters and geometrical improvement of the pressure tubes. Eventually, the error induced by the leakage level is negligible for steady surface pressure measurements. The experimental data are compared with numerical simulations and the accuracy grade is appropriate, confirming the fidelity of the method. The highest discrepancies are present where the turbulence models have their major accuracy limitations. The geometric and structural quality of the models is also investigated in terms of surface finishing, structural resistance, pressure tap geometry and optimization of the 3D-printer parameters. The model has shown to be suitable for low-speed, fully turbulent wind tunnel experiments, and the gathered experience permits to further improve iteratively the model production, instrumentation, and quality. Future work will include the production of new models of higher geometrical complexity, the improvement of structural resistance for higher wind tunnel speeds by means of additional inner metal structures, and the production of full model geometries.
Author Contributions
Conceptualization, K.S.; Data curation, M.M.; Formal analysis, C.B.; Investigation, M.M. and C.R.; Methodology, M.M., C.R. and K.S.; Resources, K.S. and C.B.; Supervision, K.S. and C.B.; Validation, M.M., C.R., K.S. and C.B.; Visualization, C.R.; Writing – original draft, M.M. and C.R.; Writing – review & editing, M.M.
Funding
This research was funded by the German Federal Ministry for Economic Affairs and Energy (BMWi), LUFO v2 project VitAM/VitaMinABC, grant number KFZ: 20A1504C.
Acknowledgments
The support of this investigation by Airbus Defence and Space within the LUFO v2 project VitAM/VitaMInABC (Virtual Aircraft Model for the Industrial Assessment of Blended Wing Body Controllability, KFZ: 20A1504C), partially funded by the German Federal Ministry for Economic Affairs and Energy (BMWi), is gratefully acknowledged. The authors thank the German Aerospace Center (DLR) for providing the DLR TAU-Code used for the numerical investigations and the Gauss Centre for Supercomputing e.V. (www.gauss-centre.eu) for funding this project by providing computing time on the GCS Supercomputer SuperMUC at Leibniz Supercomputing Center (LRZ, www.lrz.de). Furthermore, the authors gratefully acknowledge Gerard Gallagher for contributing to the research within his Master thesis.
Conflicts of Interest
The authors declare no conflicts of interest.
Nomenclature
| Pressure coefficient | |
| d | Diameter, m |
| Root chord, m | |
| Mean aerodynamic chord, m | |
| M | Mach number |
| p | Pressure, Pa |
| Leading–edge radius, m | |
| Reynolds number | |
| Velocity components, m/s | |
| Free stream velocity, m/s | |
| T | Temperature, K |
| V | Volume, |
| Cartesian coordinates, m | |
| Dimensionless wall distance | |
| Angle of attack, | |
| Boundary layer height, m | |
| Dynamic viscosity, Kg/(ms) | |
| Kinematic viscosity, | |
| Density, | |
| Leading–edge sweep angle, | |
| Friction factor | |
| Arithmetical mean deviation of the assessed profile, m | |
| Average distance between the highest peak and lowest valley in each sampling length, m |
Abbreviations
The following abbreviations are used in this manuscript.
| TUM–AER | Technical University of Munich, Chair of Aerodynamics and Fluid Mechanics |
| W/T–A | Wind tunnel A |
| PLA | Polyactide |
| FDM | Fused Deposition Modeling |
| ABS | Acrylonitrile butadiene styrene |
| PC | Polycarbonate |
| RANS | Reynolds-Averaged Navier–Stokes |
| CFD | Computational Fluid Dynamics |
References
- Hague, R.; Campbell, R.I.; Dickens, P. Implications on design of rapid manufacturing. Proc. Inst. Mech. Eng. Part C J. Mech. Eng. Sci. 2003, 217, 25–30. [Google Scholar] [CrossRef]
- Kirchheim, A.; Dennig, H.; Zumofen, L. Why education and training in the field of additive manufacturing is a necessity. In Proceedings of the International Conference on Additive Manufacturing in Products and Applications, Zurich, Switzerland, 13–15 September 2017; pp. 329–336. [Google Scholar]
- Pradel, P.; Bibb, R.; Zhu, Z.; Moultrie, J. Complexity is not for free: the impact of component complexity on additive manufacturing build time. In Proceedings of the Rapid Design, Prototyping and Manufacturing Conference (RDPM2017), Newcastle, UK, 27–28 April 2017. [Google Scholar]
- Springer, A. Evaluating aerodynamic characteristics of wind-tunnel models produced by rapid prototyping methods. J. Spacecr. Rocket. 1998, 35, 755–759. [Google Scholar] [CrossRef]
- Chuk, R.N.; Thomson, V.J. A comparison of rapid prototyping techniques used for wind tunnel model fabrication. Rapid Prototyp. J. 1998, 4, 185–196. [Google Scholar] [CrossRef]
- Hildebrand, R.J.; Eidson, R.C.; Tyler, C. Development of a low cost, rapid prototyped lambda wing-body wind tunnel model. In Proceedings of the 21st AIAA Applied Aerodynamics Conference 2003, Orlando, FL, USA, 23–26 June 2003; p. 3818. [Google Scholar]
- Aghanajafi, C.; Daneshmand, S.; Nadooshan, A.A. Influence of layer thickness on the design of rapid-prototyped models. J. Aircr. 2009, 46, 981–987. [Google Scholar] [CrossRef]
- Aghanajafi, C.; Daneshmand, S. Integration of three-dimensional printing technology for wind-tunnel model fabrication. J. Aircr. 2010, 47, 2130–2135. [Google Scholar] [CrossRef]
- Breitsamter, C. Unsteady flow phenomena associated with leading-edge vortices. Progr. Aerosp. Sci. 2008, 44, 48–65. [Google Scholar] [CrossRef]
- Hummel, D. Experimental investigation of the flow on the suction side of a thin delta wing. Z. Flugwiss. 1965, 13, 247–252. [Google Scholar]
- Hall, M.G. Vortex Breakdown. Annu. Rev. Fluid Mech. 1972, 4, 195–218. [Google Scholar] [CrossRef]
- Wentz, W.H.; Kohlman, D.L. Wind Tunnel Investigations of Vortex Breakdown on Slender Sharp–Edged Wings; NASA-CR-98737, FRL-68-013; University of Kansas Center of Research, Inc., Engineering Sciences Division: Lawrence, KS, USA, 1968. [Google Scholar]
- Raise3D Pioneering Flexible Manufacturing, Raise3D N2-Plus™. Available online: https://www.raise3d.com/pages/raise3d-n2-plus (accessed on 30 September 2019).
- Polymaker, PolyLite™ PLA. Available online: https://eu.polymaker.com/product/polylite-pla/ (accessed on 30 September 2019).
- Hövelmann, A. Analysis and Control of Partly-Developed Leading-Edge Vortices. Ph.D. Thesis, Technische Universität München, Munich, Germany, 2016. [Google Scholar]
- Scanivalve, ZOC33 miniature pressure scanner. Available online: http://scanivalve.com/media/28028/zoc33_1603.pdf (accessed on 30 September 2019).
- Buzica, A.; Debschütz, L.; Knoth, F.; Breitsamter, C. Leading-edge roughness affecting diamond-wing aerodynamic characteristics. Aerospace 2018, 5, 98. [Google Scholar] [CrossRef]
- Hövelmann, A.; Knoth, F.; Breitsamter, C. Leading–edge roughness effects on the flow separation onset of the AVT-183 diamond wing configuration. In Proceedings of the 53rd AIAA Aerospace Sciences Meeting, Kissimmee, FL, USA, 5–9 January 2015; p. 0063. [Google Scholar]
- Hövelmann, A.; Knoth, F.; Breitsamter, C. AVT-183 diamond wing flow field characteristics Part 1: Varying leading-edge roughness and the effects on flow separation onset. Aerosp. Sci. Technol. 2015, 57, 18–30. [Google Scholar] [CrossRef]
- Galle, M.; Evans, J.; Gerhold, T. Technical Documentation of the DLR [Tau]–Code; DLR, Inst. für Strömungsmechanik: Göttingen, Germany, 1997. [Google Scholar]
- TAU-Code User Guide; Release 2018.1.0; DLR Institute of Aerodynamics and Flow Technology: Göttingen, Germany, 2018.
- Spalart, P.R.; Allmaras, S.R. A One–Equation Turbulence Model for Aerodynamic Flows. In Proceedings of the 30th Aerospace Sciences Meeting and Exhibit, Reno, NV, USA, 6–9 January 1992; p. 439. [Google Scholar]
- Edwards, J.R.; Chandra, S. Comparison of eddy viscosity–transport turbulence models for three–dimensional, shock–separated flowfields. AIAA J. 1996, 34, 756–763. [Google Scholar] [CrossRef]
- Shur, M.L.; Strelets, M.K.; Travin, A.K.; Spalart, P.R. Turbulence modeling in rotating and curved channels: Assessing the spalart–shur correction. AIAA J. 2000, 38, 784–792. [Google Scholar] [CrossRef]
© 2019 by the authors. Licensee MDPI, Basel, Switzerland. This article is an open access article distributed under the terms and conditions of the Creative Commons Attribution (CC BY) license (http://creativecommons.org/licenses/by/4.0/).