1. Introduction
The superior energy density of hydrocarbon fuel make them a favorite technology for aircraft propulsion and mobility, in general. However, an ever-increasing interest in the electric systems is encouraged by the remarkable benefits of this technology, such as high power-to-weight ratio, efficiency, reliability, compactness, quietness, and, above all, elimination of local pollutant emissions.
Electrification began to take part in the aerospace industry, first, with the More Electric Aircraft (MEA) concept. Then, electric powertrains were introduced also for propulsive purposes, with hybrid-electric propulsion systems as a mid-term solution to improve the overall fuel economy and reduce the environmental impact. A good review of technologies for hybrid electric aircraft can be found in [
1]. The growing interest in this field is attested for by the ever-increasing number of studies concerning the electrification or hybridization of existing power systems, such as that in Reference [
2], regarding the hybridization of an existing General Aviation (GA) aircraft. However, technical barriers prevent full-electric propulsion systems to reach values of energy storage density (and, therefore, endurance) comparable with hydrocarbon fuel. For this reason, pure-electric propulsion is still considered unconceivable for large aircraft, such as commercial planes, unless new technologies are developed for batteries. On the contrary, it is more and more frequently used as the aerial vehicle size has been decreasing [
3]. However, a study by NASA [
4] puts into evidence how the integration between the electric propulsion and vehicle systems has its advantages, also with the existing battery technology. Moreover, new technologies like the multi-functionalization of composite materials [
5] might lead to further benefits resulting from the synergy between the structure and the propulsion.
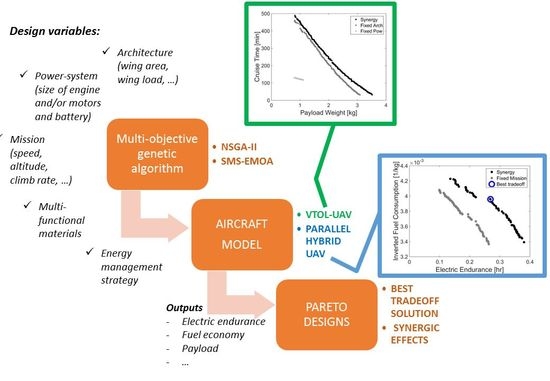
To the authors’ knowledge, none of the aircraft design procedures presented in the literature, even for the advanced power systems, take into account the synergic effects of architecture, size of the engine, and the electric components, energy management strategy, mission specification, etc., by using, moreover, existing technologies for batteries. Therefore, the main goal of this investigation was to present a comprehensive methodology for the design of electric and hybrid electric aircraft power systems, based on multi-objective optimization algorithms and backward simulations. The proposed method is explained briefly in
Section 2 and has been applied to two test cases (
Section 3 and
Section 4) to show how the performance of complex power systems can be strongly improved by exploiting the synergic effects.
The first test case takes inspiration from a study by Aksugur et al. [
6], which proposes a pure-electric, propeller-ducted, fan propulsion system to be used as powertrain on a tail-sitter Vertical Take-off and Landing Unmanned Aerial Vehicle (VTOL-UAV). Aksugur et al. [
6] selected a propulsion system, a priori, and then completed the UAV design by optimizing four aircraft design parameters. In this investigation, we considered the same UAV, with the same kind of all-electric hybrid propulsion system, but performed optimization of the propulsive units, together with the aircraft architecture. Moreover, further advantages from the structural integration and multi-functionalization were addressed through a survey of the battery integration technologies proposed in the literature. The synergy between the aircraft power system and the flight profile was not addressed in this first test case, as the VTOL-UAV was used for surveillance missions, without a well-defined and repeatable flight profile.
The second problem considered in this study concerned the optimization of both the hybrid electric power system and the mission profile specifications for a Medium-Altitude Long-Endurance Unmanned Aerial Vehicle (MALE-UAV) [
7]. This time, the synergy investigated was between the flight mission profile and the aircraft powertrain. The MALE-UAV considered here had a larger size than the first one and required a longer endurance, which made it unsuitable for a full-electric power system. In the case of hybrid electric power systems, a further degree of freedom was represented by the energy management strategy, i.e., by the specific usage of battery and fuel during the mission, which, in turn, depended on the sizing of batteries, engines, and electric machines. In the present investigation, a rule-based technique was implemented to select the usage of the battery in the different phases of flight, but the rules were optimized, together, with the other design parameters.
As for the optimization algorithm, after an analysis of their performance, the authors selected Non-dominated Sorting Genetic Algorithm-II (NSGA-II) [
8] and S-Metric Selection Evolutionary Multiobjective Algorithm (SMS-EMOA) [
9] for Test Cases 1 and 2, respectively. Another novelty in the approach proposed here, is the choice of the better algorithm for each test case, according to the nature of the optimization problem, in particular the multi-modality of the Pareto Front. The results presented here are part of a larger study on the performance of different evolutionary algorithms over a series of mathematical and engineering optimization problems but, unlike previous studies, this paper focused on the results of the optimization in the aeronautical field.
2. Methodology
The large number of design parameters and goals needed to exploit synergy in electric and hybrid electric power system, calls for the usage of simplified simulation approaches and appropriate optimization tools.
In the proposed methodology, a backward simulation approach is used. This means that the starting point is the request of propulsive power to fly the aircraft. This information is “worked backward” through the components of the power system and the conversion efficiency of the overall powertrain is obtained by multiplying the efficiency of the components in the series. The power request is appropriately split in case of the components, in parallel (Test Case 2). In this way, it is possible to estimate the overall usage of fuel or electricity.
To implement this method and to include the size of the components in the optimization, scalable and composable sub-models are needed for each component [
10]. The efficiency of each element can be calculated, either by the average point method or by a quasi-static approach, as explained by Guzzella et al. [
10]. In the first approach, the working points of the power system, along a mission, are lumped into a single representative average operating point. This approach is suitable for a simple power system like the one considered in Test Case 1, while it cannot be used for a hybrid electric power system, as in Test Case 2. In fact, a hybrid electric power system relies on a specific energy management strategy that cannot be taken into account in the average point method. For this reason, the power system of Test Case 2 was simulated with a quasi-static approach, where the aircraft mission was discretized as a time sequence of operating points. For each point, the consumption of energy was calculated, as before, but was dependent on the energy management strategy. The utilization of energy at each time step was then integrated, over the mission, to obtain the deployment of fuel or electricity. The amount of charge in the battery, the available fuel, and the weight of the aircraft were updated at each time step. Using this simulation approach, with a suitable time step, it was possible to take into account a series of time-dependent variable like, for example, the voltage of the battery as a function of its state of charge. Of course, the required computational time was much higher than that in the average operating point and this made the use of a heuristic optimization method, mandatory, for the analysis of synergies.
In this investigation, evolutionary algorithms (EAs) were selected because of their ability to address multi-objective optimizations. Among the EAs analyzed by the authors for constrained optimization problems [
11,
12], SMS-EMOA [
9] was found to the best method in all cases, except when the objective functions showed a strong multimodality. In this case, NSGA-II (Non-dominated Sorting Genetic Algorithm-II) [
8] was the best. Therefore, before applying the proposed methodology, the multimodality of the objective functions was checked, for each test case.
The last aspect of the methodology to be clarified was how the synergies were quantified. For each test case, this was performed in three steps:
The design variables were grouped according to their role (mission, powertrain, architecture, etc.);
Optimization runs were performed by considering (as design parameters) the variables of a group, while using an arbitrary setting for all other parameters;
The Pareto fronts of the optimization runs and Point 2 were compared with the results of a “synergy” optimization, where the design parameters of all groups were optimized in a single run.
Of course, the accuracy of the results depends on the correctness of the models. The test cases presented were not aimed at the design of a specific power system but only at presenting the proposed methodology. Therefore, we chose models that could guarantee a compromise between accuracy and a reduced computational time.
3. Test Case 1: The VTOL-UAV
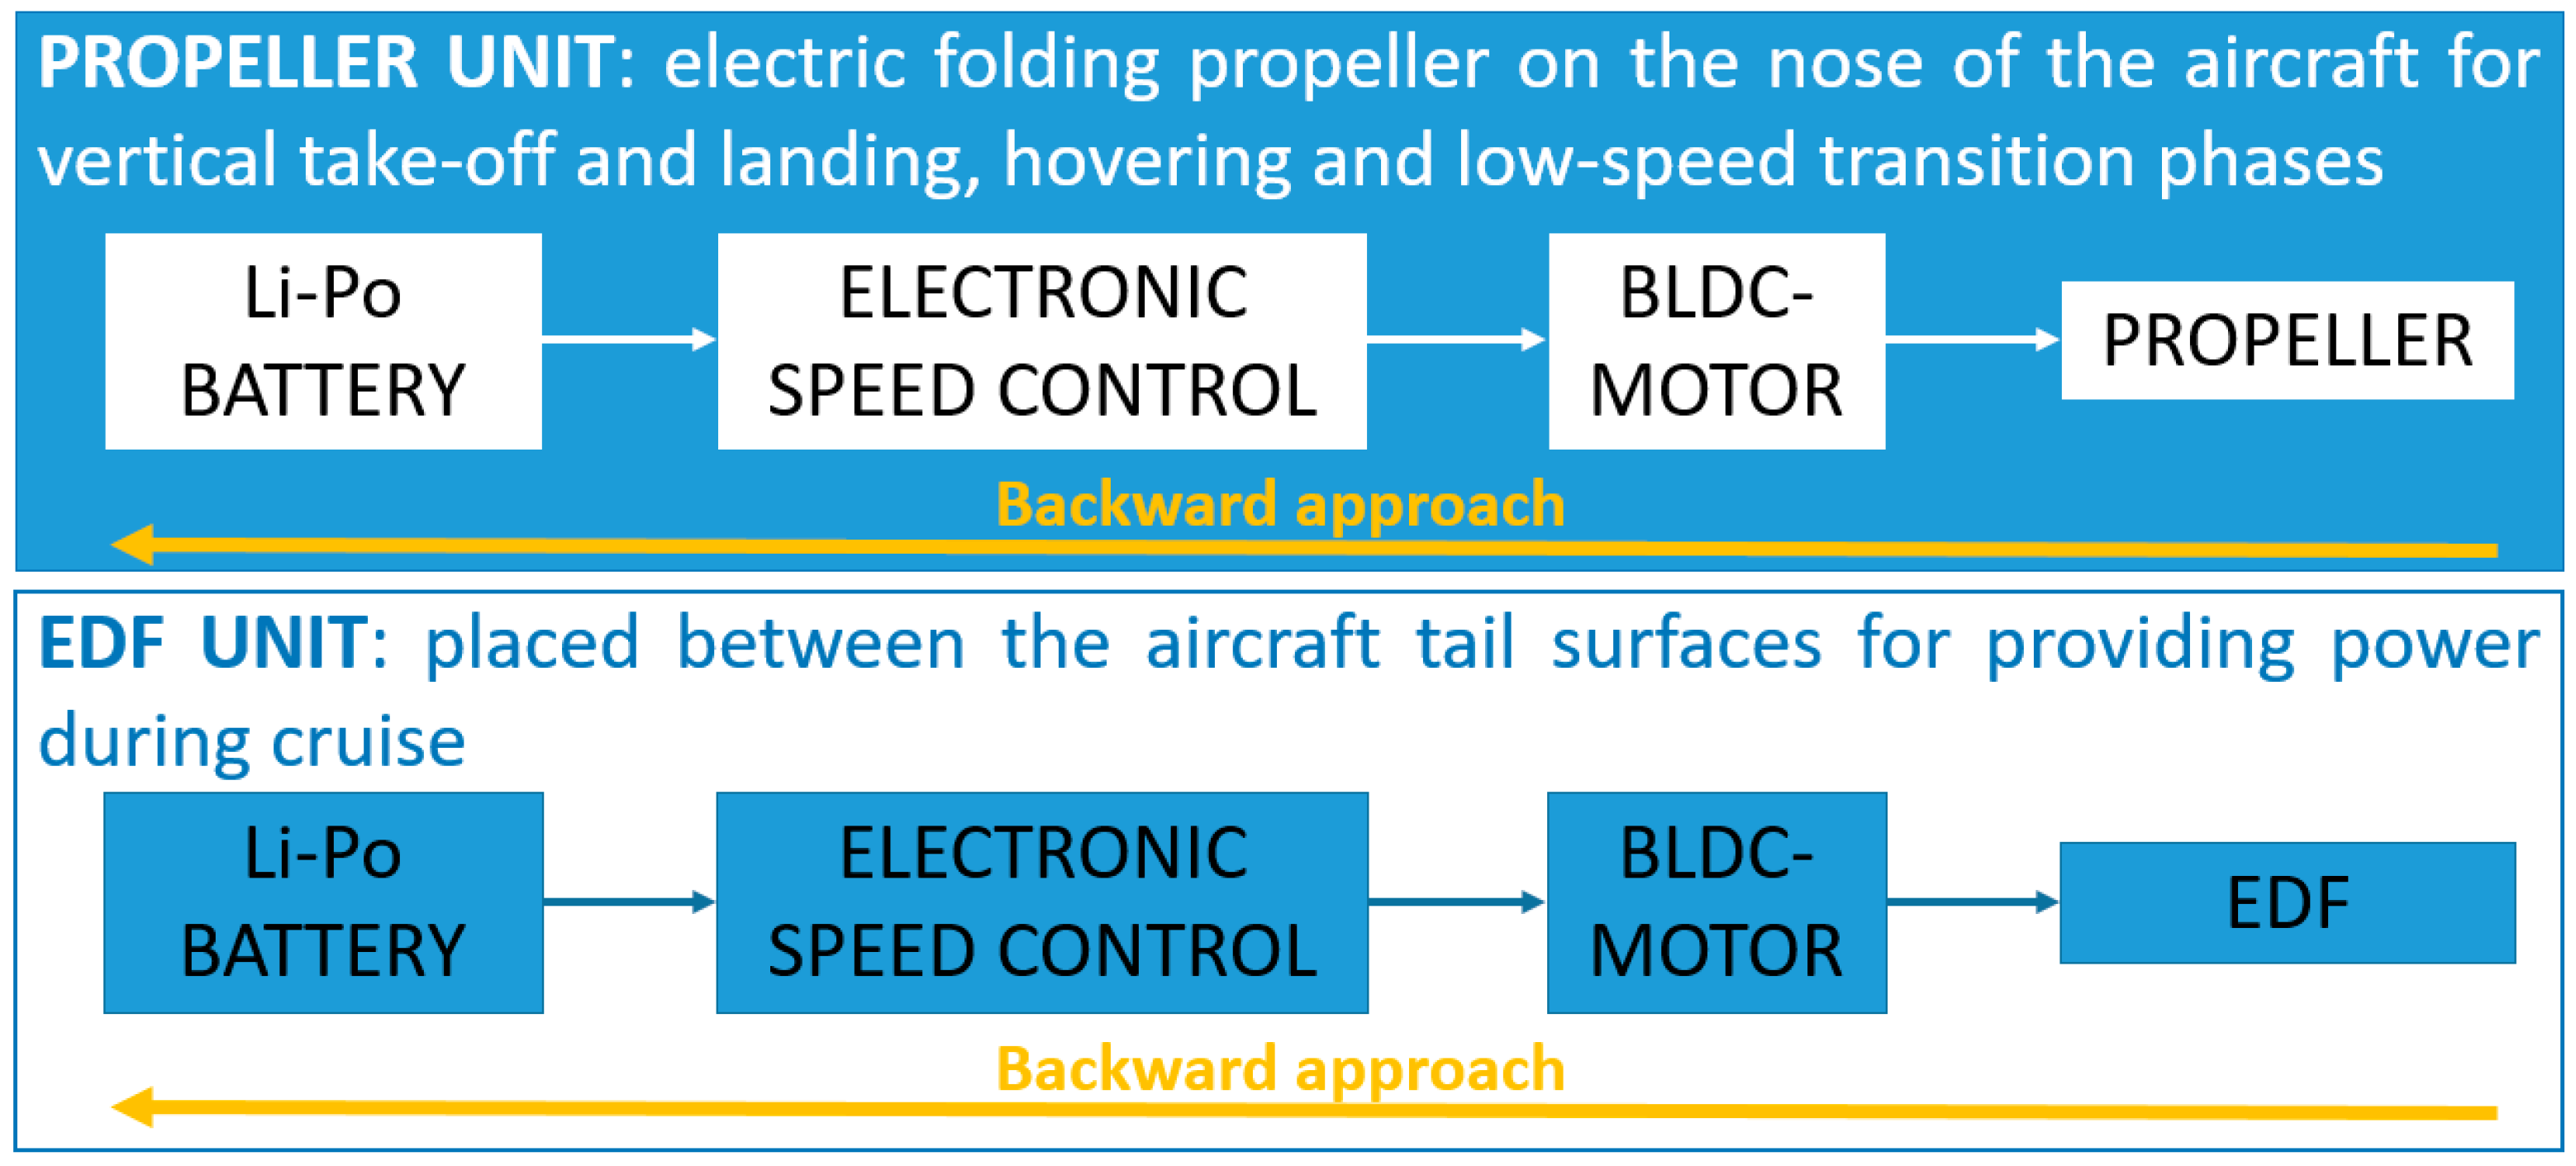
The UAV of the first case was an all-electric aerial vehicle. An electric folding propeller was installed on the nose of the aircraft and used for vertical take-off and landing, hovering, and low-speed transition mode phases. While, an Electric Ducted-Fan (EDF) unit was placed between the aircraft tail surfaces, for providing power, during cruise. Both propulsion units consisted of a battery, an electronic speed control (ESC), and a motor. The operational requirements of the UAV were kept constant and are shown in
Table 1.
The optimization problem can be formalized as follows:
The VTOL-UAV model is presented in
Section 3.1. It had a dual-objective optimization, with payload weight (
) and cruise time (
) as cost functions. Note that the proposed method belongs to the case of “simulation optimization”, i.e., the objective functions were calculated through a simulation code.
The design variable vector
included the fourteen variables reported in
Table 2, together with their lower and upper bounds. Note that the first four variables defined the group related to the architecture. They were the same as those considered in a study by Aksugur et al. [
6], from which the test case was derived. The remaining ten design variables were included to the “powertrain” group, as they characterize the size and operating values of the different components of the power system.
Note, also, the large number of constrains that ensured the results to be physically sensible and geometrically feasible, by checking the value of a series of variables, are explained in the section on nomenclature. Other technical limitations to be satisfied in terms of voltage, current, and torque of the electrical devices, and tip speed of the blades were also considered.
The optimization tool used for this problem was NSGA-II (Non-dominated Sorting Genetic Algorithm-II) [
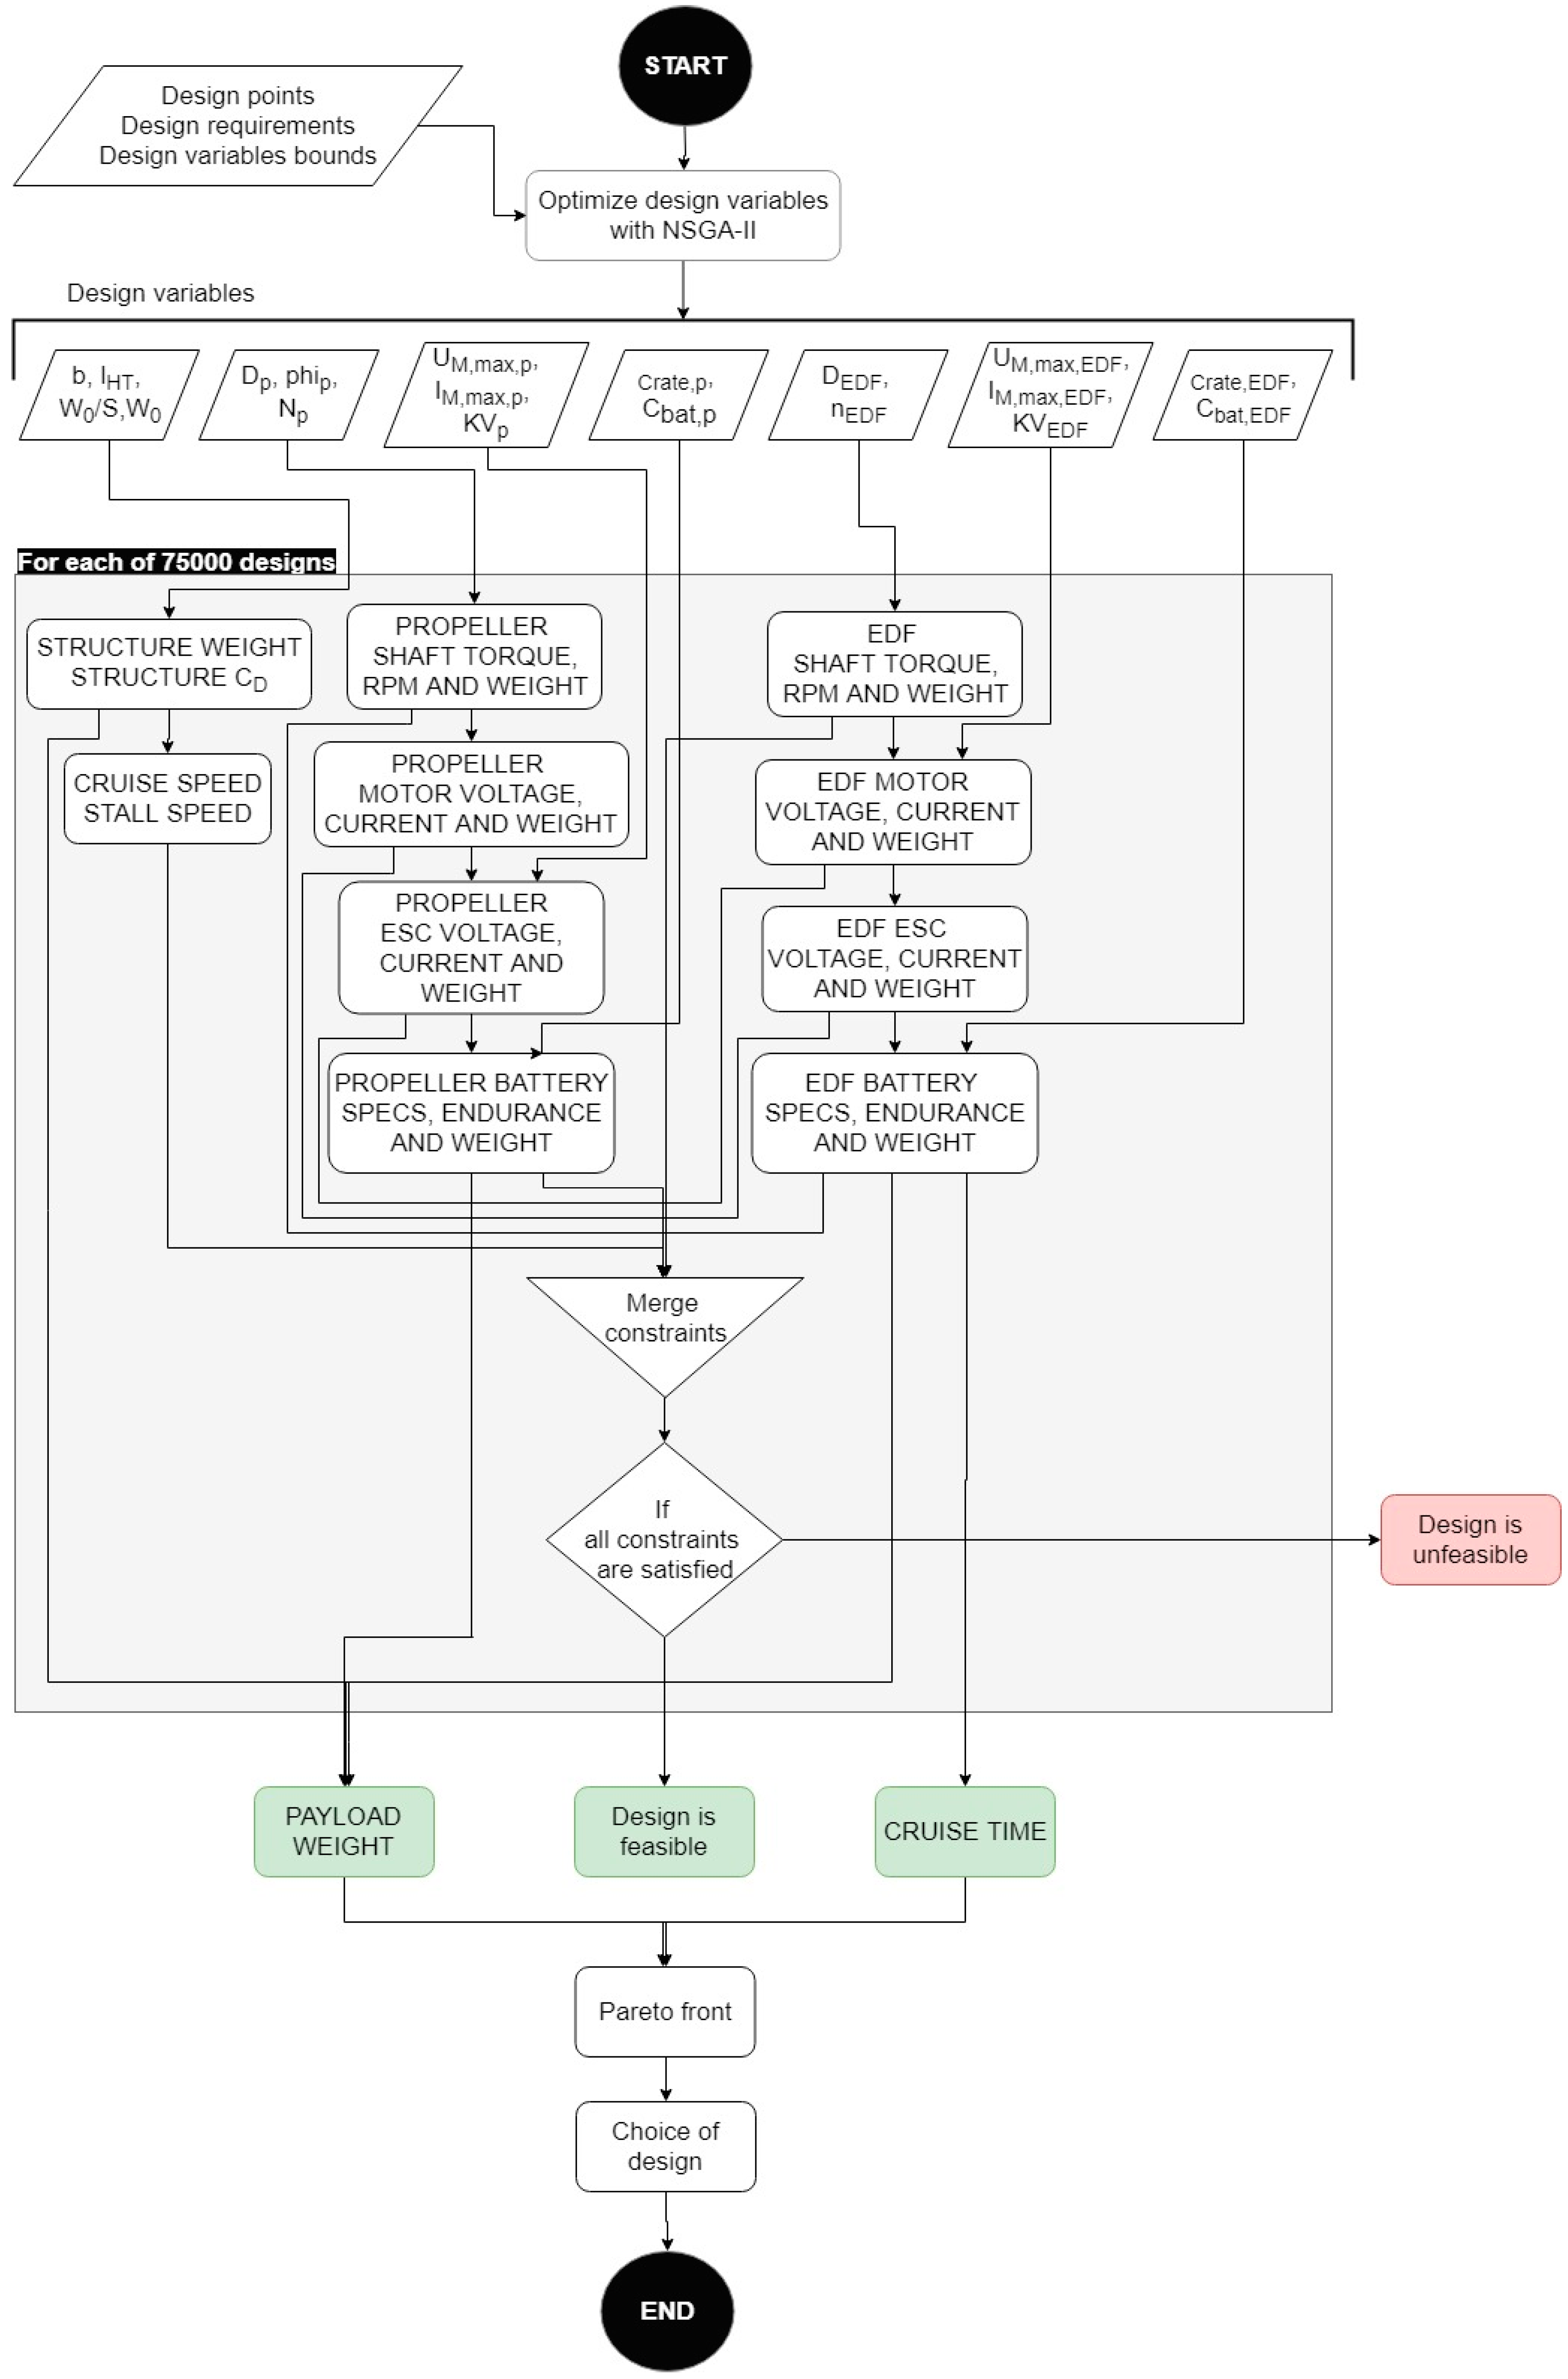
8], because of the multi-modality of the objective function
. The full flowchart of the optimization was reported in
Appendix A.
3.1. Modeling the VTOL-UAV
The dependence of the fitness function on the design variables cannot be expressed as a simple mathematical expression, but is the result of a set of sub-models.
The white and blue arrows of
Figure 1 show the energy flows throughout the system, while the orange arrows illustrate the backward approach used for the modeling.
As explained in
Section 2, the required thrust of each propulsion unit is the input of the overall simulation model. The parameters of each component of the power system were adjusted, in order to satisfy the power demand, and the efficiency of each element was taken into account with the average operating point method.
Each sub-model computed the weight of the corresponding element that added to the empty weight of the aircraft (calculated as proposed by Aksugur et al. [
6]) and reduced the available payload. In particular, the weight of the propeller and ESC were statistically estimated as a function of their diameter, while the contribution of the motors was statistically estimated as a function of their maximum power. This method took inspiration from Reference [
13], where it was possible to find the statistical regression charts of the existing devices. The only component that was not considered in Reference [
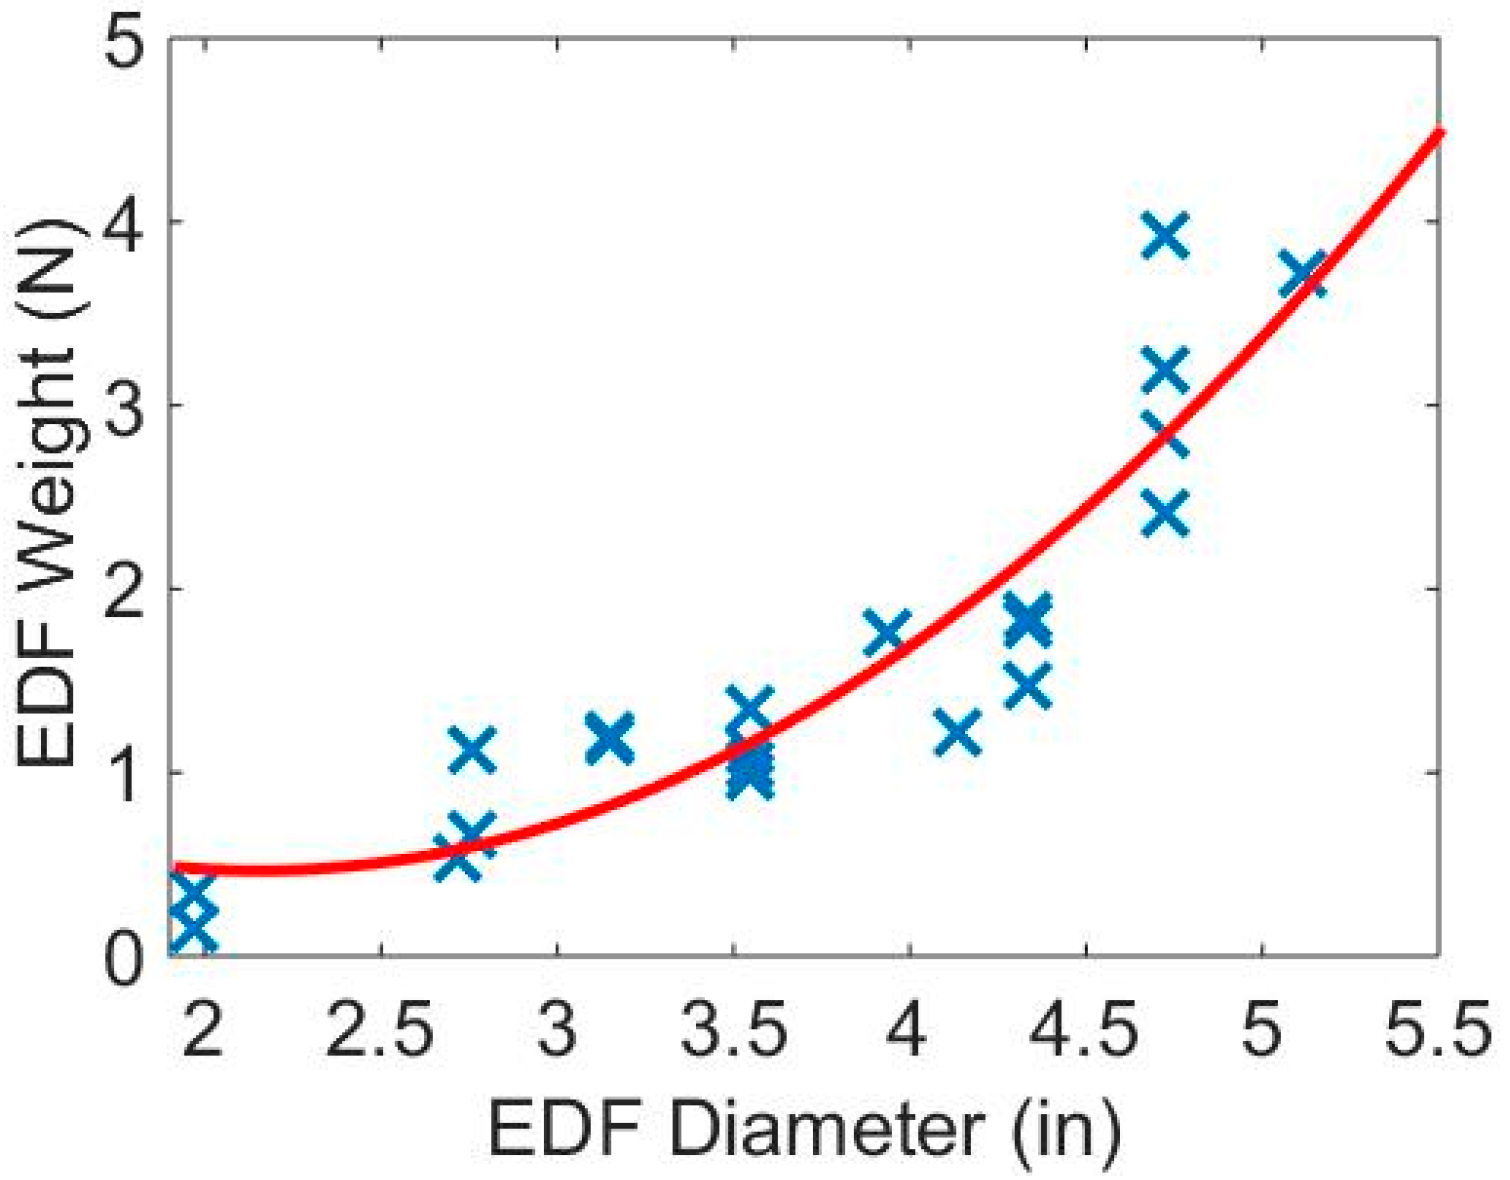
13] was the EDF, whose weight statistical regression was derived by the authors of this paper and is shown in
Figure 2.
3.1.1. Propeller
The propeller was modeled, using Equations (2)–(5). As previously stated, the input parameters of the model were, the required thrust
and the propeller design parameters. The output required the mechanical power to be calculated as the product of propeller torque and speed.
where
,
,
,
are parameters depending on the shape and aerodynamics of the propeller blades. In this work, values for the carbon-fiber propellers suggested in Reference [
13] were used. Parameters
and
represent, respectively, the propeller thrust and torque coefficients, while
and
were the propeller thrust and torque. Finally,
represents the revolutions, per minute, and
the air density of the flight conditions listed in
Table 1.
3.1.2. EDF
The EDF model takes as input parameters, the required thrust and the design variables of
Table 2, returning its shaft speed and torque. In particular, the same propeller equations were applied in the EDF model, at first. Then, Equations (6)–(8) were implemented to take into consideration the presence of the duct-wrapping of the fan blades, as suggested in Reference [
14].
where,
and
are the cross-section areas of the unducted and ducted fans that are assumed to coincide.
and
represent the power delivered by the unducted and ducted fan, respectively,
is assumed to be equal to one and represents the duct diffusion ratio, and
is the torque generated at the EDF shaft.
3.1.3. Motor
The motors considered in this investigation used the Brushless DC technology and were modeled as proposed in [
13]. The model takes as input parameters, the design variables described in
Table 2, together with the corresponding propulsor (propeller or EDF) revolutions per minute and torque, and calculates the efficiency and the electric power using the following equations:
where
and
represent, respectively, the motor no-load voltage and current,
is the motor internal resistance,
and
is the maximum value of revolutions per minute and torque, respectively, while
and
are the speed and torque of the propulsion unit connected to the electric motor.
and
are the current and voltage of the motor (defining the electric power requested by the motor),
and
are the delivered torque and mechanical power, and
is the motor efficiency.
3.1.4. ESC
The role of ESC in the considered powertrain is two-fold:
It has to work as a speed controller for the electric motor after having received the throttle signal from the flight controller.
According to the working logic of a Brushless Direct Current (BLDC) motor, it transforms the DC current from the battery to a three-phase alternating signal.
The ESC model is described by Equations (16)–(22):
where
and
are the ESC nominal voltage and current,
and
are their maximum values, and
is the power delivered by ESC.
is the nominal value of the battery voltage that the ESC receives in input, 3.7 is the nominal voltage of a single Lithium-polymer (Li-po) battery cell, and
is the ESC efficiency. Finally,
is the battery resistance, PTF represents the part throttle factor, and PWF is the ratio of the actual power to the full power, further details can be found in Reference [
15].
Equation (19) is taken from Reference [
15] and has been used here to obtain an estimation of the average ESC efficiency that was considered to be constant in time. As pointed out in [
15], the ESC efficiency changed with the input voltage
and the ESC current, during the discharge of the battery. However, this effect was neglected here, because of the simplified nature of the average point method and because the focus of the investigation was not on the actual values of the performance indices. As already explained, the goal of the investigation was to put into evidence some synergic effects in hybrid and electric aircraft.
3.1.5. Battery
The battery model takes as inputs, the ESC efficiency and the electric power of the motor, and returns the battery weight and the discharge-time.
where
is the power delivered by the battery,
and
are the nominal values of the battery current and voltage (which is the product of the nominal cell voltage 3.7 V and the number of cells in series
),
is the battery discharge time, and
is the battery weight. DOD is the depth of discharge of the battery, assumed to equal 80%, while the energy density of the battery,
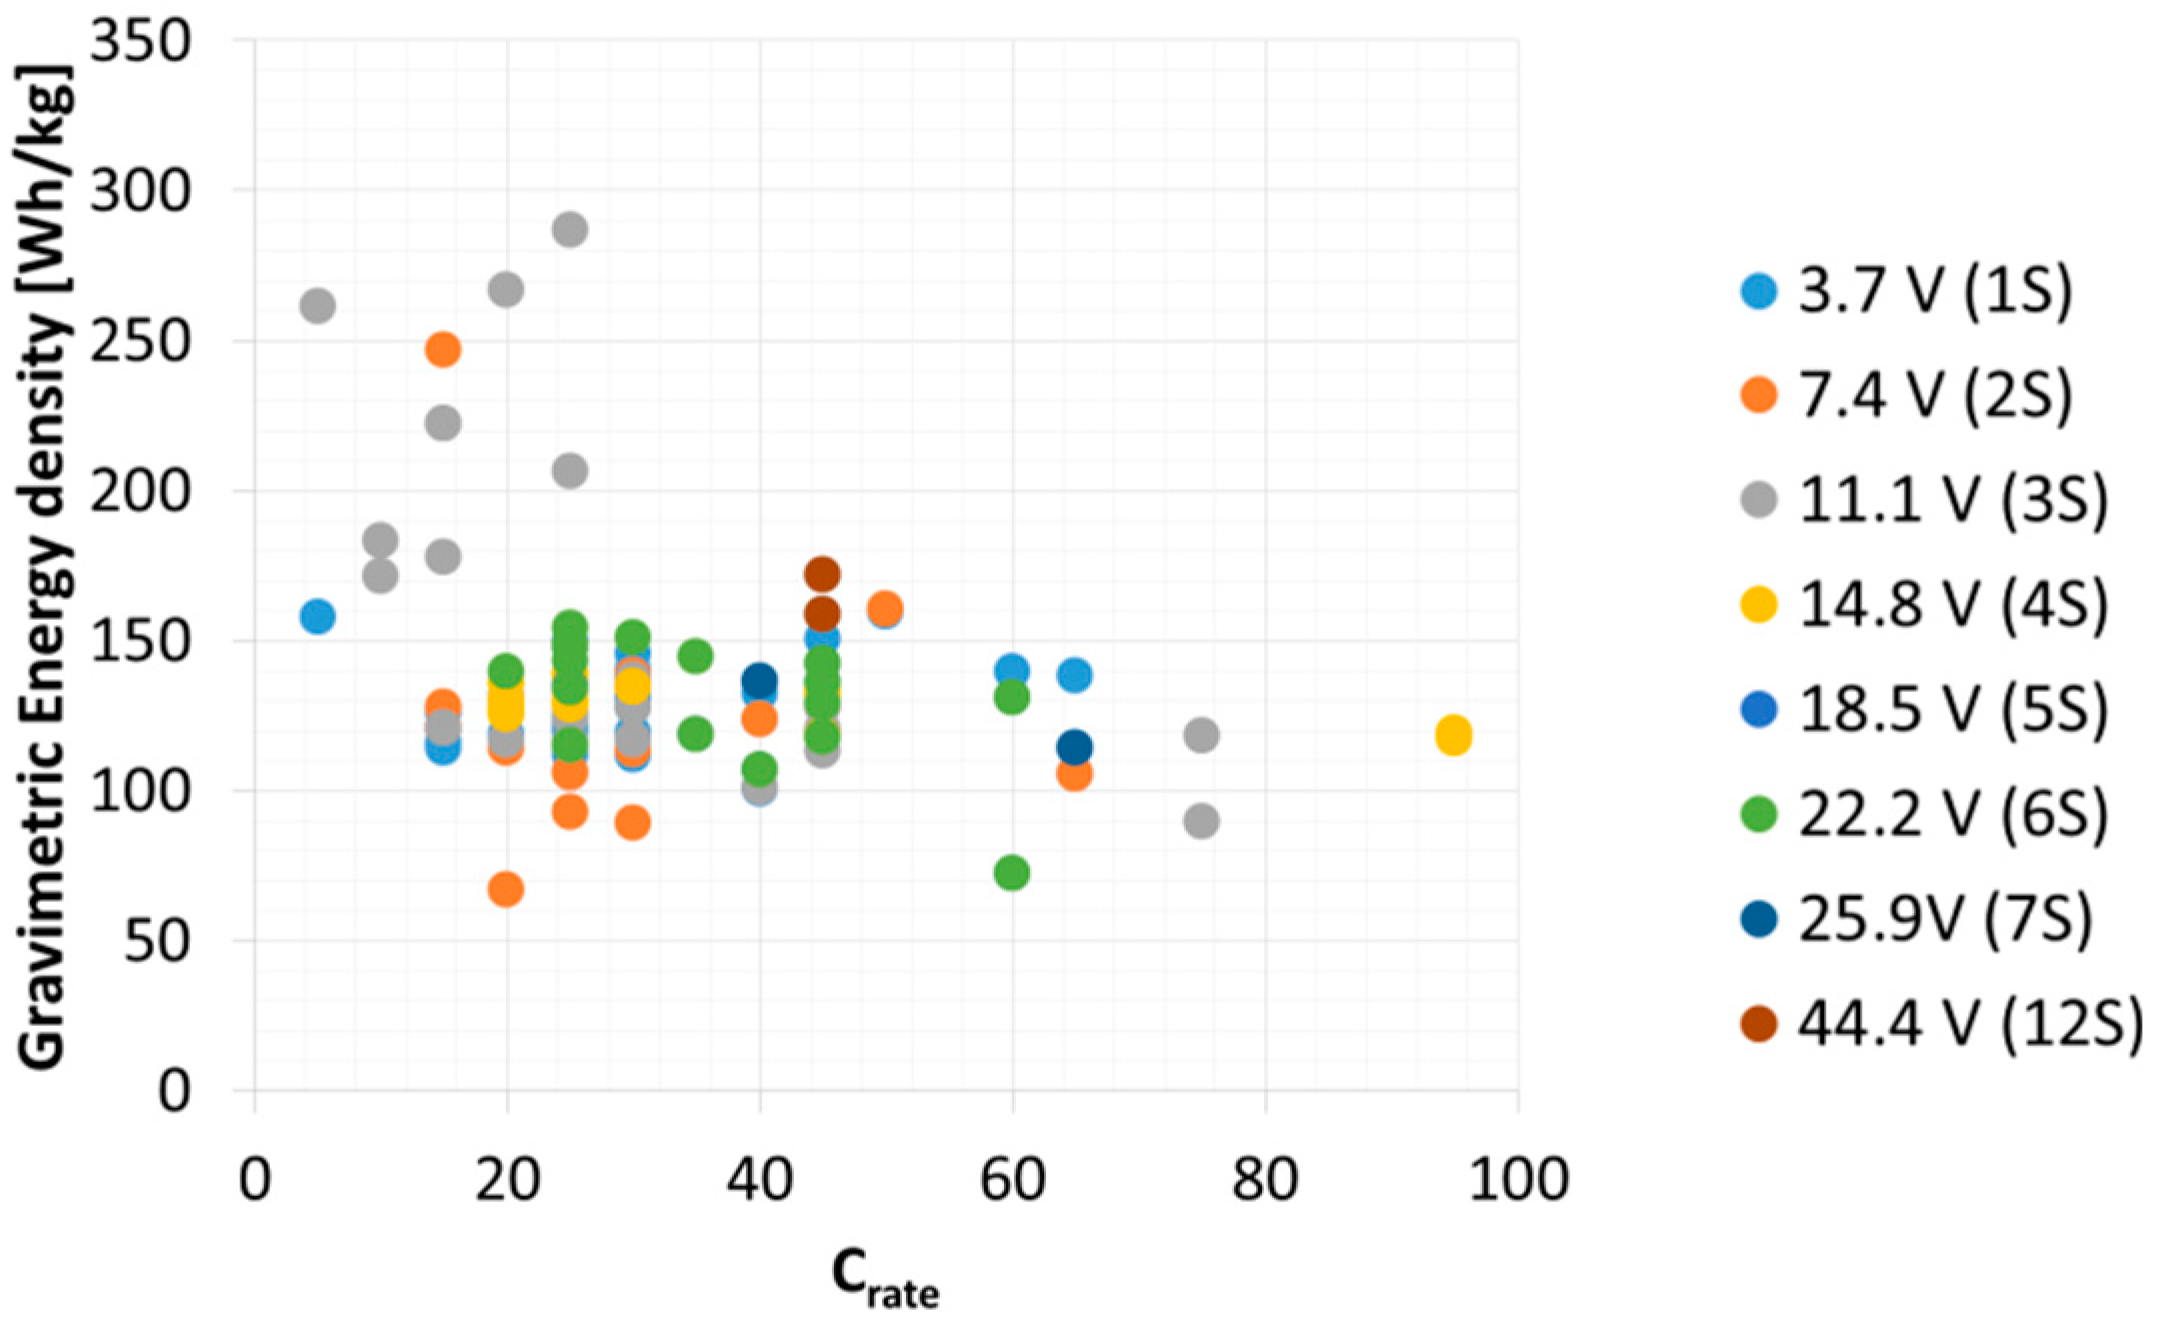
, is derived from a database of commercial Lithium-polymer (Li-po) batteries with a capacity upto 22 Ah (see
Figure 3, where values between the brackets represent the number of battery cells in series).
Note that the formula used for the discharge time, i.e., Equation (24), has been extensively validated over a large number of experimental data of constant power discharge of different Li-po batteries, in a previous study by the authors [
16]. This formula takes into account the effect of the discharge current on the actual battery capacity, through the Peukert’s coefficient “peuk” (set equal to 1.05).
The battery current needs to be checked because it cannot exceed a maximum value
, which depends on its capacity
and
:
The battery current is checked at the end of the discharge phase, when the cell voltage is assumed to drop to the cut-off value (2.7 V):
3.2. Results and Discussion
This first test case is used to discuss two different topics. The first one relates to the synergy between the architecture and the power system within the aircraft design proceeding, by using the current technologies for the batteries and motor. The second topic is the further benefit of introducing the multi-functionalization composite materials as a promising technology for improving the overall energy density. Despite both topics having already been addressed in literature, from a qualitative point of view, a quantitative analysis has not yet been performed, to the authors’ knowledge.
Synergy between the Architecture and the Power System
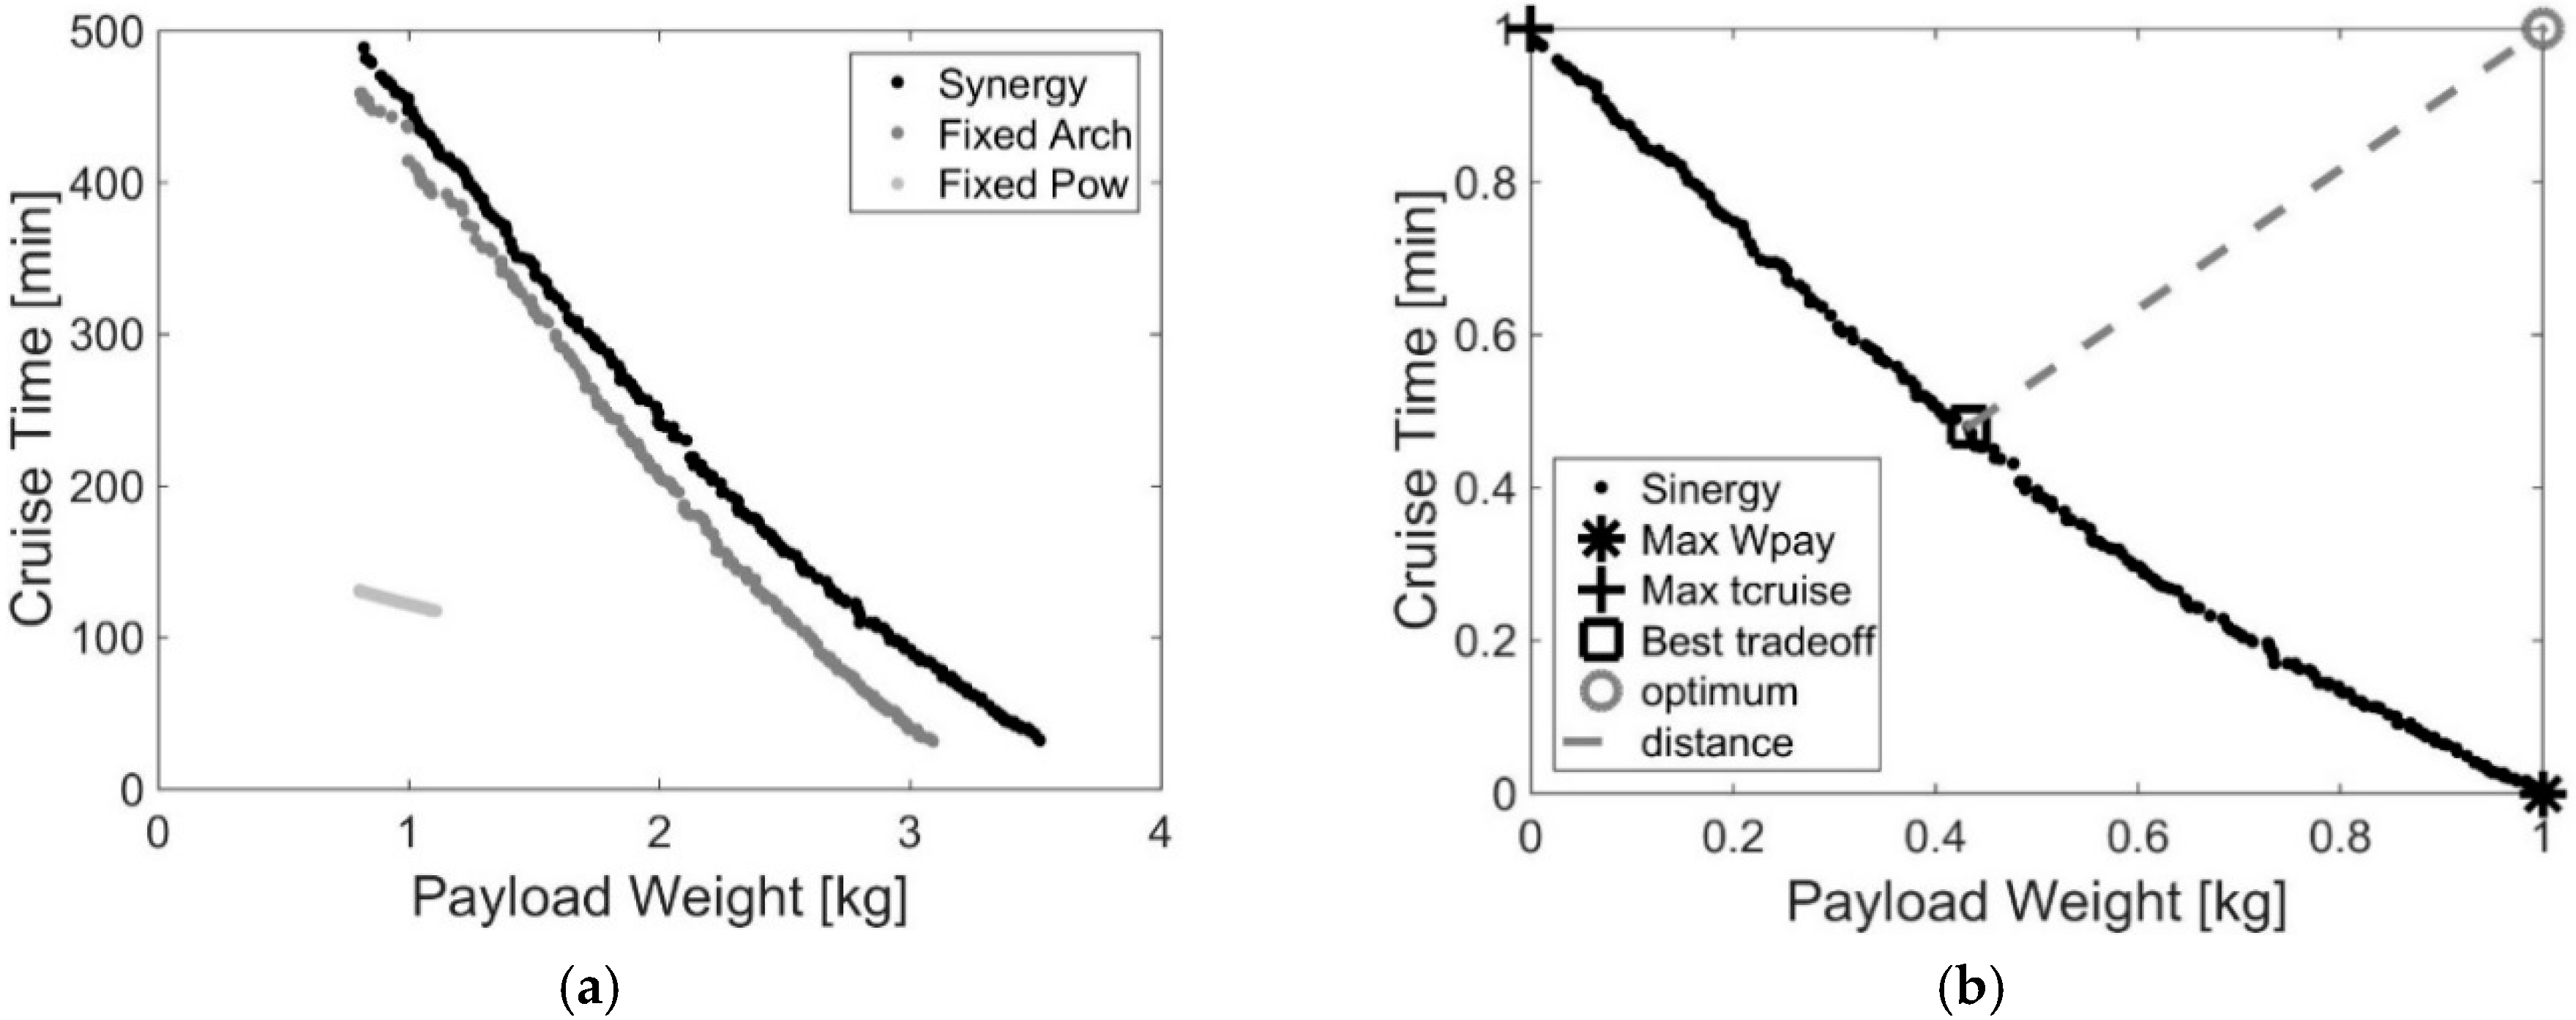
The results of the optimization are shown in
Figure 4. In particular,
Figure 4a compares three Pareto optimal fronts, obtained by different optimizations, using the following as design variables:
Fixed Arch: Only powertrain specifications (by maintaining a fixed architecture);
Fixed Pow: Only architecture parameters (fixed powertrain);
Synergy: Simultaneous optimization of the power system and the architecture of the design variables.
The second optimization allows an indirect comparison with a study by Aksugur et al. [
6], as it considers the same inputs but calculates the goals with the models presented here. Note that a direct comparison was not possible because of a lack of information on the values of the design variables and an incomplete description of the numerical procedures.
Note the importance of the introduction of the power system parameters into the aircraft design optimization. In fact, due to the synergy between the aircraft design and powertrain, it was possible to obtain strong enhancements in the target performances (higher payload weight and cruise time). For example, due to the synergy, it was possible to obtain:
The same payload of 1 kg with a 267% higher cruise time (from about 122 to about 250 min), with respect to the optimization at fixed powertrain.
The same payload of 1 kg with a 8.2% higher cruise time (from about 414 to about 448 min), with respect to the optimization at a fixed architecture.
The same cruise time of 130 min with a 228% higher payload weight (from about 0.82 to about 2.69 kg), with respect to the optimization at fixed powertrain.
The same cruise time of 130 min with a 12.1% higher payload weight (from about 2.40 to about 2.69 kg), with respect to the optimization at fixed architecture.
From
Figure 4, it is possible to observe that the main improvements were achieved through the powertrain optimization for a fixed size of aircraft. While, the choice of fixing it, a priori, and optimizing the aircraft architecture, only led to results that provided strongly suboptimal solutions. Finally, synergy allowed to reach the best configurations.
Figure 4b represents a normalized curve of the “Synergy” Pareto front of
Figure 4a, and was used to denote three optimal design points, among the optimal solutions of NSGA-II, which were solutions of maximum payload (Max_W
pay), maximum cruise time (Max_t
cruise), and best trade-off (Best_tradeoff). The latter was chosen by defining the minimum distance of the curve from a so-called “optimum” point having the same cruise time of the solution Max_t
cruise and the same payload weight of the design Max_W
pay. Therefore, the optimal point had coordinates (1,1) in the normalized plane and (3.51,489.2) in the plot of
Figure 4a.
The final choice between the optimal solutions depended on the relative importance of the two goals and was left to the final decision maker. However, their specifications, which are reported in
Table 3, could be used to draw some conclusions about the role of the different design parameters on the UAV performances. In particular, it is possible to notice that, as expected, the highest value of the cruise time was reached with an EDF battery capacity that was higher than any other solutions, while reducing the maximum battery discharge rate. This was reflected in the lower EDF motor maximum current and a larger EDF diameter, by maintaining, about constant, the EDF revolutions per minute. This meant that, the motor output torque was reduced, which was probably due to its direct proportionality to the motor maximum current. As for the maximum payload weight, it was possible to notice the strong reduction of the battery capacity. Another parameter that was reduced was the fan diameter, while the EDF motor rpm was about constant, with a consequent increase of the maximum currents, to which the motor torque was directly proportional. Based on these observations, it was possible to conclude that the battery specifications represented the main factor of influence on the final performances. This corroborates the more and more increasing interest in improving their technologies. However, this also study shows that optimization is a precious tool for better exploiting the existing technology’s potential. Finally, confirming what has been stated above about the aircraft powertrain and the structure optimization, it was possible to observe that the main differences between the three configurations listed in
Table 3 were in some parameters of the power system.
3.3. Structural Integration and Multi-Functionalization
Structural integration means embedding a part into the primary structure of the overall system and making the latter fulfil some structural tasks (such as carrying loads and shape retention), in order to save weight and volume. A step ahead of the structural integration is the multi-functionalization, which consists of designing system components to perform multiple (at least two) predetermined functions. An interesting example is the multi-functionalization of the fiber-reinforced composite materials, to add electrical energy storage capabilities [
5]. This allows for part of the conventional energy storage system mass to be subsumed into the aircraft structure, reducing the conventional energy storage system mass needed for a given total amount of stored energy. Therefore, multifunctional composites can be very interesting in the design of electrified airplanes. Note that, the structural properties and failure modes of the modified material should be investigated, as well as the storage ability of the multifunctional component, as a function of shapes, materials, loads, and strains. However, this is beyond the scope of this investigation.
Let us define
and
[
5] as:
where superscripts “battery” or “structure” can be added to each term, to specify if the term is related to either the structure or the battery. Note that
represents the structural properties (e.g., stiffness or strength density) and
measures the energy mass efficiency. In the conventional case (functional separation and no-integration),
, and
.
If the structural parts get energy storage tasks and the battery contributes to the structural functions, it is possible to quantify the mass saving potential, as follows [
5]:
In Equation (29), is the total mass of the system, is the mass of the system structure, and is the conventional battery mass. Note that the first term of Equation (29) represents the original aircraft structure mass, the second term is the mass of the multifunctional battery as a function of its energy mass efficiency, and the mass of the conventional battery. The third term represents the mass to be subtracted to the original structure mass of the aircraft, due to the presence of a multifunction battery that contributes to the structural task.
Let us now consider the further improvements of the VTOL-UAV optimization that could be obtained with the integration/multi-functionalization concept and the technologies described above.
This could be performed by identifying the values of and which:
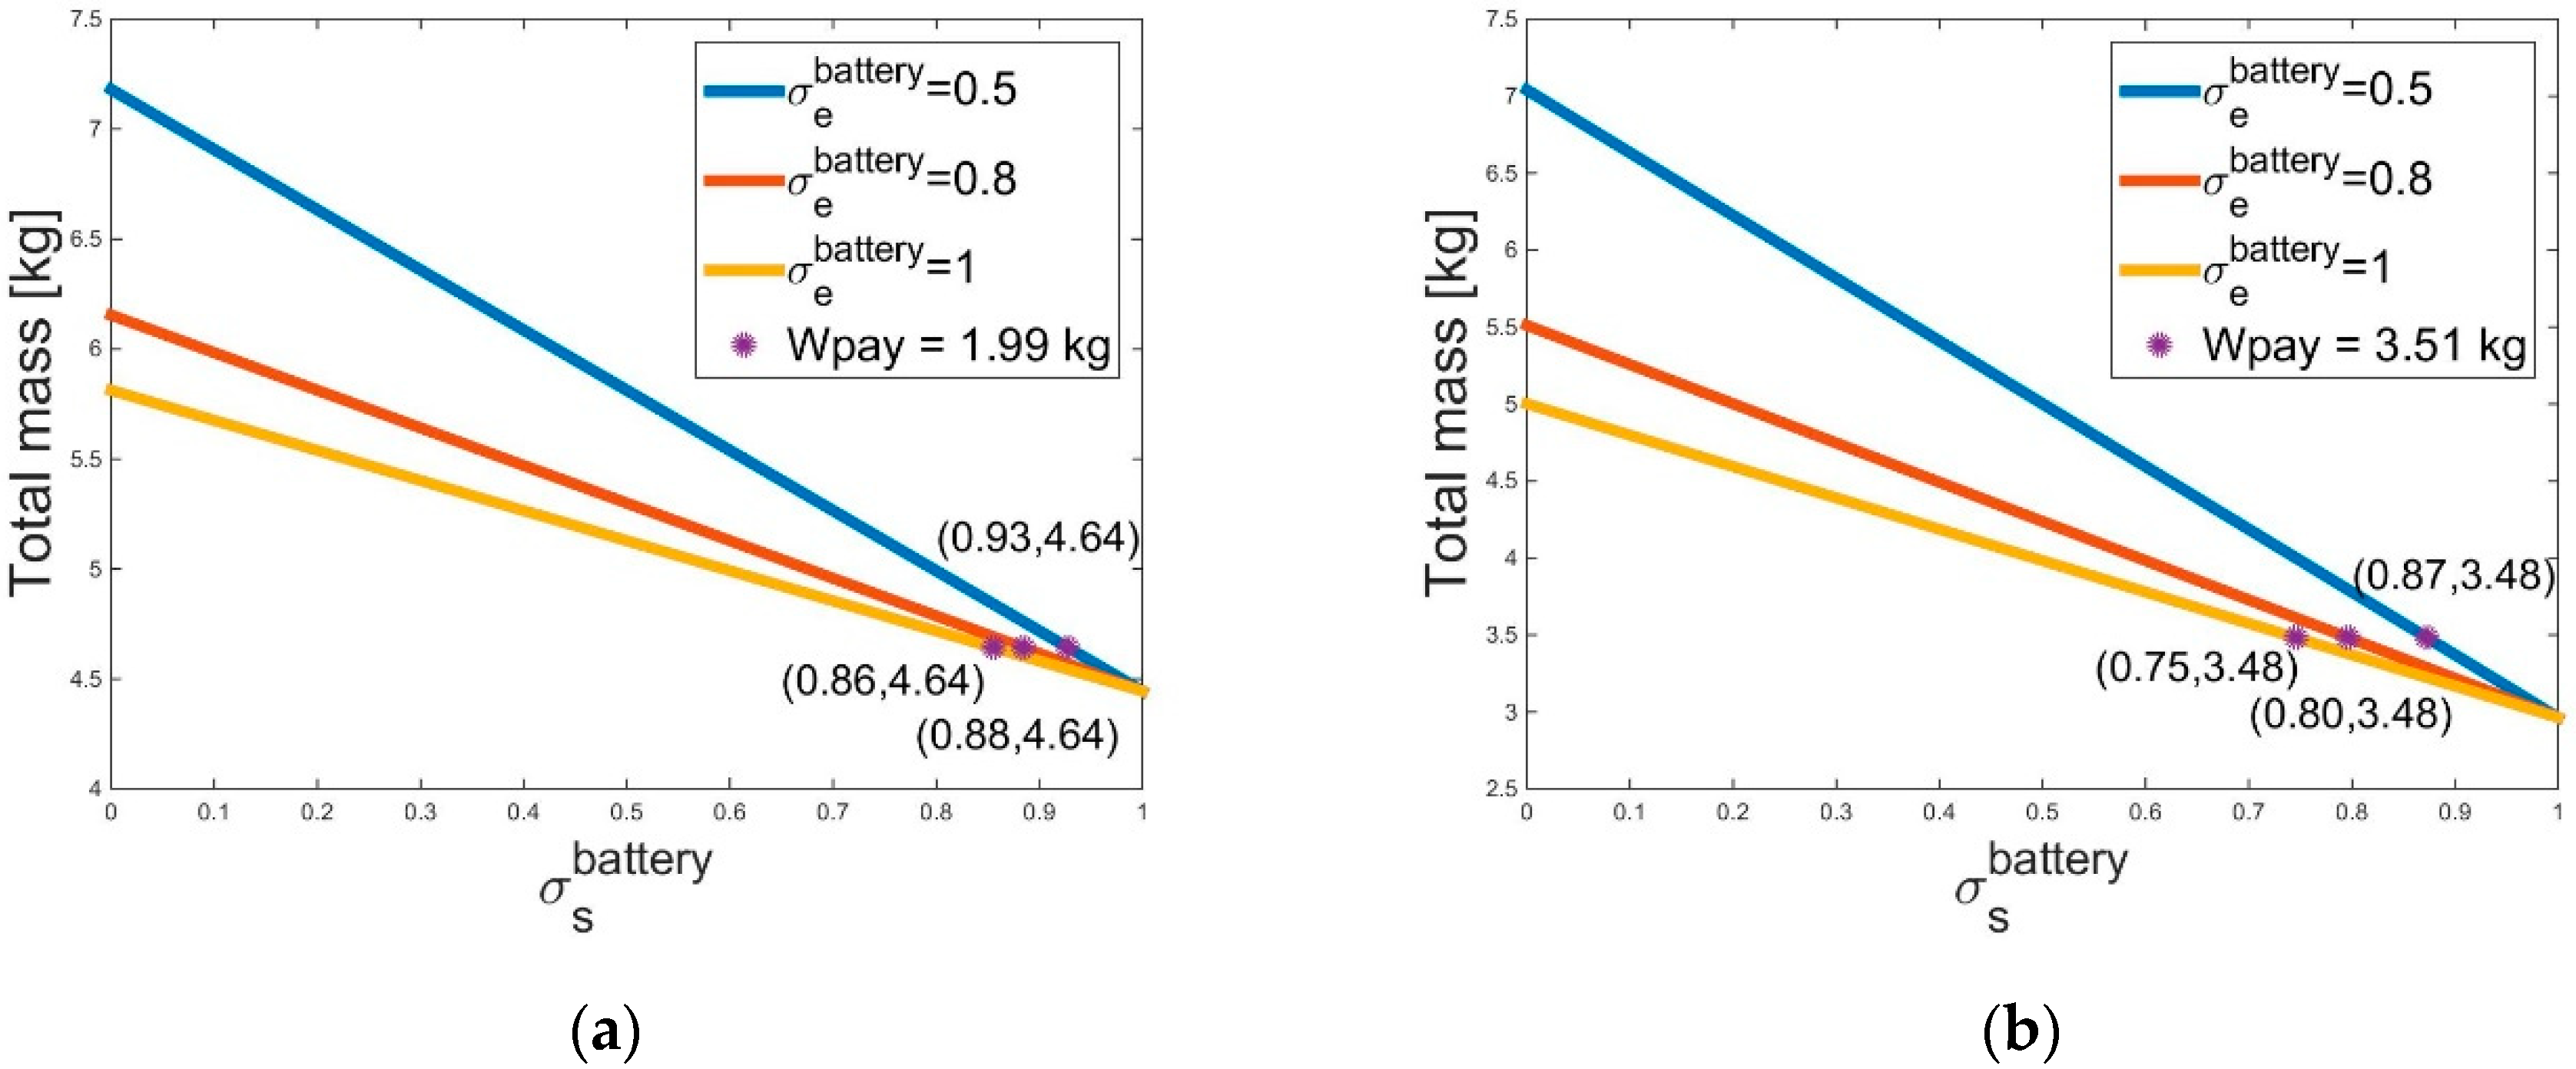
The last case was found to not be feasible. While, the results of the first two cases are shown in
Figure 5, where the total mass represents the aircraft’s empty weight, in order to get the wanted payload, which is 1.99 kg and 3.51 kg in
Figure 5a,b, respectively.
The couples of values that led to obtaining
Wpay = 1.99 kg, starting from solution Max_t
cruise, are shown in
Figure 5a and are: (
,
), (
,
), and (
,). In this case, the empty weight (or total mass) should be equal to 4.64 kg, while, the couples of values that allowed
Wpay = 3.51 kg to be reached, starting from the solution “Best_tradeoff”, are shown in
Figure 5b, and are: (
,
); (
,
), and (
,
). In this case, the empty weight should be equal to 3.48 kg.
Note that the same result could be obtained with different combinations of the two parameters. In particular, it was possible to observe that decreased as the increased. Since it is desirable for the battery to maintain most of its energy efficiency when the multi-functionalization concept was applied, giving it structural tasks, a multi-objective optimization aiming at maximizing both the efficiencies could indicate sensible parameters to be focused on, in further studies on the multi-functionalization.
The next step was to verify if the technologies proposed in the literature for the multi-functional panels could reach these requirements. Reference [
17] suggests various approaches for creating multi-functional energy storage devices and describes the development of structural batteries, capacitors, and supercapacitors. In addition, Reference [
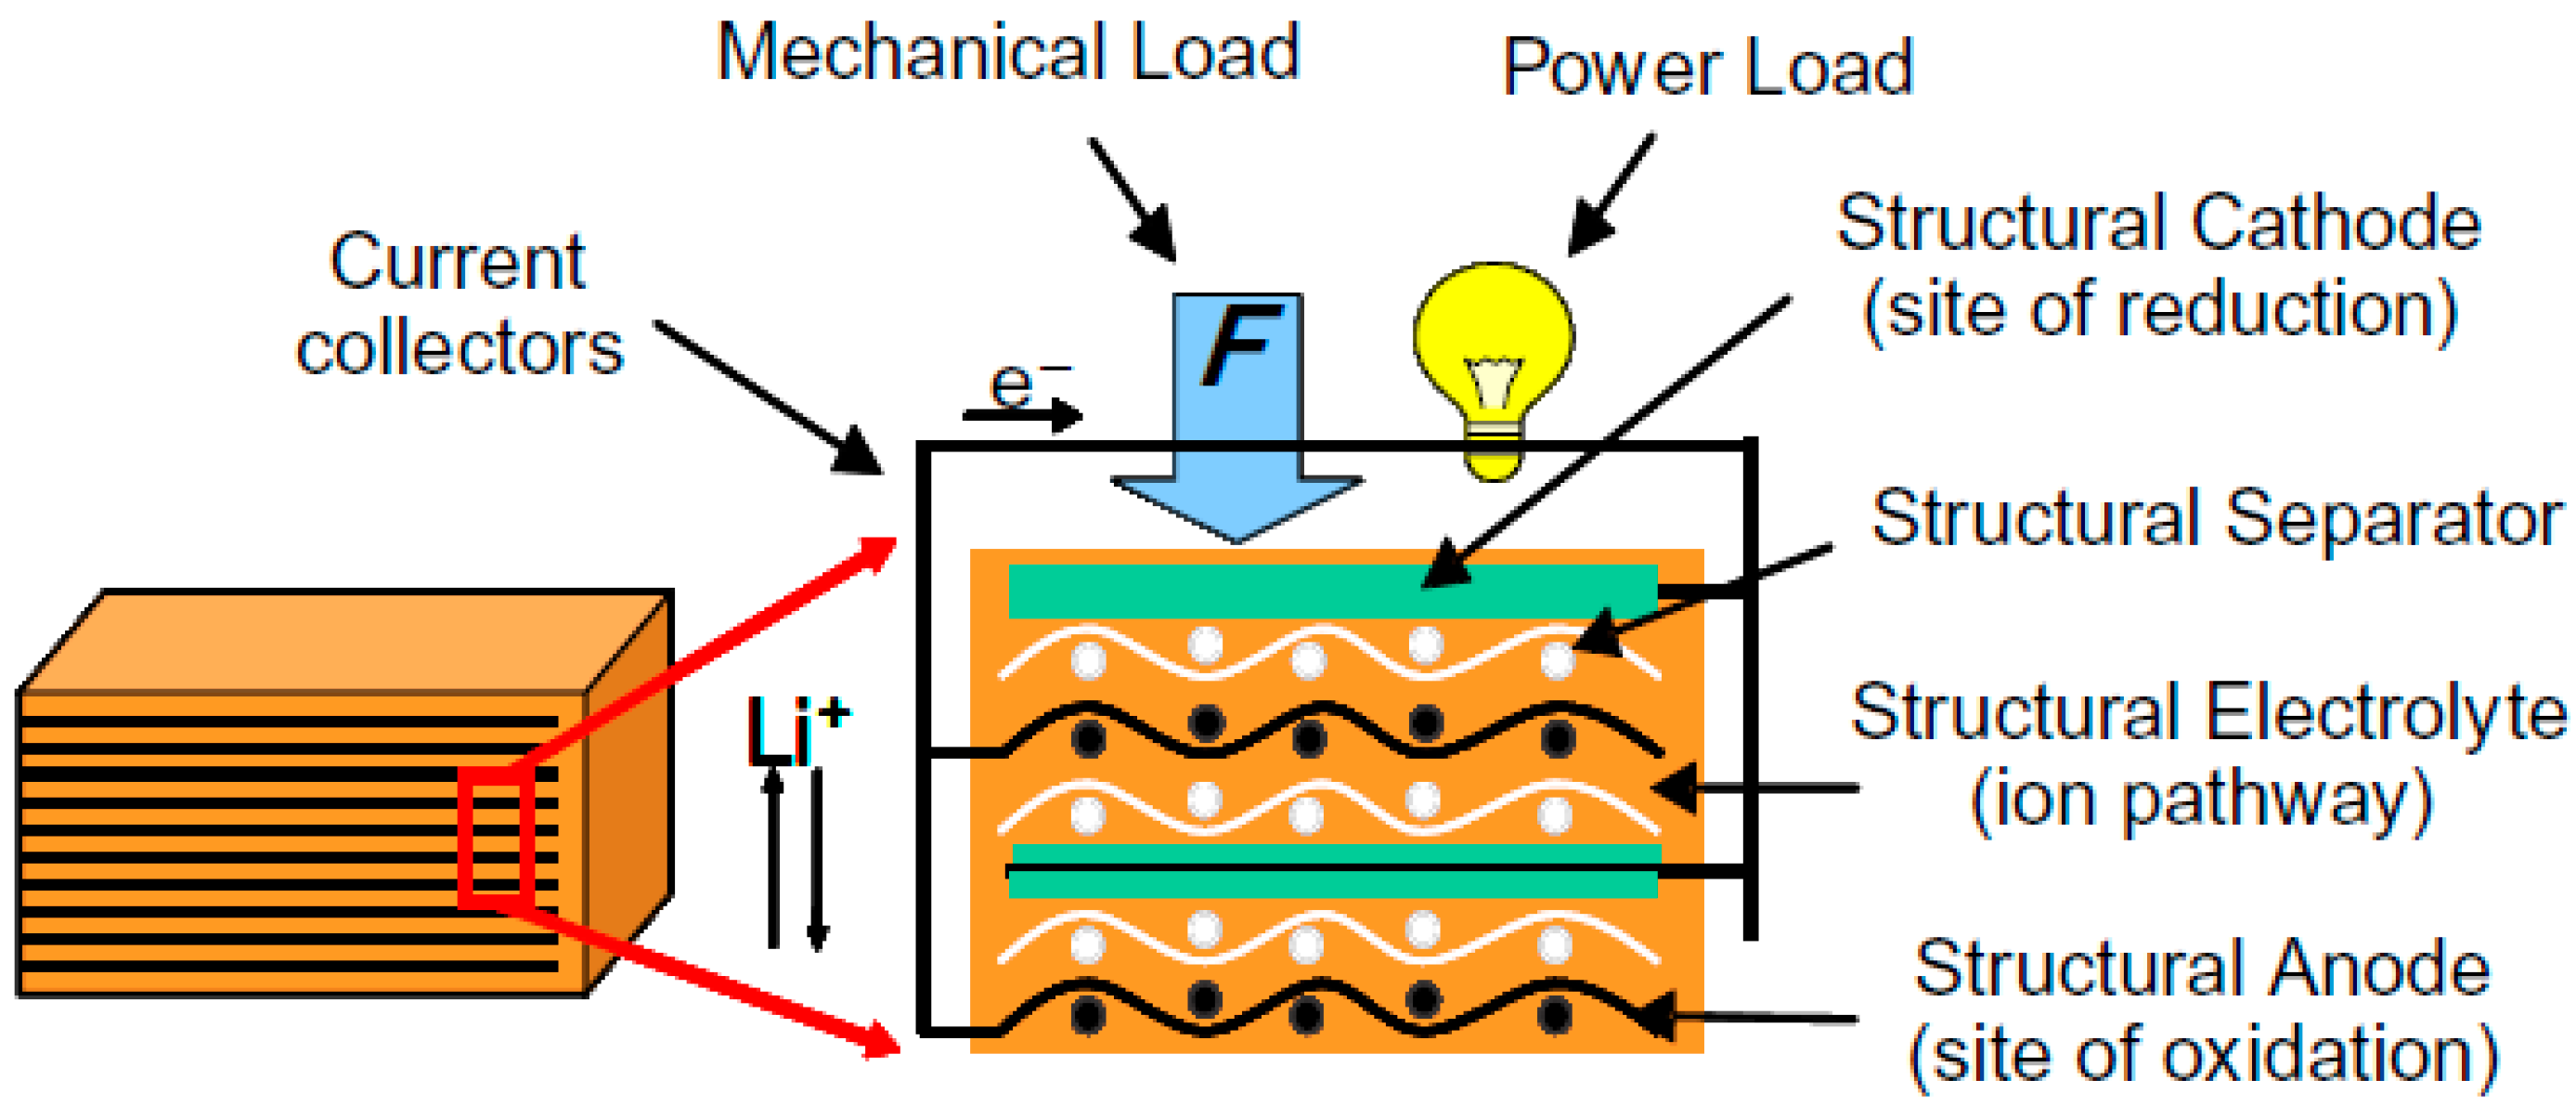
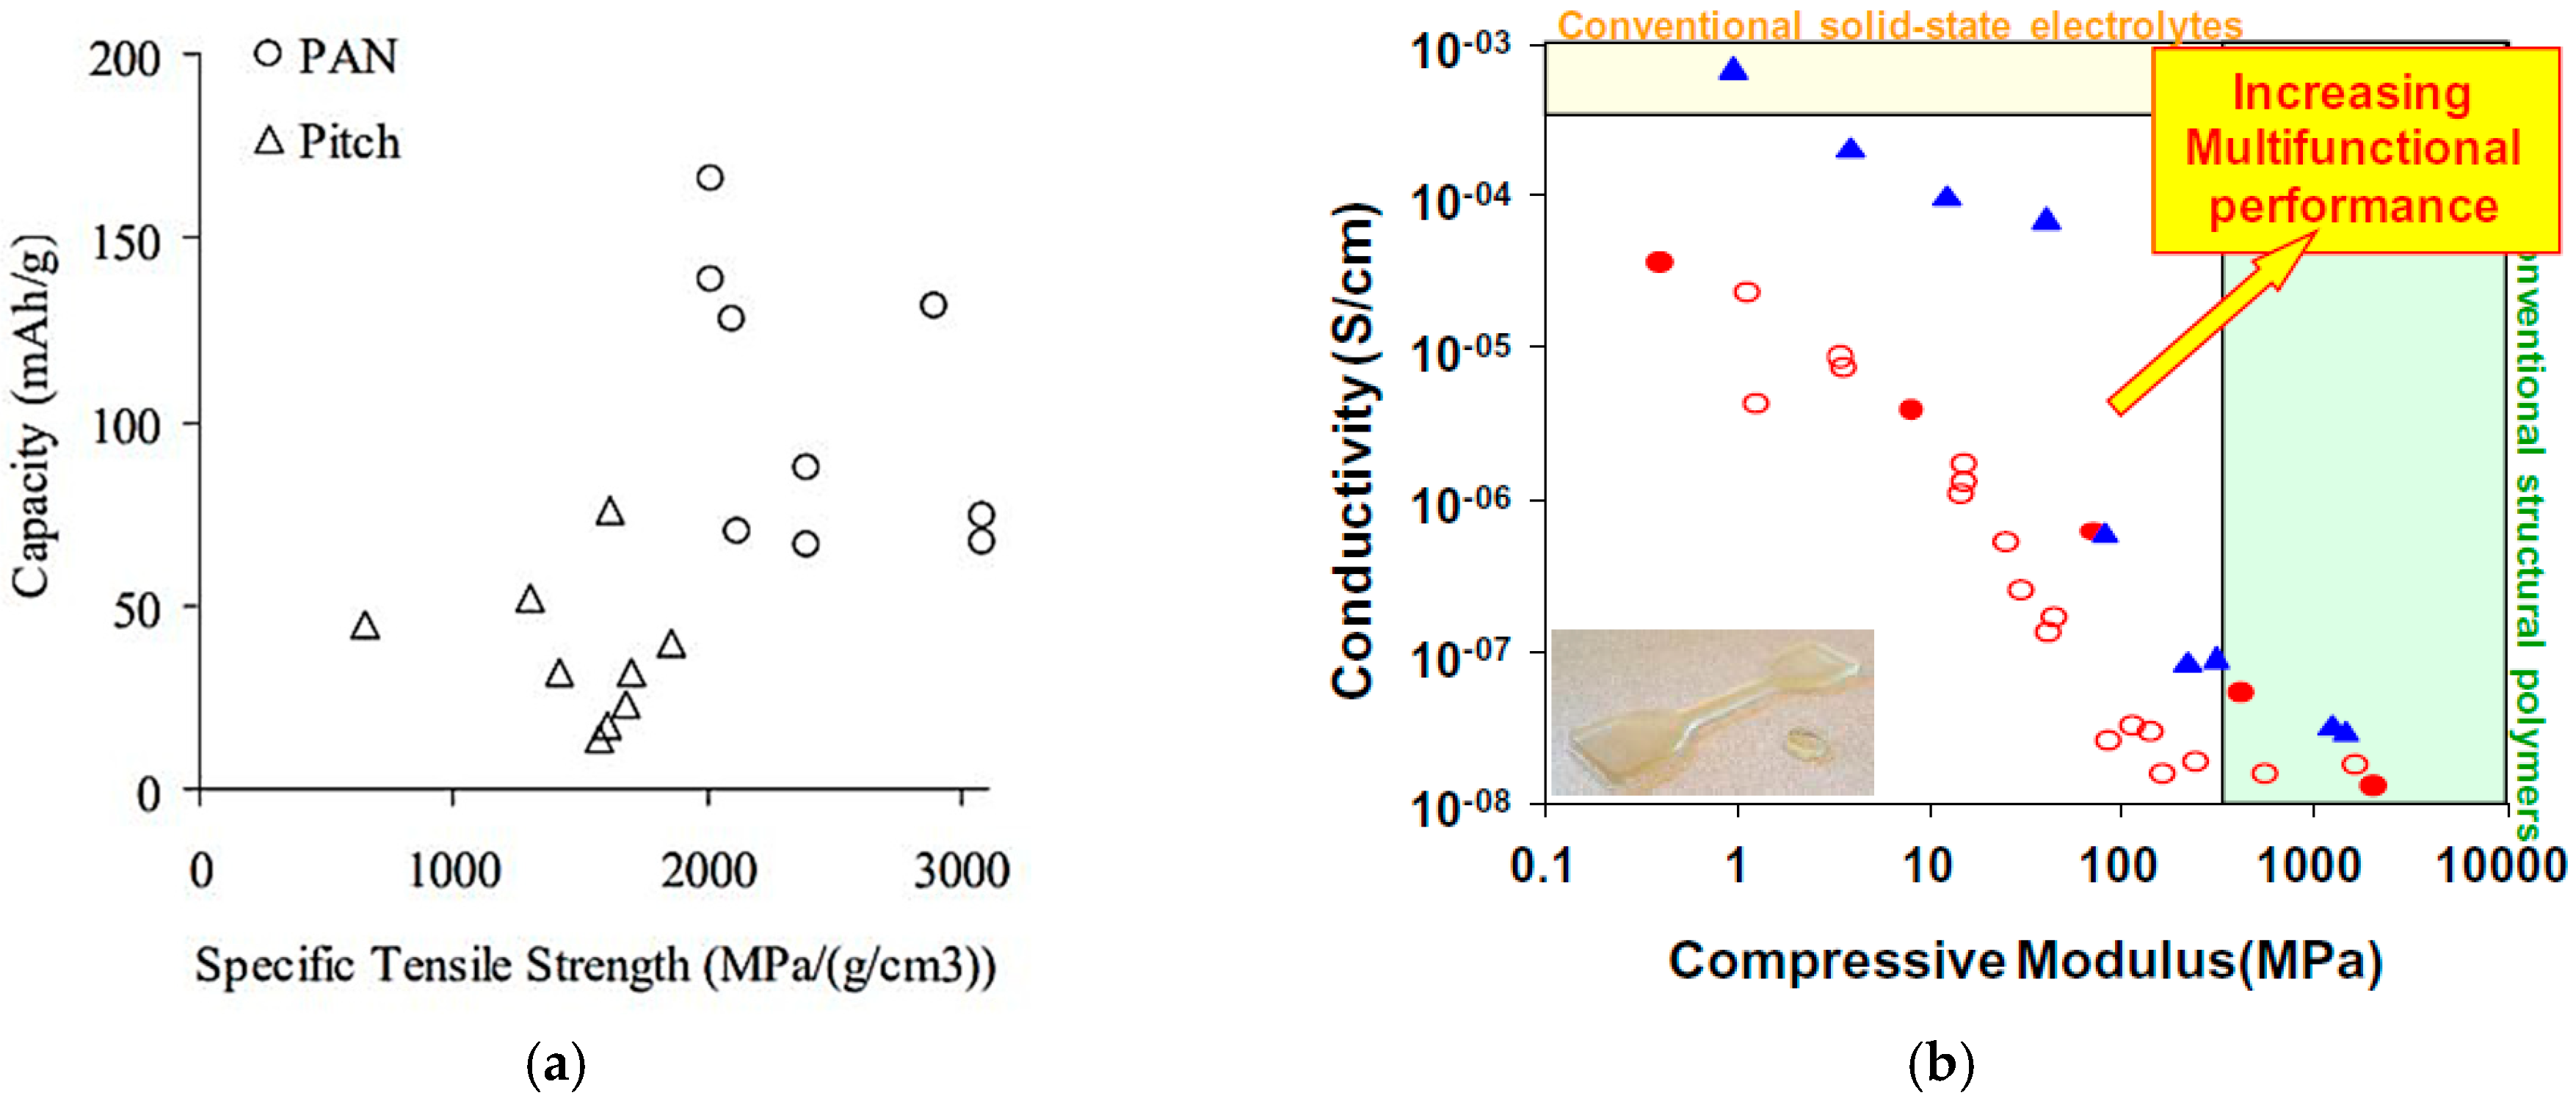
5] provides various studies as examples of different degrees of integration and multi-functionalization. Among the proposed technologies, the storage device shown in
Figure 6 seems to be the most suitable for the goals of this investigation. It considers carbon fibers fabric as an anode, a metal substrate as a primary electrical bus (current collector), coated with a thin film of active cathode, glass-fiber mats as separators, and a matrix material for the electrolyte [
17,
18]. From the results of References [
18,
18] (
Figure 7), it was possible to notice that this technology could provide a high electrical capacity and conductivity, while maintaining good mechanical properties. However,
Figure 7 represents the results of the initial analysis, considering standalone materials whose properties were less critical than those of the whole composite. Furthermore, fibers analyses did not consider, either the impact of the electrochemical cycles on the fiber mechanics or the effects of the mechanical load on the electrical properties. Further details can be found in Reference [
18].
4. Test Case 2: Hybrid Electric MALE-UAV
The second test case refers to a hypothetical UAV, similar to the well-known General Atomics Predator RQ (wing span 14.8 m, wing area 11.5 m
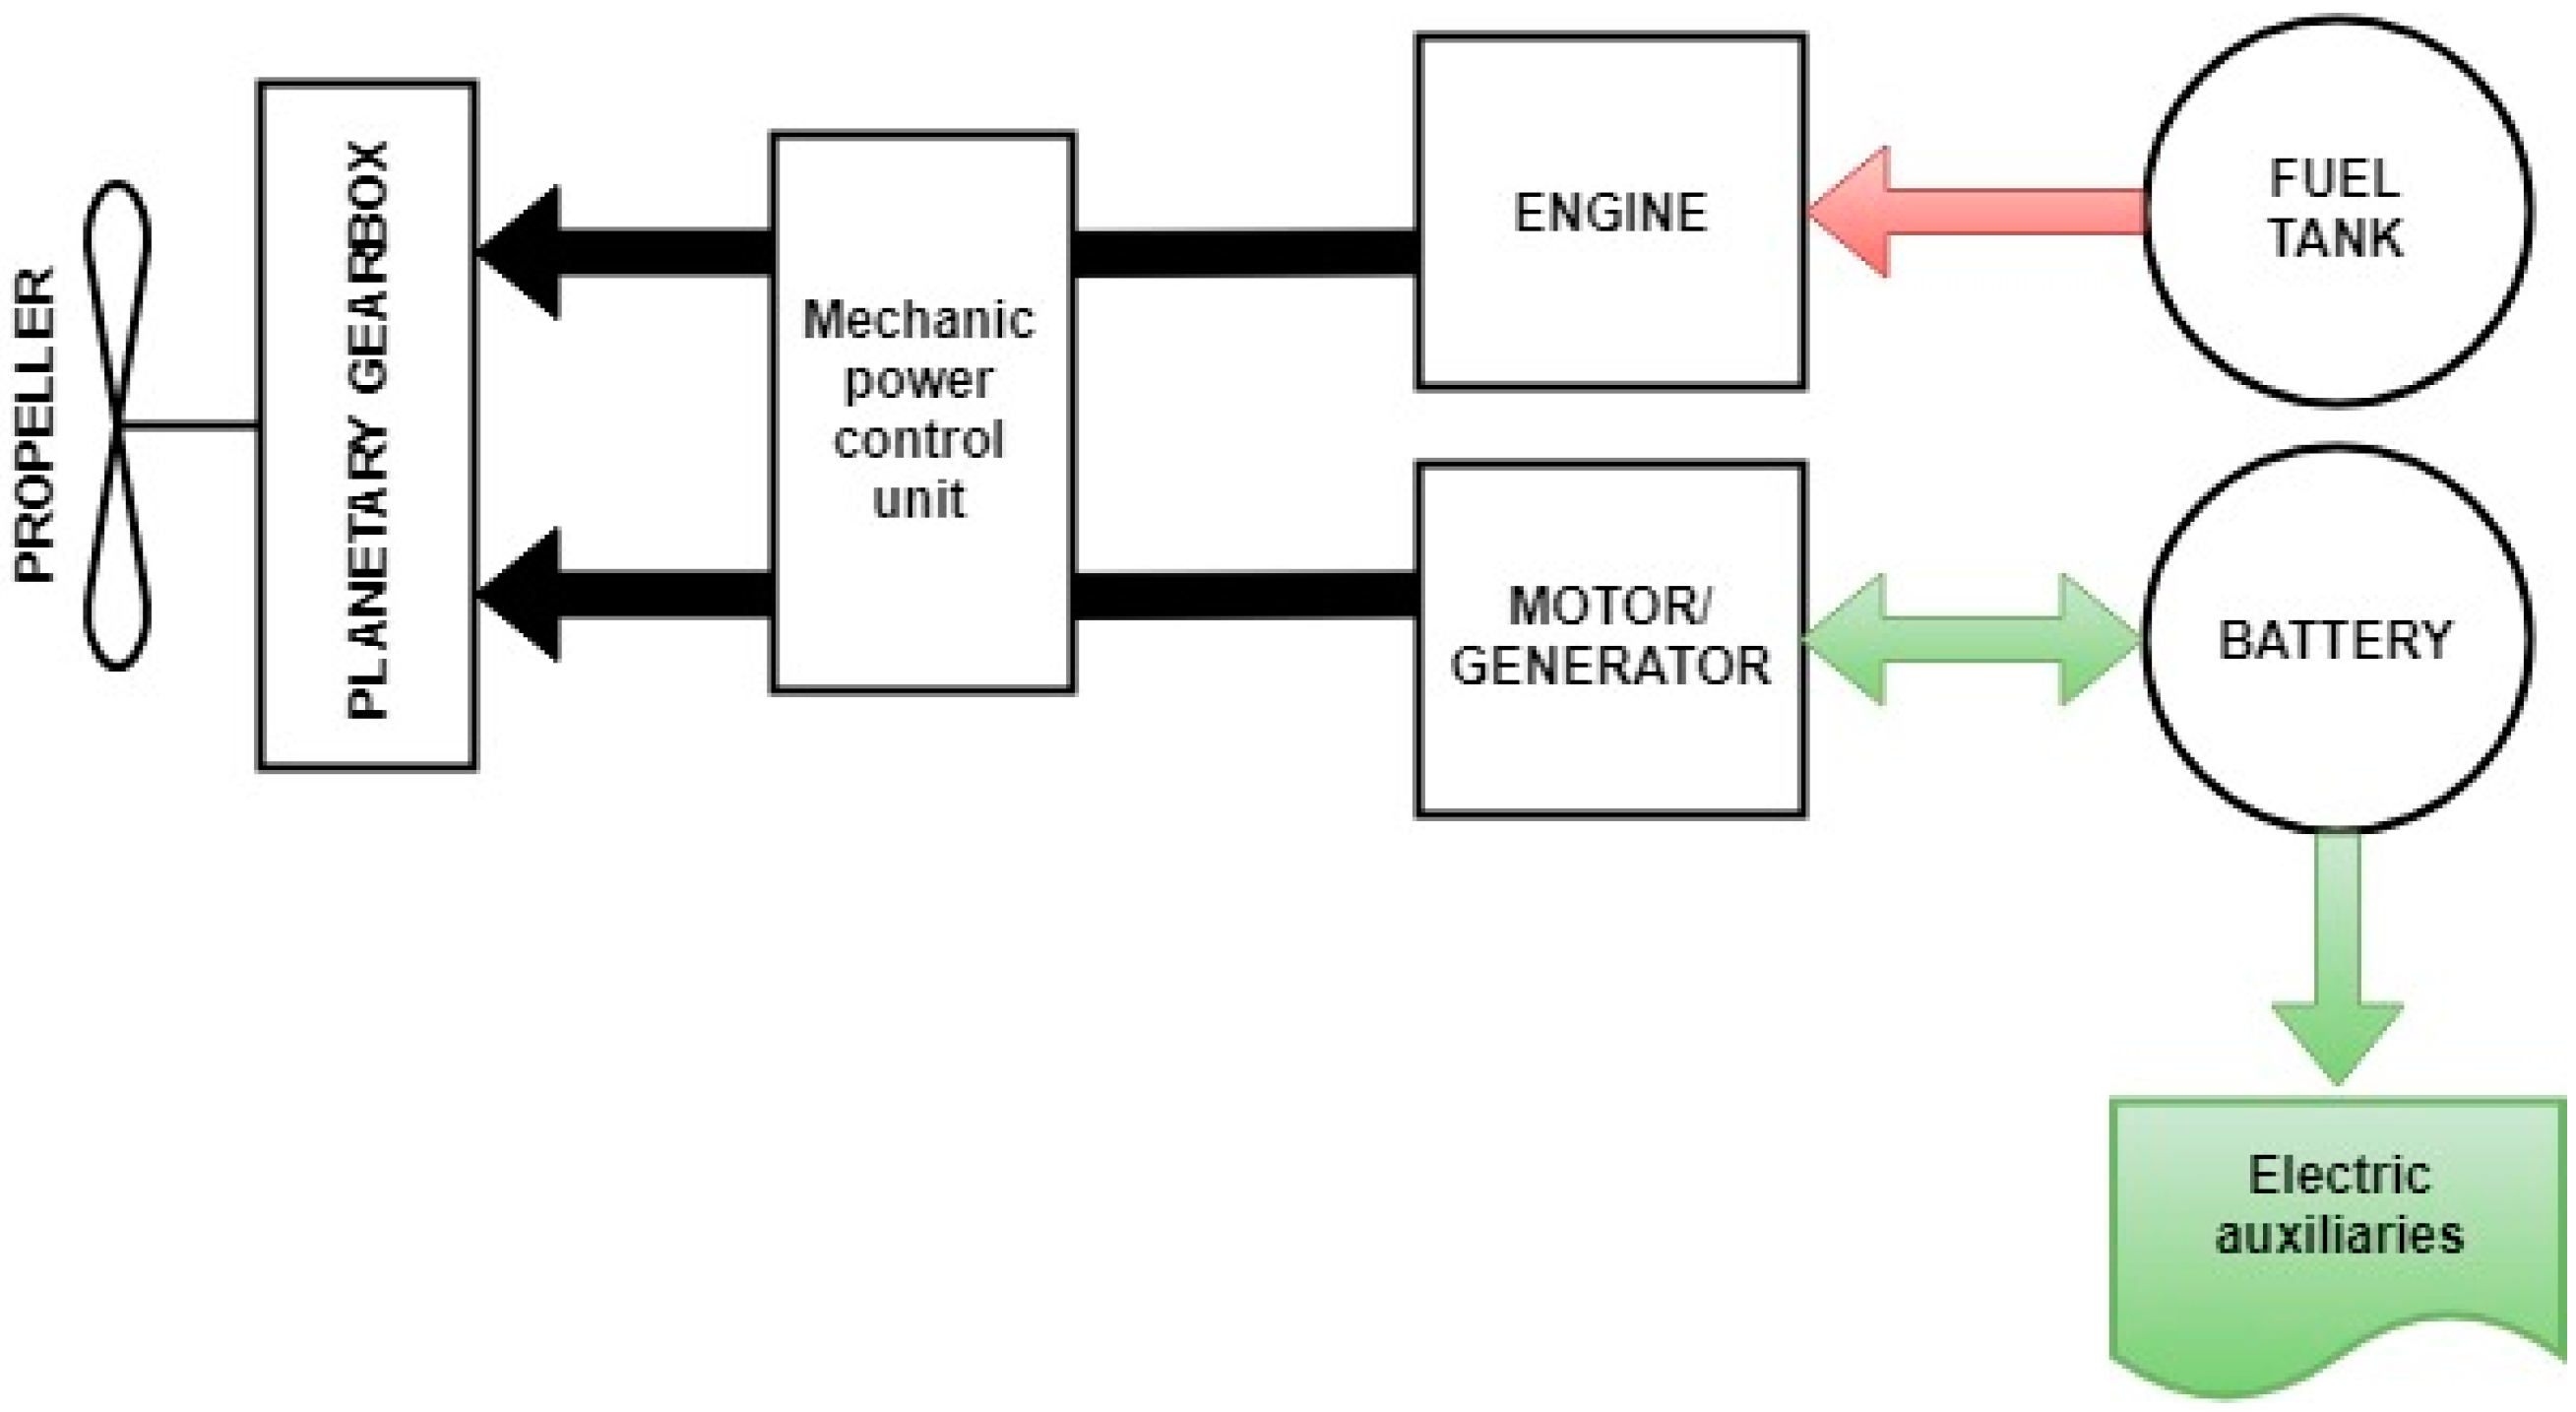
2, and a take-off mass 1,020 kg). The Predator RQ was equipped with a gasoline engine, while a parallel hybrid electric power system was considered in this study. In particular, a Permanent Magnet electric machine and a two-stroke diesel engine were mechanically connected to the propeller, through an appropriate gear box, as shown in
Figure 8. Two energy sources were available—a fuel tank and a battery.
The electric auxiliaries in
Figure 8 were assumed to draw a power of 3 kW, at each phase of flight, as suggested in Reference [
19].
The objective functions of this problem were the maximum electric endurance of the battery in a single discharge cycle (to be maximized) and the total fuel consumed during the whole mission (to be minimized). These goals were subject to a series of constraints to ensure that:
The total fuel consumed did not exceed the total fuel mass transported by the airplane, which was a constant value of the problem;
The battery discharge and recharge currents were lower than their maximum values, Crate and rCrate, respectively, which in turn depended on the battery technology;
The take-off field length was lower than 1100 m to allow the usage of a large number of runways;
The additional volume that the hybrid-electric powertrain required was less than 200 L;
The power system had to guarantee, at each time step, a power at least equal to that needed to fly the aircraft (). This was not obvious because the engine was downsized, with respect to the takeoff requirement and the additional power of the motor was not available when the battery was discharged.
Summing up, it was possible to formalize the optimization problem as follows:
The MALE-UAV model presented in
Section 4.1. The design vector
included several parameters that are grouped in the tables that follow, according to their roles. In particular,
Table 4 lists the variables defining the size of the main components of the powertrains, namely the engine, the motor, and the battery. For the battery, it was also possible to choose between the different Lithium-based technologies (as explained later), with different ranges of nominal capacity and different energy densities.
The power request could be fulfilled in four possible operating modes:
Mode 1. Thermal (the engine produced all the power required by the propeller);
Mode 2. Electric (the propeller shaft power was generated by the motor using the battery as the only energy source);
Mode 3. Charging (the engine generated the power to move the propeller and to charge the battery, while the electric motor worked as a generator);
Mode 4. Power-split (both the engine and the motor generated mechanical power that was delivered to the propeller).
The transition from one mode to the other, i.e., the split of power request between the motor and the engine, was controlled by a simple, rule-based strategy. In particular, take-off was always performed in Mode 4. Climb and descent could be performed in Mode 1, 2, 3, or 4 (when feasible). Cruise was performed as a sequence of discharge/recharge process of the battery, i.e., alternating Modes 4 and 3, or Modes 2 and 3. The specific power split during these phases was regulated by the control parameters discharge and the recharge currents of the batteries, respectively (see
Table 5).
The mission performed by this kind of UAV [
19] consists of seven phases—takeoff, climb, outbound to reach the exploration zone, loitering on-station, inbound, descent, and landing to the base station.
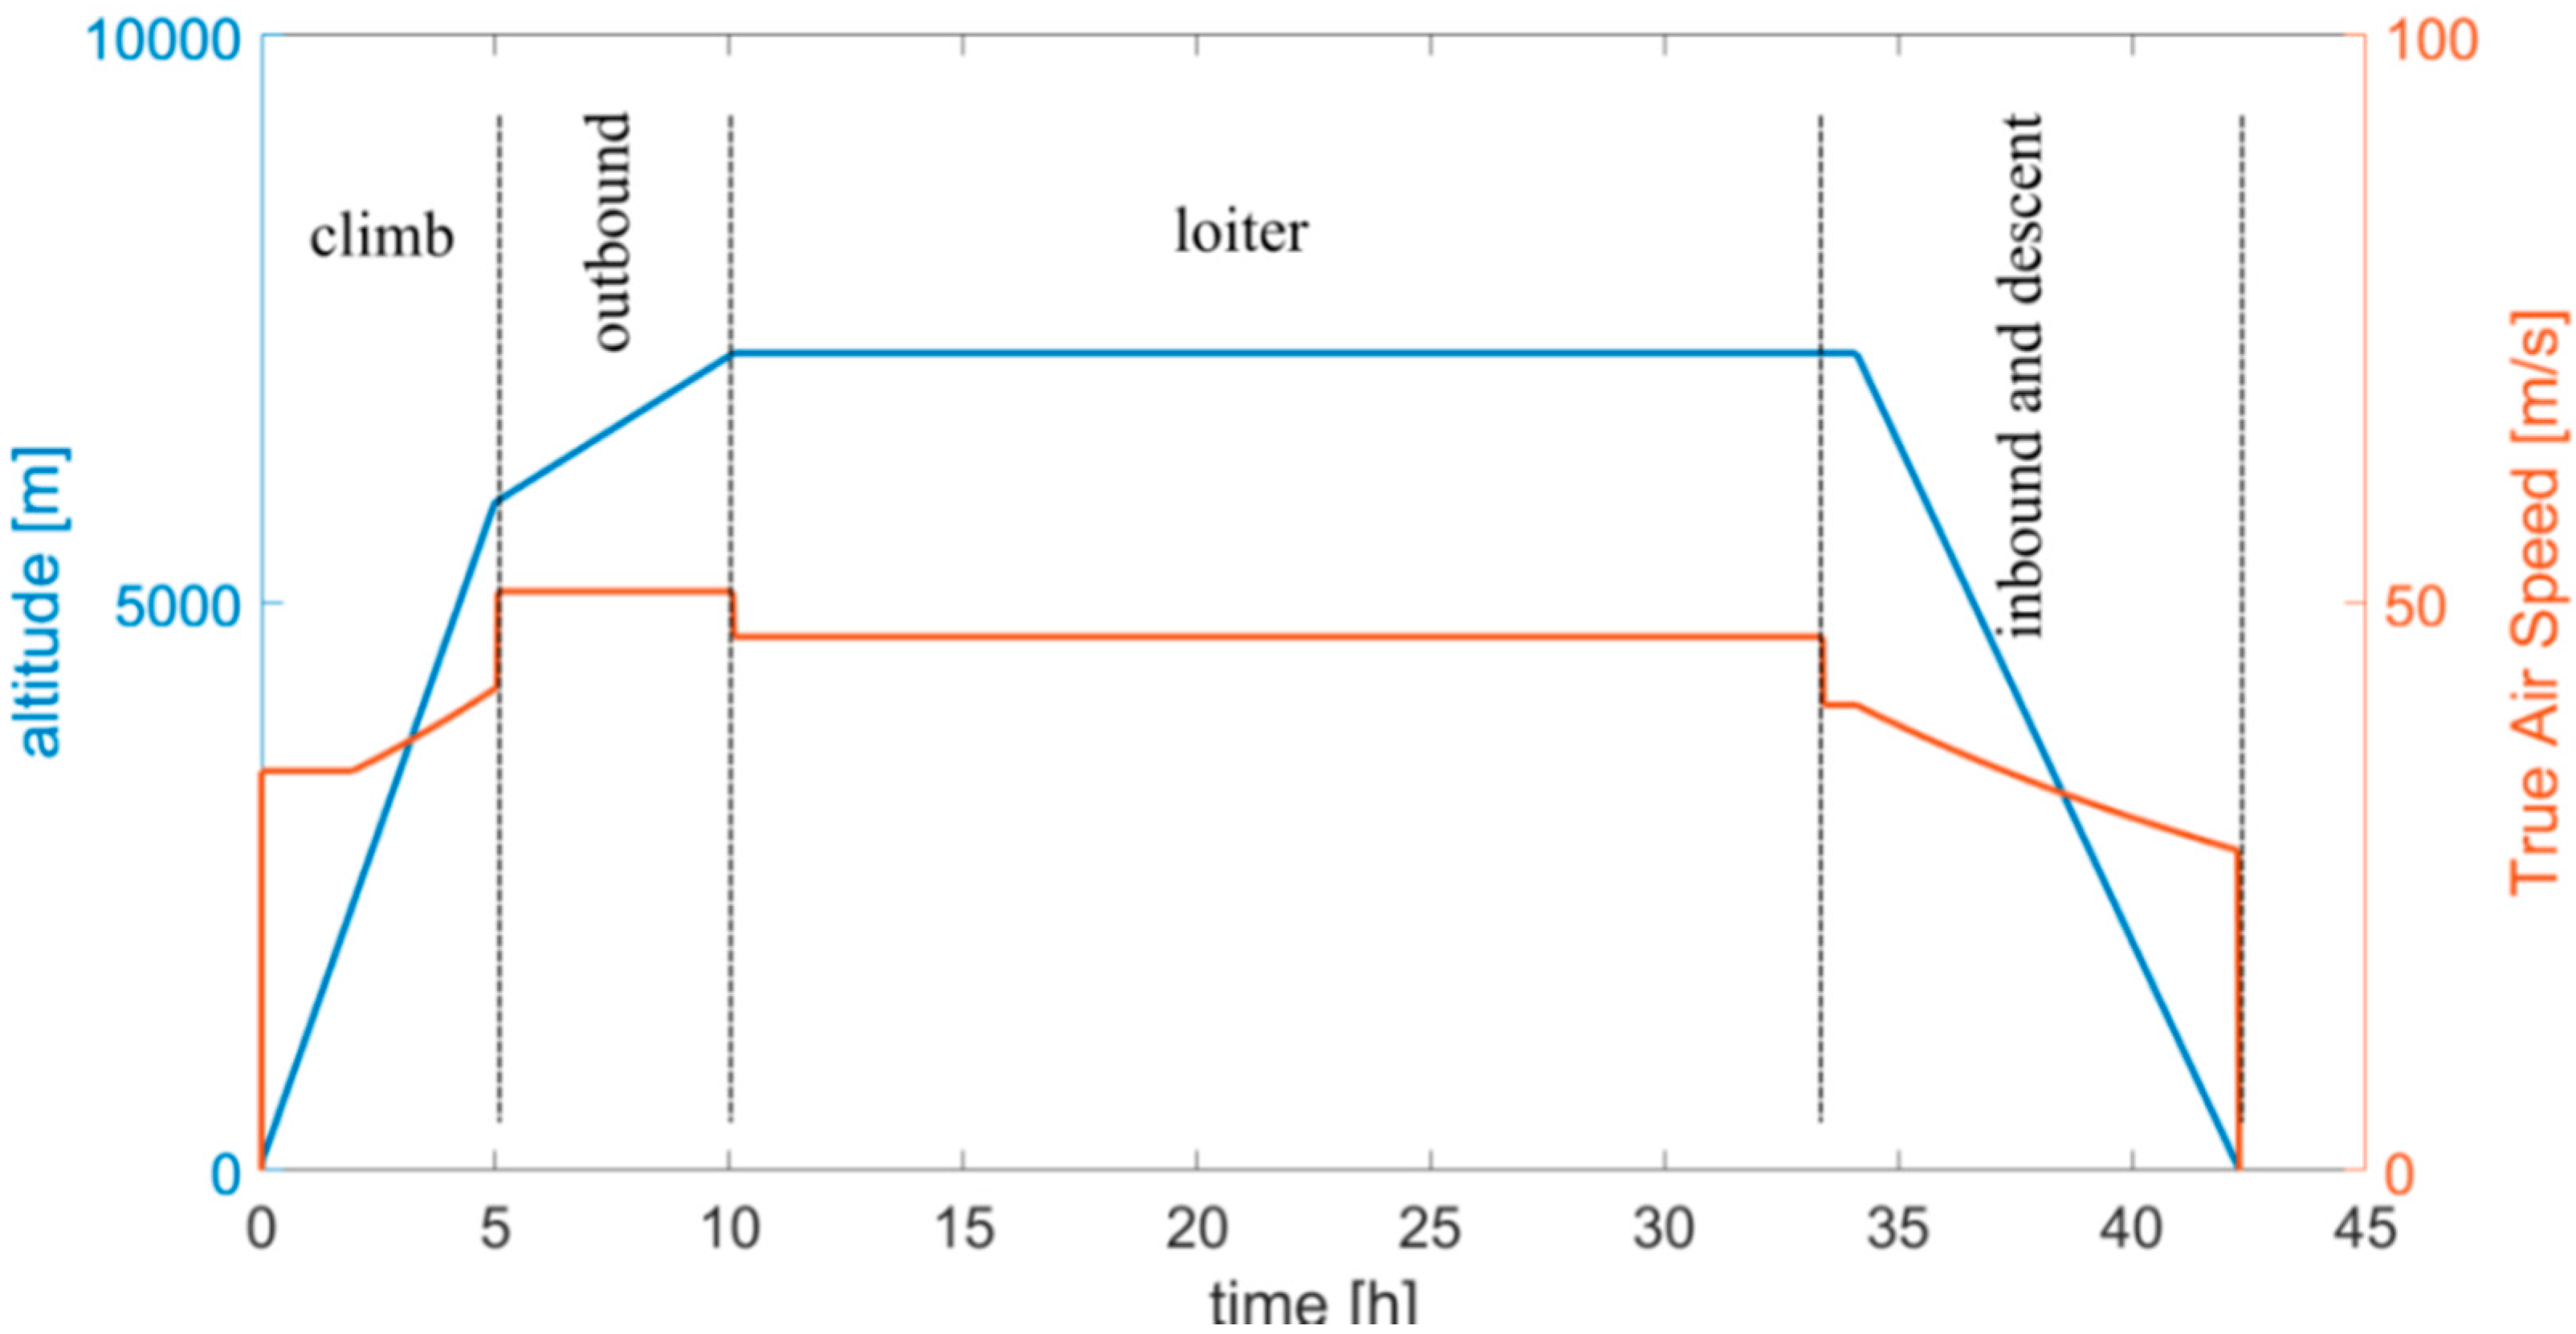
Figure 9 shows a schematic mission similar to that found in [
19]. The mission includes a very long loiter phase of 24 h, which could not be performed with an all-electric power system. This mission was used as baseline case for optimizing the powertrain only.
In the quasi-static simulation approach used in this second test case, it was also possible to include the details of the mission in the optimization, if the designers were given some degrees of freedom in choosing the speeds and altitudes of the different phases of the flight, in particular, the climb, outbound, inbound, and the descent. For this, a parametric mission profile could be generated, using the design variables of
Table 6.
Note that this dual-objective optimization has already been discussed in Reference [
11], but only in terms of the computational performances of the evolutionary optimization algorithms, to identify the best algorithm for this test case (SMS-EMOA [
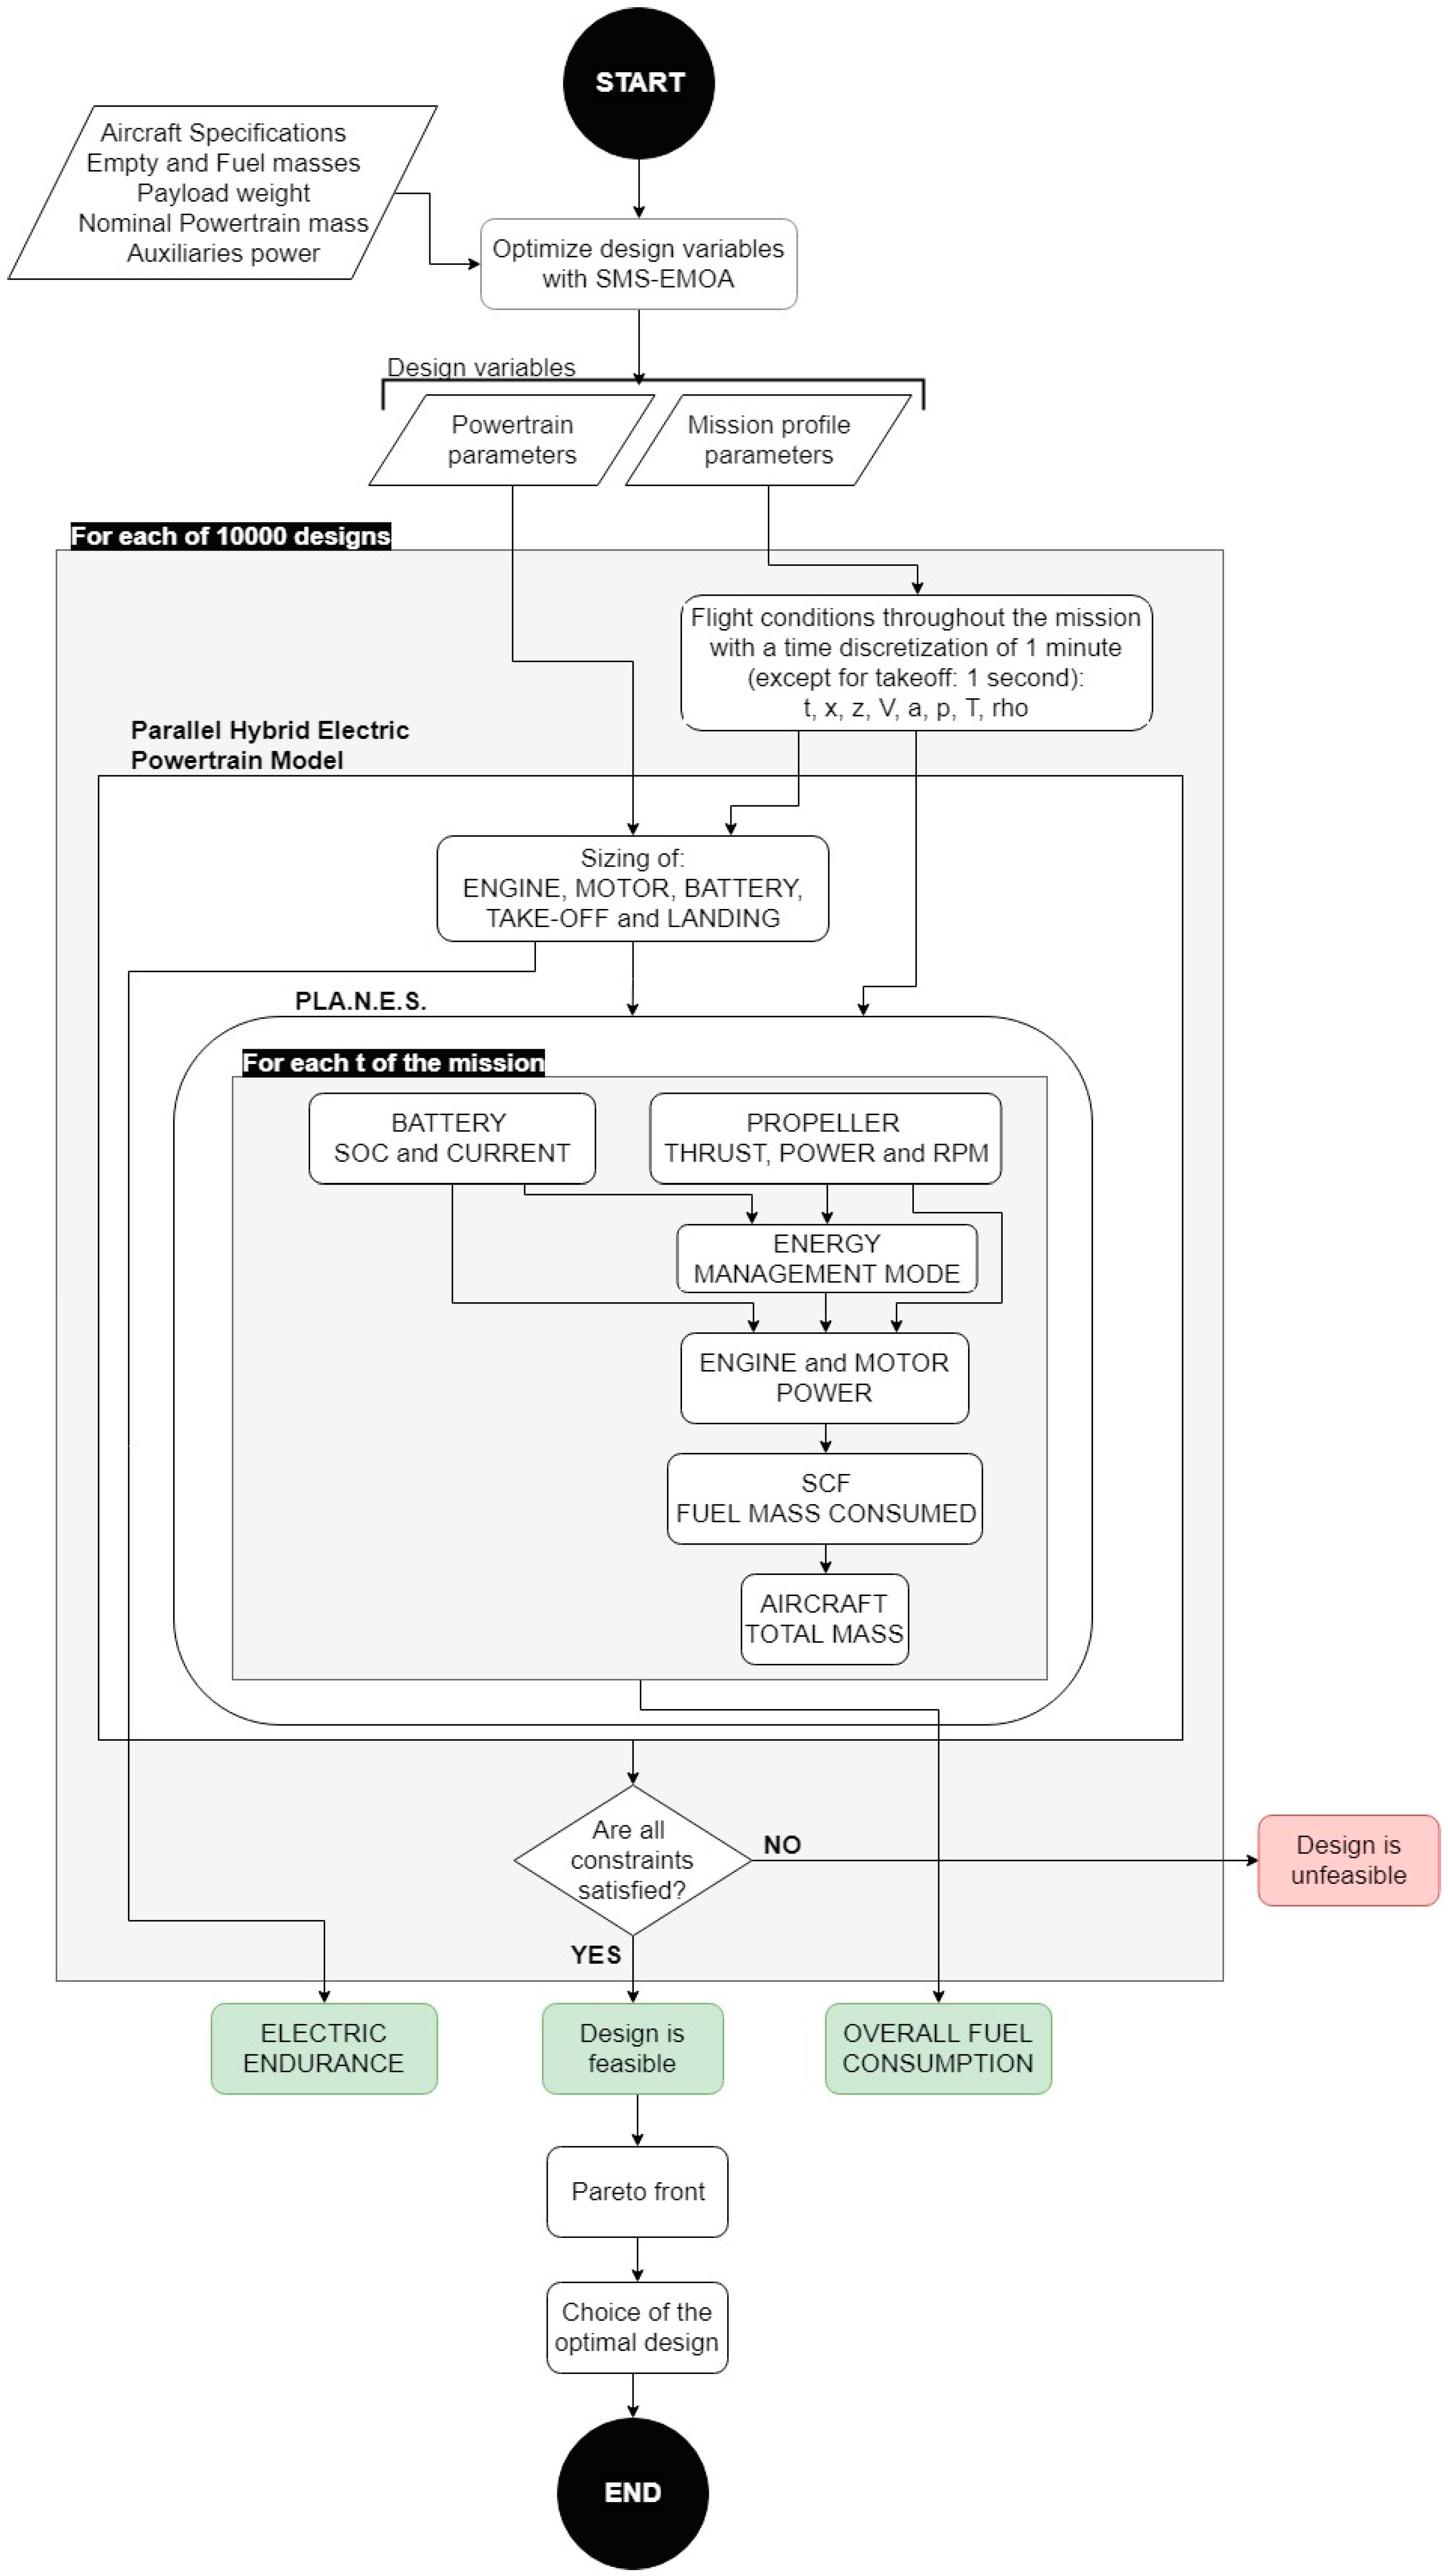
9]). In the present investigation, the focus was on the results of the optimization and in particular on the synergic effects of mission and powertrain. The full flowchart of this optimization has been reported in
Appendix B.
4.1. Simulation Models
Different from the first test case, the performance of the hybrid electric power system, i.e., the two goals, were evaluated as a function of the input variables, with a more detailed simulation approach derived, with appropriate modifications, from the automotive fields [
20]. The flowchart of the full simulation process has been shown in
Appendix B. Here, follows a brief description of the sub-models used for the components of the powertrain included in the optimization. The propeller was not specifically modeled in this test case, because it was assumed that a propeller with an appropriate efficiency could be selected for each design. The efficiency of the propeller was set to different values, according to the flight phase. Similarly, neither the size of the components nor the energy flows between them were supposed to affect the losses in the mechanical transmission and the coupling device. As in the case of the electric VTOL-UAV, the limited accuracy of these models could affect the absolute values of the performance indices but not the synergic effects analyzed in this paper. For more details on the sub-models and on the quasi-static simulation approach, please refer to [
7,
20].
4.1.1. Engine
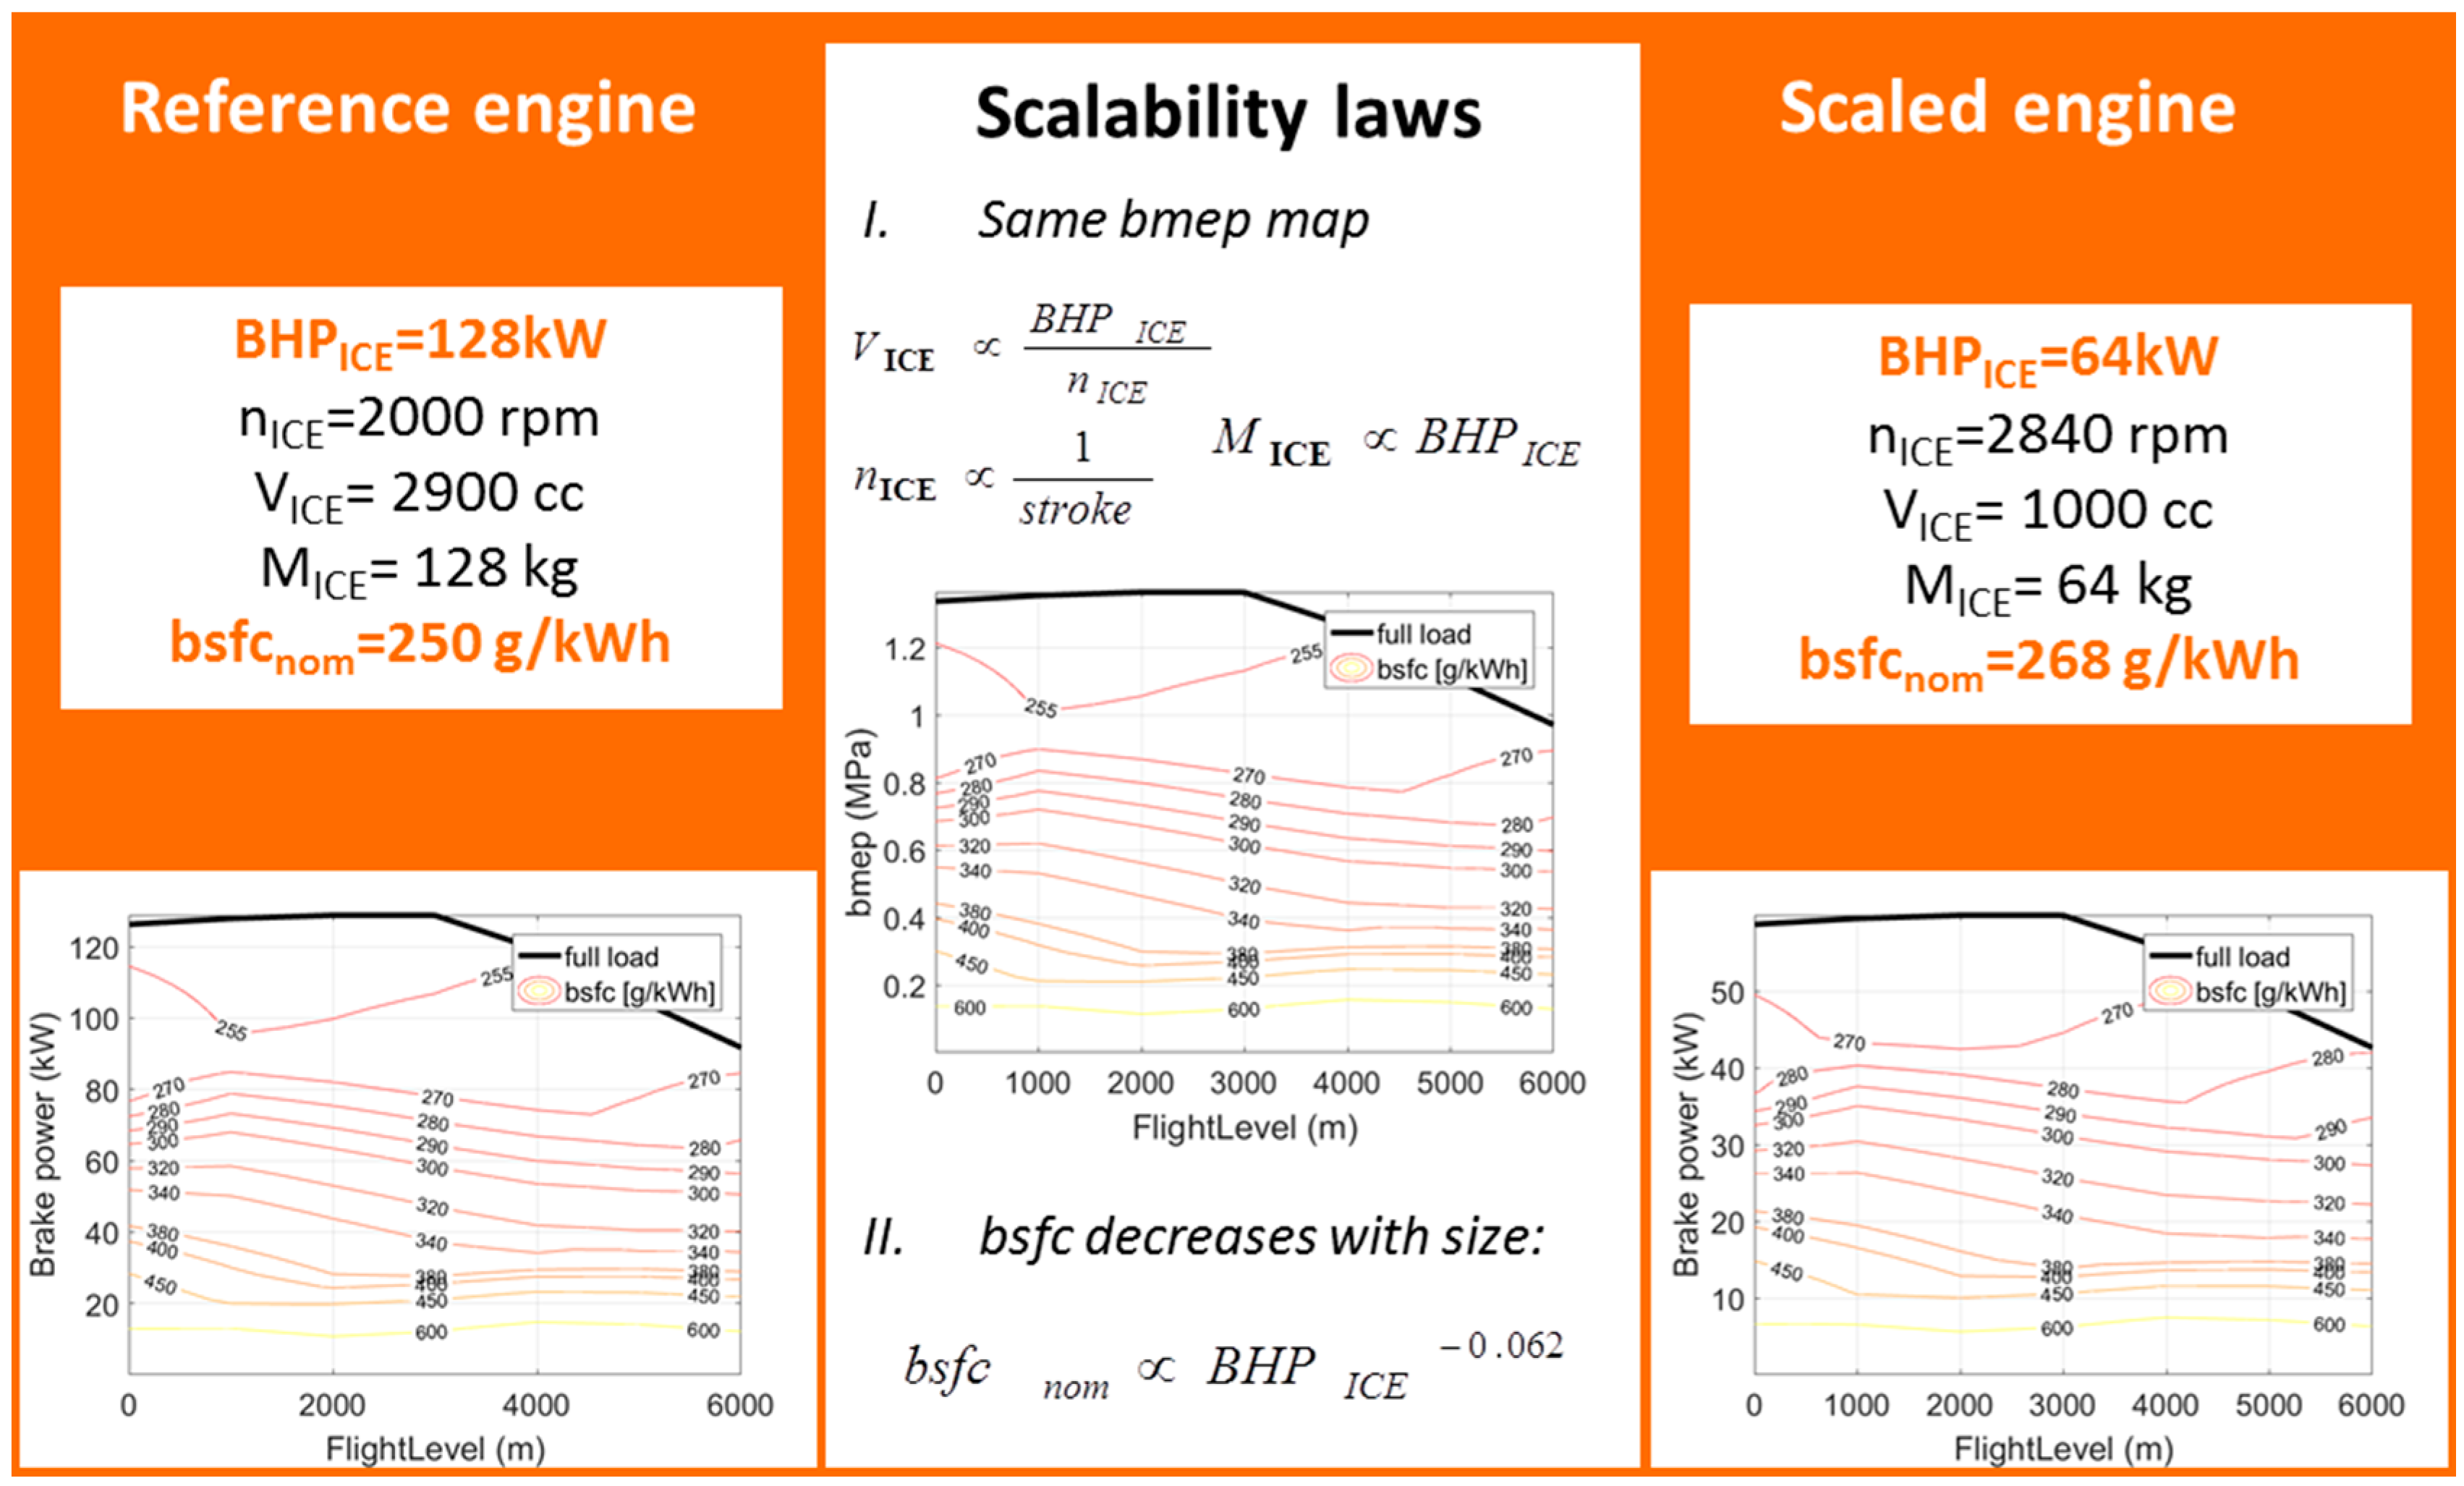
The weight of the engine and its efficiency at each time step were calculated with a scalable model that accounted for engine size, load, and altitude, at a constant speed (
Figure 10). The scaling procedure started from a reference engine whose nominal values of power, speed, and brake-specific fuel consumption (bsfc) were known a priori [
7], together with the engine weight and the efficiency map (see left part of
Figure 10). Then the scaling procedure proposed in [
10] was used to estimate the weight, the displacement, and the revolutions per minutes of an engine, with the same technology, but different nominal power (central part of
Figure 10). The new engine could be assumed to have the same efficiency map, according to [
10]. However, it is well-known that the nominal efficiency of an engine decreases with its size. For this reason an appropriate correction, derived by an interpolation of data of the existing engines, was applied here, to obtain the required information for the scaled engine, as shown in
Figure 10 (on the right).
4.1.2. Electric Machine
The nominal power of the electric machine was not an input because this component was sized according to the power that the battery could generate in discharge. Its nominal torque (obtained by dividing its power by the fixed speed) was used to predict the nominal efficiency, the mass and the volume of the electric drive (including the motor and the inverter), as better explained in [
7]. Again, an interpolation of the data on commercial machines was used.
Along the mission, the electric machine worked as a generator or as a motor, according to the rules of the energy management strategy. Its actual efficiency was calculated as a function of its size and working point with the scalable Willans line method, as suggested in [
10]. In the behavior of the generator, the efficiency was mirrored [
10]. Therefore, we could write:
where
is the mechanical power,
the electric power,
γ is 1 in motor mode, and −1 in generator mode.
4.1.3. Battery
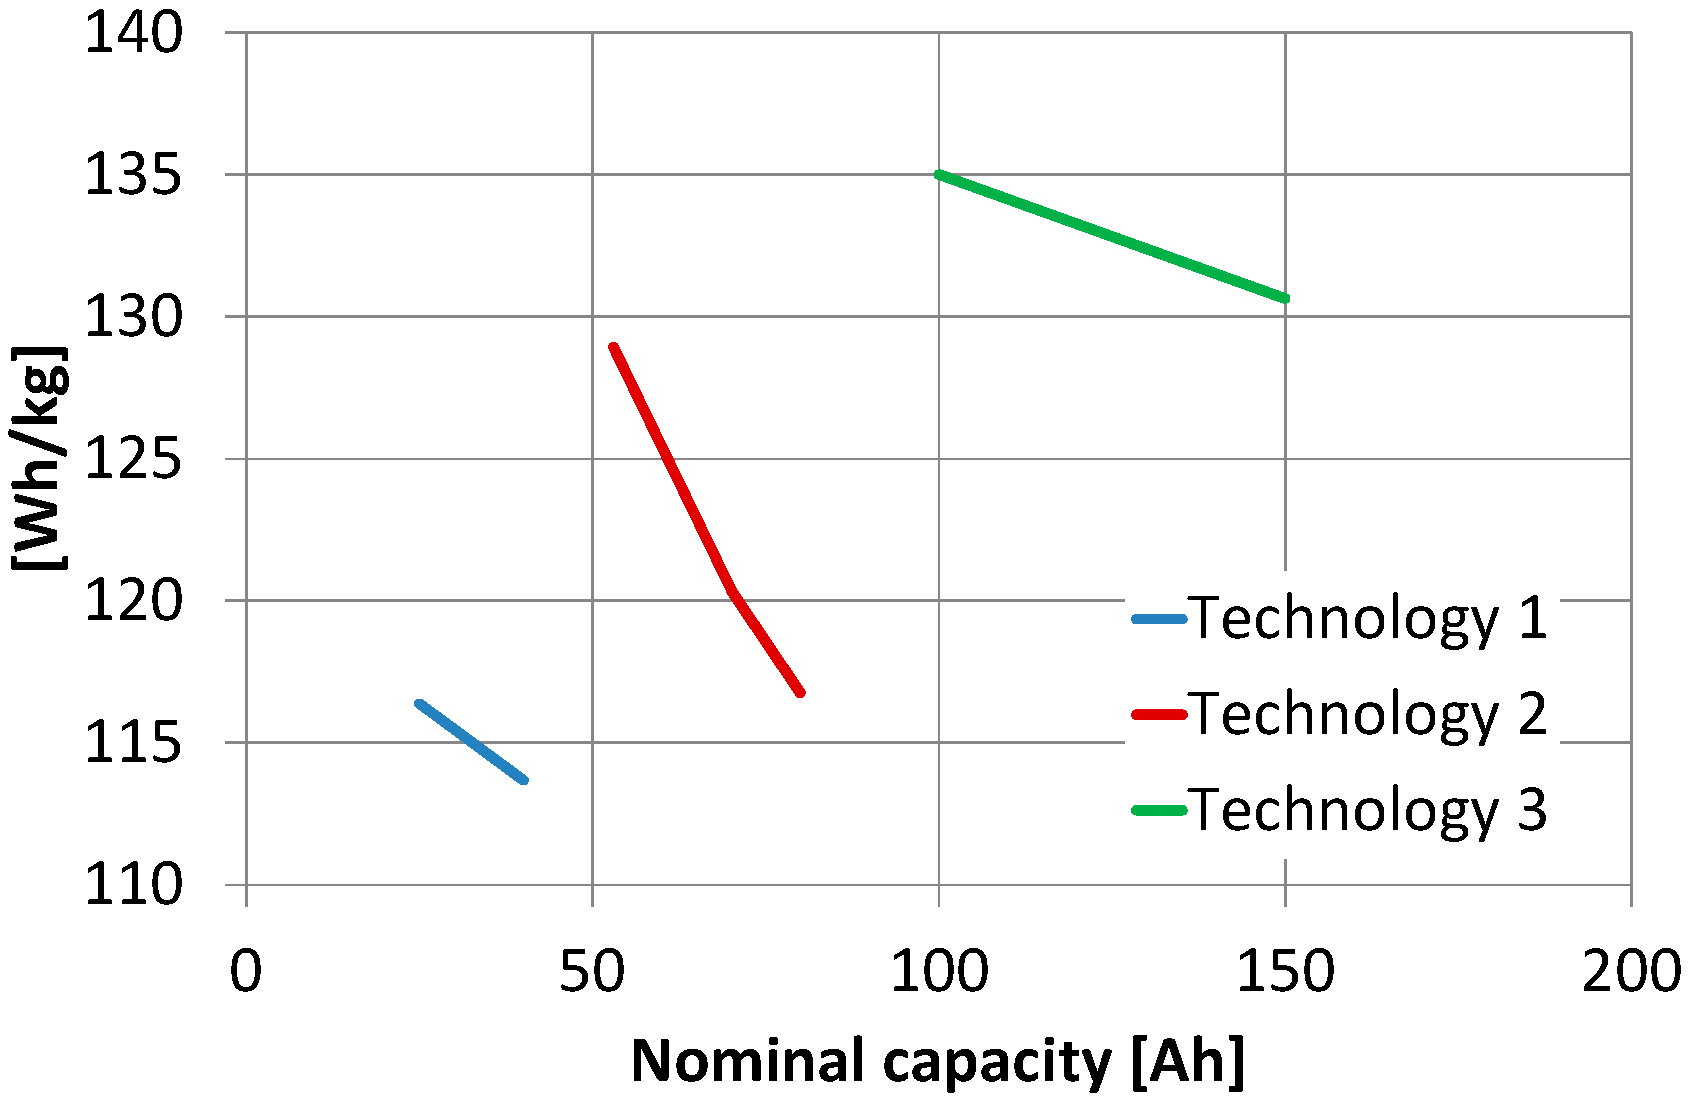
The mass and the volume of the battery were calculated by interpolating a database of existing research batteries belonging to different technologies (see Acknowledgments), as because commercial database were not available for the large Li-po batteries. These technologies differ from the manufacturing details that were not of interest for this investigation. As a result, the volumetric and gravimetric energy densities of the battery pack were a function of technology and nominal capacity, as in
Figure 11. The
Crate was 20 C, for all technologies. The recharging could be performed at a maximum current
rCrate equal to 2 C.
At each time step, on the basis of the battery power decided by the energy management strategy (positive in discharge and negative in recharge), the Shepherd’s model [
21] was used to calculate the open circuit voltage and the current of the battery:
where
RR,
E0,
A,
Kb, and
B are parameters of the model that depend on the battery technology and state of charge (
SOC) is the percentage of the nominal capacity stored in the battery at the previous time and upgraded after calculating the current with the Coulomb integration method (details in [
7]):
4.2. Results and Discussion
This problem was used in order to investigate the synergy between the mission profile and the power system, within the powertrain design, with current technologies for engines, batteries, and motors.
4.2.1. Synergy between Mission Profile and Power Systems
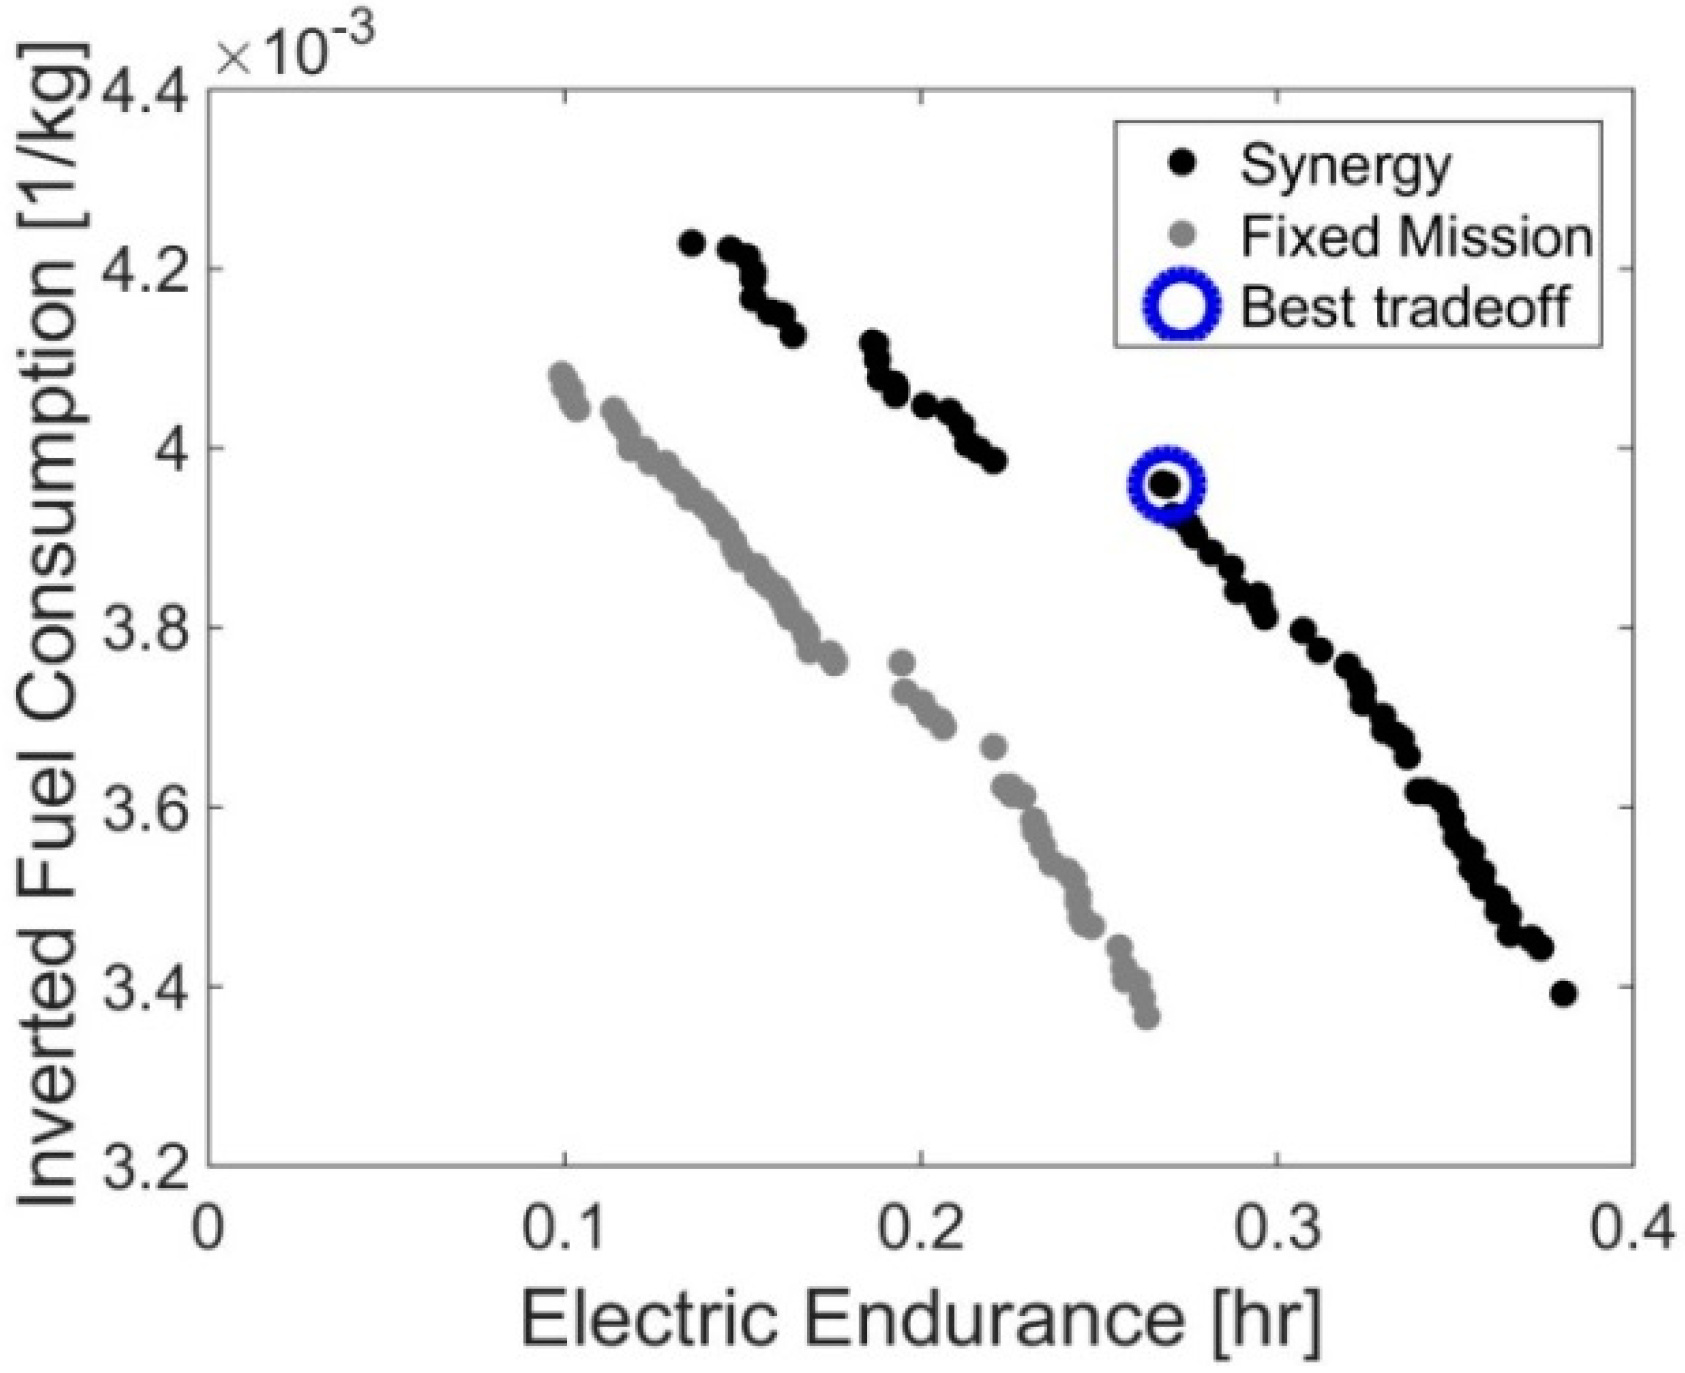
The results of the MALE-UAV optimization are shown in
Figure 12, where the Pareto optimal fronts were obtained with two different optimizations:
The overall optimization, called “Synergy”, where both the mission profile and the power system parameters are optimized.
The optimization of the hybrid electric powertrain only, called “Fixed mission”, where the mission profile is fixed, a priori.
From
Figure 12, it is possible to quantify the benefits obtained by exploiting the synergy between the aircraft mission profile and the power system, in terms of both electric endurance and fuel consumption. In particular, if we look at the bounds of the Pareto front obtained, with the two optimizations, we can notice a 44% increase of the maximum electric endurance and a 3.6% reduction of the minimum fuel consumption allowed by the synergy optimization, with respect to the partial “Fixed mission” case. This was because the powertrain components of different sizes operate better in some flight conditions than others, as explained later.
A “Best_tradeoff” solution (also show in
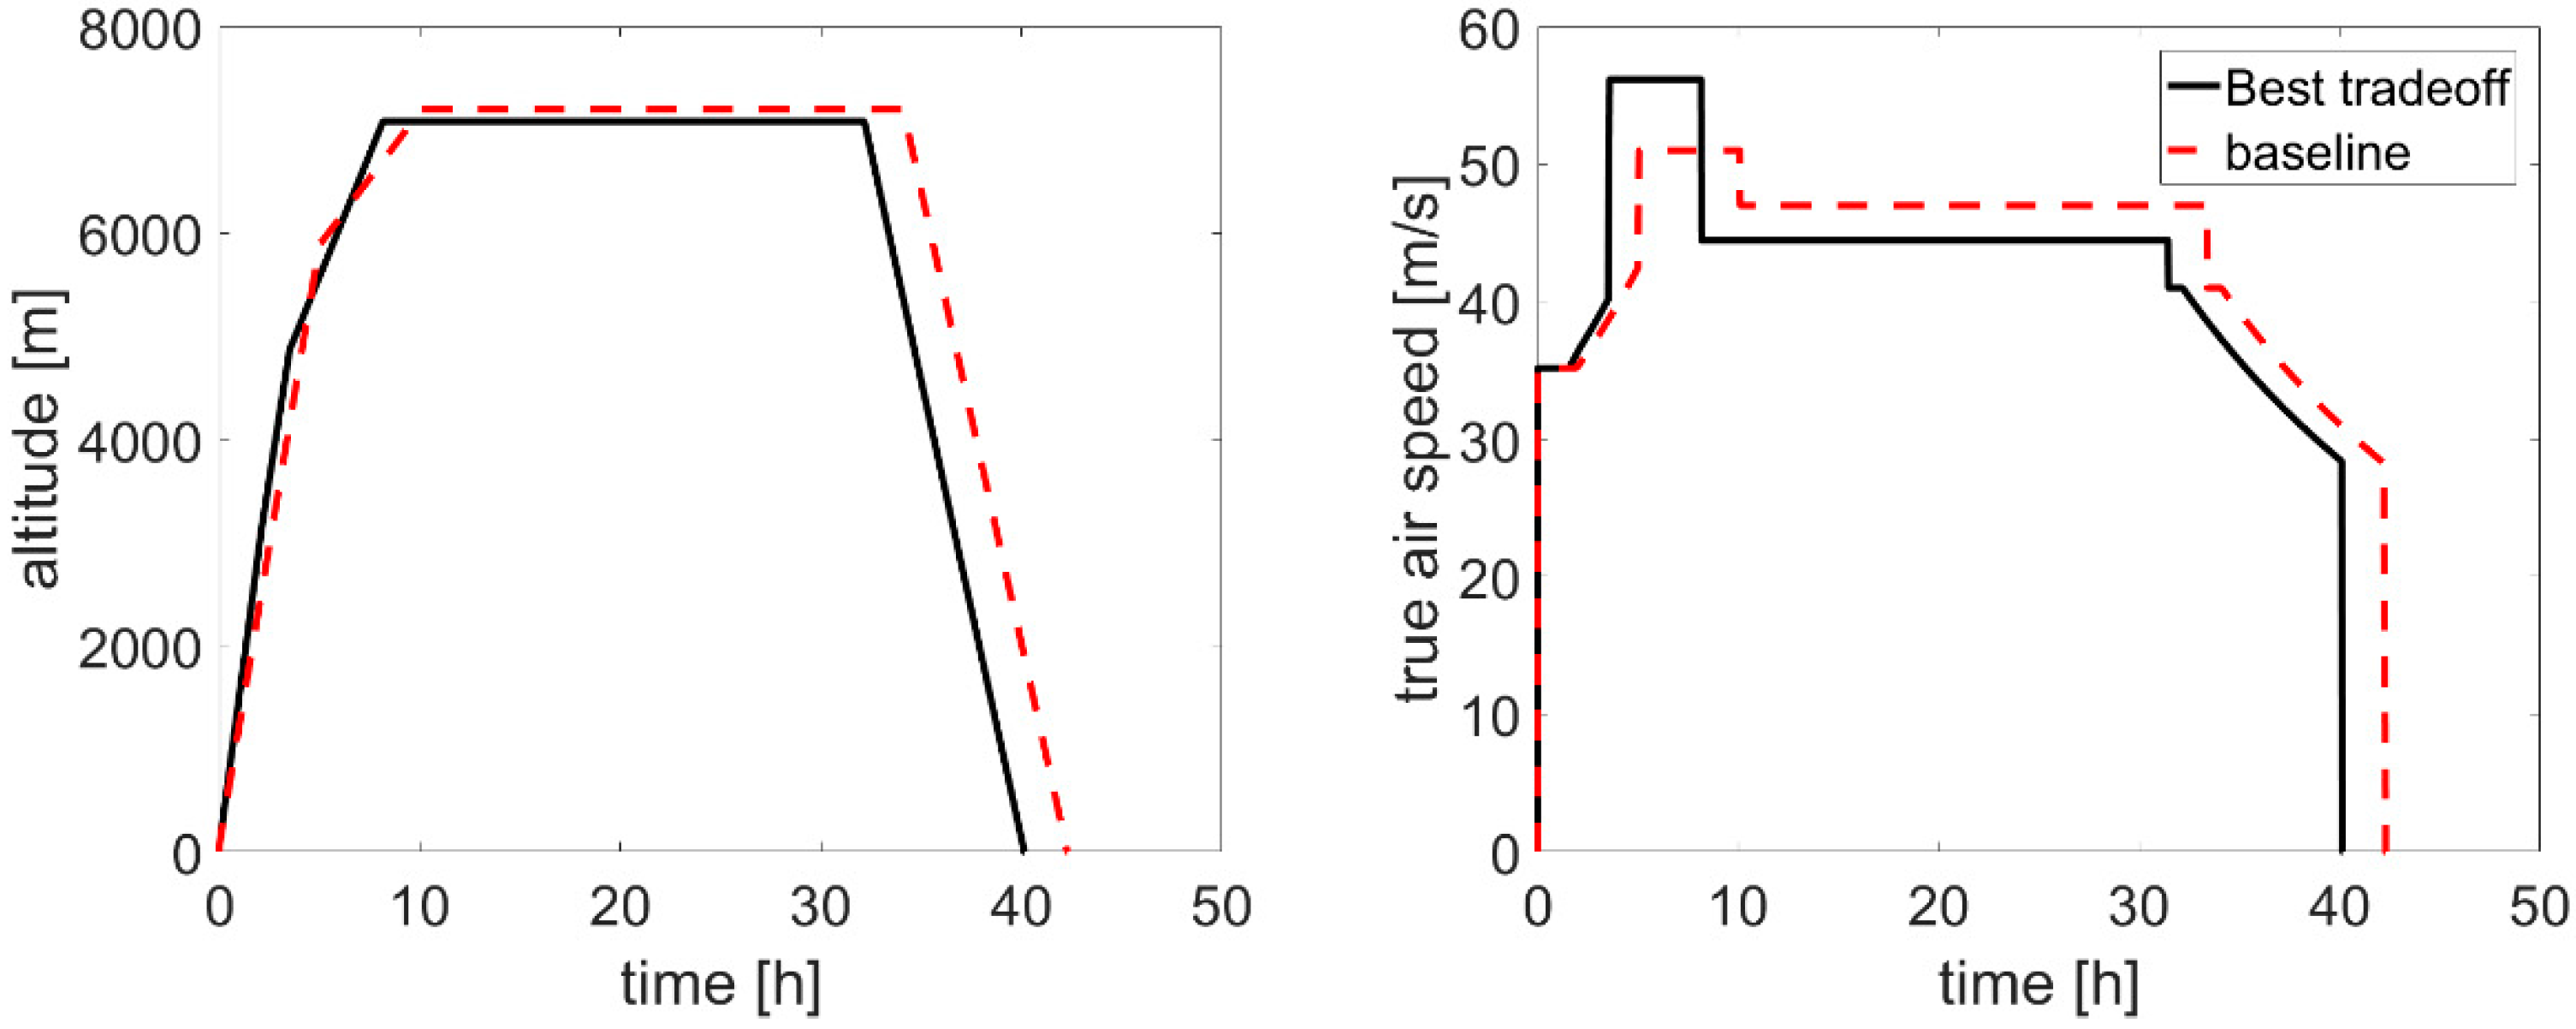
Figure 12) was obtained with the same procedure used for Test Case 1. Its mission profile was reported in
Figure 13, in terms of both altitude and speed, where it was compared to the baseline mission of
Figure 9. While, the values of the other design variables can be found in
Table 7.
Compared to the baseline mission of
Figure 9, the optimal mission (
Figure 13) was characterized by an outbound phase with a higher speed, but a lower altitude, and a faster climb. Note that the loitering-on station was at similar altitude and speed of the baseline case. Since this was the phase of the mission that was specifically connected to the UAV operation, the results of the optimization should not have affected the operational capability of the UAV, but only the time to reach the mission zone (outbound), and come back to the base.
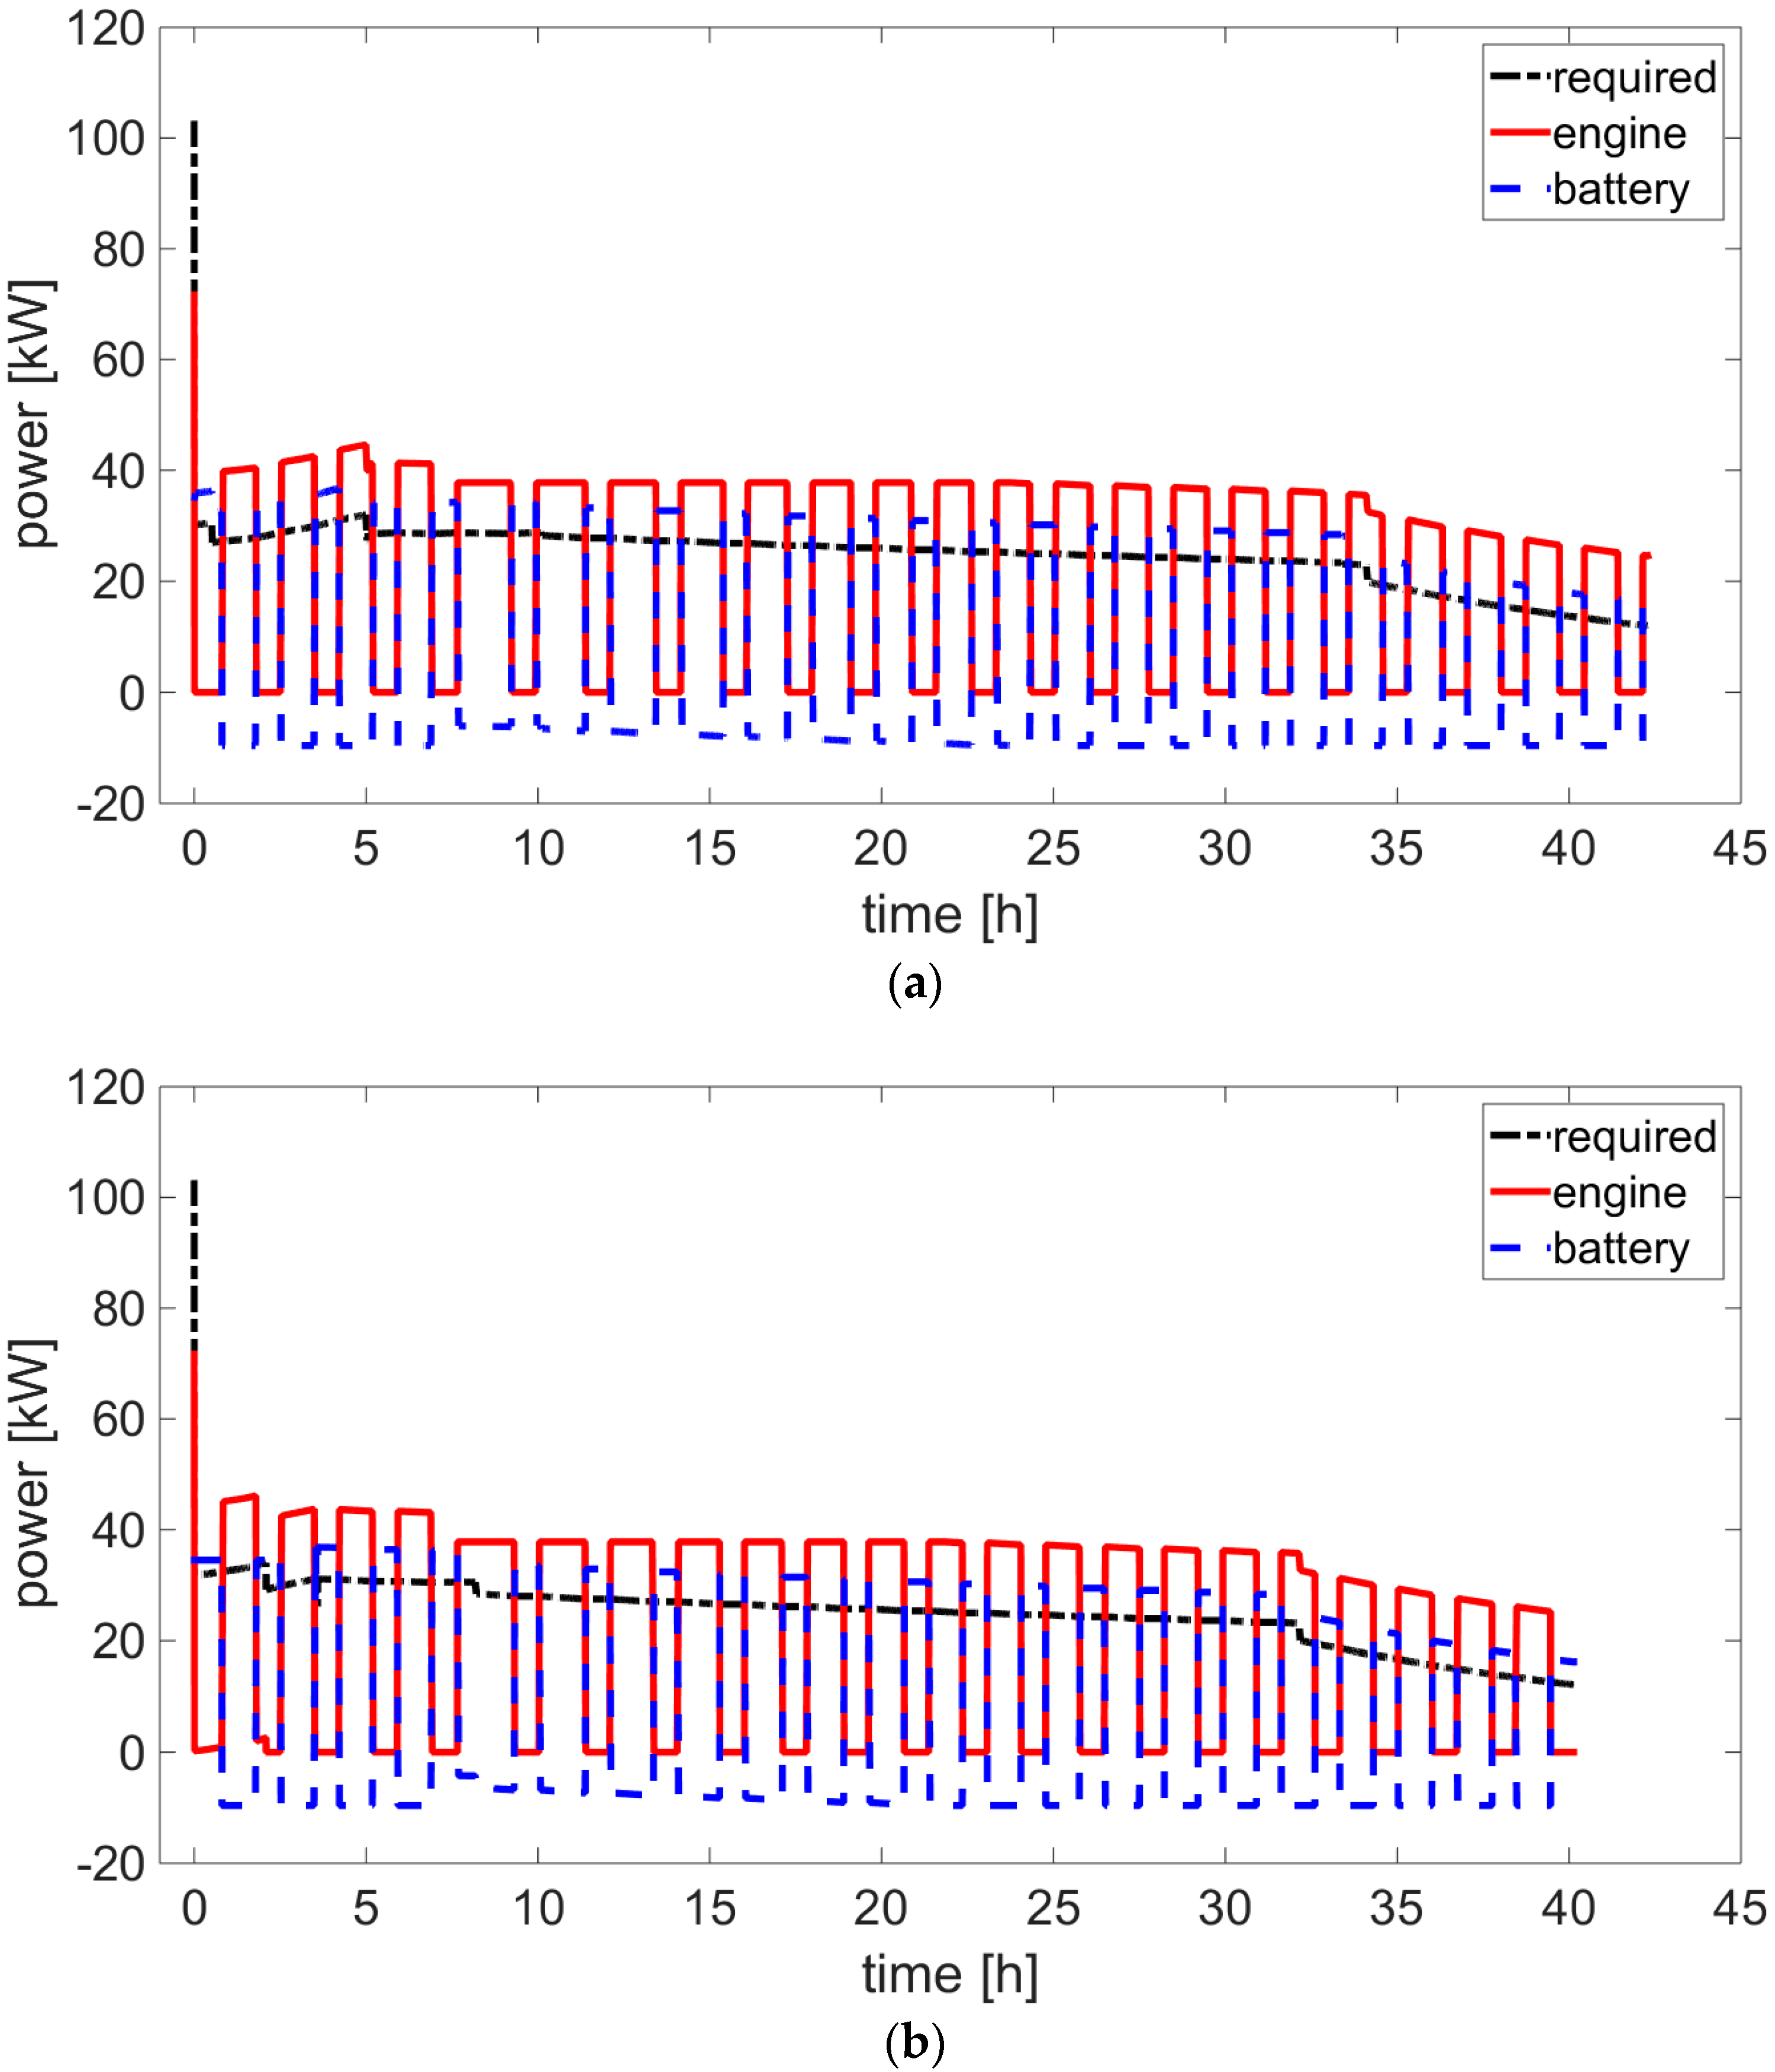
The higher power request of the outbound phase in the optimized mission had a positive effect on the overall fuel economy, because the engine worked at a higher load and, therefore, had a better efficiency. Note that this effect could only be taken into account with the usage of a detailed engine map allowed by the quasi-static approach. Moreover, the optimal mission was shorter than the baseline and this also had a role in the better performance of the tradeoff design. These considerations were confirmed by running the best tradeoff design, over the baseline mission (
Figure 14).
This figure also explained the proposed rule-based energy management, consisting of the performance of the loiter phase, as a sequence of discharge (Mode 2) and recharge (Mode 3) phases for the battery, with the engine working at an almost constant load to improve its efficiency. Note that the engine was assumed to not consume fuel, when the powertrain was in Mode 2. However, the fuel consumption associated with the engine restart or idling could easily be included in the modeling approach [
10]. Other more complex strategies could be considered, but this was beyond the goal of the present investigation.
It is worthy of note that the mission parameters did not change much over the final “synergy” Pareto front. Therefore, we could conclude that once the mission had been optimized, the trade-off between the overall fuel consumption and electric endurance depended on the choice of the other type of design parameters, namely the size of the components (
Table 4), and the energy management (
Table 5).
4.2.2. Synergy between the Size of the Components and Energy Management
Let us analyze, in details, the variation of the main design parameters, along the fronts in the arbitrary unit, so that the different parameters can be plotted in the same chart.
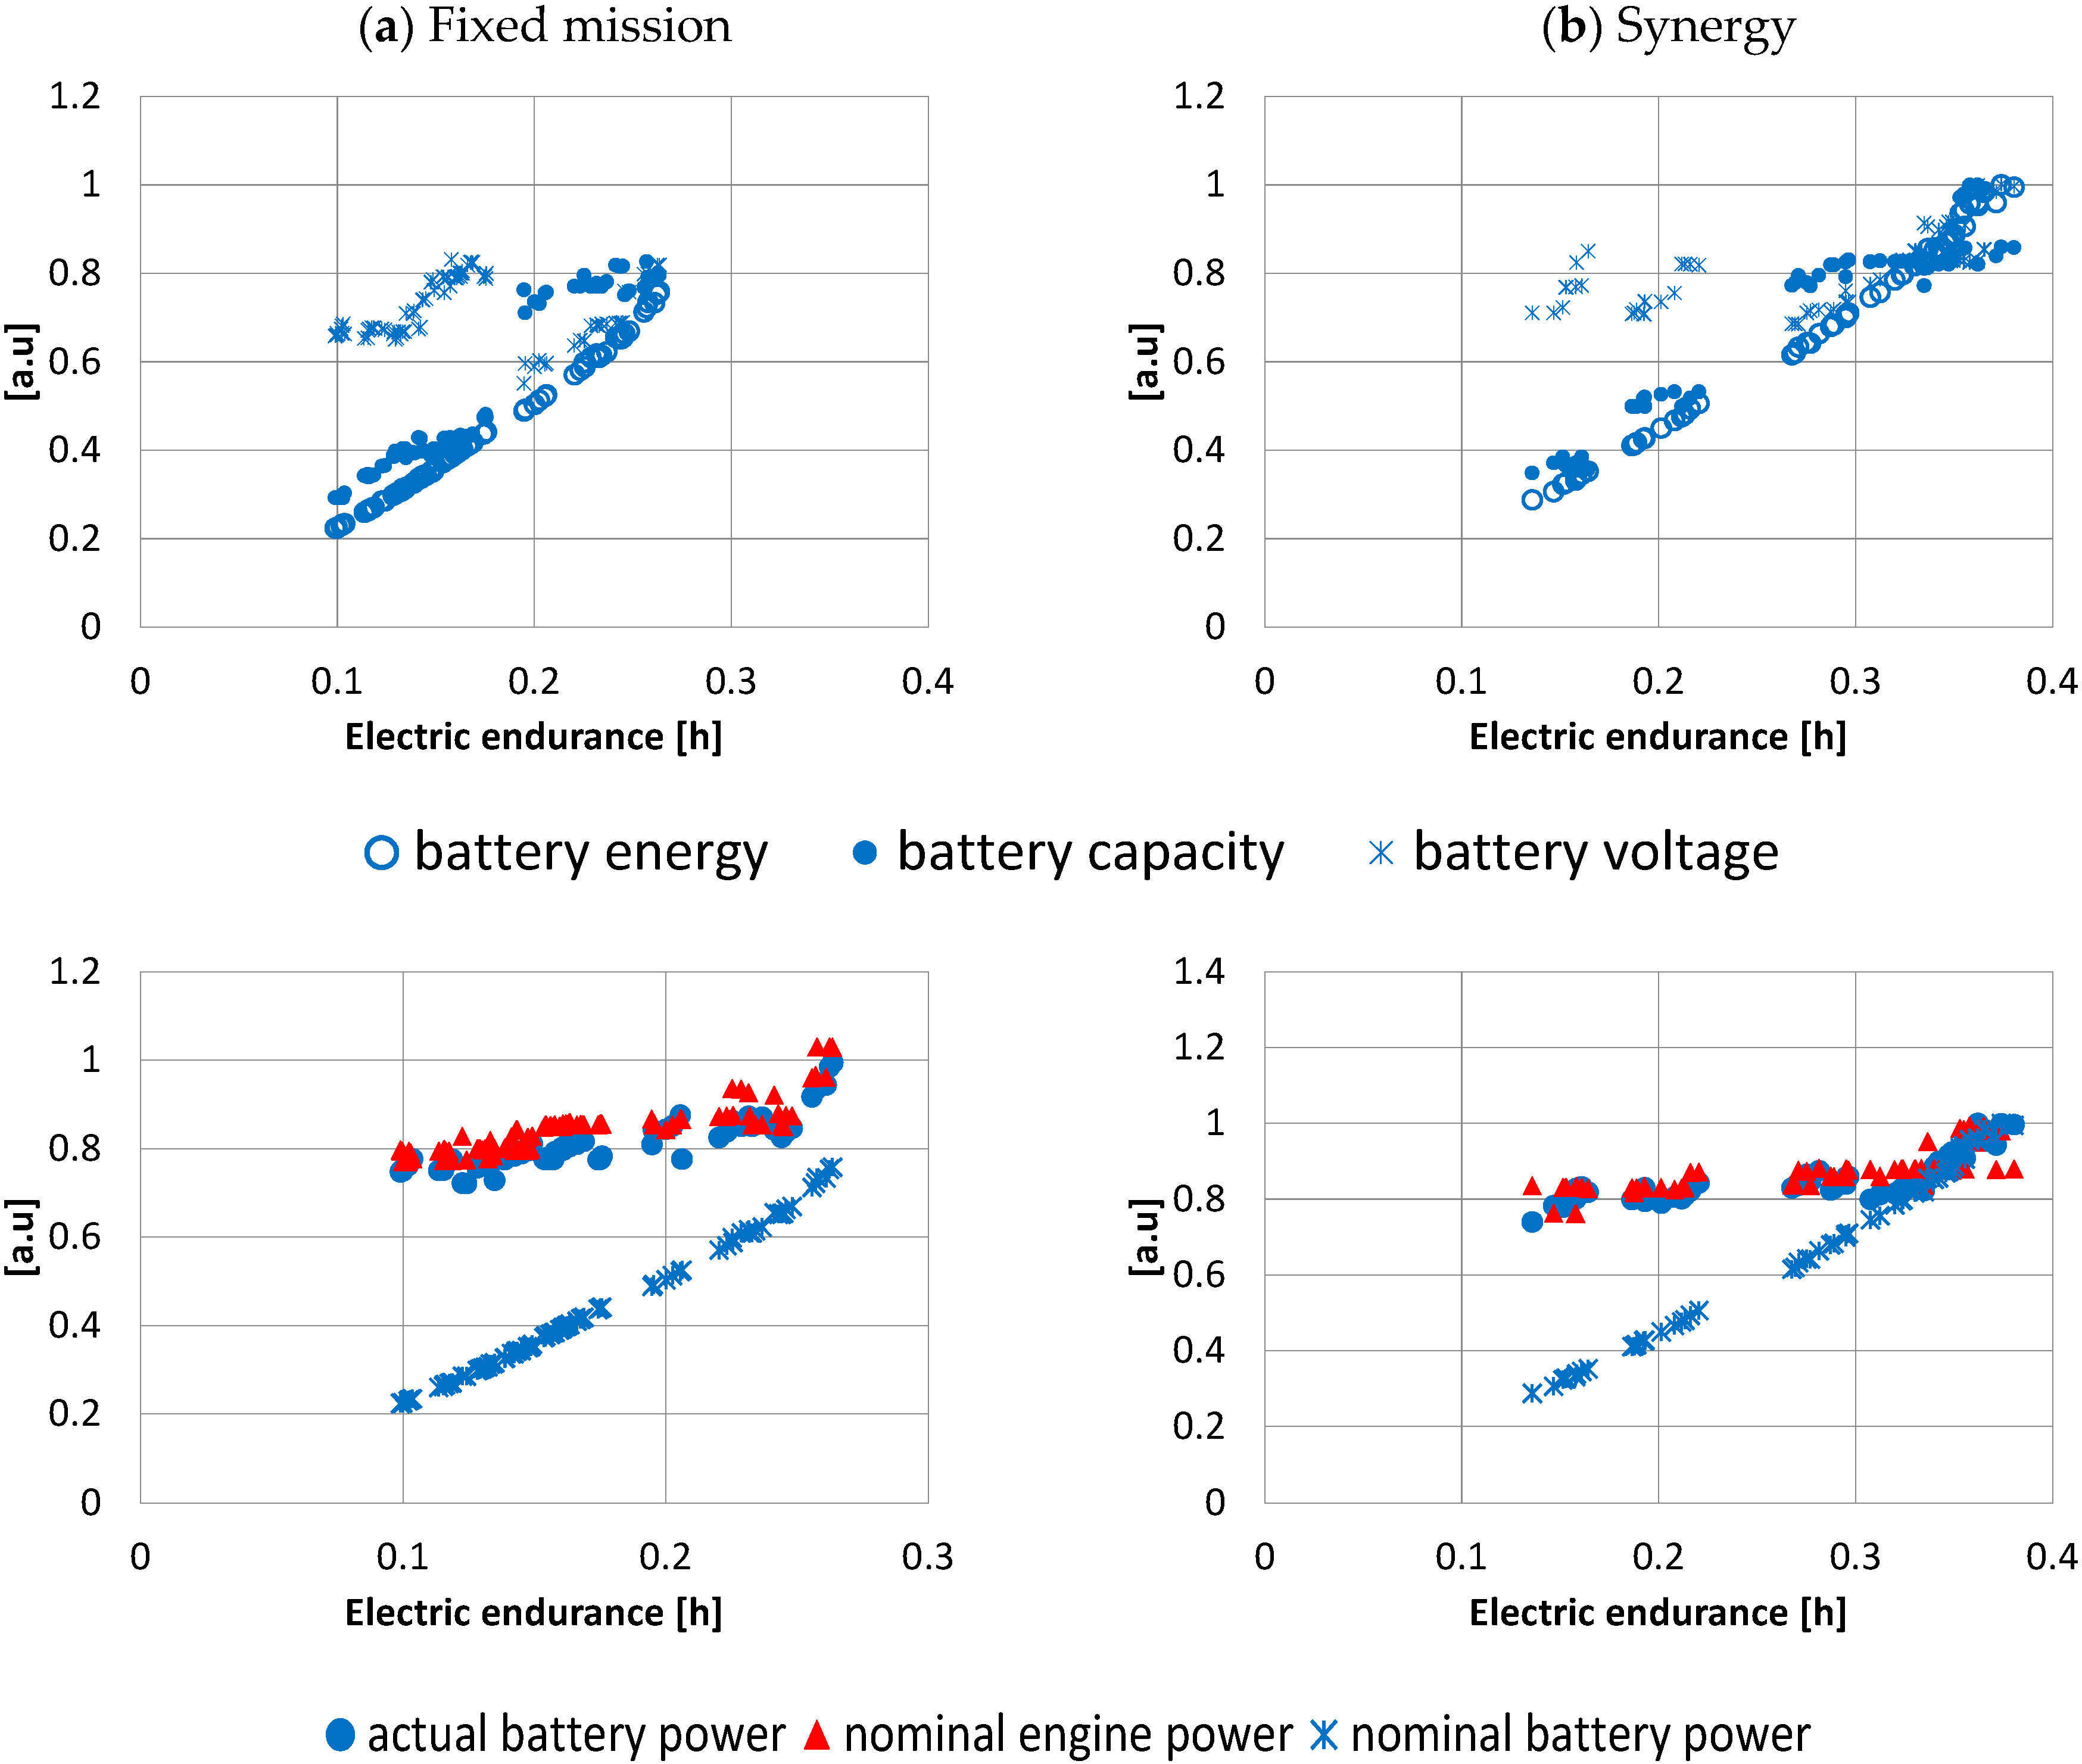
Figure 15 shows how the battery energy and power changes along the fronts of the two optimizations, from the design characterized by a good fuel economy (but poor electric endurance), towards the maximization of electric endurance (at the expense of fuel economy).
The plots shown in the upper part of
Figure 15 include the battery nominal energy, which is the product of its nominal capacity and its voltage; also shown in the first row. We can notice that electric endurance was directly correlated to the energy stored in the battery, as expected. However, from left to right, the increase of battery energy was obtained, first, at a constant voltage, by an increasing capacity until a change in battery technology was needed (gap). In fact, the trade-off fronts in
Figure 12 show an apparent discontinuity (in correspondence of inverted fuel consumption of about
kg
−1, at a fixed mission, and
kg
−1 in the full optimization), caused by the transition from battery technology 1 to battery technology 2 (
Figure 11). After the gap, a further increasing of endurance was obtained at a constant capacity, by increasing the voltage. This was particularly evident in the synergy optimization.
The plots in the lower part of
Figure 15 show the trend of engine and battery powers. For the battery, two kinds of powers are displayed—the nominal power, which is directly proportional to the battery energy, and the actual battery power that depends on the specific energy management strategy. Along the front, from left to right, we can notice a flat course of both engine power and actual battery power, while its energy increased, i.e., to increase the electric endurance, the energy stored in the battery was made increasingly larger but it was discharged at a lower rate. Even if the engine power was the about the same, along a large part of the front, the fuel economy improved because the engine worked at a higher load, due to the increase of the powertrain mass with battery energy. However, this was only possible until a certain value of endurance was reached (0.25 h and 0.34 h in the fixed mission and synergy optimization, respectively). A further improvement of the electric endurance could only be obtained with an increase in both engine power and actual battery power.
5. Conclusions
This investigation proposed a methodology to quantify the synergies between power system, architecture, mission, energy management, and multi-functionalization in electric and hybrid electric unmanned aerial vehicles, with advanced multi-objective optimization tools and appropriate simplified models. To explain the potential of the methodology to exploit the best existing technologies for such advanced power systems (in particular batteries and motors), two test cases were analyzed and discussed.
In the case of the fixed-wing tail-sitter VTOL-UAV, the results show that it was possible to obtain large improvements, in terms of the target performances, due to the synergy between aircraft design and powertrain, with respect to designing structure and power system, separately. In particular, the powertrain optimization gave the main contribution to the results, while, the choice of fixing it, a priori, and optimizing the aircraft architecture, only led to strong suboptimal solutions. In fact, the simultaneous optimization of both architecture and power system provided a 218% higher payload weight, and a 274% higher cruise time, with respect to the optimization of the only aircraft architecture, a +14% payload, and a +7% cruise time, when compared to the optimization of the only powertrain. The levels of multi-functionalization needed to obtain the maximum endurance with the same weight of the trade-off solution, and the maximum payload with the tradeoff endurance were also calculated, but constrained, again, to the existing technologies for multi-functionalization, as found in literature.
Another problem addressed in this work was the simultaneous optimization of the parallel-hybrid electric power system and the mission profile of a Medium Altitude-Long Endurance Unmanned Aerial Vehicle (MALE-UAV), in order to minimize the overall fuel consumption and maximize the electric endurance. An important outcome of this problem is the quantification of the benefits that can be obtained from the exploitation of the synergy between mission profile, the power system, and energy management, in designing a hybrid aircraft by exploiting the engine and the battery, as much as possible.
Since all results were obtained with the existing technologies, the improvements in electric endurance and fuel economy found in this study could possibly be implemented now and not only after future technology developments. Note also that the actual values of the objective functions were affected by the accuracy of the models used for the simulation. However, this did not compromise the quantification of the synergic effects.
Author Contributions
T.D.: Conceptualization, Methodology, Resources, Supervision, Writing, Validation; C.L.D.P.: Formal analysis, Investigation, Resources, Software, Writing; A.F.: Supervision, Funding, Project administration.
Funding
This research was funded by the Italian Ministry for Education, University and Research.
Acknowledgments
The database of research batteries and electric machines used in the second test case were supplied by the partners of a research project of the Aerospace Technological District (DTA-Scarl), funded by the Italian Ministry for Education, University and Research (project code PON03_00067_8).
Conflicts of Interest
The authors declare no conflict of interest.
Nomenclature
| cM | Propeller torque coefficient |
| cT | Propeller thrust coefficient |
| kt0, km0, km1, km2 | constant parameters depending on shape and aerodynamics of the propeller blades |
| σe | Energy efficiency |
| σs | Structural efficiency |
| A | Cross-section area |
| AR | Aspect ratio |
| b | Wing span |
| BatteryID | Typology of battery |
| BLDC-Motor | Brushless DC Electric Motor |
| C | Battery capacity |
| Cnom | Nominal capacity of battery |
| Crate | Battery maximum discharge rate |
| D | Diameter |
| Df | Diameter of the EDF |
| DisCur | Current of discharge |
| DOD | Depth of Discharge |
| EDF | Electric Ducted Fan |
| ESC | Electronic Speed Control |
| I | Current |
| Iother | Current for auxiliaries |
| k | Climb energy mode |
| Kv | Motor rpm per volt |
| lfuselage | Fuselage length |
| lHT | Horizontal tail arm |
| MEA | More Electric Aircraft |
| mstructure | UAV structure mass |
| mtotal | UAV total mass |
| nEDF | Revolutions per minute of the EDF |
| Np | Number of propeller blades |
| P | Power |
| peuk | Peukert coefficient |
| Pice,n | Nominal power of thermal engine |
| R | Electrical resistance |
| Range | Cruise range |
| RecCur | Current of recharge |
| ROC | Rate of Climb |
| ROD | Rate of Descent |
| S | Wing area |
| Sbat | Number of battery cells in series |
| T | Thrust |
| tcruise | Cruise time |
| tdish | Battery discharge time |
| U | Voltage |
| UAV | Unmanned Aerial Vehicle |
| Vcruise | Cruise speed |
| Vloiter | Loiter speed |
| Vstall | Stall speed at cruise |
| VTOL | Vertical Take-Off and Landing |
| W0 | Take-off weight |
| Wpay | Payload weight |
| Z | Altitude |
| η | Efficiency |
| ρ | Air density |
| φp | Propeller blade angle |
| (·)p | Propeller property |
| (·)bat | Battery property |
| (·)EDF | EDF property |
| (·)ESC | ESC property |
| (·)shaft | EDF shaft property |
| (·)duct | Ducted fan property |
| (·)unduct | Unducted fan property |
| (·)M | Electric motor property |
| (·)max | Maximum value |
| (·)min | Minimum value |
| (·)0 | No-load property |
Appendix A. Optimization Flowchart of the Electric VTOL-UAV
![Aerospace 06 00032 g0a1]()
Appendix B. Optimization Flowchart of the Hybrid Electric MALE-UAV
![Aerospace 06 00032 g0a2]()
References
- Abdul Sathar Eqbal, M.; Fernando, N.; Marino, M.; Wild, G. Hybrid Propulsion Systems for Remotely Piloted Aircraft Systems. Aerospace 2018, 5, 34. [Google Scholar] [CrossRef]
- Frosina, E.; Senatore, A.; Palumbo, L.; Di Lorenzo, G.; Pascarella, C. Development of a Lumped Parameter Model for an Aeronautic Hybrid Electric Propulsion System. Aerospace 2018, 5, 105. [Google Scholar] [CrossRef]
- Traub, L.W. Range and endurance estimates for battery-powered aircraft. J. Aircr. 2011, 48, 703–707. [Google Scholar] [CrossRef]
- Moore, M.D. Misconceptions of Electric Aircraft and their Emerging Aviation Markets. In Proceedings of the 52nd Aerospace Sciences Meeting, AIAA SciTech Forum, National Harbor, MD, USA, 13–17 January 2014. AIAA 2014-0535. [Google Scholar]
- Adam, T.J.; Liao, G.; Petersen, J.; Geier, S.; Finke, B.; Wierach, P.; Kwade, A.; Wiedemann, M. Multifunctional Composites for Future Energy Storage in Aerospace Structures. Energies 2018, 11, 335. [Google Scholar] [CrossRef]
- Aksugur, M.; Inalhan, G. Design, build and flight testing of a VTOL tailsitter unmanned aerial vehicle with hybrid propulsion system. In Proceedings of the Ankara International Aerospace Conference, Ankara, Turkey, 14–16 September 2011. [Google Scholar]
- Donateo, T.; Ficarella, A. Designing of a Hybrid Electric Powertrain for an Unmanned Aircraft with a Commercial Optimization Software. SAE Int. J. Aerosp. 2017, 10. [Google Scholar] [CrossRef]
- Deb, K.; Pratap, A.; Agarwal, S.; Meyarivan, T. A fast and elitist multiobjective genetic algorithm: NSGA-II. IEEE Trans. Evolut. Comput. 2002, 6, 182–197. [Google Scholar] [CrossRef]
- Emmerich, M.; Beume, N.; Naujoks, B. An EMO Algorithm Using the Hypervolume Measure as Selection Criterion. In Proceedings of the Third International Conference of Evolutionary Multi-Criterion Optimization EMO 2005, Guanajuato, Mexico, 9–11 March 2005. [Google Scholar]
- Guzzella, L.; Sciarretta, A. Vehicle Propulsion Systems: Introduction to Modeling and Optimization; Springer: Berlin, Germany, 2007. [Google Scholar]
- Donateo, T.; De Pascalis, C.L.; Ficarella, A. Many-Objective Optimization of Mission and Hybrid Electric Power System of an Unmanned Aircraft. Lect. Notes. Comput. Sci. 2018, 10784, 231–246. [Google Scholar] [CrossRef]
- Donateo, T.; De Pascalis, C.L.; Ficarella, A. Exploiting the synergy between aircraft architecture and electric power system in unmanned aerial vehicle through many-objective optimization. Int. J. Sustain. Aviat. 2018. in printing. [Google Scholar]
- Shi, D.; Dai, X.; Zhang, X.; Quan, Q. A Practical Performance Evaluation Method for Electric Multicopters. IEEE ASME Trans. Mechatron. 2017, 22, 1337–1348. [Google Scholar] [CrossRef]
- Jiang, Y.; Zhang, B.; Huang, T. CFD Study of an Annular-Ducted Fan Lift System for VTOL Aircraft. Aerospace 2015, 2, 555–580. [Google Scholar] [CrossRef]
- Gong, A.; Verstraete, D. Development of a dynamic propulsion model for electric UAVs. In Proceedings of the 7th Asia-Pacific International Symposium on Aerospace Technology, Cairns, Australia, 25–27 November 2015. [Google Scholar]
- Donateo, T.; Spedicato, L. Fuel economy of hybrid electric flight. Appl. Energy 2017, 206, 723–738. [Google Scholar] [CrossRef]
- Snyder, J.F.; O’Brien, D.J.; Wetzel, E.D. Structural Batteries, Capacitors and Supercapacitors. Mater. Energy Handb. Solid State Batter. 2015, 657–699. [Google Scholar] [CrossRef]
- Snyder, J.F.; Baechle, D.M.; Wetzel, E.D.; Xu, K. Multifunctional Structural Composite Batteries for U.S. Army Applications; U.S. Army Research Laboratory: Adelphi, MD, USA, 2008. [Google Scholar]
- Gundlach, J.F. Multi-Disciplinary Design Optimization of Subsonic Fixed-Wing Unmanned Aerial Vehicles Projected Through 2025. Ph.D. Dissertation, Virginia Polytechnic Institute and State University, Blacksburg, VA, USA, 2004. [Google Scholar]
- Donateo, T.; Ficarella, A.; Spedicato, L. A method to analyze and optimize hybrid electric architectures applied to unmanned aerial vehicles. Aircr. Eng. Aerosp. Technol. 2018, 90, 828–842. [Google Scholar] [CrossRef]
- Tremblay, O.; Dessaint, L.-A.; Dekkiche, A.I. A Generic Battery Model for the Dynamic Simulation of Hybrid Electric Vehicles. In Proceedings of the IEEE Vehicle Power and Propulsion Conference, Airlington, TX, USA, 9–12 September 2007. [Google Scholar]
Figure 1.
Electric power system workflow.
Figure 1.
Electric power system workflow.
Figure 2.
Weight statistical regression for EDF.
Figure 2.
Weight statistical regression for EDF.
Figure 3.
Gravimetric energy density of commercial Lithium-polymer batteries as a function of the battery maximum discharge rate (Crate).
Figure 3.
Gravimetric energy density of commercial Lithium-polymer batteries as a function of the battery maximum discharge rate (Crate).
Figure 4.
Pareto fronts the VTOL-UAV optimization problem. (a) Comparison of the three problems; and (b) choice of the optimal solutions.
Figure 4.
Pareto fronts the VTOL-UAV optimization problem. (a) Comparison of the three problems; and (b) choice of the optimal solutions.
Figure 5.
System masses for the various structural efficiencies () and Energy Densities (). (a) Payload weight (Wpay) = 1.99 kg; and (b) Wpay = 3.51 kg.
Figure 5.
System masses for the various structural efficiencies () and Energy Densities (). (a) Payload weight (Wpay) = 1.99 kg; and (b) Wpay = 3.51 kg.
Figure 6.
Structural battery scheme.
Figure 6.
Structural battery scheme.
Figure 7.
Multifunctional technology. (
a) Multifunctional properties of carbon fibers [
17,
18]; and (
b) multifunctional performance of polymer-based structural electrolytes [
17]. In (
b), open circles correspond to homopolymers electrolytes, filled circles are copolymers prepared from the two monomers whose homopolymers yielded the highest conductivity and rigidity, triangles correspond to “gels” comprising a structural polymer and liquid electrolyte in different volume ratios [
17].
Figure 8.
Scheme of the hybrid electric powertrain.
Figure 8.
Scheme of the hybrid electric powertrain.
Figure 9.
Baseline mission profile for the MALE-UAV.
Figure 9.
Baseline mission profile for the MALE-UAV.
Figure 10.
The scalable engine model (BHPICE: engine brake horse power, nICE: engine rev/min, VICE: engine displacement, MICE: engine mass, bsfc: brake-specific fuel consumption).
Figure 10.
The scalable engine model (BHPICE: engine brake horse power, nICE: engine rev/min, VICE: engine displacement, MICE: engine mass, bsfc: brake-specific fuel consumption).
Figure 11.
Gravimetric energy density of the researched Li-po batteries with a nominal voltage of 270 V.
Figure 11.
Gravimetric energy density of the researched Li-po batteries with a nominal voltage of 270 V.
Figure 12.
Results of the MALE-UAV optimization problem.
Figure 12.
Results of the MALE-UAV optimization problem.
Figure 13.
Profile mission of the “Best_tradeoff” solution of Test Case 2.
Figure 13.
Profile mission of the “Best_tradeoff” solution of Test Case 2.
Figure 14.
Usage of engine and battery in the optimal tradeoff solution. (a) Optimal mission; and (b) baseline mission.
Figure 14.
Usage of engine and battery in the optimal tradeoff solution. (a) Optimal mission; and (b) baseline mission.
Figure 15.
Trends of engine size and battery specifications along the Pareto front, for the fixed mission optimization (on the left) and synergy optimization (on the right).
Figure 15.
Trends of engine size and battery specifications along the Pareto front, for the fixed mission optimization (on the left) and synergy optimization (on the right).
Table 1.
Average operating point for the Propeller and the Electric Ducted-Fan (EDF) units.
Table 1.
Average operating point for the Propeller and the Electric Ducted-Fan (EDF) units.
| Propeller unit | 3 min at hover mode at 1 km of altitude |
| EDF unit | Cruise at at 1 km of altitude |
Table 2.
Design variable bounds for the optimization.
Table 2.
Design variable bounds for the optimization.
| Design Variable | Group | Lower Bound | Upper Bound |
|---|
| Wing span (b) | Architecture | 1 m | 2 m |
| Wing loading () | Architecture | 100 | 220 |
| Horizontal tail arm () | Architecture | 0.6 m | 1.5 m |
| Take-off weight () | Architecture | 30 N | 100 N |
| Propeller diameter () | Powertrain | 0.5 m | 1.2 m |
| Propeller blade angle () | Powertrain | 3 deg | 30 deg |
| EDF fan diameter | Powertrain | 0.07 m | 0.16 m |
| EDF revolutions per minute ( | Powertrain | 20,000 rpm | 50,000 rpm |
| Propeller/EDF motor maximum voltage | Powertrain | 6 V/6 V | 24 V/78 V |
| Propeller/EDF motor maximum current | Powertrain | 20 A/5 A | 180 A/180 A |
| Propeller/EDF motor KV value | Powertrain | 60 rpm/V/1200 rpm/V | 360 rpm/V/2100 rpm/V |
| Propeller and EDF batteries maximum discharge rate | Powertrain | 10 C | 95 C |
| Propeller/EDF battery capacity | Powertrain | 5 Ah/5 Ah | 22 Ah/60 Ah |
| Propeller/EDF battery number of cells in series (Sbat) | Powertrain | 2 S/2 S | 10 S/12 S |
Table 3.
Design variables of the three optimal design points of the VTOL-UAV optimization problem.
Table 3.
Design variables of the three optimal design points of the VTOL-UAV optimization problem.
| Design Point | b (m) | (m) | (N/m) | (N) | (m) | (deg) |
| Max_Wpay | 1.78 | 0.83 | 219 | 69 | 0.77 | 29.7 |
| Max_tcruise | 1.73 | 0.88 | 220 | 65 | 0.76 | 30.0 |
| Best_tradeoff | 1.76 | 0.94 | 220 | 69 | 0.77 | 29.9 |
| | (V)
Propeller | (A)
Propeller | (rpm/V)
Propeller | (V)
EDF | (A)
EDF | (rpm/V)
EDF |
| Max_Wpay | 18.6 | 91.3 | 61.4 | 15.0 | 9.3 | 1804 |
| Max_tcruise | 18.6 | 84.1 | 61.1 | 14.9 | 5.7 | 2052 |
| Best_tradeoff | 18.6 | 89.5 | 61.2 | 16.0 | 6.1 | 1942 |
| |
propeller | (Ah)
propeller |
EDF | (Ah)
EDF | (rpm) | (m) |
| Max_Wpay | 90C | 7.3 | 82C | 6.3 | 26,090 | 0.09 |
| Max_tcruise | 94C | 7.0 | 19C | 44.0 | 25,700 | 0.15 |
| Best_tradeoff | 92C | 7.3 | 73C | 27.5 | 25,530 | 0.14 |
| | |
Propeller |
EDF | (kg) |
(min) | |
| Max_Wpay | 4 | 5 | 4 | 3.51 | 32.6 | |
| Max_tcruise | 4 | 5 | 4 | 0.82 | 489.2 | |
| Best_tradeoff | 4 | 5 | 4 | 1.99 | 252.1 | |
Table 4.
Design variables defining the size and technology of the powertrain.
Table 4.
Design variables defining the size and technology of the powertrain.
| Parameters | Unit | Lower Bound | Upped Bound |
|---|
| Nominal Engine power | kW | 40 | 160 |
| Battery elements in series | – | 50 | 100 |
| Battery technology (T) | – | 1 | 3 |
| Battery nominal capacity (C) | Ah | 20(T1) | 40(T1) |
| 50(T2) | 80(T2) |
| 100(T3) | 150(T3) |
Table 5.
Design variables related to the energy management strategy.
Table 5.
Design variables related to the energy management strategy.
| Parameters | Unit | Lower Bound | Upped Bound |
| Discharge current | C | 0.5 | 20 |
| Recharge current | C | 0.1 | 2 |
| Energy mode during climb | – | 1 | 4 |
| Energy mode during descent | – | 1 | 4 |
Table 6.
Mission design variables for the MALE-UAV’s optimization.
Table 6.
Mission design variables for the MALE-UAV’s optimization.
| Parameter | Unit | Min | Max | Step |
|---|
| Outbound speed | m/s | 41.0 | 61.0 | 0.5 |
| Outbound altitude | m | 4900 | 6900 | 100 |
| Loiter speed | m/s | 37.0 | 57.0 | 0.5 |
| Loiter altitude | m | 6950 | 7450 | 25 |
| Altitude of rate of climb switch | m | 2300 | 3300 | 25 |
| Rate of climb of the first part of the climb | m/s | 0.224 | 0.424 | 0.05 |
| Rate of climb of the second part of the climb | m/s | 0.224 | 0.424 | 0.05 |
| Rate of descent | m/s | 0.144 | 0.344 | 0.01 |
Table 7.
Specification of the “Best_tradeoff” solution of Test Case 2.
Table 7.
Specification of the “Best_tradeoff” solution of Test Case 2.
| Design Point | DisCur (C) | RecCur (C) | k | Pice,n (kW) | Sb | Cnom (Ah) | BatteryID |
|---|
| Best_tradeoff | 1.03 | 1.00 | 2 | 76 | 62 | 53 | Li-Po |
© 2019 by the authors. Licensee MDPI, Basel, Switzerland. This article is an open access article distributed under the terms and conditions of the Creative Commons Attribution (CC BY) license (http://creativecommons.org/licenses/by/4.0/).
