1. Introduction
Detect and Avoid (DAA) systems are complex communication and locational assemblies that consist of several independent components that are used throughout the aviation industry. Each of these components is assumed to be an integral portion of an overarching DAA system. A complete DAA system would include an automatic dependent surveillance broadcast (ADS-B) module, traffic collision avoidance system (TCAS), radar, secondary surveillance radar (Mode S) transponder, global positioning system (GPS), and an altimeter. DAA components have extensive history and are used in manned aircraft systems. These technologies allow communications between ground-based and space-based operations with aircraft. Manned and unmanned aircraft systems (UAS) rely on DAA communication and location technologies to maintain safe flight operations. The positions of aircraft relative to one another can be managed by air traffic control (ATC) and pilots when all systems are operating correctly. Some of these components, including GPS and altimeter, are common UAS components in civilian applications. It is expected that ADS-B will become a more common component of future civilian UAS applications as manufacturers continue to improve upon the miniaturization and affordability of this technology.
Altitude data is the most crucial data for aircraft vertical separation. Currently, altitude data can be found from different DAA components. The barometric altimeter is the oldest and most used device, other sources like radar altimeter and ADS-B are considered to be potential sources for reliable altitude data. By 2020, having ADS-B onboard is mandatory for manned aircraft operating in controlled airspace, and altitude data found within ADS-B messages can be used for vertical separation. However, previous work [
1] showed differences detected between the altitudes coming from different sources (barometric vs. geometric altitude) along with variation in elevation detected in aircraft reports by ADS-B (In) devices [
2].
We investigated the occurrence and duration of communication losses between radar and ADS-B systems with aircraft that were operating in proximate airspace. Our analyses considered data that were collected during actual flight operations. Our objectives were to identify the number and duration of communication losses for both radar and ADS-B systems that occurred within a discrete time period. In addition, we also considered whether other unique communication behavior and anomalies were occurring, such as reported elevation deviations. Our results revealed that the loss of communication with both radar and ADS-B systems does occur, with variation in the length of communication losses. We also found that unexpected behaviors, such as aircraft sharing the same identification number and altitude discrepancies, were occurring with communications. Although our data were gathered from manned aircraft, there are also implications for unmanned aircraft systems that are operating within active airspaces due to similar proposed equipage requirements for group 4–5 (large platform) UAS. From the literature review performed, this is the first study of its kind available to the public.
Over the past 100 years radar systems have evolved substantially. Despite this fact, radar, just like any other complex engineering design is prone to design flaws and problems. Previous studies [
1,
2,
3,
4,
5,
6,
7,
8,
9,
10] have been performed addressing and identifying the problems with radar. Some work has been done on the reliability/performance of radar, while others have been on future applications to address the current problems. However, from the literature review performed, no work to date has classified radar data anomalies like the ones found in this paper.
1.1. Background
Several publications have documented surveillance resolution, measurement errors, and the coverage of air traffic control radars. Thomas [
3] created maps of the radar coverage throughout the continental United States. An operational test and evaluation plan for the ARSR-4 demonstrated that radar successfully performed its basic functions [
4]. A comparable study was also done on the ASR-11 radar by Weber and Schanne [
5]. Azimuth errors on the ARSR-4 [
6], ASR-9 and ASR-11 [
7] were evaluated as well. Additional studies identified vulnerabilities in secondary radar [
8,
9]. Even the effects of wind turbines on air traffic control radars were evaluated [
10].
While some studies addressed the current problems of radar, others looked to future applications to address the existing problems. Immoreev and Taylor discuss how increasing the bandwidth of radars can significantly increase their capabilities [
11]. The use of phased array radars can add numerous benefits, as described by Buckler [
12]. However, with phased array radars, the multiple secondary radar signals will need to be dealt with and separated by computer algorithms [
13]. The Federal Aviation Administration (FAA) recently published a document on the national requirements for phased array radars [
14].
FAA conducted flight inspection to analyze the data and coverage capability for ADS-B in I90 TRACON [
15]. The performance criteria for the test were measured by integrity and accuracy indicator values present in the ADS-B message, such as Navigation Integrity Category, Navigation Accuracy for Position, and System Integrity level. A value was set for each indicator to define the performance of the system. The coverage analysis of this report reveals that in some area geometric altitude wasn’t reported by 1090ES link, where the universal access transceiver (UAT) link is maintained to report geometric altitude. FAA also published a performance report [
16] to provide public information to aid in the interpretation of ADS-B data. Studies have been conducted in Europe analyzing the performance of ADS-B ground station data [
17]. Integrity and accuracy analyses were also conducted in China [
18]. Other studies have been done on the fusion and comparison of ADS-B and radar data [
19,
20]. Castle, Trinh, Mayer and Parry [
20] demonstrated that the comparison between ADS-B and Radar was occasionally difficult due to the some of the same radar failures identified in this paper. One group of researchers is currently studying how an autonomous ATC will work [
21].
There are multiple components within DAA systems. We provide a brief description and summary of altimeters, GPS, radar and ADS-B below.
1.1.1. Altimeters
In aircraft, altimeters are used to measure the atmospheric pressure from a static port outside the aircraft [
22]. In principle as altitude increases, pressure decreases. An aneroid barometer is calibrated on aircraft to show pressure directly as an altitude above mean seal level (MSL). The altimeter system takes a barometric pressure reading from the Pitot-Static tube on the outside of the aircraft and uses a vacuum system to display the altitude above MSL. Modern aircraft use a sensitive type altimeter in which the actual MSL value can be adjusted based on current weather conditions.
Altimeters are used by both manned and unmanned aircraft as a primary means of determining aircraft altitude. The barometric altitude is used in all systems of the aircraft from navigation to DAA. ADS-B, TCAS, and transponders all rely on altimeters to provide aircraft altitude. Additionally, GPS altitude as well as ground radar altitude readings can be used as an accuracy check of barometric altitude or in the case of a barometric altimeter failure as the primary means of altitude information.
1.1.2. GPS
Manned and unmanned aircraft use GPS to determine altitude, location, and navigation. The GPS system feeds into ADS-B and TCAS, and is used by those DAA systems for location data. This reliance on GPS for DAA as well as basic location and navigation services makes GPS a critical system for aviation [
23]. The basic GPS service provides users with approximately 8-meter accuracy, 95% of the time anywhere on or near the surface of the earth. To accomplish this, each of the GPS satellites emits signals to receivers that determine the user location by computing the difference between the time that the signal is sent and the time it is received. The time information is placed in the codes transmitted by the satellites so that the receivers can constantly determine the time a signal was broadcast. The signal also contains data that a receiver can use to compute the locations of the satellites as well as make adjustments to maintain accuracy. With a minimum of four separate satellite transmissions, a GPS receiver can triangulate its own three-dimensional position by determining the distance (referred to as a range) from each of the satellites.
1.1.3. Radar
Detect and Avoid radar is an air-to-air radar that is being developed in order to provide an additional layer of collision avoidance and separation for manned and unmanned aircraft in the national airspace. The system will have one or more antenna elements in order to cover the radar field. The electronics of the radar provide transmit, receive, control, status, and tracking functions [
24,
25].
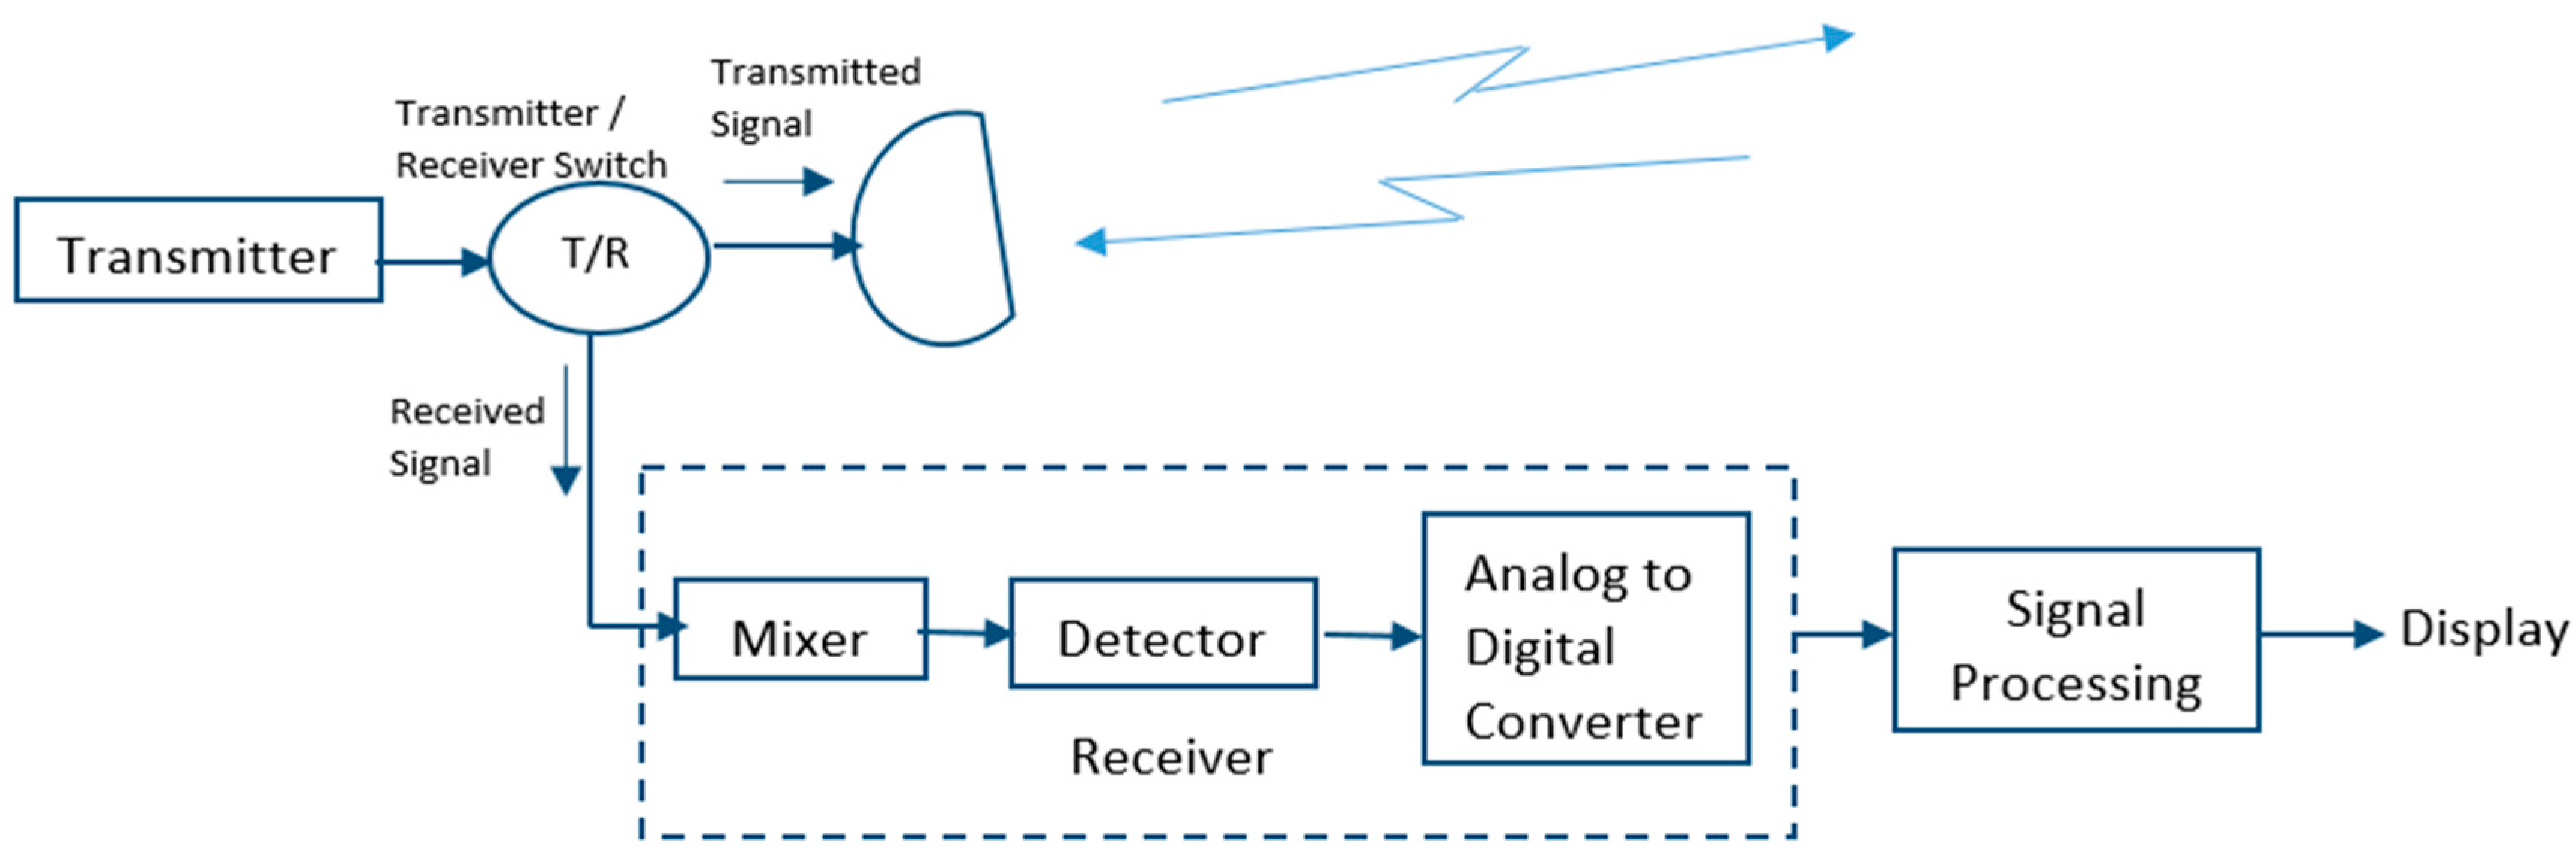
Until an air-to-air system is developed and even after a system is developed, ground based radar will be used. Ground based radar is one of the primary means for ATC to provide aircraft separation services for manned flight, and likely unmanned flights in the future as they are integrated into the national airspace (NAS). The FAA and other government agencies use primary and secondary radar systems for aircraft detection. Primary radar sends high frequency pulses that are reflected of targets (aircraft) and the signal is received back as an echo [
26]. This is a passive system, which means the aircraft does not need any additional equipment for the system to work. The primary data collected include the range and azimuth of the aircraft relative to the radar site. The major components to a primary radar system include: a transmitter, antenna, receiver, and signal processor. A schematic of the primary radar system can be seen in
Figure 1 [
27].
Secondary radar systems differ from the primary radar system slightly, where the aircraft needs to have a transponder to reply to interrogations from the secondary radar transmitter [
27]. Meaning this is an active system, because the aircraft needs a transponder for the system to work. The two primary classes of transponders include Mode A and Mode C. Mode A reports the aircraft ID number, and Mode C reports the altitude. Typically, the secondary radar is mounted on top of the primary radar, and with the combination of the data received between primary and secondary radar, ATC is able to get a complete picture of an aircraft’s location. A schematic of the secondary radar system is provided in
Figure 2 [
28]. The ground unit is typically called the interrogator, which sends a coded pulse to the transponder. Once the pulse is received, it is decoded, and a reply is send back down to the ground station.
1.1.4. Automatic Dependent Surveillance-Broadcast (ADS-B)
ADS-B is a system by which aircraft and fixed ground locations can share position, velocity, and other information with one another [
29,
30,
31]. ADS-B periodically transmits its state vector, which includes horizontal and vertical position, and velocity. The system is broken down into two separate components, ADS-B Out and ADS-B In. The transponder mode is the ADS-B Out portion which broadcasts all state vector information. The receiving part of the system is ADS-B In which receives communication from other aircraft as well as ADS-B messages from ground locations. With state vector information available from other proximate aircraft as well as information re-broadcasted from ground locations, it is possible to establish the relative position and movement of those proximate aircraft with reference to the ownship aircraft.
ADS-B is automatic in the sense that no pilot or controller action is required for the information to be broadcast. It is a dependent surveillance because it requires that the aircraft state vector and additional information be derived from the on-board navigation equipment. The aircraft originating the broadcast may or may not have knowledge of which users are receiving its broadcast.
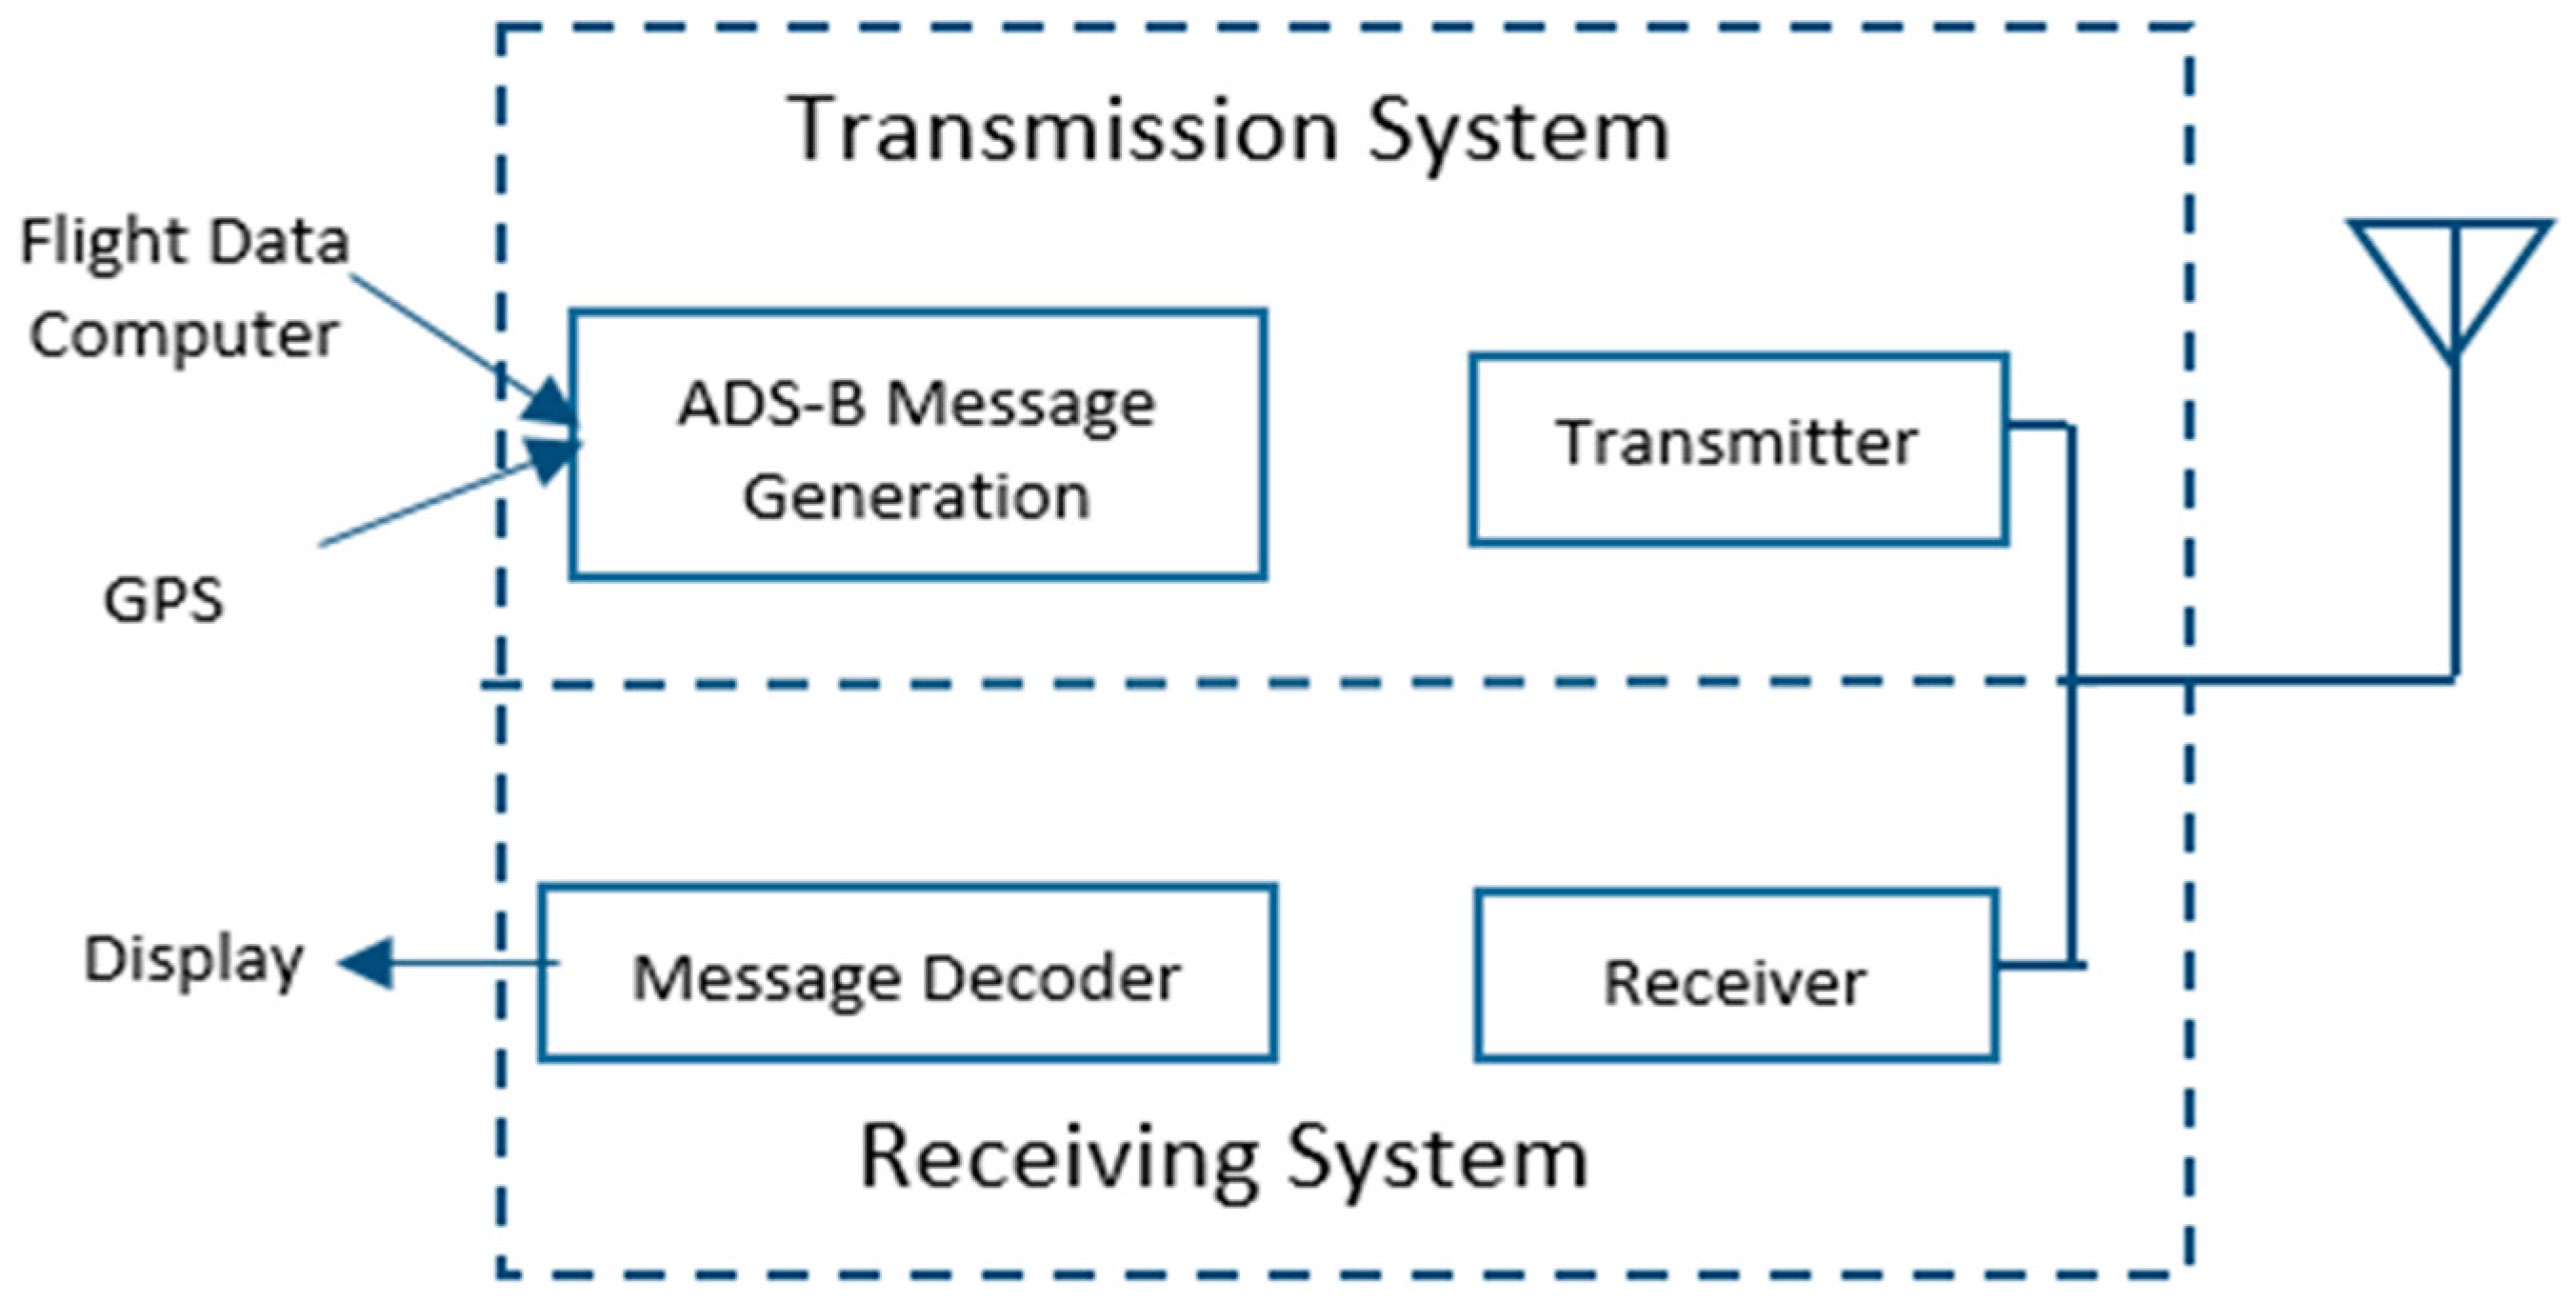
The overall system could be used to replace secondary radar as the primary surveillance method for air traffic control. The ADS-B system is currently used in the United States as a component of the NextGen national airspace strategy for upgrading and enhancing the overall aviation infrastructure. ADS-B increases air traffic safety by making aircraft visible in real time to Air Traffic Control (ATC) and to other appropriately equipped aircraft. The system allows for the possibility of increased situational awareness, improved visibility, weather reporting, flight information broadcasts, traffic capacity improvement, cockpit display of traffic information (CDTI) and airborne collision avoidance. A high-level block diagram of ADS-B can be seen in
Figure 3 [
32].
2. Materials and Methods
2.1. Radar
Harris (an aeronautical research organization) provided access to radar data from two Red River Valley (ND, USA) radar sites located near the cities of Fargo and Finley. The amount of data accounted for hundreds of thousands of lines of logged information each day for each site. To better understand the data and what could be done with it, altitude information was analyzed for one day (21 June 2015). This date was chosen because of the Summer solstice, which provided the longest duration of daylight. This was particularly of interest, because many of the aircraft detected on the radar are student operated from the University of North Dakota (UND) fleet during daylight hours. Dropout rates and unique behavior were looked at for both sites and categorized based on time. A dropout is identified if the time between two successive logged data points is greater than the radar scan rate. The radar scan rate from Fargo is 4.8 s whereas Finley has a radar scan rate of 12.0 s. Unique behavior was identified by any unusual behavior other than a dropout. Once the dropouts and unique behavior were identified, the information was analyzed based on time duration, location, and source of the data anomaly.
2.2. ADS-B
Also, ADS-B message dropouts are a concern, which this study investigated. ADS-B should update and send its position status every second but we found this is not always the case. This analysis is split into two phases. The first phase discusses the dropout rates. This issue is explored through a closure examination of seven days of data mostly composed from the UND fleet collected from the Grand Forks Airport. ADS-B dropouts were analyzed utilizing the data from 15 June to 21 June 2015 from Grand Forks Airport. The data were archived in a GDL-90 raw pass-through format and parsed for interpretation. Dropout rates were counted as the number of times the data did not indicate a one second update period. A total of 642 aircraft data were analyzed including 534,736 data points/transmissions. Each data point contained the aircraft position (latitude, longitude), altitude, aircraft status (Ground/Air) along with additional information.
The ADS-B unit at Grand Forks Airport is a GDL-90 datalink transceiver. Aircraft altitude discrepancy was investigated in the second phase with the data collected from an open source website (ADS-B Exchange 2016) with world-wide coverage.
3. Results
To adhere to the standards set forth by the Federal Aviation Administration and the standard units for the United States. National Airspace System, the altitude readings and subsequent analysis are provided and performed in United States Customary System units, rather than SI units.
3.1. Radar
Cyclic behavior, multiple aircraft with the same ID number, and outliers (a deviation of more than 10% of the expected altitude based on the past and projected behavior of the aircraft) were the primary unique radar behaviors spotted in this analysis.
Figure 4,
Figure 5,
Figure 6 and
Figure 7 show the four different types of anomalous behavior (drop outs and the three unique behaviors).
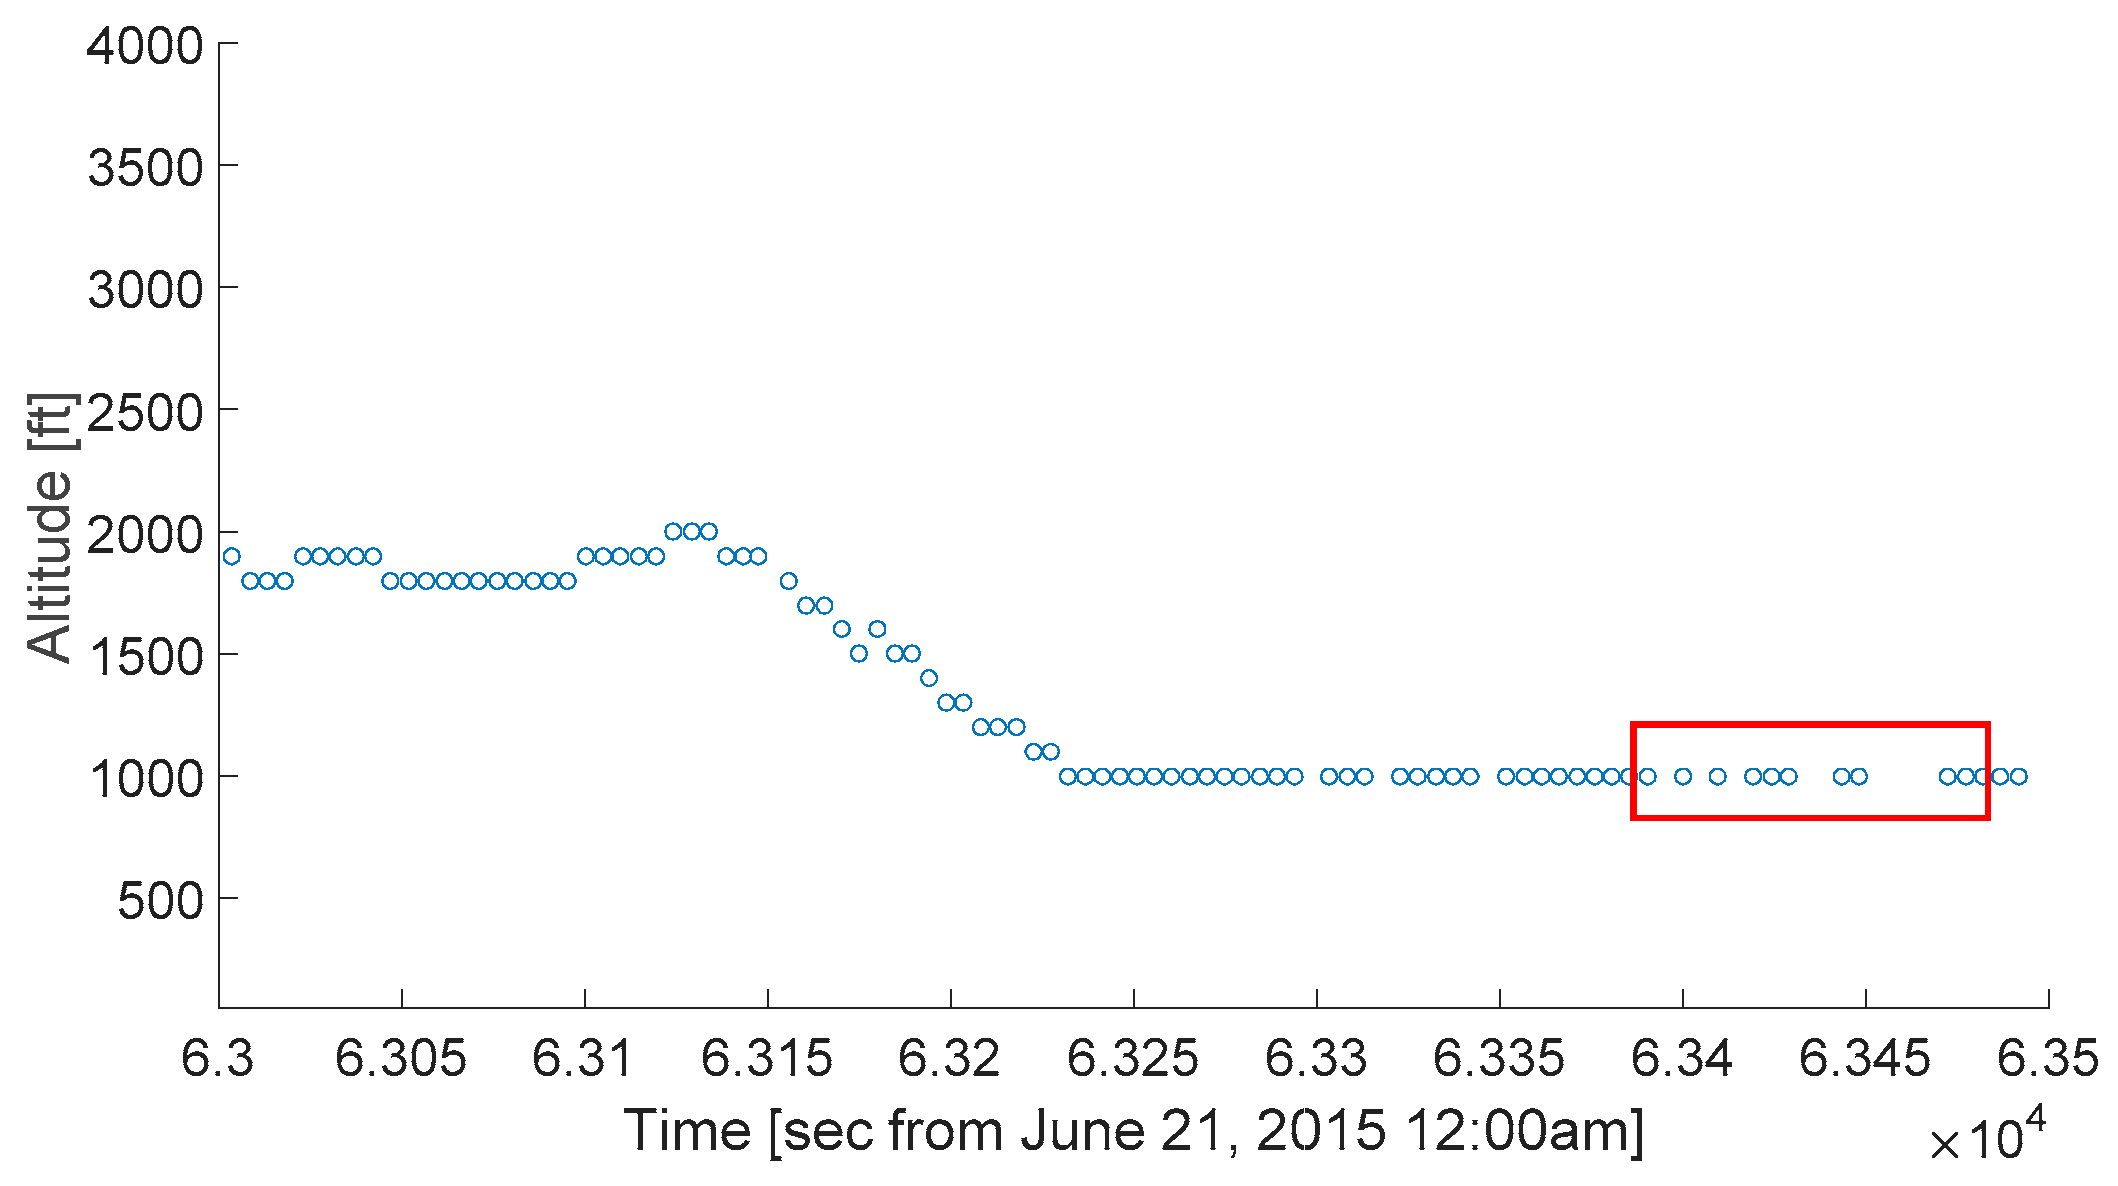
Figure 4 shows dropouts as a function of altitude and dropout duration length. Note the durations past 6.33 × 10
4 s where there are missed data points, these drop outs ranged from 9 to 24 s.
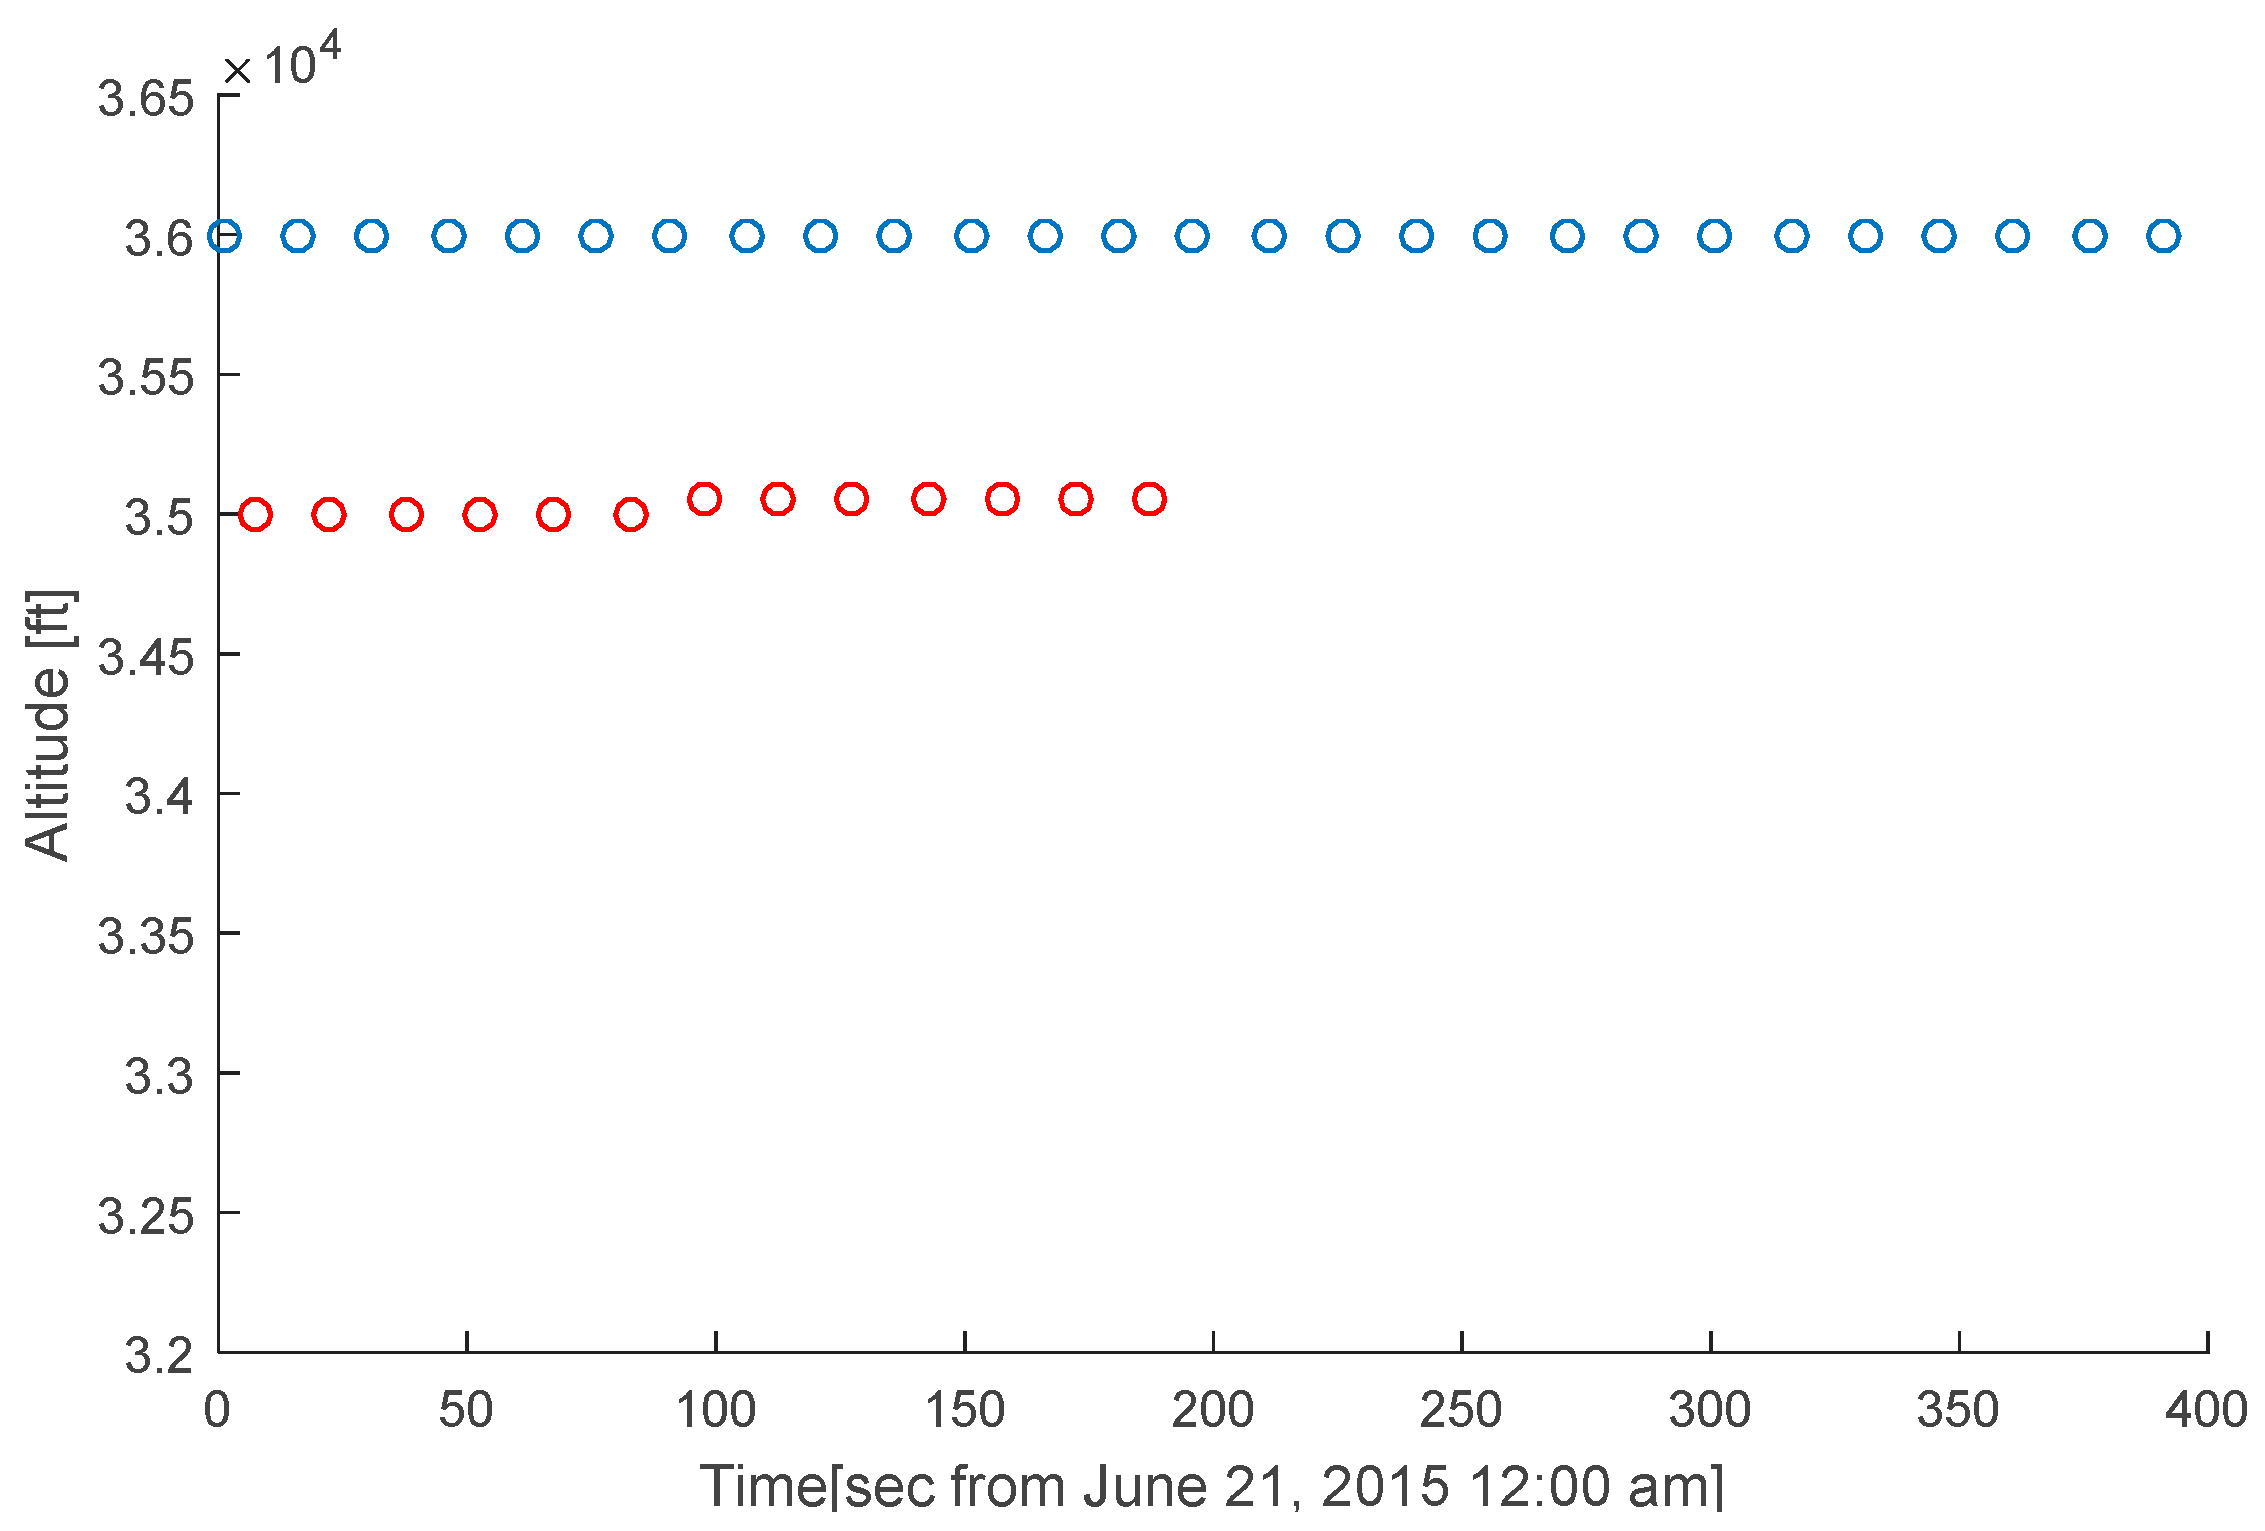
Figure 5 shows unique cyclical behavior with altitude readings fluctuating between 35,000 and 36,000 feet over a 200 s time span.
Figure 6 shows a case where there were many aircraft with the same aircraft Mode A ID number being reported during the same time period. Lastly,
Figure 7 shows numerous outliers, where the reported altitude repeatedly jumps from nominal (expected) to 0 feet elevation.
Dropouts and unique behavior were classified into time intervals.
Table 1 summarizes the dropout data, while
Table 2 summarizes the unique behavior data (note: the multiple aircraft unique behavior was omitted from the data in the table). The average, minimum, and maximum dropout/unique behavior duration is listed, along with the categorized time intervals. As shown from the tables, the average dropout was approximately five radar scans (23.69 s) for Fargo, and just under three radar scans (32.41 s) for Finley. The unique behavior statistics were much lower, with an average of about one radar scan (5.30 s) for Fargo and approximately two radar scans (23.52 s) for Finley. Fargo had 67% of its dropouts and 98% of its unique behavior occur for less than three radar scans. While Finley had 82% of its dropouts and 84% of its unique behavior for less than three radar scans. However, there are some dropouts that occur for a significant period, with some dropouts persisting for hundreds of seconds.
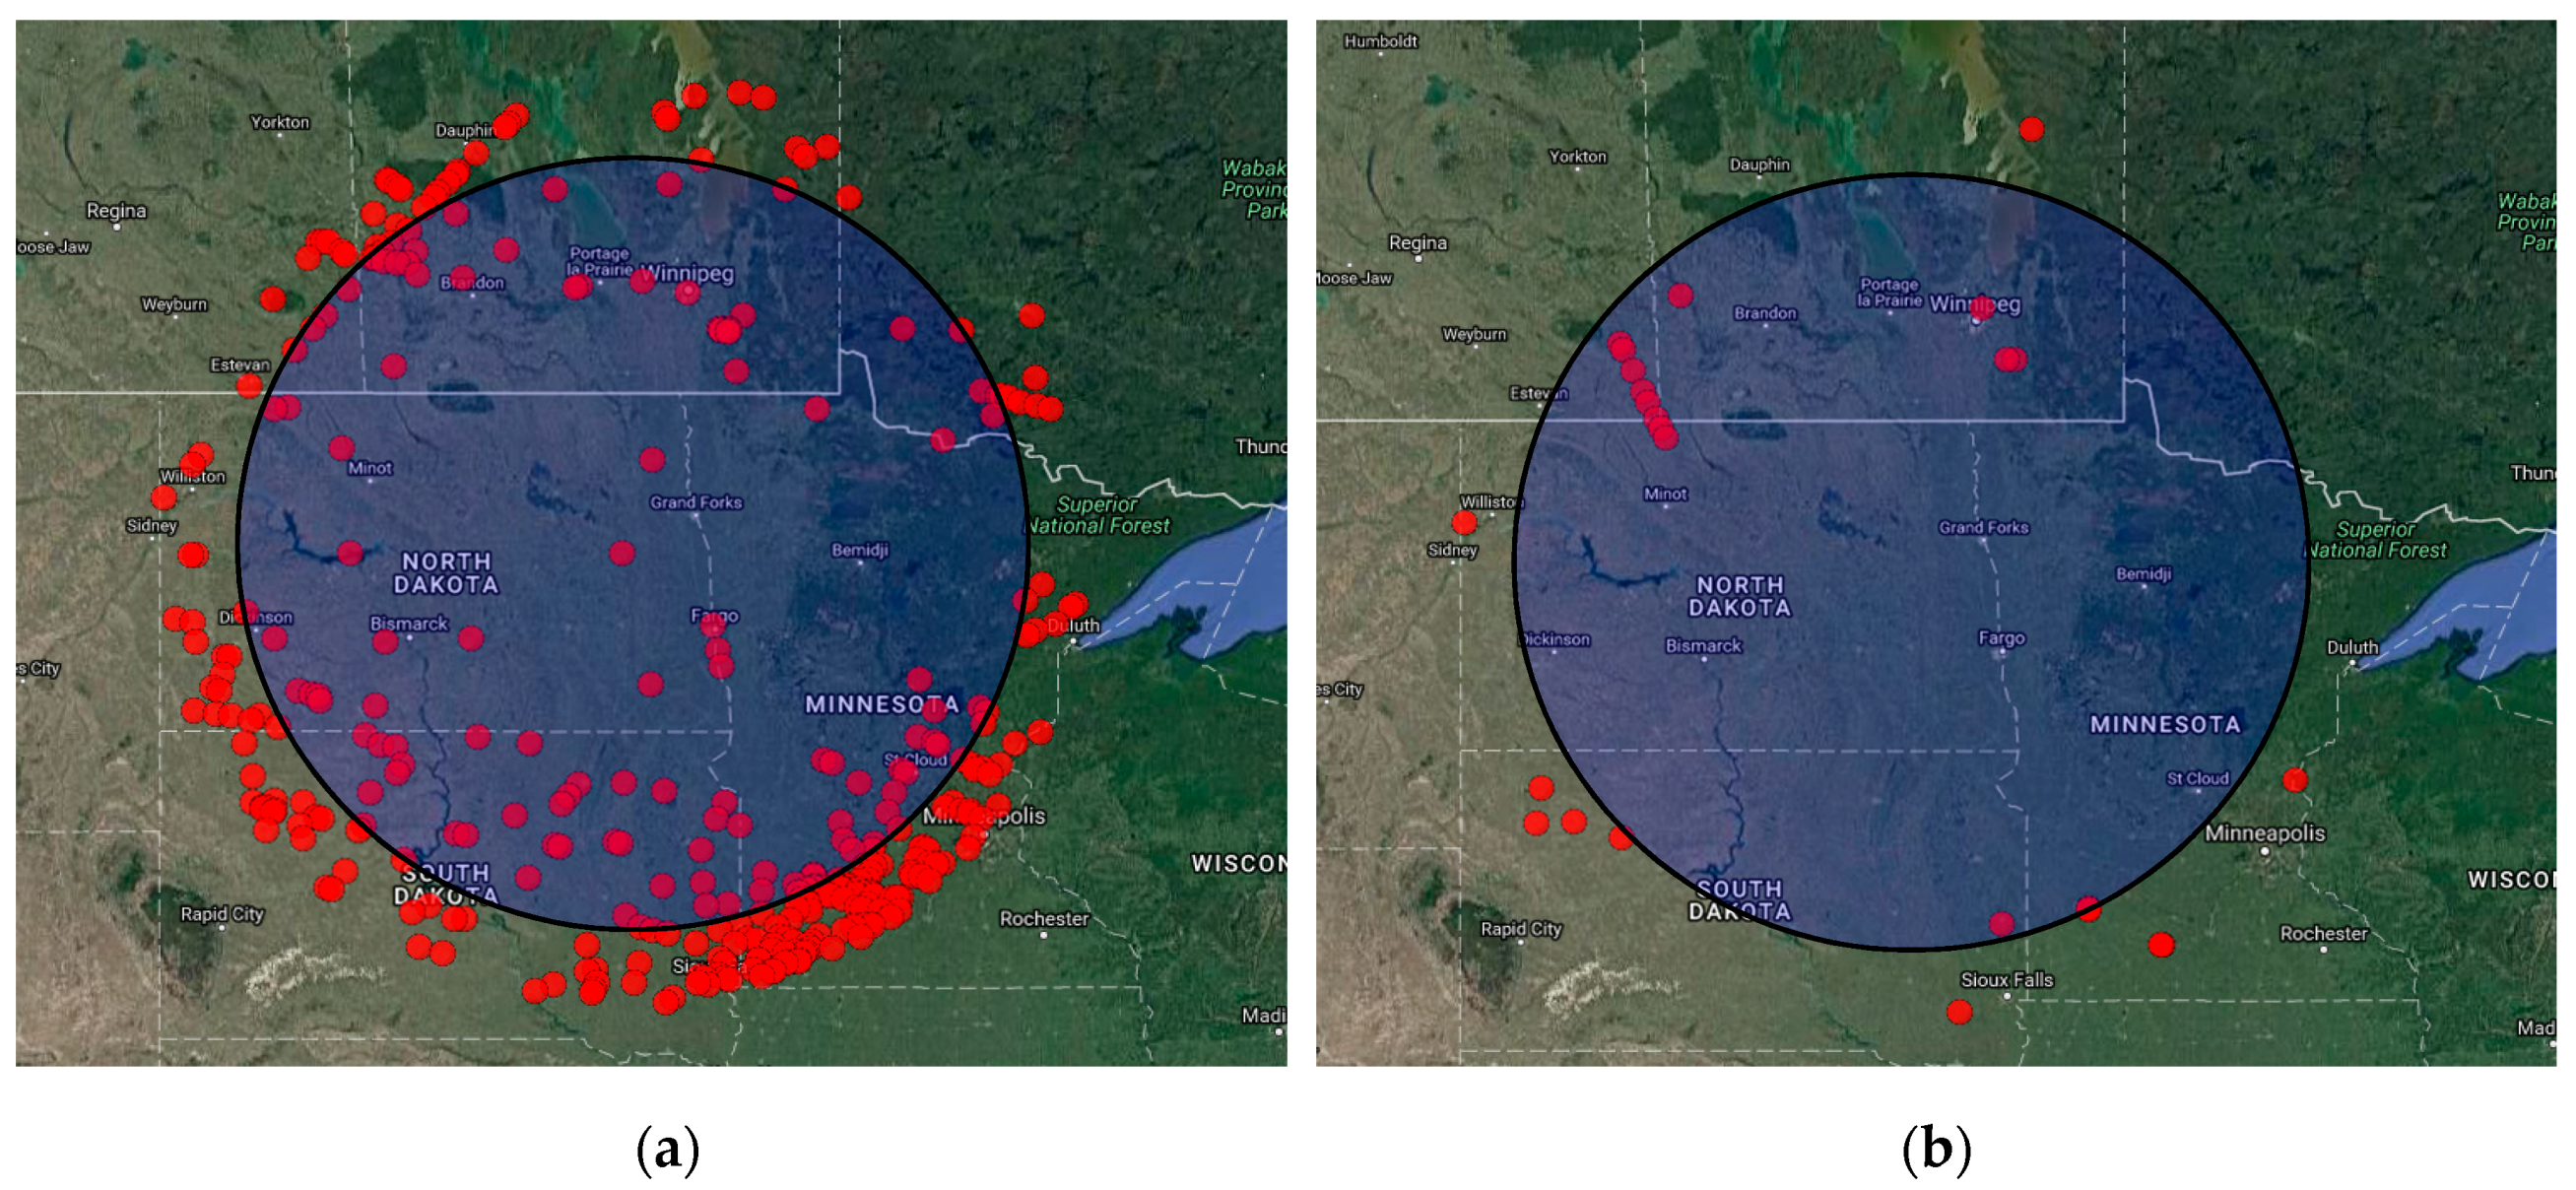
Time and location were investigated to see if either demonstrated an influence on dropouts or unique behavior in system performance. Time did not appear to play a large role, however location had a large effect. This can be seen by
Figure 8 and
Figure 9, which shows the dropouts and unique behavior, with the effective radar radius overlaid on top of the points. It can be seen that a significant number of the dropouts and unique behavior occurred either in the approach path to the airport (Fargo or Grand Forks) or near the effective radar radius.
An overlapping study was also done to determine if the dropouts and unique behavior were radar or transponder induced. Fargo’s radar radius fits entirely inside Finley’s, so theoretically, all of Fargo’s planes should be detected by Finley (unless the planes are too low to be intercepted by Finley’s radar beam). It was found that only 2 of the 13 (15%) planes from Fargo showed unique behavior on both radars, and 1 out of the 64 (1.5%) planes from Fargo experienced dropouts on both radars. This indicates that in most cases of dropouts and unique behavior, it is a radar issue and not a transponder issue. However, transponder issues do still occur, which is shown from the overlapping analysis. The multiple aircraft unique behavior is also likely a transponder error, with either the wrong plane ID number being entered, or ATC assigning multiple of the same plane IDs. In conclusion, many dropouts and unique behavior phenomenon occur on a daily basis, which warrants future investigation.
3.2. ADS-B
A total of 642 aircraft data were analyzed including 534,736 data points/transmissions. Each data point contained the aircraft position (latitude, longitude), altitude, aircraft status (Ground/Air) and a few other messages. Dropouts occurred 35,063 times, but it should be noted that this number (35,063) does not represent time. In other words, the ADS-B message was lost for at least 1 s over 35,063 times transponding. The dropouts ranged from 2 s to over 5 min in some cases.
Table 3 summarizes these results.
We found that 71.5% of dropouts were less than 5 s in duration, and approximately 13% of total dropouts fell between 5 and 300 s. One unique finding was that 15.6% of the total dropouts lasted longer than 300 s (5 min), which is quite significant. However, it might not be solely a transponder issue. This data includes UND’s training fleet, so there is a possibility that the aircraft piloted by students took a flight path that went out of range of the ADS-B receiver. To check this hypothesis, the dataset from 21 June 2015 was considered because it had the least number of aircraft. The aircraft showing dropouts more than 300 s were identified, and the position information was scrutinized. We did find that some (3 out of 5) of the aircraft were taking a route that went outside the range of the ground ADS-B and came back after several minutes and repeated that maneuver again. This is one of the potential reasons for the higher dropout time in this initial study.
In the second phase of the ADS-B study, a representative sample of data starting from 12:00 a.m. to 12:14 a.m. on 20 October 2016, was utilized. A total of 1282 aircraft were found, of which only 744 aircraft reported position, and both geometric altitude and barometric altitude. This means approximately 42% (538) missed at least some portion of the position or altitude data. In addition, only 1155 aircraft reported both barometric and geometric altitude, which means that 10% of aircraft missed at least one of the altitude measurements.
Deviation was found between barometric and geometric altitudes ranging from 9 to 500 feet in the ADS-B data. Messages of 121 (10%) aircraft showed deviation in altitude data with approximately 48% of the aircraft having barometric altitude higher than geometric altitude. This trend was reversed in the remaining aircraft, comprising approximately 52% of the aircraft data.
Table 4 summarizes the results.
Primary analysis revealed that the altitude discrepancy could be as high as 500 feet. About 28% of discrepancies fell above 200 feet which might increase the likelihood of violation of the vertical separation threshold (
Table 5). A significant percentage of these cases could produce the possibility of a near mid-air collision condition. The discrepancies were nearly normally distributed above and below the actual altitude, so combinations where one is high and the other low can lead to dramatic vertical separation errors.
It is important to recognize the characteristics of the discrepancy in order to resolve them. The initial study revealed that approximately 82% aircraft display consistent discrepancy, however there are cases (~18% of the aircrafts) where the deviation is not a constant value and fluctuates. Also, phase of flight appears to play an important role in the discrepancy. Level flight showed higher deviation than ascending/descending phases.
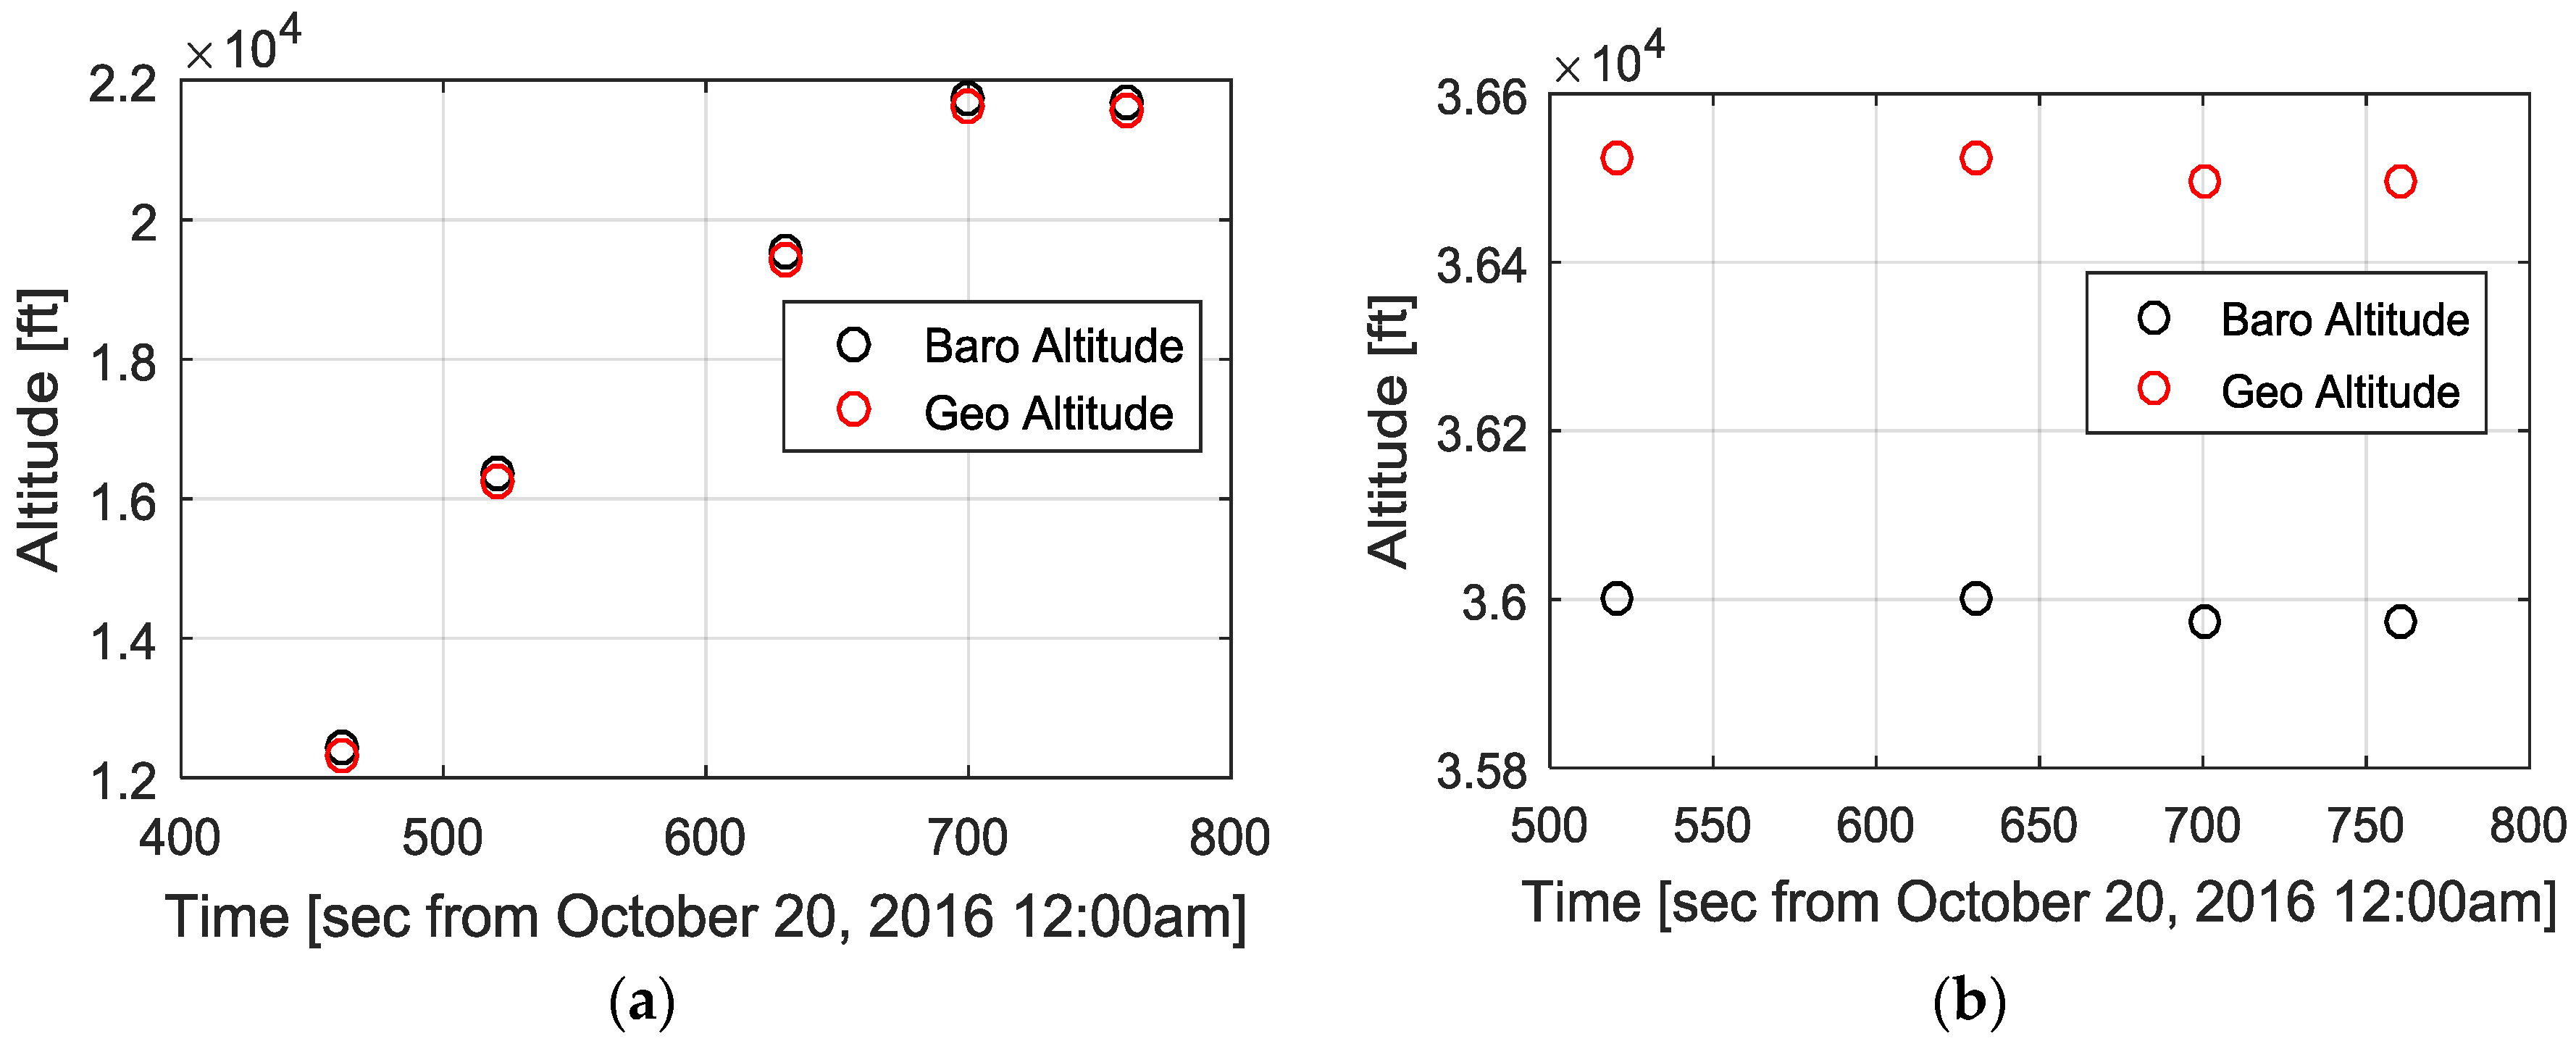
Figure 10 represents an example of the deviation in two different flight phases.
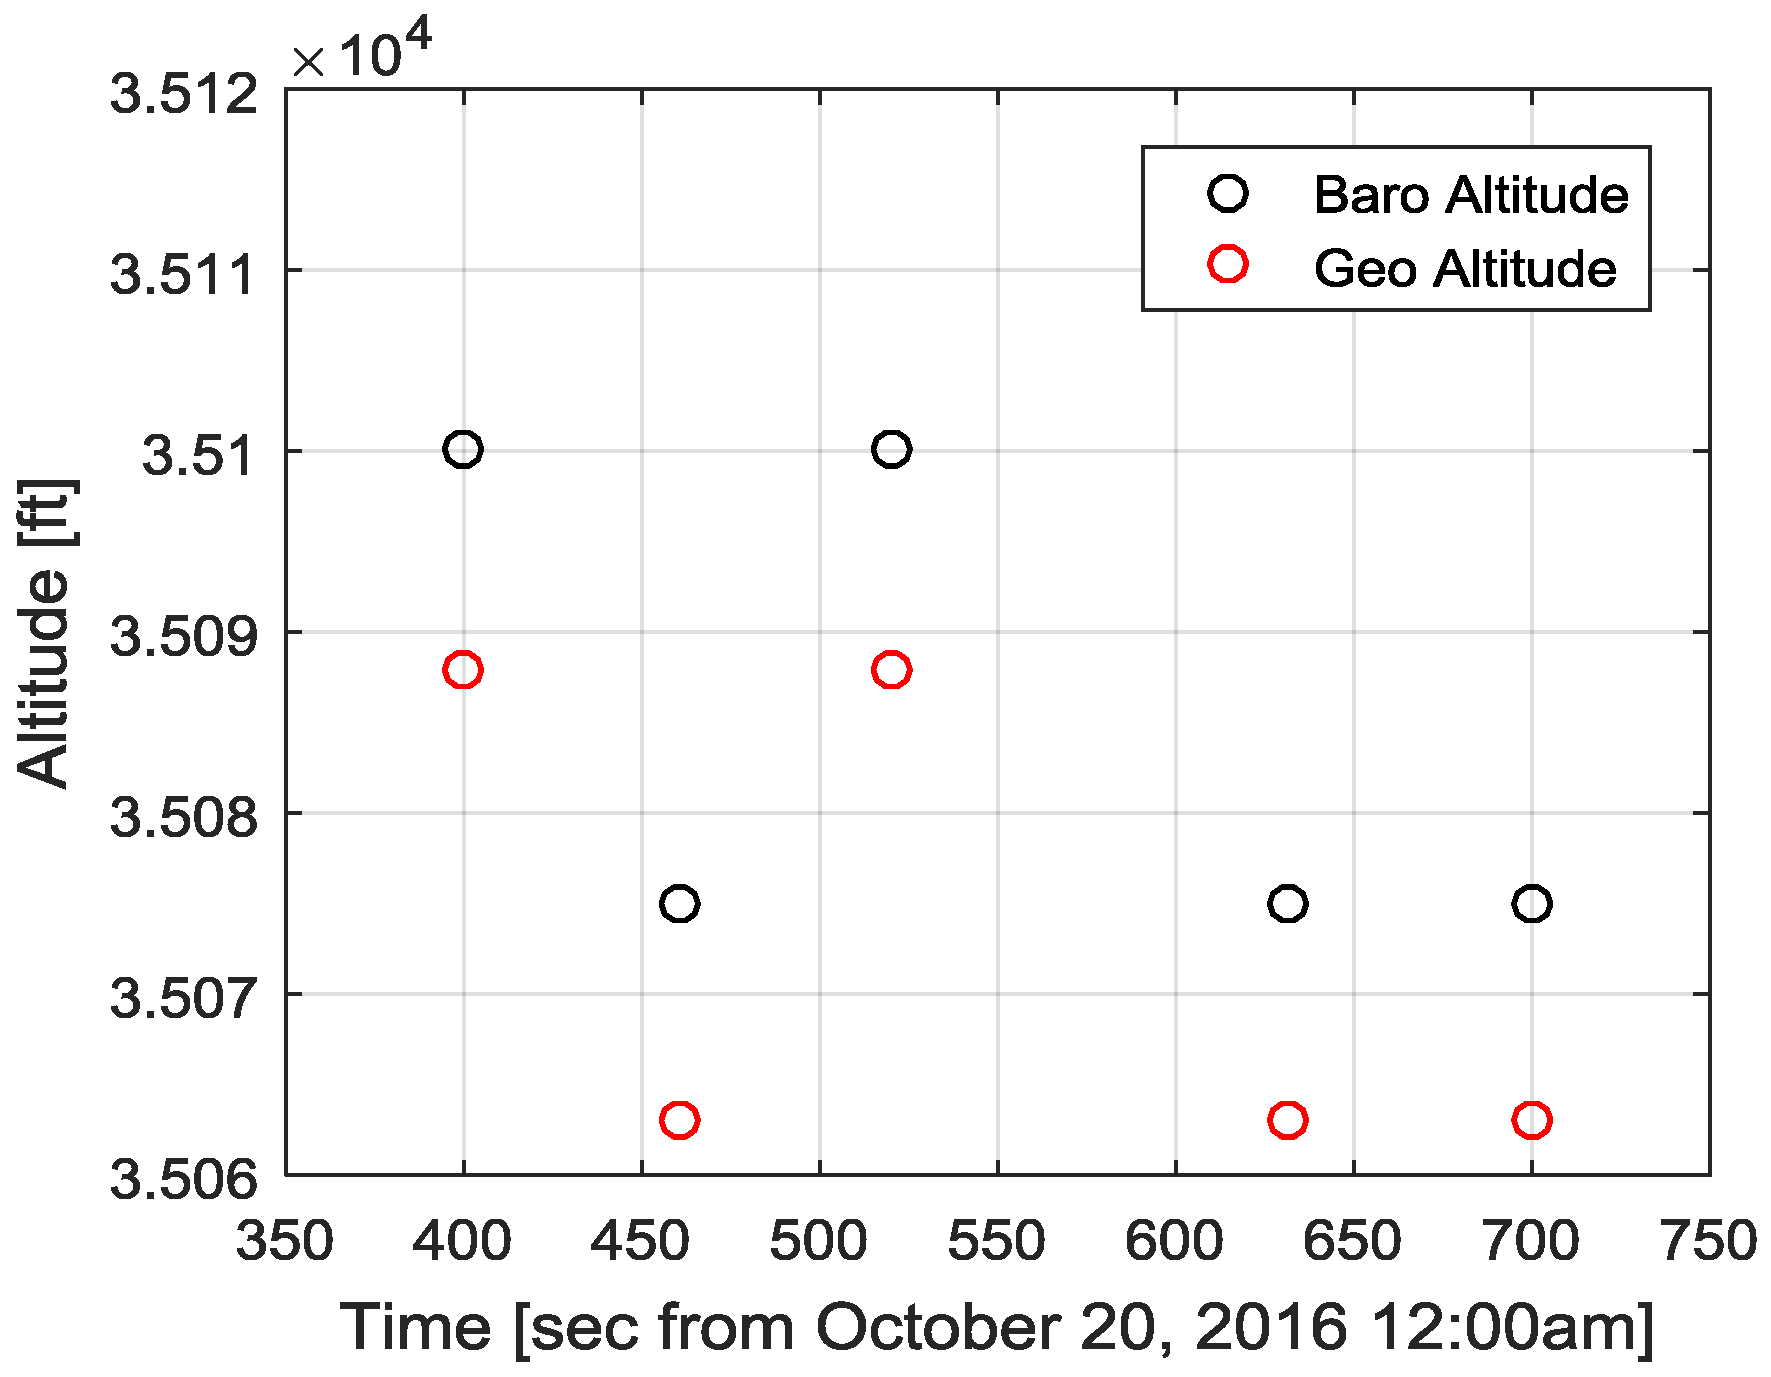
A unique anomaly was discovered by the analysis that can be called “altitude jump” where the altitude data set jumps every other sample. This was similar to the cyclical behavior identified in the radar analysis. The analysis was done on a small sample of data; a more diverse and comprehensive study may provide more insight on the anomalies found in this preliminary study and lead to solutions to overcome these behaviors.
Figure 11 represents the “altitude jump” anomaly.
4. Discussion
This study sought to further explore DAA criticality through examination of live radar and ADS-B that were made available from two radar sites in proximity to the University of North Dakota. Over hundreds of thousands of lines of data were examined for these sites representing one day of observations at each site. The dropout rates and unique behavior were tallied from the recorded radar data. The average drop out length occurred for 23.69 s and 32.41 s, at Fargo and Finley, respectively. While the average unique behavior length was 5.31 s at Fargo and 23.52 s at Finley. In fact, some drop outs lasted for several minutes. Considering the average or even the maximum time length of drop outs and unique behavior, they are a significant period of time for ATC to receive erroneous data. The large majority of drop outs and unique behavior occurred on the edge of the effective radar radius or near airports. This is logical because the radar is being pushed to the edge of its operational limitations at the edge of its scan area. Airports also have some of the highest traffic density, which likely leads to these phenomena. We determined that when dropouts and unique behavior occur, it is often caused by the radar ground station and not the transponder. However, it was also found that the transponder functionality appeared to be responsible for some of the unique behavior cases. The results suggest that dropouts and unique behavior occur every day. This is concerning as the unique behavior included altitude readings that alternated by hundreds of feet at successive scans and large discrepancies between altitude readings. This could prove problematic for vertical aircraft separation. Further research should explore how pervasive and common these failures are over time periods that go beyond a single day, and at other radar locations.
We examined ADS-B dropout rates over one week of data from an airport located near UND, involving 642 aircraft and 534,736 data point transmissions. Data was lost 35,063 times (6.6% of all transmissions) for a least one second during transponding. In some cases, dropouts lasted over five minutes but the vast majority of the dropouts (71.5%) were less than five seconds. These dropouts may not all be attributable to transponder failure as some of these dropouts were likely attributable to aircraft leaving the range of the ground ADS-B and later returning.
To further examine ADS-B performance, we considered data from a world-wide database of 1282 aircraft operating over a brief time span. Only 744 (58%) of these aircraft reported position, geometric altitude, and barometric altitude. Only 1155 (90%) of these aircraft had both barometric and geometric altitude. Among the aircraft that reported both altitudes, elevation differences were present in 121 (10%). We found elevation variation as high as 500 feet when we compared barometric and geometric altitudes. Approximately 28% (34) of the aircraft had elevation differences in excess of 200 feet, a level which could lead to a mid-air collision.
These two ADS-B studies raise concerns about ADS-B reliability and functionality. Further study should examine whether the trends we observed are consistent over longer time spans and larger aircraft fleets. Further study also might investigate whether the anomalous patterns and behavior we witnessed with radar and ADS-B also occur with other facilities and locations.
Our results drew from data that involved communications with manned aircraft. Our findings are also relevant, however, for UAS. UAS are increasingly becoming part of airspace throughout the world, and it is expected that unmanned aircraft will number more greatly than manned aircraft at a not-too-distant future, particularly in the transport and delivery role. Radar and ASD-B will also be technologies that UAS rely upon for airspace deconfliction and will therefore be affected by the identified anomalies and failures. In addition to understanding these anomalies to correctly build robust DAA systems for UAS, findings from this study could also be applied to autonomous ATC systems. In the future, autonomous ATC systems will likely be used in airspace that is not heavily congested. The radar and ADS-B anomalies identified in this work will need to be understood to help with the logic used in the future ATC systems.
Acknowledgments
The Federal Aviation Association has sponsored this project through the Center of Excellence for Unmanned Aircraft Systems. However, the agency neither endorses nor rejects the findings of this research. The presentation of this information is in the interest of invoking technical community comment on the results and conclusions of the research.
Author Contributions
William Semke, Nicholas Allen, and Asma Tabassum contributed to all phases of this research. Matthew McCrink and Mohammad Moallemi participated in the analysis, review, and writing of results. Kyle Snyder was the team lead in organizing this research effort, reporting with our sponsor, and reviewing all research products. Evan Arnold and Dawson Stott contributed to the experiment design and assisting with the synthesis of the results in the scope of the unified research project. Michael G. Wing coordinated the writing team effort and contributed to the writing and review of research results.
Conflicts of Interest
The authors declare no conflict of interest.
References
- Taib, N.A.; Ali, B.S. An Analysis of Geometric Altitude Data in ADS-B Messages. In Proceedings of the ION ITM, Monterey, CA, USA, 25–28 January 2016. [Google Scholar]
- Federal Aviation Administration. ADS-B IN Device Performance Analysis Report; Simulyze Inc.: Reston, VA, USA, 2016.
- Thomas, M.L. Atlas of Radar Coverage of the Lower 48 Border States—Final. Available online: http://psugeo.org/Publications/Atlas%20of%20Radar%20Coverage%20of%20the%20Lower%2048%20Border%20States%20-%20Final.pdf (accessed on 8 March 2017).
- Healy, T.A.; McDonald, R.K.; Pomrink, R.F.; Conklin, W.P. Air Route Surveillance Radar Model 4 (ARSR-4) Operational Test and Evaluation (OT&E) Final Report; Federal Aviation Administration Technical Center: Atlantic City, NJ, USA, 1997.
- Weber, R.; Schanne, J. Airport Surveillance Radar Model 11 (ASR-11) FAA Test and Evaluation Master Plan (TEMP); Federal Aviation Administration Technical Center: Atlantic City, NJ, USA, 1998.
- Busch, A.C.; Bradbury, P. Measurement and Analyses of ASR-4 System Error. Part I. Overview; Federal Aviation Administration: Atlantic City, NJ, USA, 1974.
- Mayer, C.; Tzanos, P. Comparison of ASR-11 and ASR-9 Surveillance Radar Azimuth Error. In Proceedings of the 2011 IEEE/AIAA 30th Digital Avionics Systems Conference, Seattle, WA, USA, 16–20 October 2011. [Google Scholar]
- Air Traffic Control Radar Beacon System (ATCRBS). Available online: http://web.mit.edu/6.933/www/Fall2000/mode-s/atcrbs.html (accessed on 30 January 2017).
- Phillips, D. Mode A and Mode C: The Straight Scoop on How It Works. Available online: http://www.aeroelectric.com/articles/Altitude_Encoding/modec.htm (accessed on 30 January 2017).
- Lemmon, J.L.; Carrol, J.E.; Sanders, F.H.; Turner, D. Assessment of the Effects of Wind Turbines on Air Traffic Control Radars; United States Department of Commerce: Washington, DC, USA, 2008.
- Immoreev, I.J.; Taylor, J.D. Future of Radars. In Proceedings of the IEEE Conference on Ultra Wideband Systems and Technologies, Baltimore, MD, USA, 21–23 May 2002. [Google Scholar]
- Buckler, L.M. The Use of Phased Array Radars at Civilian Airports. In Proceedings of the IEEE Phased Array Systems and Technology Conference, Boston, MA, USA, 15–18 October 1996. [Google Scholar]
- Petrochilos, N.; Galati, G.; Mene, L.; Piracci, E. Separation of Multiple Secondary Surveillance Radar Sources in a Real Environment by a Novel Projection Algorithm. In Proceedings of the IEEE Conference on Signal Processing and Information Technology, Athens, Greece, 21 December 2005. [Google Scholar]
- Federal Aviation Administration. Multifunction Phased Array Radar (MPAR) Notional Functional Requirements Document; Federal Aviation Administration: Washington, DC, USA, 2012.
- Federal Aviation Administration. Houston/I90 TRACON Automatic Dependent Surveillance—Broadcast (ADS-B) Flight Inspection Analysis and Coverage Report; Federal Aviation Administration: Washington, DC, USA, 2011.
- Federal Aviation Administration. Public ADS-B Performance Report (PAPR) User’s Guide; Federal Aviation Administration: Washington, DC, USA, 2016.
- Ali, B.S.; Schuster, W.; Ochien, W.; Majumdar, A.; Kian, C.T. A Study of ADS-B Data Evaluation and Related Problems. Proceeding of the 2013 International Technical Meeting of the Institute of Navigation, San Diego, CA, USA, 27–29 January 2013. [Google Scholar]
- Zhang, J.; Lui, W.; Zhu, Y. Study of ADS-B data evaluation. Chin. J. Aeronaut. 2011, 24, 461–466. [Google Scholar] [CrossRef]
- Baud, O.; Honore, N.; Taupin, O. Radar/ADS-B Data Fusion Architecture for Experimentation Purpose. In Proceedings of the IEEE Conference on Information Fusion, Florence, Italy, 10–13 July 2006. [Google Scholar]
- Castle, M.W.; Trinh, T.; Mayer, C.; Parry, C. Evaluation of Separation Performance with ADS-B at the Philadelphia Key Site. In Proceedings of the IEEE/AIAA 29th Digital Avionics Systems Conference, Salt Lake City, UT, USA, 3–7 October 2010. [Google Scholar]
- Wolff, C. Radar Tutorial. Available online: http://www.radartutorial.eu/druck/Book2.pdf (accessed on 15 February 2017).
- Tang, W.; Howell, G.; Tsai, Y.H. Barometric altimeter short-term accuracy analysis. IEEE Aerosp. Electron. Syst. Mag. 2005, 20, 24–26. [Google Scholar] [CrossRef]
- Kaplan, E.D.; Hegarty, C. Understanding GPS: Principles and Applications; Artech House: Norwood, MA, USA, 2005. [Google Scholar]
- Wolff, C. Radar Sets. In Radar Basics; RadarTutorial.eu: Berlin, Germany, 1998; pp. 1–11. [Google Scholar]
- Jain, P. Classification of RADARs. Available online: https://www.engineersgarage.com/articles/types-of-radars (accessed on 21 March 2017).
- Richards, M.A.; Scheer, J.A.; Holm, W.A. Principles of Modern Radar; SciTech Publishing: Raleigh, NC, USA, 2010; ISBN 978-1-891121-52-4. [Google Scholar]
- Jain, P. Classification of RADARs. Available online: https://www.engineersgarage.com/articles/types-of-radars (accessed on 29 April 2017).
- International Civil Aviation Organization. Manual for the Universal Access Transceiver (UAT); ICAO: Montreal, QC, Canada, 2003. [Google Scholar]
- Wichgers, J.M. Automatic Dependent Surveillance—Broadcast. In Digital Avionics Handbook, 3rd ed.; CRC Press: Boca Raton, FL, USA, 2015. [Google Scholar]
- Federal Aviation Administration. Airworthiness Approval of Automatic Dependent Surveillance—Broadcast (ADS-B) Out Systems; Federal Aviation Administration: Washington, DC, USA, 2015.
- Federal Aviation Administration. NextGen: Automatic Dependent Surveillance—Broadcast. Available online: https://www.faa.gov/nextgen/update/progress_and_plans/adsb/ (accessed on 4 May 2017).
- Nikoleris, A.; Erzberger, H.; Paielli, R.; Chu, Y. Performance of an Automated System for Control of Traffic in Terminal Airspace. In Proceedings of the 16th AIAA Aviation Technology, Integration, and Operations Conference, Washington, DC, USA, 13–17 June 2016. [Google Scholar]
Figure 1.
Primary radar schematic.
Figure 1.
Primary radar schematic.
Figure 2.
Secondary Surveillance Radar Schematic.
Figure 2.
Secondary Surveillance Radar Schematic.
Figure 3.
High level universal access transceiver (UAT) automatic dependent surveillance–broadcast (ADS-B) block diagram.
Figure 3.
High level universal access transceiver (UAT) automatic dependent surveillance–broadcast (ADS-B) block diagram.
Figure 4.
Altitude [ft] vs. time [sec from 21 June 2015 12:00 a.m.] plot showing dropouts. Note the time gaps/dropouts on the right side of the plot within the red box.
Figure 4.
Altitude [ft] vs. time [sec from 21 June 2015 12:00 a.m.] plot showing dropouts. Note the time gaps/dropouts on the right side of the plot within the red box.
Figure 5.
Altitude [ft] vs. time [sec from 21 June 2015 12:00 a.m.] plot showing cyclical unique behavior. Note the altitude jumping between 35,000 (red circles) and 36,000 feet (blue circles).
Figure 5.
Altitude [ft] vs. time [sec from 21 June 2015 12:00 a.m.] plot showing cyclical unique behavior. Note the altitude jumping between 35,000 (red circles) and 36,000 feet (blue circles).
Figure 6.
Altitude [ft] vs. time [sec from 21 June 2015 12:00 a.m.] plot showing multiple aircraft with the same aircraft ID number. This plot illustrates an example of when there were many readings that occurred at the same time period without the ability to resolve them independently, indicating that multiple aircraft had the same ID number. As the ID numbers are identical it is not possible to distinguish individual aircraft, resulting in significantly degraded situational awareness.
Figure 7.
Altitude [ft] vs. time [sec from 21 June 2015 12:00 a.m.] plot showing outliers. Note how the altitude readings jump from their nominal reading (blue circles) to 0 ft (red circles) back to the nominal value many times.
Figure 7.
Altitude [ft] vs. time [sec from 21 June 2015 12:00 a.m.] plot showing outliers. Note how the altitude readings jump from their nominal reading (blue circles) to 0 ft (red circles) back to the nominal value many times.
Figure 8.
The Finley Radar Map showing the effective radar radius (blue circle) and the location of each dropout or unique behavior (red dot): (a) Dropouts; (b) Unique Behavior.
Figure 8.
The Finley Radar Map showing the effective radar radius (blue circle) and the location of each dropout or unique behavior (red dot): (a) Dropouts; (b) Unique Behavior.
Figure 9.
The Fargo Radar Map showing the effective radar radius (blue circle) and the location of each dropout or unique behavior (red dot): (a) Dropouts; (b) Unique Behavior.
Figure 9.
The Fargo Radar Map showing the effective radar radius (blue circle) and the location of each dropout or unique behavior (red dot): (a) Dropouts; (b) Unique Behavior.
Figure 10.
Altitude [ft] vs. time [sec from 20 October 2016 12:00 a.m.] plots showing discrepancies in ascending and level flight: (a) Altitude discrepancy is small in ascending phase; (b) discrepancy range is higher in level flight.
Figure 10.
Altitude [ft] vs. time [sec from 20 October 2016 12:00 a.m.] plots showing discrepancies in ascending and level flight: (a) Altitude discrepancy is small in ascending phase; (b) discrepancy range is higher in level flight.
Figure 11.
Altitude [ft] vs. Time [sec from 20 October 2016 12:00 a.m.] plot showing cyclic change in both geometric and barometric altitude data.
Figure 11.
Altitude [ft] vs. Time [sec from 20 October 2016 12:00 a.m.] plot showing cyclic change in both geometric and barometric altitude data.
Table 1.
Summary of dropout statistics for both the Fargo and Finley sites. The average, minimum, and maximum dropout time is noted. The dropouts are also ranked by time intervals, showing the number of dropouts for that time period and the percentage.
Table 1.
Summary of dropout statistics for both the Fargo and Finley sites. The average, minimum, and maximum dropout time is noted. The dropouts are also ranked by time intervals, showing the number of dropouts for that time period and the percentage.
| Fargo | Finley |
|---|
| Dropout Duration | - | Dropout Duration | - |
| Average (s) | 23.69 | - | Average (s) | 32.41 | - |
| Minimum (s) | 9.00 | - | Minimum (s) | 23.53 | - |
| Maximum (s) | 265.46 | - | Maximum (s) | 336.27 | - |
| Categorized Data | - | Categorized Data | - |
| Number of Dropouts | 132 | - | Number of Dropouts | 352 | - |
| Less than 10 s | 65 | 49% | Less than 24 s | 146 | 41% |
| 10–15 s | 24 | 18% | 24–36 s | 143 | 41% |
| 15–20 s | 1 | 1% | 36–48 s | 24 | 7% |
| 20–25 s | 5 | 4% | 48–60 s | 9 | 3% |
| 25–30 s | 5 | 4% | 60–90 s | 19 | 5% |
| 30–60 s | 26 | 20% | 90–120 s | 9 | 3% |
| Greater than 60 s | 9 | 7% | Greater than 120 s | 2 | 1% |
Table 2.
Summary of unique behavior for the Fargo and Finley sites. The average, minimum, and maximum unique behavior time is noted. The unique behavior occurrences are also ranked by time intervals, showing the number of unique behavior instances for that time period and the percentage.
Table 2.
Summary of unique behavior for the Fargo and Finley sites. The average, minimum, and maximum unique behavior time is noted. The unique behavior occurrences are also ranked by time intervals, showing the number of unique behavior instances for that time period and the percentage.
| Fargo | Finley |
|---|
| Unique Behavior | - | Unique Behavior | - |
| Average (s) | 5.31 | - | Average (s) | 23.52 | - |
| Minimum (s) | 4.66 | - | Minimum (s) | 11.84 | - |
| Maximum (s) | 19.24 | - | Maximum (s) | 108.16 | - |
| Categorized Data | - | Categorized Data | - |
| Unique Behavior | 52 | - | Unique Behavior | 25 | - |
| Less than 10 s | 51 | 98% | Less than 24 s | 19 | 76% |
| 10–15 s | 0 | 0% | 24–36 s | 2 | 8% |
| 15–20 s | 1 | 2% | 36–48 s | 1 | 4% |
| 20–25 s | 0 | 0% | 48–60 s | 1 | 4% |
| 25–30 s | 0 | 0% | 60–90 s | 0 | 0% |
| 30–60 s | 0 | 0% | 90–120 s | 2 | 8% |
| Greater than 60 s | 0 | 0% | Greater than 120 s | 0 | 0% |
Table 3.
Dropout statistics over 7 days (15 June to 21 June 2015). Dropouts are also categorized by duration interval including occurrences and interval percentages.
Table 3.
Dropout statistics over 7 days (15 June to 21 June 2015). Dropouts are also categorized by duration interval including occurrences and interval percentages.
| Total Data Set | Dropout | % Dropout |
|---|
| 534,736 | 35,063 | 6.6% |
| Categorized Data |
| Total | 35,063 | - |
| Less Than 5 s | 25,066 | 71.5% |
| 5–10 s | 512 | 1.5% |
| 10–20 s | 313 | 0.9% |
| 20–40 s | 92 | 0.3% |
| 40–60 s | 163 | 0.3% |
| 60–300 s | 3401 | 9.7% |
| Greater 300 s | 5469 | 15.6% |
Table 4.
Aircraft demonstrating different characteristics of altitude data from ADS-B messaging.
Table 4.
Aircraft demonstrating different characteristics of altitude data from ADS-B messaging.
| Behaviors | Number of Aircraft | Percentage |
|---|
| Report Both Altitude | 1155 | - |
| No deviation found | 1034 | 90% |
| Discrepancy found | 121 | 10% |
| Out of 121 cases of altitude discrepancy | Consistent Discrepancy | 99 | 82% |
| Fluctuating Discrepancy | 22 | 18% |
Table 5.
Aircraft altitude discrepancy ranges.
Table 5.
Aircraft altitude discrepancy ranges.
| Altitude Discrepancy Range | Number of Aircraft | Percentage (Out of 121 Aircraft That Showed Altitude Discrepancy) |
|---|
| 1 feet–50 feet | 32 | 26% |
| 51 feet–100 feet | 23 | 19% |
| 101 feet–150 feet | 16 | 13% |
| 151 feet–200 feet | 16 | 13% |
| 201 feet–250 feet | 17 | 14% |
| 251 feet–350 feet | 11 | 9% |
| 351 feet–450 feet | 04 | 3% |
| 451 feet–500 feet | 02 | 2% |
© 2017 by the authors. Licensee MDPI, Basel, Switzerland. This article is an open access article distributed under the terms and conditions of the Creative Commons Attribution (CC BY) license (http://creativecommons.org/licenses/by/4.0/).

 ,
, 


