1. Introduction
Flapping flight has become an increasingly popular area of research over the last couple of decades. Important experimental and numerical analyses have been carried out, and flapping flight drones and aircraft have been designed, built and tested with varying degrees of success. Two major categories of activity have been differentiated:
The first category is related to the development of ornithopter aircraft, i.e., machines that fly like birds, while the second is related to entomopters, i.e., aircraft that flap like insects. There is also a scale difference between the two categories, since ornithopters can have sizes of the order of one meter while entomopters are measured in decimeters or even centimeters. This work will concentrate exclusively on birdlike flapping.
Many significant works have been published on birdlike flapping, starting with the 2D work of Von Karman and Burgers [
2] and Garrick [
3]. More recently, Young et al. [
4] published an extensive review of the state of the art concerning flapping 2D airfoils. In fact, there has been a surprising number of review papers on flapping flight [
5,
6,
7,
8,
9,
10], considering the fact that the subject is a relatively new research area. As insect-like flight is considered to be more challenging, most researchers have concentrated on it. Nevertheless, birdlike flight is not a resolved problem, and there are still many open questions concerning it.
Numerous experimental, theoretical and numerical analyses of pitching and/or plunging 2D airfoils have been performed. Such work is relevant to hydrofoils, aircraft wings and helicopter blades, and therefore, wide ranges of Reynolds and Mach numbers have been investigated. In contrast, work on 3D flapping has been rarer although some contributions were made in the last couple of decades [
11,
12,
13,
14].
One of the important issues concerning flapping flight is the modeling approach to be used in order to estimate the aerodynamic loads. Numerous techniques from modified strip theory to Computational Fluid Dynamics (CFD) have been applied. Computational cost is quite an important consideration due to the unsteady nature of the flow fields so that lower fidelity approaches can be preferable, at least under attached flow conditions. The Vortex Lattice Method (VLM) has been proposed for modeling flapping flight by several authors [
15,
16,
17,
18,
19,
20]. Ames et al. [
21] compared predictions from a vortex lattice simulation against experimental measurements for a flapping rigid rectangular wing. They found that the predictions were accurate only for the highest Reynolds numbers and lowest reduced frequencies tested, since the VLM is an inviscid approach and, therefore, cannot model flow separation. However, extensions for flow separation at the leading edge have been in use since the 1970s [
22,
23,
24,
25]. Roccia et al. [
26] used such a modification to model flapping wings in hover conditions. Many of the VLM simulations have been coupled to structural solvers in order to simulate flexible flapping wings [
27,
28,
29]. Others have used the VLM in order to optimize thrust production or power requirements for flapping flight [
30,
31]. Vest and Katz [
32] carried out flapping wing simulations using the unsteady source and doublet method, which is also inviscid, but, unlike the VLM, can model wing thickness. Another alternative is the doublet lattice method studied by Isogai and Harino [
33].
The objective of the present work is to investigate the accuracy of the load predictions obtained by the vortex lattice method when applied to the flapping of a rigid rectangular wing, in both attached and separated flow cases. Three different techniques for load estimation will be used and their predictions compared to experimental measurements.
2. Experiments
The flapping wing experiments are described in detail in Razak and Dimitriadis [
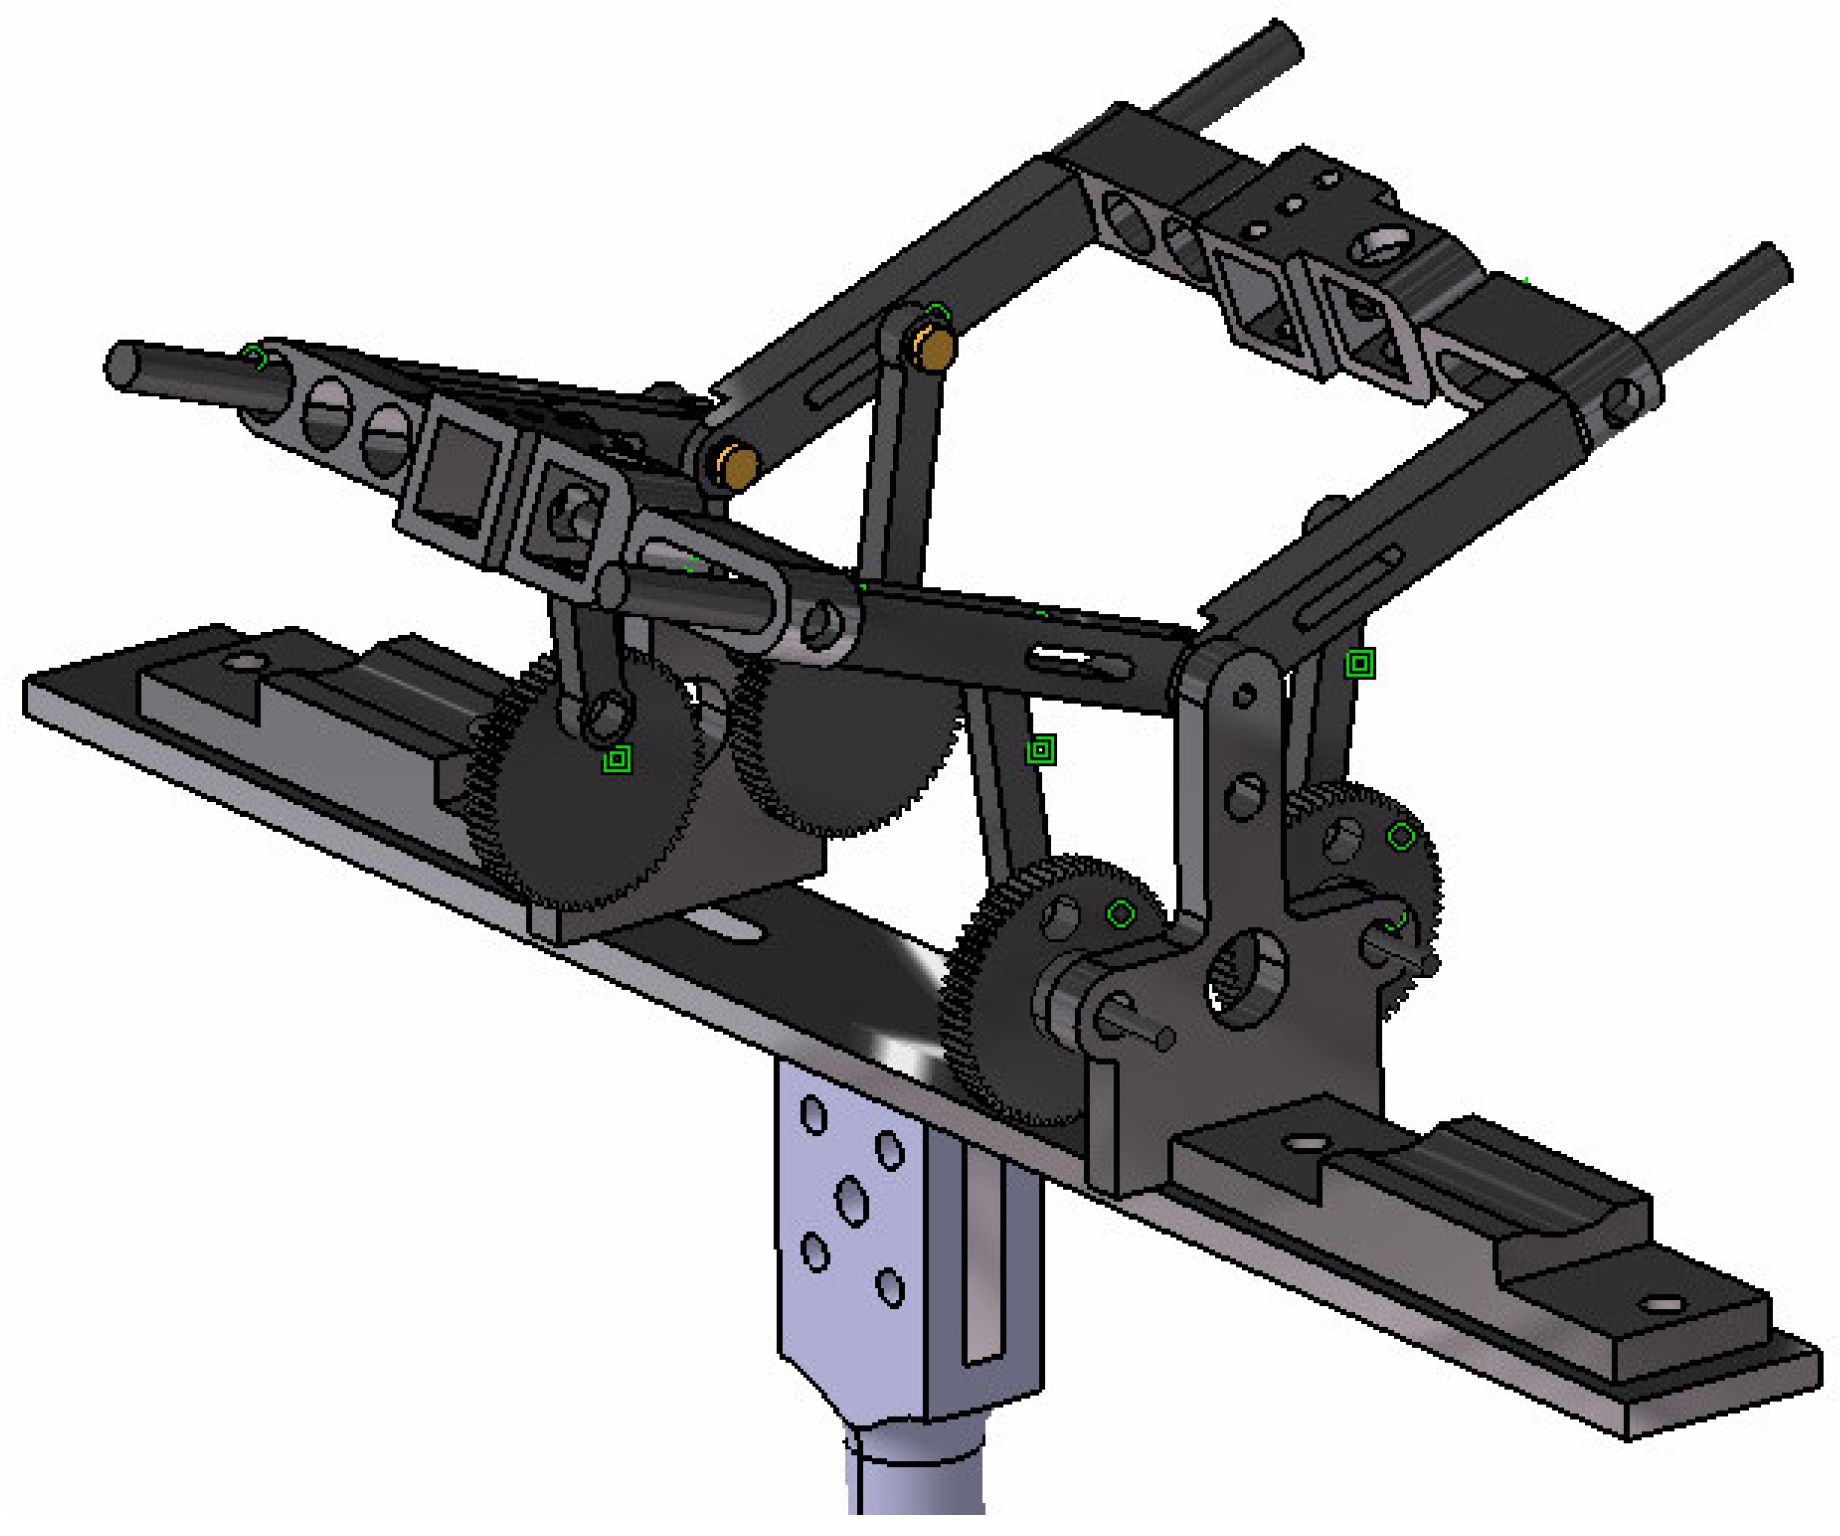
14]; only a short summary is presented here. The flapping mechanism is shown in
Figure 1 and consisted of a tandem dual crank arrangement, connected to a single drive shaft, which was in turn driven by a brushless direct current electric motor. Root flapping was imposed by the dual crank, while pitching was imposed by the tandem nature of the mechanism. The phase between the forward and aft flapping arms was constant throughout the flapping cycle. The value of the phase could be set by imposing an initial offset in the positions of the two cranks. Wing adaptors were used to join the forward and aft flapping arms. The adaptors’ function was to accommodate different orientations and positions of the flapping arms and to translate these into pitching angle without stressing the flapping arms. They also allowed the setting of a constant geometric static pitch angle
.
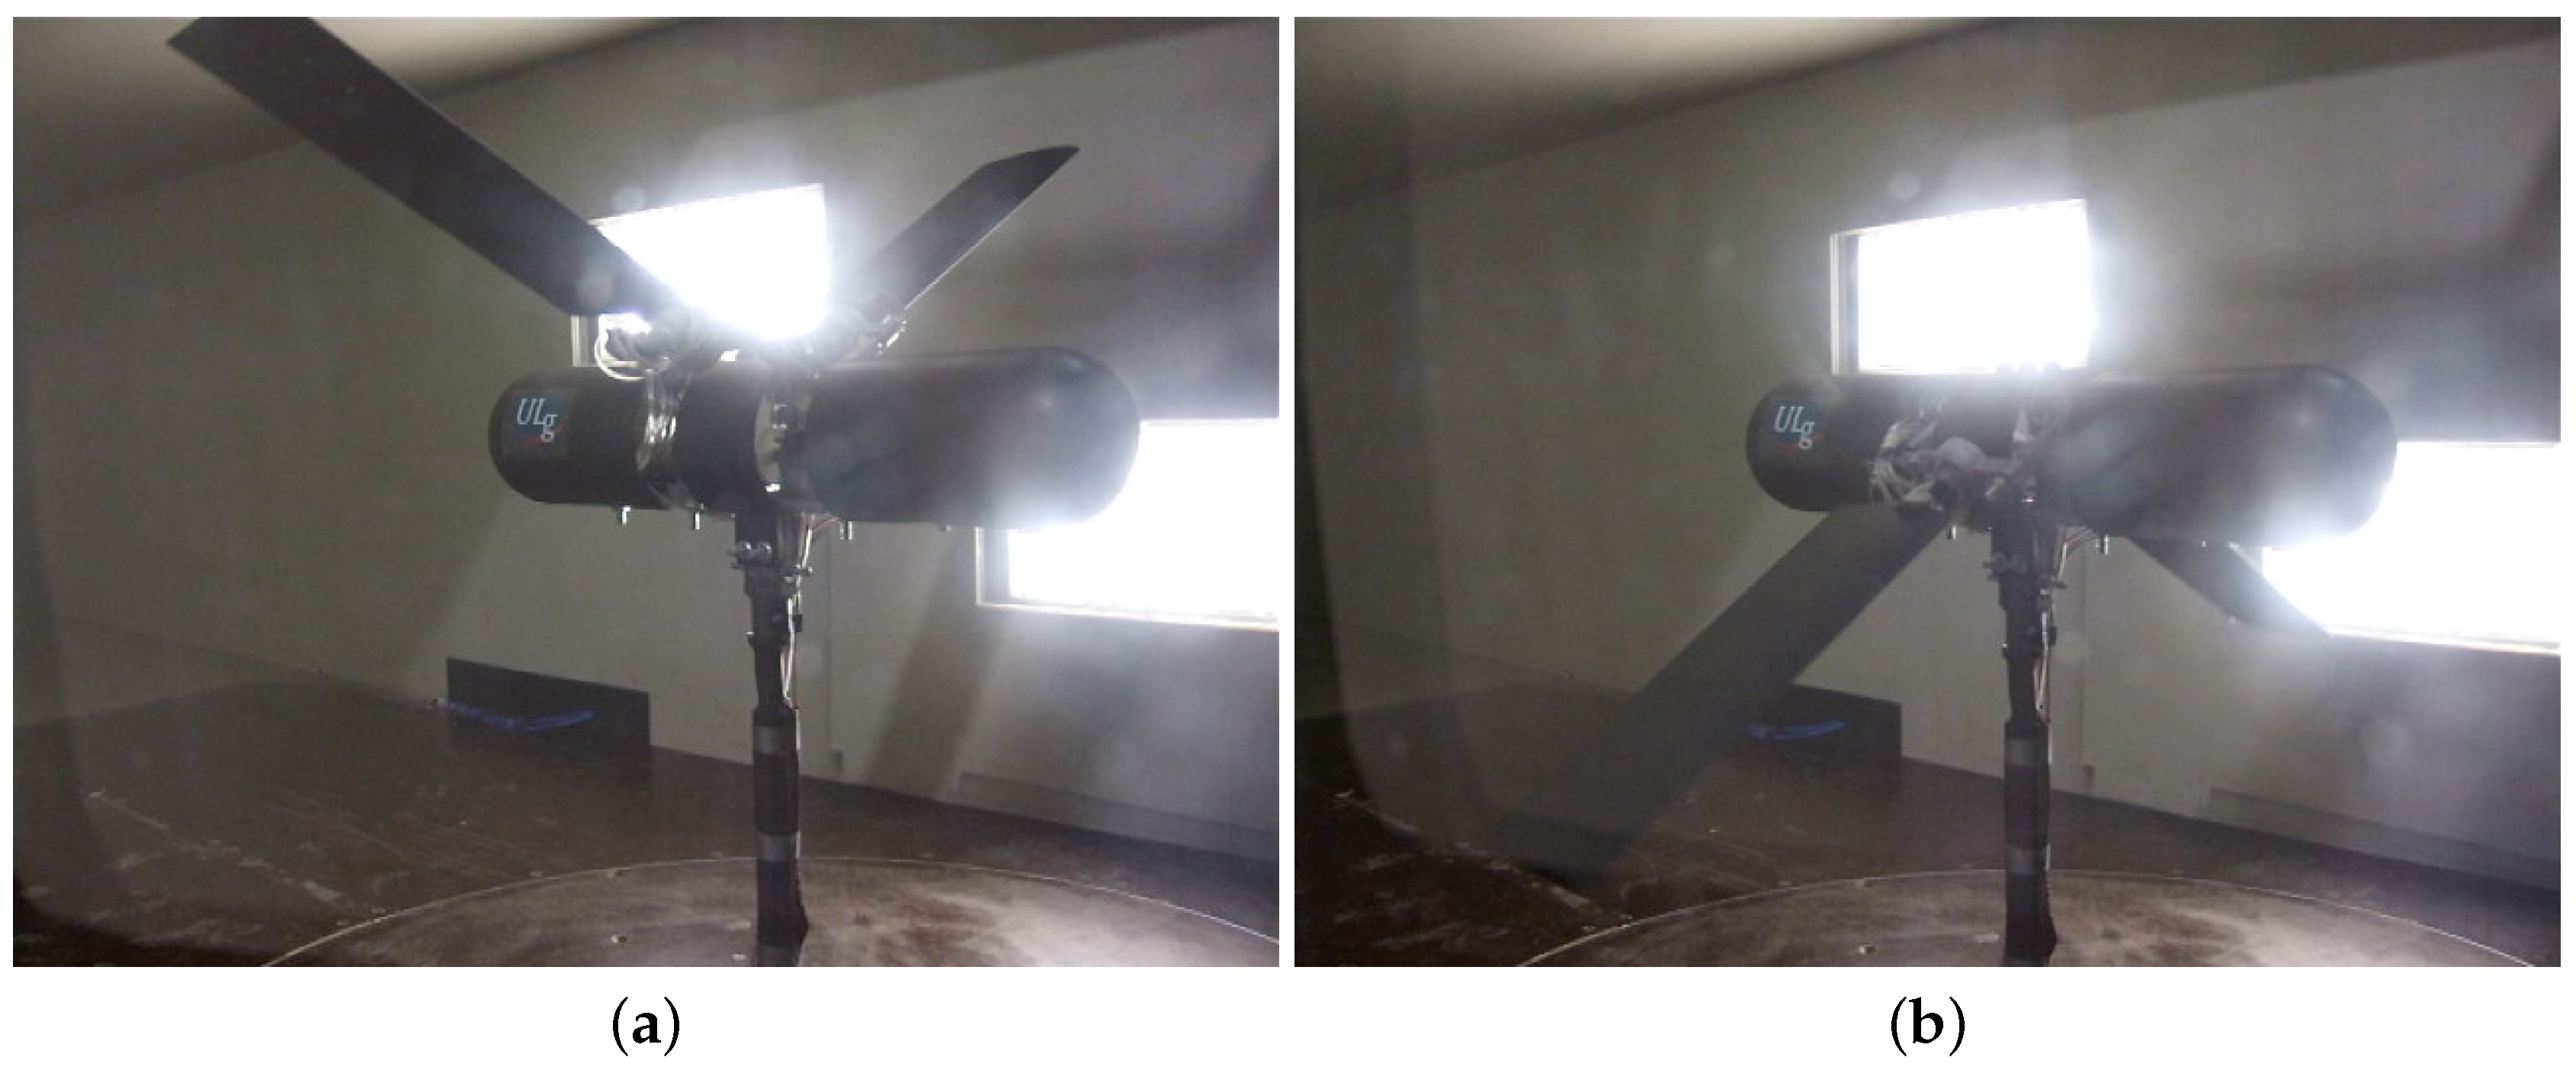
Figure 2 shows the complete apparatus in the wind tunnel, with wings installed at the maximum and minimum flap angle positions. The amplitude of the flap angle,
, was
. The maximum amplitude of the pitch angle,
, was
, but could be set to any desired lower value. Flapping and pitching occurred at the same frequency,
f, which was set to four values of 0.79, 1, 1.23 and 1.5 Hz. The frequency was kept low to avoid interference from the structural modes of vibration of the entire assembly and to limit the inertial loads caused by the motion.
Figure 2 also shows that the flapping assembly was mounted on a beam instrumented with strain gauges that was used to measure the lift, drag and side forces. The lift force was defined as perpendicular to the wind tunnel’s free stream and the drag parallel to it.
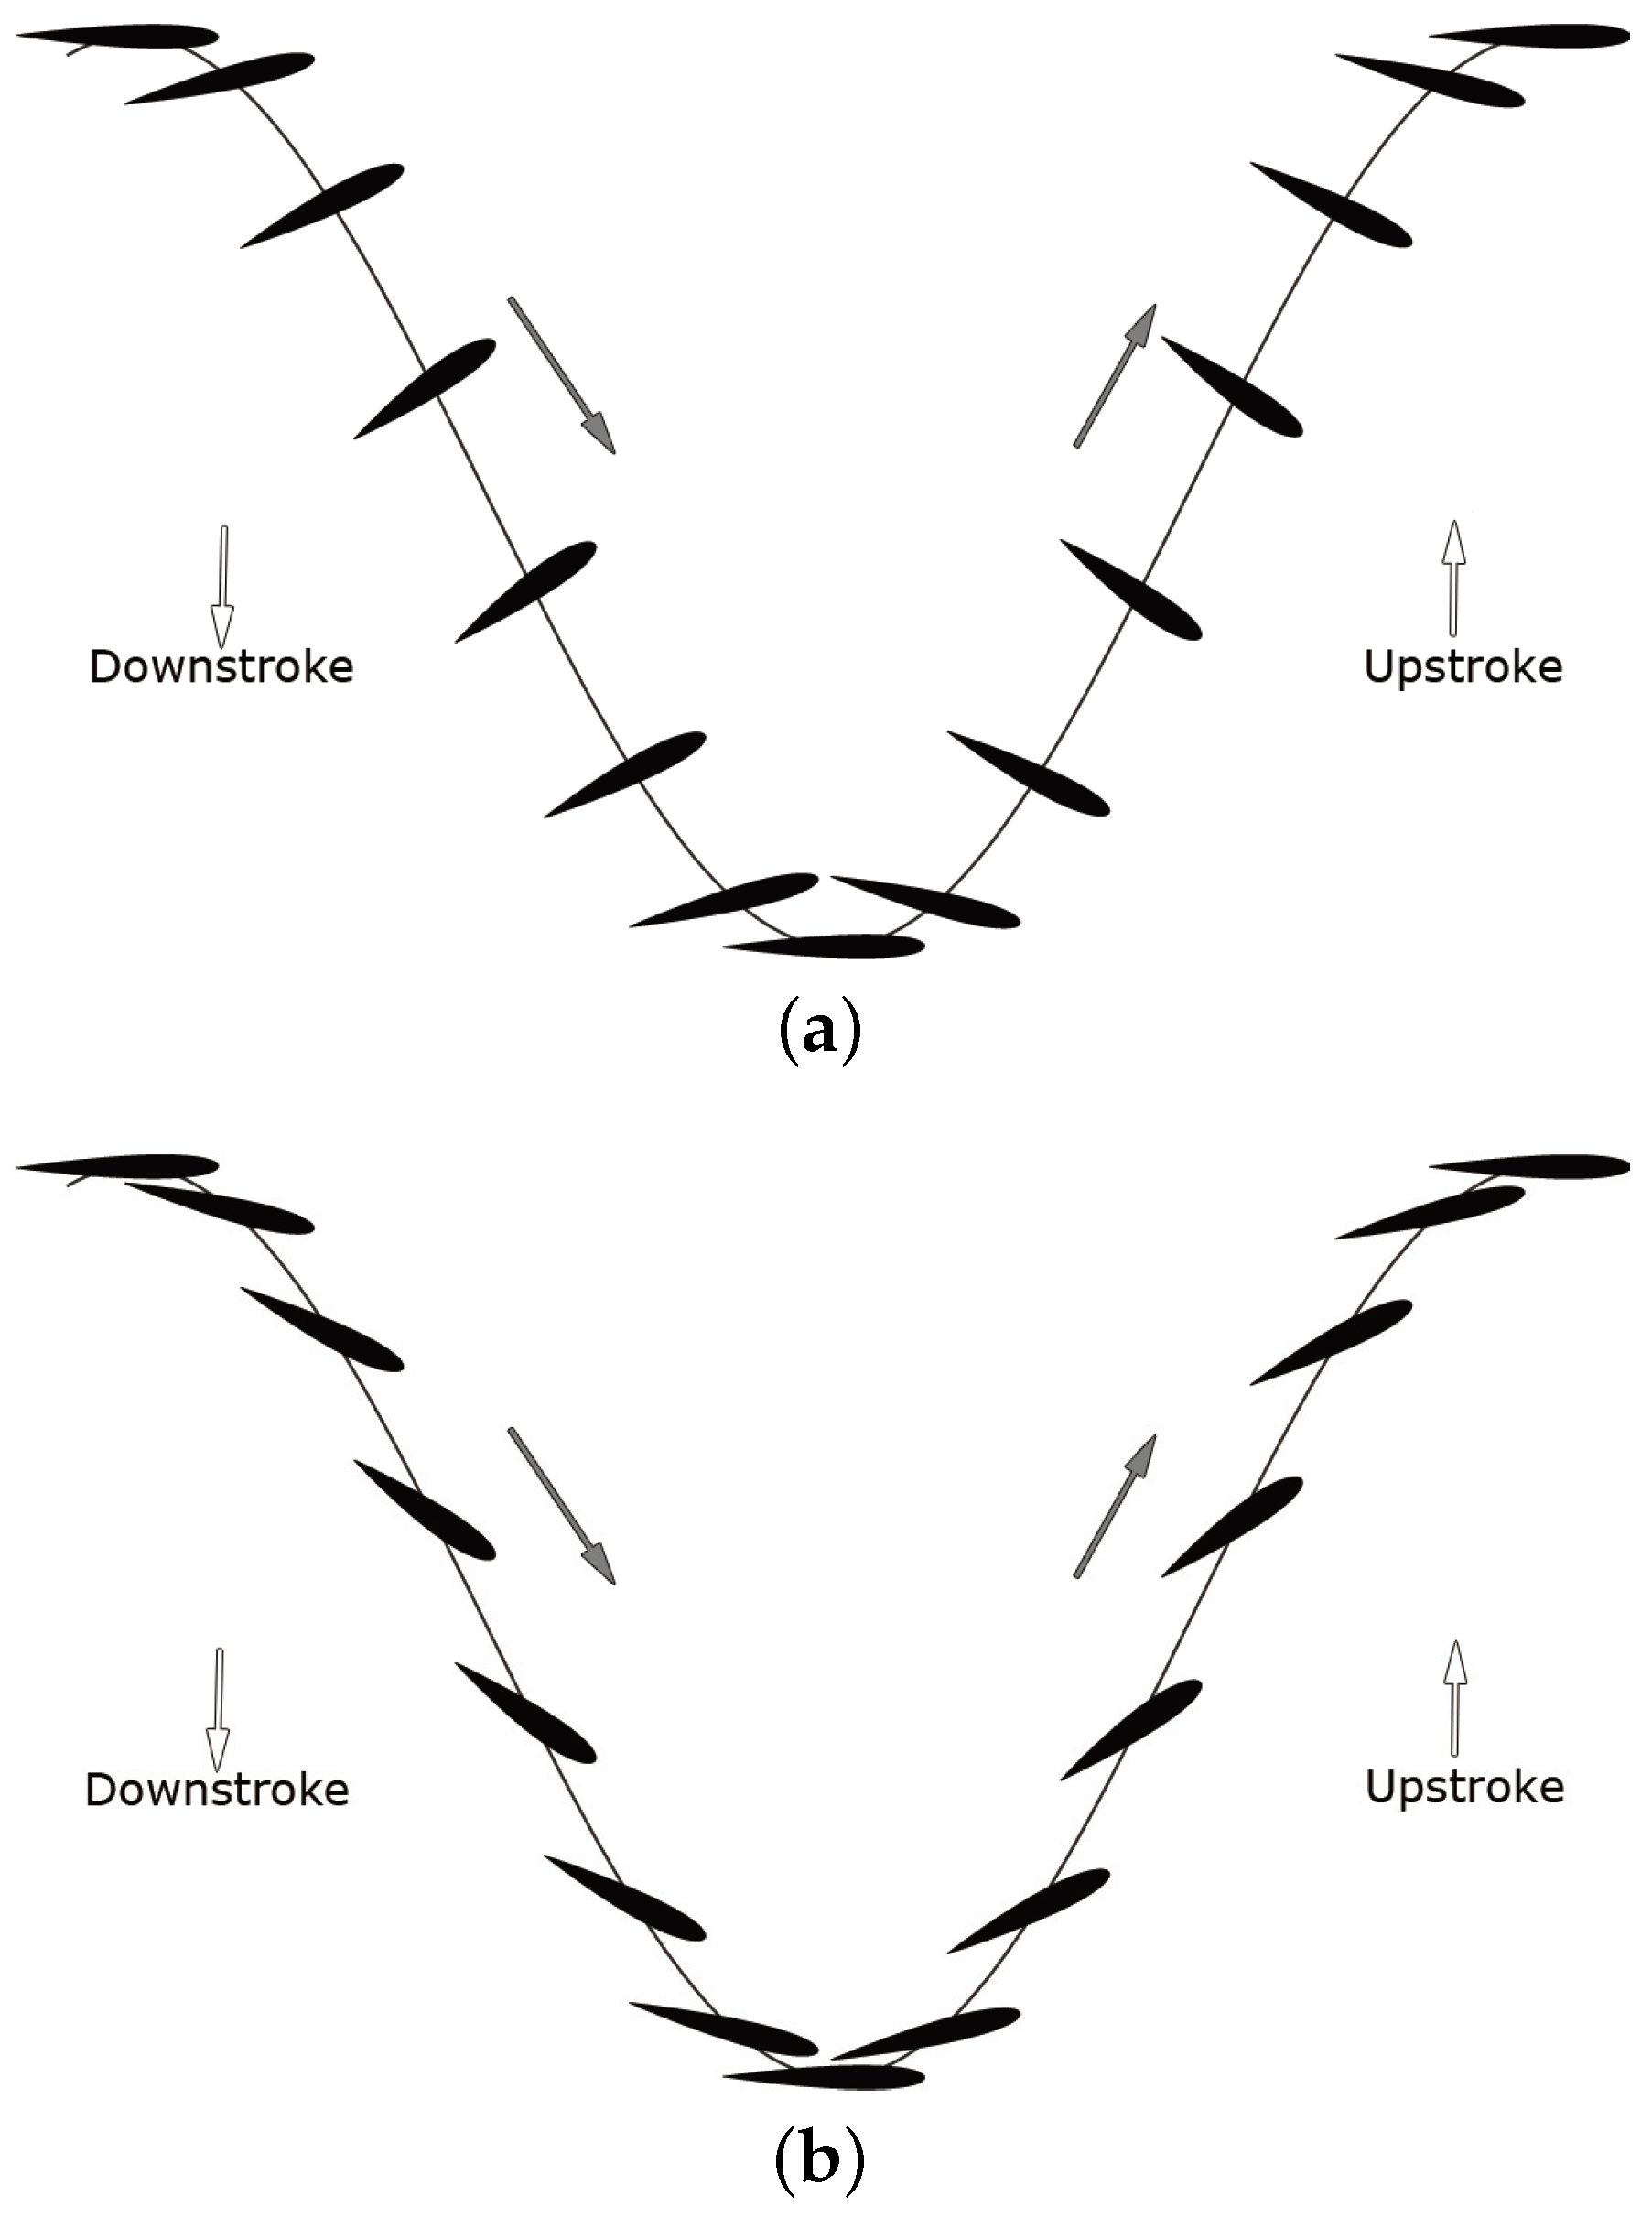
Pure flapping, pitch lagging and pitch leading kinematics were imposed on the wings. Pure flapping involved a constant pitch angle; the difference between pitch lagging and pitch leading motions is demonstrated in
Figure 3. In the lagging case, the instantaneous flap angle leads the instantaneous pitch angle by a phase difference of
and vice versa. Pitch leading ensures that the kinematic angle of attack of the wing remains small and maximizes the thrust while keeping the flow attached. Conversely, pitch lagging causes very high kinematic angles of attack and generates high instantaneous values of lift.
The wings were straight, rectangular and untwisted and had an NACA 6409 profile (other wing profiles were also tested [
14], but only the NACA 6409 wing will be used in the present work, as it was the only wing that was tested in pure flapping, pitch leading and pitch lagging kinematic configurations). The chord,
c, and span,
b, of each wing were 0.16 and 0.4 m, while the distance between the wing root and the flapping axis was 0.15 m. Numerous combinations of kinematics and wing speed were tested; the flap amplitude was always constant at
, and the flap angle center was always
, so that the flapping motion was symmetric across the horizontal plane passing through the flap axis. The pitch amplitude was set to
,
and
, and the pitch center was varied between
and
. The airspeed,
U, was set to 6, 9.4 and 14.8 m/s, leading to Reynolds numbers between
and
and reduced frequency values,
, between 0.03 and 0.13. The Strouhal number,
, ranged between 0.03 and 0.17, where
is the flapping amplitude at the wingtip.
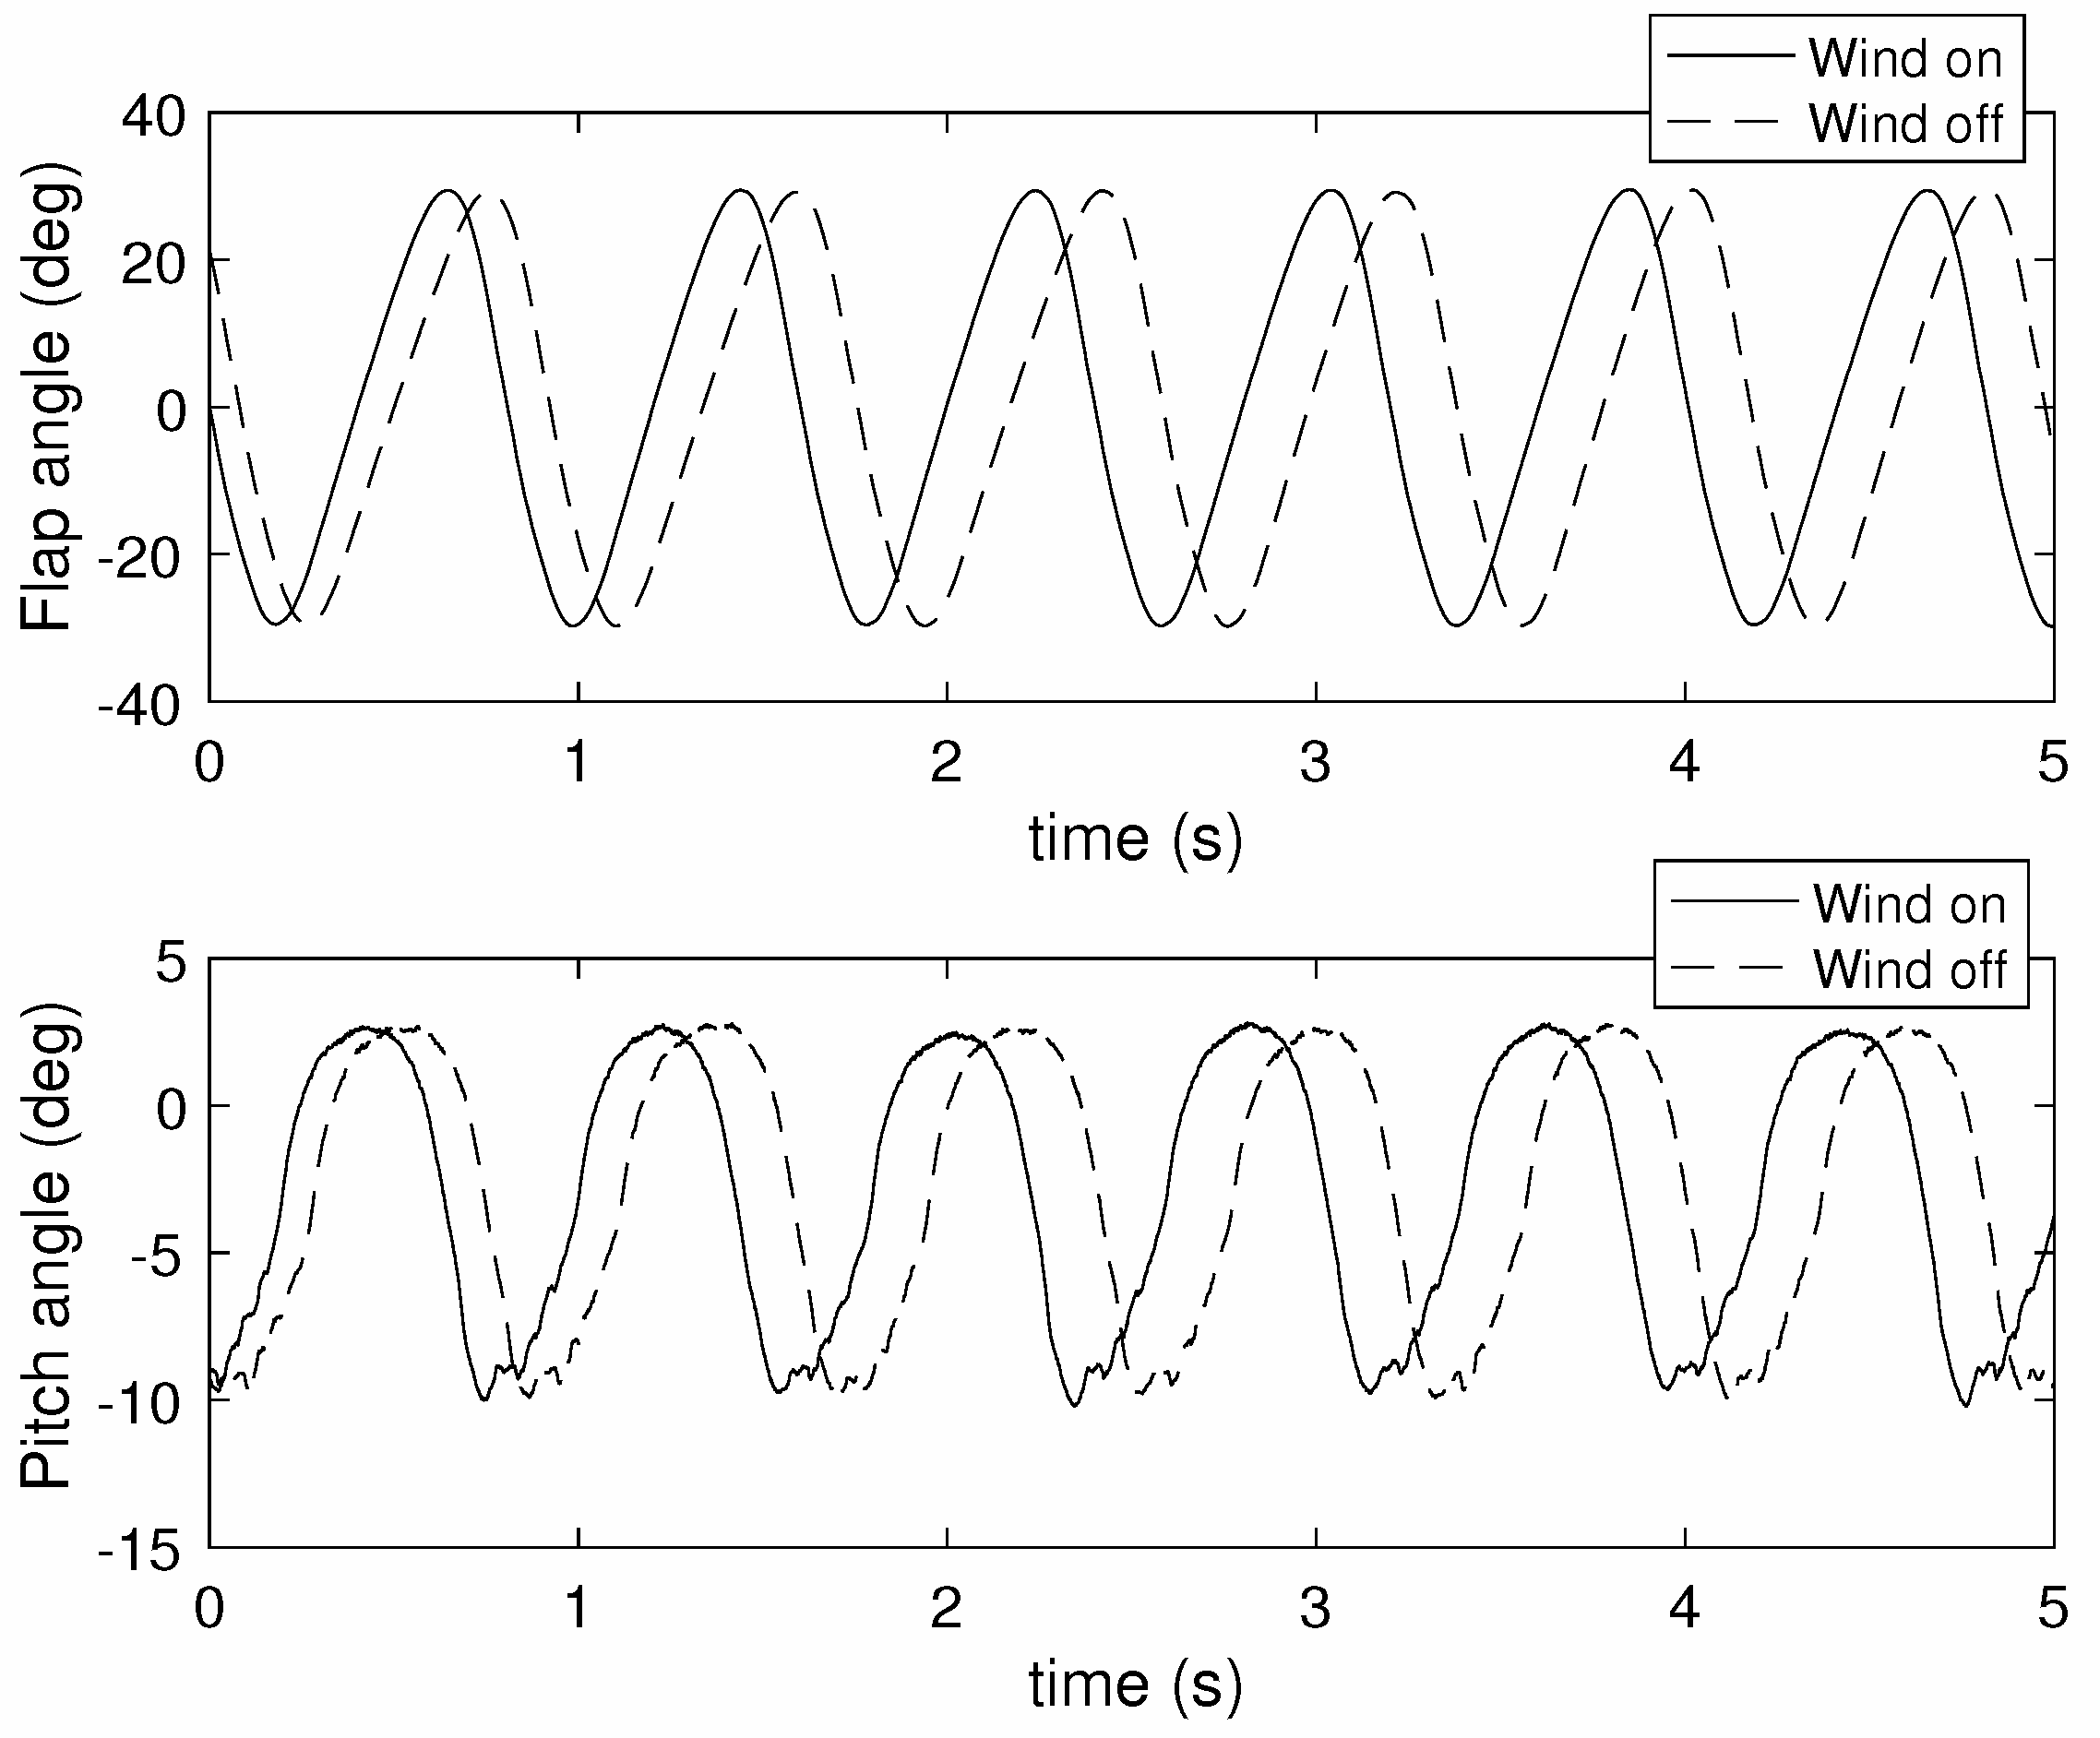
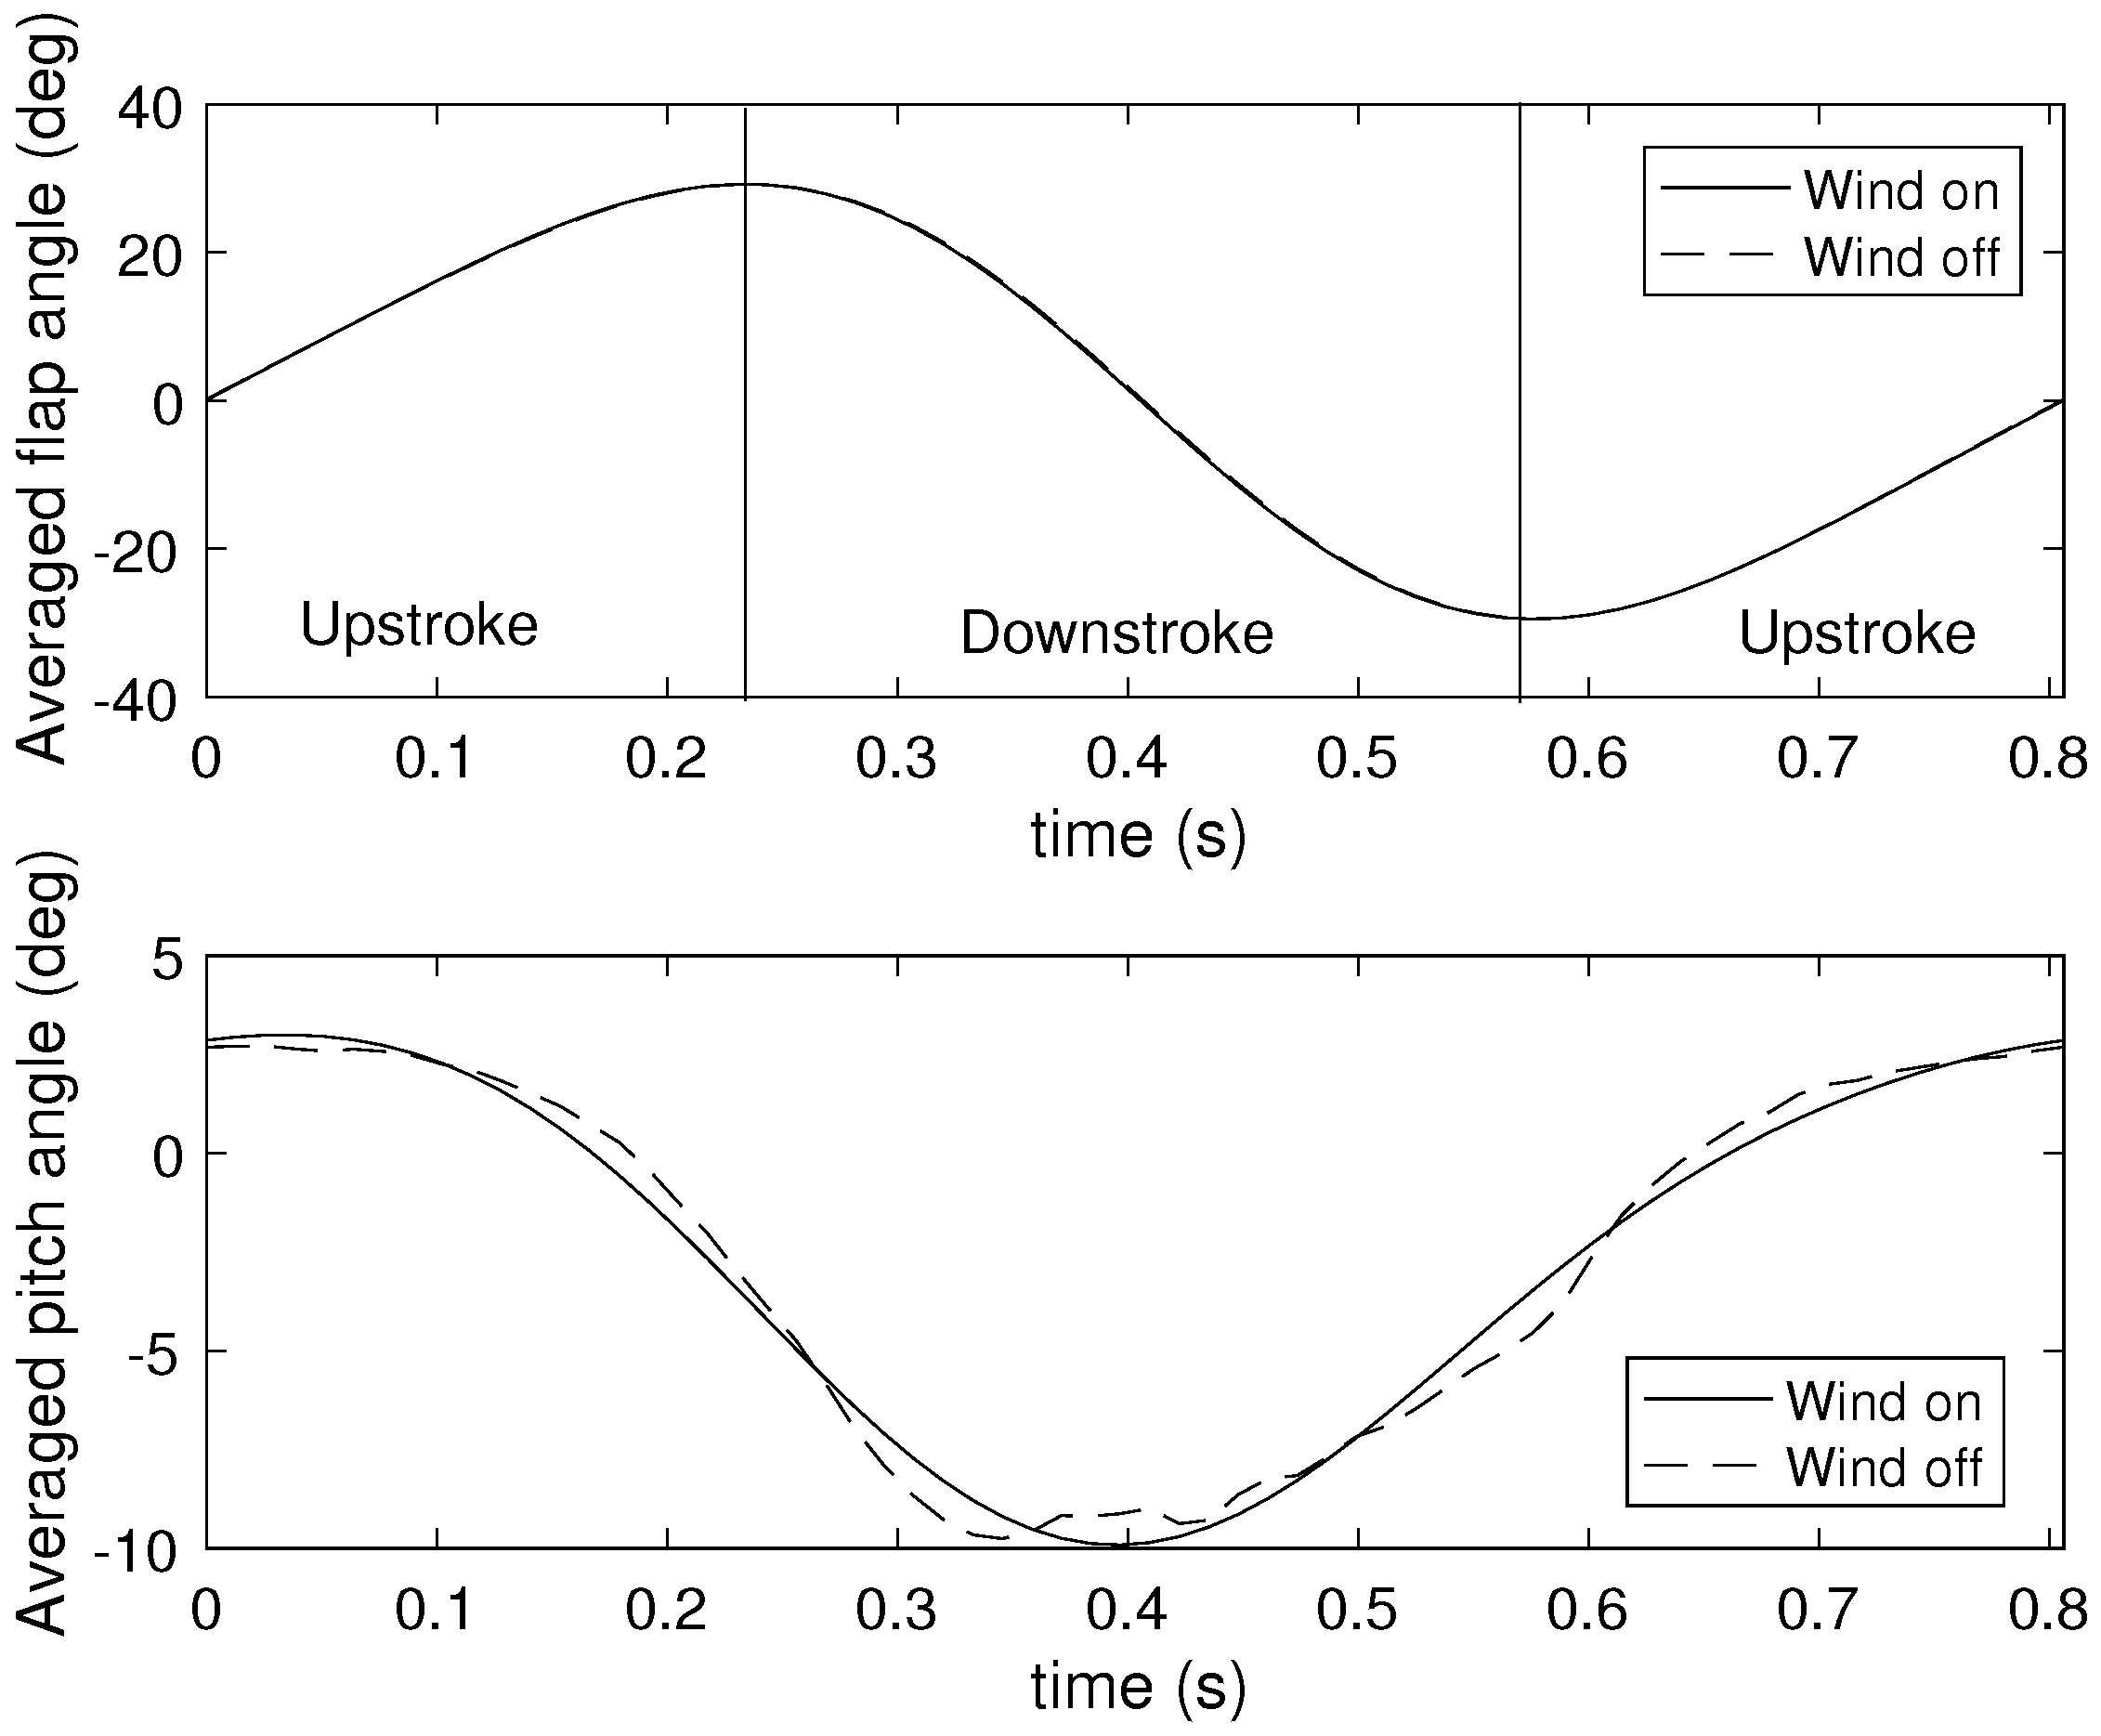
The loads measured by the aerodynamic balance included both aerodynamic and inertial contributions. In order to separate the two, wind-off flapping and pitching tests were carried out for each tested configuration. The force measurements obtained during these tests included only inertial contributions and were to be subtracted from the load values measured during the wind-on tests, which also included aerodynamic loads. The wind-off tests were carried out after replacing the wings with metal bars that had the same inertial characteristics in flap and generated negligible aerodynamic loads. Extension springs were also installed on top of the flapping arms in order to mimic the effect of the lift acting on the wings at wind-on conditions. Despite these precautions, the flap and pitch angle signals at wind-off and wind-on conditions were not identical, as demonstrated in
Figure 4 for a particular test case. All measured signals had to be cycle averaged before subtracting the wind-off loads from the wind-on loads.
The cycle averaging algorithm can be summarized as follows:
Low-pass filter the flap, pitch, lift and drag signals with a cut-off frequency of 3 Hz (twice the highest flapping frequency).
Identify the positive zero crossings of the flap time response and use them to define start times and end times for complete cycles.
Use linear interpolation at each start and end time to determine the exact time when . Resample the time vector at 64 equal intervals between the start and end time of each cycle.
Interpolate linearly the flap, pitch, lift and drag signals at the re-sampled time instances for each cycle.
Calculate the mean and standard deviation values for the flap, pitch, lift and drag signals at each re-sampled time instance over the number of cycles, . Furthermore, calculate the mean period.
The mean values of each signal at the 64 time instances constitute the cycle averaged signal.
Figure 5 shows the result of the cycle-averaging process on the flap and pitch signals of
Figure 4. It can be seen that the wind-on and wind-off flap angle time histories are nearly indistinguishable, but there are visible differences between the two pitch responses. Nevertheless, it was assumed that pitching has a very small effect on the inertial loads compared to flapping, and therefore, the subtraction could be carried out. The cycle averaging procedure was also applied simultaneously to the measured lift and drag signals, leading to mean waveforms and standard deviation estimates. For all test cases, cycle averaging resulted in flap signals with the same phase as the one shown in
Figure 4. The time history begins and ends at the middle of the upstroke, while the middle of downstroke lies near the middle of the time range. All results presented throughout this paper are calculated using the same flap phase.
Finally, the parasite drag due to skin friction and interference from the wing supports was also removed from the drag measurements, since the vortex lattice method cannot model such effects. Static wind-on tests were carried out with the wings set to zero flap and pitch angles, and the measured drag values were subtracted from the drag time histories obtained from the flapping wind-on tests.
3. Vortex Lattice Model
The Vortex Lattice model employed for this work is similar to the one used by Dimitriadis et al. [
20] with one major difference: the drag is calculated using both the Katz and Joukowski approaches, as discussed by Simpson et al. [
34] and Lambert and Dimitriadis [
35]. The VLM method is described in detail in several authoritative publications [
29,
36]. It consists of solving the Laplace equations for a wing undergoing a general motion using vortex rings as the elementary solution. The rings are placed on the quarter chord of geometric panels on the wing’s camber surface (bound vortex rings), as well as in the wake (wake vortex rings). Vortex rings are also placed in the wake in order to simulate the free vortex sheet. The Kutta condition that the flow separates smoothly from the trailing edge is enforced by shedding the vorticity of the bound trailing edge panels into the wake at each time step. A leading edge wake can also be shed from the bound leading edge panels in order to model leading edge flow separation [
23]. This option was chosen by Roccia et al. [
26], but flow separation will be represented here by means of the Leishman–Beddoes model; hence, VLM simulations are carried out with a single wake shed from the trailing edge.
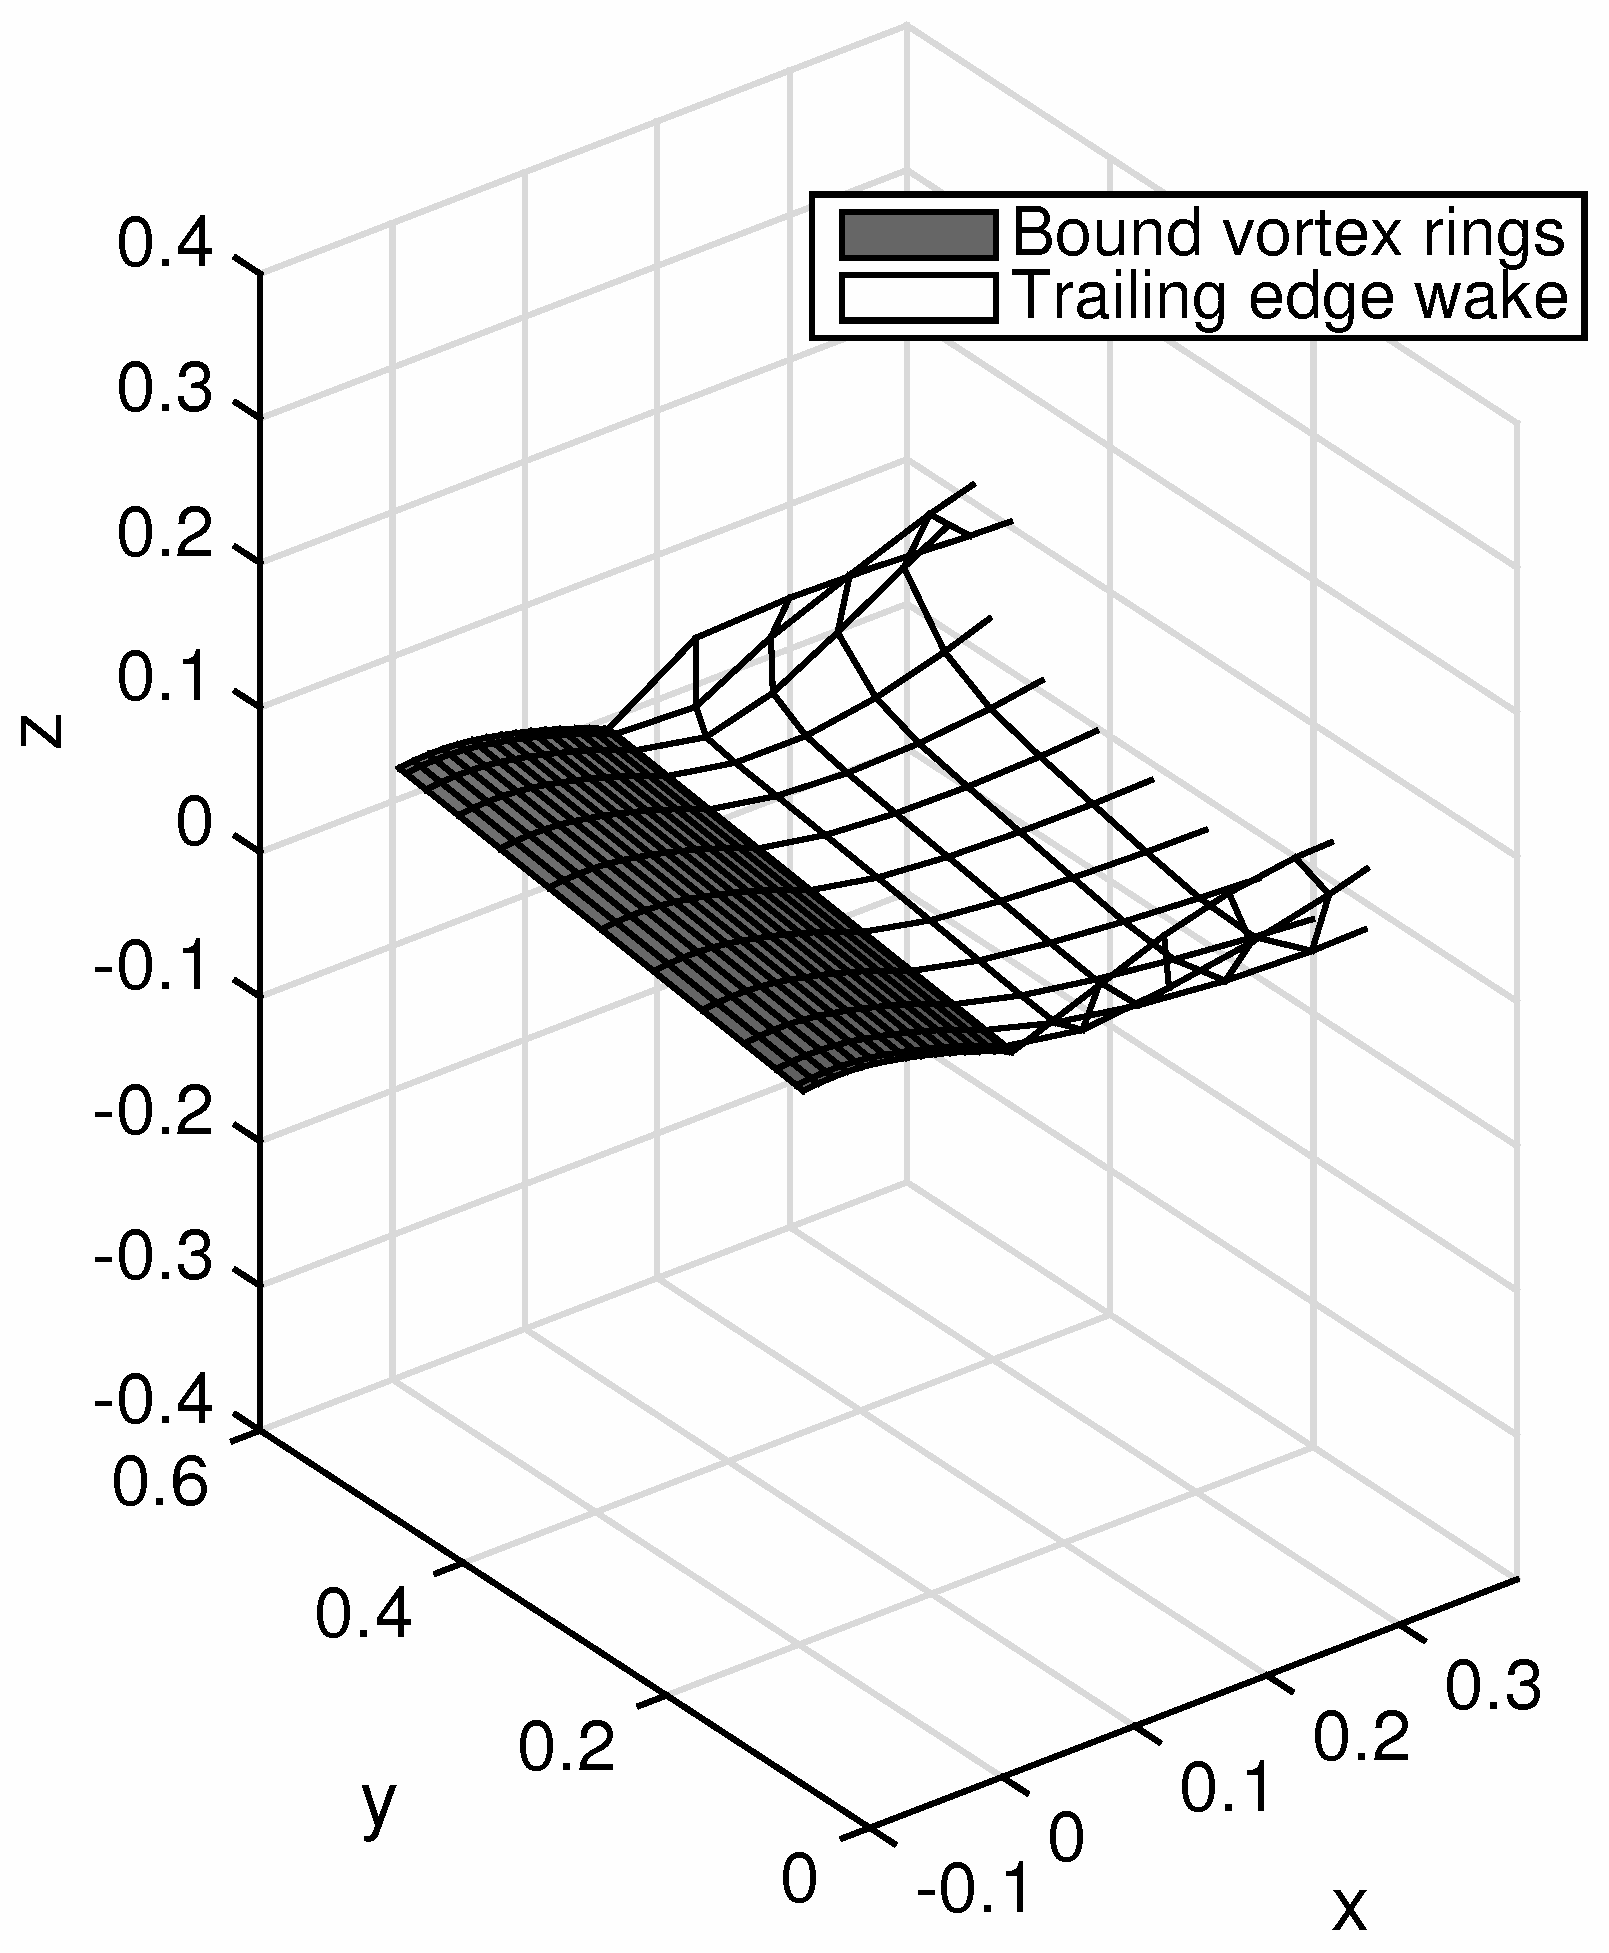
The two vorticity surfaces (bound and trailing edge wake) are exemplified in
Figure 6. Note that
x,
y and
z are global coordinates, but
x is aligned with the chord and
y aligned with the span when
. Once a vortex ring is shed into the wake, it is allowed to travel at the local flow velocity, so that the wake is force-free.
According to the vortex model by Vatistas et al. [
37], the velocity induced at a general field point by a straight line vortex segment, whose ends with respect to the field point are given by vectors
and
and whose strength is
, is given by:
where
K is defined as
if the vortex segment belongs to a bound vortex ring and:
if the segment belongs to a wake vortex ring. In this latest expression:
where
is the kinematic viscosity of air,
,
,
,
[
38] and
is the time elapsed since the vortex segment was shed into the wake.
The impermeability boundary condition is imposed by calculating the velocities induced by all of the vortex rings normal to the control points of the geometric panels of the wing from Equation (
1) and setting the total normal velocity to zero. The boundary condition becomes:
where
and
are vectors containing the vortex strengths of the bound and trailing edge wake vortex rings, respectively,
,
are the aerodynamic influence coefficient matrices and
,
are the components of the external velocity normal to the wing panels induced by the motion and the wake, respectively. The external velocity includes contributions due to the free stream, the flapping motion and the pitching motion. As the wing is rigid, the
influence coefficient matrix is constant in time. In contrast,
is time-varying as the wake deforms.
Equation (
3) is solved for the unknown strengths of the bound vortices,
, at each time instance. The wake vortex strengths
are known since they were shed from bound vortex rings at previous time steps. At the start of the calculation, there is no wake, and
. The wake develops at the rate of one row of vortex rings per time instance, so that the start of the motion is impulsive and gives rise to a starting vortex. This means that the first flapping cycle is not representative of the fully-developed flapping flow, and at least two cycles must be simulated.
Once the strengths of the bound vortex rings have been calculated, the forces acting on the wing can be calculated using either the Joukowski approach or the Katz technique [
34,
35]. For the former, the force generated by the
-th vortex ring is given by:
where
i is the chordwise panel index,
j is the spanwise panel index and
is the steady contribution of the
m-th vortex segment of the ring, given by:
Here,
is the local flow velocity evaluated at the center of the segment;
is the vortex segment vector; and
its vortex strength. The latter is generally equal to
for all vortex segments of each vortex ring except for the trailing edge spanwise segments (i.e., the bound segments that are in contact with the wake segments), where
. Finally,
in Equation (
4) is the unsteady force contribution of the
-th vortex ring, given by:
where
is the area of the corresponding wing panel and
a unit vector normal to the panel. The derivative
is calculated using a first order backwards difference formula.
The Katz approximation requires the calculation of three different velocities on the -th panel:
the velocity due to the wing’s motion ,
the velocity induced by the vorticity in the wake and
the velocity induced by only the bound chordwise vortex segments,
Then, the lift acting on the
-th panel is given by:
where
,
are chordwise and spanwise unit vectors tangential to the panel while
and
are the chordwise and spanwise lengths of the panel. The panel’s angle of attack due to the shape and motion of the wing is
. The drag acting on the panel is given by:
where:
and
is an orthogonal projection of the normal to the panel in the direction of the flow. The total aerodynamic force induced by the
-th panel is then given by:
Note that, for the Katz method, is always perpendicular to the local airspeed due to the motion of the wing while is always parallel to it. Consider a static, symmetric and rectangular wing at an angle of attack to a horizontal free stream. The contribution to the total drag will be zero for any value of , as the lift is always perpendicular to the free stream. The contribution to the total drag will always be positive due to the downwash effect, except if or . This situation also holds for the flapping case; thrust is produced only by the contribution when the lift vector leans forward (Knoller–Betz effect). Thrust is particularly strong in the outboard part of the wing, which can see very high kinematic angles of attack during the downstroke. Nevertheless, the force component will still only produce drag. Furthermore, note that the local lift goes to zero at the wingtip; therefore, the part of the wing with the highest kinematic angle of attack during the downstroke does not contribute the thrust.
The load estimates of Equations (
4) and (
7) should be similar, but not identical, which is why both sets of estimates will be presented in the Results sections. The advantage of the Joukowski method is simplicity and ease of implementation. The advantage of the Katz method is speed, as it requires flow velocity evaluations only on the control points of the wing panels, not on the mid-points of every bound vortex segment.
4. Estimation of Separated Flow Aerodynamic Loads Using the Leishman–Beddoes Model
An alternative to the Katz and Joukowski aerodynamic load estimation techniques is to use the 2D unsteady drag model presented by Leishman [
39]. For a 2D airfoil oscillating in pitch in an airflow, the unsteady drag coefficient can be written as:
where
is the instantaneous pitch angle,
the normal force coefficient and
the chordwise force coefficient. The latter is also known as leading edge suction, as it contributes thrust. For attached flow, the chordwise force coefficient can be estimated from:
where
is an unsteady effective angle of attack and the lift curve slope is assumed to be equal to
. The factor
usually takes values between 0.95 and 0.97 and represents the fact that airfoils in viscous flows cannot attain the full amount of leading edge suction. Leishman and Crouse [
40] select the effective angle of attack as:
where
is the unsteady normal force coefficient caused by circulatory contributions only.
In the context of a VLM simulation, the unsteady normal force coefficient can be calculated from either the Katz or Joukowski methods. For example, from Equation (
5) and for the
j-th spanwise section:
This force can be used to obtain an estimate of the local unsteady angle of attack
:
This expression is an overestimation, as contains both circulatory and non-circulatory contributions. This point will be discussed later on.
The Leishman–Beddoes model can also be used to estimate the amount of local flow separation and the ensuing changes to the aerodynamic loads. The chordwise position of the separation point,
, can be estimated from Kirchoff theory. For the
j-th spanwise section, the separation point lies at:
where
is the value of the static angle of attack when
, i.e., the separation point lies at
and
,
are constants to be determined for each airfoil and the Reynolds number. Furthermore,
, where
is the normal coefficient offset required to make the airfoil’s lift curve symmetrical (see the next paragraph). Consequently, the normal and chordwise force coefficients at the
j-th spanwise station are given by:
Finally, the total lift and drag can be approximated from:
The aerodynamic load coefficients of Equations (
12) and (
13) were calculated at each time instance using the current estimate of
. The values of
,
,
and
were obtained from the experimental measurements at low Reynolds numbers presented by Durgesh et al. [
41].
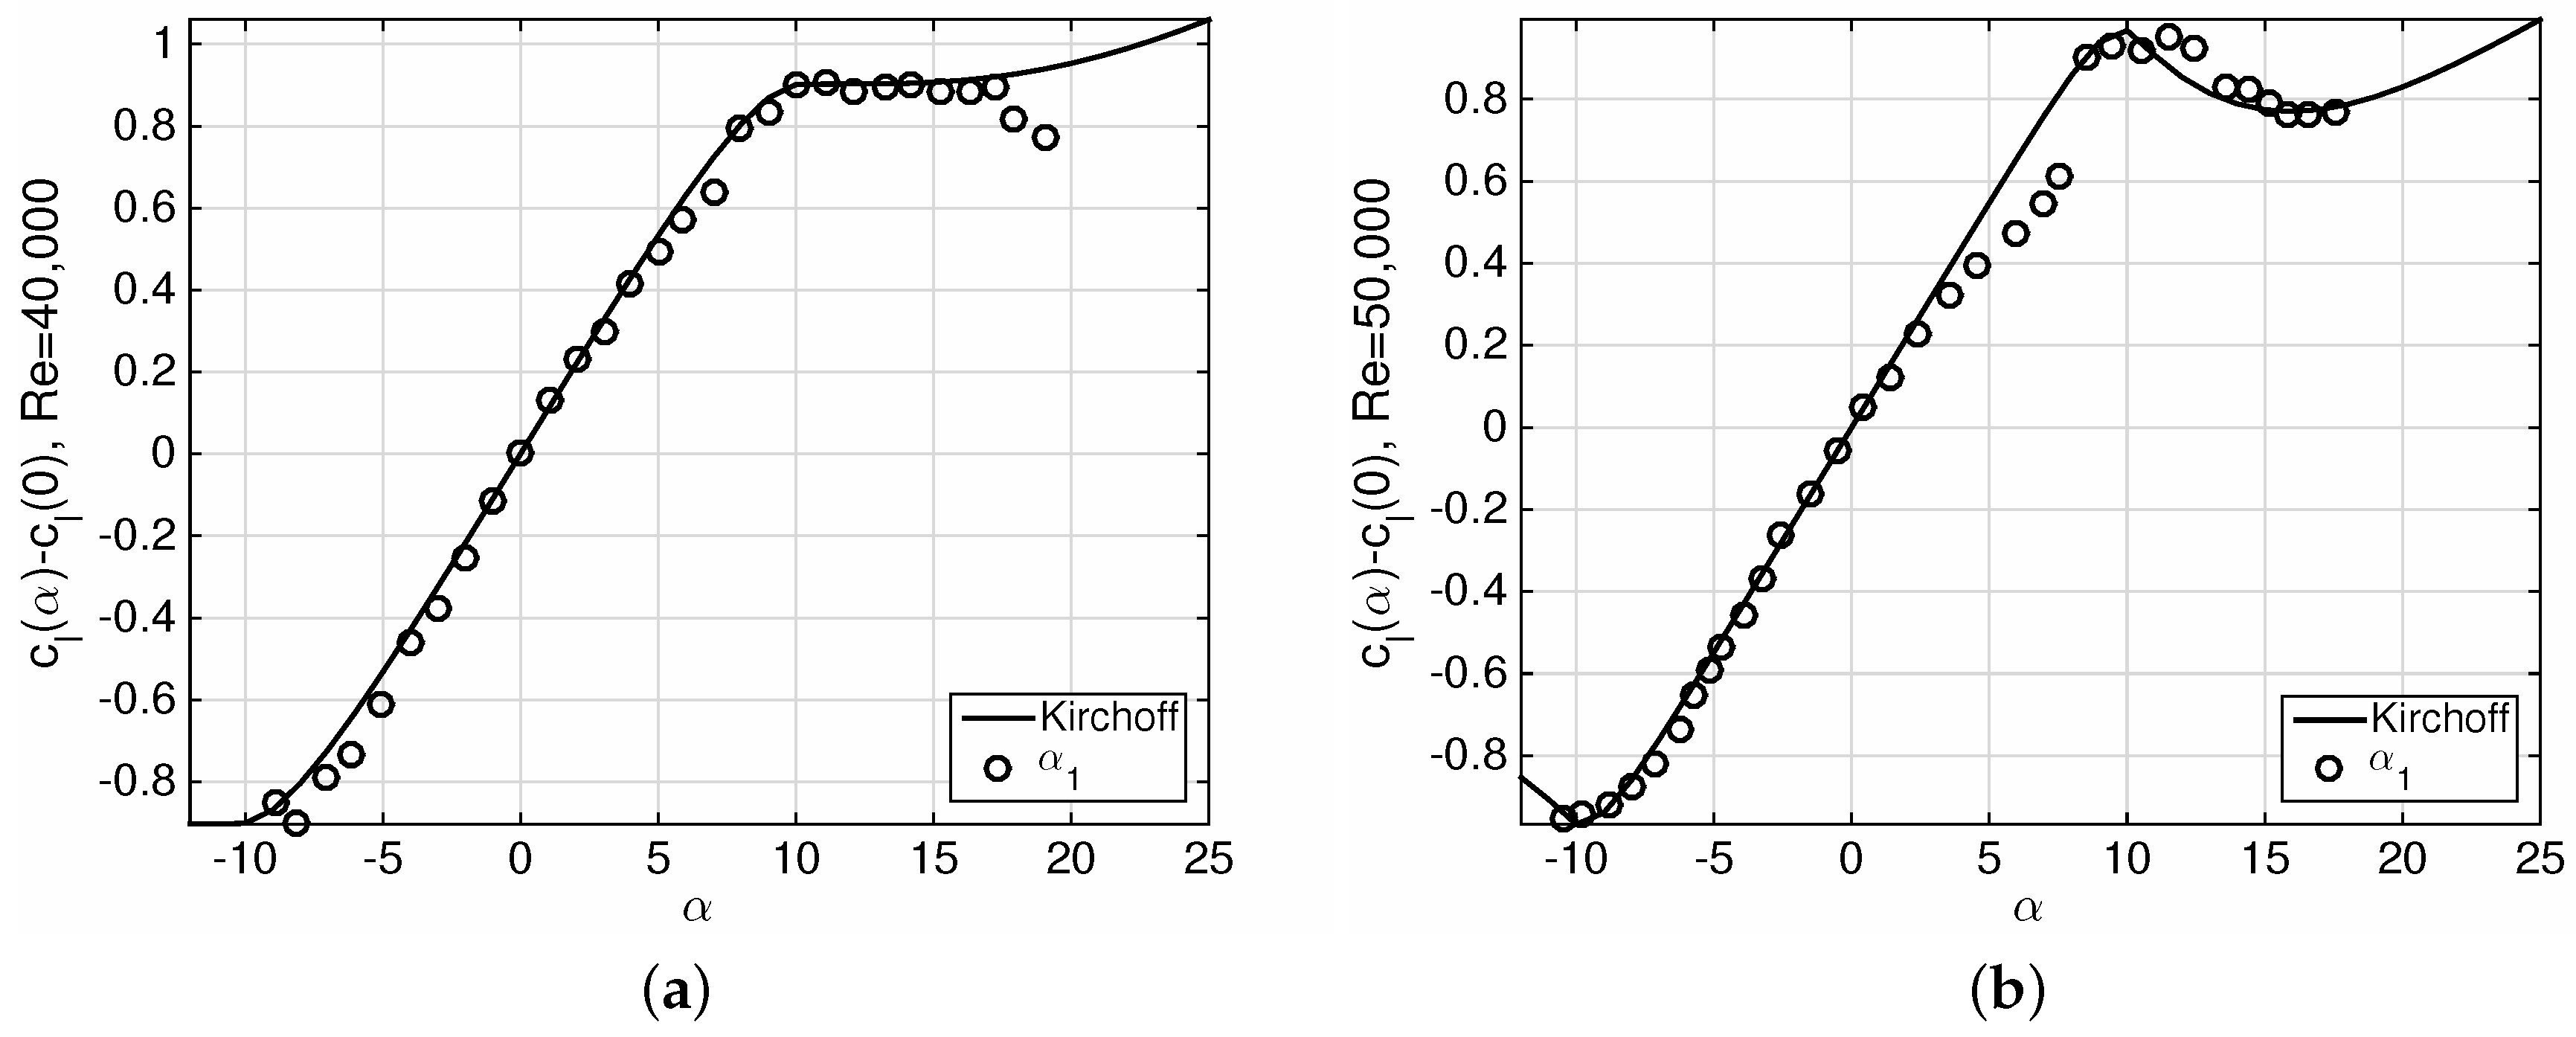
Figure 7 plots the results of the Kirchoff theory curve fits, compared to the experimental data. Note that there is a discontinuity in the experimental lift curve at
that cannot be represented by the Kirchoff exponential functions. The minimum Reynolds number tested in flapping was 66,000, so that the curve fit of
Figure 7b was used for setting the Kirchoff model’s parameters, leading to
,
,
and
.
In the complete Leishman–Beddoes model, both and are delayed by time lags and , respectively, before calculating the normal and chordwise load coefficients. The time lags represent the stall delay phenomenon and are estimated from dynamic experiments on the airfoil section undergoing sinusoidal pitching; such experiments were not carried out as part of the present work, and values for and were not found in the literature for the NACA 6409 at the Reynolds number range of interest. Furthermore, the Reynolds numbers and reduced frequencies of the experiments were quite low, suggesting that stall delay may not be very important. Consequently, the time delays were not applied in this work. The Leishman–Beddoes-based technique presented here also neglects the modeling of the Dynamic Stall Vortex (DSV).
As mentioned earlier, Equation (
9) is an overestimation, since the Katz approach does not differentiate between circulatory and non-circulatory aerodynamic loads. A simple and approximate solution to this problem is adopted in the present work. Equation (
10) is re-written as:
and the correction factor in both Equations (
11) and (
14) is set to
. This modification implies that around 20% of the inviscid aerodynamic normal force over the entire span is non-circulatory in origin. This statement is justified only because the reduced frequencies investigated in the present work are low. The value of 0.75 was set by trail-and-error and is constant over the entire span.
5. Pitch Leading
The pitch leading test cases were simulated using only the Katz and Joukowski load estimation techniques, without any stall modeling. The kinematic angle of attack for these cases is always low throughout the wing, and therefore, no visible flow separation is occurring. For each test case, the cycle averaged experimental flap and pitch angle time histories were used as kinematic input to the VLM. This means that each flapping cycle always started and finished at mid-upstroke. The experimental signals were re-sampled at the simulation time step and repeated in order to simulate two full cycles.
The simulations were carried out with
chordwise panels and
spanwise panels. The spacing of the panels was sinusoidal in the spanwise direction so that the grid was denser near the wingtips. The time step was set to
, and each simulation was run for two full flapping cycles. Both the Katz and Joukowski estimates of the drag were calculated for all cases. The chosen values of
m,
n and
led to converged aerodynamic load estimates, and refining the spatial and temporal grids produced negligible changes in the predicted lift and drag.
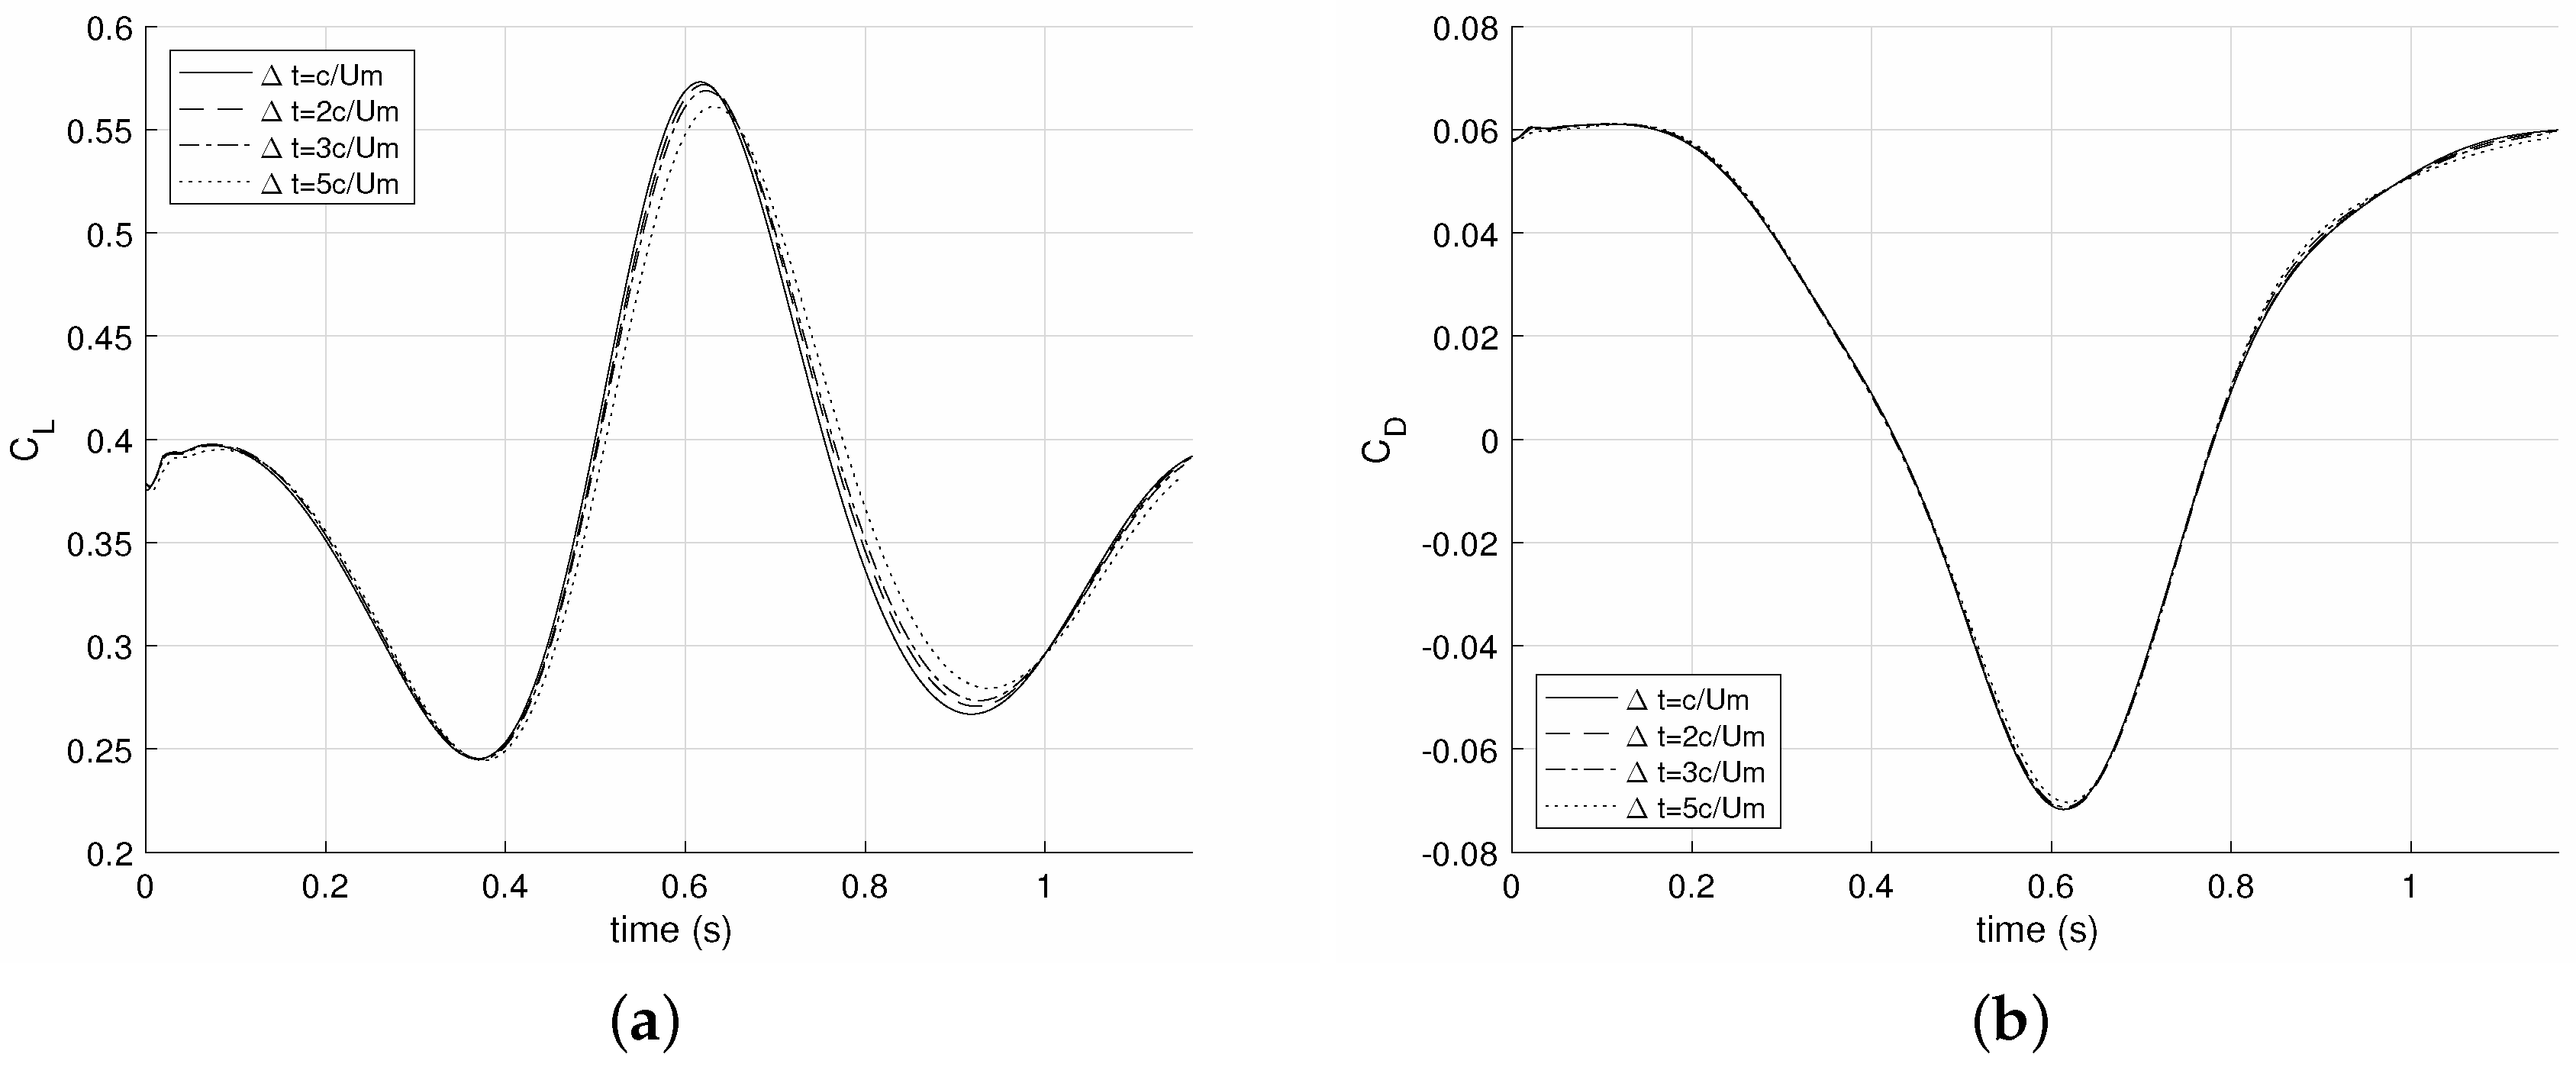
Figure 8 demonstrates the convergence of the aerodynamic loads predicted by the Katz method with a decreasing time step from
to
. It can be seen that the time step value has nearly negligible effect on the drag. Its effect on the lift time history is visible, but the signals obtained for
and
are very similar. Therefore, it was decided to use
in order to speed up the calculations. The same time step was appropriate for other kinematic test cases and load estimation methods.
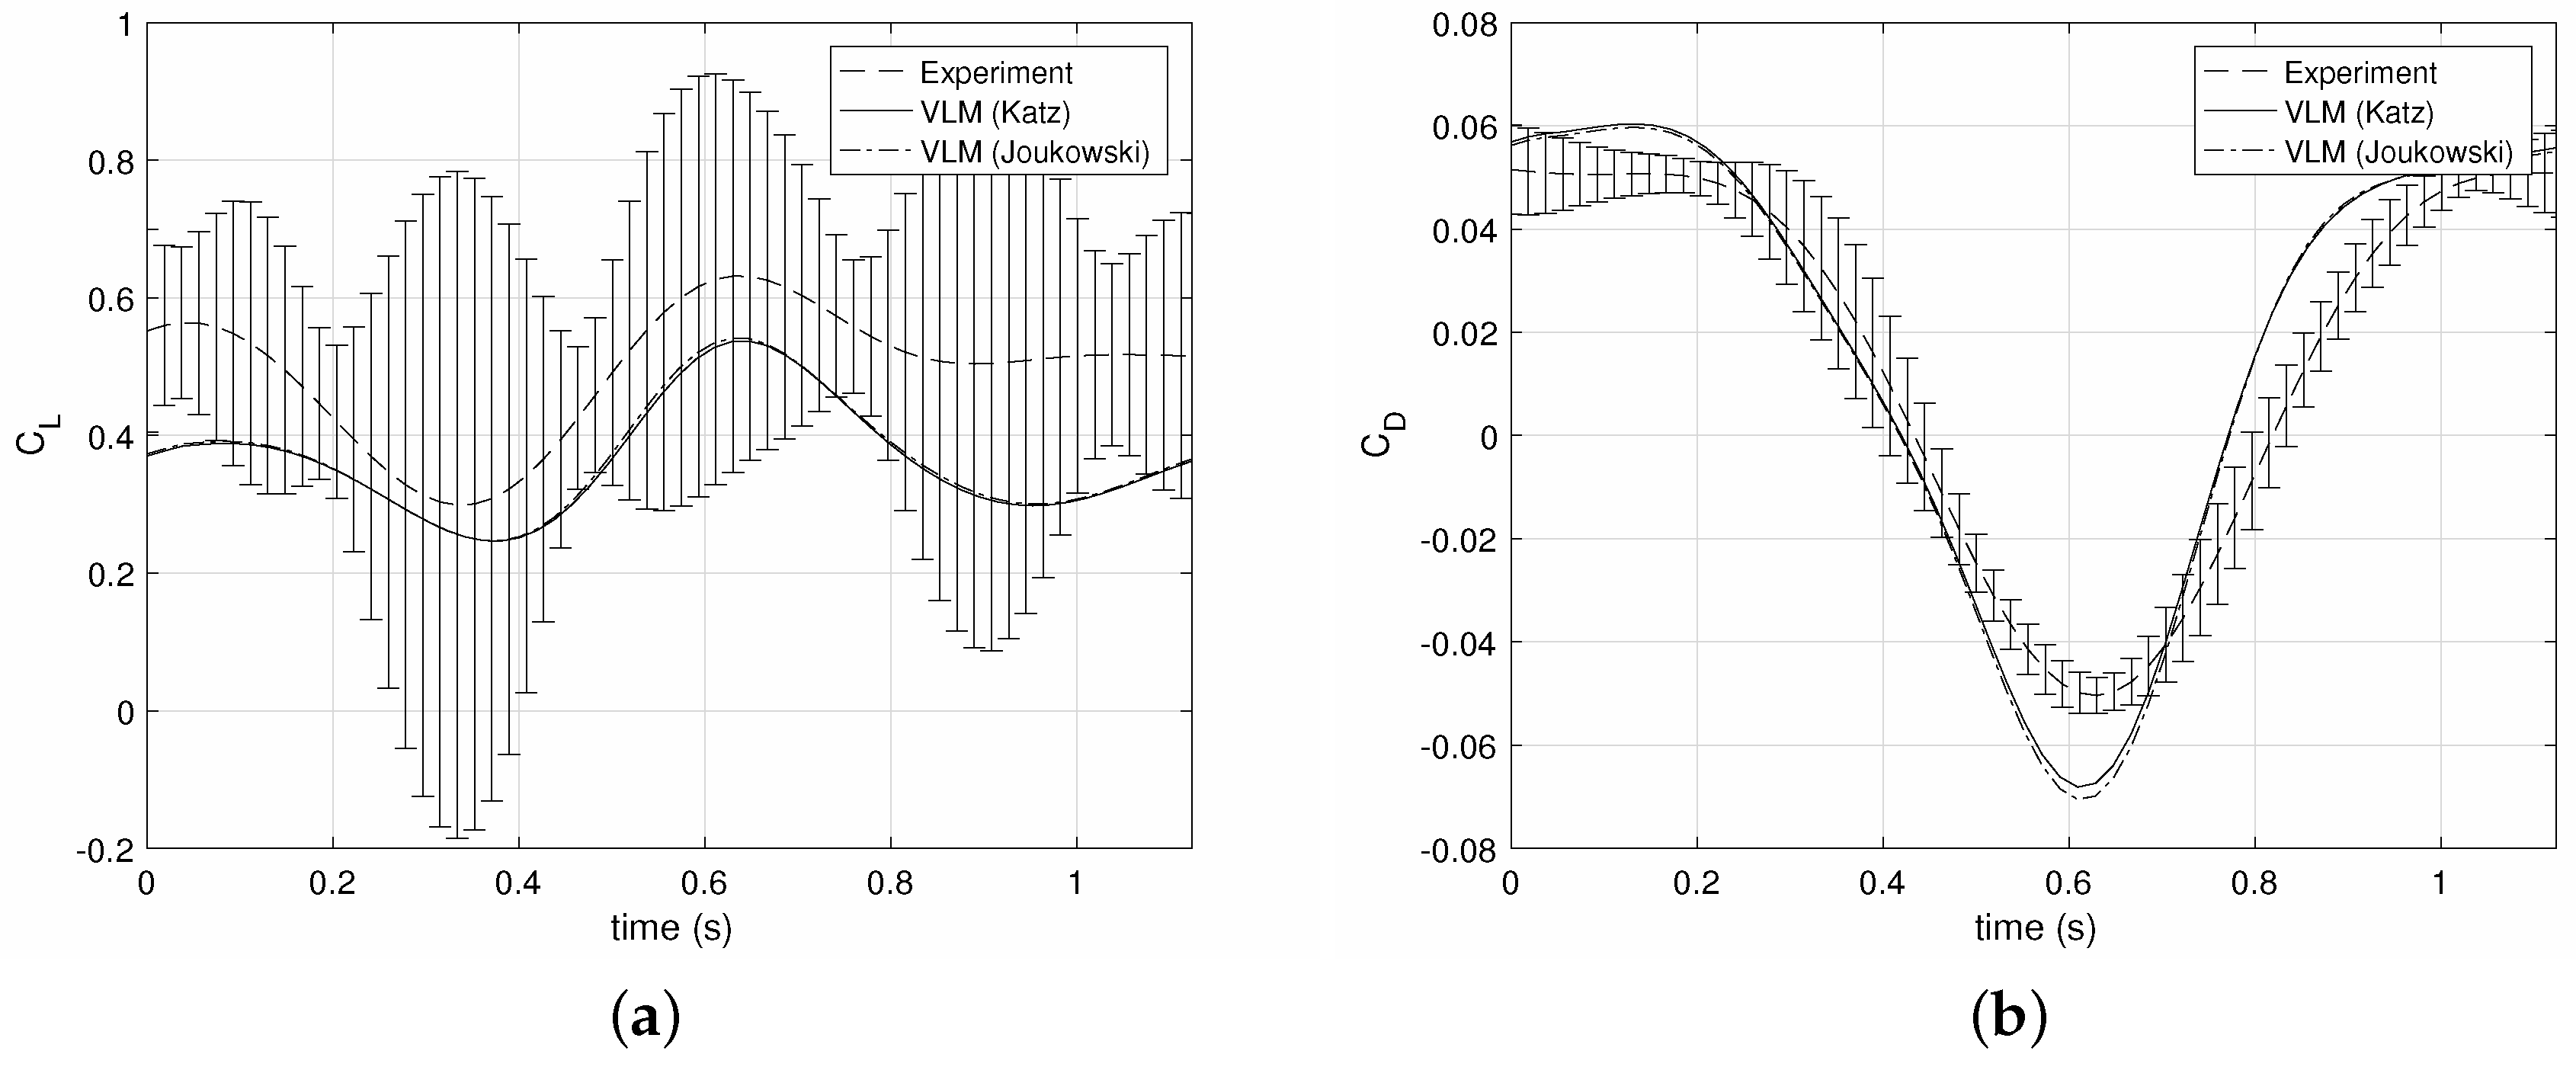
The agreement between the experimental and simulated lift and drag coefficients was generally good for most test cases.
Figure 9 plots the lift and drag coefficients for the test case
m/s,
Hz and a pitch oscillation between
and
. The reduced frequency is
, and the experimental results are plotted with error bars that represent the standard deviation of the cycle averaging procedure. Note that the error bars of the lift coefficient are much higher than those of the drag; pitch leading oscillations at this low airspeed produce small amounts of lift, such that the difference between aerodynamic and inertial loads is quite low. The inertial loads act mainly in the lift direction and have a limited effect on the drag, whose standard deviation is much lower than that of the lift.
Figure 9a shows that the VLM predictions for the lift obtained by the Katz and Joukowski methods are very similar. They are both lower than the cycle averaged experimental lift signal, but lie nearly always within the error bars. The phases of the simulated and experimental lift coefficients are nearly identical.
Figure 9b plots the predicted and experimental drag coefficients. The estimates obtained by the Katz and Joukowski techniques lie very close to each other, except at the very start and end of the cycle. Note that the drag is negative through part of the cycle, i.e., the wing is producing thrust. The maximum thrust is slightly overestimated by the VLM approach, but the experimental and simulated waveforms are actually very similar.
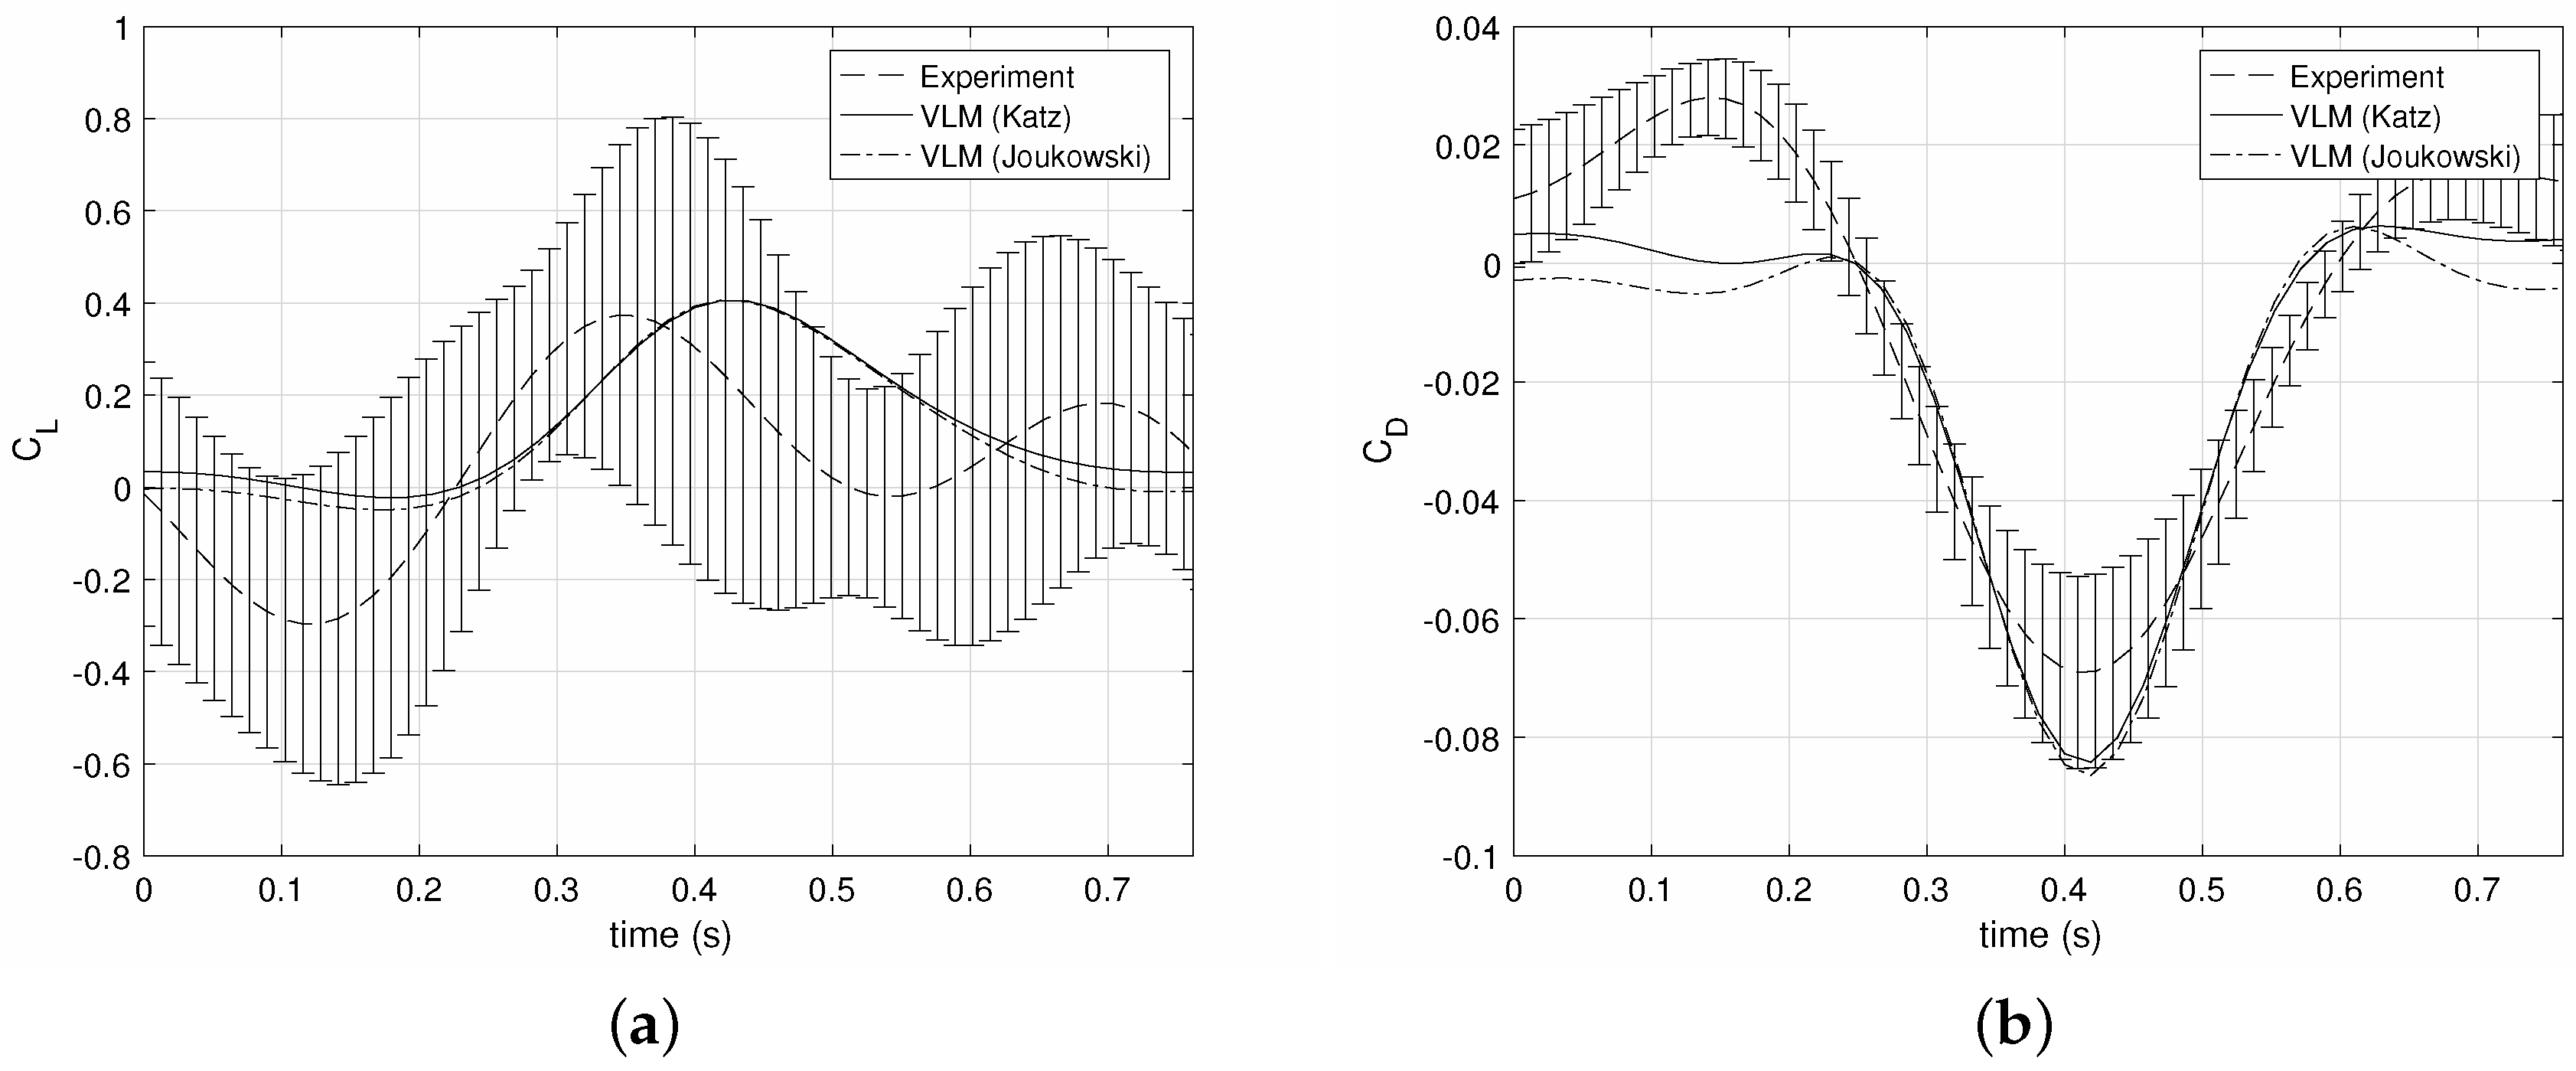
Figure 10 plots the lift and drag coefficients for another test case, defined by
m/s,
f = 1.23 Hz and a pitch oscillation between
and
, with
. In this case, there is a noticeable phase delay between the simulated and experimental lift signals. Furthermore, the maximum lift coefficient is predicted accurately by the VLM, but not the minimum, which is in fact a downforce in the experimental results. Nevertheless, the simulated waveforms lie within the error bars and are therefore considered reasonable predictions. Once more, the Katz and Joukowski method estimates are quite similar. The simulated drag waveform lies again lower than the experimental average, but still within the error bars. The simulation misses the positive drag peak occurring at the end of the upstroke, but provides a satisfactory prediction of the thrust.
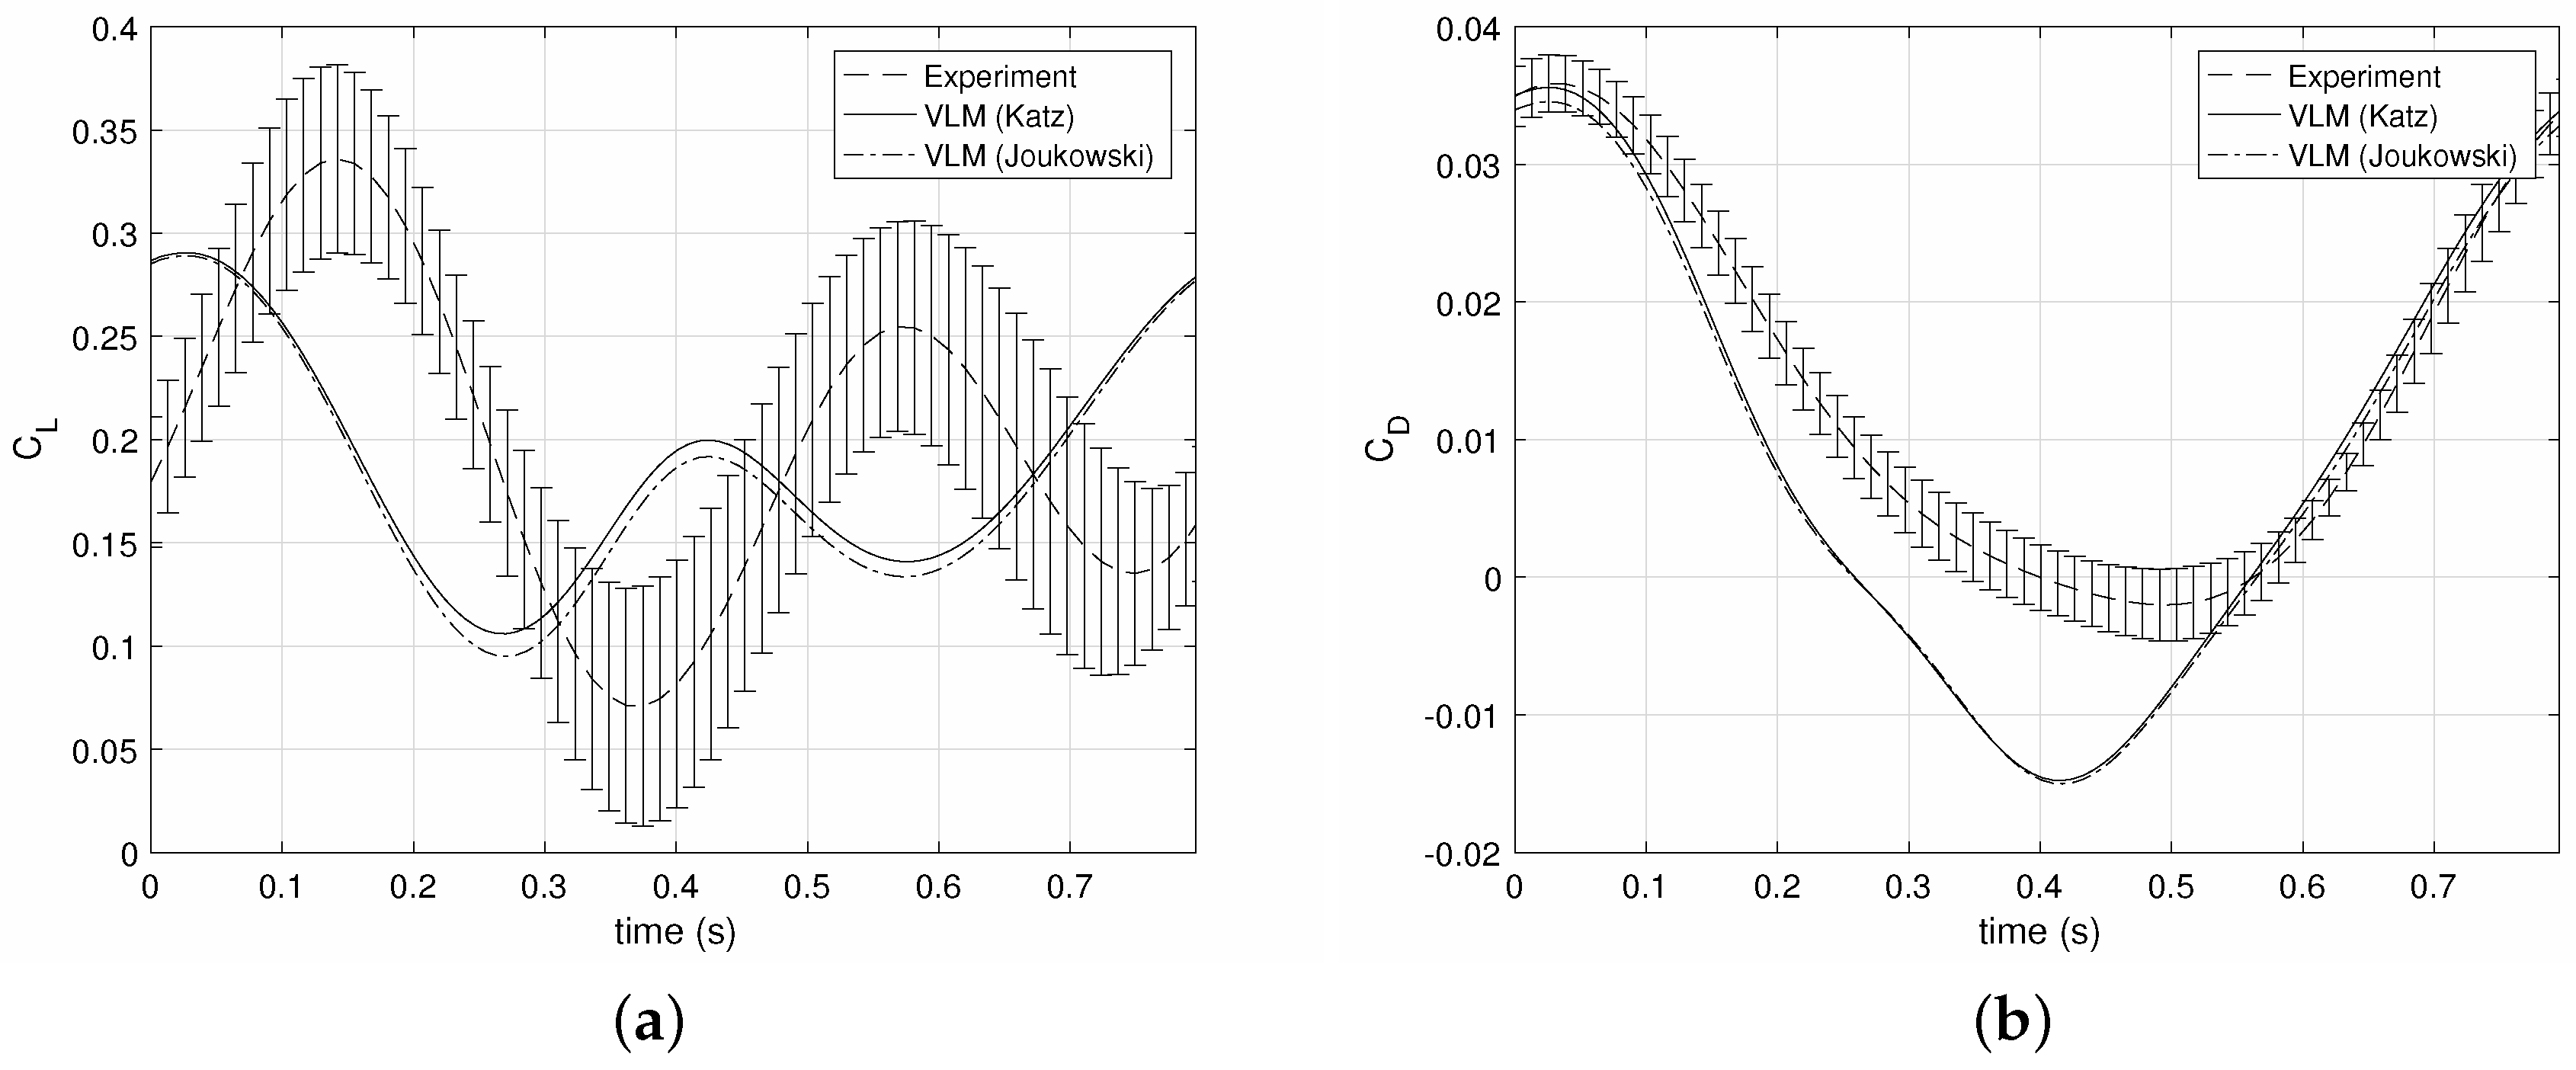
Finally,
Figure 11 plots the lift and drag coefficients for the test case
m/s,
Hz and a pitch oscillation between
and
, so that the reduced frequency is
. The mean of the predicted lift signal is accurate, but the amplitude is slightly lower than the experimental amplitude; and there is also a noticeable phase delay. Note that at this airspeed, the aerodynamic loads become significant, and the standard deviation of the cycle averaging procedure is smaller. The simulated lift would still lie inside the error bars if it were not for the phase shift. The VLM drag predictions again overestimate the thrust; in the experiment, very little thrust is produced. During the upstroke, the simulated drag signals are quite similar to the experimental measurements.
The results presented in this section show that the predictions obtained by the VLM simulations are acceptable for pitch leading test cases. The overestimation of the thrust is expected, as the VLM does not model airfoil thickness or viscous effects. The phase shift between the simulated and experimental lift signals may be due to the cycle averaging procedure; the cycle averaged pitch signal may not have the correct phase, resulting in a phase delay of the predicted lift coefficient. In fact, the lift coefficient is quite sensitive to the pitch phase; the drag predictions are less sensitive to pitch phase, although still affected by it.
6. Pure Flapping
The pure flapping tests were run for different constant pitch angle values,
. They involved higher kinematic angles of attack than the pitch leading cases, and therefore, the results from the Leishman–Beddoes approach of Equations (
12) and (
13) will also be presented in this section.
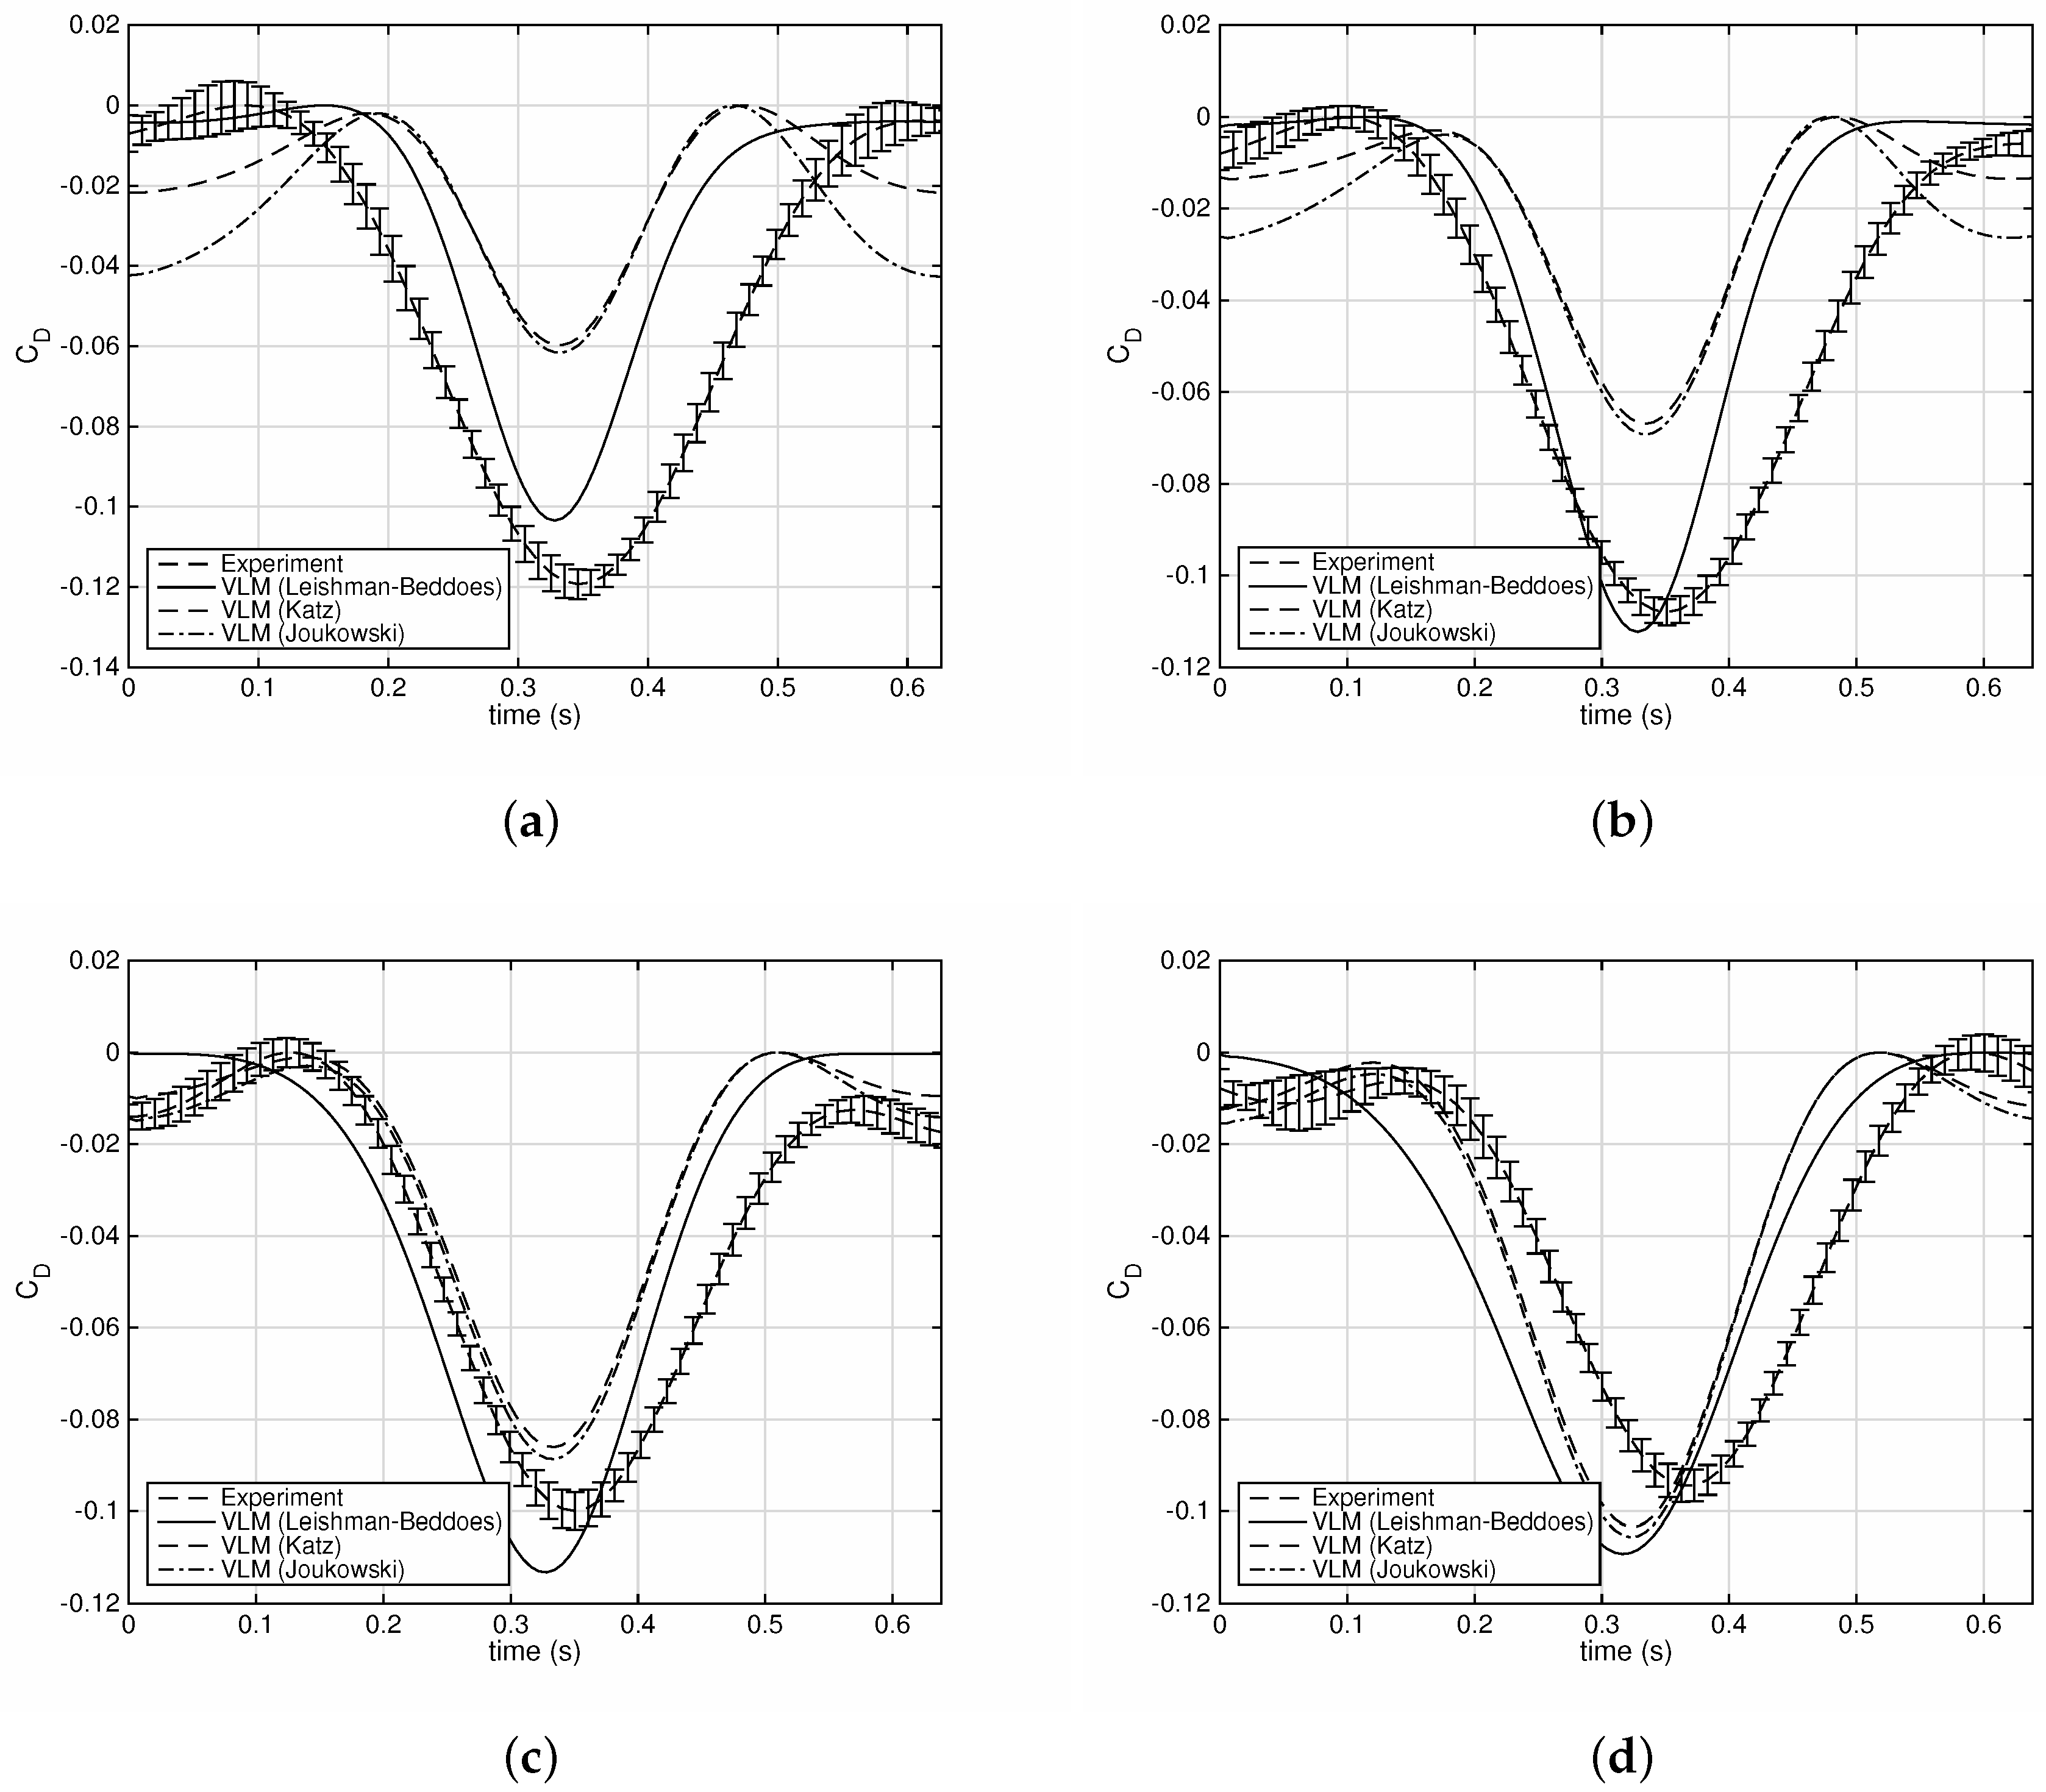
Throughout the flapping tests, it was observed that the Katz and Joukowski approaches systematically underpredict the drag amplitude when
.
Figure 12 plots the experimental and simulated drag coefficients for the case
m/s,
Hz and for four different values of
. In all of these plots, each of the drag time histories were centered around
at the upstroke by subtracting from each signal its maximum value. In this way, only differences in amplitude are assessed.
For and , the Katz and Joukowski drag predictions clearly have a much lower amplitude than the experimental measurements. The Leishman–Beddoes drag estimates are significantly better for these cases. In contrast, for the and , all three techniques give acceptable solutions. In fact, the Leishman–Beddoes approach overestimates the thrust by a small amount for these cases.
It is not clear why negative pitch angles cause this problem with the Katz and Joukowski drag estimate. The reason might be stall, as flow visualization showed that extensive flow separation can take place even at midspan during pure flapping test cases [
14]. Nevertheless, the Leishman–Beddoes technique does not identify any significant flow separation. In the example of
Figure 12a, the kinematic angle of attack at the tip oscillates between
and
, but the effective angle of attack,
, only varies between
and
, so that the furthest upstream instantaneous position of the separation point lies at
. The effective angle of attack is much smaller than the kinematic one because of the effect of the downwash, which decreases significantly the normal force over the outboard part of the wing.
7. Pitch Lagging
In pitch lagging motion, the pitch angle lags the flap, and therefore, massive flow separation can occur. The first test case to be considered is defined by
m/s,
Hz and a pitch oscillation between
and
. The reduced frequency is
, and the Strouhal number
, while the kinematic angle of attack at the wingtip oscillates between
and
.
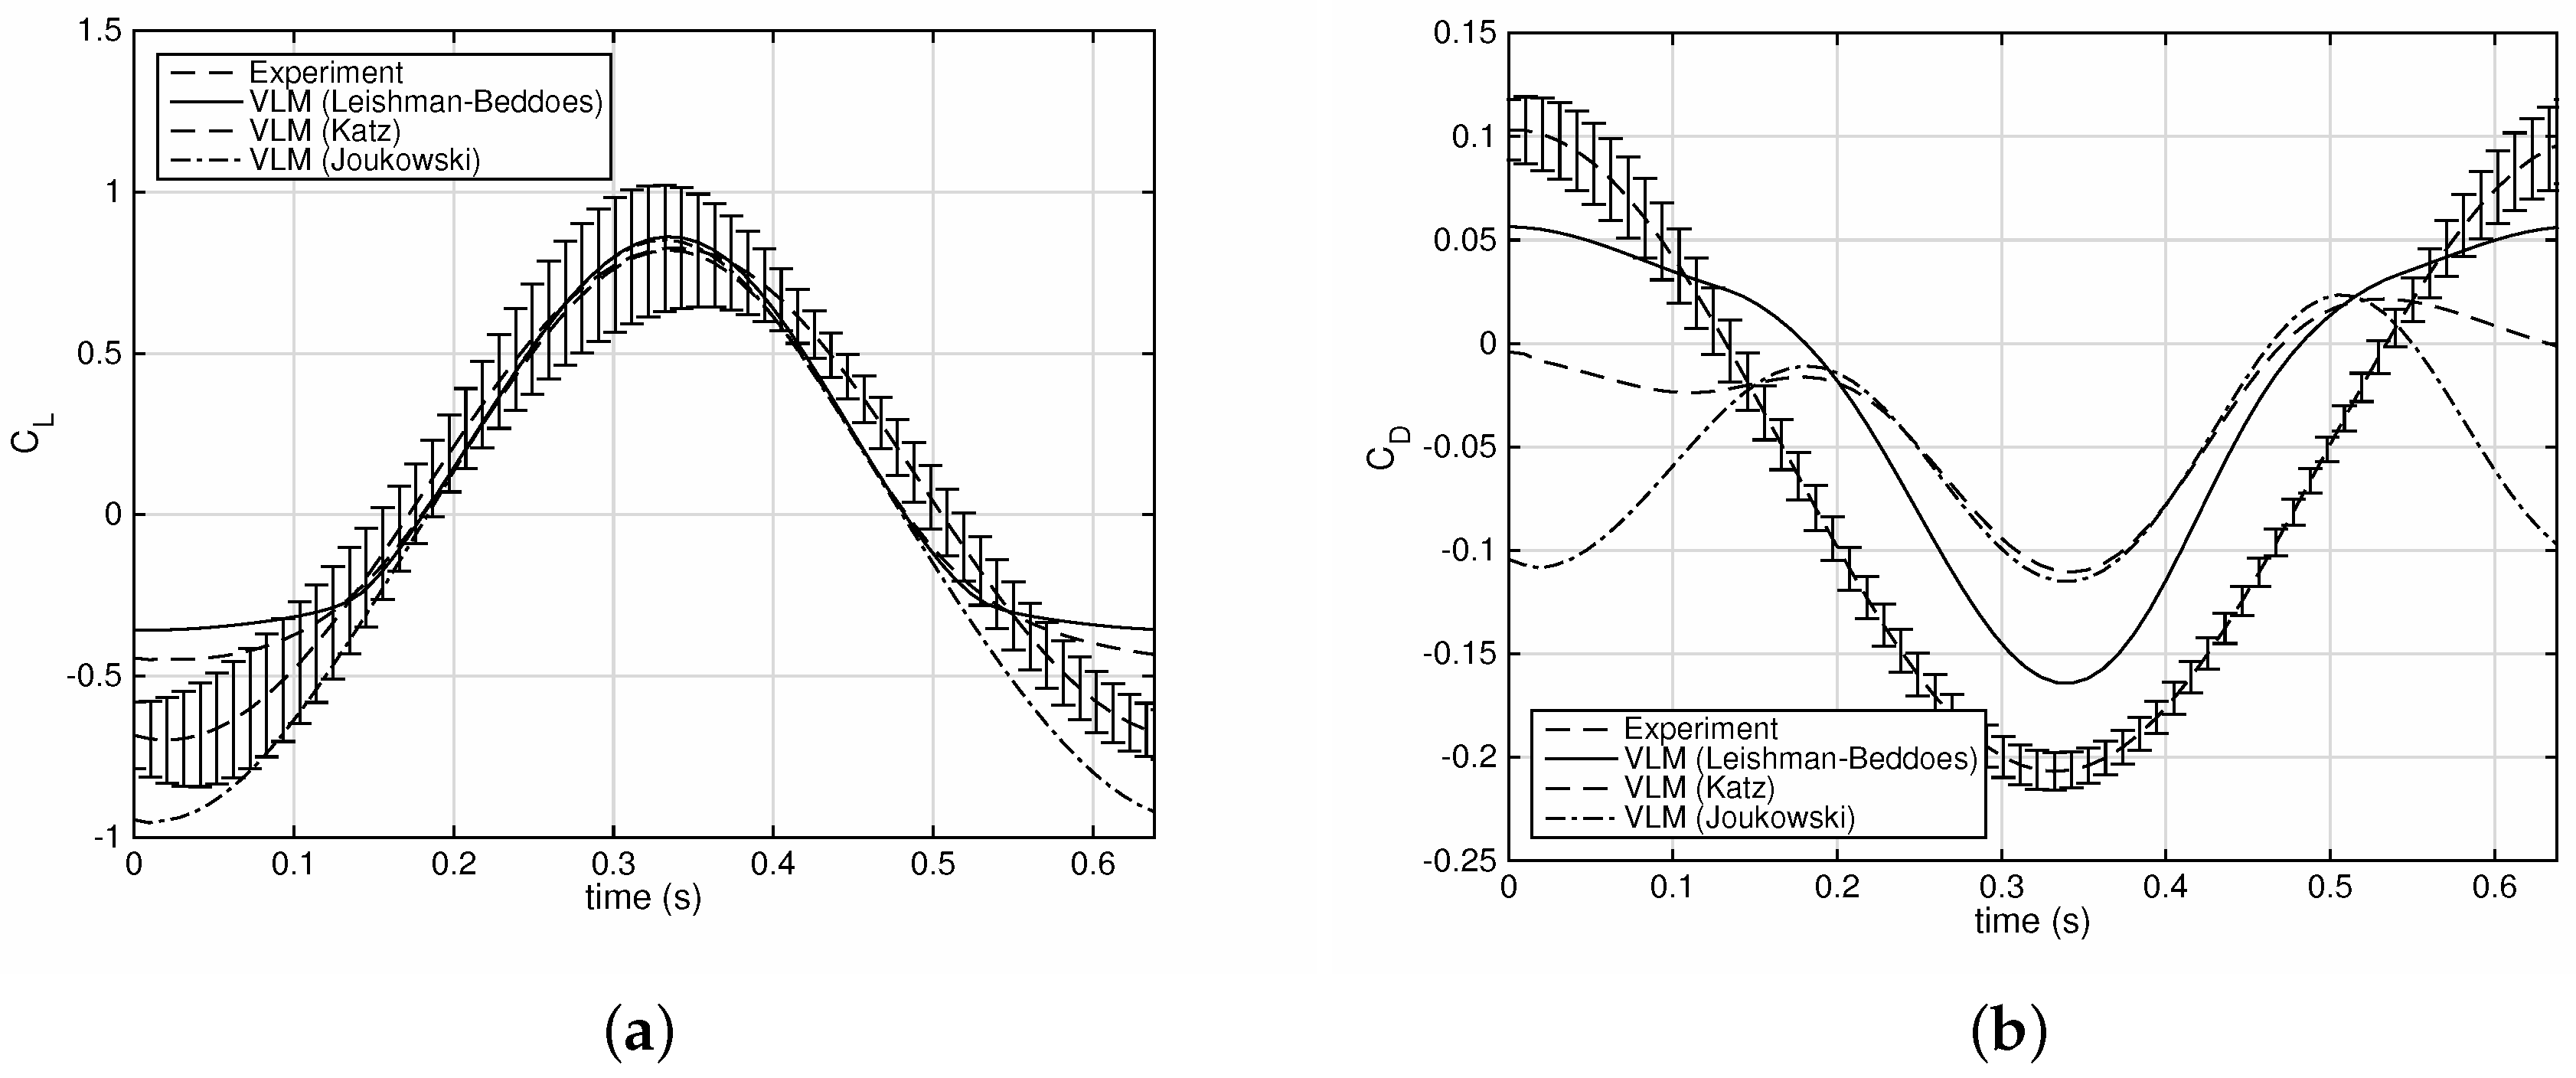
Figure 13 plots the lift and drag coefficient time histories for this case. It can be seen that all three load estimation techniques predict the lift successfully, despite the very high instantaneous values of kinematic angle of attack at the wingtip. In contrast, the drag estimated by both the Katz and Joukowski methods is quite inaccurate. In particular, more thrust is predicted during the upstroke than the downstroke, which is not the case in the experimental drag measurement. In contrast, the Leishman–Beddoes technique yields a drag time history that is quite similar to the experimental signal, except for a slight phase shift.
Figure 14 plots the lift and drag coefficient estimates obtained for the case
m/s,
Hz,
and
. The reduced frequency is
and the kinematic angle of attack at the tip oscillates between
and
. The Katz and Joukowski techniques match the experimental lift curve with good accuracy. The Leishman–Beddoes lift prediction is also quite good, except at the upstroke, where the amount of flow separation is exaggerated, leading to lower than expected values of the downforce. The Katz and Joukowski drag estimates are again quite inaccurate, as they underestimate the thrust during the downstroke and overestimate it during the upstroke. The Leishman–Beddoes approach yields a drag time history that is closer to the experimental curve, but still underestimates the thrust.
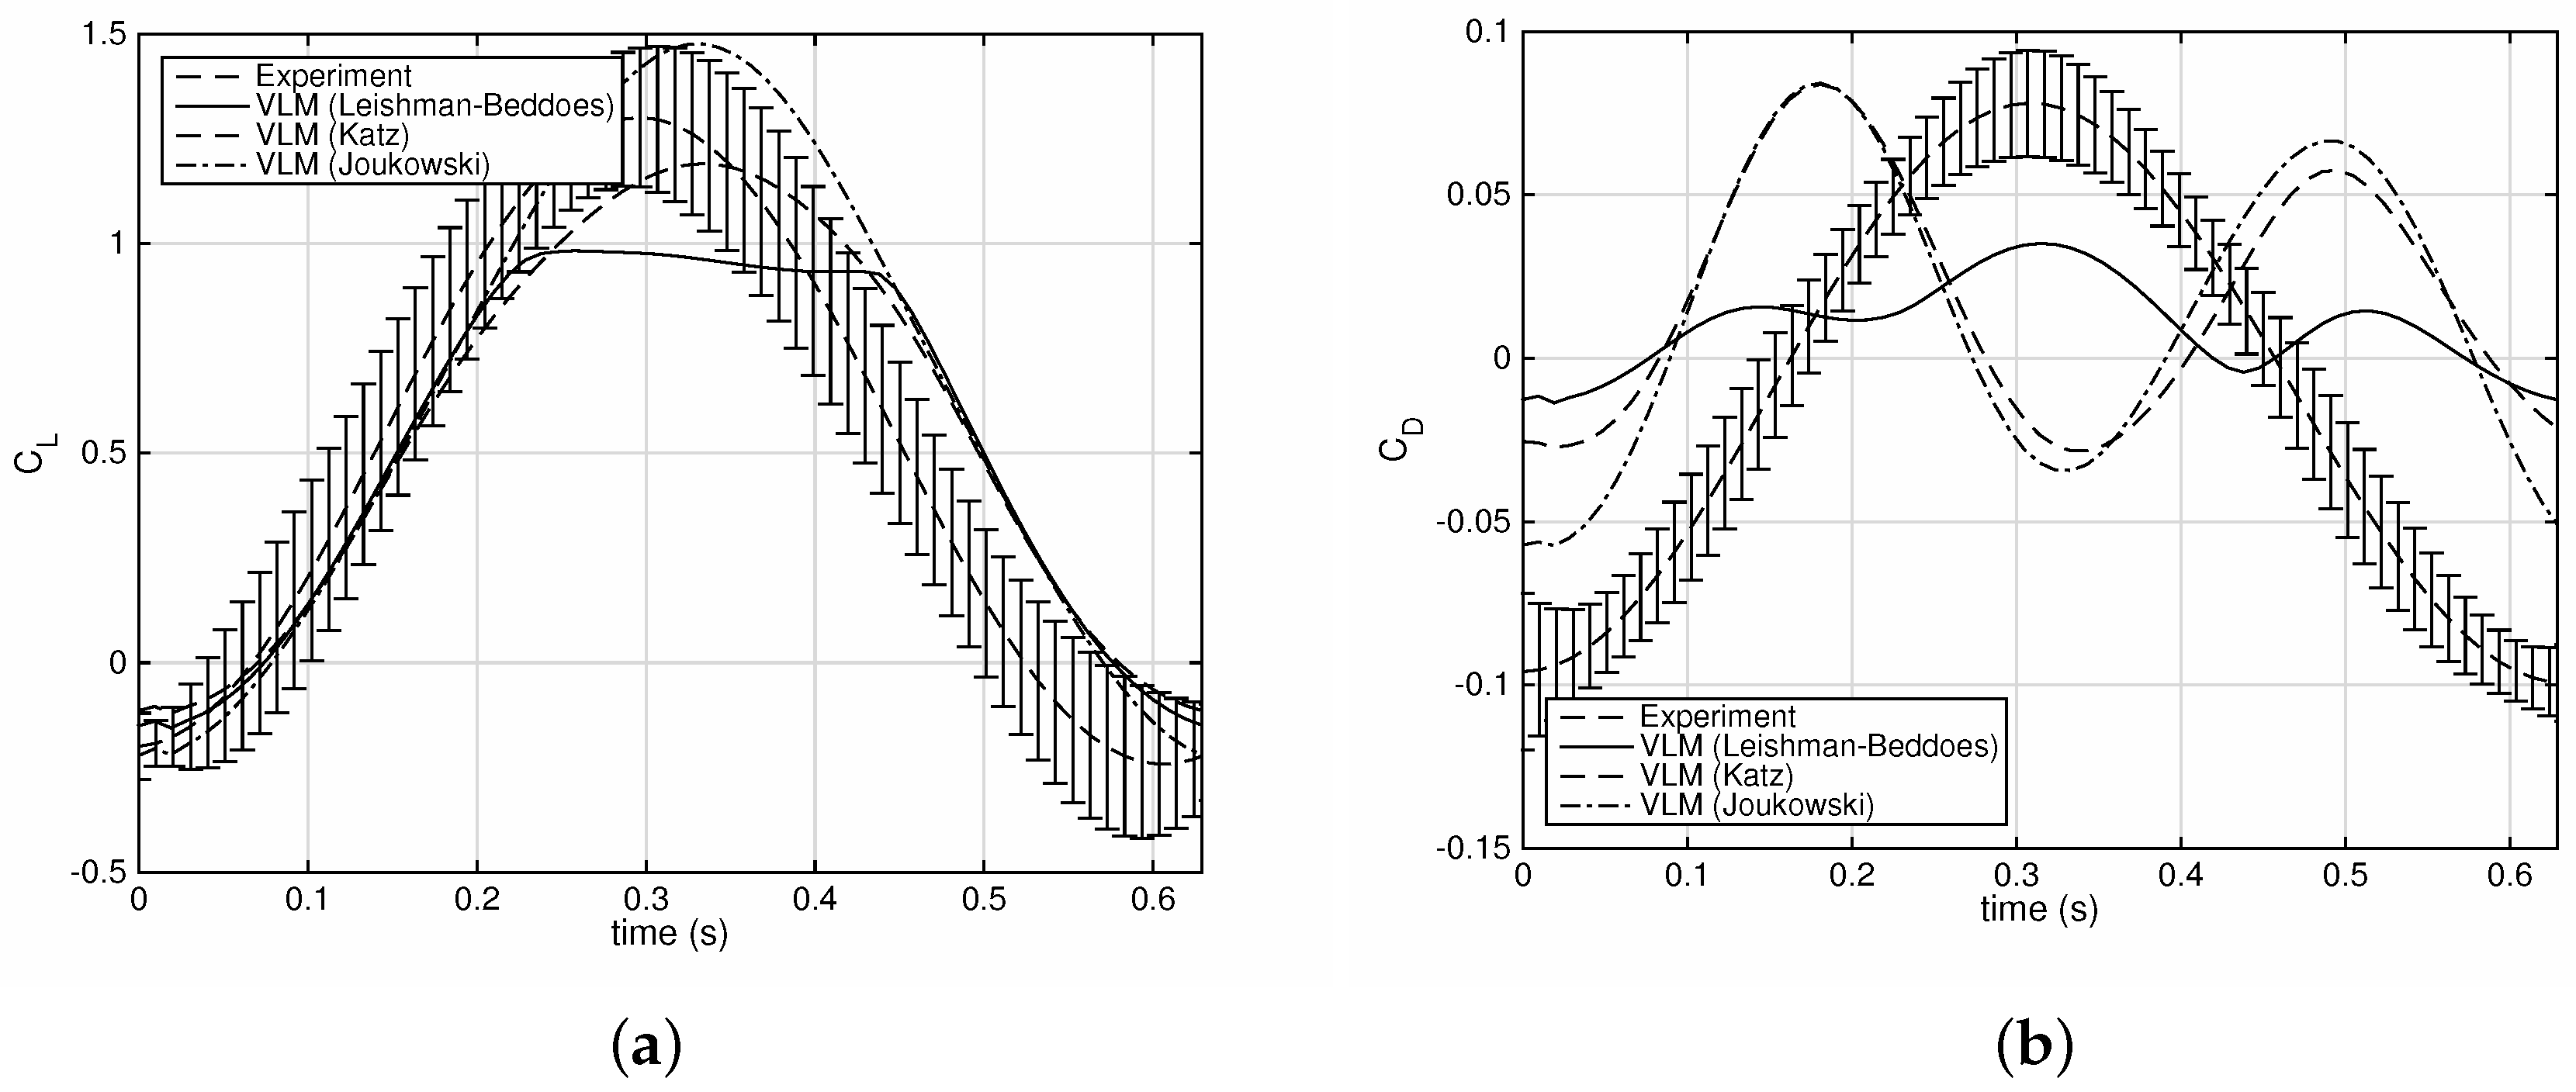
The test case of
Figure 14 is one of the most challenging, as it combines the highest reduced frequency and a very large variation in the kinematic angle of attack. Despite this fact, the simulation results could still be considered as acceptable. However, increasing the pitch angle limits to
,
, while keeping all other test parameters constant leads to unsatisfactory simulation predictions, particularly for the drag. This situation is demonstrated in
Figure 15. The Katz and Joukowski lift estimates are quite good, but the Leishman–Beddoes technique predicts massive separation during the downstroke and features a plateau in the lift time history. Furthermore, none of the three approaches produce good predictions for the drag.
8. Comparison of Mean Aerodynamic Loads
The results shown up to this point concern time-resolved lift and drag predictions, but in practice, the mean aerodynamic loads are very often required. Here, mean loads are obtained by averaging
and
over a complete flapping cycle for all of the test cases.
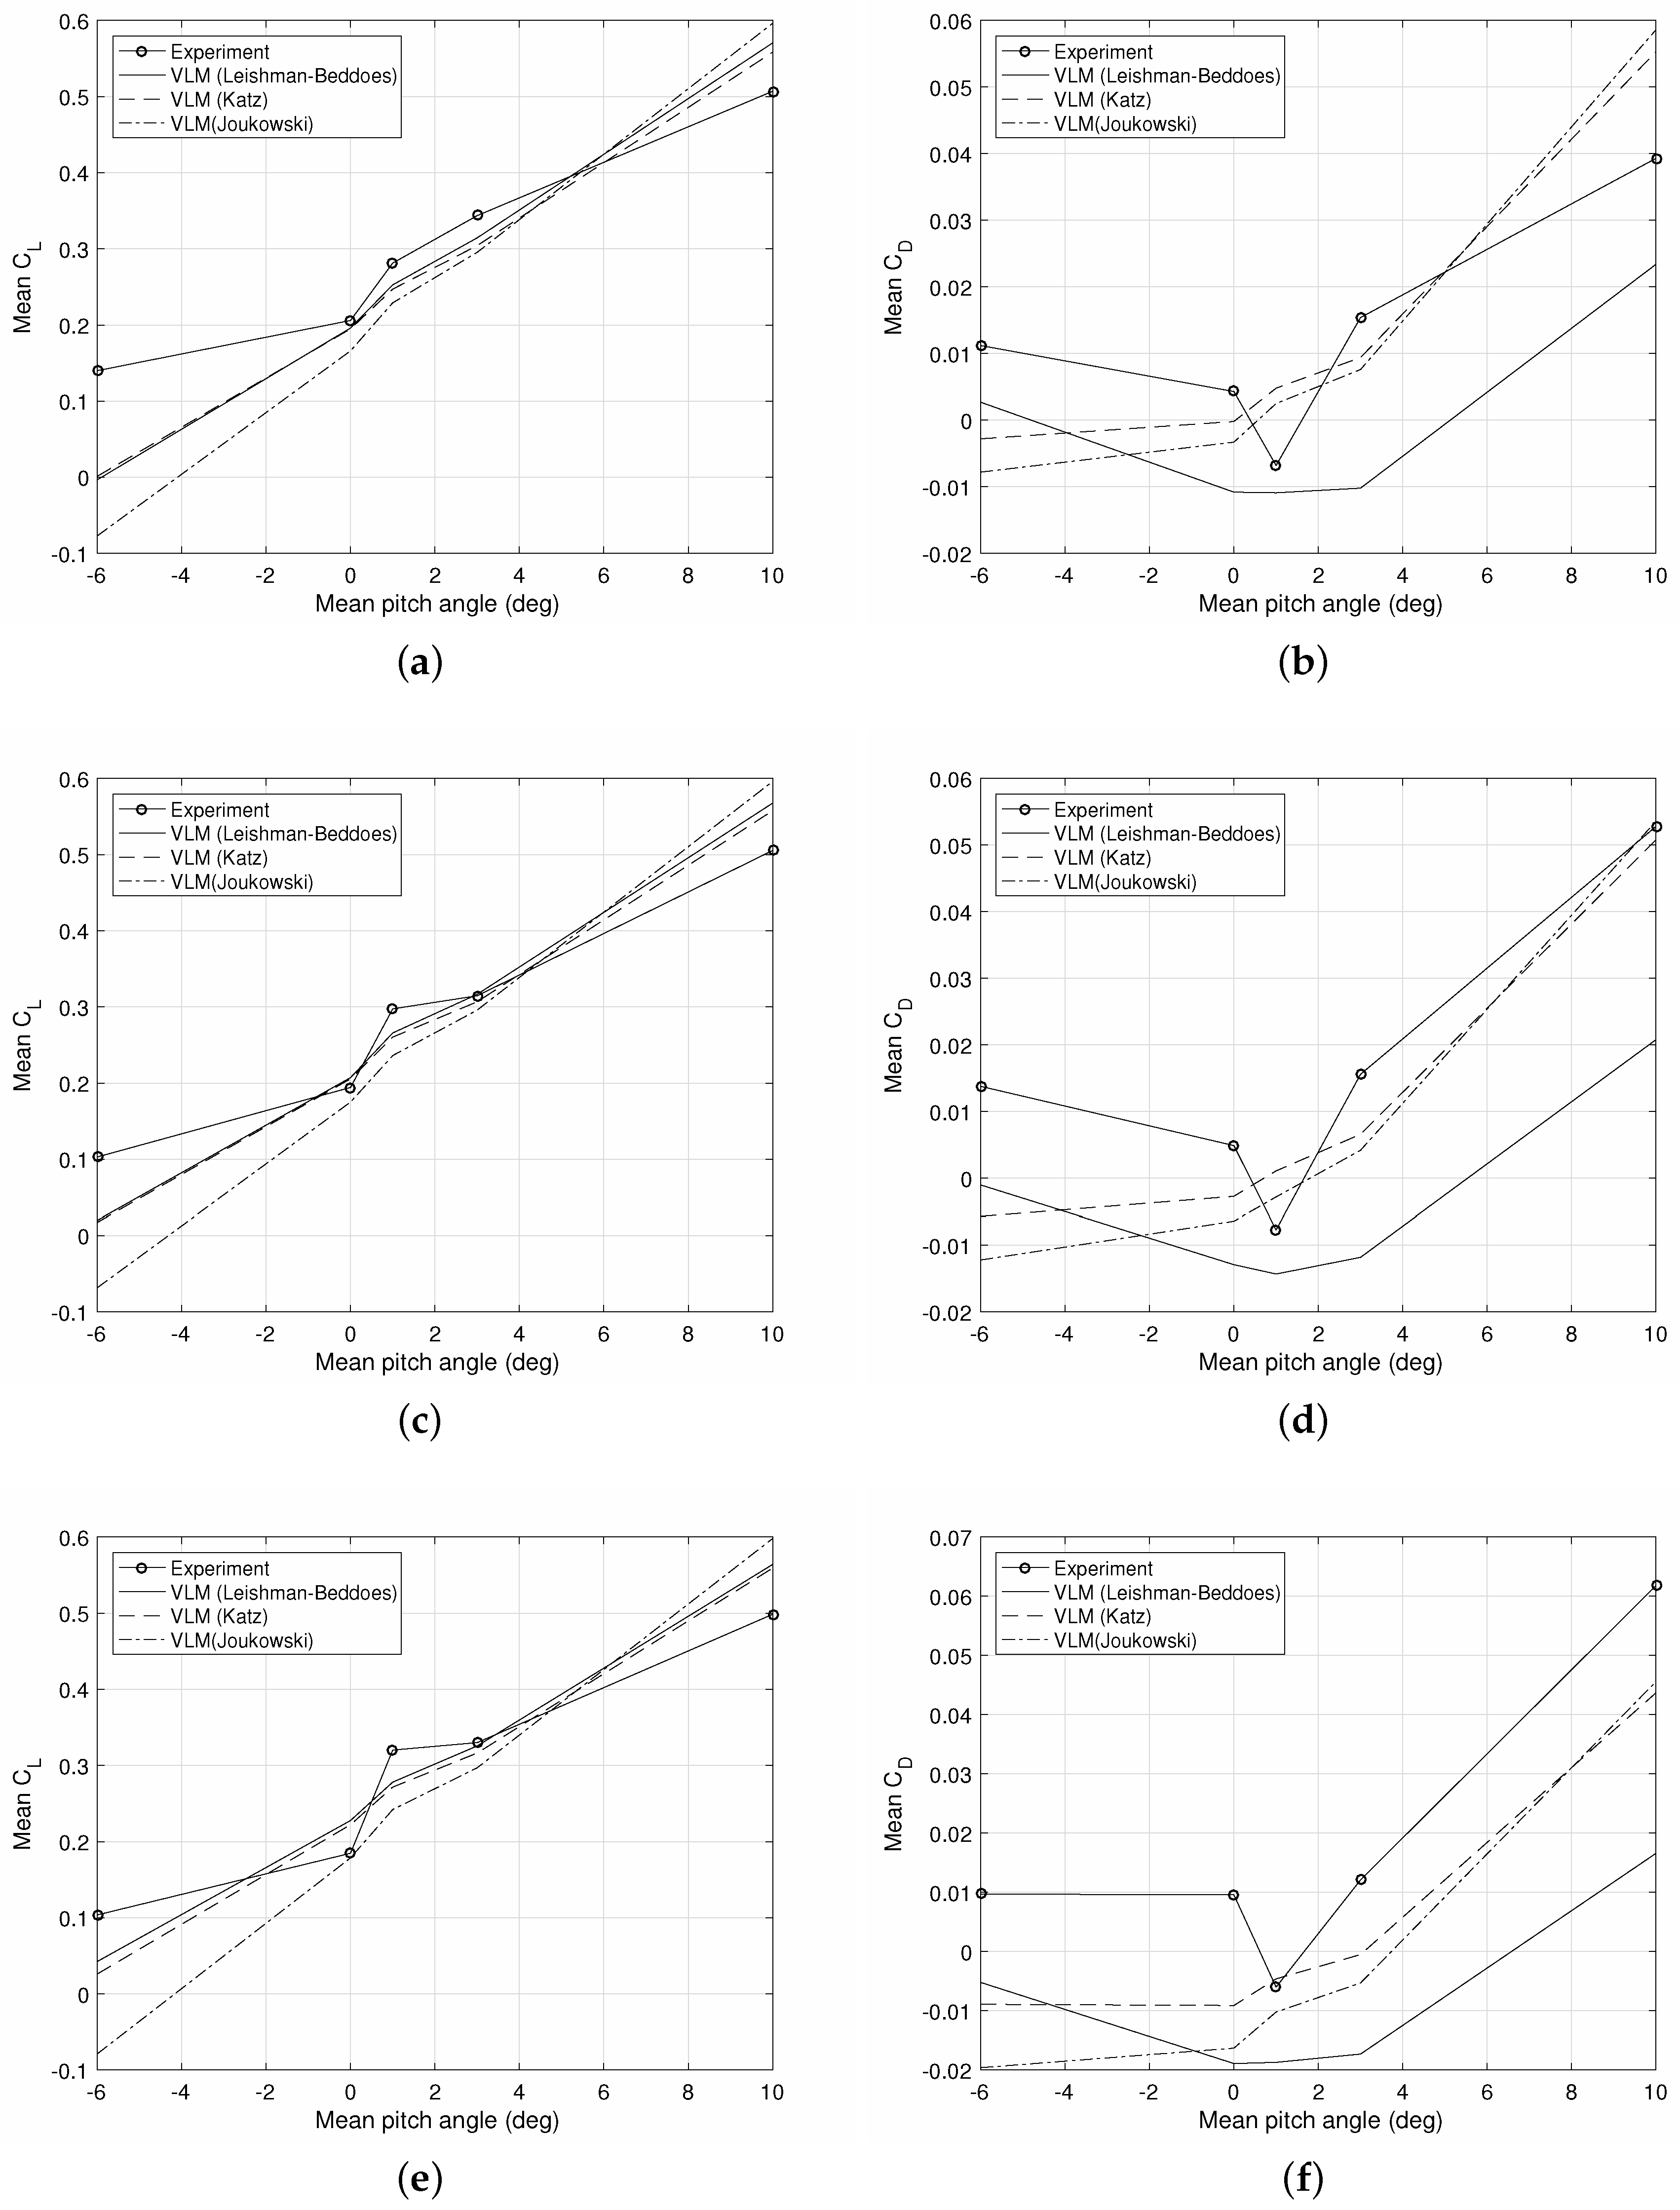
Figure 16 plots the predictions by the three VLM load estimation methods for the mean
and
for some pitch lagging test cases and compares them to the experimental measurements. The airspeed is
m/s for all plots, while three of the four frequencies (1.0, 1.23 and 1.5 Hz) are presented. The figure is representative of the quality of mean aerodynamic load predictions obtained for the majority of the test cases.
It can be seen that the mean lift coefficient variation with mean pitch angle is generally well represented by all three methods for pitch angles between and . At the two extreme values of the mean pitch, and , the lift is overestimated and underestimated, respectively, by all techniques. This phenomenon is probably due to the fact that significant flow separation occurs at the extreme values of the pitch angle.
The drag coefficient plots show that the experimental drag measurement undergoes a significant drop at the mean pitch angle of . This phenomenon is not captured by any of the numerical predictions. The Leishman–Beddoes mean drag coefficient estimates are systematically lower than the experimental measurements by around 0.01–0.04, the higher underestimations occurring at the positive mean pitch angles. The Katz and Joukowski methods underpredict the mean drag coefficient by a smaller amount, up to 0.03; for Hz, they even overestimate the drag by 0.02 at a mean pitch angle of . At pitch angles between and , the mean drag estimates obtained from these two methods are generally acceptable.
The conclusion from
Figure 16 is that mean aerodynamic load estimates obtained from the VLM approach are most accurate for intermediate mean pitch angles, even in pitch lagging conditions. Furthermore, the lift is predicted with higher accuracy than the drag. This last observation is reasonable since the lift coefficient values are one order of magnitude higher than those of the drag coefficient, and therefore, prediction errors are relatively smaller.
9. Conclusions
Considering the complexity of the experiments and of the phenomena involved in flapping flight, the simulation results presented in this work can be considered generally acceptable, in the absence of significant flow separation. However, it is clear that none of the load estimation methods investigated here is successful in all cases. The lift is predicted generally well, except in cases where significant stall is occurring. Even the Leishman–Beddoes model does not represent the full physics of some of the flows, as seen in
Figure 15.
Admittedly, the Leishman–Beddoes model used here is simplified, as it does not feature any of the time delay effects of the full model and does not calculate the effects of the dynamic stall vortex. The lack of time lagging does not seem to reduce the accuracy of the method for the low reduced frequencies tested here. Furthermore, there are no convincing dynamic stall models for highly three-dimensional flows. While a significant amount of research has been carried out on 2D dynamic stall, very few studies have addressed the 3D phenomenon.
The general conclusion is that the VLM is suitable for flapping flight simulations for cases that do not involve significant flow separation. The two most popular load estimation methods, i.e., the Katz and Joukowski techniques, produce very similar predictions during the downstroke, although some differences can occur over the upstroke. These differences are mostly visible in the drag time histories and concern cases where neither method is very successful (i.e., pure flapping with negative and pitch lagging). The Leishman–Beddoes approach can provide better drag predictions than the other two methods for specific cases, but can also feature a constant negative offset in its time histories, which sometimes can be significant.
