Article

Spray Characteristics of Alternative Aviation Fuel Blends

by
Andreas P. Vouros
1,2,
Alexandros P. Vouros
1,3 and
Thrassos Panidis
1,*
1
Laboratory of Applied Thermodynamics, Mechanical Engineering & Aeronautics Department, University of Patras, 26504 Patras, Greece
2
Laboratory of Fluid Mechanics, Mechanical Engineering Department, Technological Educational Institute Western Greece, 26443 Patras, Greece
3
Laboratory of Fluid Mechanics & Turbomachinery, Department of Mechanical Engineering Educators, School of Pedagogical & Technological Education, 14121 Athens, Greece
*
Author to whom correspondence should be addressed.
Aerospace 2017, 4(2), 18; https://doi.org/10.3390/aerospace4020018
Submission received: 31 December 2016 / Revised: 8 March 2017 / Accepted: 17 March 2017 / Published: 23 March 2017

Abstract

:
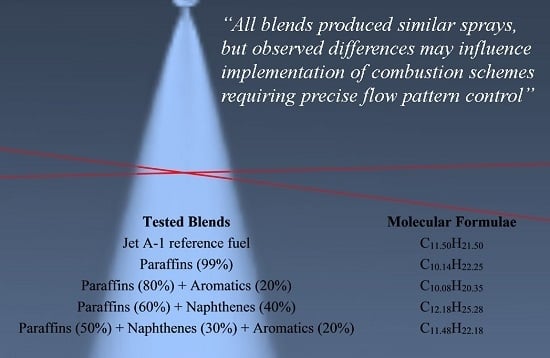
The compatibility of spray characteristics of alternative fuel blends, in relation to currently used Jet A-1 fuel, has been assessed experimentally. Tested blends were selected based on a narrow cut of paraffins, mixed with appropriately selected aromatics and naphthenes. Relevant physical properties including the density, viscosity, and surface tension were estimated first. The jet spray was produced using a single fluid, generic nozzle at operating pressures 5–11 bars. The atomization characteristics were assessed through measurements of droplet velocity field and droplet size, using phase Doppler anemometry. The physical properties varied within 10% of the reference fuel values. The spray results indicate that all tested blends produced similar atomized jets and droplet sizes, although observed differences may influence the implementation of combustion schemes which require precise control of the flow pattern.

Graphical Abstract

1. Introduction

Air travel growth is predicted to continue at five percent per year and therefore the future rate of gains in fuel efficiency is expected to be outpaced by the projected growth in air traffic [1]. Thus, the aircraft industry will need an increasing amount of fuel and as a consequence, the aviation industry is interested in alternative energy sources and alternative fuels in particular, to assure security of supply. Besides, candidate fuels are expected to positively affect global warming, environmental protection and diversity and sustainability. New fuels should be compatible with the current fleet and thus be “drop in” fuels similar to current Jet A-1 fuel, ideally with a lower CO2 budget [2].
The increasing demand for alternative, sustainable fuels in the transport sector is linked to the availability of alternative fuels for gas turbines [3,4,5]. The Fischer–Tropsch (FT) process offers a solution to this issue, providing synthetic middle distillate fuel components. The FT method or the “anything-To-Liquid” process (xTL) offers a versatile pathway to create synthetic fuels, converting carbon- and energy-containing feedstock to high quality fuels. The feedstock can be either natural gas (Gas-To-Liquid, GTL), biomass (Biomass-To-Liquid, BTL) or coal (Coal-To-Liquid, CTL). During the gasification step, the connection to the starting material is lost, so FT liquids from any starting material will be essentially the same [6].
Focusing on the GTL procedure, FT kerosene can provide advantages as an alternative aviation fuel, as it is physically similar to kerosene and thus compatible with current fuel storage and handling facilities. Moreover, the FT kerosene is a product virtually free from the sulfur-, oxygen- and (occasionally) nitrogen-containing compounds found in conventional jet fuel; it emits fewer particulates than conventional jet fuel and it is a sulfur-free fuel leading to the complete elimination of SOx emissions. There are no sulfur dioxide (SO2) or sulfuric acid (H2SO4) aerosol emissions, which also form contrails. Furthermore, the synthetic FT kerosene produces lower budgets of other pollutants such as particulate matter, and hydrocarbon emissions [3,6,7].
On the other hand, the FT synthetic fuel present disadvantages related to the low aromatics content. FT kerosene will have a density value lower than the minimum requirement, whereas switching from conventional jet fuel to aromatic-free FT synthetic fuel, will cause some of the elastomers (used in aircraft fuel systems to swell) to shrink, which may lead to fuel leaks [3,7]. In this view, there is concern in the industry regarding switching from conventional jet fuel to aromatic-free synthetic fuel. The effects of aromatics on elastomers is an area of active research and a possible solution could be an additive that would ensure that elastomers swell even in the absence of aromatics. The disadvantages of the low aromatics content disappear if the FT synthetic fuel is blended with conventional jet fuel, although the advantage of lower emissions is reduced. However, it is envisaged that usage of synthetic jet fuels will improve air quality around airports, which will be particularly advantageous at inner city airports.
The use of alternative fuels in aviation aero engines requires a thorough understanding of their atomization and combustion properties. These processes are expected to be strongly affected by the physical properties and chemical composition of a particular blend. In addition, transfer phenomena (turbulent heat, mass and momentum transfer) as well as chemical kinetics are involved in the interaction between the oxidizer flow field and the fuel droplets. Each of these phenomena is extremely complicated in its own right, and when coupled together in a real flow situation, their study becomes even more difficult.
The performance of a combustor depends on the droplet size produced by the nozzle atomizer and the way in which the air mixes with the droplets [8,9,10,11,12]. Spray formation at a nozzle is dominated by different mechanisms, depending on the relative velocity and the properties of the liquid and the ambient gas [13,14]. These dependencies can be identified using appropriate non-dimensional numbers. The Reynolds number, Re = ρuD/μ, characterizes the balance between the inertial and viscosity forces (u is the exit velocity, D the diameter of the nozzle, ρ the gas density, and μ the dynamic viscosity). The Weber number, We = ρu2D/σ, is the main quantity controlling droplet breakup mechanisms and the resulting formation of droplets, relating the surface tension force to the aerodynamic force exerted by the ambient gas (σ is the surface tension of the liquid). Finally, the Ohnesorge number, O h = μ / ρ σ D = W e / R e takes into account viscosity dissipation in relation to the surface tension energy. Low Ohnesorge numbers are associated with weak friction losses and most of the inserted energy is converted to surface tension energy whereas, at high Ohnesorge number values, internal viscous dissipation becomes dominant. Reitz and Lefebvre [15,16,17] have identified four regimes for spray formation in relation to Re and Oh numbers, namely the Rayleigh regime, the first and the second wind-induced regimes and the atomization regime. Farther downstream, spray break up may continue due to aerodynamic forces.
Experimental data are often required for the determination of the droplet size and velocity distributions. Consequently, the atomization characteristics of candidate alternative fuels have to be assessed through detailed experiments of the spray field including local measurements of droplet Sauter mean diameter (SMD) distributions as well as axial and radial velocity profiles [17]. Moreover, the characteristics of liquid fuel atomization and vaporization are vital, because the atomization and evaporation of the fuel spray directly affect the engine performance and emission characteristics [18]. Furthermore, the sensitivity of the fuel droplet velocity field to the physical properties, such as density, viscosity and surface tension, is of great importance in relation to the atomization process. These effects are considered essential nowadays, when the implementation of advanced, staged combustion schemes, which require precise control of the flow pattern, are under consideration on both sides of the Atlantic (e.g., ASCENT and Clean Sky projects).
The present work is in line with several contemporary efforts to assess the influence of composition and physical properties on the atomization characteristics of alternative fuels [19,20,21,22,23]. The work was part of a larger effort to investigate the applicability of fuels that can be processed to look like kerosene, as practical alternatives to fossil fuels by the Virtual Fuel Centre of the Environmentally Compatible Air Transport System project (ECATS) [24,25,26]. Aiming to contribute to the assessment of compatibility of the spray characteristics of alternative fuel blends, the objective of the present work was to evaluate the relevant physical properties including surface tension, kinematic viscosity and density, and investigate their effect on the atomization process, comparing the resulting spray properties with those of the reference Jet A-1 fuel spray. To this end, a generic experiment was conducted in the Lab of Applied Thermodynamics at University of Patras (LAT/UP), to assess the spray characteristics of specified fuel blends, evaluating the spray quality.

2. Materials and Methods

2.1. Brief Description of Tested Fuels—Evaluation of Physical Properties

The evaluated fuels were based on a narrow xTL cut, consisting mainly of relative low molecular weight n- and iso-paraffins, as a base case. The blends were mixtures of the base compound with appropriately selected single-ring aromatics, di-aromatics and naphthenes, in the form of commercially available industrial grade solvents. A typical Jet A-1 was also used for reference purposes. The generic composition of the GTL blends considered is presented in Table 1. All GTL blends were supplied by Shell Global Solutions (London, UK), with the associated molecular formulas based on two-dimensional gas chromatography. Although the blends were delivered “as is”, further information can be found in complementing research publications, prepared by other members of the ECATS Virtual Fuel Centre [24,25,26].
A characterization of physical and chemical properties of GTL blends has been first conducted by Shell Global Solutions. This included fuel density, obtained with the IP365 method, and mean molecular weight and formula calculated from the detailed composition data. Kinematic viscosity and surface tension measurements were conducted at the University of Patras, (Patras, Greece), with a Rheometrics Rheometer SR 200 (TA Instruments Inc., New Castle, DE, USA) using Couette-flow methodology and a KSV Sigma Tensiometer 700 (KSV Instruments Ltd., Helsinki, Finland) using the Du Nouy ring method, respectively. The relevant physical properties of the tested blends, along with the temperatures at which they were measured and the associated expanded uncertainties, are presented in Table 2.

2.2. Experimental Facility

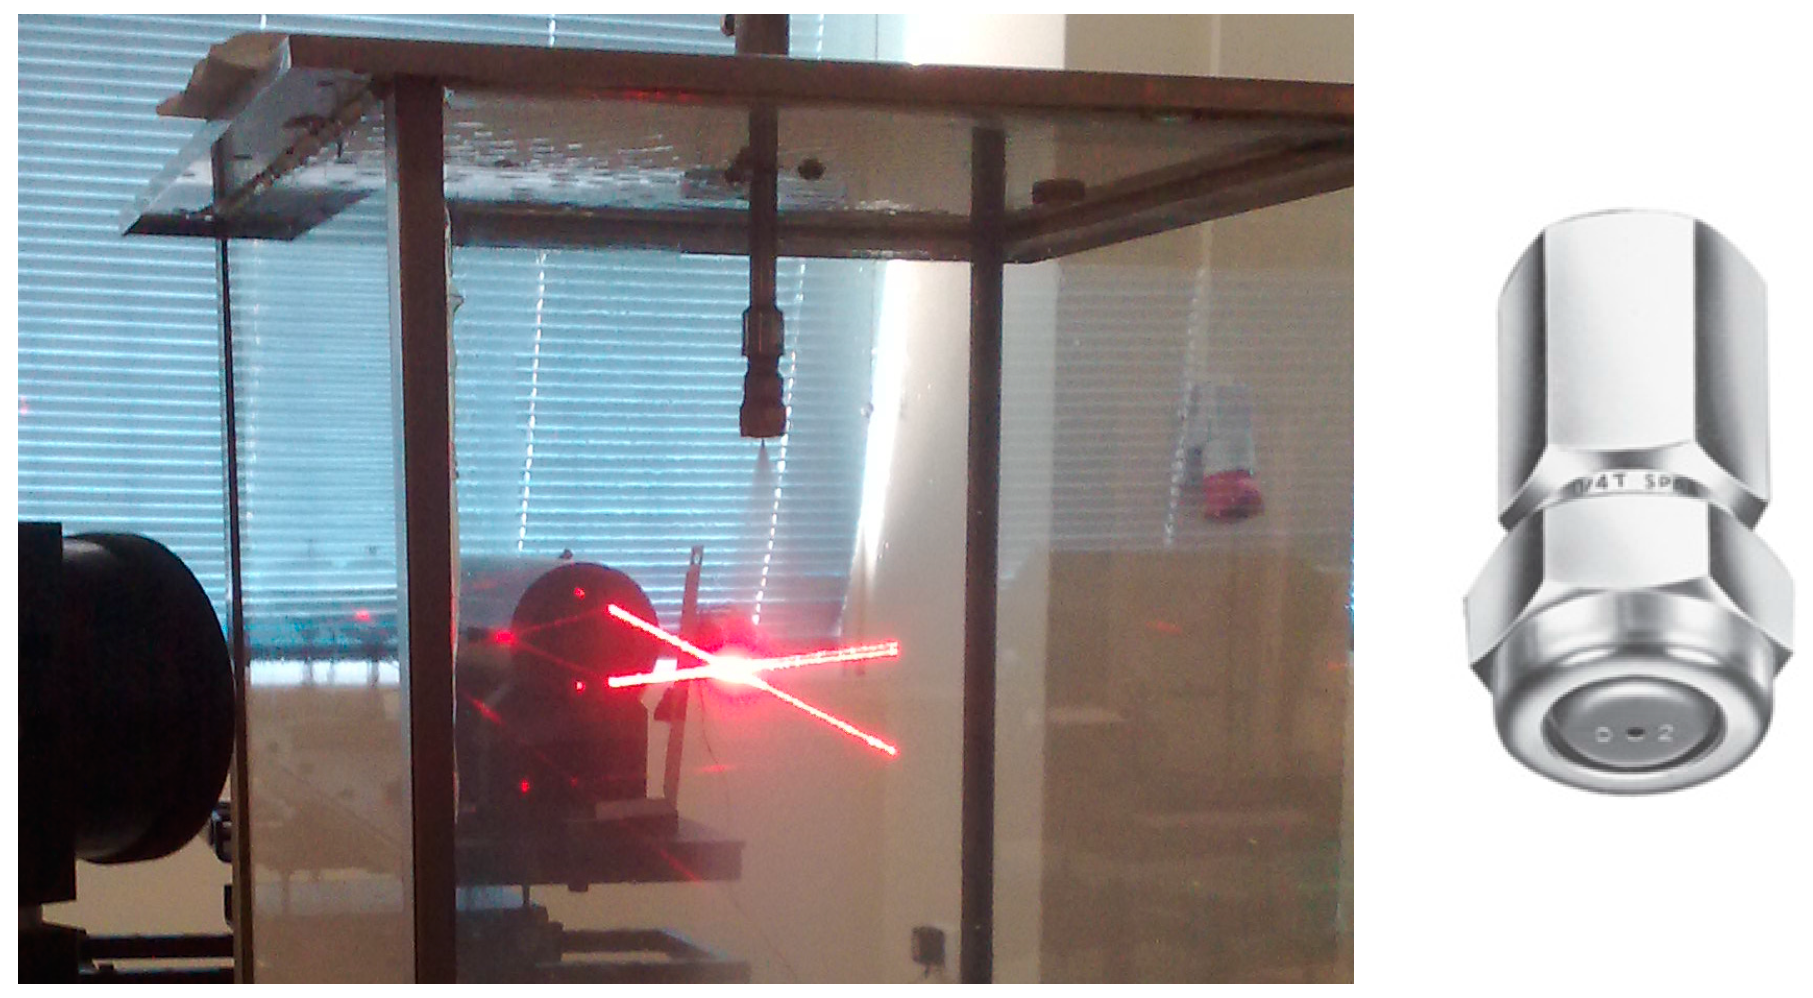
A closed loop facility has been designed and constructed for the atomization experiments, in which liquid mixtures can be circulated (Figure 1). An explosion-proof Danfoss oil pump (pressure range 5–12 bars for kerosene) was used to maintain the liquid flow in the circulation loop. Flow monitoring and control were achieved with a series of devices including a rotameter, pressure gauges, a sheathed thermocouple and control valves. The spray–liquid sheet was injected from a generic full cone spray nozzle. The test chamber is 1000 mm in height with a cross section area of 400 × 400 mm2 and was made of suitable glass windows allowing optical access. Fuel that accumulates at the conical bottom of the test section is recirculated through the pump. The test rig schematic is shown in Figure 1 and a photo of the test chamber during the jet fuel atomization experiments along with the selected nozzle is shown in Figure 2.
The spray–liquid jet was injected from a generic full cone spray nozzle which has been selected based on characteristics such as operation injection pressure, volumetric capacity and spray cone angle. Parameters such as nozzle spray pattern, and the induced flow field were considered to avoid the accumulation of droplets on the test rig windows, which would block the optical path of the measuring apparatus. As the experiment was intended to be generic, only common single fluid nozzle types for liquid phase have been used, since pressure nozzles of small dimensions produce sprays and flow patterns which are more sensitive to fluid properties.
The full–cone ¼ D1-35 Spraying Systems Co nozzle which was selected can be operated at pressures reaching 20 bars whereas, and the maximum pump working pressure for kerosene was 12 bars. The orifice diameter is 0.79 mm, producing at nominal pressure of 6 bars a spray of volumetric capacity 0.78 lit/min with a cone angle of 26 degrees. The present tests were generic, isothermal tests at room conditions, designed to facilitate optical diagnostics for the comparison of sprays produced by the different blends. The results are not expected to provide direct information on the operational characteristics in actual applications, but the generic character and simplicity of the nozzle-test section combination, makes them suitable for the evaluation of the capabilities of numerical codes to capture the spray production and development characteristics.

2.3. Measuring Technique

The phase Doppler anemometry (PDA) technique has been applied for droplet size and velocity measurements. This technique determines the droplet velocity by standard “fringe” mode laser anemometry, and estimates the droplet size by measuring the phase shift due to the spatial variation of the fringes, reaching two detectors after traveling paths of different lengths through the droplets. The two detectors receive signals from spatially distinct areas on the collection lens. The frequency of the Doppler burst is directly proportional to the droplet velocity component perpendicular to the plane of the fringes. The measured phase shift is related linearly to the droplet diameter by a so-called phase factor, which is determined by the geometry of the optical arrangement of the PDA system, the wavelength of the laser light, and the dominating mechanism of light scattering (reflection or refraction) [27,28,29,30]. The technique is insensitive to the amplitude of the scattered light and provides additional local point information including liquid flux, drop number density and size–velocity correlation. The front lens of receiving and transmitting optics and the receiving angle have been selected and optimized according to the measurement requirements. The receiving optics consisted of a Dantec classic PDA system. The signal was analyzed by a burst spectrum analyzer (BSA, Dantec Dynamics, Skovlunde, Denmark), based on 10% spherical validation and 10° phase error criteria. At each measuring location, 30,000 validated samples were recorded. The sampling rate was dependent on droplet presence and signal validation, maintaining a mean value of 1.7 kHz close to the spray axis, whereas at the outer measuring locations the sampling rate dropped to no less than 50 Hz in any case. Transmitting and receiving optics were mounted on a 3D mechanical traversing system. Preliminary measurements were conducted to identify the location of the jet axis, based on the symmetry properties around it. The main characteristics of the optical setup are shown in Table 3.
Measurement uncertainties depend on droplet diameter, velocity orientation and magnitude and optical arrangement. Reliable flux measurements are more difficult to obtain than size or velocity measurements. Particularly, the uncertainty in volumetric flux depends on the data validation efficiency, the ratio of droplet-to-probe volume diameter and the probability of droplets crossing the probe volume with specific trajectories, and can be kept small if the probe volume is larger than the maximum droplet diameter in the flow [27,31,32,33]. For the present experiment, uncertainties were estimated to be 4% for the mean droplet size, 1.5% for the mean velocity, 4% for the root mean square (rms) velocity, and about 18% for the volume flux measurements, for 95% confidence level [34].

2.4. Experimental Conditions

The experimental work was organized as a parametric study. Measurements included radial distributions of the droplet mean and rms streamwise velocity component, Sauter mean diameter (SMD) and volumetric flux at specified axial locations. Radial profiles at axial distances 58, 98, 138, 178 mm or in non-dimensional form (normalized with the nozzle diameter, d = 0.79 mm) at z/d = 73.4; 124.1; 174.7; 225.3 respectively, have been obtained for injecting pressures of 5; 7; 9; and 11 bars for each fuel blend. Results have been evaluated in relation to fuel blend physical properties. Comparative diagrams are presented for all blends in respect to injection pressure and axial distance.
During the experiments, the fuels were heated passing through the pump. At steady state conditions, when measurements were obtained, the fuel temperature in the feeding line was 40 ± 1.5 °C. To provide a generalized frame of reference, which will allow comparisons with similar data, fuel properties have been re-evaluated at 40 °C, based on the measured quantities. To this end, the fuel properties were assumed to vary with temperature in a similar manner with Jet A-1 fuel as described in [35]. More specifically, density variation for all blends was estimated to be linear with temperature, with the same slope as Jet A-1 in [35], which as indicated in this report, is almost the same for a variety of fuels. Likewise, assuming that molecular properties are quite close for all blends, a linear relationship was used for estimating the temperature variation of surface tension, in agreement with the Ramsay–Shields correlation [36], using the same slope as Jet A-1 in [35]. In the case of the kinematic viscosity, ν, the linear dependence is expected between log log Z and log T (where Z = ν + 0.7 + exp(−1.47 − 1.84ν − 0.51ν2)) [37] and again the corresponding slope of the Jet A-1 fuel in [35] was used for estimating the temperature dependence of all blends. The properties of all blends estimated at 40 °C, as described above, along with relevant non-dimensional numbers estimated for all blends based on nozzle exit velocity at 11 bars, and nozzle diameter are presented in Table 4.
The base P blend has significantly lower density and surface tension in comparison to the Jet A-1 fuel, whereas successive blends attain values closer to the reference fuel. Regarding the kinematic viscosity, only the measurements of the last two blends (P–N and P–N–Ar) appear to diverge from the reference fuel values. The P–N–Ar blend presents the lowest Re and We numbers followed by the P, P–N and Jet A-1, whereas the highest values correspond to the P–Ar blend. Values of the Oh number are almost the same for Jet A-1 and the P–Ar blend, whereas the base P blend value is a little higher and those of the last two blends (P–N and P–N–Ar) diverge significantly from the reference fuel values. Considering the experiments for all blends and at all pressures, the nozzle exit Reynolds number was in the range 25,000–50,000 and the Ohnesorge number was close to 5 × 10⁻³, therefore according to Reitz and Lefebvre [15,16,17], spray formation can be expected to correspond to the atomization regime.

3. Results and Discussion

3.1. Axial Droplet Velocity

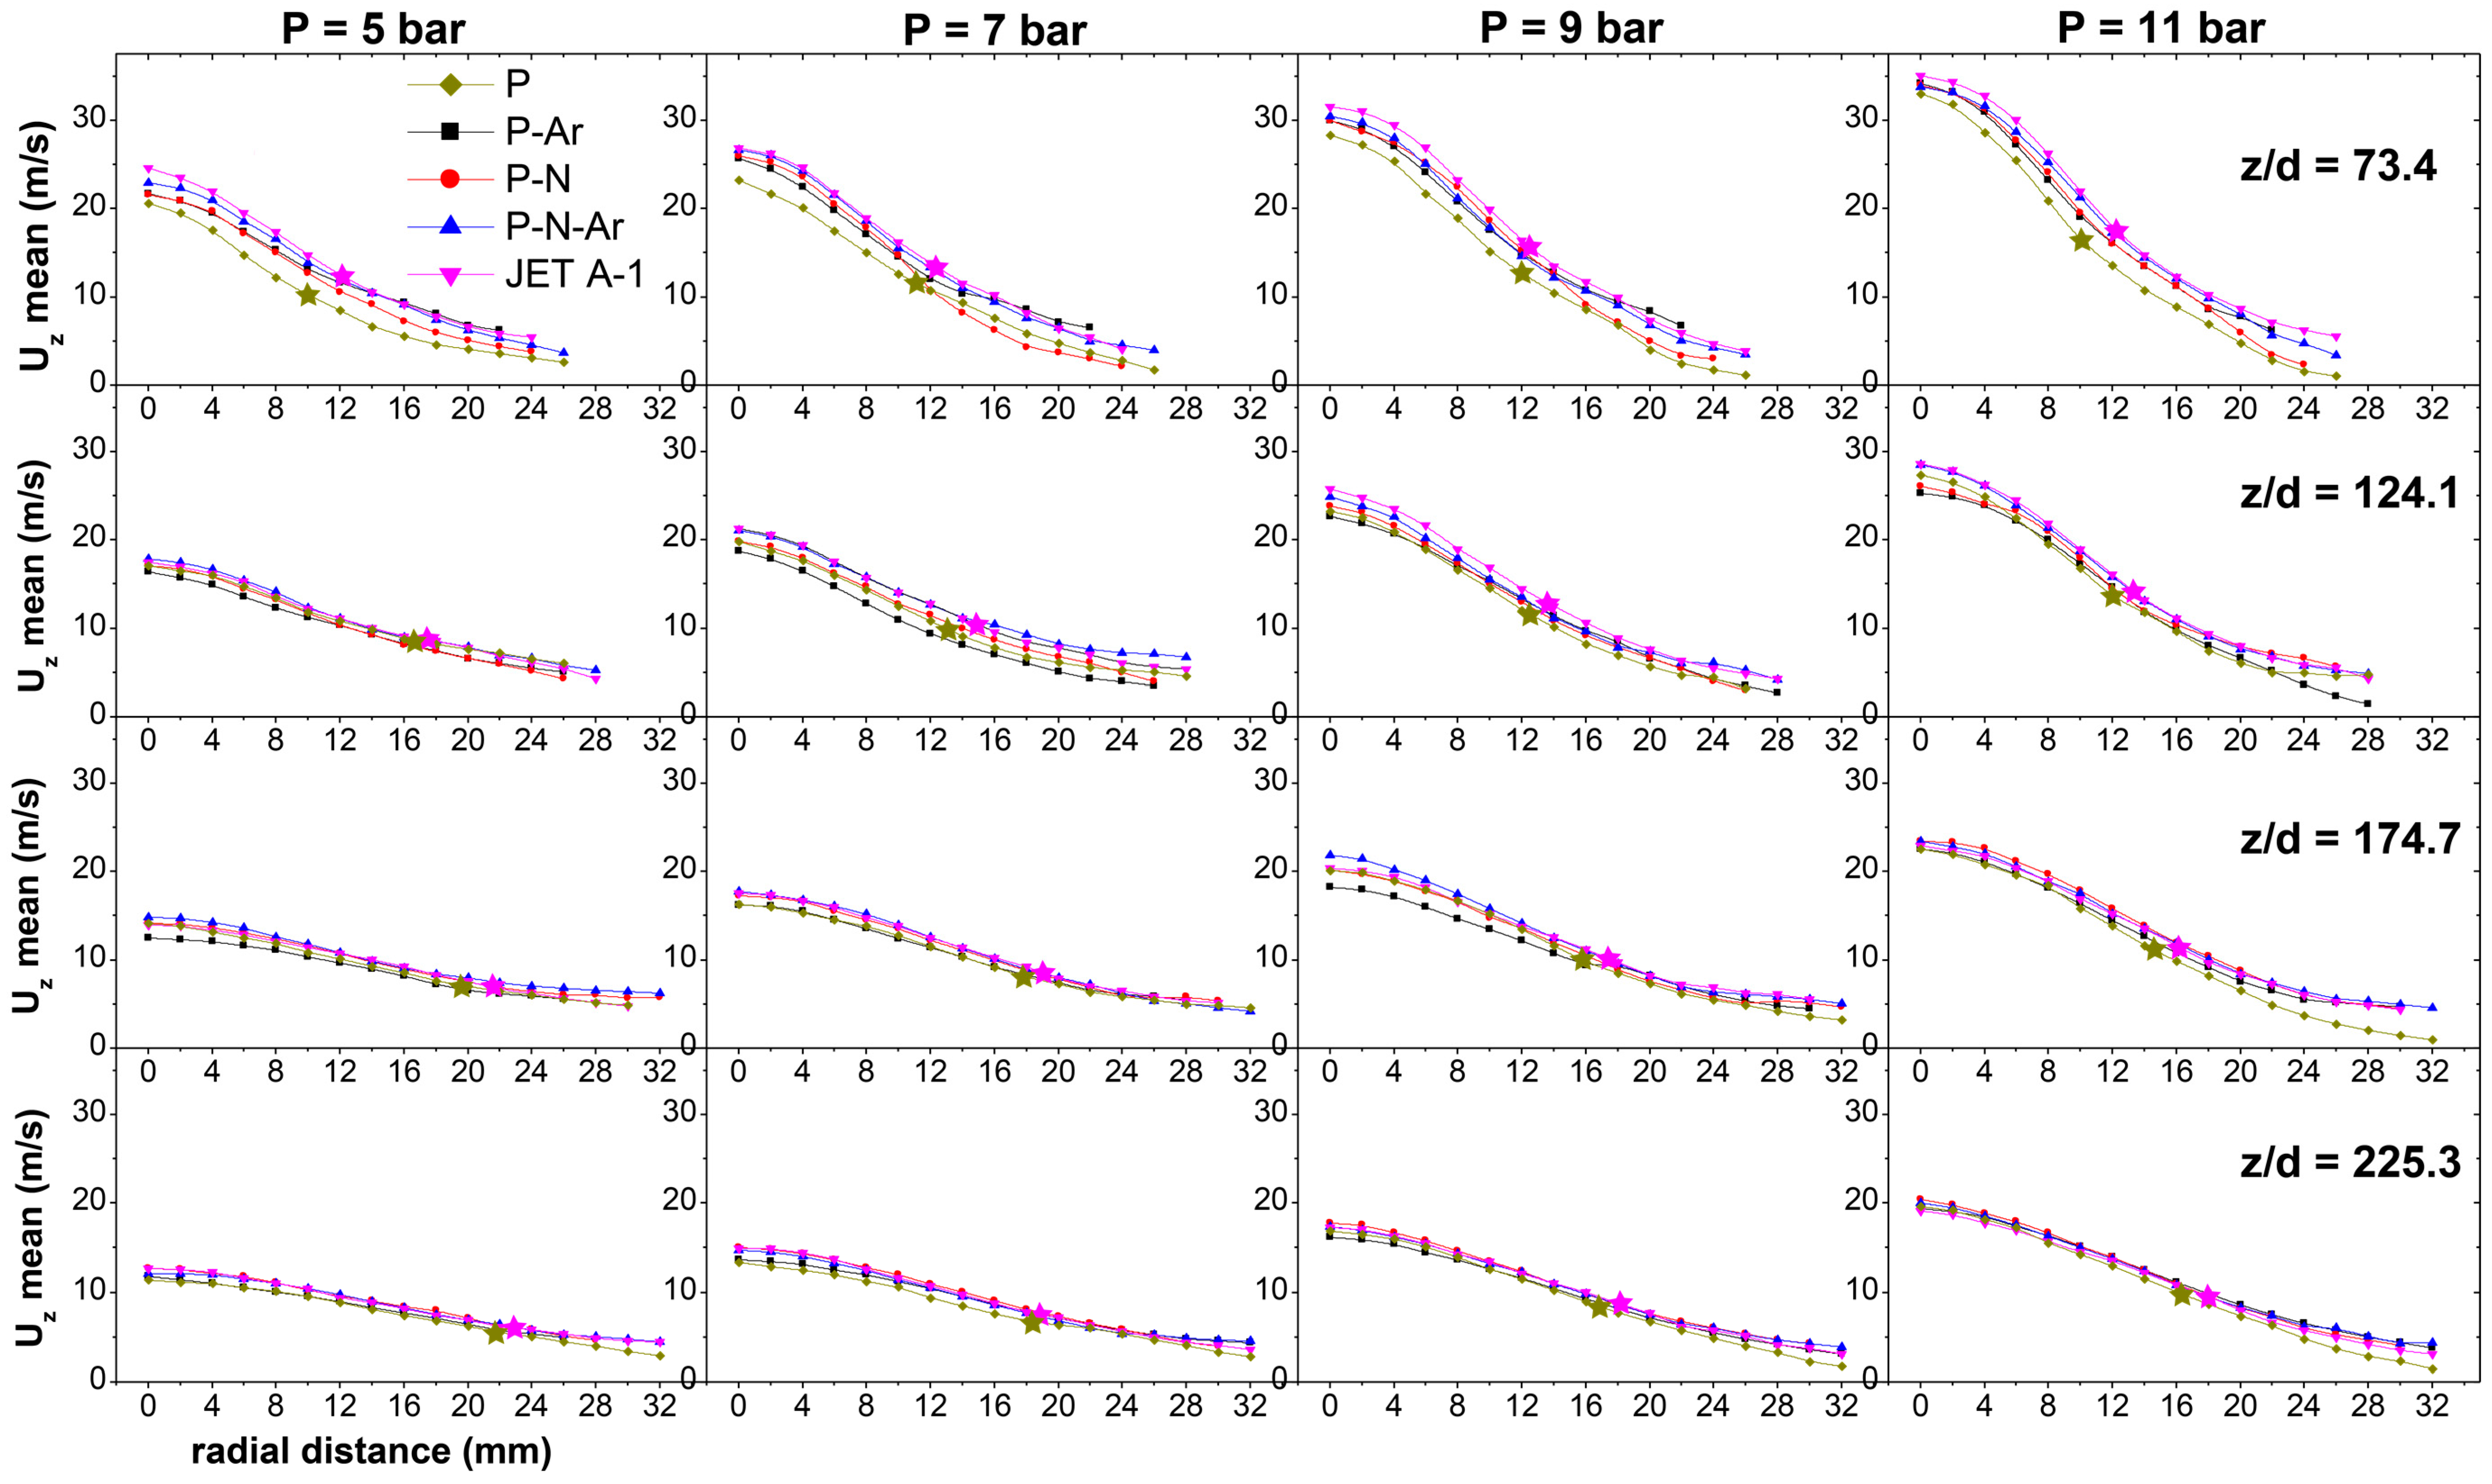
Mean axial droplet velocity distributions are presented in Figure 3 at different distances z/d from the jet exit, for all pressure cases. All distributions have the typical (for an axisymmetric jet) bell shaped (almost Gaussian) form around the central axis. This trend is observed for all operating pressures, although values increase with pressure as expected. At the locations closest to the nozzle (z/d = 73.4), different blends present rather distinct distributions, shifted in relation to the reference Jet A-1 in a range reaching about 20% of peak values. Jet A-1 velocities attain, in most cases, the largest values, whereas those of the GTL (P blend) attain the lowest. Values for the other blends lie in between. The P–N–Ar blend seems to be the one attaining values closest or even equal to those of Jet A-1 for all operating pressures. At larger distances from the orifice, peak velocities decrease and the differences between corresponding values for all blends become smaller. It can be said, in general, that Jet A-1 and the P–N–Ar blend and to a lesser extent the P–N blend attain (rather similar) higher velocities whereas P and P–Ar blends attain lower velocities. It is interesting to note that the values of the axial velocities are rather correlated with the density (and the surface tension) variation of the blends than with the Re number and the viscosity, which is considerably higher for the P–N–Ar blend in comparison with Jet A-1. This observation probably deserves to be further investigated. Experiments with different fuels in a single-cup swirl-stabilized combustor at steady-state combustion conditions [38], also revealed minimal axial velocity differences for the fuels tested, whereas, contrary to the present results, velocity measurements, in a spray produced by a pressure swirl nozzle [19], were lower for Jet A-1 fuel (having the largest kinematic viscosity) than for the other fuels tested and the differences became larger as the injection pressure was increased.
The large stars on the Jet A-1 and P blend (GTL) distributions designate axial velocity values at half of the center line value and their radial positions (r1/2) are indicative of jet spreading. Based on r1/2, the increase of pressure seems to result in lower spreading angles, and perhaps a different pattern of the jet, as will also be discussed in relation to the volumetric flux measurements. The radial position of the stars indicates that the spreading of the Jet A-1 fuel jet is always larger than that of the P blend at the same distance from the exit and for all pressures.

3.2. Axial Rms Velocity

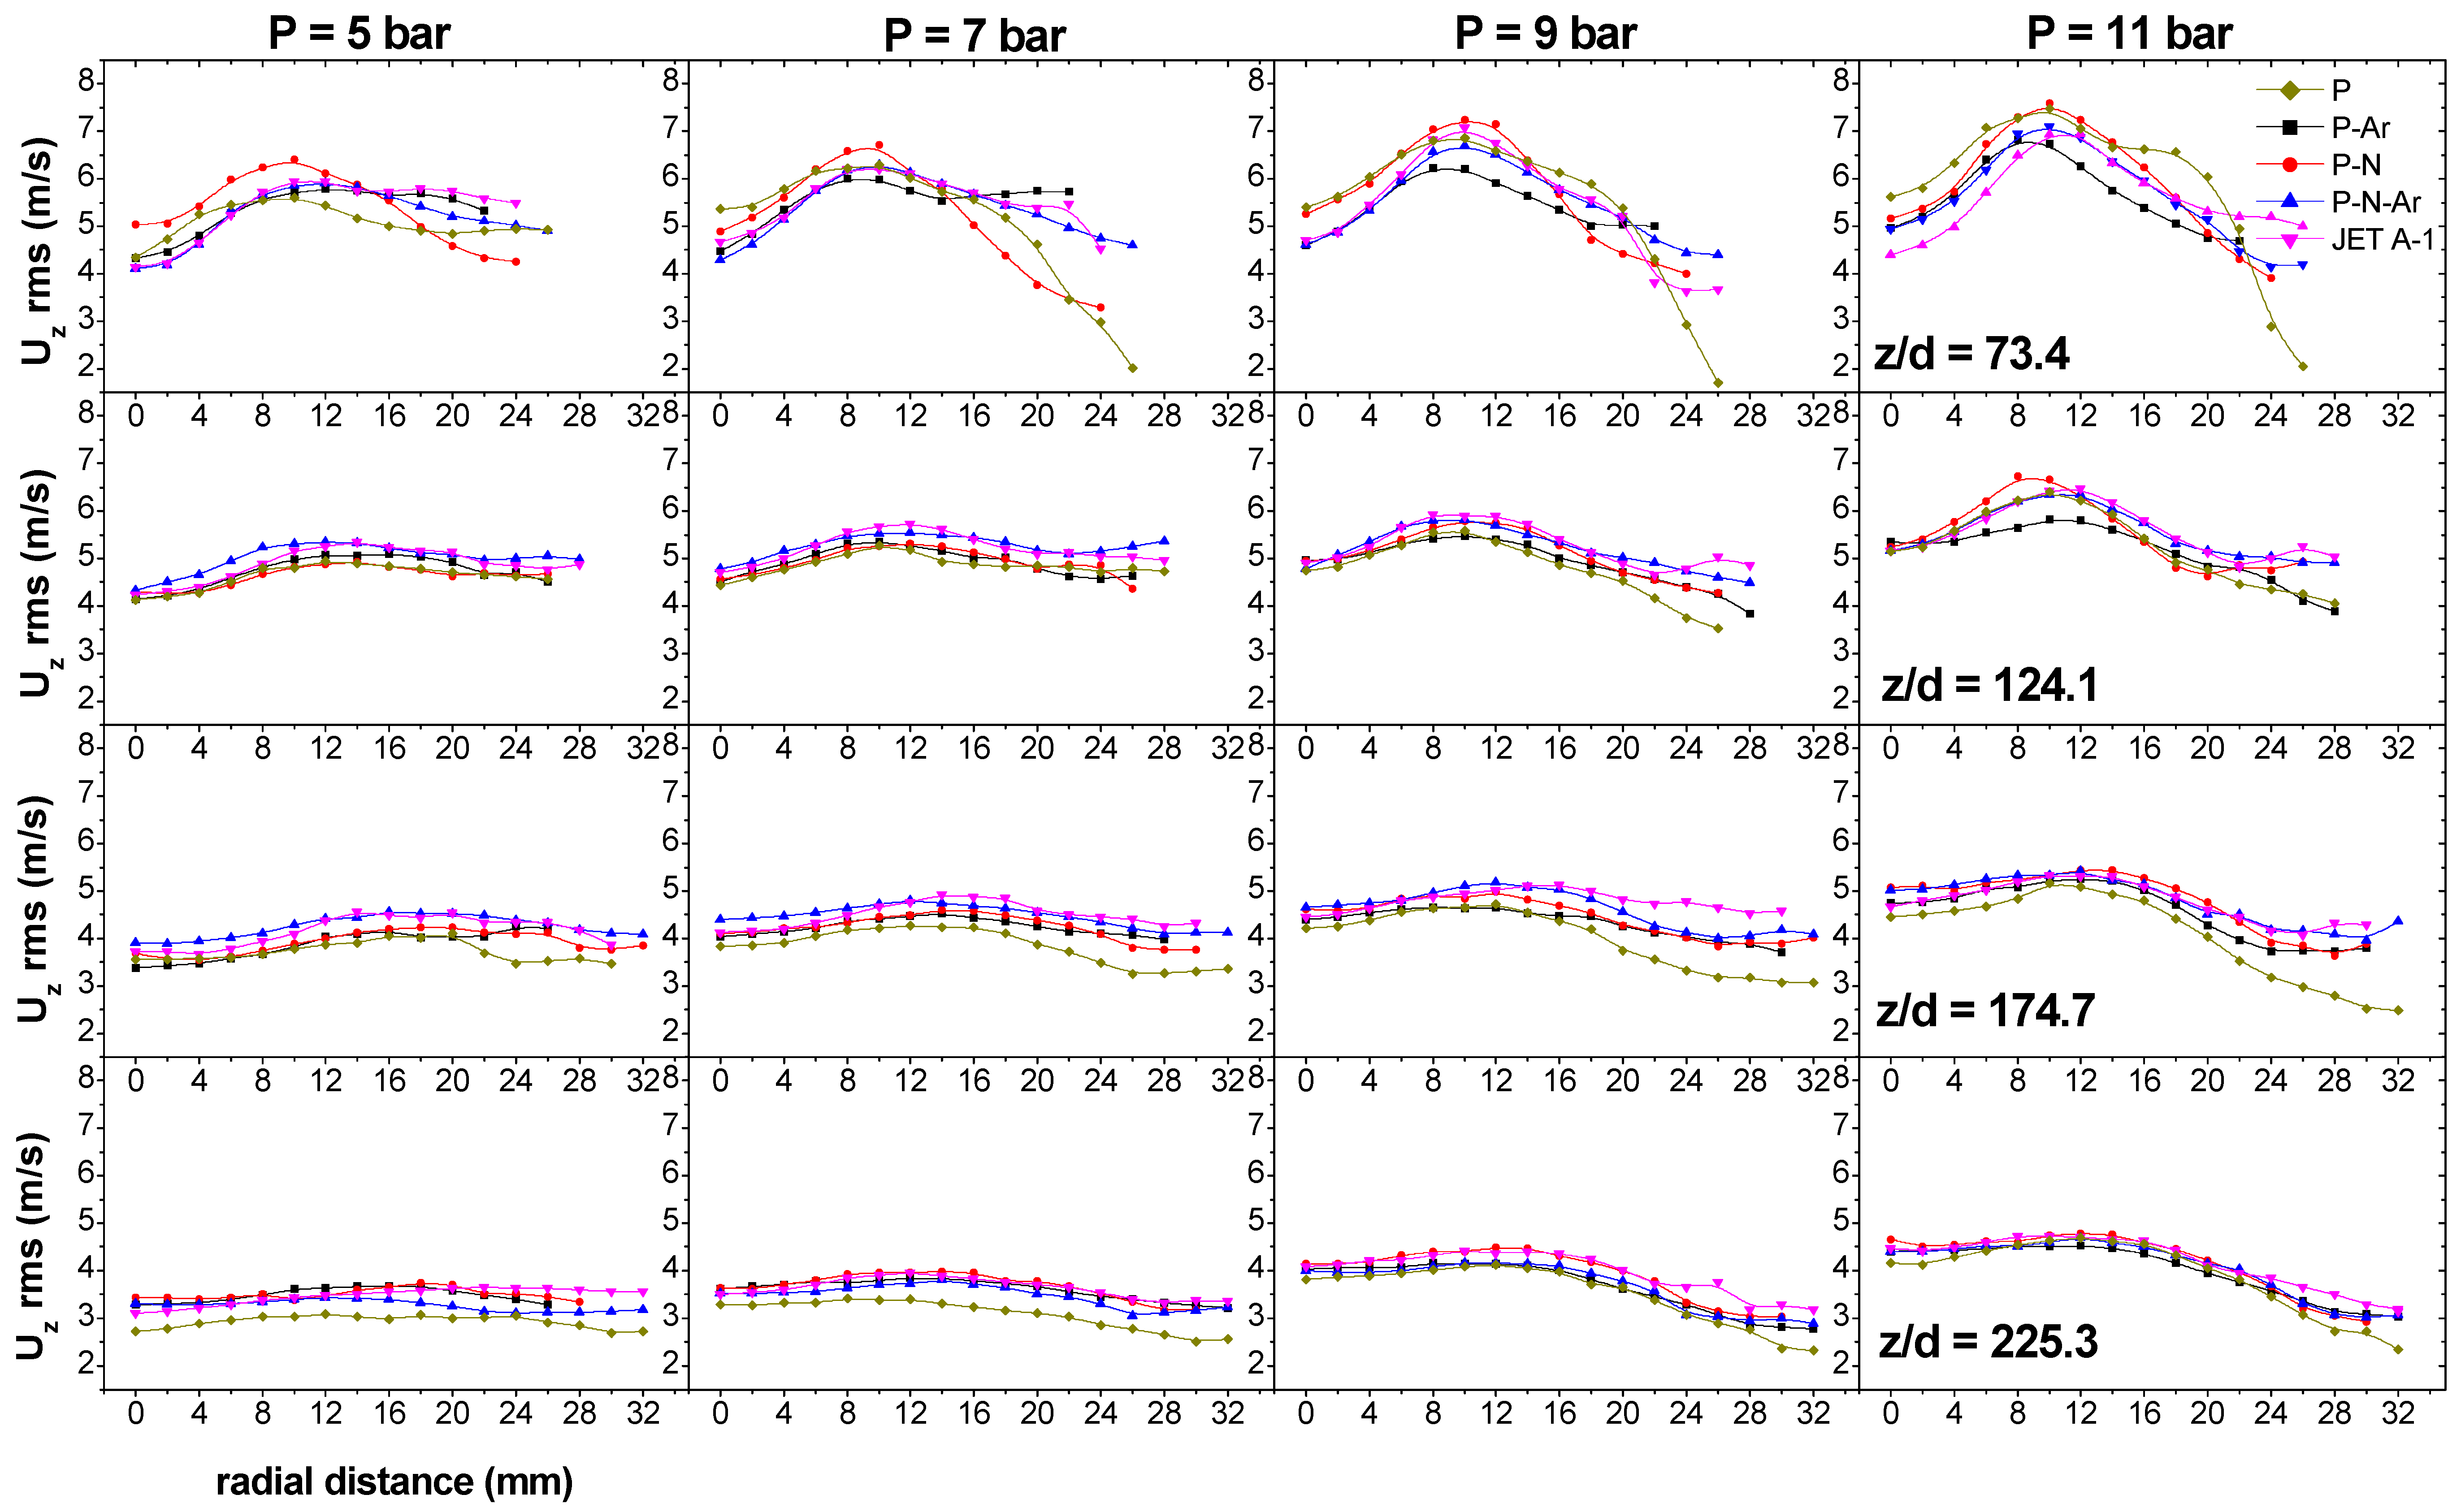
In Figure 4, the corresponding axial droplet velocity rms distributions are depicted, providing information on the turbulence and mixing characteristics of the flow field. The profiles present an off-axis peak, indicative of the shear layer developing between the jet and the ambient. The peak comes closer to the axis as the operating pressure increases and moves away from it at larger distances from the nozzle, due to jet spreading. Although the variations between the measurements for different blends persist downstream in a range of 20%–30% of peak values, the trends distinguishing particular blends are not very clear. It can be said that, as in the mean velocity measurements, Jet A-1 and the P–N–Ar blend and, to a lesser extent, the P–N blend, follow similar trends whereas the P blend, which presents relatively high values closer to the nozzle location, attains the lowest values at larger distances from the nozzle exit.

3.3. Sauter Mean Droplet Diameters

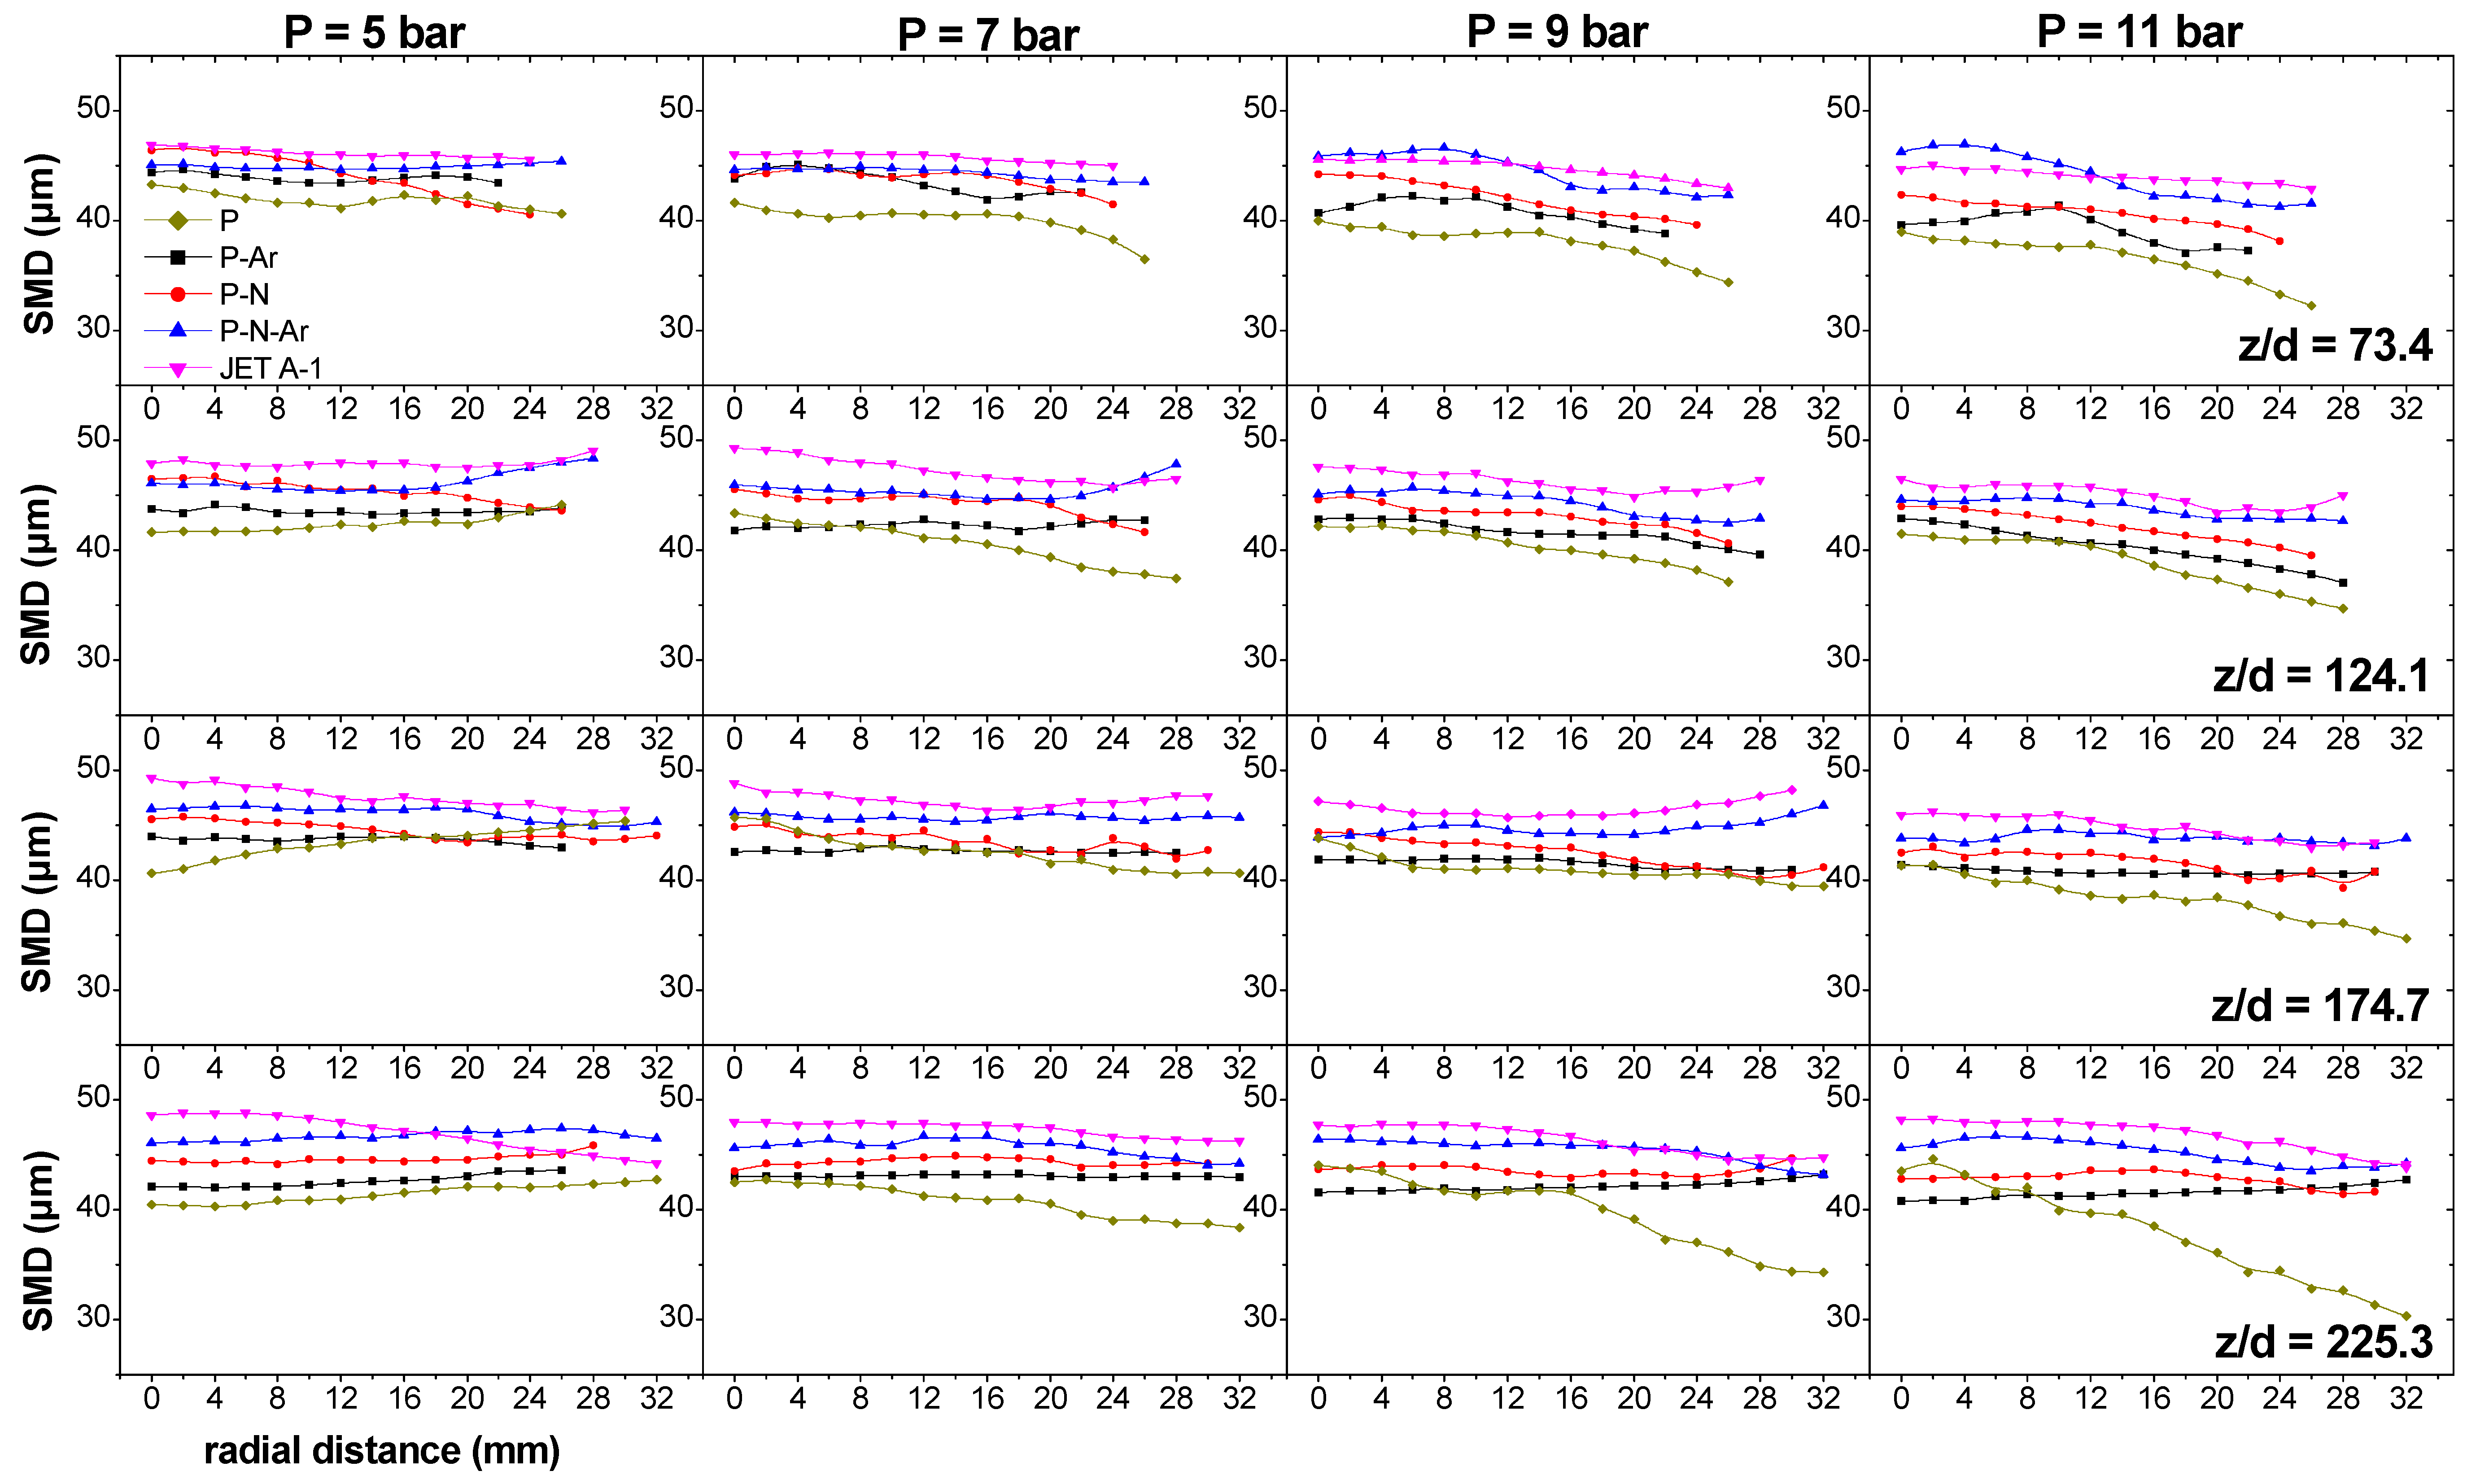
Regarding the Sauter mean droplet diameter (SMD) measurements, presented in Figure 5, the trends of the different blends seem to be clearer than for the previously presented variables. Differences between blends vary in the range 10%–20% of peak values. The size of the droplets decreases in general as the operating pressure is increased as was also observed in [39], whereas the size distribution in the radial direction, across the spray, remains more or less uniform at all measurement stations. The reference fuel Jet A-1 produces the larger droplets whereas the P–N–Ar blend produces droplets with a little smaller SMD. The SMD of the P–N blend droplets is quite similar to the latter whereas the P–Ar blend droplets and especially those of the base P blend are even smaller, diverging significantly from the reference Jet A-1 droplets’ SMD. As in the case of the axial velocity, Sauter mean diameters do not seem to correlate with the relevant non-dimensional numbers, although the trends indicate that higher surface tension fluids produce larger droplets. Sauter mean diameter measurements, in a spray from a pressure swirl nozzle, presented in [19], showed little variation for different fuels. On the other hand, measurements in sprays produced by a hybrid airblast atomizer in [23], present compatible results with the present study, indicating also a small decrease in diameter for higher injection pressure. However, experiments with the same fuels as in [23], in a single-cup swirl-stabilized combustor at steady-state combustion conditions [38], present an almost inverse relation between fuel properties and droplet sizes. It has to be noted that contrary to the above-mentioned investigations [23,38], where the droplet size histograms were skewed, in the present work the size histograms (typical samples are provided as supplementary materials, Figures S1 and S2) have, in most cases (independent of blend, pressure or location), a rather symmetric form of similar extent.

3.4. Volumetric Flux

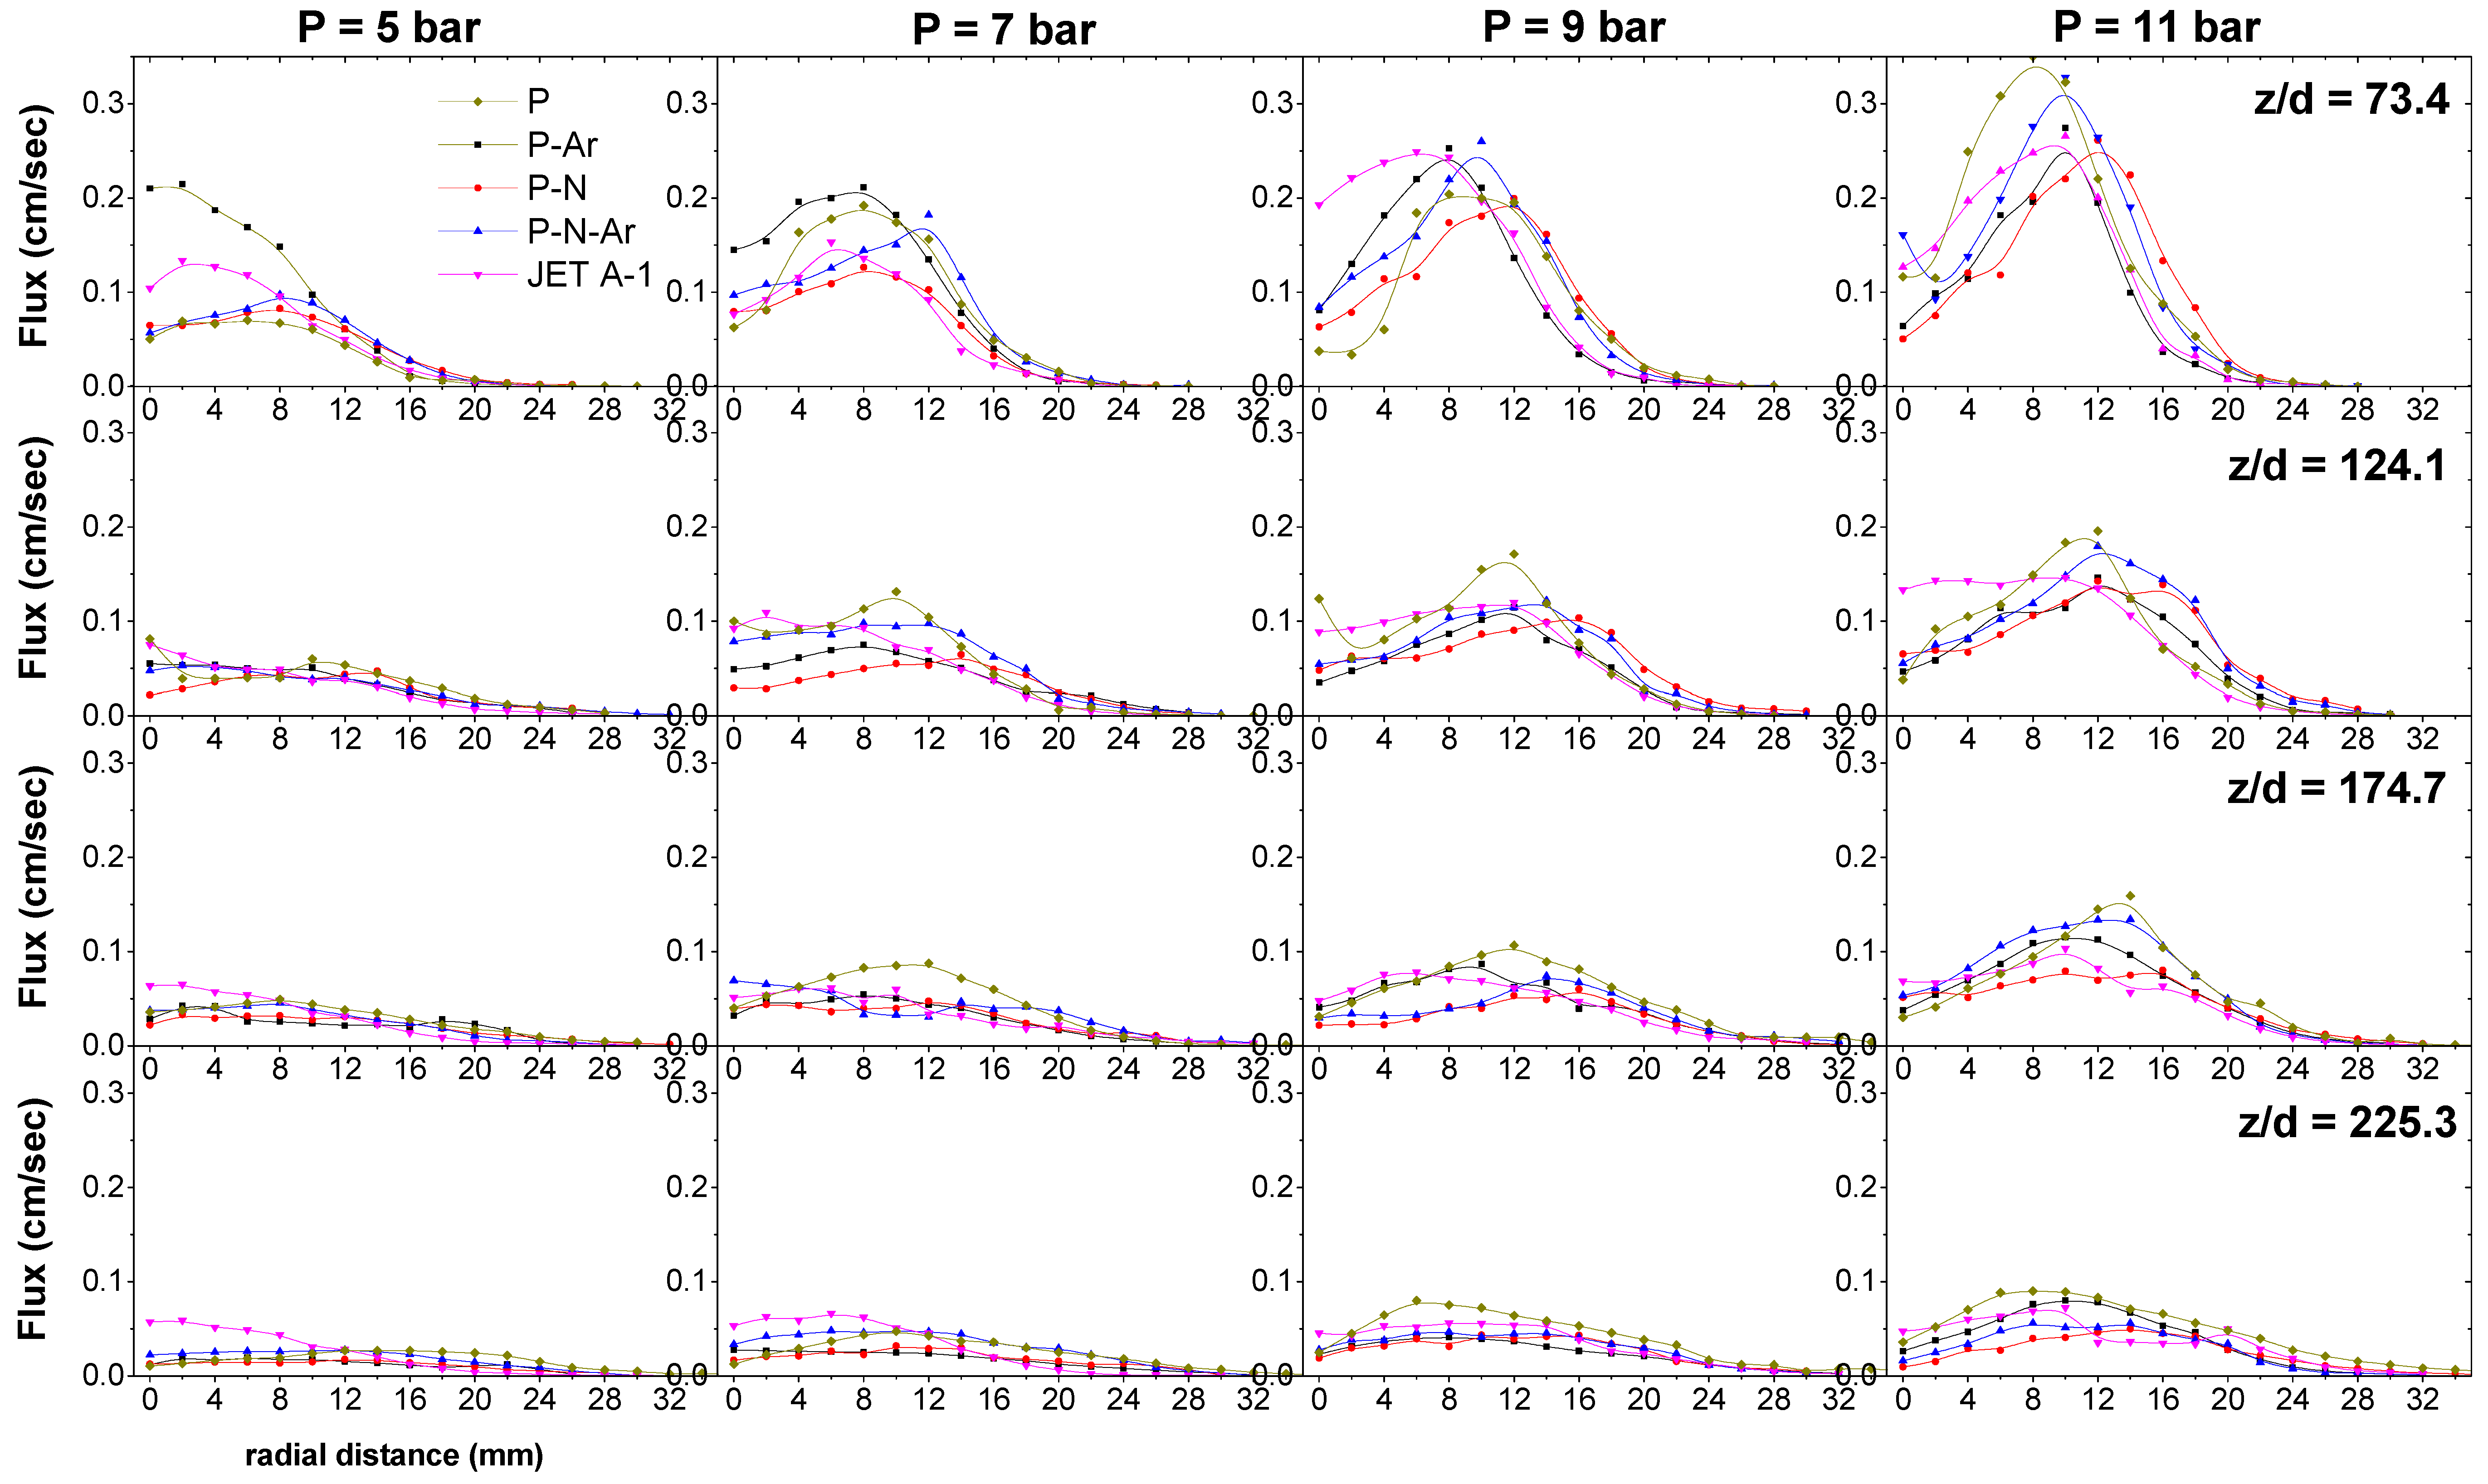
Volumetric flux measurements obtained by the PDA are presented in Figure 6, for completeness of this presentation. Given the form of the distributions and the high uncertainty associated with flux measurements with a PDA it is farfetched to try to distinguish specific blend effects. The plots indicate that although, at low injection pressure, the highest fluxes are associated with the central area of the jet, increasing the pressure results in a displacement of peak values away from the centerline, resembling the development of a hollow cone pattern, a behavior which is compatible with the different spreading observed in the axial velocity measurements. Of special interest, deserving further investigation, is the observation that although the total volumetric flux is decreasing downstream, probably due to the evaporation of the fuel droplets, this decrease is not associated with a corresponding decrease of the droplet sizes.

4. Conclusions

The spray characteristics of alternative fuel blends provided by Shell Global Solutions have been assessed experimentally in relation to currently used Jet A-1 fuel. The physical properties of the tested blends were within 10% of the reference fuel properties. The droplet mean axial velocity measurements indicate that, under the conditions used in the present study, all tested blends produce flow fields of a similar pattern, although velocity magnitude, especially in the near field, presented differences as large as 20% of the peak values, depending on the blend composition. These differences diminished downstream and at the last stations were of the order of the uncertainties. Larger differences, persisting downstream, were observed in the measurements of the axial velocity rms values, indicating small differences in the turbulence and mixing for the different blends. The composition of the blends has a distinct effect on the Sauter mean diameter of the resulting sprays. Mean diameters are clearly correlated with the blend composition. It is hard to distinguish the effect of different blends on the volumetric flux measurements, although a difference in the spray pattern due to the increase of the injection pressure can be surmised. In general, it can be said that all blends have comparable physical properties and produce similar sprays to the reference Jet A-1 fuel and as drop in fuels, may be expected to behave like the reference fuel, as far as spraying characteristics are concerned. For this purpose, the P–N–Ar blend (Paraffins, 50%–Naphthenes, 30%–Aromatics, 20%) seems to be the best candidate. It has a density and a surface tension very close to those of the reference fuel and produces a similar spray pattern, with matching droplet velocity and Sauter mean diameter distributions. It has to be noted that observed differences may have an effect on the implementation of staged combustion schemes which require precise control of the flow pattern.

Supplementary Materials

The following are available online at https://www.mdpi.com/2226-4310/4/2/18/s1, Figure S1: Droplet size distributions at three radial locations on the closest and the farthest measurement planes, for Jet A-1 fuel; Figure S2: Droplet size distributions at three radial locations on the closest and the farthest measurement planes, for P-Ar blend.

Acknowledgments

The work was funded through the ECATS (Environmentally Compatible Air Transport System–FP-6 Network of excellence) project (Project No. ANE-CT-2005-012284). The authors are grateful to Shell Global Solutions (UK) for providing the tested blends.

Author Contributions

Andreas P. Vouros contributed to the design and construction of the experimental facility. He was responsible for the experimental investigation and the post processing of the measurements. He also contributed to the writing of this paper. Alexandros P. Vouros contributed to the design of the experimental facility. He participated in the experiments and the data analysis during the post processing of measurements. Thrassos Panidis conceived and designed the experimental apparatus. He also contributed to the analysis of the results and the writing of this paper.

Conflicts of Interest

The authors declare no conflict of interest. The founding sponsors had no role in the design of the study; in the collection, analyses, or interpretation of data; in the writing of the manuscript, and in the decision to publish the results.

References

  1. Schafer, A.W. The Prospects for Biofuels in Aviation, in Biofuels for Aviation—Feedstocks, Technology and Implementation; Chuck, C.J., Ed.; Academic Press: London, UK, 2016; pp. 3–16. [Google Scholar]
  2. SWAFEA Final Report. Sustainable Way for Alternative Fuels and Energy in Aviation. 2011. Available online: http://www.icao.int/environmental-protection/GFAAF/Documents/SW_WP9_D.9.1%20Final%20report_released%20July2011.pdf (accessed on 11 December 2016).
  3. Blakey, S.; Rye, L.; Wilson, C.W. Aviation gas turbine alternative fuels: A review. Proc. Combust. Inst. 2011, 33, 2863–2885. [Google Scholar] [CrossRef]
  4. Maurice, L.Q.; Lander, H.; Edwards, T.; Harrison, W.E. Advanced aviation fuels: A look ahead via a historical perspective. Fuel 2001, 80, 747–756. [Google Scholar] [CrossRef]
  5. Gökalp, I.; Lebas, E. Alternative fuels for industrial gas turbines (AFTUR). Appl. Therm. Eng. 2004, 24, 1655–1663. [Google Scholar] [CrossRef]
  6. IATA 2010 Report on Alternative Fuels; Ref. No: 9709-03; International Air Transport Association: Montreal–Geneva, 2010; ISBN 978-92-9233-491-8. Available online: http://www.iata.org/publications/Documents/IATA%202010%20Report%20on%20Alternative%20Fuels.pdf (accessed on 11 December 2016).
  7. Chevron Alternative Jet Fuels—A Supplement to Chevron’s Aviation Fuels Technical Review. 2006. Available online: https://www.cgabusinessdesk.com/document/5719_Aviation_Addendum._webpdf.pdf (accessed on 11 December 2016).
  8. El Banhawy, Y.; Whitelaw, J.H. Experimental study of the interaction between a fuel spray and surrounding combustion air. Combust. Flame 1981, 42, 253–275. [Google Scholar] [CrossRef]
  9. Chigier, N.A.; McCreath, C.G.; Makepeace, R.W. Dynamics of droplets in burning and isothermal kerosene sprays. Combust. Flame 1974, 23, 11–16. [Google Scholar] [CrossRef]
  10. Conrad, T.; Bibik, A.; Shcherbik, D.; Lubarsky, E.; Zinn, B.T. Feasibility of intermittent active control of combustion instabilities in liquid fuelled combustors using a smart fuel injector. Proc. Combust. Inst. 2007, 31, 2223–2230. [Google Scholar] [CrossRef]
  11. Eckstein, J.; Freitag, E.; Hirsch, C.; Sattelmayer, T.R.; von der Bank, T.; Schilling, J. Forced low–frequency spray characteristics of a generic airblast swirl diffusion burner. Eng. Gas Turbines Power 2005, 127, 301–306. [Google Scholar] [CrossRef]
  12. Carl, M.; Behrendt, T.; Frodermann, M.; Heinze, J.; Hassa, C.; Meier, U.; Wolff-Gassmann, D.; Hohmann, S.; Zarzalis, N. Experimental and numerical investigation of a planar combustor sector at realistic operating conditions. J. Eng. Gas Turbines Power 2001, 123, 810–816. [Google Scholar] [CrossRef]
  13. Hardalupas, Y.; Taylor, A.M.K.P.; Whitelaw, J.H. Velocity and size characteristics of liquid–fuelled flames stabilized by a swirl burner. Proc. R. Soc. Lond. Ser. A 1990, 428, 129–155. [Google Scholar] [CrossRef]
  14. Hardalupas, Y.; Liu, C.H.; Whitelaw, J.H. Experiments with disk stabilized kerosene–fuelled flames. Combust. Sci. Technol. 1994, 97, 157–191. [Google Scholar] [CrossRef]
  15. Reitz, R.D. Modeling atomization processes in high-pressure vaporizing sprays. At. Spray Technol. 1987, 3, 309–337. [Google Scholar]
  16. Reitz, R.D.; Bracco, F.V. Mechanism of atomization of a liquid jet. Phys. Fluids 1982, 25, 1730. [Google Scholar] [CrossRef]
  17. Lefebvre, A.H. Basic processes in atomization. In Atomization and Sprays, 2nd ed.; Taylor & Francis, Hemisphere Publishing Corporation: New York, NY, USA, 1989; pp. 37–59. [Google Scholar]
  18. Sornek, R.J.; Dobashi, R.; Hirano, T. Effect of turbulence on vaporization, mixing, and combustion of liquid-fuel sprays. Combust. Flame 2000, 120, 479–491. [Google Scholar] [CrossRef]
  19. Kannaiyan, K.; Sadr, R. Effect of fuel properties on spray characteristics of alternative. At. Spray 2014, 24, 575–597. [Google Scholar] [CrossRef]
  20. Sivakumar, D.; Vankeswaram, S.K.; Sakthikumar, R.; Raghunandan, B.N. Analysis on the atomization characteristics of aviation biofuel discharging from simplex swirl atomizer. Int. J. Multiph. Flow 2015, 72, 88–96. [Google Scholar] [CrossRef]
  21. Charalampous, G.; Hardalupas, Y. How do liquid fuel physical properties affect liquid jet development in atomisers. Phys. Fluids 2016, 28, 102106. [Google Scholar] [CrossRef]
  22. Feddema, R.T. Effect of aviation fuel type and fuel injection conditions on the spray characteristics of pressure swirl and hybrid air blast fuel injectors. Master’s Thesis, Purdue University, West Lafayette, IN, USA, 2013. [Google Scholar]
  23. Buschhagen, T.; Zhang, R.Z.; Naik, S.V.; Slabaugh, C.D.; Meyer, S.E.; Gore, J.P.; Lucht, R.P. Effect of aviation fuel type and fuel injection conditions on non-reacting spray characteristics of hybrid air blast fuel injector. In Proceedings of the 54th AIAA Aerospace Sciences Meeting, AIAA SciTech Forum, San Diego, CA, USA, 4-8 January 2016. AIAA 2016-1154. [Google Scholar]
  24. Keramiotis, C.; Zannis, G.; Skevis, G.; Founti, M.A. Performance investigation of Fischer-Tropsch kerosene blends in a laboratory-scale premixed flame burner. Exp. Therm. Fluid Sci. 2013, 44, 868–874. [Google Scholar] [CrossRef]
  25. Vukadinovic, V.; Habisreuther, P.; Zarzalis, N. Experimental study on combustion characteristics of conventional and alternative liquid fuels. J. Eng. Gas Turbines Power 2012. [Google Scholar] [CrossRef]
  26. Rye, L.; Wilson, C. The influence of alternative fuel composition on gas turbine ignition performance. Fuel 2012, 96, 277–283. [Google Scholar] [CrossRef]
  27. Tropea, C.; Xu, T.-H.; Onofri, F.; Grehan, G.; Haugen, P.; Stieglmeier, M. Dual-mode phase-Doppler anemometer. Part. Part. Syst. Charact. 1996, 13, 165–170. [Google Scholar] [CrossRef]
  28. Tropea, C.; Yarin, A.L.; Foss, J.F. Velocity Vorticity and Mach Number in Handbook of Experimental Fluid Mechanics; Springer: Berlin/Heidelberg, Germany, 2007; pp. 296–309. [Google Scholar]
  29. Pitcher, G.; Wigley, G.; Saffman, M. Sensitivity of dropsize measurements by phase Doppler anemometry to refractive index changes in combusting fuel sprays. In Applications of Laser Techniques to Fluid Mechanics; Adrian, R.J., Durao, D., Durst, F., Maeda, M., Whitelaw, J., Eds.; Springer: Berlin/Heidelberg, Germany, 1991; pp. 227–247. [Google Scholar]
  30. Panidis, T.; Sommerfeld, M. The Locus of Centres Method for LDA and PDA Measurements, Developments in Laser Techniques and Fluid Mechanics; Adrian, R.J., Durao, D., Durst, F., Heitor, M.V., Maeda, M., Whitelaw, J.H., Eds.; Springer: Berlin/Heidelberg, Germany, 1997; pp. 203–220. [Google Scholar]
  31. Hardalupas, Y.; Taylor, A.M.K.P.; Whitelaw, J.H. Mass Flux, Mass Fraction and Concentration of Liquid Fuel in a Swirl—Stabilized Flame. Int. J. Multiph. Flow 1994, 20, 233–259. [Google Scholar] [CrossRef]
  32. Widmann, J.F.; Presser, C.; Leigh, S.D. Improving phase Doppler volume flux measurements in low data rate applications. Meas. Sci. Technol. 2001, 12, 1180–1190. [Google Scholar] [CrossRef]
  33. Saffman, M. Automatic calibration of LDA measurement volume size. Appl. Opt. 1987, 26, 2592–2597. [Google Scholar] [CrossRef] [PubMed]
  34. Tate, R.W. Some problems associated with the accurate representation of droplet size distributions. In Proceedings of the 2nd International Conference on Liquid Atomic and Spray Systems, Madison, WI, USA, 20–24 June 1982. [Google Scholar]
  35. Handbook of Aviation Fuel Properties. CRC Report No. 635. 2004. Available online: www.dtic.mil/dtic/tr/fulltext/u2/a429439.pdf (accessed on 27 February 2017).
  36. Ghosh, P. Colloid and Interface Science; PHI Learning: New Delhi, India, 2009. [Google Scholar]
  37. ASTM D341-03 Standard Test Method for Viscosity-Temperature Charts for Liquid Petroleum Products. 2004. Available online: www.astm.org/Standards/D341.htm (accessed on 11 December 2016).
  38. Mayhew, E.; Mitsingas, C.M.; McGann, B.; Hendershott, T.; Stouffer, S.; Wrzesinski, P.; Caswell, A.W.; Lee, T. Spray characteristics and flame structure of Jet A and alternative jet fuels. In Proceedings of the 55th AIAA Aerospace Sciences Meeting, AIAA SciTech Forum, AIAA 2017-0148, Grapevine, TX, USA, 9–13 January 2017. [Google Scholar]
  39. Wang, X.F.; Lefebvre, A.H. Influence of fuel temperature on atomization performance of pressure-swirl atomizers. J. Propuls. Power 1988, 4, 222–227. [Google Scholar] [CrossRef]
Figure 1. Schematic drawing of the experimental facility, peripherals and the phase Doppler anemometry (PDA) optical system.
Aerospace 04 00018 g001
Figure 2. Experimental setup and spray nozzle.
Aerospace 04 00018 g002
Figure 3. Axial mean velocity distributions of all testing fuels in respect to the axial distances and the injecting pressures (The large stars indicate velocities at half of the centerline value, on the Jet A-1 and P blend (GTL) distributions at corresponding radial positions, r1/2).
Aerospace 04 00018 g003
Figure 4. Axial rms velocity distributions of all testing fuels in respect to axial distances and injecting pressures.
Aerospace 04 00018 g004
Figure 5. Fuel droplet Sauter mean diameters (SMDs) of all testing fuels in respect to axial distances and injecting pressures.
Aerospace 04 00018 g005
Figure 6. Volumetric flux of all testing fuels in respect to axial distances and injecting pressures.
Aerospace 04 00018 g006
Table 1. Generic composition of Gas-To-Liquid (GTL) blends.
BlendCompound ContentMolecular Formulae
P (GTL)Paraffins (99%)C10.14H22.25
P–ArParaffins (80%) + Aromatics (20%)C10.08H20.35
P–NParaffins (60%) + Naphthenes (40%)C12.18H25.28
P–N–ArParaffins (50%) + Naphthenes (30%) + Aromatics (20%)C11.48H22.18
Table 2. Measured physical properties of the tested blends.
BlendFuel Density (15 °C)Kinematic ViscositySurface Tension (22 °C)
ρ (kg/m3)ν (cSt)σ (mN m−1)
Jet A-1821.00.99 ± 0.04 at 24.95 °C29.84 ± 0.06
P737.61.01 ± 0.04 at 25.02 °C26.28 ± 0.05
P–Ar768.70.98 ± 0.04 at 25.04 °C27.43 ± 0.04
P–N787.91.13 ± 0.04 at 20.61 °C28.87 ± 0.05
P–N–Ar805.41.15 ± 0.04 at 22.75 °C29.43 ± 0.02
Table 3. Main features of the Optical Setup.
ComponentType
LaserSourceHe–Ne
Wavelength632.8 nm
Power20 mW
Transmitting OpticsFocal length250 mm
Frequency shift40 MHz
Receiving OpticsModelPDA 57X10
Focal length310 mm
Receiving Angle67° to forward
Table 4. Estimated physical properties of the tested blends at 40 °C and non-dimensional numbers at 11 bars.
BlendFuel DensityKinematic ViscositySurface TensionExit Non-Dimensional Numbers at 11 Bars
ρ (kg/m3)ν (cSt)σ (mN m−1)ReWeOh
Jet A-1803.10.8128.454.83 × 1045.42 × 1044.82 × 10−3
P719.70.8224.894.38 × 1044.74 × 1044.97 × 10−3
P–Ar750.80.8026.044.97 × 1045.77 × 1044.83 × 10−3
P–N770.00.8627.484.51 × 1045.31 × 1045.10 × 10−3
P–N–Ar787.50.9028.044.04 × 1044.68 × 1045.35 × 10−3