Abstract
This paper presents an experimental investigation on using FOLDing wingtips sERving as cONtrol effectorS (FOLDERONS) for a mini Unmanned Aerial Vehicle (UAV). A representative off-the-shelf mini-UAV with a conventional configuration was selected. The main theme of this paper is to utilise FOLDERONS as a control effector (mainly in roll) to augment the control authority of conventional control surfaces. Furthermore, the impact of actuation rate on the effectiveness of FOLDERONS is assessed. The paper describes the preliminary and detailed design and sizing of the morphing wing. In addition, the manufacturing of the wing system and its integration with the UAV are addressed. Wind-tunnel testing in the RJ Mitchell wind-tunnel at the University of Southampton was performed. Both static (straight and sideslip) and dynamic (straight flight) tests are conducted at a range of airspeeds and Angles Of Attack (AOAs). The impact of folding wingtips on the lateral and directional stability is analysed. The main finding of this paper is that FOLDERONS are effective (especially at large dynamic pressure and AOAs) in controlling the lateral and directional stability. Finally, this study shows that FOLDERONS cannot fully replace conventional ailerons especially at low dynamic pressures, and their strong dependence on the AOA makes them prone to a roll reversal phenomena when the wing (and FOLDERONS) is operating at negative AOAs.
1. Introduction
From its inception, aviation has been influenced by nature. Early pioneers drew inspiration from the natural world, replicating patterns and mechanisms they observed. The Cody Flyer developed by Samuel Cody first flew in 1908 and is an example of how bio-inspired characteristics were used in aircraft. The wing camber could be changed by means of wire tensioners running along the wing ribs [1], much in the same way as a bird. As aviation developed, greater demand for high speed led to the development of stiffer, less adaptable aircraft structures. In the pursuit of efficiency and performance advances, the aviation industry is moving back towards bio-inspired configurations to reap the benefits of in-flight adaptation and optimisation.
The commercial aviation industry is continually striving to increase the aerodynamic efficiency to meet demanding customer requirements and stringent regulations and targets, such as the ACARE2020 [2] and the FlightPath2050 [3]. Large wingspan is a potential solution to increase the aerodynamic efficiency; however, it results in weight penalties. In addition, airport/gate restrictions limit the maximum wingspan an aircraft can have. The current trend followed by Airbus and Boeing is to build aeroplanes with larger wingspans where the wingtips can fold up on ground to meet airport restrictions and allows larger wing span in flight to maximise aerodynamic efficiency. A promising example is the Boeing 777-x, which will have folding wingtips allowing it to have a wingspan of 71.0 m compared to 64.8 m for the 777-200LR. The main research question that this paper aims to answer is: can these folding wingtips, which will definitely be added to be used only on the ground, be used in flight as control effectors to enhance the control authority of the aircraft? Therefore, this paper is an experimental investigation to assess the effectiveness of folding wingtips as control effectors.
Previous Work
Kaygan and Gatto [4] investigated the benefits and potentials of folding wingtips for control augmentation. The base aircraft used was an off-the-shelf flying wing that utilised a Zagi aerofoil section. The aircraft was then adapted to include a 0.15-m span winglet on each side of the wing (18% of the original span). They allowed the dihedral, twist and sweep of each winglet to vary as shown in Table 1.

Table 1.
Winglet’s design parameters [4].
The results of interest are for the dihedral deflection cases. The authors deflected the port winglet through the full range of dihedral angles whilst keeping the starboard winglet planar, and the results matched previous experimental work carried out by Bourdin et al. [5]. This study numerically demonstrated the potential for roll control using folding wingtips. However, the study used a flying wing platform, which implies that the outcomes are not directly applicable for conventional configurations. In addition, they did not consider the effect of sideslip and the impact of actuation rate. Furthermore, Smith et al. [6] conducted a computational study followed by experimental validation on the use of folding wingtips to enhance the aerodynamic efficiency of transport aircraft. Bourdin et al. [5] and Gatto et al. [7] investigated the use of articulated winglets for flight control and load alleviation of a flying wing. Their studies used the same baseline flying wing as was presented in [4], and the aim was to collect experimental data to prove the concept of using articulated winglets for full control. A flying wing was selected so that certain winglet deflections would cause the aerodynamic centre to move in both the span-wise and chord-wise direction, allowing pitch and roll control. A system of servos was used to actuate the articulating winglets, and the experimental results were good. The system showed a maximum roll authority (one winglet at 75 degrees dihedral) coefficient of rolling moment change of , which equates to rad. By comparing this directly to the values of an aileron on a large transport aircraft, [7], the comparability is evident. By taking into account deflection angles, it was discussed that ailerons are more efficient per degree of deflection. This study successfully proves the validity of flying wing aircraft control using articulated winglets. The results observed are not directly applicable to conventional configuration aircraft, but prove promise in this field of research. A more extensive review on folding wingtips and dihedral morphing technologies (applications and concepts) is given in Barbarino et al. [8] and Ajaj et al. [9].
It is evident from the discussion above that the study of folding wingtips is a relatively uncharted, but promising field of research. Both experimental and theoretical studies have been conducted with promising results, proving the potential benefits of these systems. It is clear that there is a lack of data regarding the effectiveness of folding wingtips on a conventional aircraft configuration (fuselage, wings and tail), and no research has been carried out into the impact of these systems during a sideslip scenario. In addition, there is no knowledge of the impact of high speed actuation on folding wingtip effectiveness.
2. Materials and Methods
2.1. Unmanned Aerial Vehicle (UAV) Platform
The developed winglet system has been integrated into an existing UAV platform. A conventional configuration aircraft was selected instead of a flying wing, as it provides the most representative case, and the results can be scaled to suit larger conventional aircraft. The selection process was based around the size constraints of the RJ Mitchell wind tunnel and ensuring that the platform does not place unnecessary constraints on the actuation mechanism, mainly relating to the planform shape (e.g., high sweep angle). The platform selected was the Seagull Arising Star and can be seen in Figure 1. The chosen platform is a highly regarded trainer aircraft with a rectangular wing planform. The low aspect ratio wing means that the tip vortex is strong, and it will receive large benefits from the addition of winglets [10].
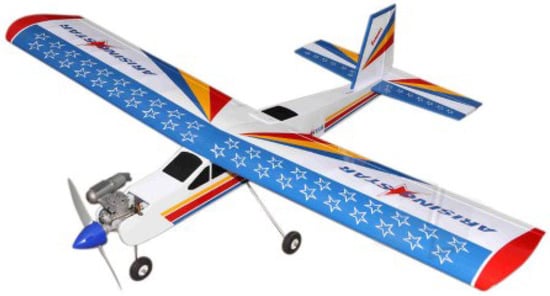
Figure 1.
Seagull Arising Star V2 Unmanned Aerial Vehicle (UAV) platform [11].
The Arising Star has a 1.6-m span wing. The design parameters of the aircraft are listed in Table 2. The aerofoil used on the wing has a flat lower surface and a cambered upper surface. For simplicity, a modified wing design is used to replace the baseline wing whilst keeping all other components of the aircraft similar to the original design. In the modified wing, the baseline aerofoil profile has been replaced with a NACA0018 symmetric aerofoil to maximise the internal volume of the wing. It should be noted that the baseline wing has approximately 5 degrees of dihedral, whereas the modified wing has no dihedral. This is mainly to simplify the design and manufacturing of the actuation mechanism. The modified wing consists of two main parts: the main wing and the FOLDing wingtips sERving as cONtrol effectorS (FOLDERONS). The main wing has a wingspan of 1.6 m and a chord of 0.26 m (similar to the baseline wing). As stated earlier, both the main wing and the FOLDERONS have a NACA0018 aerofoil.

Table 2.
Baseline wing specification and flight speed of the UAV.
2.2. FOLDERONS
The dimensions (span, root chord, taper ratio and leading edge sweep) of the FOLDERONS have been extracted from aircraft conceptual design sources, mainly Raymer [10]. Table 3 details the geometric parameters of the FOLDERONS.

Table 3.
FOLDERONS geometry.
A conceptual design phase was carried out to develop the actuation system, and the concepts developed offer a wide range of solutions to the proposed problem, each with their own merits. A down-select process was then carried out to develop the final concept.
2.2.1. Actuation Concepts
Concept 1
Concept 1, shown in Figure 2, investigates the use of hinge line actuators to develop the rotational torque required. The advantage of this design is that the direct connection between the actuators and the hinge line mitigates additional transmission losses, making the system more efficient. The biggest disadvantage is the loss in winglet area due to the mounting position of the actuator. The majority of the recovered vortex energy is located near the trailing edge of the wing, so provided this loss in area is kept relatively small, this is acceptable. A further disadvantage by locating the actuator in this position is that it is susceptible to damage should the aircraft have a tip strike upon landing or take off. In addition, the actuator mass will maximise the root bending moment in this position.

Figure 2.
Concept 1 utilising hinge line actuators (top view).
Concept 2
Concept 2, shown in Figure 3, aims to maximise the winglet surface area and bring the actuation components inboard. A system of timing pulleys and belts has been used to transfer the actuation torque to the hinge line. In comparison to Concept 1, higher transmission losses will be observed, and this is to be controlled through the use of bearings. There are bearings placed next to the actuator to ensure there is no lateral load placed on the actuator itself. Regular maintenance to check belt tensioning and to service the bearings is a major disadvantage to this design.
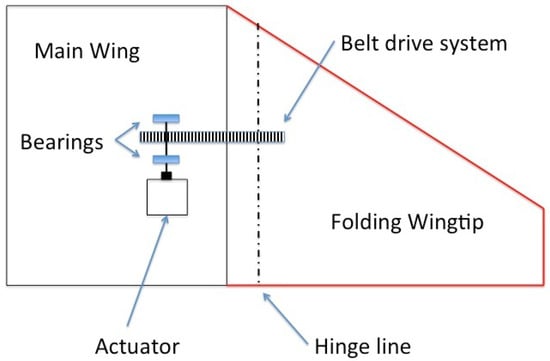
Figure 3.
Concept 2 using a system of pulley gears (top view).
Concept 3
Concept 3, shown in Figure 4, uses a worm drive to transfer the torque. The major advantage to this system is the power off locking capability. If the lead angle on the screw is selected carefully, the wheel cannot rotate unless the screw is actively driven. This means zero power is required for the system when remaining in one position. These benefits for the current application might however be limited as the system will be continually changing state. The worm drive acts to gear the system, enabling larger torques to be developed. This could be advantageous by allowing a less powerful (smaller) actuator to be used, but it will also make the system slower. The paper focuses on high speed actuation, so this is a major issue. The mounting arrangement of worm gears means that the actuator must sit below or above the centreline; this reduces the already limited size available to fit an actuator.
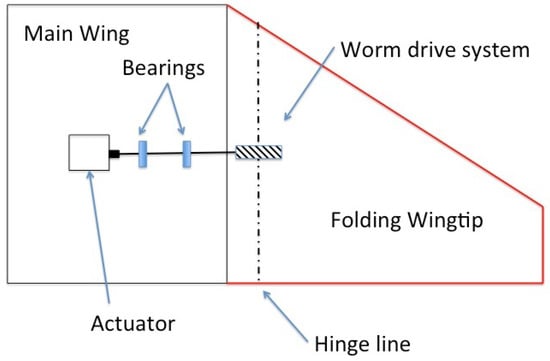
Figure 4.
Concept 3 using a worm gear system (top view).
Downselect
To select the optimal solution, the design concepts were rated against the following design requirements; cost, complexity, estimated mass, robustness and effectiveness. A binary weighting matrix was used to generate a prioritised list of requirements. Following this, a design matrix was used to select the final solution based on its ability to meet the requirements. The optimal solution to meet these requirements is Concept 2, the belt drive solution. The design matrix can be seen in Table 4 and Table 5.

Table 4.
Suitability of the designs to meet the requirements.

Table 5.
Final mapped design suitability.
2.2.2. Gap Covering Concepts
The space between the tip of the main wing and the root of the winglet is a critical region. With any form of actuation, there will be a gap between these parts allowing air to escape through and reduce the efficiency. The level to which this gap has an impact is yet to be quantified, but consideration has been given to the problem. Two major ideas have been investigated to solve this problem. The first is to completely cover the region using some form of skin. The second is to reduce the gap to as little as possible.
Fully-Covered Method
Previous studies have shown that corrugations are an effective method to bridge the gap, but are aerodynamically poor according to Ursache et al. [12] and should be avoided. Flexible skin, such as latex, is an idea investigated by the authors with a moderate amount of success, as shown in Figure 5. This is aerodynamically superior to corrugations, but the amount of tension required to keep a smooth surface during high dihedral folding is excessive. This method places significant extra loading on the actuation components, leading to larger actuators, which reduces any potential aerodynamic efficiency benefit. Another concept investigated is the use of a retractable skin; this mitigates the issues relating to the flexible skin tensioning, but introduces significant complexity. The conclusion is that until the impact of not covering the area is quantified and shown to be significant, there is not a viable solution when considering mass and complexity.
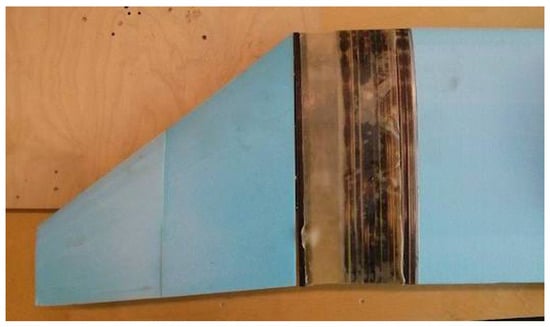
Figure 5.
Flexible latex skin investigation.
Gap Reduction Method
The alternative method is to not directly solve the problem, but to reduce the impact of it. This method aims to reduce the gap between the wingtip and the winglet to minimise the leakage between the upper and lower surfaces. The challenging part to this paper was that the wingtip is designed to move 180 degrees, and a gap reduction method must account for this. The concept generated acts in a similar way to classical aileron hinges, utilising a semicircular leading edge. Due to the high degree of dihedral proposed for the system, a wingtip section encapsulating the semicircular profile is not possible in the same way as it is on ailerons. The concept uses a vertical face on the inboard section to allow the full 180 degree motion required. The semicircular section on the wingtip ensures that a minimal gap is maintained through all angular displacements. These concepts can be seen in Figure 6.
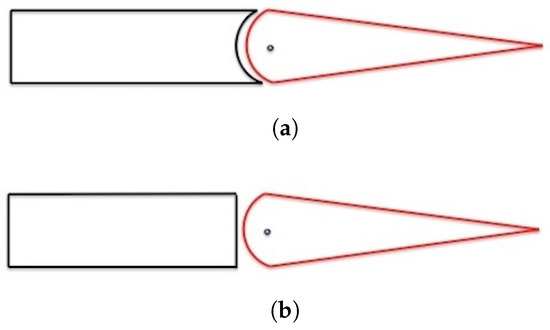
Figure 6.
Gap reduction hinge designs. (a) Aileron-style hinge with encapsulating inboard section preventing full range of motion (front view); (b) selected hinge style to enable full range of motion (front view).
2.3. Modelling and Sizing
The tornado Vortex Lattice Method (VLM) has been used to estimate aerodynamic loads. Tornado is the vortex lattice method software programmed in MATLAB; it was selected due to its fast solving time and ability to be controlled through custom MATLAB scripts. Tornado VLM models the wing as thin sheet of discrete vortices and computes the pressure and force distributions around the whole body. In addition, it provides the aerodynamic and stability derivatives of the aircraft. For robust structural sizing of the wing system, the ultimate operating condition for this aircraft (in flight and in wind-tunnel testing), which corresponds to 15 degrees AOA and a 20-m/s airspeed, has been identified. After inputting the geometry and the test conditions through a binary-based user interface, the simulation can be run in very little time. The aerodynamic loads extracted from Tornado are used to size the wing/wingtip structure and to size the actuation system. At 20 m/s and 15 degrees AOA, the main wing lift (without the wingtips) is 117.4 N, and the wingtip lift is 6 N.
2.3.1. Structural Layout
The wind-tunnel prototype has two mounting ribs located on the main wing to allow attachment and load transfer to the overhead load cell. The aerodynamic loads generated by the main lifting surface are transferred to these ribs via two main wing spars running the full span of the wing, as shown in Figure 7a. Mounted directly onto the ends of the spars are the folding wingtips and associated actuation components for efficient load transfer. The fuselage complete with tail surfaces and landing gear is mounted underneath the wing using 8 diagonally-placed rubber bands. This attachment method is identical to the original aircraft and one that was shown to be structurally robust.

Figure 7.
Main wing structural layout. (a) Wing structure including main spars and ribs; (b) main wing cross-section showing internal cut outs for main spars and electrical cable runs.
2.3.2. Spar Sizing
The 2 main spars give the wing structural rigidity and allow the aerodynamic loads to be transferred from the extruded polystyrene wing profiles to the overhead load cell. The spars have been sized using classical bending theory and a number of assumptions to analyse commercially available tubing:
Modelling assumptions:
- The wing is treated as a half span cantilever beam;
- The 2 spars share the load equally;
- A safety factor of 1.25 is used due to the unmanned nature of the aircraft [13].
2.3.3. Actuation Components
The torque required was calculated by summing the elementary factors of moments around the wingtip hinge line whilst operating at 20 m/s and 15 degrees AOA (worst case scenario). All forces were assumed to act at the midspan of the wingtip creating a conservative requirement. In addition, a 20% safety factor was included in the final value to account for any uncertainties and prevent transmission slip [14]. The final torque requirement was 1.459 Nm.
From the finalised torque requirement, an actuator and transmission system were sized. The servo motor selected was the DFROBOT 180 degree standard servo that can supply 1.47 Nm of torque when supplied with 7.2 V. The pulleys and timing belt combination have been sized for a 1:1 ratio, and this has been completed as follows. The value of specific torque taken from a relevant manufacturer data sheet is 1.7, and through analysing the systems available, the final system was designed. It was found that a 1 cm-wide belt coupled with two 14-tooth T5 timing pulleys provided the smallest system capable of meeting the requirement. The transmission system specified is able to transfer 1.67 Nm of torque, 15% higher than the maximum servo torque.
2.4. Wind Tunnel Demonstrator
The prototype has been designed with modularity being a key philosophy. Units can be removed for modification or maintenance purposes. The main wing is constructed from 2 spars running through extruded polystyrene foam, and secured onto the tips of the main wing are the FOLDERONS, which house all of the actuation components and the wingtip itself. Two wind tunnel mounting ribs are secured directly to the spars and act to transfer load to the overhead wind tunnel balance. The final wing can be seen in Figure 8.
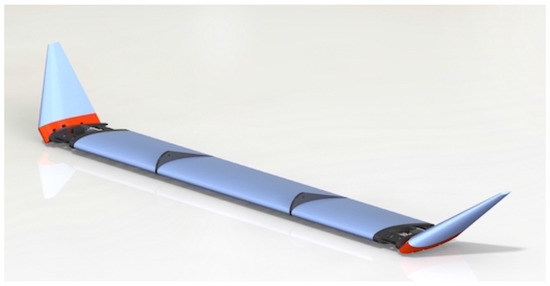
Figure 8.
Full prototype design.
2.4.1. FOLDERONS Structure
The structural components of the FOLDERONS are manufactured from laser-cut 6-mm birch plywood. Laser cutting was chosen due to its low cost and high accuracy; an accuracy of mm is achievable depending on the material. This method combined with Computer-Aided Design (CAD) allows complex wood joints to be created with relative ease. Finger joints were integrated into the supporting braces to connect them securely to the main ribs. The finger joints significantly increase the surface area available for glueing, and this, combined with the interlocking element between components, makes them very strong. The resultant part can be seen in Figure 9.

Figure 9.
FOLDERONS structure manufactured from 6-mm birch plywood. (a) Inboard side of the FOLDERONS structure; (b) internal joint structure; (c) outboard side of the FOLDERONS structure.
The next stage in the FOLDERONS manufacture was to install the actuation components. The bearing rod ends were installed into the pre-cut mounting holes using nuts and washers. Following the bearing installation, a custom rotating bar was manufactured using a lathe. The bar was manufactured from 8-mm mild steel and sized to fit between the two outboard bearings with a 5-mm thread cut into both ends to secure it in place. The timing pulleys and belt were then installed and secured using a grub screw. The servo motors were installed into the FOLDERONS using a Computer Numeric Control (CNC) machined aluminium mount secured in place using 4 mounting bolts. Four mounting points provide a secure base for the actuator and prevent any movement resulting from torque reactions. The actuator was connected directly to the inner pulley drive shaft via a quarter inch brass shaft connector and 4-mm grub screw. The installation can be seen in Figure 10.

Figure 10.
Final installation of the servo motor actuator. (a) Final actuator installation; (b) countersunk actuator mounting bolts.
To secure the FOLDERONS to the main wing, two 6-mm neodymium magnets were installed. A custom-made 3 pin connector was developed and installed to allow the FOLDERONS electrical connection to be easily connected and disconnected, as shown in Figure 11.
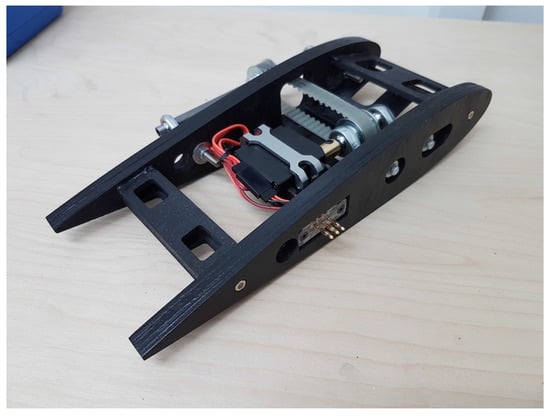
Figure 11.
Assembled modular tip unit.
The wingtip was cut using CNC hot wire cutting, and the process created a burn away channel in the surface. To rectify this, a polyester filler was used to create a smooth aerodynamic finish. The gap reduction module was 3D printed out of ABS plastic to allow complex internal geometry. Before the wingtip spars were installed, shaft couplers were welded on to enable the entire wingtip section to be removed for modification or maintenance. The spars were then bonded into the gap reduction module and wingtip section to form the final component. Plastic covers were secured onto the units to cover the actuation components.
2.4.2. Main Wing
The main wing is manufactured from extruded styrofoam, and the process was completed by CNC hot wire cutting due to its high precision. The material was selected due to its low cost and compatibility with hot wire cutting. Each section has an internal cut out for both spars and an internal wiring channel for electrical connections. These sections were glued onto the spars along with the wind tunnel mounting ribs to form the final wing. The channel left by the wire cutting process has been smoothed using a polyester filler, as shown in Figure 12.
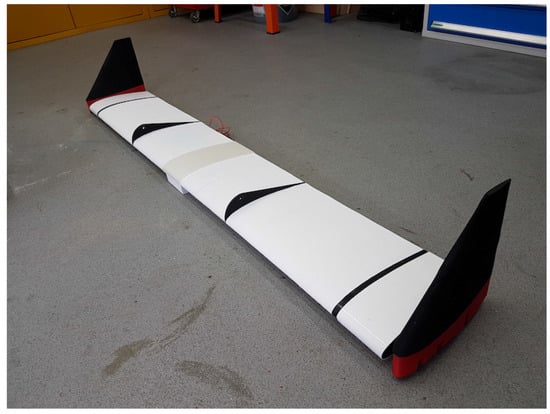
Figure 12.
Assembled wing.
An Arduino was used to control the actuators, and a series of codes was developed to allow specific tests to be carried out. Once the final assembly was finished, bench testing was completed to tune the control codes and correctly tension the belt drive transmission. A control schematic and image of the Arduino can be seen in Figure 13.

Figure 13.
Arduino controller used during testing. (a) A schematic to show the electrical connections of 2 servo motors and an Arduino; (b) the Arduino layout during tunnel testing.
3. Wind Tunnel Testing
The RJ Mitchell wind tunnel at the University of Southampton was used for testing the prototype. A six-axis load cell with a data acquisition rate of 1 kHz was mounted on an overhead turntable, allowing sideslip tests. The turntable ensures that during sideslip testing, the forces and moments are measured in the body axes and not the tunnel axes. The prototype was mounted using two main vertical struts attached to the mounting ribs of the main wing and a tail strut attached to the rear of the fuselage, as shown in Figure 14. The tail strut enabled the AOA to be adjusted from outside the tunnel (control room). The testing was completed without an engine or propeller being installed, and the resulting data neglect these features. Prior to testing, the load cell was calibrated, and tare values at all conditions were recorded. Three types of testing were conducted to analyse the effectiveness of FOLDERONS: static testing (with and without sideslipping) and dynamic testing. In the static testing, the FOLDERONS angles are adjusted without recording the variations in forces and moments. On the other hand, in the dynamic testing, the time variation of the forces and moments is captured as the angles of the FOLDERONS are adjusted. During each test, the following data were recorded; lift (N), drag (N), side force (N), rolling moment (Nm), yawing moment (Nm) and pitching moment (Nm).
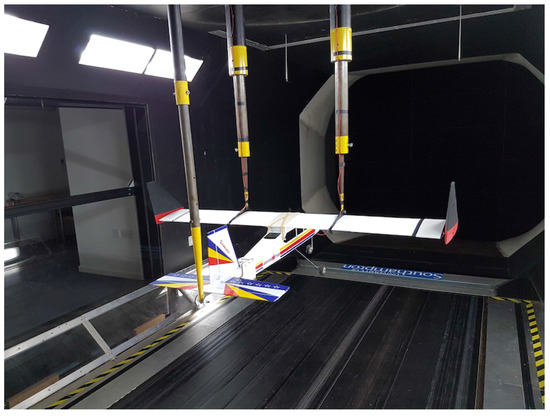
Figure 14.
UAV Installation in the RJ Mitchell Tunnel.
3.1. Static Testing: No Sideslip
In this part of static testing, the aircraft is assumed to be in straight flight (no sideslip). Different FOLDERONS angles, airspeeds and AOA’s are studied to understand the behaviour of FOLDERONS at take off, climb and cruise. The testing parameters are shown in Table 6 below.

Table 6.
Static testing parameters.
The static testing process was an iterative one. Firstly, the AOA and airspeed were set to desired values. Once the airspeed had settled, the wingtip actuation code was uploaded to iterate through all possible wingtip configurations, as specified in Table 6. The code was set to pause at each configuration for a 15-s interval, during which data were recorded. A 5-s dataset was recorded at 1 kHz (5000 data points) and then averaged automatically before being appended into a text file. An example of the test configurations can be seen in Figure 15.
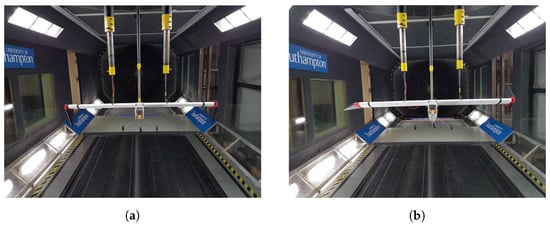
Figure 15.
An example of static deflection cases. (a) Symmetric deflection; (b) asymmetric deflection.
3.2. Static Testing: Sideslip
The sideslip testing procedure was almost identical to that of static testing, the only difference being the addition of the sideslip angle variable. A range of test variables was used to gather data over various flight phases, and the details of these can be seen in Table 7.

Table 7.
Sideslip testing parameters.
3.3. Dynamic Testing
The final testing series was to investigate the aerodynamic impact of high speed actuation. In order to test this, the same airspeed and AOA values as presented in Table 6 were used to allow comparisons between static and dynamic data to be made. The wingtip configurations, however, took a different form. One wingtip was set to move to a position and hold whilst the other wingtip completed a full speed sweep from −90 to +90 degrees, during which data were collected. The aim of this test series is to gain insight into the transient behaviour, so for each test case, the raw data were captured without an automated averaging process. A four-second data window was captured to allow sufficient time before and after the event to make post-processing more effective. The speed of actuation was kept constant to reduce the number of variables, and a full 180 degree sweep was recorded to take 0.79 s at zero degrees AOA.
4. Results and Discussion
4.1. Static Forces as a Result of Wingtip Folding
4.1.1. Rolling Moment Variation
The data presented in Figure 16, Figure 17, Figure 18 and Figure 19 is the rolling moment coefficient variation for all four AOA cases at a 15-m/s airspeed. The data trends for all three airspeeds are nearly identical, with only their magnitudes varying. For this reason, only one data-set has been repeated here. Each data series within a plot represents the rolling moment coefficient variation with a constant port dihedral and varying starboard dihedral angle. The legend below the figure describes the port dihedral state.
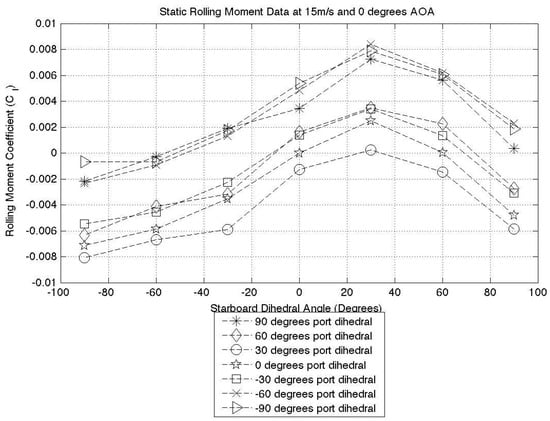
Figure 16.
Zero degrees AOA static test results.
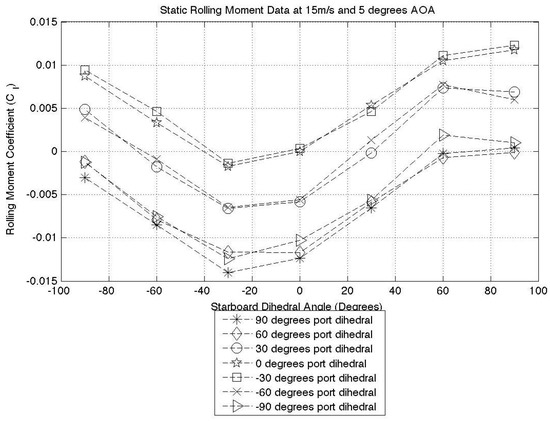
Figure 17.
Five degrees AOA static test results.
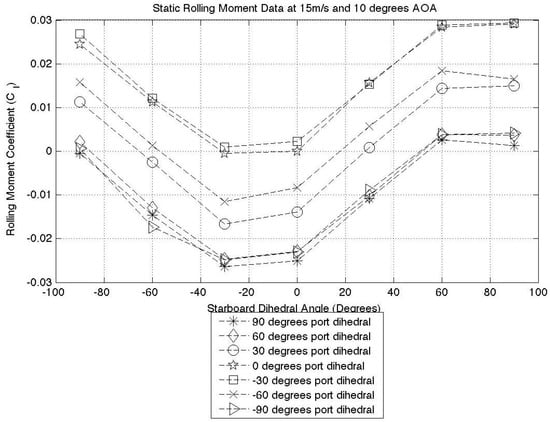
Figure 18.
Ten degrees AOA static test results.
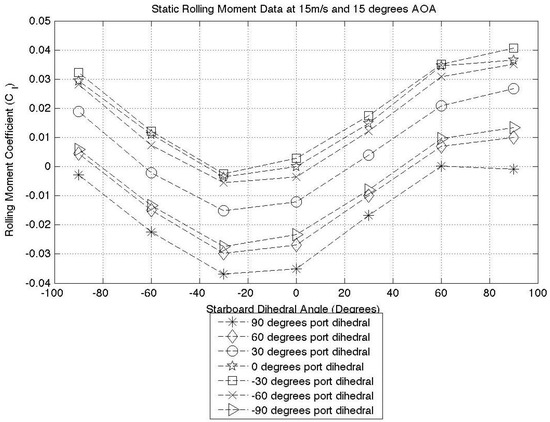
Figure 19.
Fifteen degrees AOA static test results.
By observing Figure 17, Figure 18 and Figure 19, it is evident that for each port winglet data series, the minimum point lies at negative 30 degrees starboard dihedral. This minimum point represents the position where the starboard wingtip is producing maximum lift and the rolling moment coefficient is at its greatest and in an anti-clockwise direction. This observation is valid for almost all cases where the AOA . In all of the zero degree AOA cases (over all three airspeeds) instead of the minimum lying at negative 30 degrees dihedral, there is a maximum observed at positive 30 degrees dihedral. This can be seen in Figure 16. The switch from a minimum to a maximum shows that the aircraft is producing a rolling moment in the opposite direction to the higher AOA cases. From this, we can conclude that the aircraft is producing down force and thus explaining the shift from a minima to a maxima. This also explains why the aircraft is now producing its maximum rolling moment at positive 30 degrees. By taking the case of zero degrees port dihedral and ninety degrees starboard dihedral at a positive angle of attack, the aircraft will produce a clockwise rolling moment. At a negative angle of attack, this same configuration produces an anti-clockwise rolling moment. From a pilot’s (or autopilot’s) perspective, this has the potential to cause a dangerous situation. This must therefore be considered in an aircraft flight control system.
The main conclusion that can be drawn from this testing case is that max(Lift) is almost always achieved at a wingtip dihedral angle of degrees, not at zero degrees, as might be expected. It should be noted that due to the dihedral increments of 30 degrees used in this study, the true maximum lift value might lie somewhere between zero and 30 degrees, but we can conclude that it does not lie at zero degrees.
4.1.2. Aileron Comparison
Table 8 below shows the maximum port (negative) and starboard (positive) rolling moment coefficient recorded at each airspeed and AOA. By observing the table, it can be seen that the magnitude increases with airspeed and AOA, as expected.

Table 8.
Maximum and minimum rolling moment coefficients at different flight conditions.
The rolling moment coefficient range achieved with FOLDERONS is . This is around 2.5-times smaller than the rolling moment coefficient achieved with conventional ailerons, which can produce a moment coefficient range of around [7]. This clearly shows that FOLDERONS cannot fully replace conventional ailerons, but can augment their performance, which allows smaller ailerons and, hence, lighter wing design to be achieved.
The poor performance observed at low AOA and low dynamic pressure can be explained using the approximate rolling moment equation in Equation (1). The equation assumes that the wingtips’ AOA is the same as the main wing. Equation (1) shows that the rolling moment is directly proportional to AOA and dynamic pressure. For a given airspeed, the rolling moment generated by an aileron deflection is independent of the AOA of the main wing (only for the linear aerodynamic region). On the contrary, for a given airspeed, the rolling moment generated by FOLDERONS is dependent on the instantaneous AOA of the wing. This is a critical point highlighted by Equation (1). To alleviate this problem, the AOA of the wingtip could be changed at certain flight conditions, but this would add significant complexity and will make the aircraft prone to tip stall.
The conclusion can therefore be made that on a conventional aircraft, FOLDERONS cannot be used as a substitute for ailerons at low airspeeds and AOA, but have the potential to become a large contributor to rolling moment generation at high airspeed and AOA scenarios.
4.2. The Effect of Folding Wingtips on Aircraft Stability during a Sideslip Scenario
The sideslip analysis consists of two parts, the directional stability and the lateral stability. The changes in stability values as a direct result of wingtip folding are the critical aim, not the stability values themselves. In the following discussion, a sideslip occurs when the aircraft nose is pointing to the right of the oncoming airflow and by convention is referred to as a negative sideslip.
4.2.1. Lateral Stability
Figure 20 and Figure 21 show a comparison of the lateral stability for five degrees and 10 degrees sideslip, respectively. Both cases are at a 10-m/s airspeed and 10 degrees AOA, and both are a representation of the trends seen in all data cases. The baseline wing is the main wing with the wingtip devices fully removed.
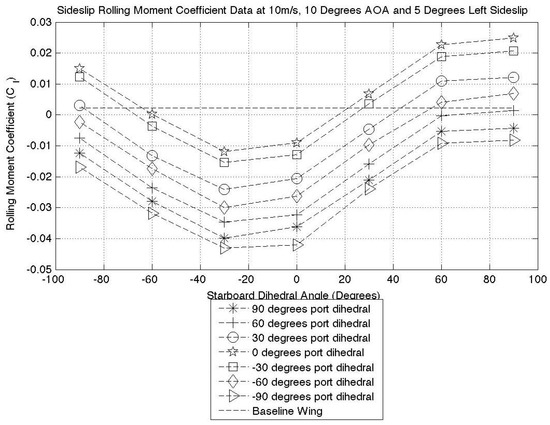
Figure 20.
Five degrees sideslip rolling moment coefficient.

Figure 21.
Ten degrees sideslip rolling moment coefficient.
By observing the baseline wing data line, it can be seen that the aircraft is only producing a small restoring moment, and the removal of the dihedral is likely to have caused this. Both Figure 20 and Figure 21 clearly show that at certain configurations, the wingtips can produce a sideslip restoring moment. They also show how the wingtips can induce an instability. By observing the data, the configuration producing maximum restoring moment is a low port dihedral (0 or ) and a high positive starboard dihedral angle (60 or 90), the combination of which is dependent on flight condition. This broadly agrees with the results found in the static data analysis regarding rolling moment at zero degrees sideslip.
By symmetrically deflecting the FOLDERONS upward, the aircraft is temporarily increasing its level of dihedral at the outer portions of the wing. The data generated show that through symmetric deflection, the dihedral effect can be observed. By symmetrically deflecting to positive angles, the restoring moment is increased over the planar case, and at high sideslip angles, it exceeds the baseline wing. The impact of the anhedral is also observed, and symmetric deflection downwards reduces the restoring moment in comparison to a planar wing, for example a negative 60 degree symmetric deflection. This is a significant result and shows that FOLDERONS have the ability to be used for temporary dihedral/anhedral increases.
It has been shown that the sideslip restoring moment can be increased by two methods; asymmetric deflection to create a lift differential or symmetric deflection to induce the dihedral effect. From the data plots presented, the most effective method is through asymmetric deflection.
4.2.2. Real Aircraft Lateral Stability Comparison
To quantitatively analyse the effectiveness of FOLDERONS upon lateral stability, the lateral stability derivative, , has been plotted, and the resulting graph can be seen in Figure 22. For a negative sideslip, the lateral stability derivative should be negative for a stable aircraft. A negative value means that the restoring moment rolling the aircraft away from the sideslip increases with an increase in sideslip angle.
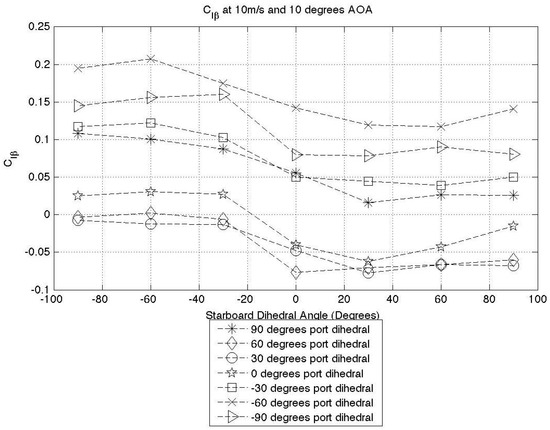
Figure 22.
Lateral stability derivative variation.
As Figure 22 shows, some configurations stabilise the aircraft in a sideslip condition, whereas others de-stabilise it. A peak value of is generated at starboard dihedral of zero degree and 60 degrees port dihedral. The aircraft selected for direct comparison is the Cessna 182 due to its similarity in planform and overall configuration. The rolling stability derivative for this aircraft in a climb scenario is , a highly comparable value.
The rolling moment of an aircraft is produced by multiple sources, each with varying strength. In an ideal situation, the rolling moment produced would come solely from the main wing, but certain data cases tell us that this is not the case. Taking the configuration of 90 degrees port dihedral and zero degree starboard dihedral, the span-wise component of the force produced by the port wingtip would increase as the left sideslip angle increases, due to the increased AOA. The lift produced over the starboard wing should reduce with increased left sideslip angle due to a reduced chord-wise component of incoming flow. From just the wing contribution, the stability derivative should be negative, indicating a stable aircraft. In fact, the stability derivative is positive when all factors are included. Due to the high wing configuration, the rolling moment due to the fuselage is acting to roll the aircraft further into the sideslip, and its influence can be attributed to the counterintuitive data highlighted. It is interesting to note that all positive–positive deflection angles in Figure 22 produce a laterally stable configuration, showing the effect of dihedral on the stability derivative. Similarly, the negative-negative deflection cases show a laterally unstable aircraft as a result of anhedral. This further validates the findings in the preceding section and shows that FOLDERONS can be used to modify the lateral stability if required to perform specific manoeuvres and demonstrate certain behaviour.
4.2.3. Directional Stability
Figure 23 and Figure 24 present the same 10 degrees AOA cases as presented for the lateral stability analysis. These figures represent the trend observed for all test cases. For an aircraft in a negative sideslip, the yawing moment should be negative. In a similar way to the rolling moment case, the wingtip configurations can act to both increase and decrease the restoring moment. If both wingtips are symmetrically actuated to ±90 degrees, the surfaces should create a force in the same direction as the vertical stabiliser, and this in theory should produce a small moment due to the wingtip sweep angle. By observing the ±90 degrees symmetric actuation case in Figure 23 and Figure 24, the restoring moment has improved over the planar wingtip case, though not by a significant amount; this is a good result and as predicted.
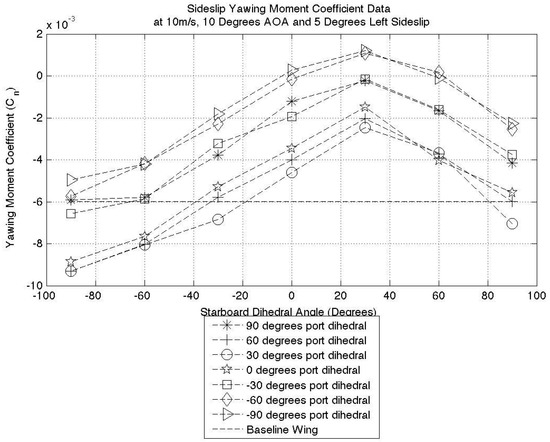
Figure 23.
Five degrees sideslip yawing moment coefficient.
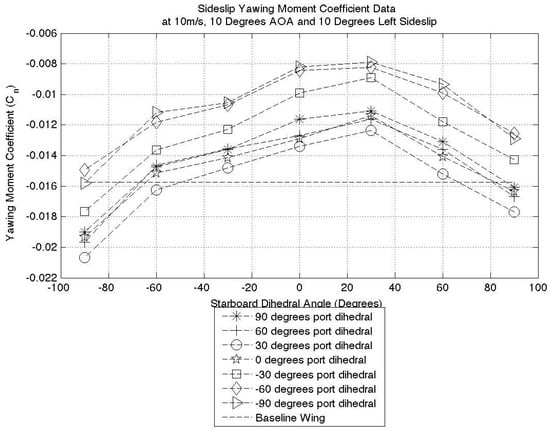
Figure 24.
Ten degrees sideslip yawing moment coefficient.
The largest increase in restoring moment is observed when the port wingtip is at a low positive dihedral angle and the starboard wingtip is at negative 90 degrees. In this scenario, the port wing is producing more lift than the starboard one, and therefore, the total drag value of the port wing is greatest. The increased drag differential creates a yawing moment in the direction of the sideslip velocity. Based on this, we can conclude that FOLDERONS can produce a restoring moment of varying magnitudes through two separate mechanisms.
4.2.4. Real Aircraft Directional Stability Comparison
A plot of the directional stability derivative can be seen in Figure 25.
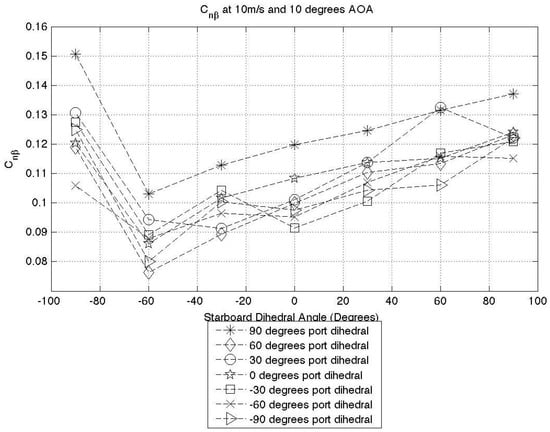
Figure 25.
Directional stability derivative variation.
For a stable aircraft in negative sideslip, the directional stability derivative is positive. The figure shows that all configurations provide a positive derivative, and therefore, all configurations are directionally stable. The minimum positive value observed is , which when compared to that of the Cessna 182 during climb, shows that even the most de-stabilising configuration has a comparable value to that of a real aircraft. The maximum value of is significantly higher than that of the Cessna 182. The data collected shows that a 66% change in the directional stability derivative is available through the use of FOLDERONS. This is a property that could be harnessed for complex manoeuvre cases where a change in the directional stability is beneficial.
4.3. Effect of High-Speed Actuation on System Performance
To reduce the data noise generated through high frequency data collection, the data have been averaged in blocks of 40 to reduce the 4000 data points recorded down to 100 averaged points. A moving average has also been fitted through this data for visualisation purposes. A further piece of code has been written to overlay the static data onto the dynamic data and produce data plots for direct comparisons. A sample of these data can be seen in Figure 26 and represents the trend seen throughout.
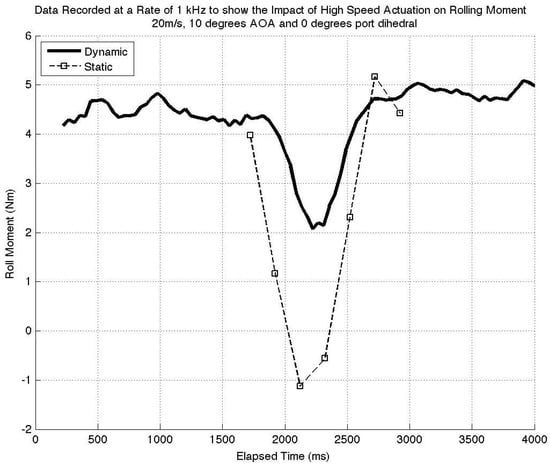
Figure 26.
Dynamic vs. static results.
The data clearly show a discrepancy in the rolling moment produced by the static and dynamic cases. In this data series, the static data represent the maximum rolling moment available at that configuration, as there is no negative effects as a result of actuation impacting this value. The high speed actuation during the dynamic data collection clearly results in a reduction in rolling moment in all configurations. From this, we can conclude that the wingtip surface is moving faster than the airflow settling time, and the rolling moment is not meeting its full potential. This is a significant result and shows that high speed actuation has a detrimental impact on the effectiveness of FOLDERONS.
5. Conclusions
This paper has shown that FOLDERONS can enhance the rolling authority of a conventional aircraft especially at high angles of attack or large dynamic pressure. These systems provide sufficient rolling authority (moment and rate) during the less demanding flight phases (mainly cruise). The rolling moment (direction and magnitude) generated by FOLDEDRONS is highly dependent on the angle of attack, which is not the case for conventional ailerons. In fact, the mechanism of generating roll authority is very different between FOLDERONS and ailerons. Ailerons produce roll control by incremental lift on each side of the wing. On the other hand, FOLDERONS generate roll control by tilting the wingtip lift and reducing the moment arm on each side of the wing, hence the dependency on the AOA. Unlike ailerons, rolling authority generated using FOLDERONS suffers from a reversal effect at negative angles of attack. In other words, at negative angles of attack, changing the dihedral angles of the wingtips to roll right produces a roll to the left instead. This destabilising contribution must be considered in the design of the control law and might pose issues if operated in steep descents/dives. The actuation speed of the FOLDERONS has a significant impact on their effectiveness. The maximum effectiveness of the FOLDERONS occurs when the actuation rates are in the same order of magnitude as the rate of the airflow to allow flow to develop around the wingtips as they fold. Due to the large deflection angles required from these systems, high actuation rates would be needed to meet response rate requirements, reducing the aerodynamic effectiveness.
The lateral and directional stability are significantly affected by the FOLDERONS, allowing active tailoring of these values. For a conventional aircraft, stability is of paramount importance, but too much stability can lead to an unresponsive and hard to manoeuvre aircraft. The ability to tailor these stability values leads to the notion of less resisted manoeuvre cases. Adjustment in these values allows an aircraft to be less resistive to control commands and ultimately lead to smaller control inputs and reduced control surface loading. In addition, cross-coupling between the yaw and roll axes was observed. FOLDERONS have minimal impact on the pitch axis mainly due to the fact that the wing is straight. The addition of wing sweep would allow pitch axis authority and cross-coupling between all three control axes to be achieved, which might allow new types of manoeuvres to be achieved.
It is suggested that further work is carried out to investigate the impact of, and the solution to, the gap covering problem. A compromise solution was used to good effect in this paper, but this is an area with improvement still to be made. The main issue with the current system is the lack of rolling moment developed at low speed and low AOA; a study should be carried out to investigate modifying the system to include wingtip twist to vary the wingtip AOA. If successful, this would increase the range of flight conditions the system can effectively operate in, but must be traded off against the additional complexity introduced.
Acknowledgments
This material is based on work supported by the Air Force Office of Scientific Research under Award Number FA9550-15-1-0422.
Author Contributions
The project aims and objectives were collaboratively developed between the authors. The work was then carried out by Josh Mills with technical input and guidance from Rafic Ajaj.
Conflicts of Interest
The authors declare no conflict of interest.
Abbreviations
| AOA | Angle Of Attack |
| FOLDERONS | FOLDing wingtips sERving as cONtrol effectorS |
| UAV | Unmanned Aerial Vehicle |
| VLM | Vortex Lattice Method |
| CAD | Computer-Aided Design |
| CNC | Computer Numerical Control |
| Symbols | |
| Air density | |
| V | Velocity |
| Wingtip area | |
| Lift curve slope | |
| Rolling moment coefficient | |
| Lateral stability derivative | |
| Yawing moment coefficient | |
| Directional stability derivative | |
| Angle of attack | |
| Wingtip dihedral | |
| Wingtip twist | |
| Wingtip sweep | |
| Rolling moment | |
| Span of the main wing | |
| Port wingtip dihedral angle | |
| Starboard wingtip dihedral angle |
References
- Smith, M.A. Flight and Aircraft Engineer Weekly; Flight and Aircraft Engineer: London, UK, 1954; Volume 65. [Google Scholar]
- Advisory Council for Aviation Research and Innovation in Europe. European Aeronautics: A Vision for 2020; European Commission: Luxembourg, 2001. [Google Scholar]
- European Commission. Flightpath 2050: Europe’s Vision for Aviation; European Commission: Luxembourg, 2011. [Google Scholar]
- Kaygan, E.; Gatto, A. Investigation of Adaptable Winglets for Improved UAV Control and Performance. World Acad. Sci. Eng. Technol. 2014, 8, 1281–1286. [Google Scholar]
- Bourdin, P.; Gatto, A.; Friswell, M. The Application of Variable Cant Angle Winglets for Morphing Aircraft Control. In Proceedings of the Applied Aerodynamic Conference, San Francisco, CA, USA, 5–8 June 2006. [Google Scholar]
- Smith, D.; Lowenberg, M.; Jones, D.; Friswell, M. Computatonal and Experimental Validation of the Active Morphing Wing. J. Aircr. 2014, 51, 925–937. [Google Scholar] [CrossRef]
- Gatto, A.; Bourdin, P.; Friswell, M. Experimental Investigation into the Control and Load Alleviation Capabilities of Articulated Winglets. Int. J. Aerosp. Eng. 2012, 2012, 789501. [Google Scholar] [CrossRef]
- Barbarino, S.; Bilgen, O.; Ajaj, R.M.; Friswell, M.I.; Inman, D.J. A Review of Morphing Aircraft. J. Intell. Mater. Syst. Struct. 2011, 22, 823–877. [Google Scholar] [CrossRef]
- Ajaj, R.; Keane, A.; Beaverstock, C.; Friswell, M.; Inman, D. Morphing Aircraft: The Need for a New Design Philosophy. In Proceedings of the 7th Ankara International Aerospace Conference, Ankara, Turkey, 11–13 September 2013. [Google Scholar]
- Raymer, D.P. Aircraft Design: A Conceptual Approach; American Institute of Aeronautics and Astronautics (AIAA): Reston, VA, USA, 2012; Volume 5. [Google Scholar]
- RC World—Seagull Arising Star Trainer. Available online: http://www.rcworld.co.uk/acatalog/Seagull-Arising-Star-Trainer.html (accessed on 10 September 2016).
- Ursache, N.; Melin, T.; Isikveren, A.; Friswell, M. Technology Integration for Active Poly-Morphing Winglets Development. In Proceedings of the ASME Conference on Smart Materials, Ellicott City, MD, USA, 28–30 October 2008. [Google Scholar]
- Saff, C.R. Airframe Certification Methods for Unmanned Aircraft; Technical Report; The Boeing Company: Chicago, IL, USA, 2007. [Google Scholar]
- Slocum, A. Fundamentals of Design; Technical Report; Massachusetts Institute of Technology (MIT): Cambridge, MA, USA, 2008. [Google Scholar]
© 2017 by the authors. Licensee MDPI, Basel, Switzerland. This article is an open access article distributed under the terms and conditions of the Creative Commons Attribution (CC BY) license (http://creativecommons.org/licenses/by/4.0/).