
Analysis of Pilot-Induced-Oscillation and Pilot Vehicle System Stability Using UAS Flight Experiments

Abstract
:
1. Introduction
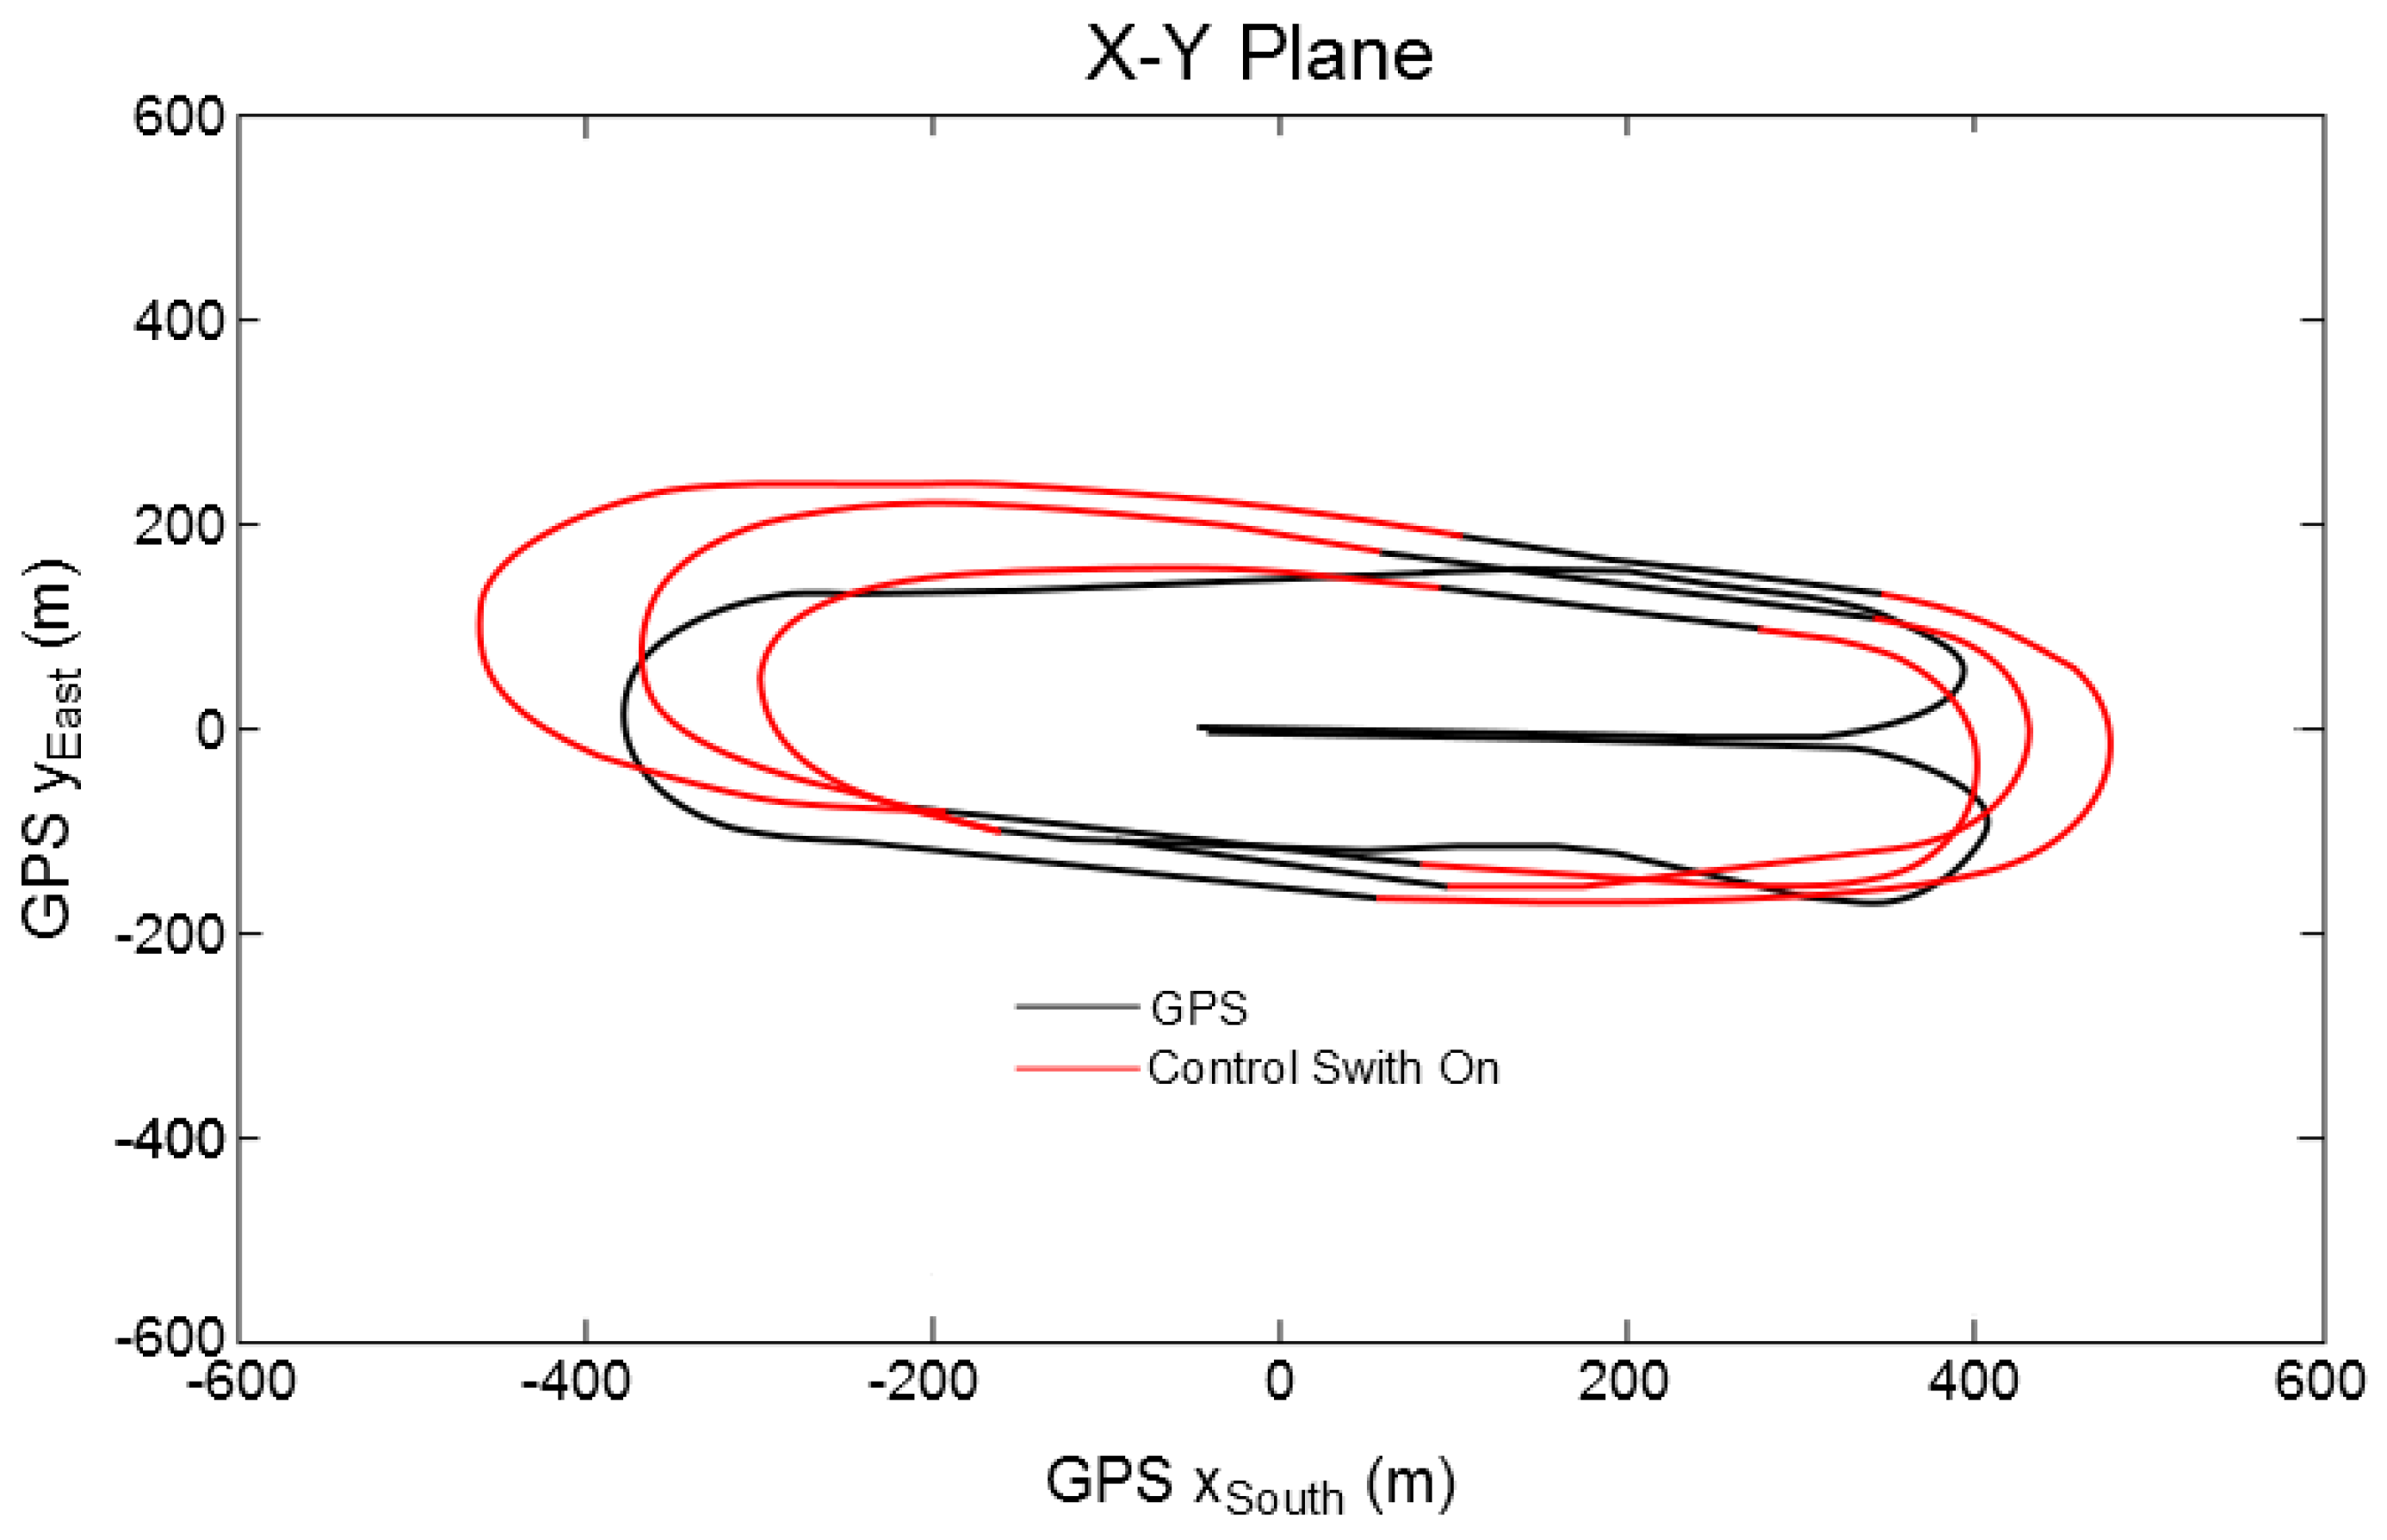
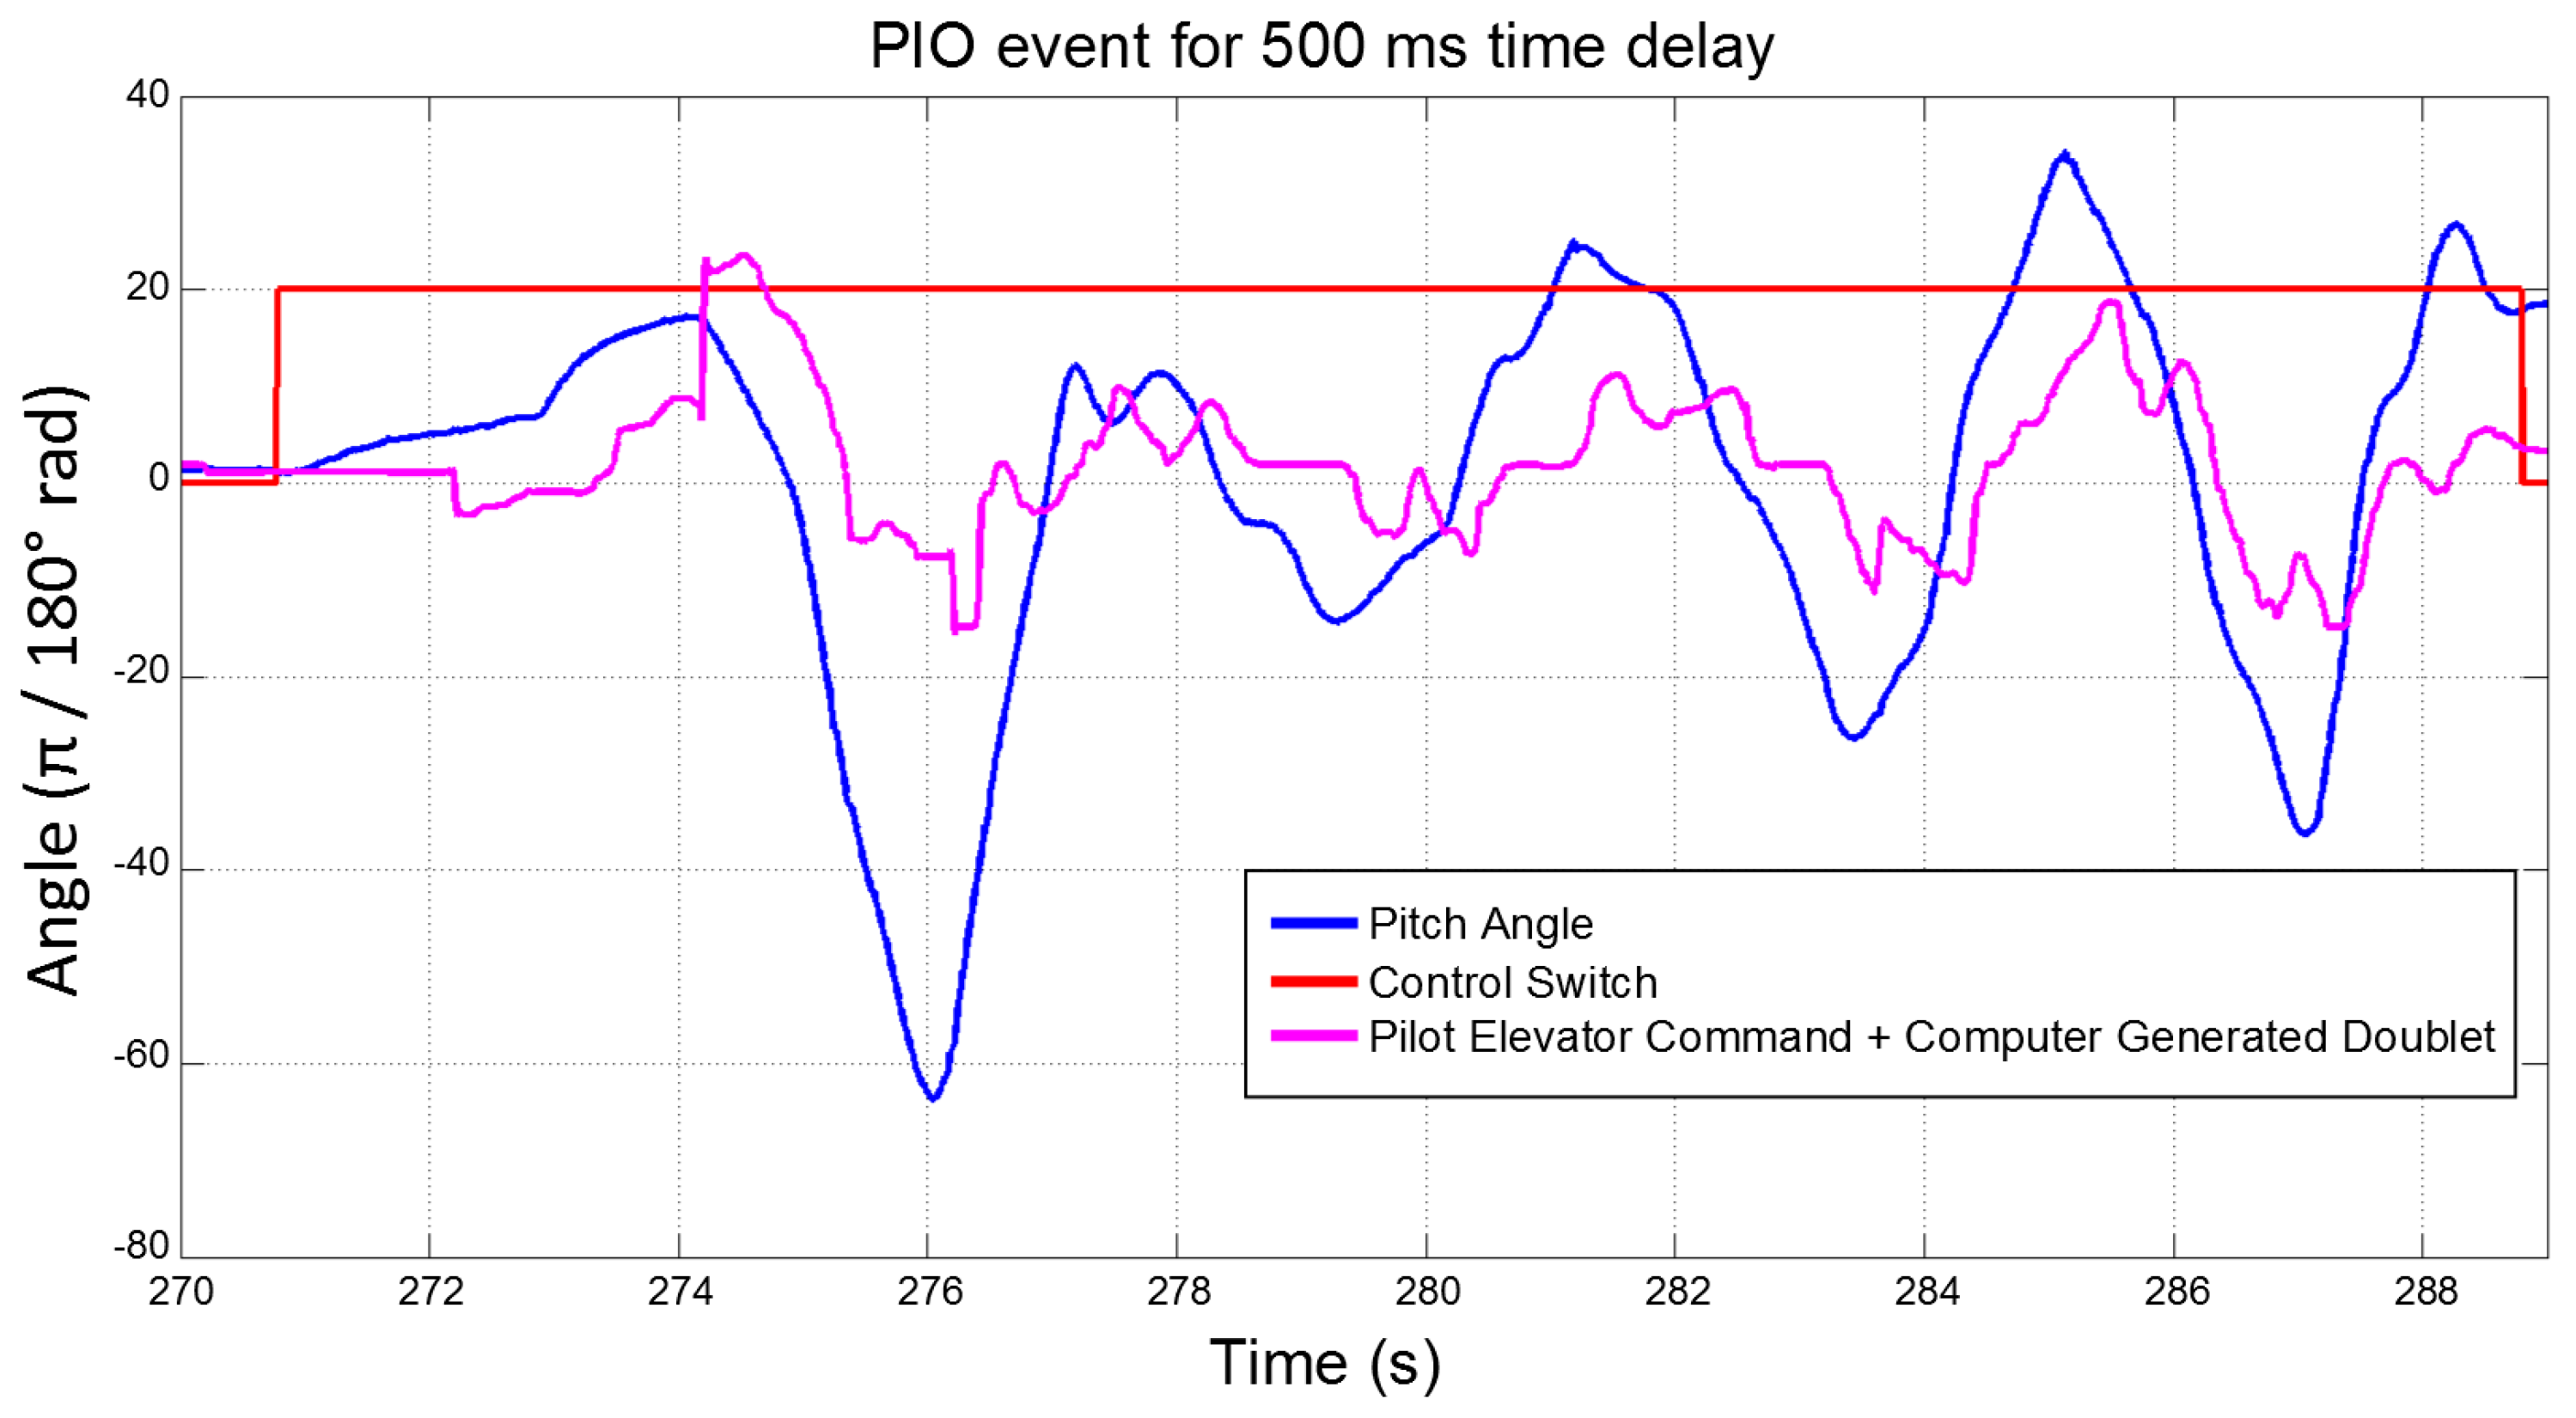
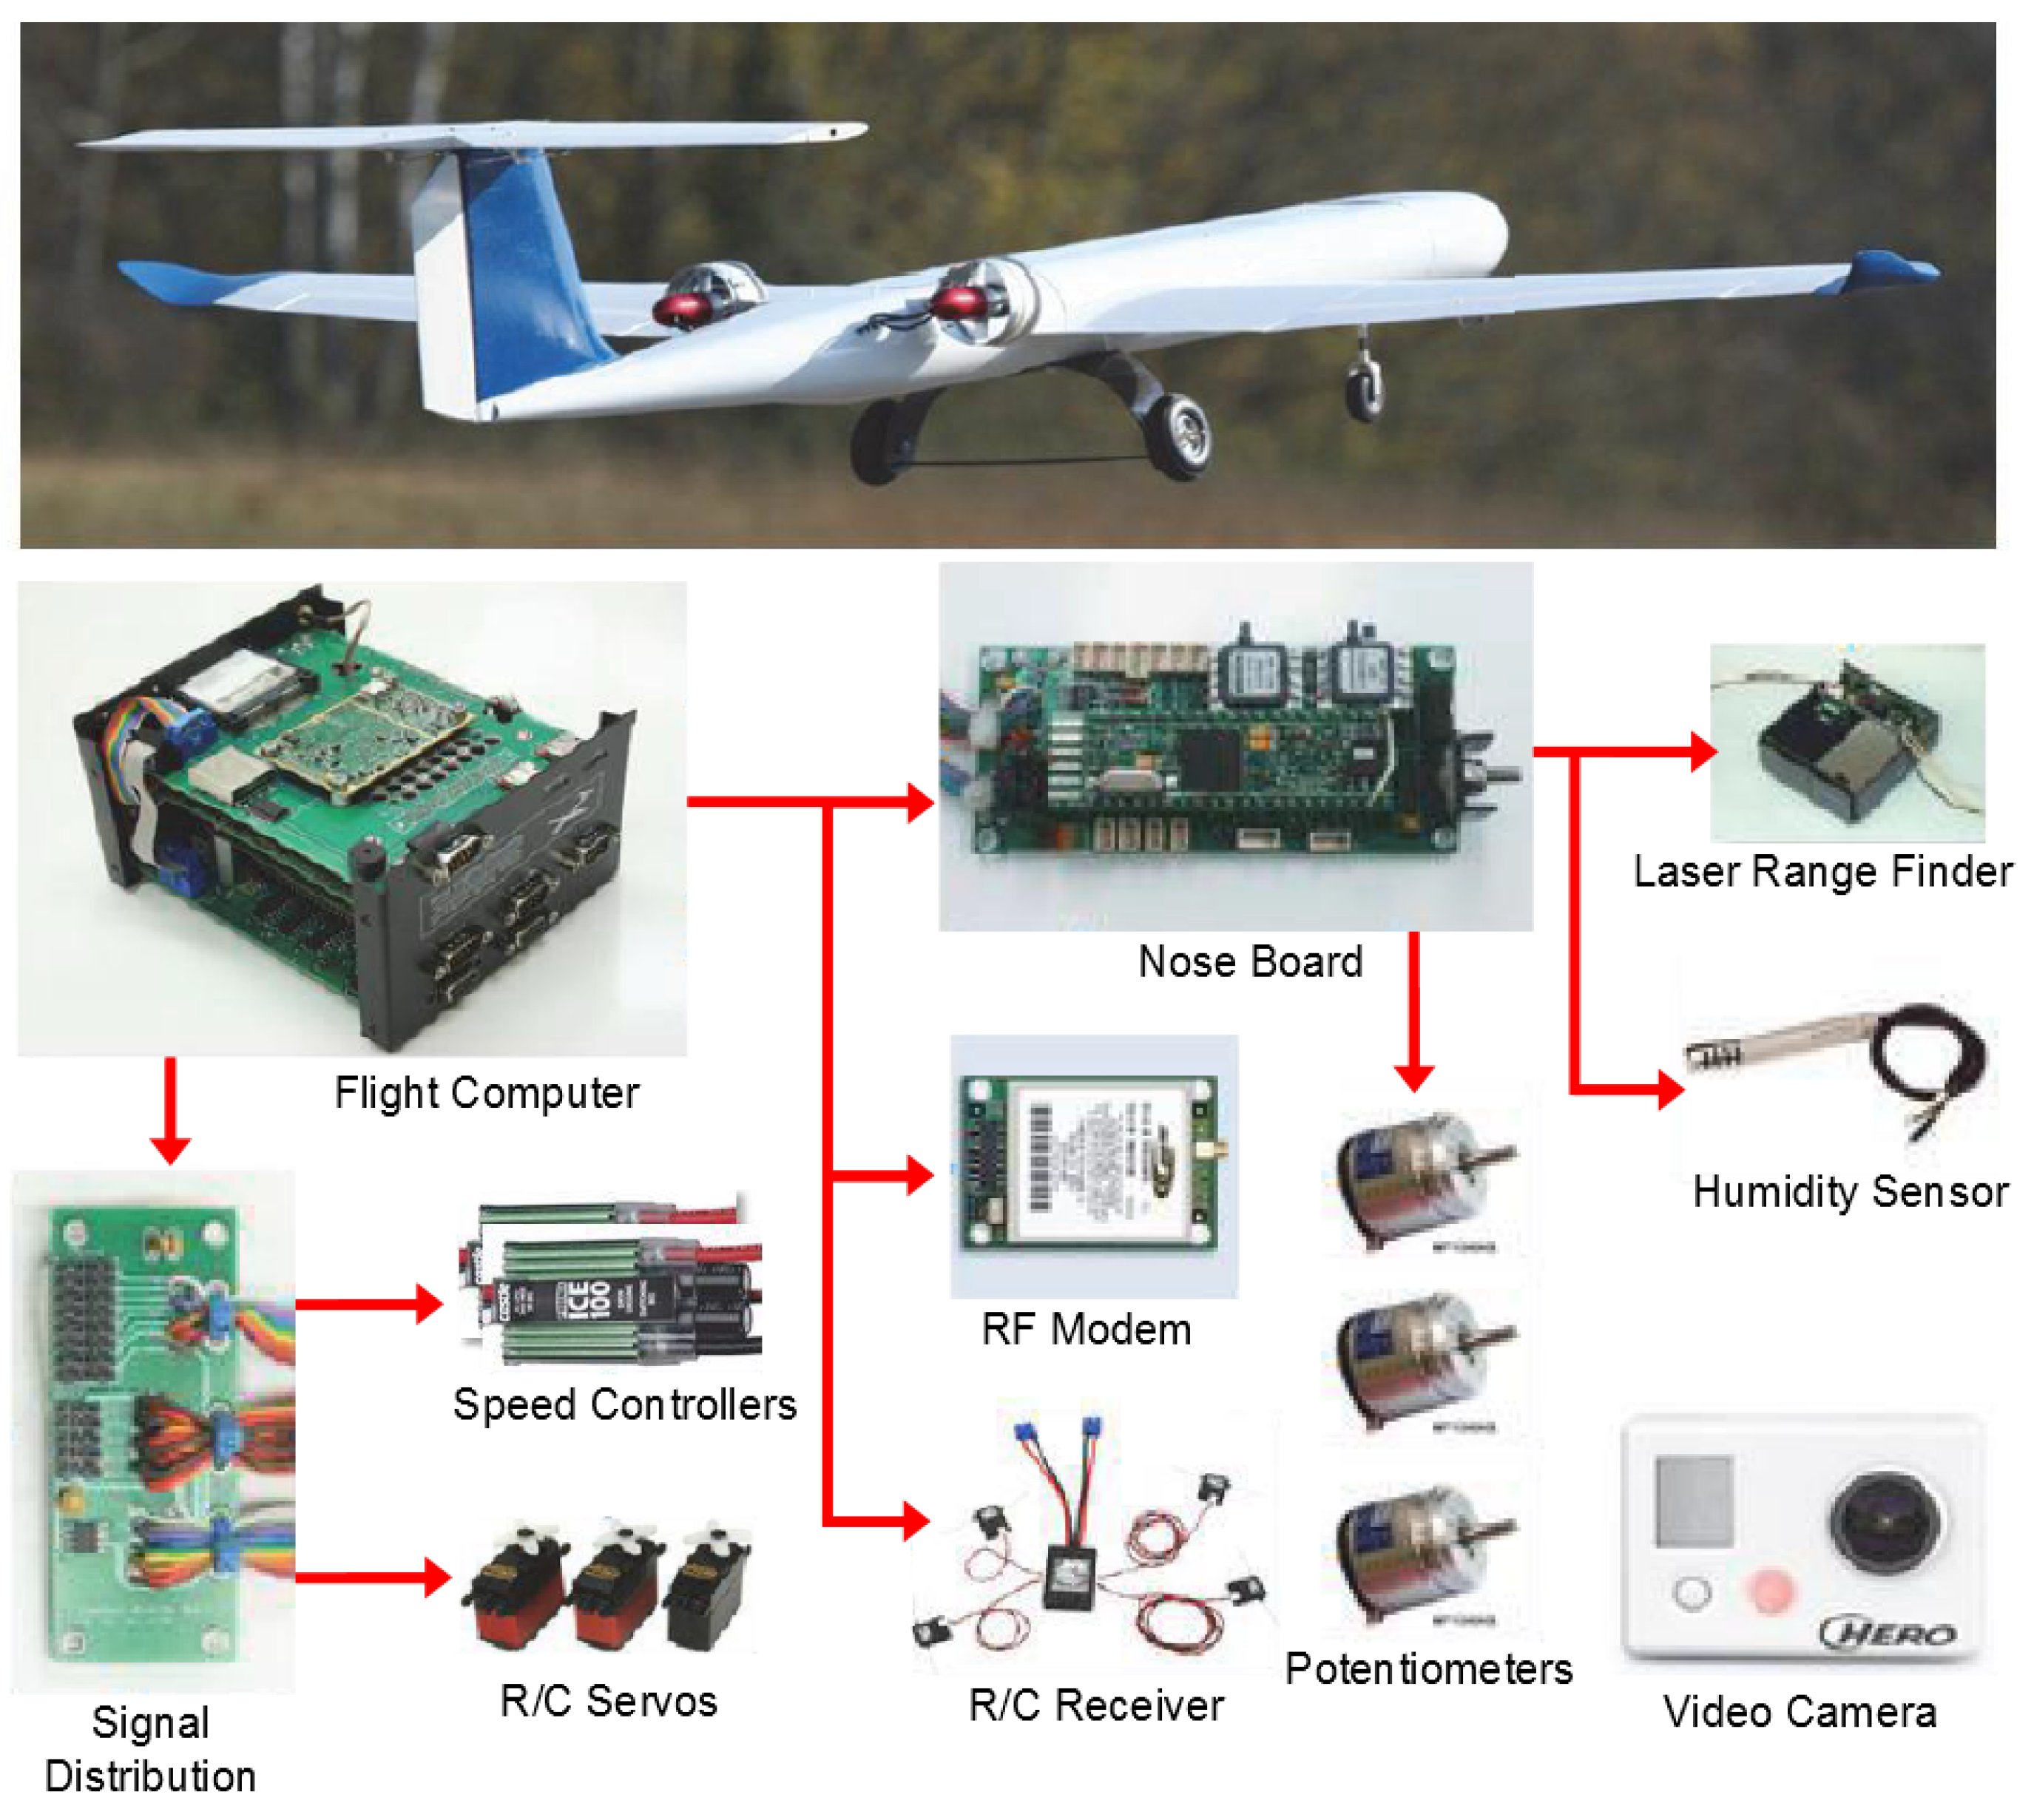
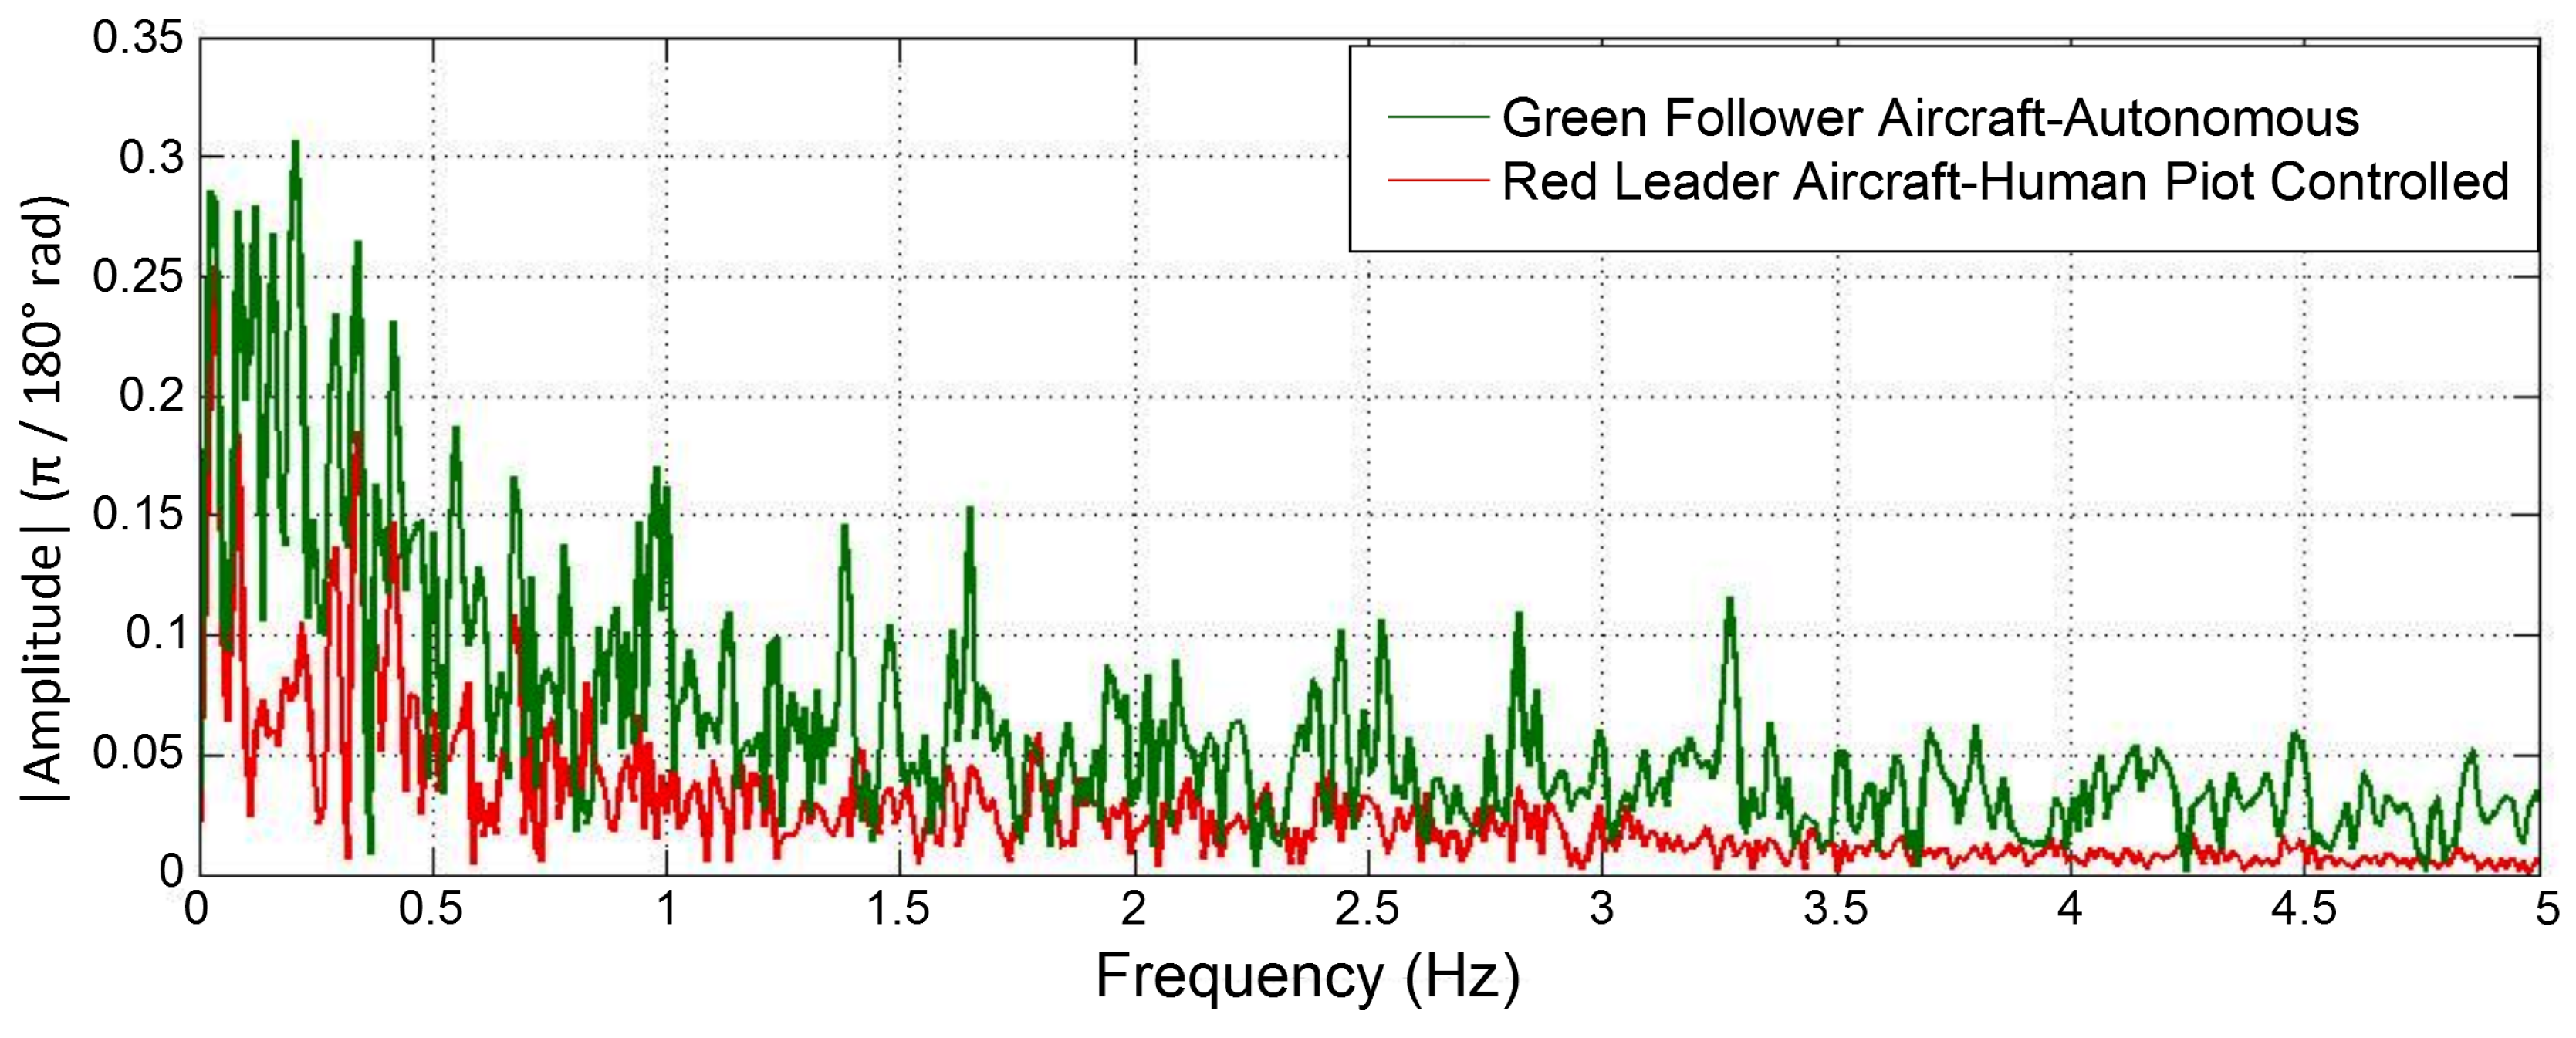
2. Flight Experiments
3. Flight Data Analysis for Pilot-Induced Oscillation (PIO)
3.1. Category 1 PIO Analysis
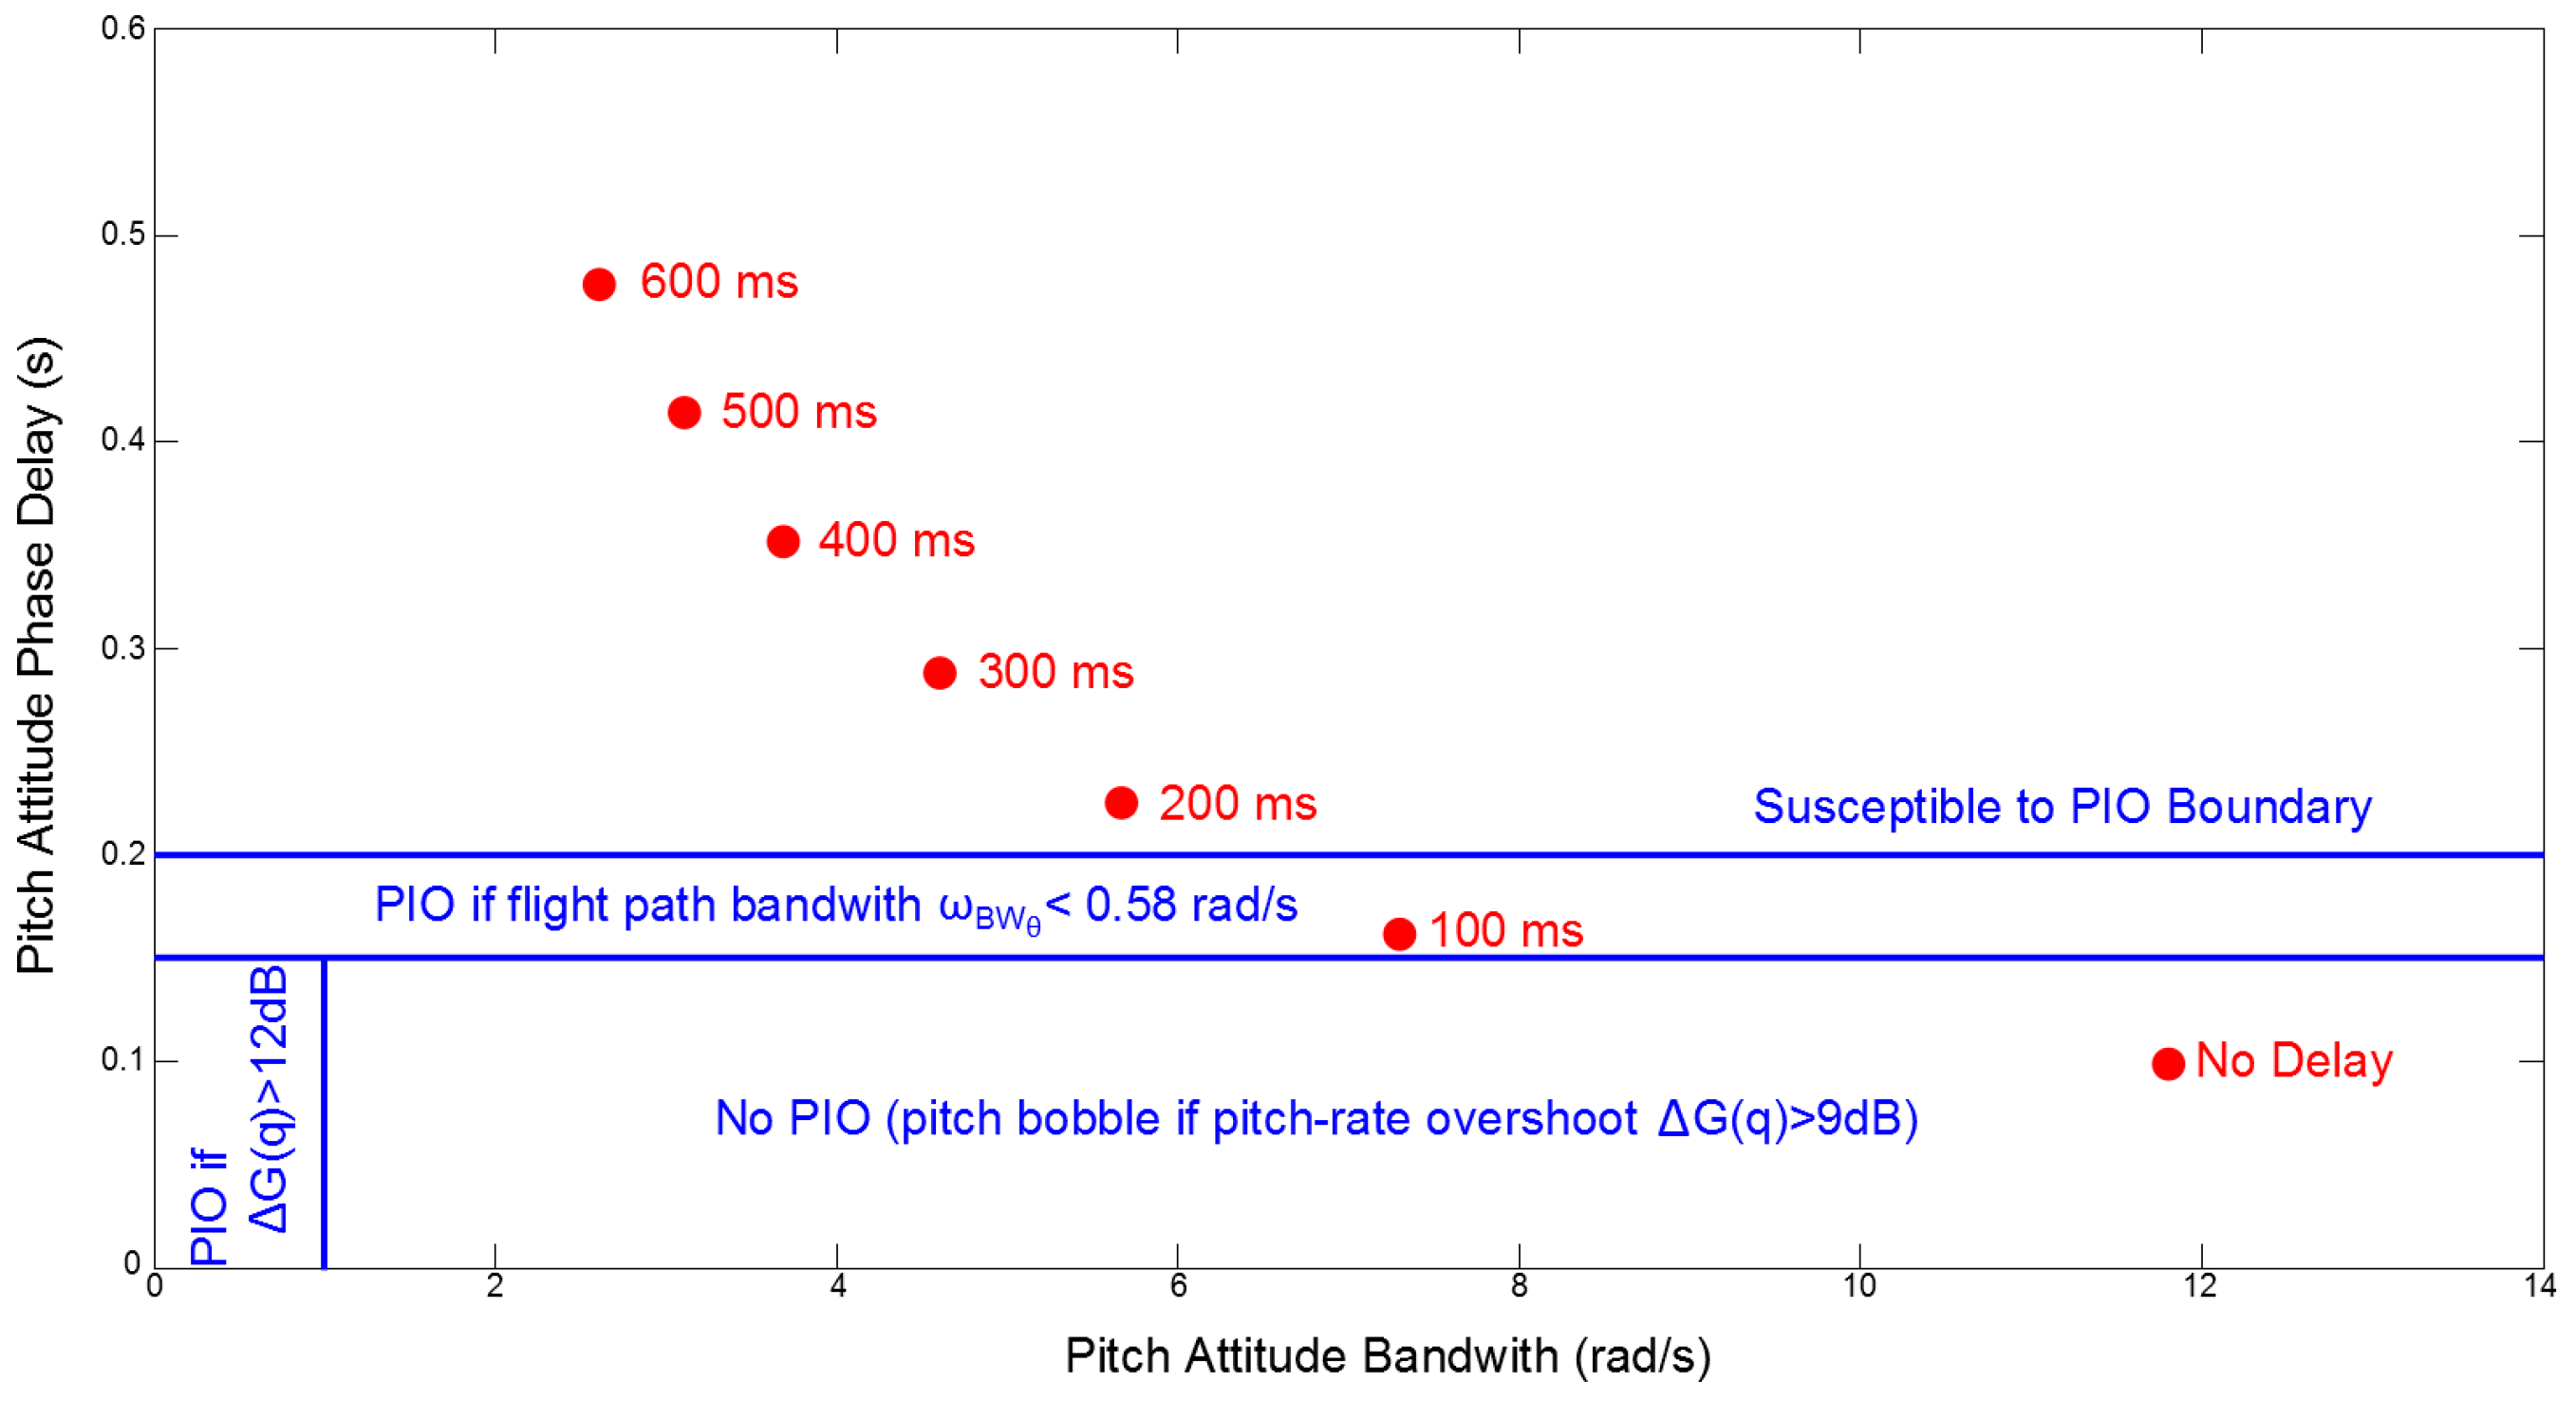
3.1.1. Bandwidth/Pitch Rate Overshoot
- (1)
- The Bandwidth is defined as the frequency at which the phase margin is 45 or the gain margin is 6 dB, whichever frequency is lower. This represents the range of frequencies over which the pilot can control the aircraft without giving rise to instability.
- (2)
- The Phase delay is defined as . It represents the slope of the phase angle at frequencies above the bandwidth. A large value of phase delay means that above the bandwidth frequency the pilot will find a rapidly decreasing phase margin, thus instability is likely to occur.
3.1.2. Neal-Smith Criterion
- 1
- The aircraft-pilot phase angle at the bandwidth frequency must be −90.
- 2
- The low frequency droop must be less than −3 dB.
- 1
- The solution does not converge.
- 2
- The predicted model contains excessive lag.
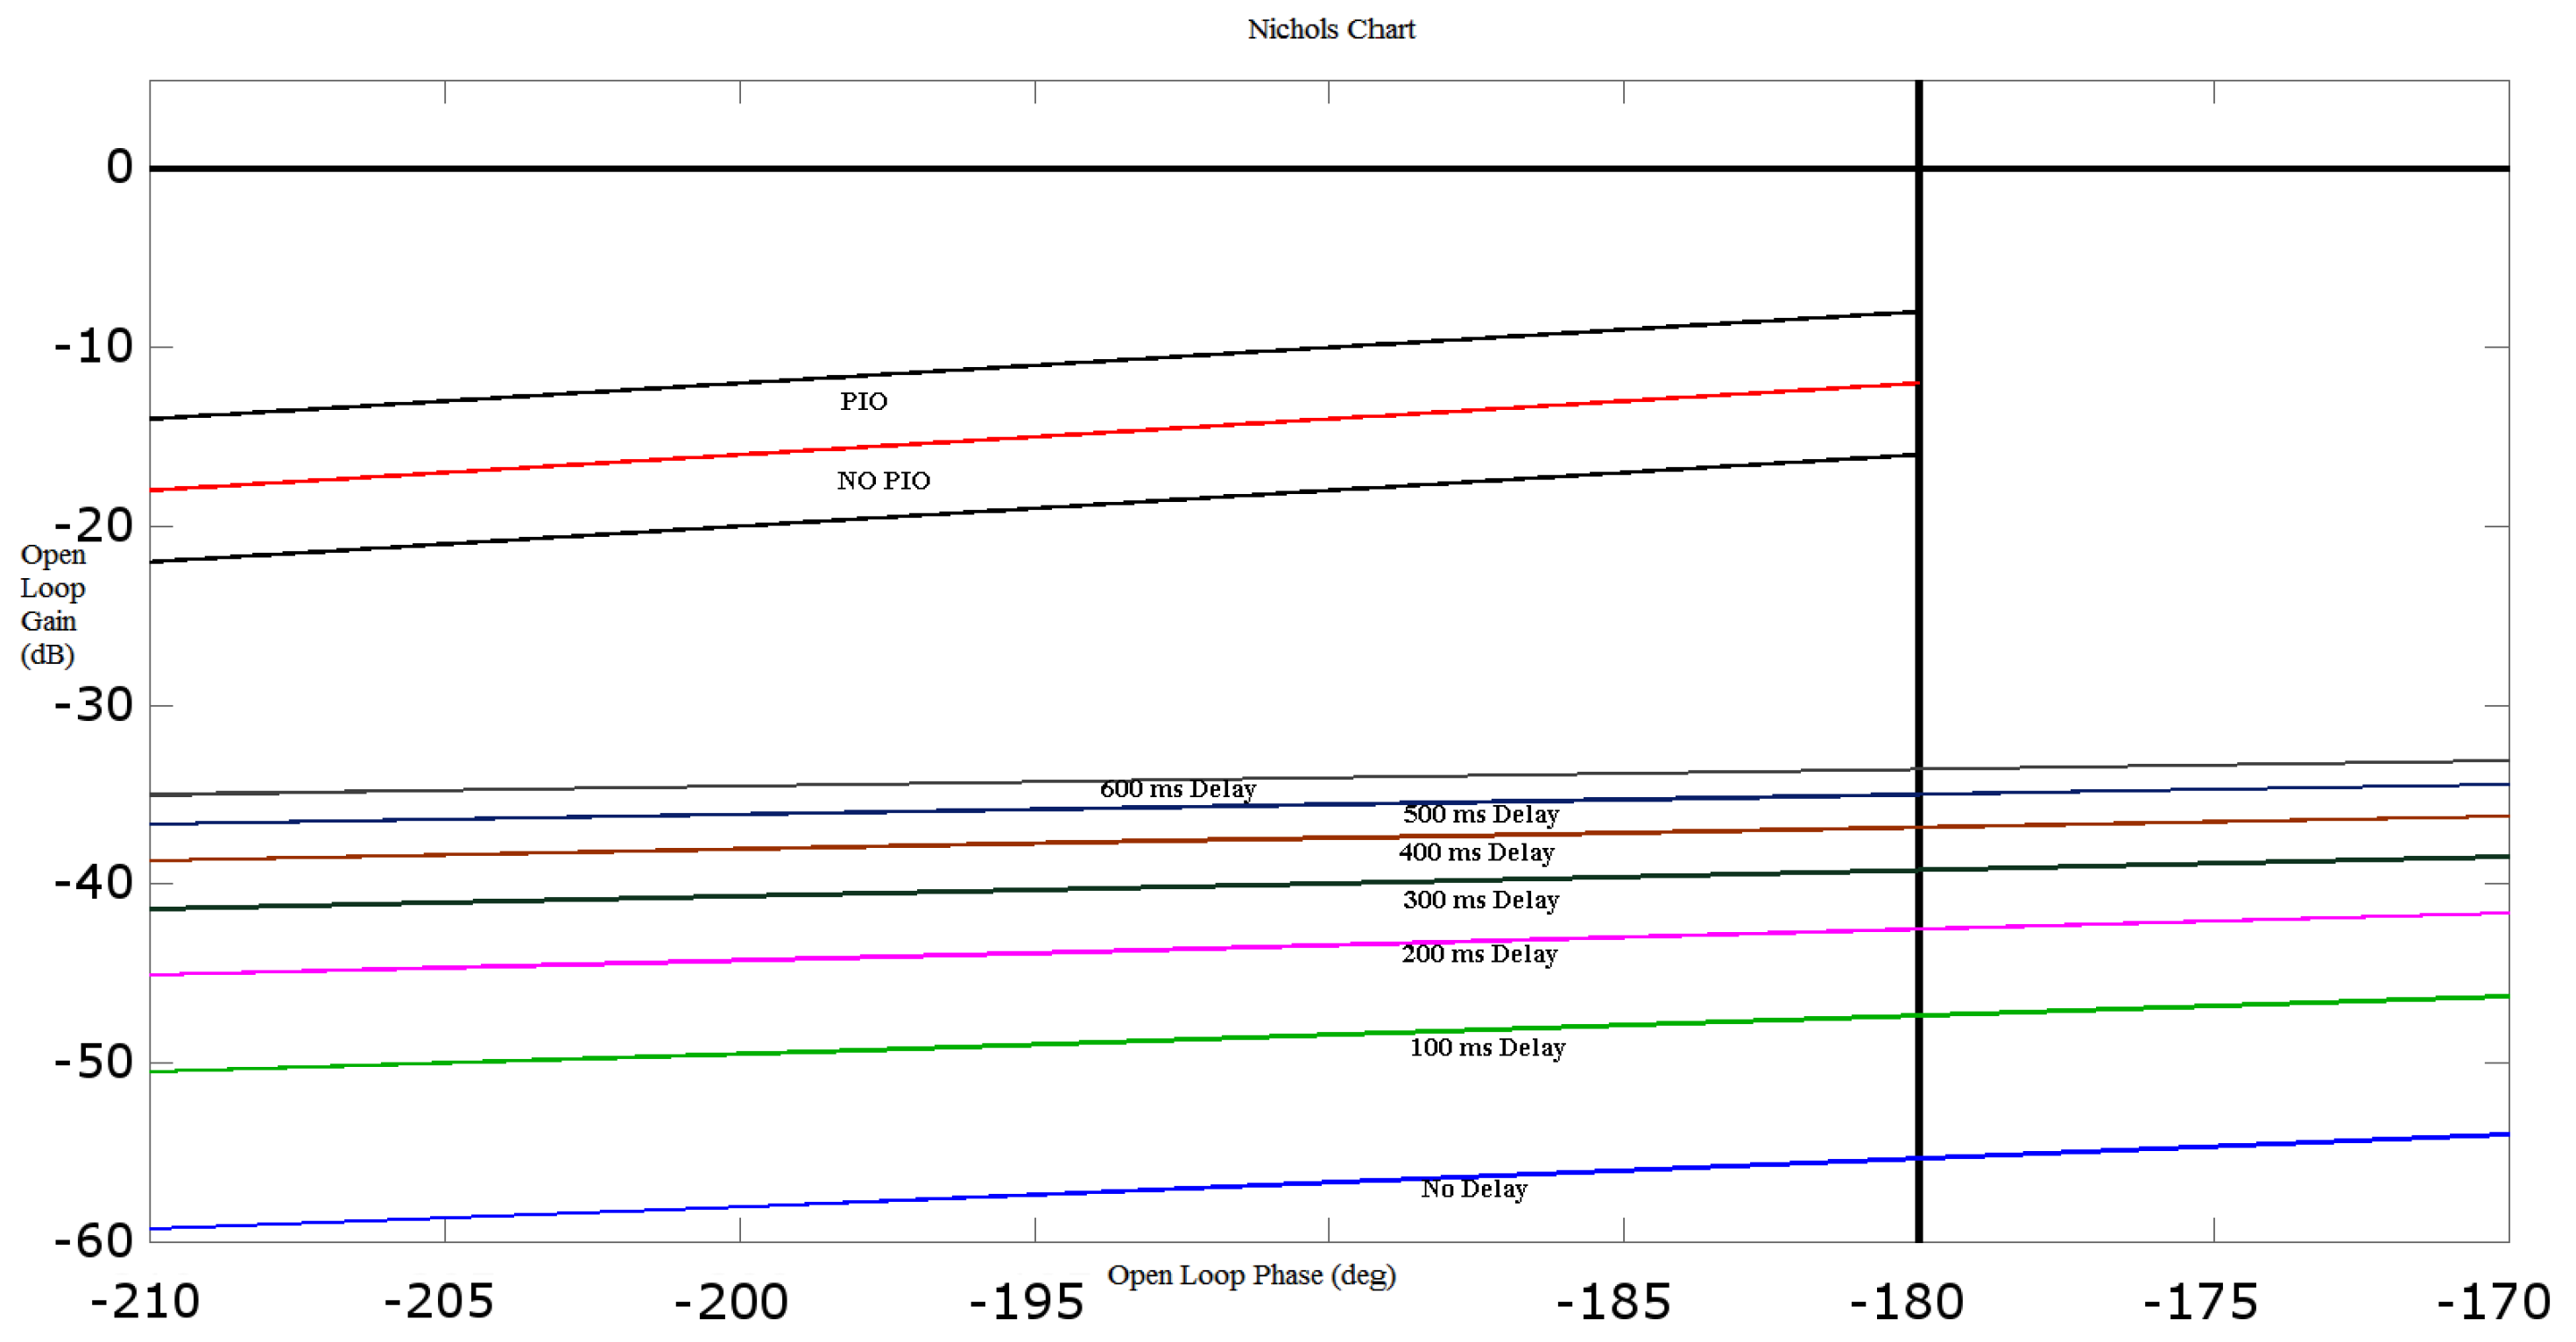
3.1.3. Smith-Geddes Criterion
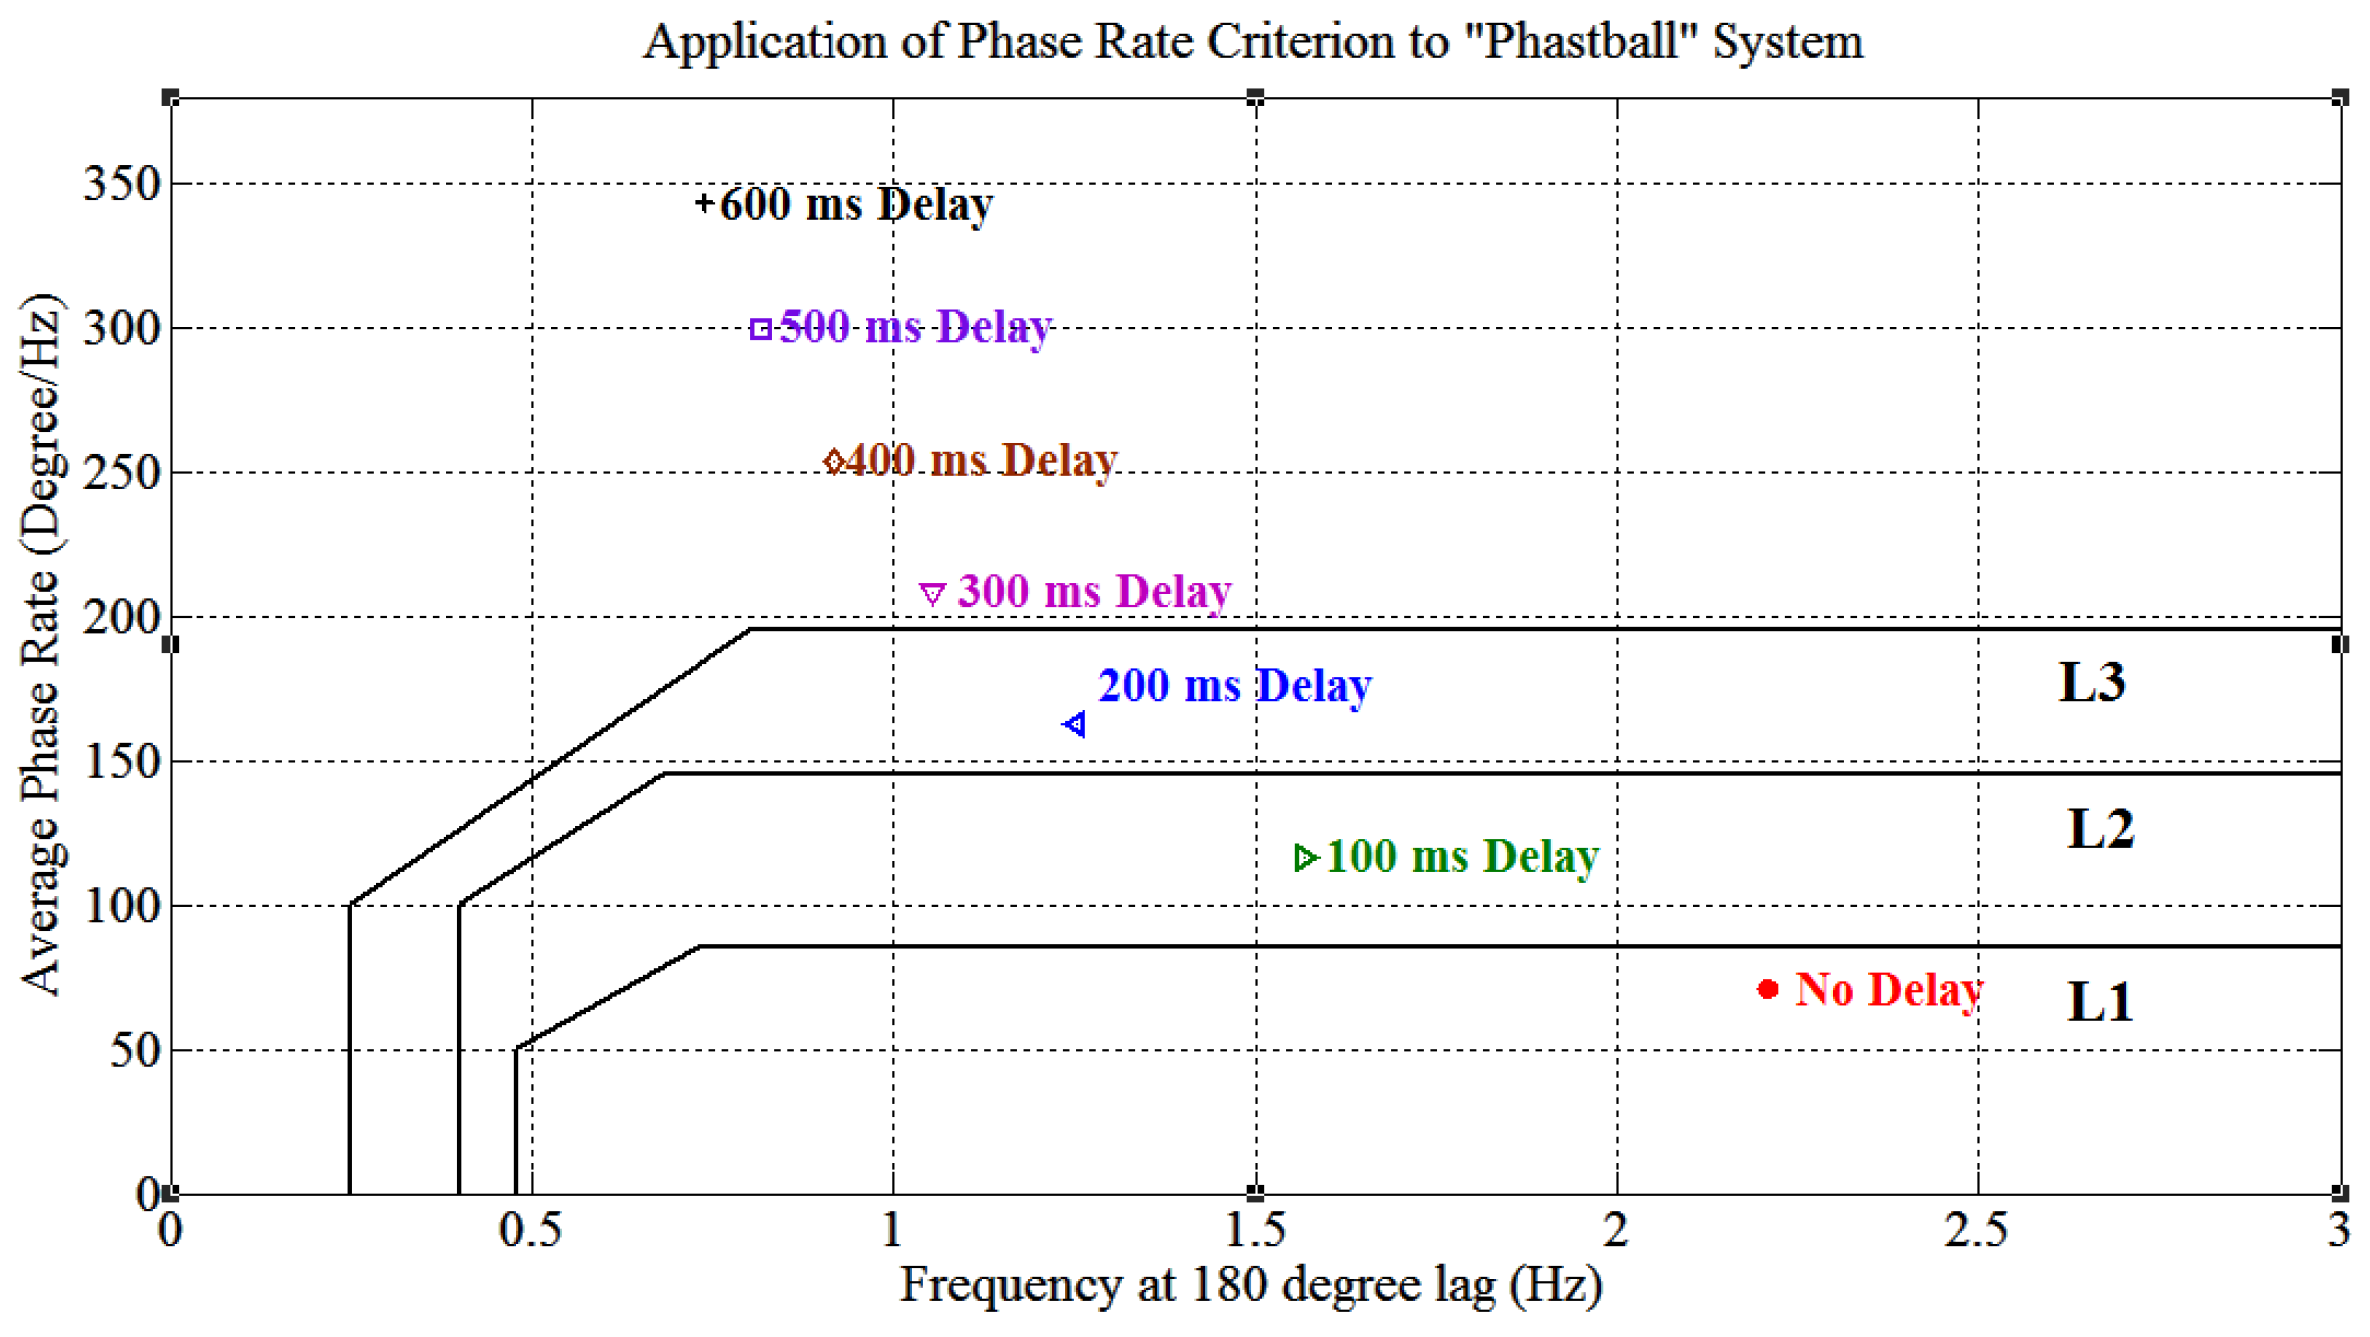
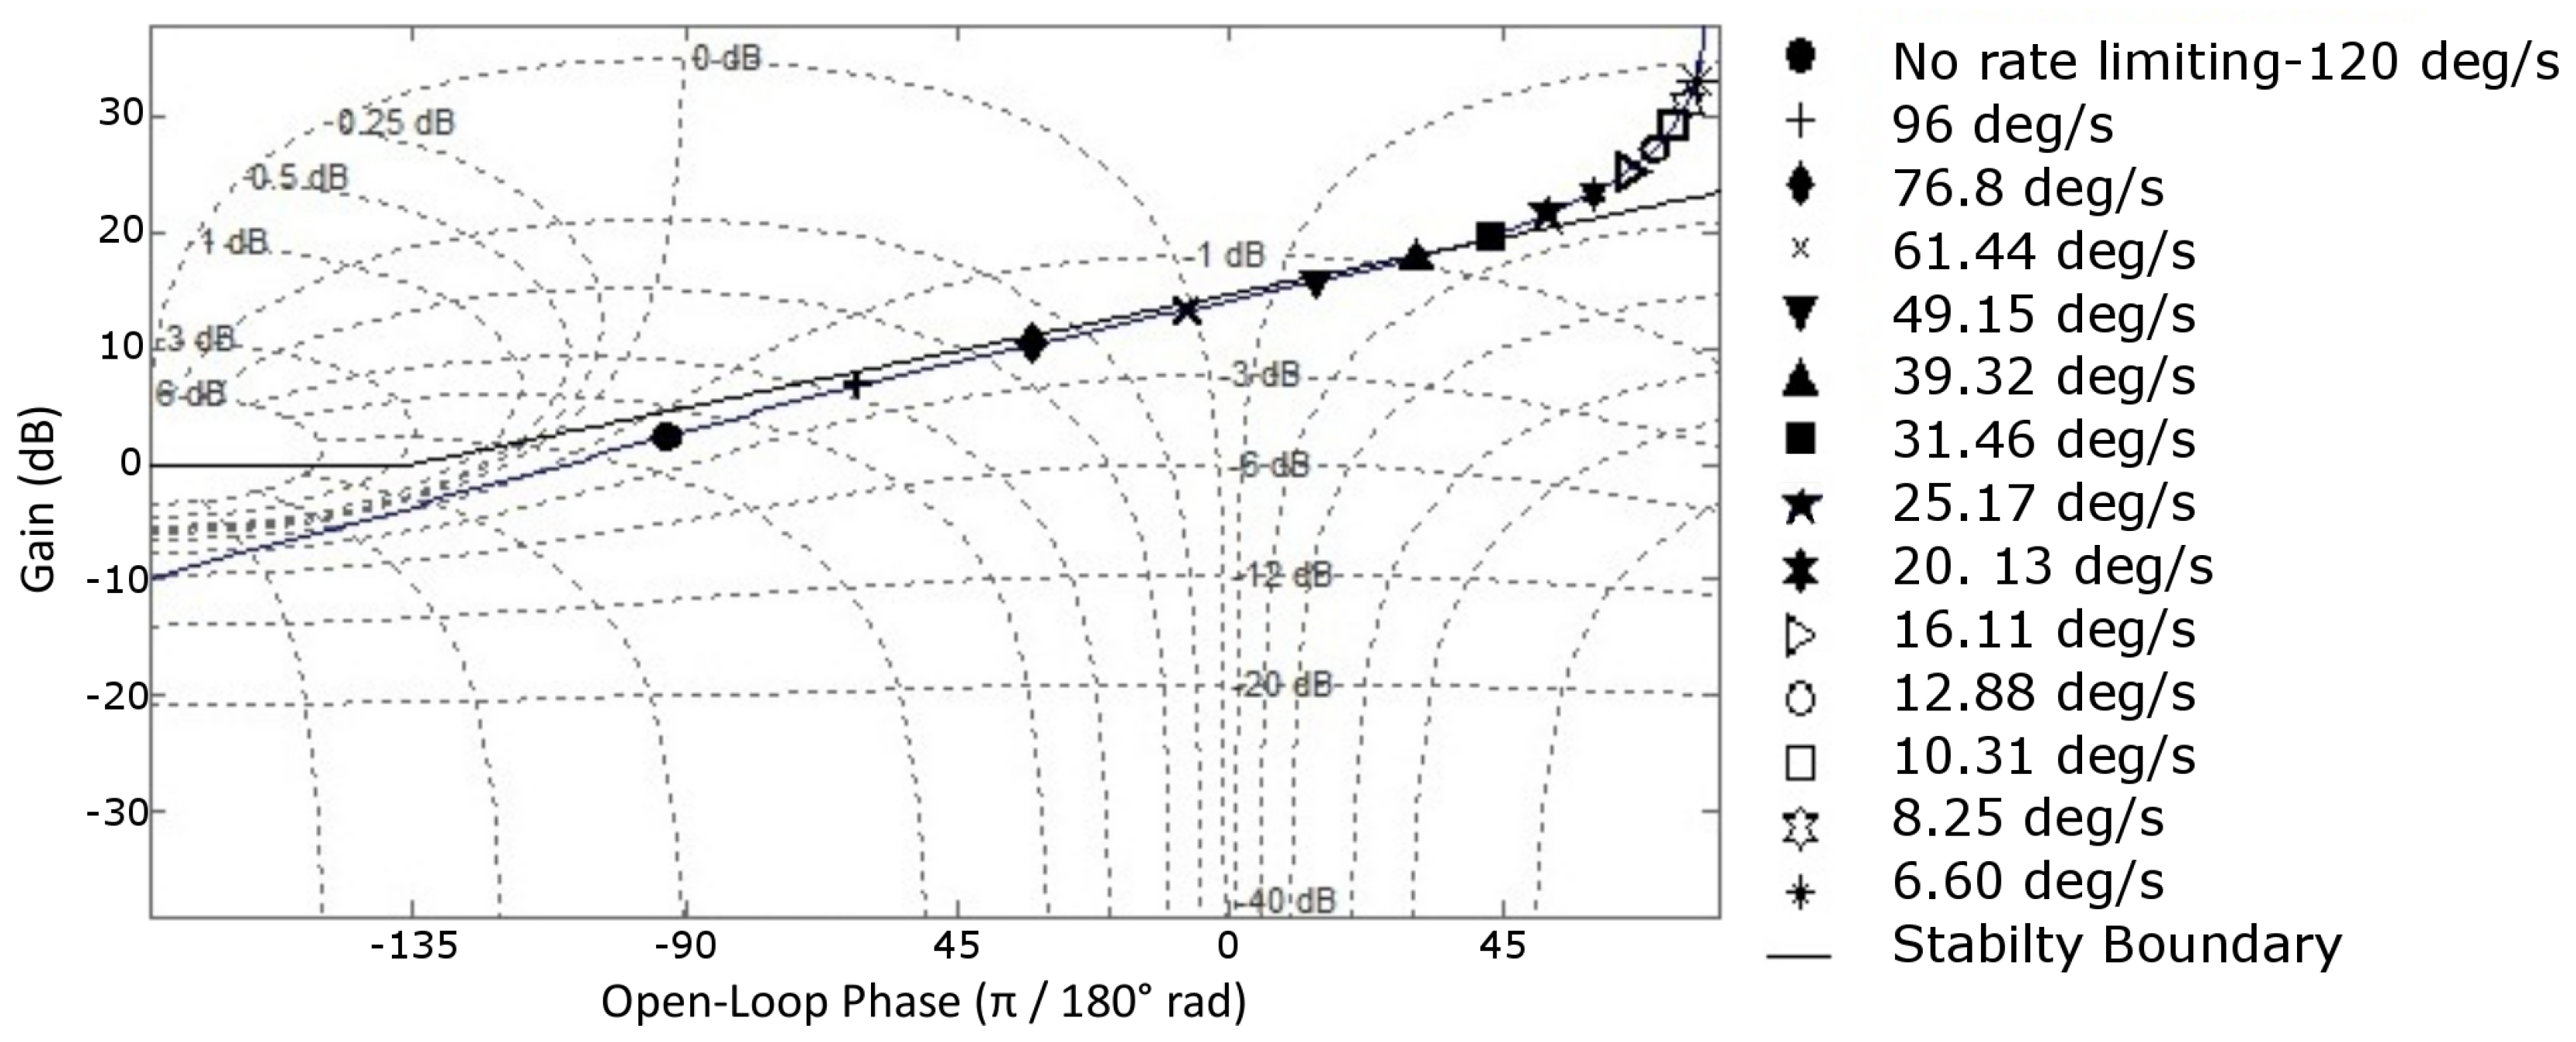
3.1.4. Phase Rate Criterion and Gain Phase Template (Average Phase Rate)
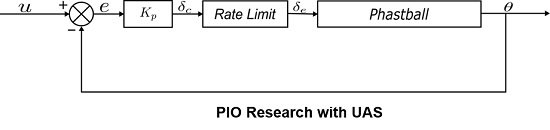
3.2. Category 2 PIO Analysis
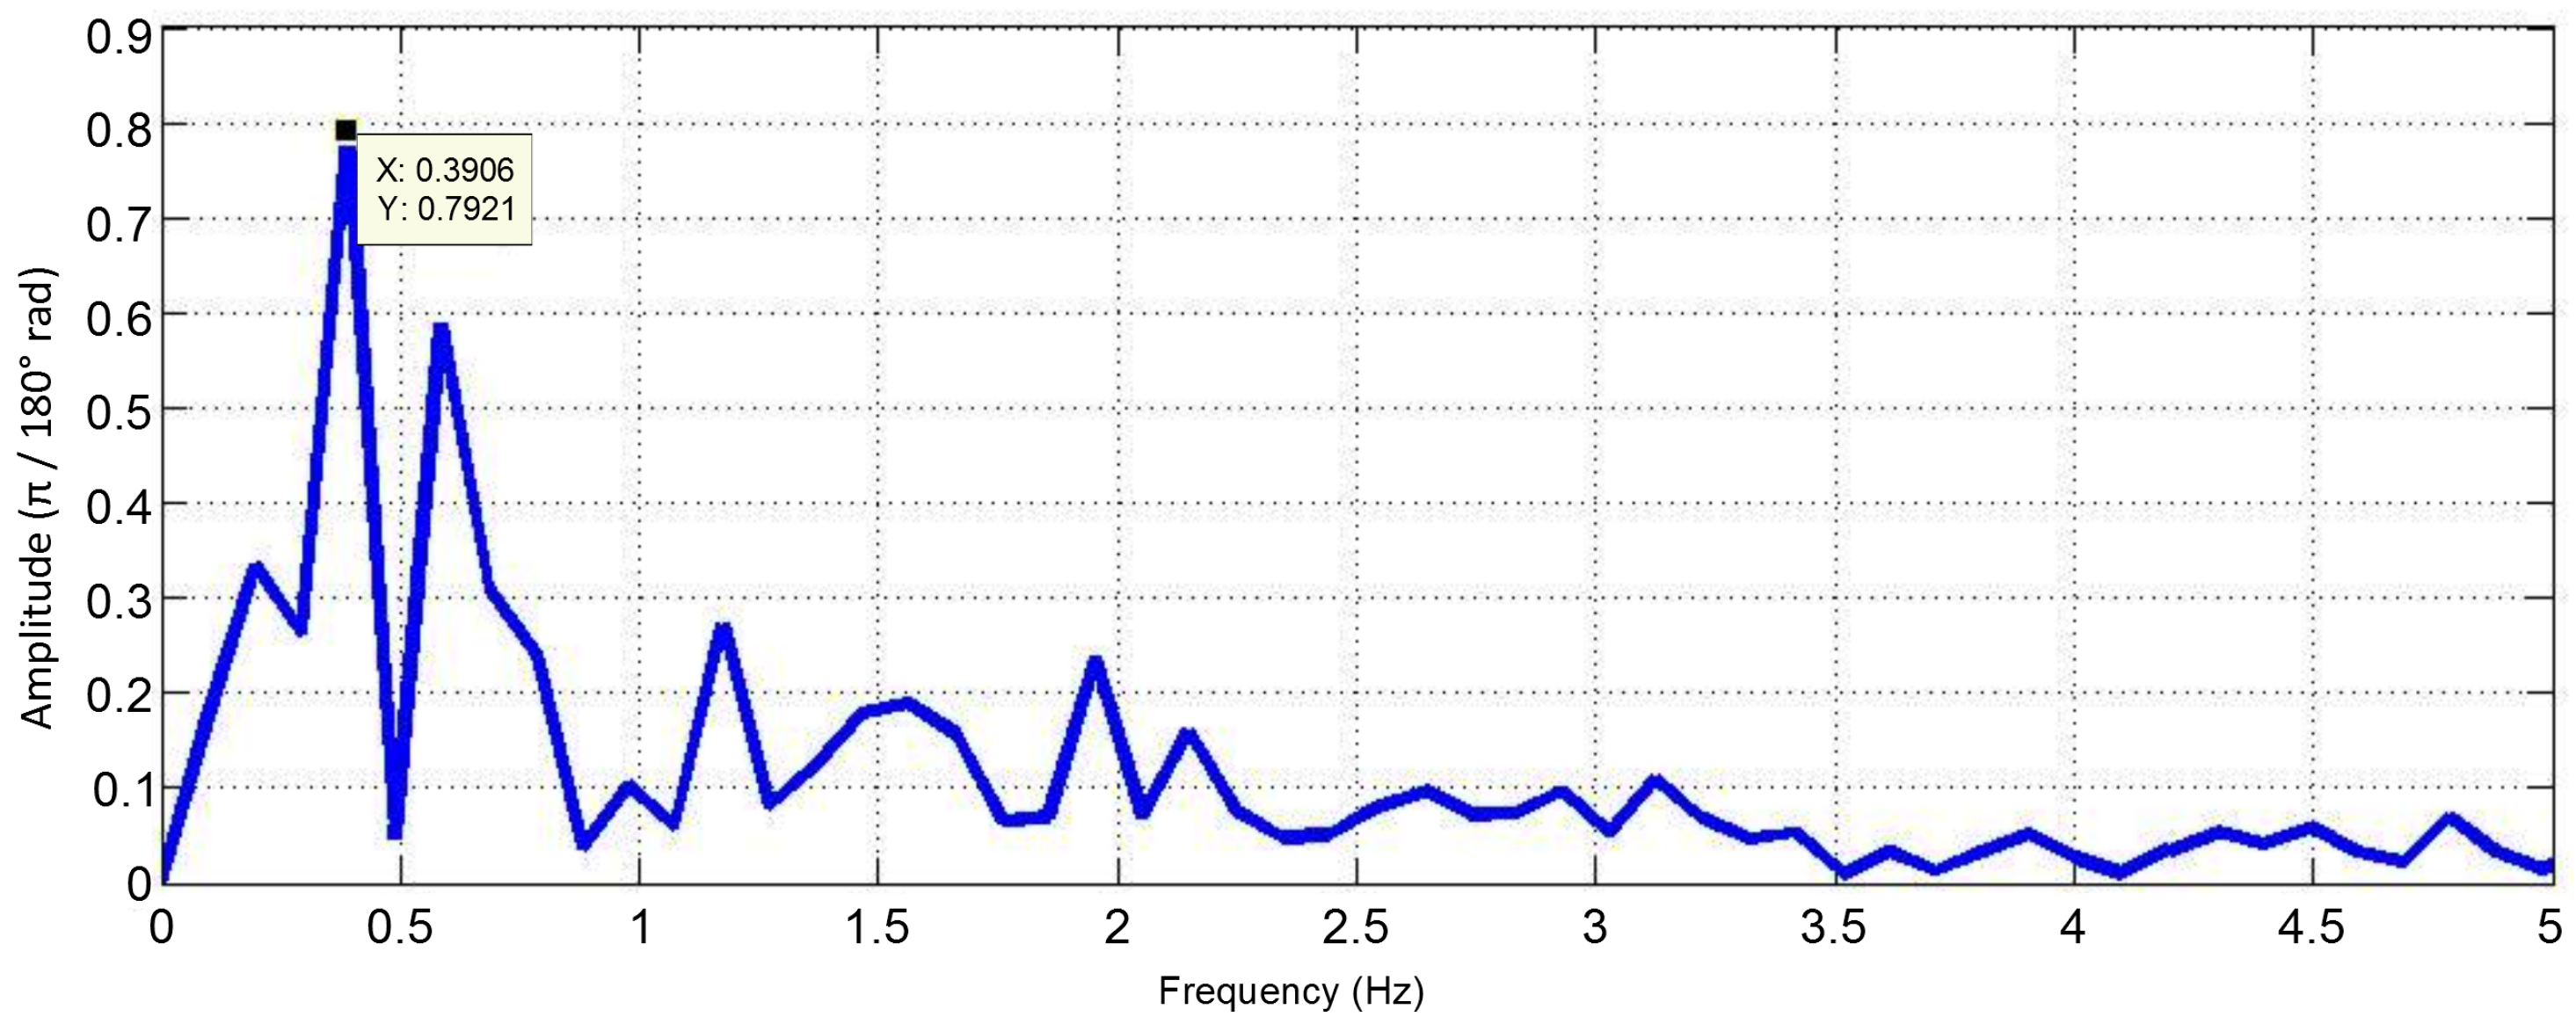
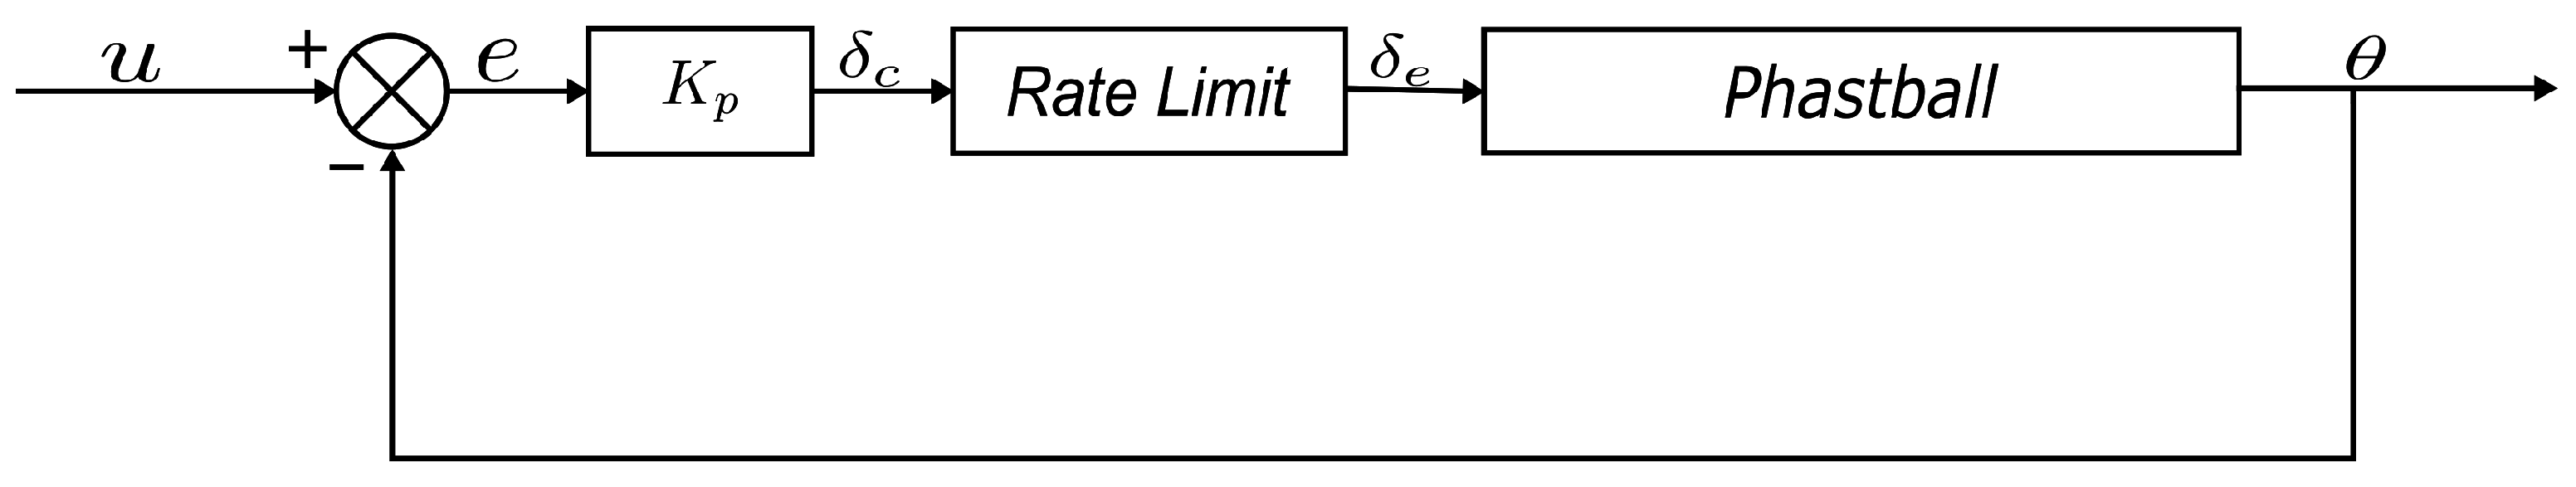
4. “Phastball” Pilot Command Analysis and Pilot Model Parameter Estimation
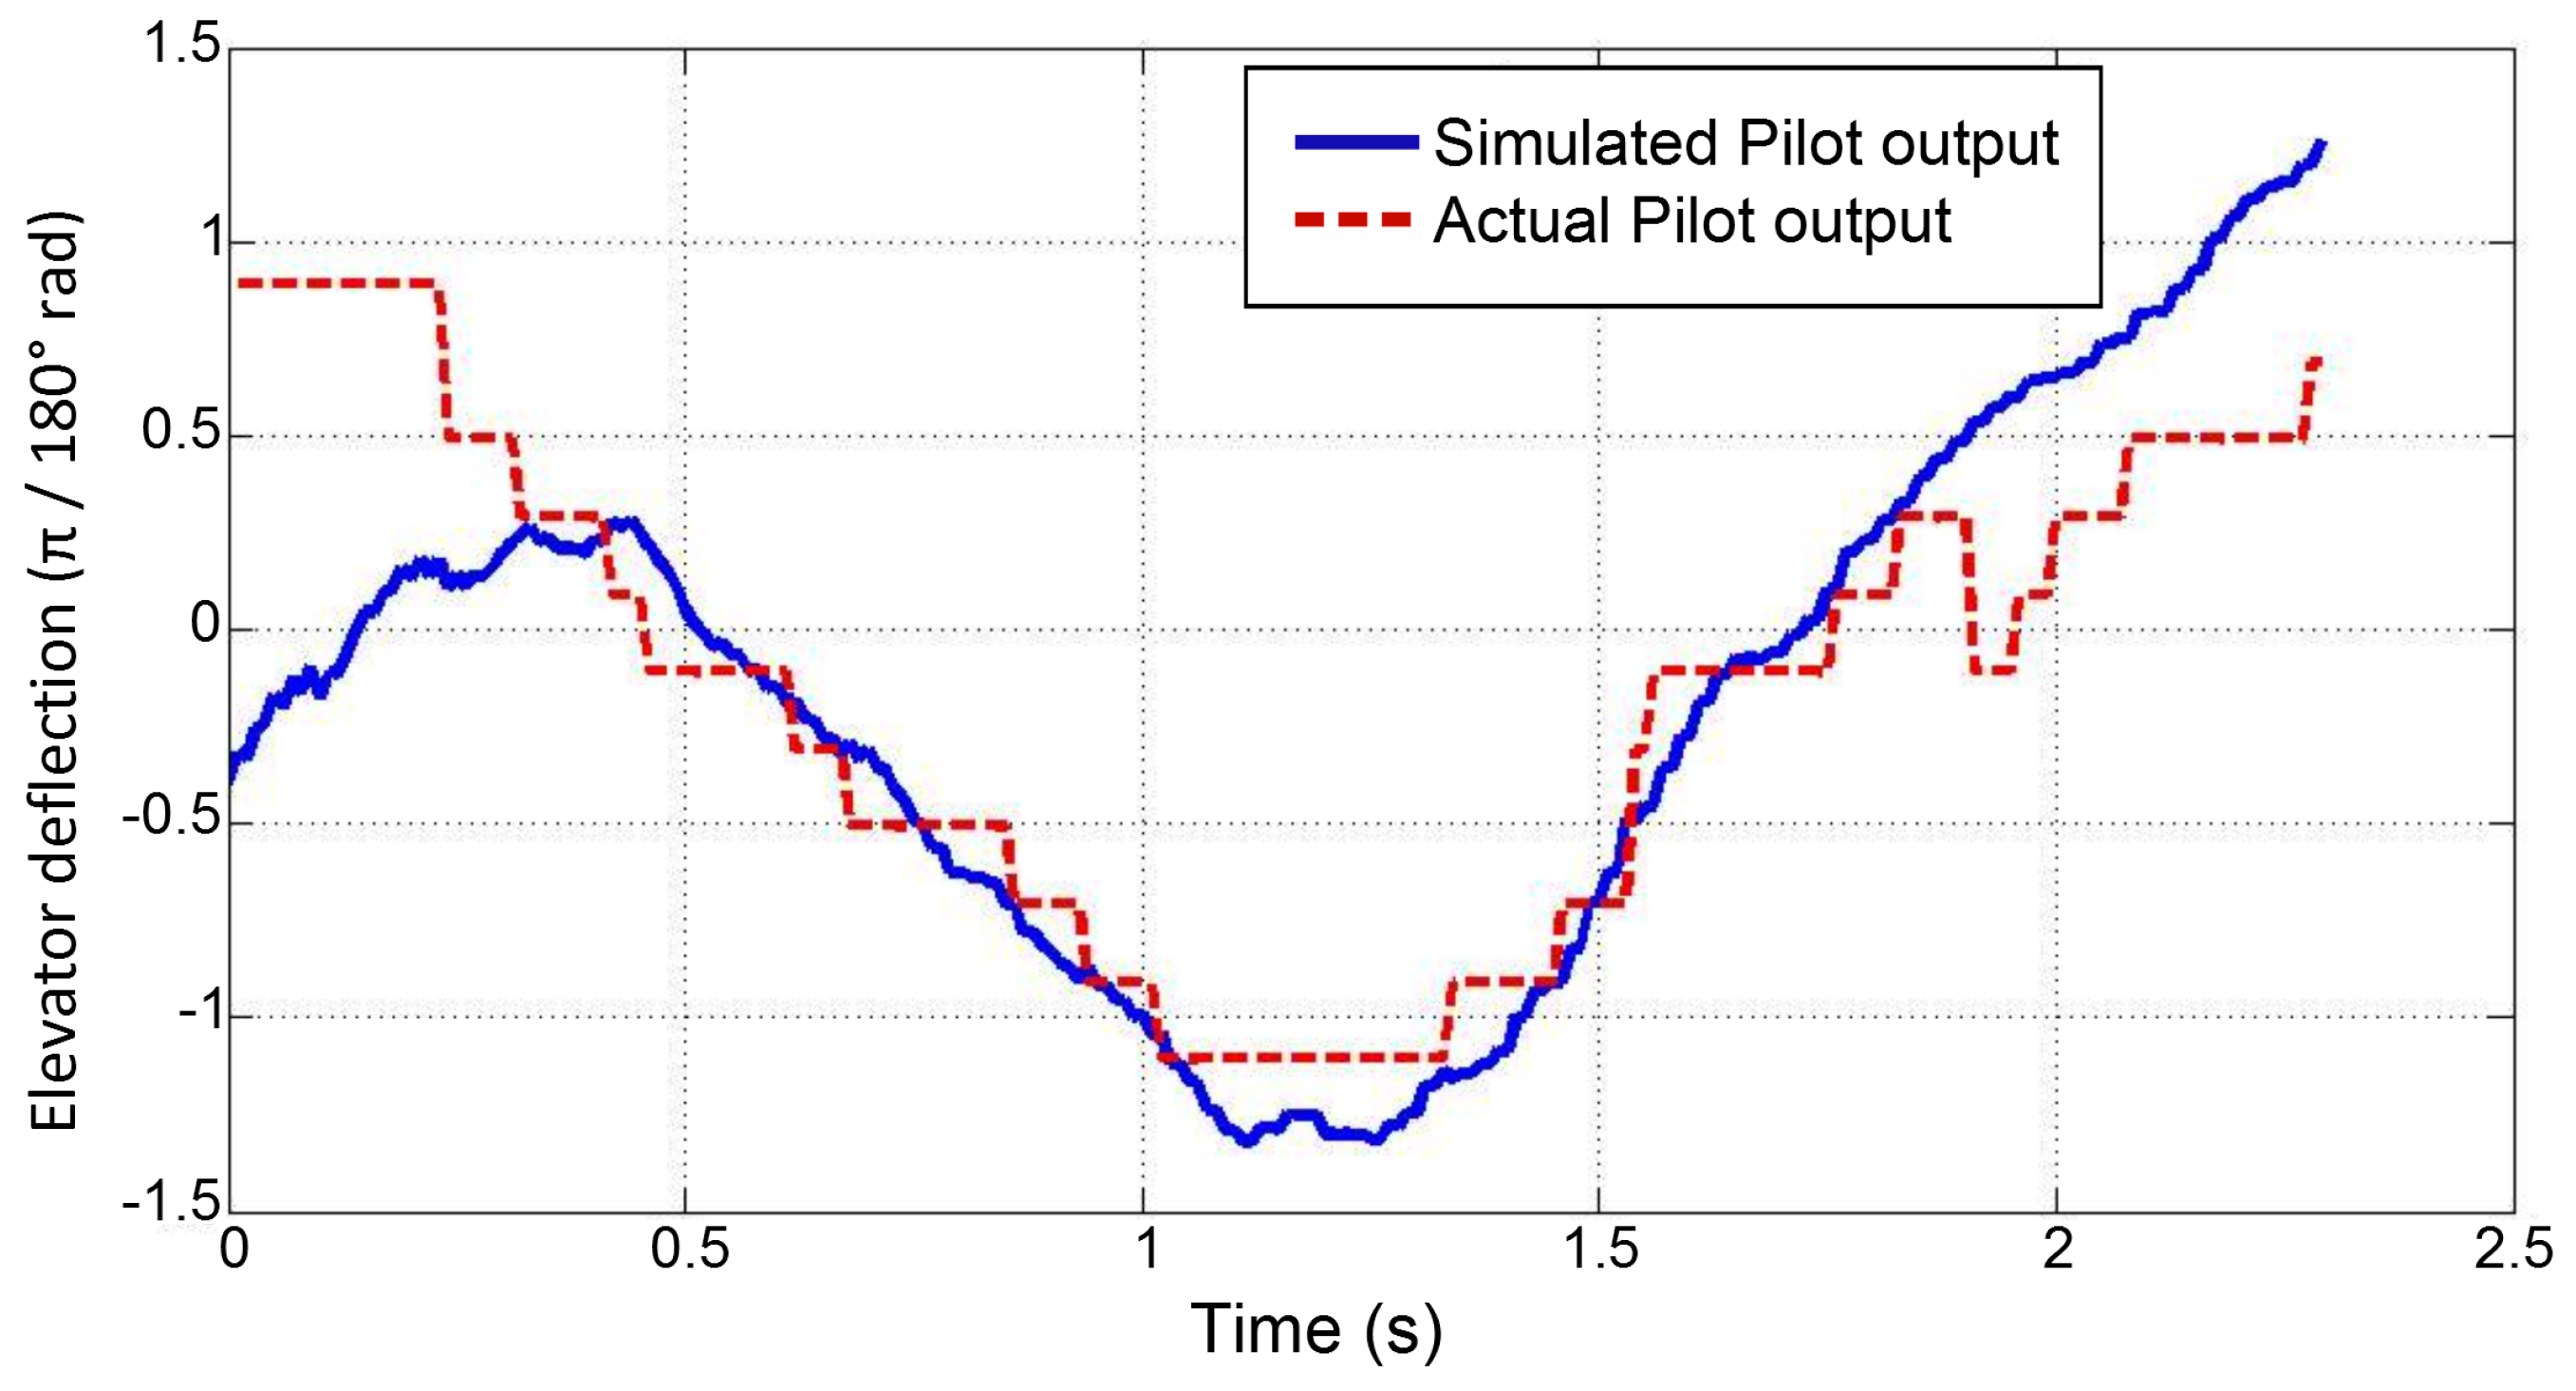
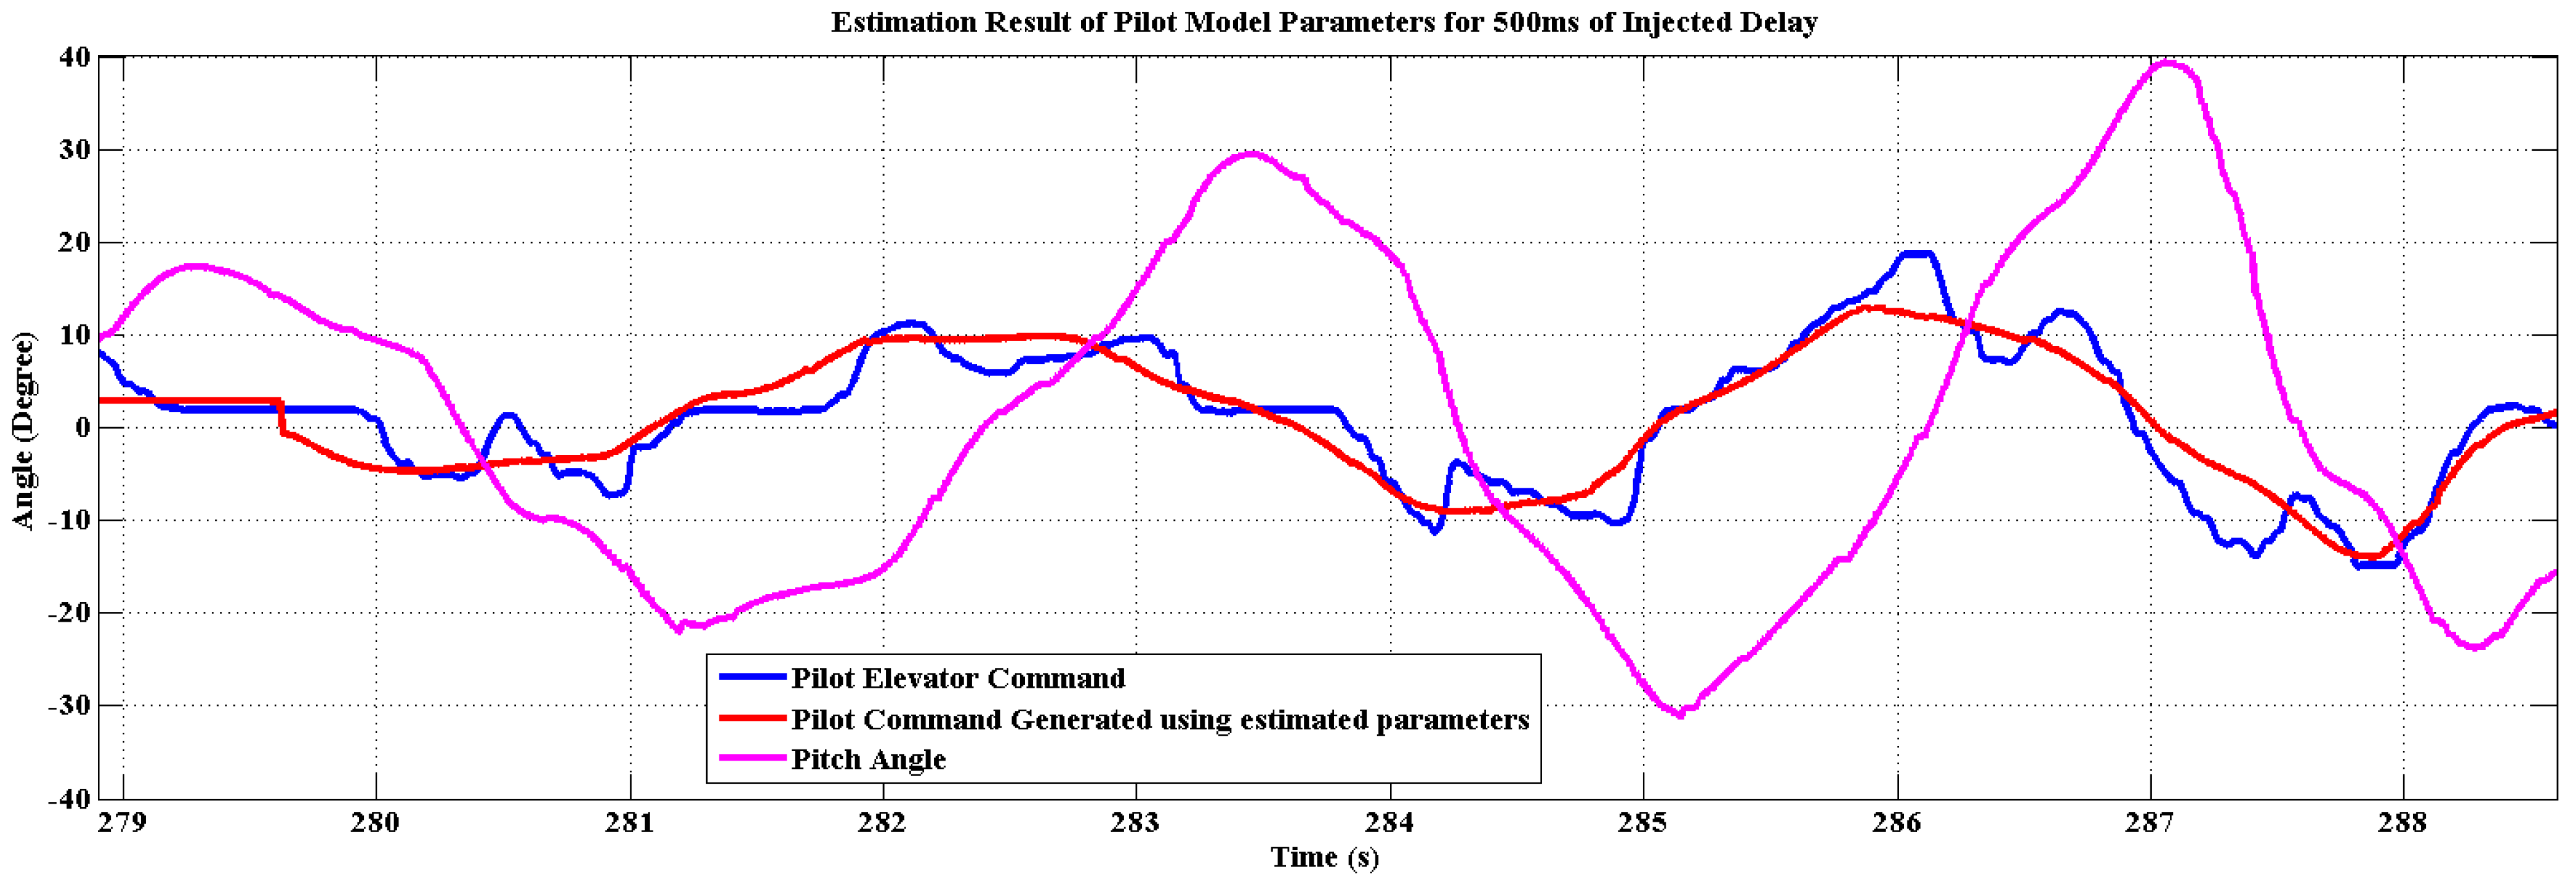
Pilot Model Parameter Estimation
5. “Phastball” PVS Stability Analysis
5.1. Category 1 PIO
5.2. Category 2 PIO
6. Conclusions
- Is PIO possible in UAS?
- −
- Section 2 provides example of PIO events seen during “Phastball” flight test.
- Effectiveness of existing PIO criteria developed for manned aircraft when applied to UAS?
- −
- Section 3 evaluates various existing PIO criteria for “Phastball” for both Category 1 and Category 2 PIO for “Phastball”. Existing Category 1 PIO methods such as Bandwidth/Pitch Rate Overshoot and Phase Rate criteria and the Category 2 PIO method OLOP provide sufficiently accurate PIO predictions for “Phastball”. The conventional PIO analysis techniques which do not agree with “Phastball” flight test results, such as Neal-Smith and Phase Template criteria can in part be attributed to the fact that the existing PIO susceptibility boundaries were developed for large manned aircraft and the same boundaries may not hold for a small R/C aircraft like “Phastball”.
- Batch estimation technique accuracy in determining McRuer model parameters?
- −
- Section 4 carries out batch estimation of the data for straight leg and landing phase. The batch estimated parameters gave poor validation results. However, they still provided valuable information regarding the frequency characteristics of the pilot command.
- Closing the loop with pilot model and stability analysis accuracy for predicting PIO events?
- −
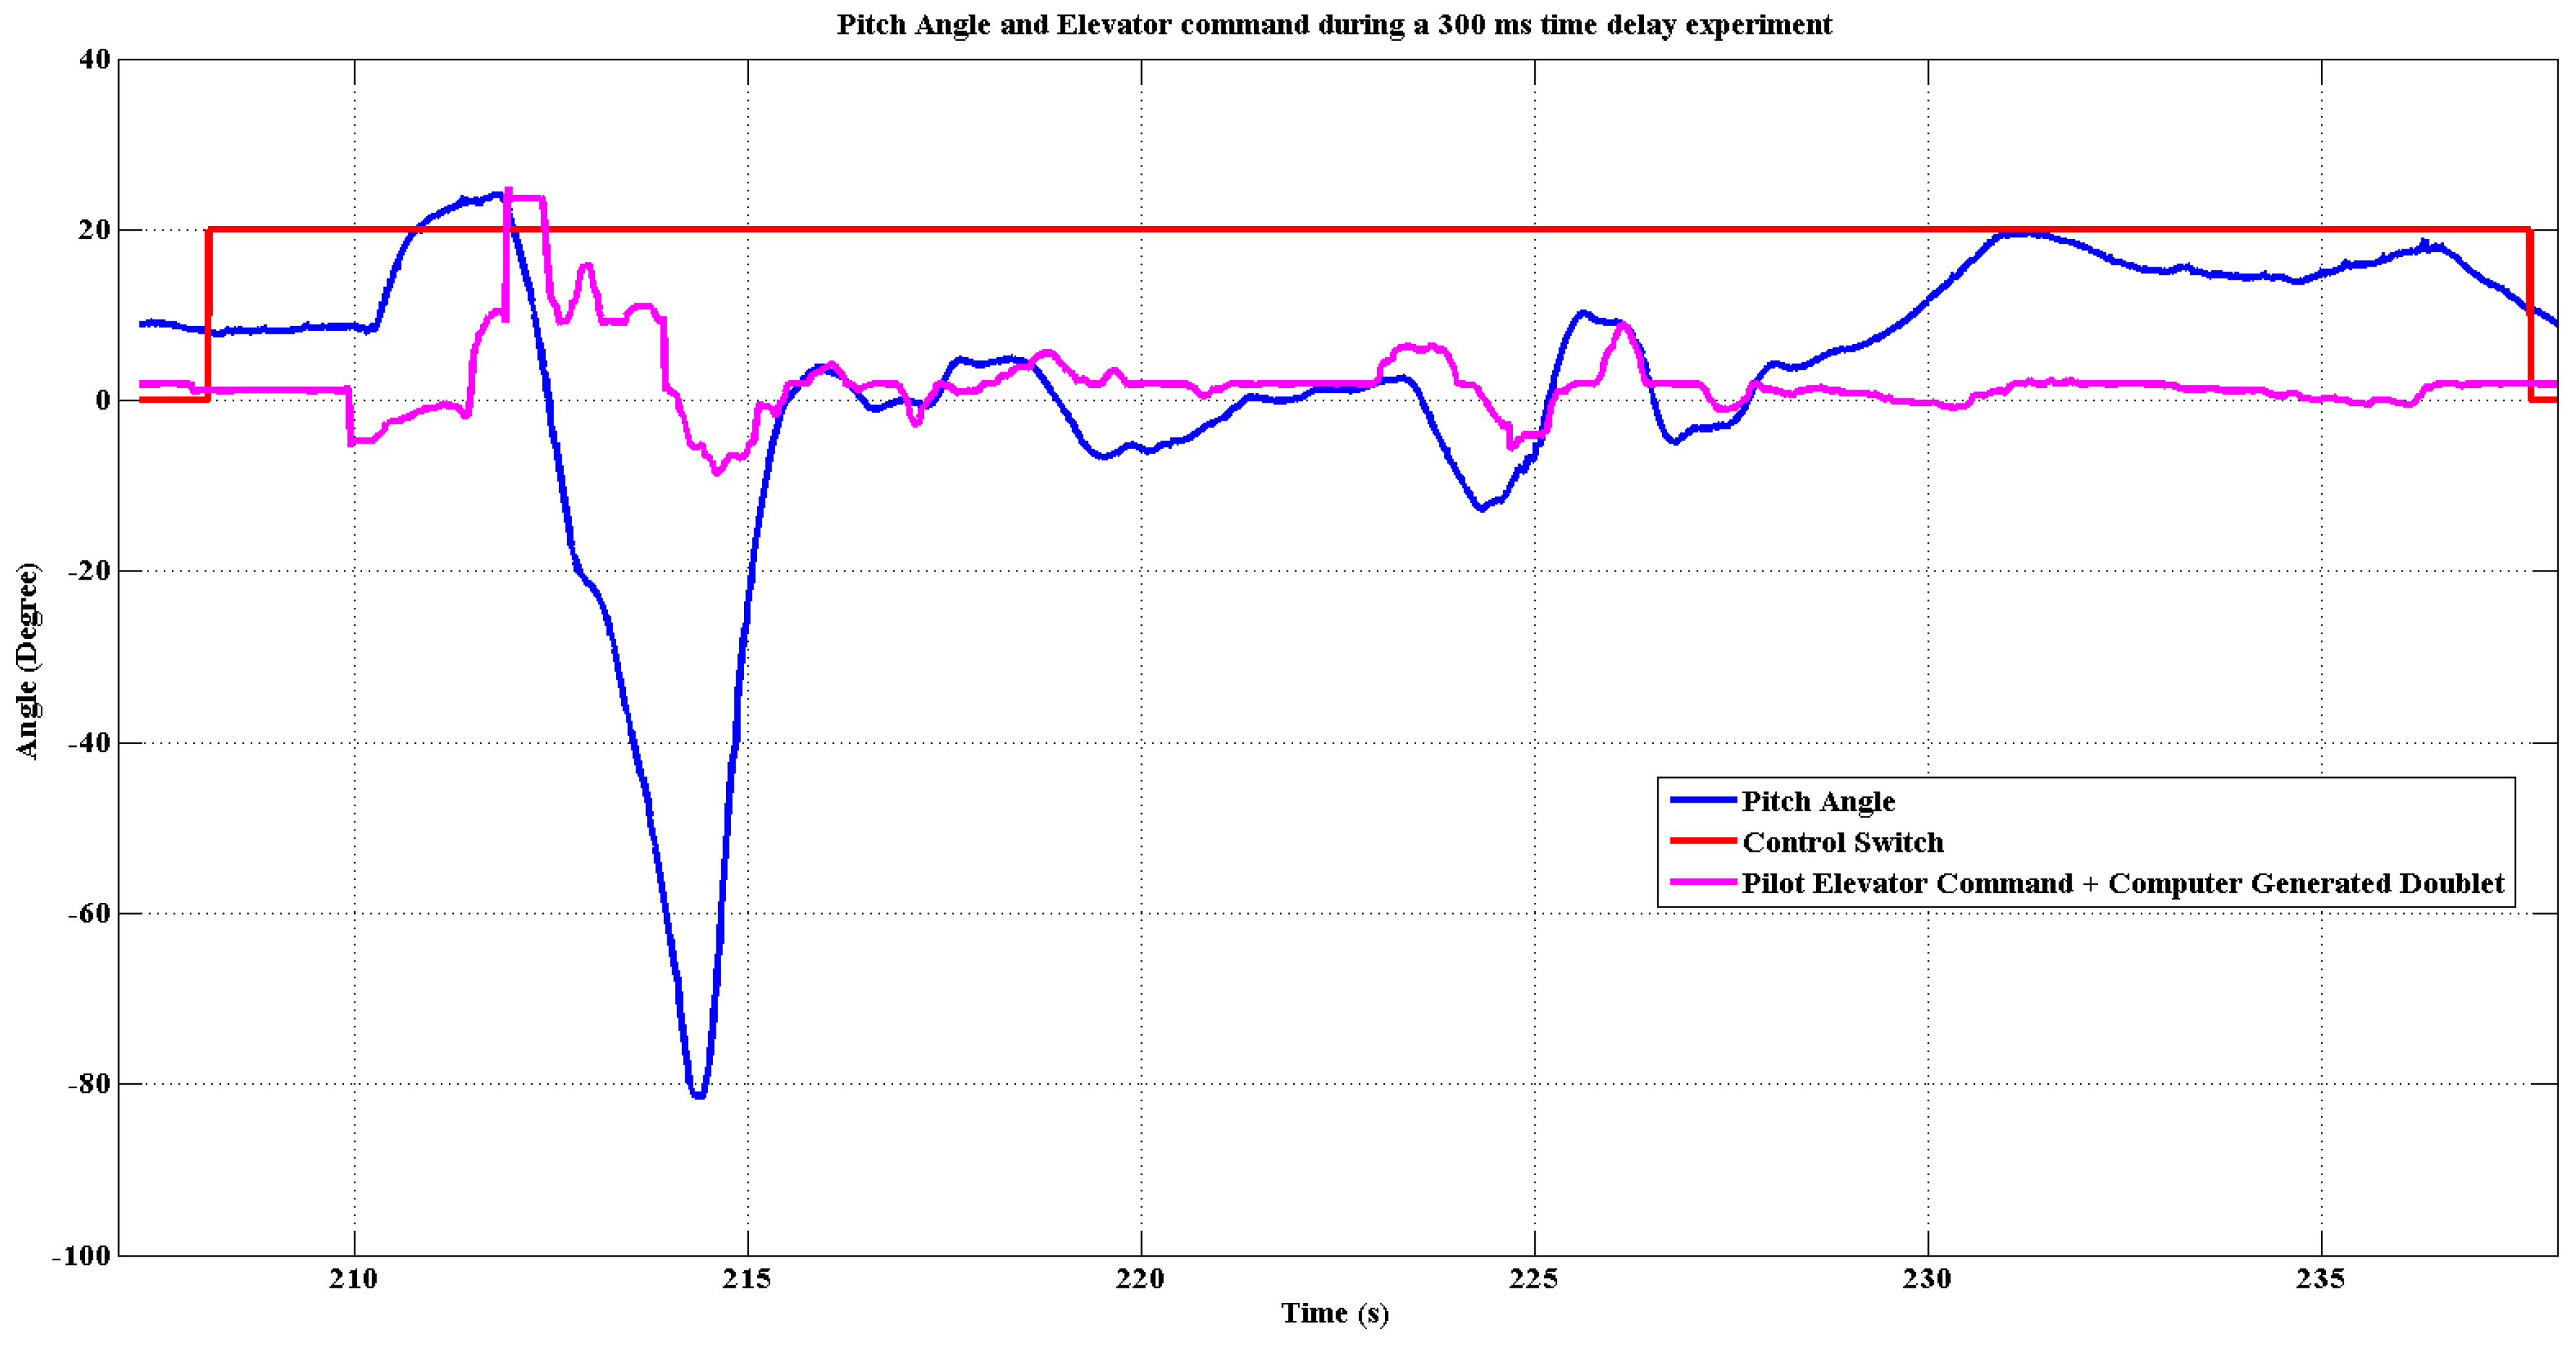
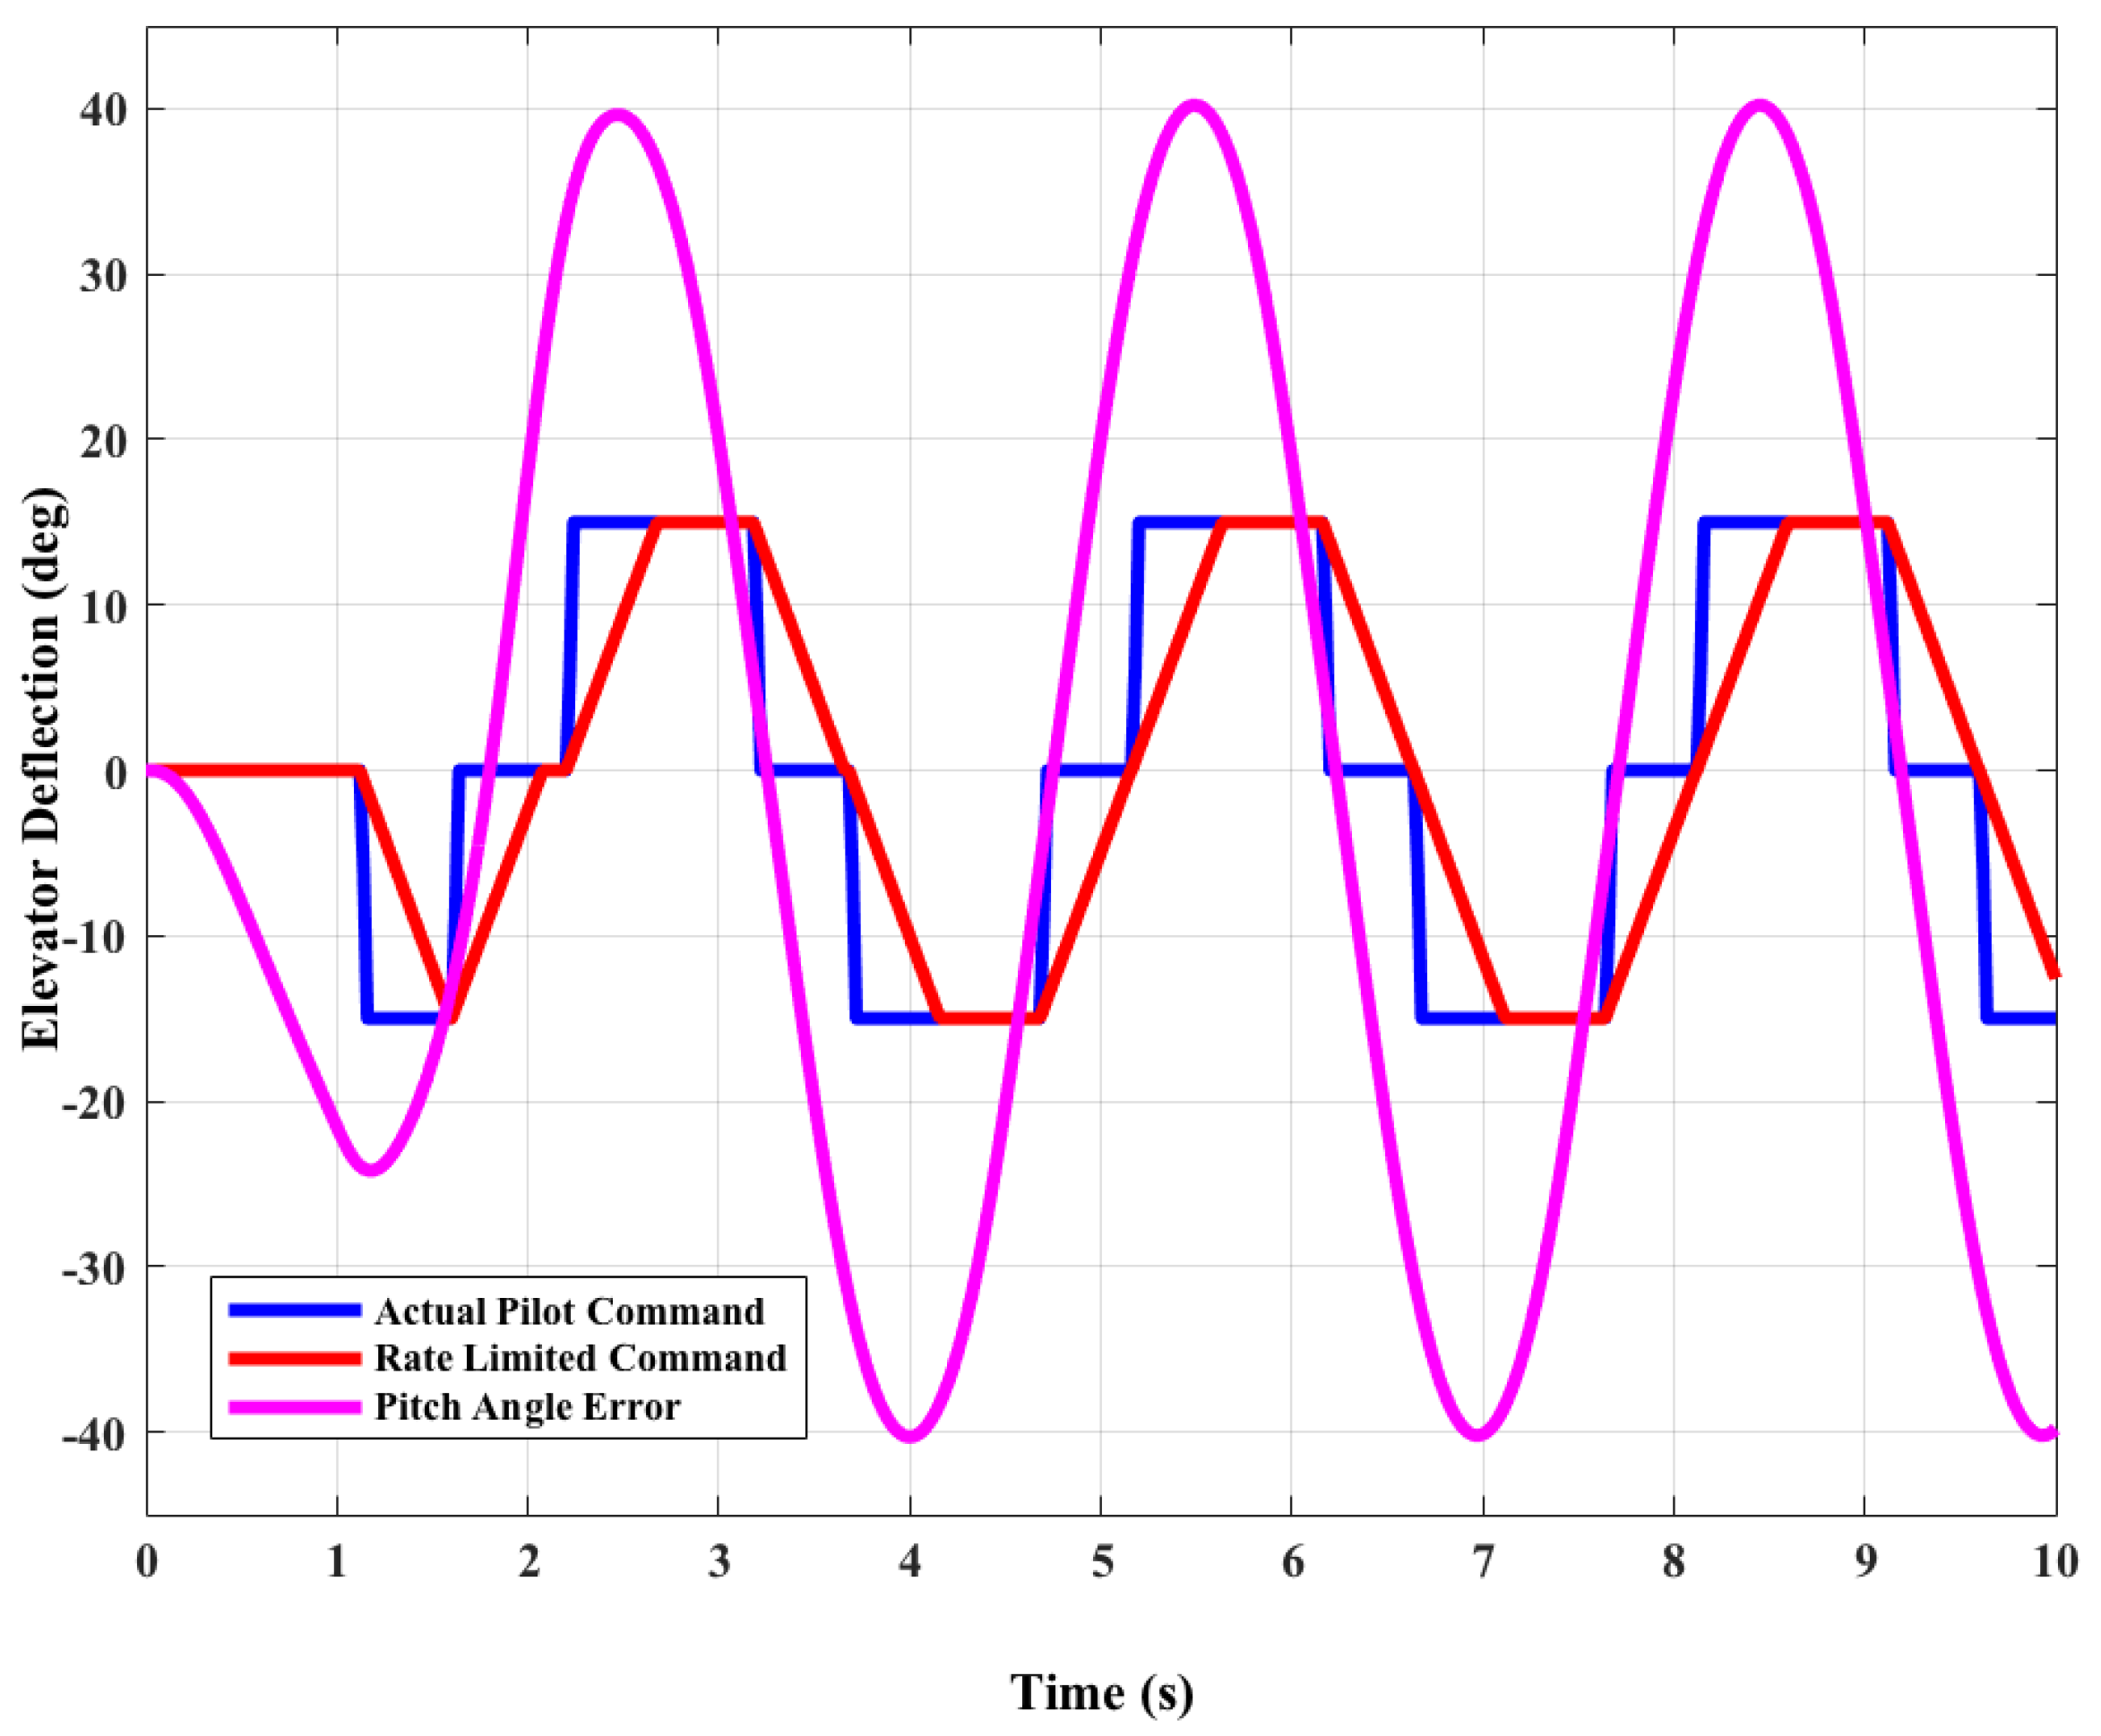
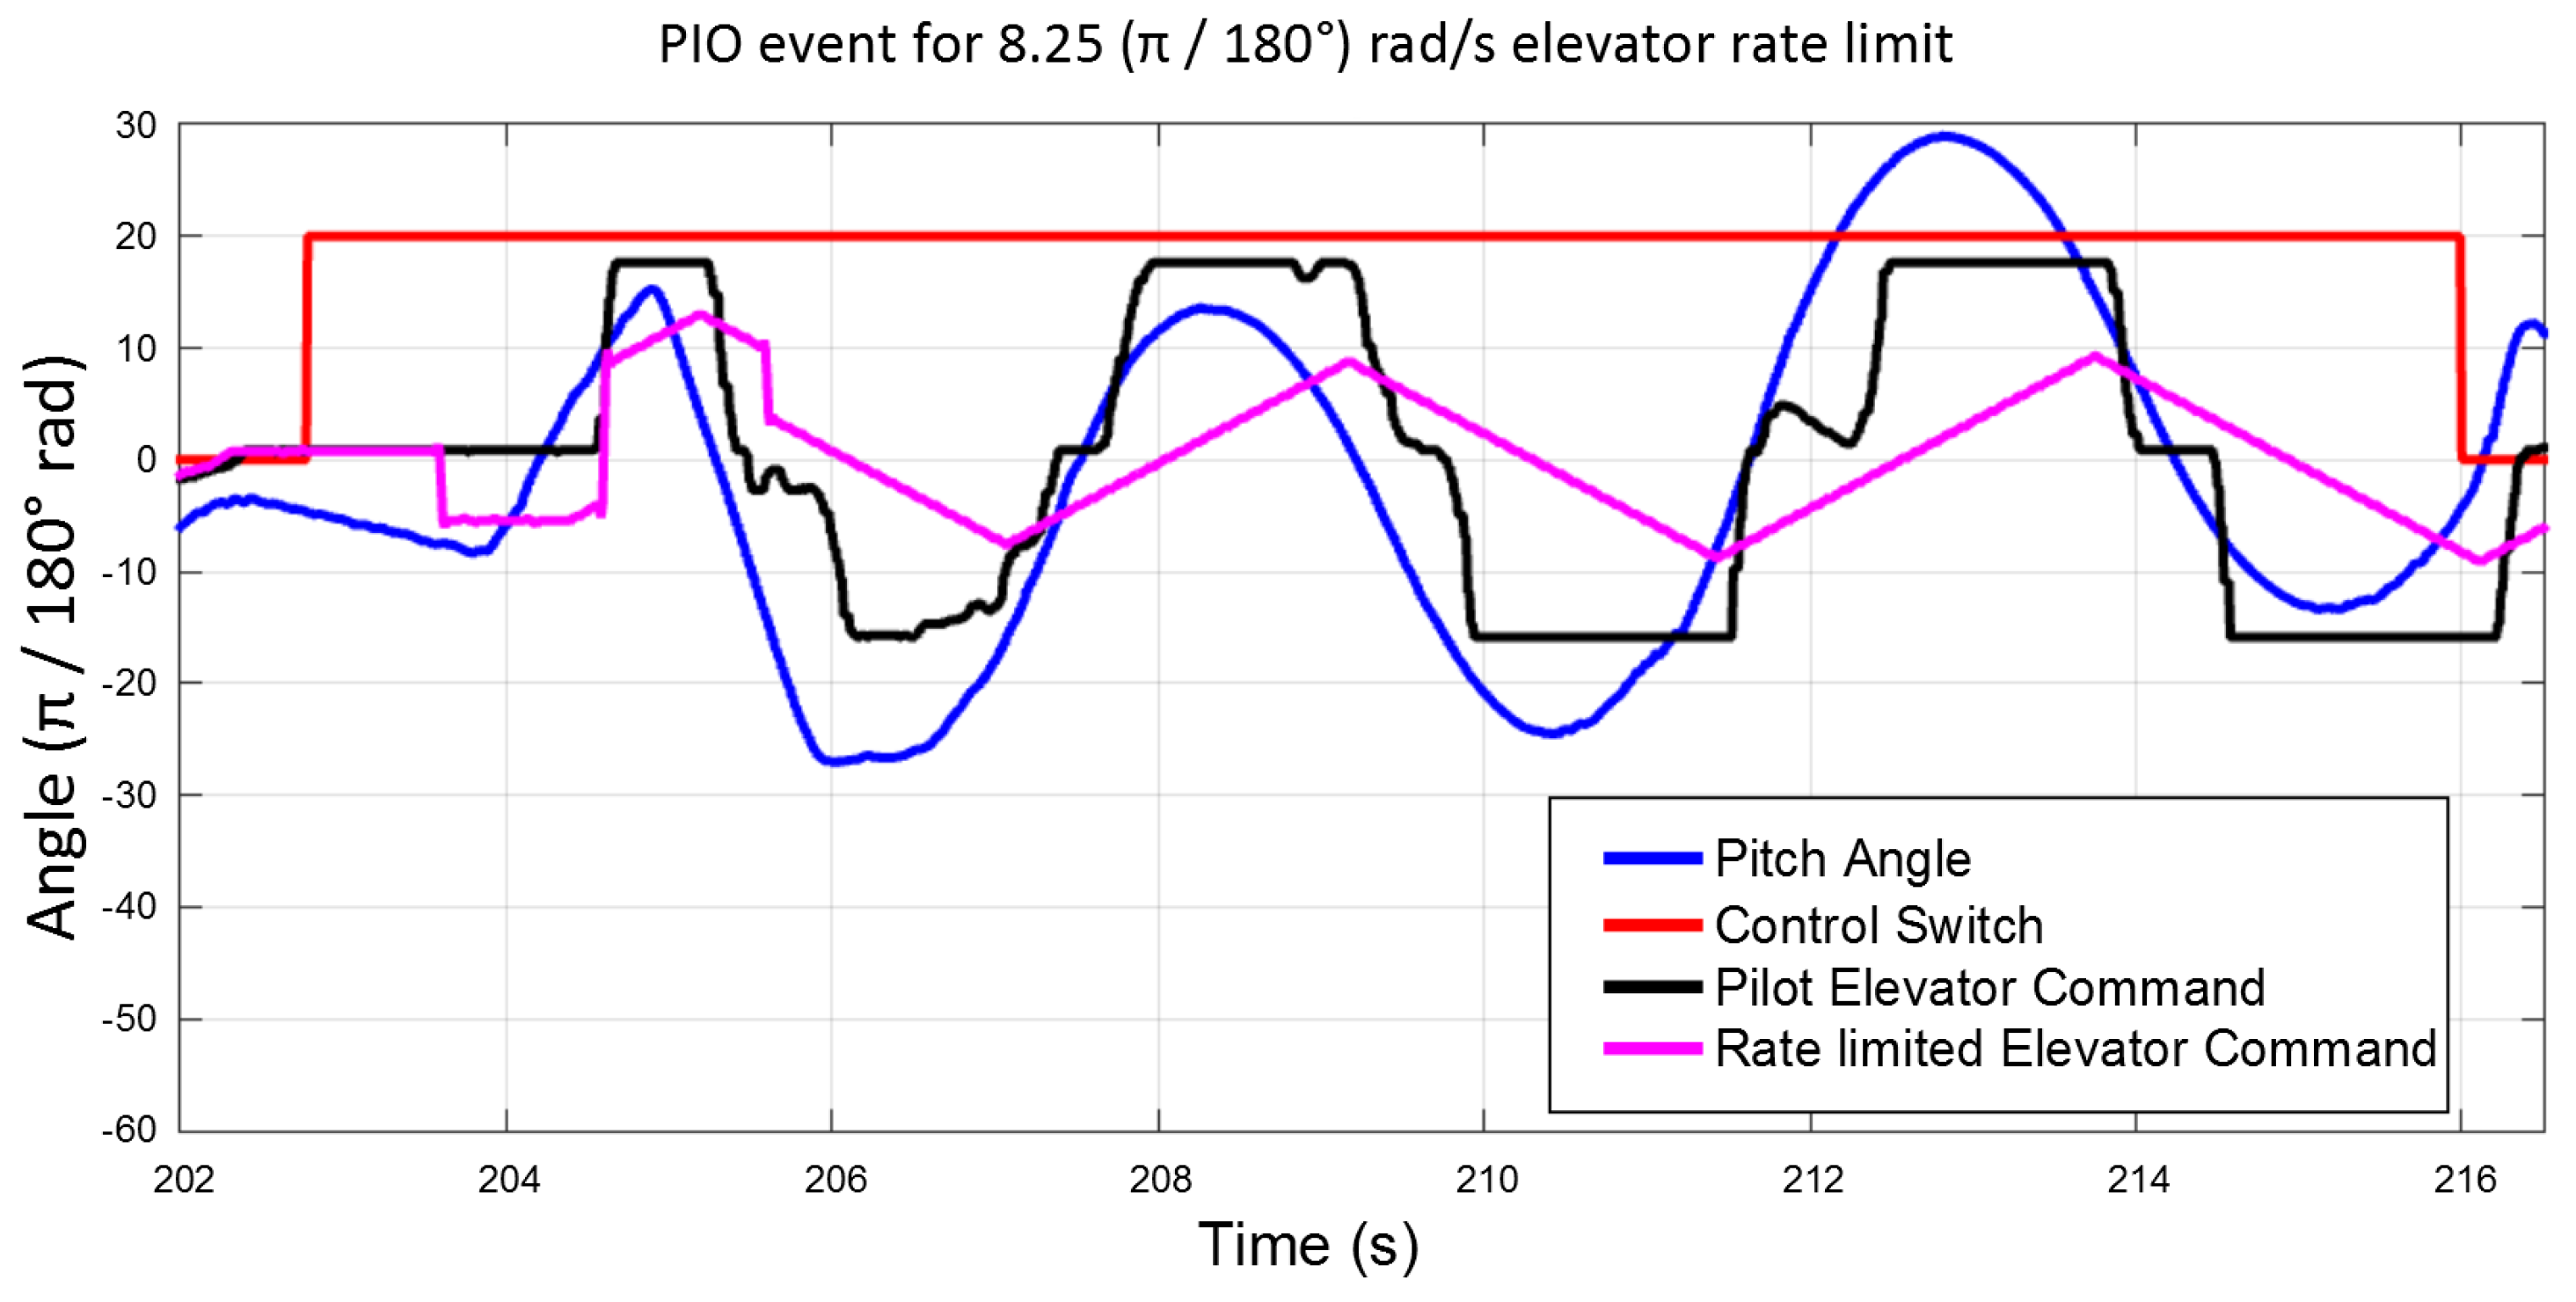
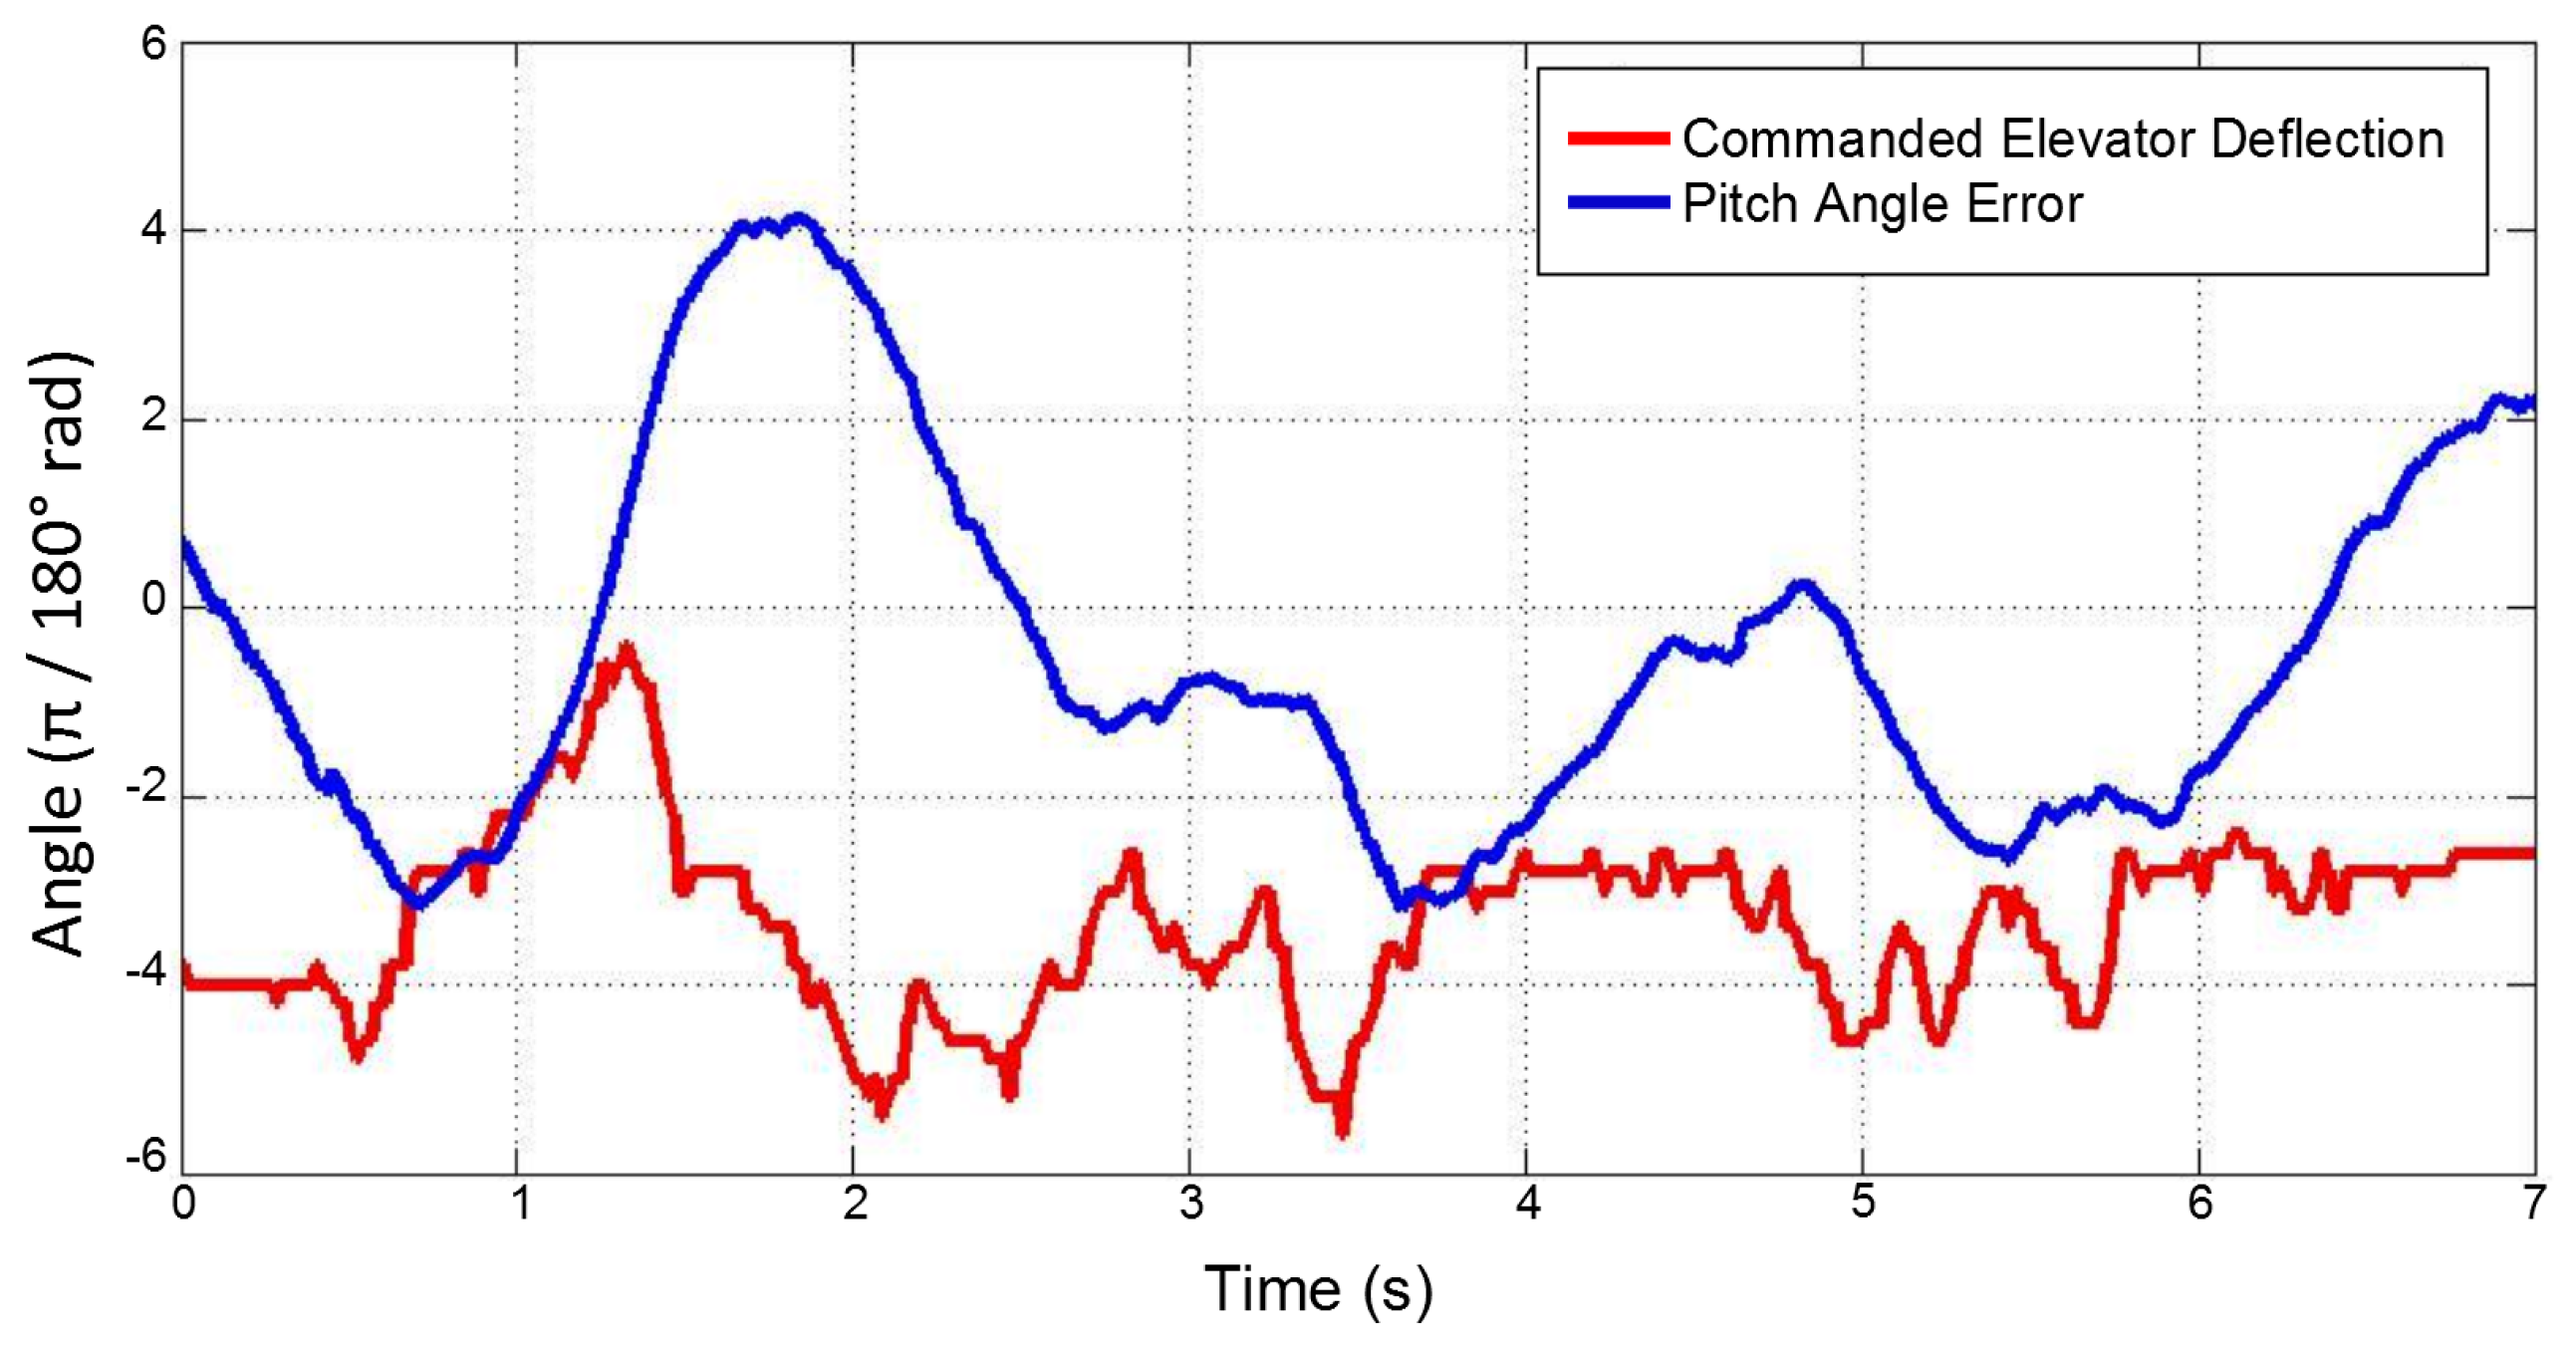
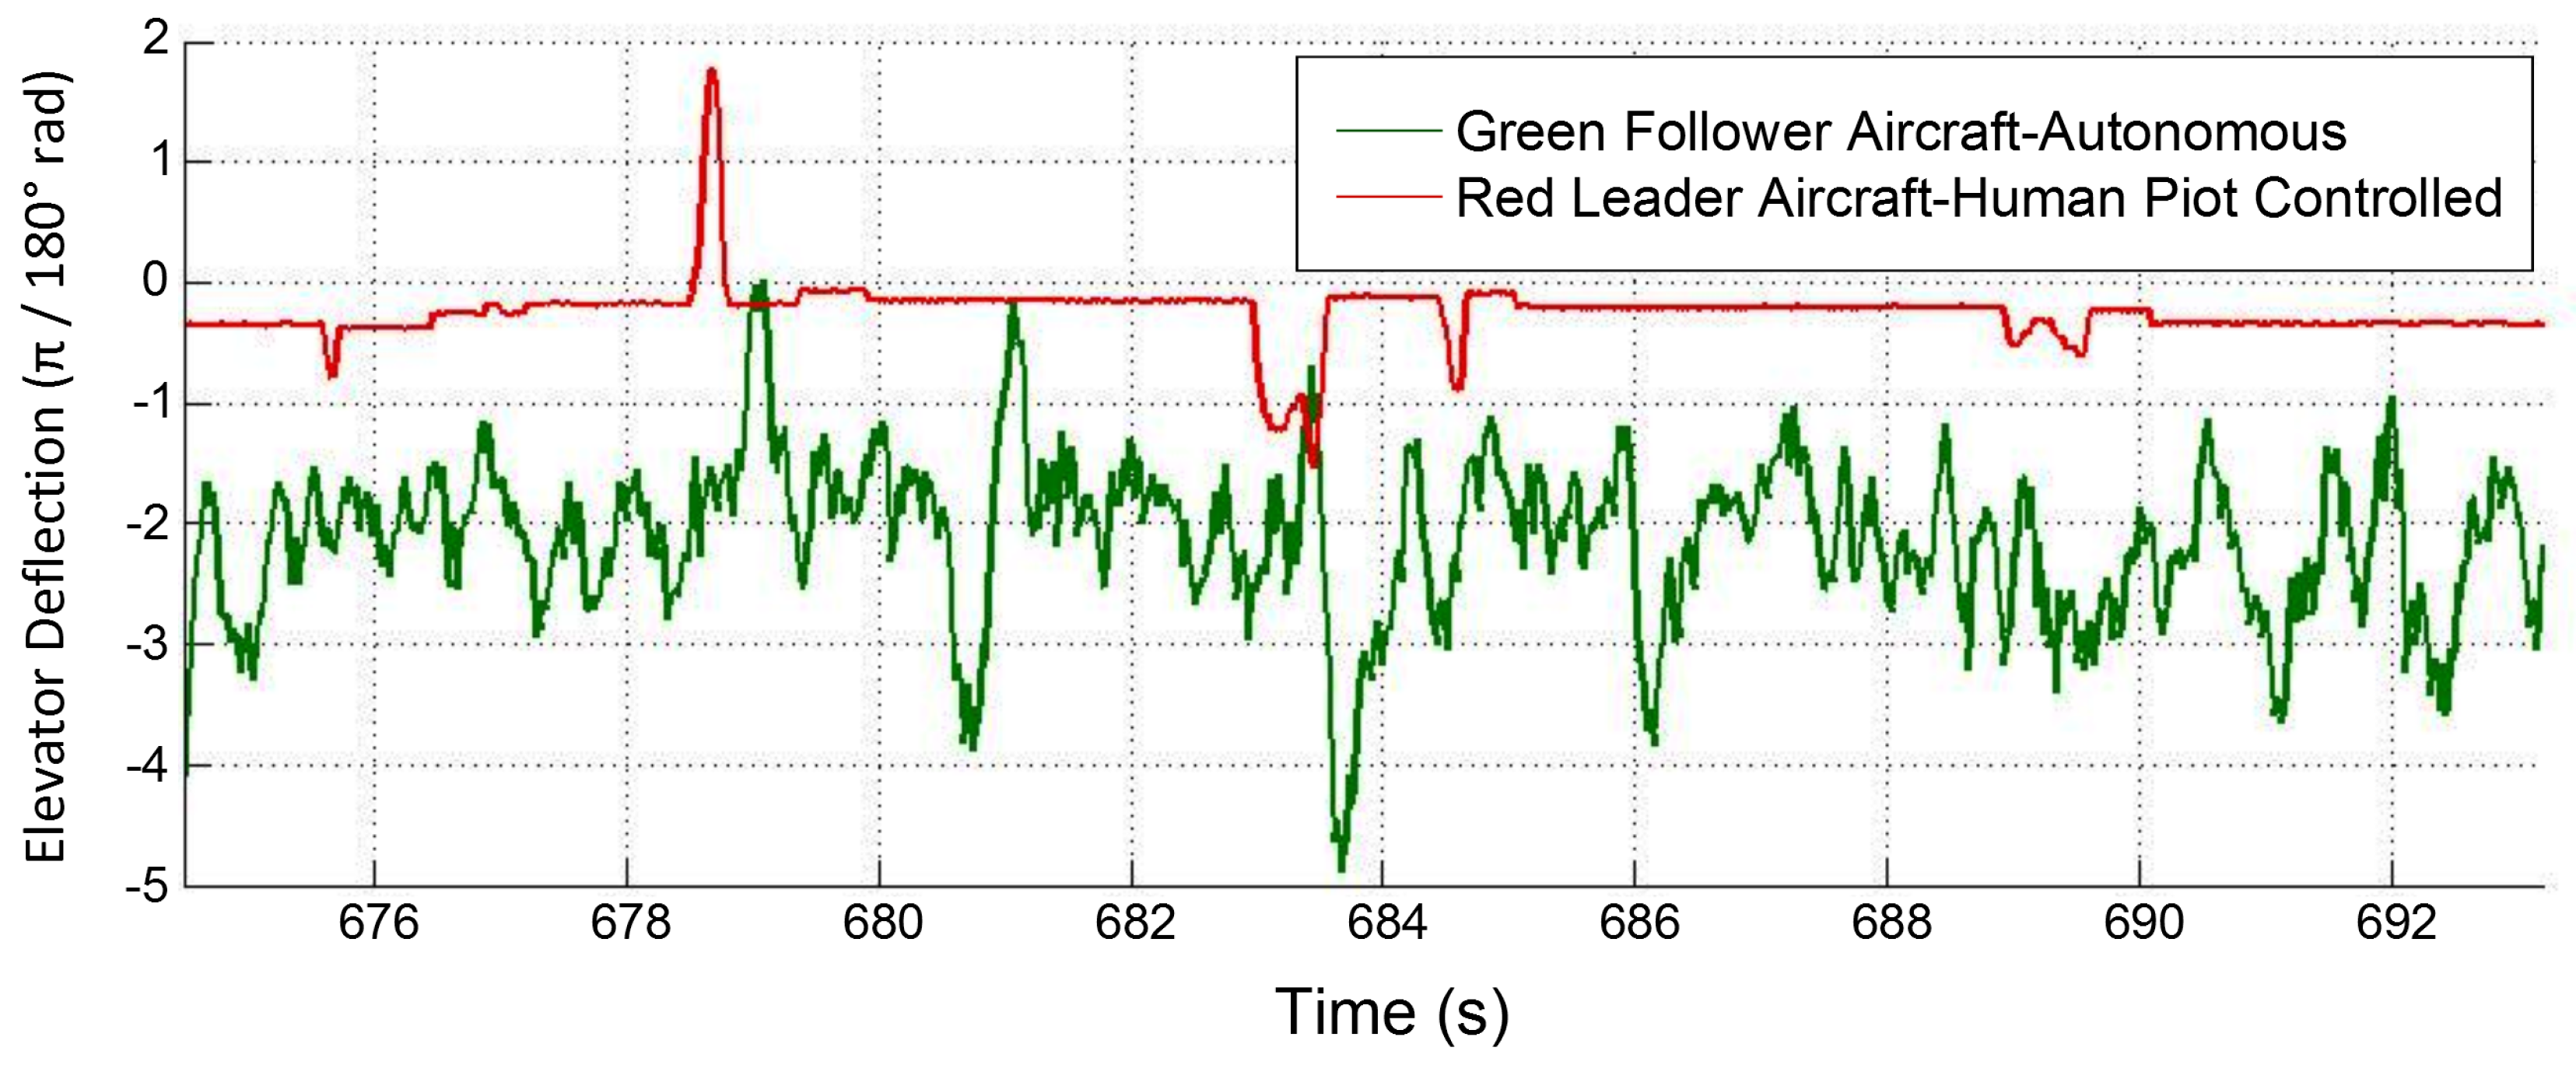
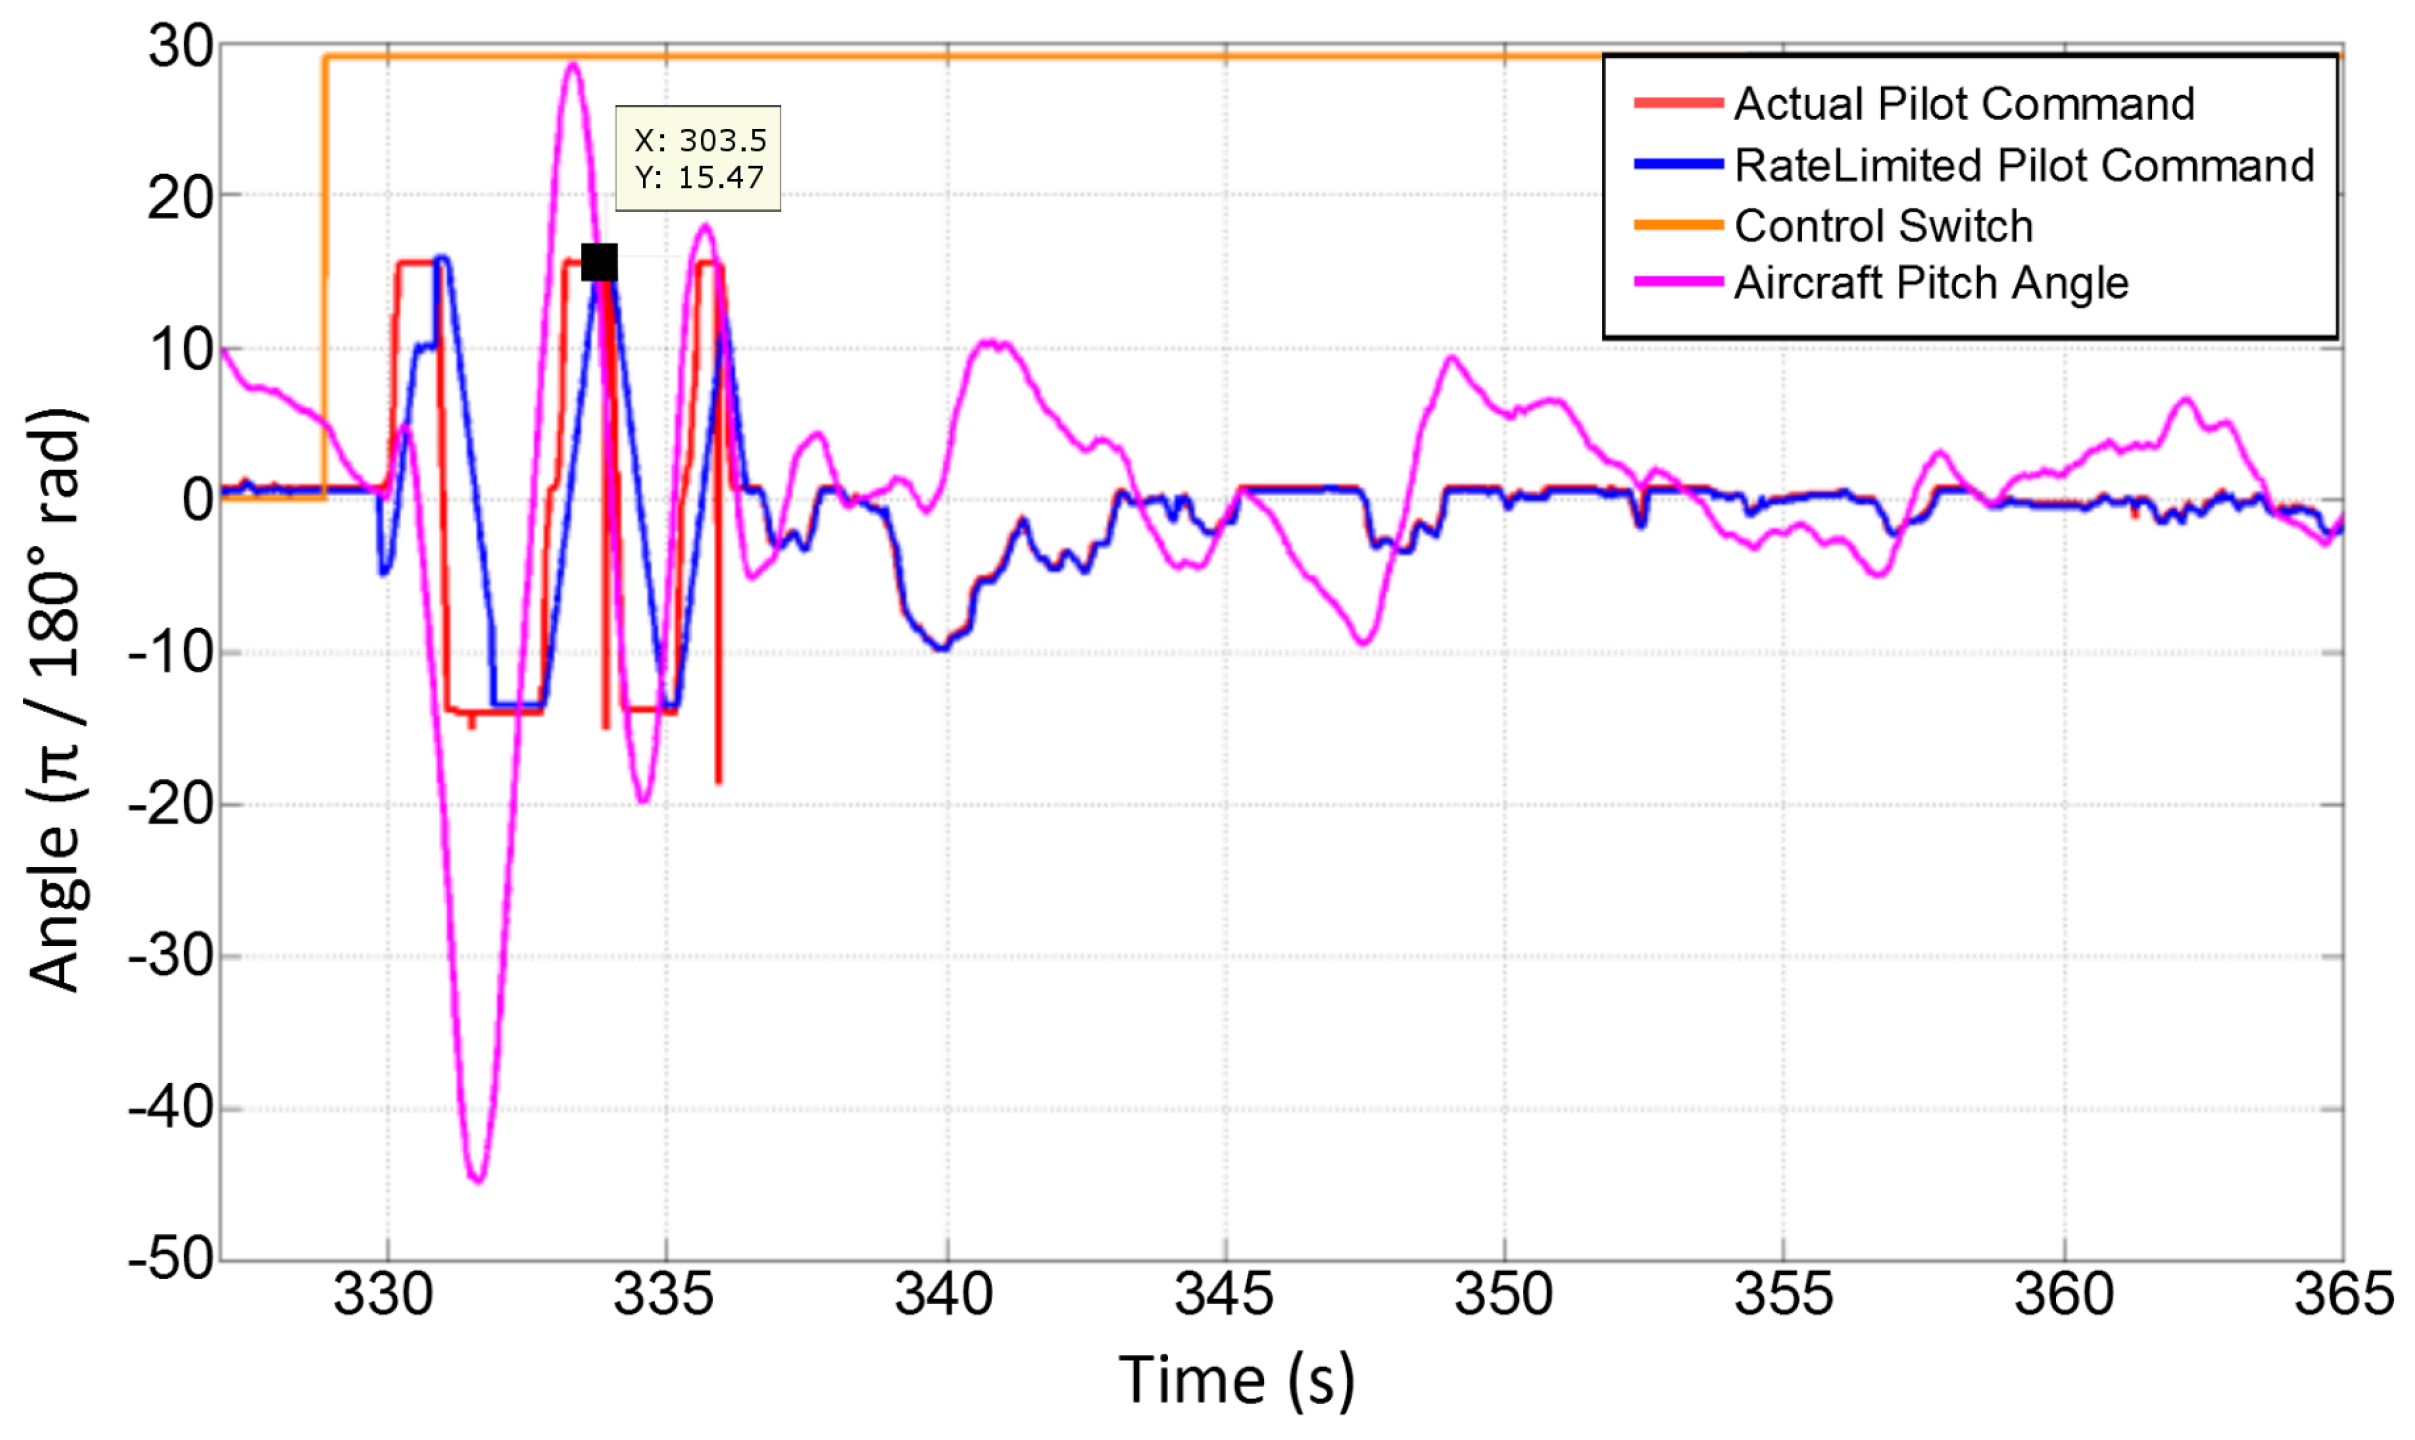
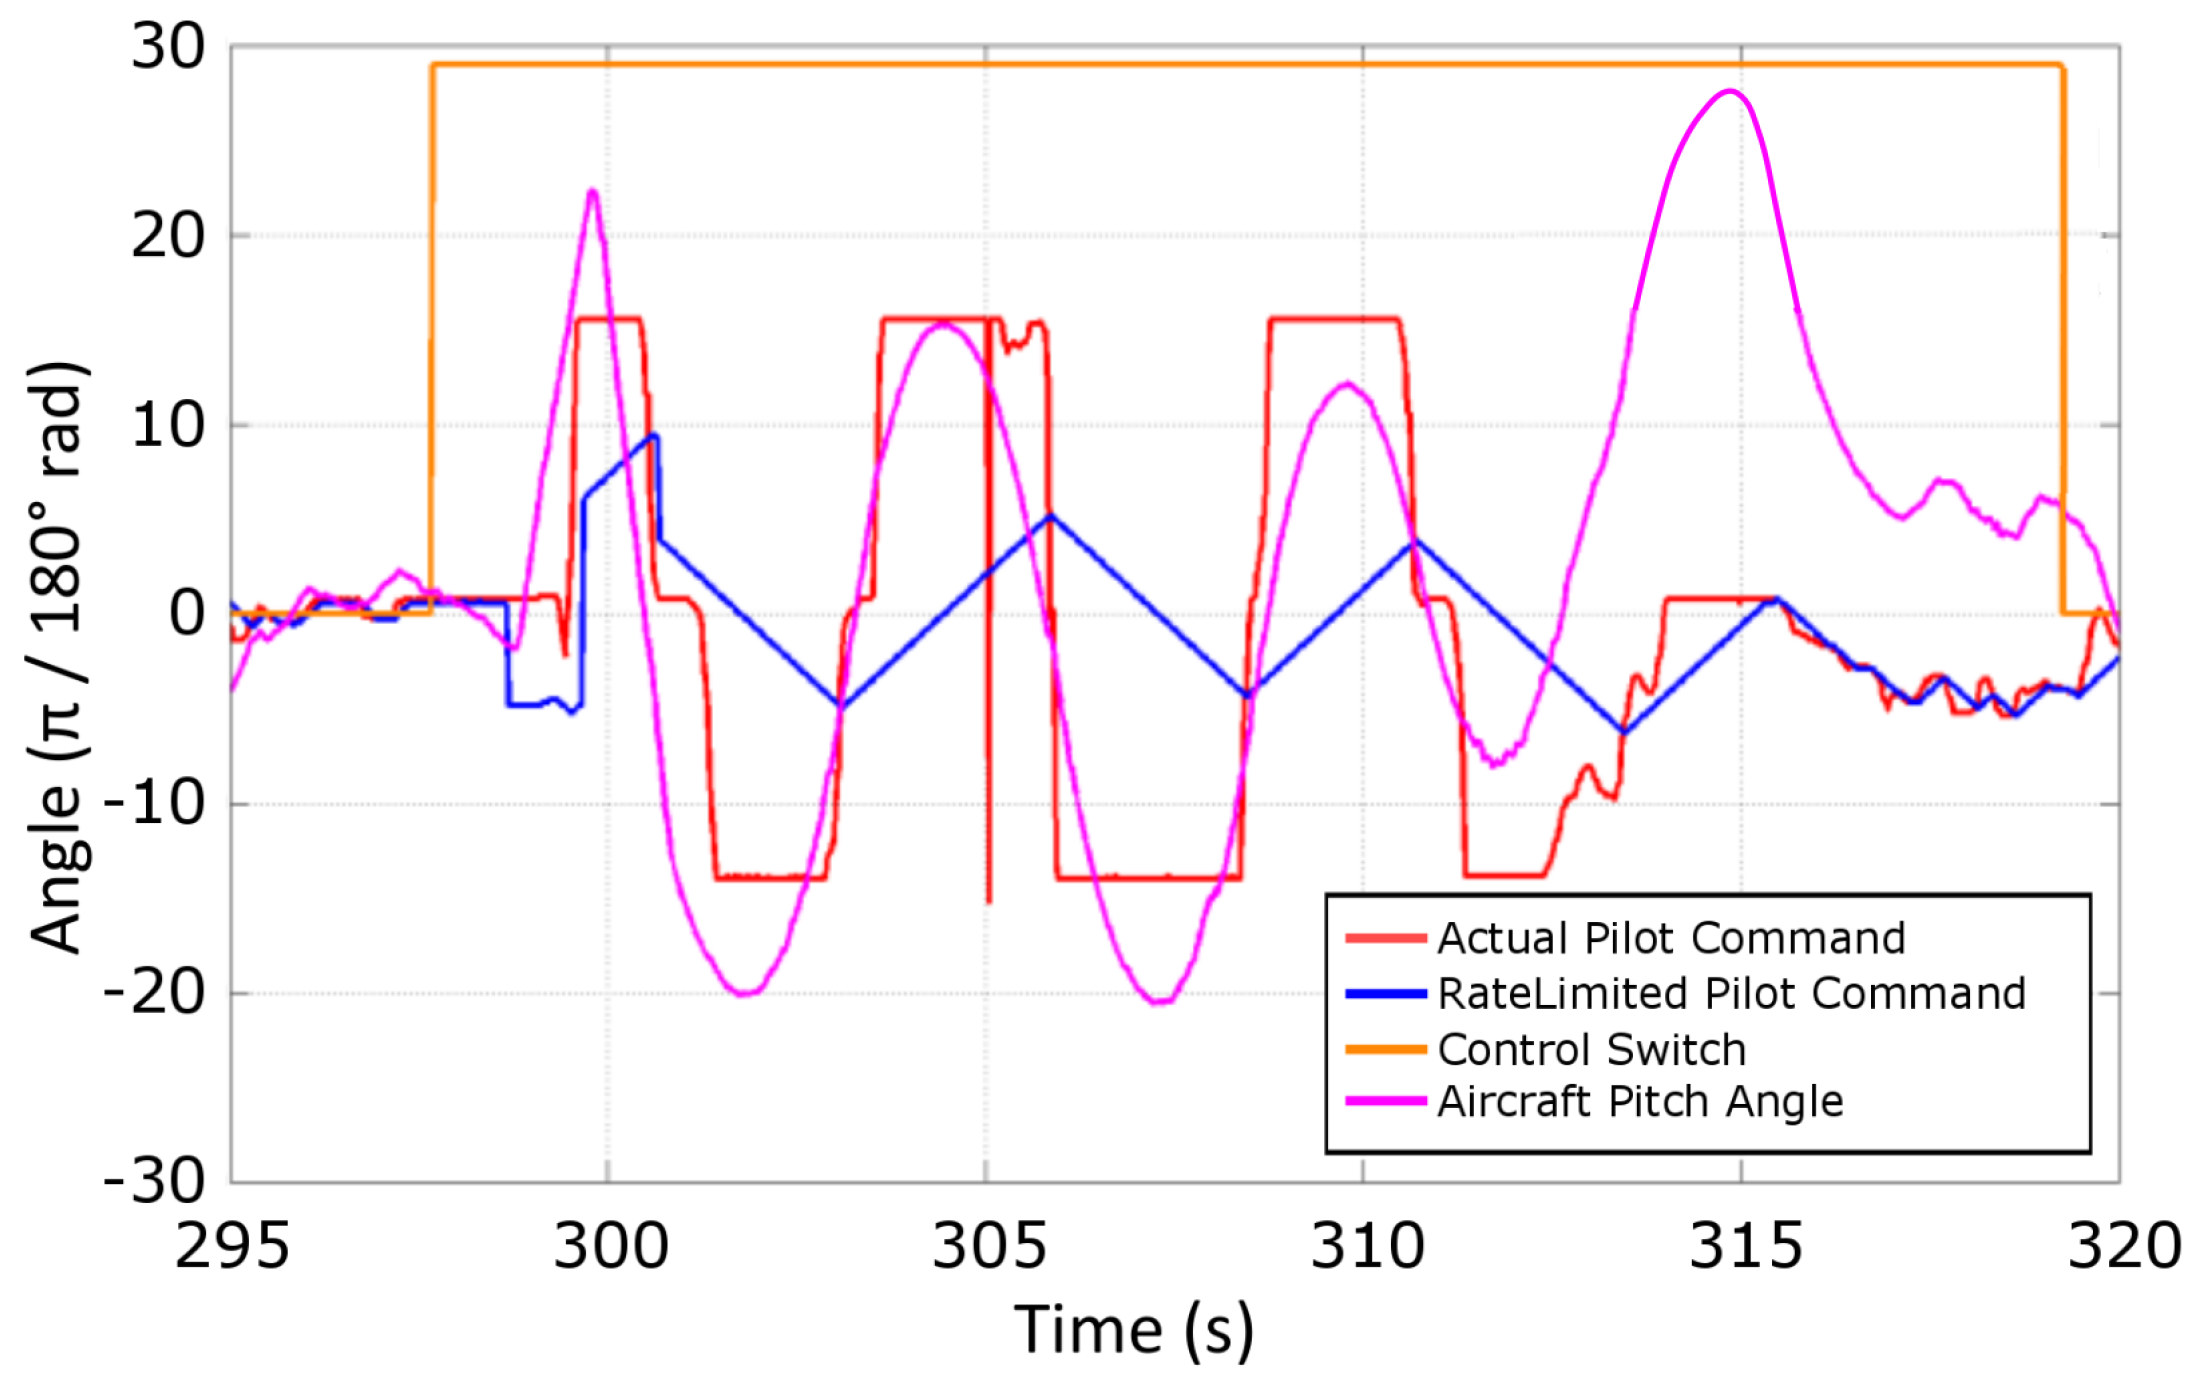
- In Section 5 the estimated pilot model was used to determine the Category 1 PIO susceptibility for “Phastball” and it was observed that the delay margin of the PVS is highly susceptible to human pilot intrinsic delay and workload. On the other hand, a fully developed Category 2 PIO (due to elevator actuator rate limiting) flight data showed that the pilot command is of bang-bang control nature during the PIO event. This renders the lead-lag pilot model inapplicable to determine the Category 2 PIO susceptibility for “Phastball”. The bang-bang control nature of the pilot also rendered describing function technique to determine Category 2 PIO susceptibility inapplicable. Therefore, PVS simulations were carried out for the “Phastball” system for various inputs to obtain additional information about the Category 2 PIO susceptibility of “Phastball” due to elevator actuator rate limiting. It was observed in simulations that “Phastball” Category 2 PIO susceptibility is sensitive to pilot’s threshold for pitch error (the pitch error below which pilot does not react). Simulations also showed the pilot threshold values at which PIO appears decreases with decreasing value of rate limit on the actuators.
Acknowledgments
Author Contributions
Conflicts of Interest
Abbreviations
| Bandwidth frequency (Bandwidth/Pitch Rate criterion) | |
| Frequency at phase 180 | |
| Critical frequency (Smith-Geddes criterion) | |
| Close-loop onset frequency | |
| Aircraft pitch angle | |
| ϕ | Phase angle |
| Critical phase (Smith-Gedded criterion) | |
| Pilot commanded elevator deflection | |
| Elevator deflection | |
| Phase delay (Bandwidth/Pitch Rate criterion) | |
| τ | Pilot delay |
| Pilot remnant | |
| Pitch error input to pilot model | |
| K | Pilot gain |
| Pilot model output | |
| Phase rate parameter around 180 phase angle | |
| Maximum elevator rate limit | |
| S | Average slope of the attitude to stick deflection amplitude response |
| Pilot lead | |
| Pilot lag | |
| Gen-V | Generation V |
| GNC | Guidance, Navigation, and Control |
| OLOP | Open Loop Onset Point |
| PIO | Pilot Induced Oscillation |
| PIL | Pilot-In-Loop |
| PVS | Pilot Vehicle System |
| R/C | Remote Controlled |
| SLFP | Steady Level Flight Phase |
| WVU | West Virginia University |
| UAS | Unmanned Aircraft System |
References
- Standard, M. Flying Qualities of Piloted Aircraft; Technical Report, MIL-STD-1797A; Department of Defense: Washington, DC, USA, 1990.
- Cooke, N.J. Human factors of remotely operated vehicles. In Proceedings of the Human Factors and Ergonomics Society Annual Meeting, San Francisco, CA, USA, 16–20 October 2006; Volume 50, pp. 166–169.
- McCarley, J.S.; Wickens, C.D. Human Factors Concerns in UAV Flight; Champaign Institute of Aviation, Aviation Human Factors Division, University of Illinois at Urbana: Urbana, IL, USA, 2004. [Google Scholar]
- Williams, W. UAV Handling Qualities….. You Must be Joking; Aerospace Sciences Corperation Pty. Ltd.: Springfield Lakes, Australia, 2003. [Google Scholar]
- McRuer, D.T. Aviation Safety and Pilot Control: Understanding and Preventing Unfavorable Pilot-Vehicle Interactions; The National Academies Press: Washington, DC, USA, 1997. [Google Scholar]
- Moorhouse, D.J. Flight Control Design—Best Practices; NATO Research and Technology-Organization (RTO-TR): Neuilly sur Seine, France, 2000; Volume 29. [Google Scholar]
- GARTEUR Action Group FM. Evaluation of Prominent PIO Susceptibility Criteria; Technical Report, Technical Report TP-120-01; Group for Aeronautical Research and Technology in EURop: Cranfield, UK, 1999. [Google Scholar]
- Neal, T.P.; Smith, R.E. An In-Flight Investigation to Develop Control System Design Criteria for Fighter Airplanes. Volume 2. Appendices 1 through 5; Technical Report, DTIC Document; Air Force Flight Dynamics Laboratory: Dayton, OH, USA, 1970. [Google Scholar]
- Duda, H. Prediction of pilot-in-the-loop oscillations due to rate saturation. J. Guid. Control Dyn. 1997, 20, 581–587. [Google Scholar] [CrossRef]
- Hanke, D. Handling Qualities Analysis on Rate Limiting Elements in Flight Control Systems; Advisory Group for Aerospace Research and Development, Flight Vehicle Integration Panel Workshop on Pilot Induced Oscillations 18 p(SEE N 95-31061 11-03); Advisory Group for Aerospace Research and Development: Neuilly sur Seine, France, 1995. [Google Scholar]
- Amato, F.; Iervolino, R.; Pandit, M.; Scala, S.; Verde, L. Analysis of pilot-in-the-loop oscillations due to position and rate saturations. In Proceedings of the 39th IEEE Conference on Decision and Control, Sydney, Australia, 12–15 December 2000; Volume 4, pp. 3564–3569.
- McRuer, D.T.; Jex, H.R. A review of quasi-linear pilot models. IEEE Tran. Hum. Factors Electron. 1967, HFE-8, 231–249. [Google Scholar] [CrossRef]
- Stapleford, R.L.; Peters, R.A.; Alex, F.R. Experiments and a Model for Pilot Dynamics with Visual and Motion Inputs; National Aeronautics and Space Administration (NASA): Moffett Field, CA, USA, 1969.
- Kleinman, D.L.; Baron, S.; Levison, W.H. A control theoretic approach to manned-vehicle systems analysis. IEEE Trans. Autom. Control 1971, 16, 824–832. [Google Scholar] [CrossRef]
- Johannsen, G.; Levis, A.H.; Stassen, H.G. Theoretical problems in man-machine systems and their experimental validation. Automatica 1994, 30, 217–231. [Google Scholar] [CrossRef]
- Pool, D.M.; Zaal, P.M.; Damveld, H.J.; van Paassen, M.M.; Mulder, M. Pilot equalization in manual control of aircraft dynamics. In Proceedins of the IEEE International Conference on Systems, Man and Cybernetics (SMC 2009), San Antonio, TX, USA, 11–14 October 2009; pp. 2480–2485.
- Zaal, P.M.T.; Pool, D.M.; Chu, Q.; Mulder, M.; Van Paassen, M.; Mulder, J.A. Modeling human multimodal perception and control using genetic maximum likelihood estimation. J. Guid. Control. Dyn. 2009, 32, 1089–1099. [Google Scholar] [CrossRef]
- Mandal, T.; Gu, Y.; Chao, H.; Rhudy, M. Flight Data Analysis of Pilot-Induced-Oscillations of a Remotely Controlled Aircraft. In Proceedings of the AIAA Guidance, Navigation, and Control Conference, Boston, MA, USA, 19–22 August 2013.
- Mandal, T.; Gu, Y. Pilot-Vehicle System Modeling Using Sub-Scale Flight Experiments. In Proceedings of the AIAA Modeling and Simulation Technologies Conference (AIAA 2014-1004), National Harbor, MD, USA, 13–17 January 2014.
- Gross, J.N.; Gu, Y.; Rhudy, M.B.; Gururajan, S.; Napolitano, M.R. Flight-test evaluation of sensor fusion algorithms for attitude estimation. IEEE Trans. Aerosp. Electron. Syst. 2012, 48, 2128–2139. [Google Scholar] [CrossRef]
- Gururajan, S.; Gu, Y.; Seanor, B.; Prucz, J.; Napolitano, M. Evolution of the Flight Testing Program at West Virginia University in Support of Flight Control Research. In Proceedings of the 52nd Israel Annual Conference on Aerospace Sciences.
- Gu, Y.; Barchesky, F.; Chao, H.; Gross, J.; Napolitano, M. Avionics Design for a Sub-Scale Fault-Tolerant Flight Control Test-Bed; INTECH Open Access Publisher: Rijeka, Croatia, 2012. [Google Scholar]
- Mitchell, D.G.; Klyde, D.H. A critical examination of PIO prediction criteria. In Proceedings of the AIAA Atmospheric Flight Mechanics Conference, Boston, MA, USA, 10–12 August 1998.
- Mitchell, D.G.; Klyde, D.H. Bandwidth Criteria for Category I and II PIOs; The workshop “Pilot-Induced Oscillation Research: The Status at the End of the Century, NASA Dryden”; NASA Dryden Flight Research Center: Hampton, VA, USA, 2001.
- Gibson, J.C. The Prevention of PIO by Design; AGARD Conference Proceedings Agard CP. DTIC Document; Advisory Group for Aerospace Research and Development: Neuilly sur Seine, France, 1995; p. 2. [Google Scholar]
- Gururajan, S.; McGrail, A.; Gu, Y.; Seanor, B.; Napolitano, M.; Prucz, J.; Phillips, K. Identification of Aerodynamic Parameters for a Small UAV from Flight Data. In Proceedings of the 52nd Israel Annual Conference on Aerospace Sciences.
- Pavel, M.D.; Masarati, P.; Gennaretti, M.; Jump, M.; Zaichik, L.; Dang-Vu, B.; Lu, L.; Yilmaz, D.; Quaranta, G.; Ionita, A.; et al. Practices to identify and preclude adverse Aircraft-and-Rotorcraft-Pilot Couplings—A design perspective. Prog. Aerosp. Sci. 2015, 76, 55–89. [Google Scholar] [CrossRef]
- Levine, W.S. Aerospace Controls. In The Control Handbook; CRC Press: Boca Raton, FL, USA, 1996; p. 1287. [Google Scholar]
- Tischler, M.B. Advances in Aircraft Flight Control; CRC Press: Boca Raton, FL, USA, 1996. [Google Scholar]
- Pratt, R. Flight Control Systems: Practical Issues in Design and Implementation; The Institution of Engineering and Technology: Stevenage, UK, 2000; Number 57. [Google Scholar]
- Hoh, R.H.; Mitchell, D.G.; Ashkenas, I.L.; Klein, R.H.; Heffley, R.K. Proposed MIL Standard and Handbook-Flying Qualities of Air Vehicles; Proposed MIL Handbook; Technical Report; DTIC Document; Systems Technology Inc.: Hawthorne, CA, USA, 1982; Volume 2. [Google Scholar]
- Smith, R.H. The Smith-Geddes Criteria. In Proceedings of the SAE Aerospace Control and Guidance Systems Committee Meeting, Reno, NV, USA, 11 March 1993.
- Smith, R.H.; Geddes, N.D. Handling Quality Requirements for Advanced Aircraft Design: Longitudinal Mode; Technical Report; DTIC Document; Systems Research Labs Inc.: Dayton, OH, USA, 1979. [Google Scholar]
- Gibson, J.C. Evaluation of alternate handling qualities criteria in highly augmented unstable aircraft. Am. Inst. Aeronaut. Astronaut. 1990, 2844. [Google Scholar]
- Gibson, J.; St Annes, L. Looking for the Simple PIO Model; Advisory Group for Aerospace Research and Development, Flight Vehicle Integration Panel Workshop on Pilot Induced Oscillations 11 p(SEE N 95-31061 11-03); DTIC Document; Advisory Group for Aerospace Research and Development: Neuilly sur Seine, France, 1995. [Google Scholar]
- Gilbreath, G.P. Prediction of Pilot-Induced Oscillations (PIO) Due to Actuator Rate Limiting Using the Open-Loop Onset Point (OLOP) Criterion; Technical Report; DTIC Document; Air Force Inst of Tech Wright-Patterson: Dayton, OH, USA, 2001. [Google Scholar]
- Taylor, L.W., Jr. A comparison of human response modeling in the time and frequency domains. In Proceedings of the Third Annual NASA-University Conference on Manual Control, NASA SP-144, Los Angeles, CA, USA, 1–3 March 1967; pp. 137–153.
- Gu, Y.; Seanor, B.; Campa, G.; Napolitano, M.R.; Gururajan, S. Autonomous Formation Flight: Design and Experiments; INTECH Open Access Publisher: Rijeka, Croatia, 2009. [Google Scholar]
- McRuer, D.T.; Krendel, E.S. Mathematical Models of Human Pilot Behavior; Technical Report; DTIC Document; Advisory Group for Aerospace Research and Development: Neuilly sur Seine, France, 1974. [Google Scholar]
- Klyde, D.H.; Mitchell, D.G. Investigating the role of rate limiting in pilot-induced oscillations. J. Guid. Control Dyn. 2004, 27, 804–813. [Google Scholar] [CrossRef]
- Klyde, D.H.; McRuer, D.T.; Myers, T.T. PIO analysis with actuator rate limiting. In Proceedings of the AIAA Atmospheric Flight Mechanics Conference, San Diego, CA, USA, 29–31 July 1996; pp. 569–580.
- Smith, R.H. Predicting and validating fully-developed PIO. In Proceedings of the Guidance, Navigation, and Control and Co-located Conferences, Scottsdale, AZ, USA, 1–3 August 1994; pp. 1162–1166.
- Young, L.R.; Meiry, J.L. Bang-bang aspects of manual control in high-order systems. IEEE Trans. Autom. Control 1965, 10, 336–341. [Google Scholar] [CrossRef]


| System Delay Introduced (ms) | Susceptibility to PIO (Prediction) | Number of Flights PIO Observed | Number of Flights PIO Not Observed |
|---|---|---|---|
| 0 | Very Low | No PIO observed in any flight | |
| 100 | Low | 0 | 3 |
| 200 | High | 0 | 3 |
| 300 | High | 1 | 1 |
| 400 | Very High | 1 | 1 |
| 500 | Very High | 2 | 0 |
| 600 | Very High | 2 | 0 |
| System Delay Introduced (ms) | () | Susceptibility to PIO (Prediction) | Number of Flights PIO Observed | Number of Flights PIO Not Observed |
|---|---|---|---|---|
| 0 | −33.53 | Not Susceptible | No PIO observed in any flight | |
| 100 | −63.07 | Very Low | 0 | 3 |
| 200 | −92.34 | Very Low | 0 | 3 |
| 300 | −121.66 | Low | 1 | 1 |
| 400 | −151.20 | High | 1 | 1 |
| 500 | −181.26 | Very High | 2 | 0 |
| 600 | −210.81 | Very High | 2 | 0 |
| Prediction | Number of Flights PIO Observed | Number of Flights PIO Not Observed |
|---|---|---|
| No PIO | 2 | 20 |
| PIO | 14 | 1 |
| τ (ms) | ||||
|---|---|---|---|---|
| Range of Values | 0.2856–0.5823 | 0.0200–0.8742 | 0.0624–1.048 | 192–980 |
| Mean | 0.3124 | 0.3580 | 0.85217 | 428 |
| Standard Deviation | 0.1026 | 0.14787 | 0.2143 | 147 |
| Prediction | Number of Flights PIO Observed | Number of Flights PIO not Observed |
|---|---|---|
| No PIO | 1 | 21 |
| PIO | 14 | 1 |
© 2016 by the authors; licensee MDPI, Basel, Switzerland. This article is an open access article distributed under the terms and conditions of the Creative Commons Attribution (CC-BY) license (http://creativecommons.org/licenses/by/4.0/).
Share and Cite
Mandal, T.K.; Gu, Y. Analysis of Pilot-Induced-Oscillation and Pilot Vehicle System Stability Using UAS Flight Experiments. Aerospace 2016, 3, 42. https://doi.org/10.3390/aerospace3040042
Mandal TK, Gu Y. Analysis of Pilot-Induced-Oscillation and Pilot Vehicle System Stability Using UAS Flight Experiments. Aerospace. 2016; 3(4):42. https://doi.org/10.3390/aerospace3040042
Chicago/Turabian StyleMandal, Tanmay K., and Yu Gu. 2016. "Analysis of Pilot-Induced-Oscillation and Pilot Vehicle System Stability Using UAS Flight Experiments" Aerospace 3, no. 4: 42. https://doi.org/10.3390/aerospace3040042
APA StyleMandal, T. K., & Gu, Y. (2016). Analysis of Pilot-Induced-Oscillation and Pilot Vehicle System Stability Using UAS Flight Experiments. Aerospace, 3(4), 42. https://doi.org/10.3390/aerospace3040042