Article

A Bayesian Network Augmentation of JARUS SORA 2.5 for Probabilistic UAS Operational Risk Assessment: A Proof-of-Concept Study


Transport and Telecommunication Institute, Lauvas 2, LV-1019 Riga, Latvia
*
Author to whom correspondence should be addressed.
Aerospace 2026, 13(9), 848; https://doi.org/10.3390/aerospace13090848 (registering DOI)
Submission received: 7 August 2026 / Revised: 10 September 2026 / Accepted: 15 September 2026 / Published: 20 September 2026
(This article belongs to the Section Air Traffic and Transportation)

Abstract

This proof-of-concept study examines whether a Bayesian Network (BN) can augment the evidentiary layer of the Joint Authorities for Rulemaking on Unmanned Systems (JARUS) Specific Operations Risk Assessment (SORA) 2.5. The architecture retains the official Final Ground Risk Class (GRC), Residual Air Risk Class (ARC), and Specific Assurance and Integrity Level (SAIL) state spaces and uses a deterministic SAIL mapping, while uncertain operational evidence is represented probabilistically. A VLOS airframe-inspection scenario at Riga Airport and a deliberately adverse stress scenario are used to illustrate model behavior. Under the assumptions encoded in the submitted model, the modal states for the airport scenario coincide with the conventional SORA classifications (GRC 4, ARC c, and SAIL IV), and one-way sensitivity identifies aircraft size classification, ground-risk mitigation effectiveness, and airspace complexity as the strongest model drivers. These numerical posteriors are assumption-dependent outputs of uncalibrated engineering judgements, not observed frequencies, validation evidence, or probabilities of regulatory approval. The present contribution is therefore limited to demonstrating feasibility and sensitivity analysis value; empirical calibration, structured elicitation, multiple operational cases, and release of the executable model and complete parameter tables are required for independent replication and practical use.

1. Introduction

The rapid proliferation of Unmanned Aerial Systems (UASs) has fundamentally altered modern aviation, expanding capabilities across precision agriculture, environmental monitoring, infrastructure inspection, logistics, and surveillance [1]. Concurrently, breakthroughs in avionics [2], autonomous navigation, and communication infrastructure now permit highly intricate operations in dense urban environments, airport vicinities, and beyond Visual Line of Sight (BVLOS). While these advancements yield clear economic and operational efficiencies, they introduce critical safety challenges regarding airspace traffic density, operational complexity, and conflict management with conventional manned aviation. Safely integrating UASs into shared airspace demands rigorous, reliable risk assessment methodologies.
European regulators address this challenge via risk-based frameworks, where safety mandates scale directly with operational complexity. Within the European “Specific” category, the primary regulatory mechanism is the Specific Operations Risk Assessment (SORA). Developed by the Joint Authorities for Rulemaking on Unmanned Systems (JARUS) and codified by the European Union Aviation Safety Agency (EASA), SORA systematically evaluates ground and air risks to establish target levels of safety assurance [3,4,5,6,7]. The framework has been successfully adapted to diverse use cases, ranging from urban aerial cinematography [8] to strategic flight planning for large remotely piloted aircraft [9].
SORA is intentionally categorical and pre-operational. Its tables provide a consistent regulatory classification, while uncertainty in exposure estimates, encounter conditions, reliability evidence, or mitigation performance is handled through conservative categories, supporting evidence, and competent-authority judgement rather than reported as probability distributions. This can limit the analyst’s ability to examine how uncertain inputs affect neighboring classifications, particularly for automated or high-frequency BVLOS concepts. A complementary probabilistic model may therefore be useful when the evidence supporting a classification is incomplete or variable.
Bayesian Networks (BNs) can combine heterogeneous evidence and propagate uncertainty through explicit conditional dependencies [10,11,12]. A static BN can update posterior distributions when evidence changes between assessments, but it does not model temporal transitions or continuous in-flight risk. Existing Bayesian UAS risk models generally target accidents, mission, or third-party risk rather than reproducing the formal SORA GRC-ARC-SAIL state structure, which limits direct traceability to SORA decision points.
This study develops a hybrid SORA-BN proof of concept whose technical focus is the explicit mapping of uncertain evidence to the official Final GRC and Residual ARC state spaces, followed by the deterministic SORA 2.5 SAIL mapping. The intended decision-support capability is not a new authorization rule but an auditable sensitivity view showing which evidence assumptions can move the regulatory classification.
Specifically, this study aims to
  • Critically review contemporary methodologies in UAS safety risk assessment;
  • Isolate and define the core structural and operational limitations of the standard SORA framework;
  • Evaluate the mathematical and practical suitability of BN for complex aviation risk profiles;
  • Construct a unified, deployable hybrid SORA–BN model;
  • Illustrate the proposed framework with an airport-inspection scenario and a contrasting adverse stress scenario, comparing modal BN outputs with equivalent SORA classifications and evaluating sensitivity rather than predictive accuracy.

2. Literature Review

Research on UAS safety combines regulatory assessment, engineering hazard analysis, collision and ground risk modeling, and probabilistic methods. This section synthesizes the approaches most relevant to uncertainty-aware SORA decision support and identifies the specific gap addressed by the proposed architecture.

2.1. UAS Safety Risk Assessment

UAS applications now include infrastructure inspection, agriculture, logistics, and disaster response [13,14]. Their expansion introduces technical, human, environmental, cybersecurity, airspace, and regulatory hazards. Safe integration therefore requires a structured process for hazard identification, risk assessment, mitigation, and documentation. The principal risk categories are summarized in Table 1.

2.1.1. The Role of Risk Assessment in UAS Operations

As UAS operational volumes expand, systematic risk evaluation supports proactive safety management [14]. The process identifies hazards, assesses whether residual risks are tolerable, and specifies the mitigations required to protect third parties and infrastructure [19]. Unlike certification-centered approaches for crewed aviation, UAS assessments are tailored to the operation: a rural VLOS mission and an urban BVLOS mission present materially different exposure and encounter conditions. As delineated in the generalized workflow in Figure 1, this life cycle continuously bridges hazard identification, risk assessment, mitigation deployment, and comprehensive documentation.
This application-oriented strategy is becoming increasingly important for advanced applications such as Urban Air Mobility, autonomous flights, and multi-UAS coordinated flights. Safety Risk Management, for example, has been successfully implemented in multi-UAS operations in the airport setting [21].

2.1.2. UAS Risk Assessment Methodology

Risk assessment in UASs involves the use of risk indicators, risk analysis, and risk evaluation. The estimated risk is compared to a pre-set standard or criterion, and additional mitigation measures are put in place where the result is greater than the accepted level [22]. This process helps maintain a balance between safety, efficiency, and cost effectiveness [23]. Safety assessment usually answers three questions [24]:
  • What may go wrong? (hazards);
  • What is the likelihood of the event? (probability);
  • What are the consequences? (severity).
The total operational risk may be expressed as:
R = h P h R h
where P{h} is the probability of hazard type h, and Rh is its conditional risk. The assessment may either calculate and aggregate hazard-specific risks or model the complete operation within a single integrated framework [22]. In commercial aviation, the first approach is commonly associated with airworthiness certification [25], whereas integrated models are frequently used for mid-air collision risk quantification [26].

2.2. Regulatory Framework for UAS Operations

European UAS regulation applies a risk-based approach in which requirements are proportional to the characteristics of the operation. The EASA framework, supported by JARUS methodologies, distinguishes Open, Specific, and Certified categories [3], as summarized in Table 2.
The categories are intended to maintain an Equivalent Level of Safety (ELoS), meaning that UAS operations should achieve a safety level comparable to relevant conventional aviation activities [27]. This proportional framework avoids imposing excessive requirements on simple missions while ensuring more rigorous assessment and certification for higher-risk operations.

2.3. Existing UAS Risk Assessment Methods

UAS risk assessment methods differ in purpose, granularity, and treatment of uncertainty. Fault Tree Analysis (FTA) traces combinations of causes leading to an undesired event, whereas Event Tree Analysis (ETA) examines possible consequences following an initiating event. Failure mode and effects analysis (FMEA) evaluates component failure modes, and Bow-Tie Analysis links threats, preventive barriers, consequences, and recovery controls. These engineering methods are useful for causal and barrier analysis but are generally configured for a defined system and scenario. SORA instead assesses the operation for regulatory authorization.

2.4. Specific Operations Risk Assessment (SORA)

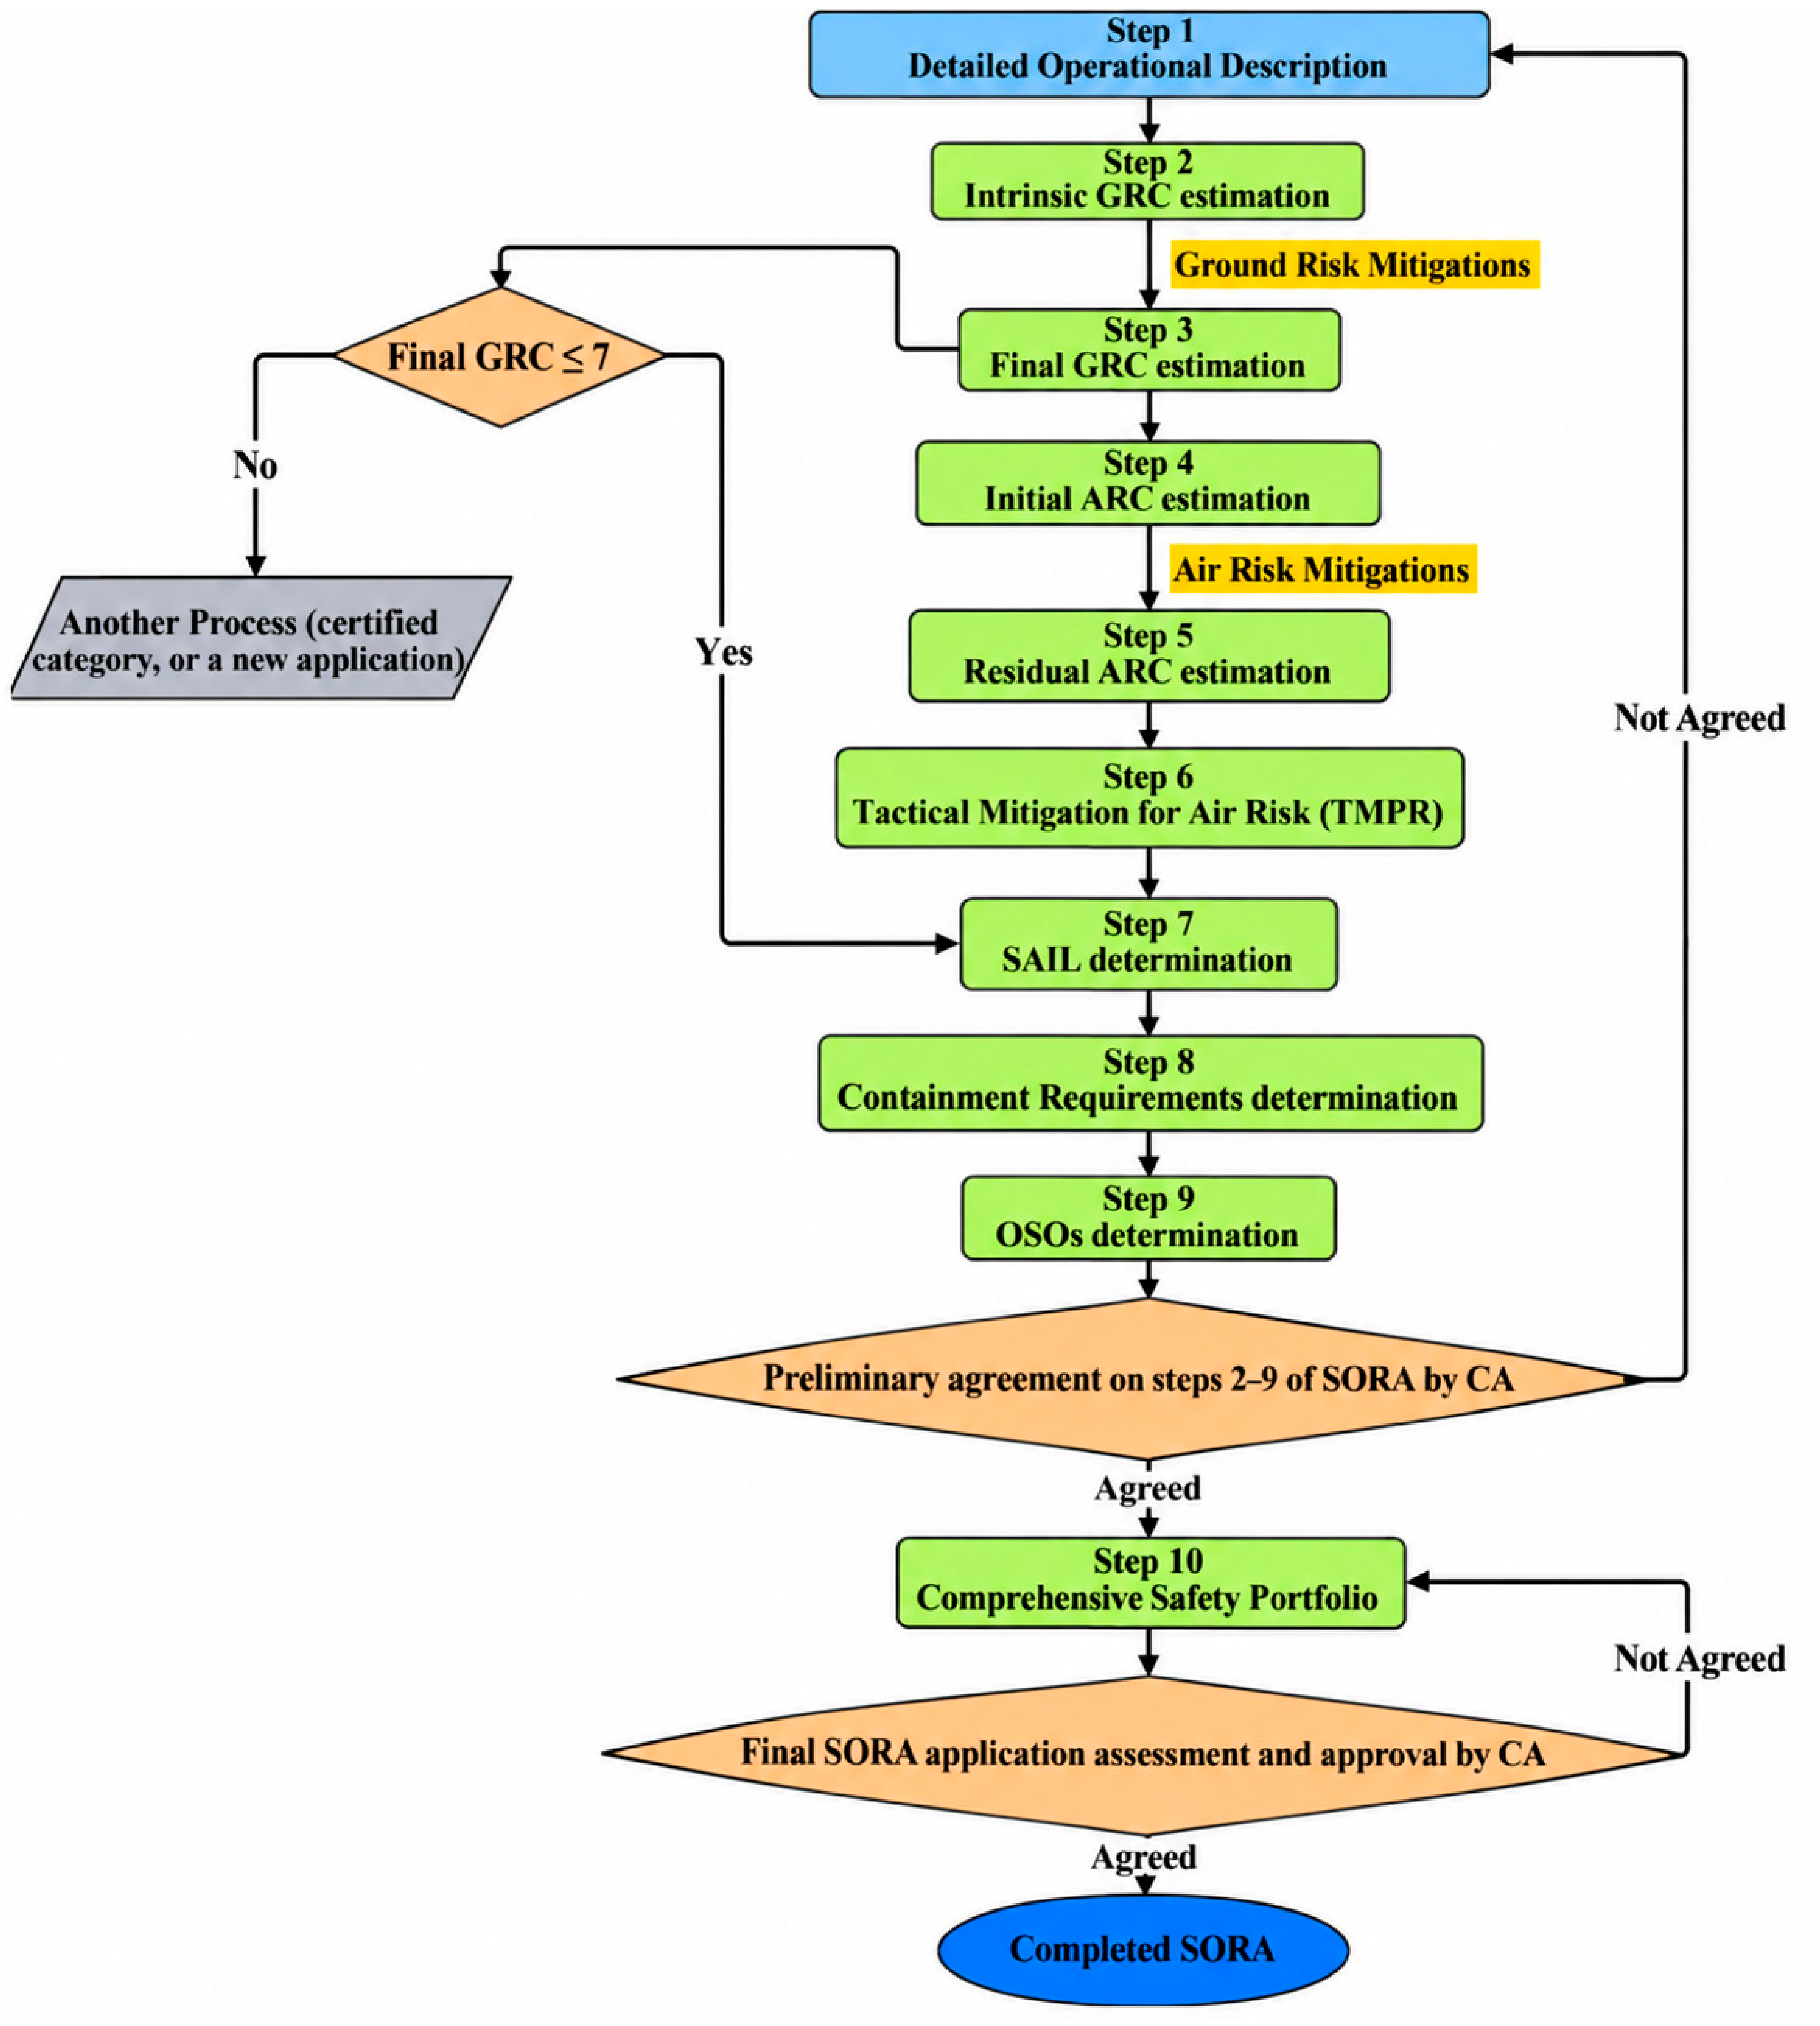
SORA was developed by JARUS and adopted within the EASA regulatory framework for Specific-category UAS operations [21]. It provides a structured, risk-based process for determining whether a proposed mission can be conducted with an acceptable level of safety. It has also been described as an expert-based decision process for evaluating risks to third parties in the air and on the ground [22]. The principal stages are shown in Figure 2.
The assessment begins with a Concept of Operations (ConOps) describing the mission, aircraft, operating area, flight profile, environmental conditions, and planned mitigations. SORA then determines the Ground Risk Class (GRC) and Air Risk Class (ARC), applies relevant ground, strategic, and tactical mitigations, and derives the Specific Assurance and Integrity Level (SAIL). The SAIL establishes the robustness required for the applicable Operational Safety Objectives (OSOs), ensuring that safety requirements remain proportional to mission risk.

2.5. Principles of Bayesian Networks

Bayesian Networks (BNs) are probabilistic models for representing uncertainty and updating beliefs when new evidence becomes available. Their mathematical basis is Bayes’ theorem:
P A B = P B A P A P B
Let A stand for the event or hypothesis, B for the evidence observed, P(A) and P(B) for the respective prior probabilities, P(B|A) for the likelihood of evidence assuming A, and P(A|B) for the posterior probability of A given B.
A BN consists of a directed acyclic graph and associated Conditional Probability Tables (CPTs) [11]. Each node represents a variable, each edge encodes a conditional dependency, and each CPT specifies the distribution of a child node for every combination of parent states. The joint distribution factorizes into the product of each node’s conditional distribution given its parents [12]. This structure permits evidence updating and the combination of observations with expert knowledge. Prior UAS BNs, however, usually produce safety, mission success, collision, or third party-risk outcomes rather than an explicit mapping to SORA’s Final GRC, Residual ARC, and SAIL states.

2.6. Research Gap

The research gap is narrower than the absence of probabilistic UAS risk models. Existing BNs could in principle be post-processed or remapped to SORA categories, but such a mapping requires explicit state definitions, evidence semantics, separation of probabilistic and deterministic rules, and traceability to the SORA tables. The technical question addressed here is whether those design choices can be implemented coherently while exposing the sensitivity of SORA-equivalent outputs to uncertain evidence.
Accordingly, the contribution is an architecture that (i) aligns BN child states with the official Final GRC and Residual ARC categories; (ii) preserves the SAIL lookup as a deterministic rule; (iii) keeps containment and OSO robustness outside the probabilistic network; and (iv) reports posterior state distributions and evidence-state sensitivity as analytical, assumption-dependent outputs. Table 3 distinguishes this scope from selected prior approaches.

3. Comparative Analysis of Existing UAS Risk Assessment Methods

Following the literature review, the principal UAS risk assessment methods were compared to determine their suitability for increasingly complex operations. The analysis focuses on their purpose, scope, treatment of uncertainty, regulatory applicability, and practical requirements.

3.1. Evaluation Criteria

Six criteria were used to compare the methods. The first was primary purpose: SORA supports operational authorization [4], whereas FTA and BN methods primarily investigate failure mechanisms, causal dependencies, or risk outcomes [23].
The second criterion was risk scope, ranging from specific outcomes such as mid-air collision or injury to people on the ground [28] to integrated pathways involving technical, human, environmental, and operational factors.
The third criterion was uncertainty treatment. SORA uses categorical tables supported by evidence and expert judgement [29], whereas BNs and Monte Carlo simulation can produce quantitative distributions but require substantially more data or elicited knowledge.
The fourth criterion was level of analysis. SORA evaluates a mission-level ConOps [30], FMEA/FMECA examines component failure modes [23], and FTA and ETA represent causal or event sequences.
The fifth criterion was the ability to revise results when evidence changes. Weather, population exposure, communications, and air traffic vary across UAS operations [1], and BNs can update posterior distributions when new evidence is entered [27]. The sixth criterion was usability, assessed in terms of data, software, expertise, time, and cost requirements.

3.2. Comparison of Methods

UAS risk assessment approaches can be grouped into regulatory methods, causal models, collision risk models, and ground risk models [26]. Their principal characteristics are summarized in Table 3.
SORA is the principal method for Specific-category operational risk assessment, but it reports categorical outcomes rather than posterior probability distributions. FTA, ETA, and Bow-Tie Analysis describe causal chains and barriers [30], while BNs update probability distributions when evidence changes [12]. Collision risk models focus on mid-air encounters [31], and ground risk models estimate consequences to people or assets using geographic, demographic, and impact data. These methods address different questions and are complementary rather than interchangeable.

3.3. Strengths and Limitations of SORA

SORA provides a structured mission-level workflow based on ConOps, GRC, ARC, TMPR, SAIL, containment, and OSOs. Its regulatory recognition supports consistent communication between operators and competent authorities, and its pre-flight process promotes proactive identification and mitigation of risk. Its categorical structure and reliance on evidence-supported judgement, however, do not directly show how uncertainty in inputs redistributes confidence across neighboring classifications. Table 4 summarizes the principal strengths and limitations.
SORA therefore remains an effective regulatory foundation, but its analytical capability can be supplemented by probabilistic methods that explicitly represent uncertainty and dependencies among operational factors.

3.4. Bayesian Networks as a Complementary Approach

A BN is a directed acyclic graph in which variables and conditional dependencies are encoded through CPTs or canonical parameterizations. It provides complete posterior distributions, combines operational evidence with expert judgement, and permits evidence to be updated between assessments. These features can support uncertainty-aware UAS mission analysis. Table 5 positions the present study relative to selected SORA and Bayesian approaches.
The main challenges are variable definition, causal or dependency justification, parameter elicitation, and validation. When operational data are limited, probability assignments can be dominated by expert judgement. A BN therefore remains an analytical supplement and does not acquire regulatory standing independently of SORA.

3.5. Comparative Discussion

The reviewed methods address different decision problems. SORA provides the recognized regulatory classification process; engineering methods explain failure and barrier pathways; and BNs represent uncertainty and conditional dependence. The specific contribution evaluated here is the feasibility of reporting assumption-dependent probability mass and sensitivity over SORA-equivalent endpoints while preserving the official deterministic mappings.

4. Methodology of Work

This concept-driven proof-of-concept study constructs a static BN augmentation of JARUS SORA 2.5 and illustrates its behavior using an airport airframe-inspection scenario. The workflow comprised review of regulatory and scientific sources, comparison of alternative methods, definition of the network structure and state spaces, conventional SORA assessment of the scenario, BN evidence assignment, internal boundary checks, and one-way evidence-state sensitivity analysis.

4.1. Research Design

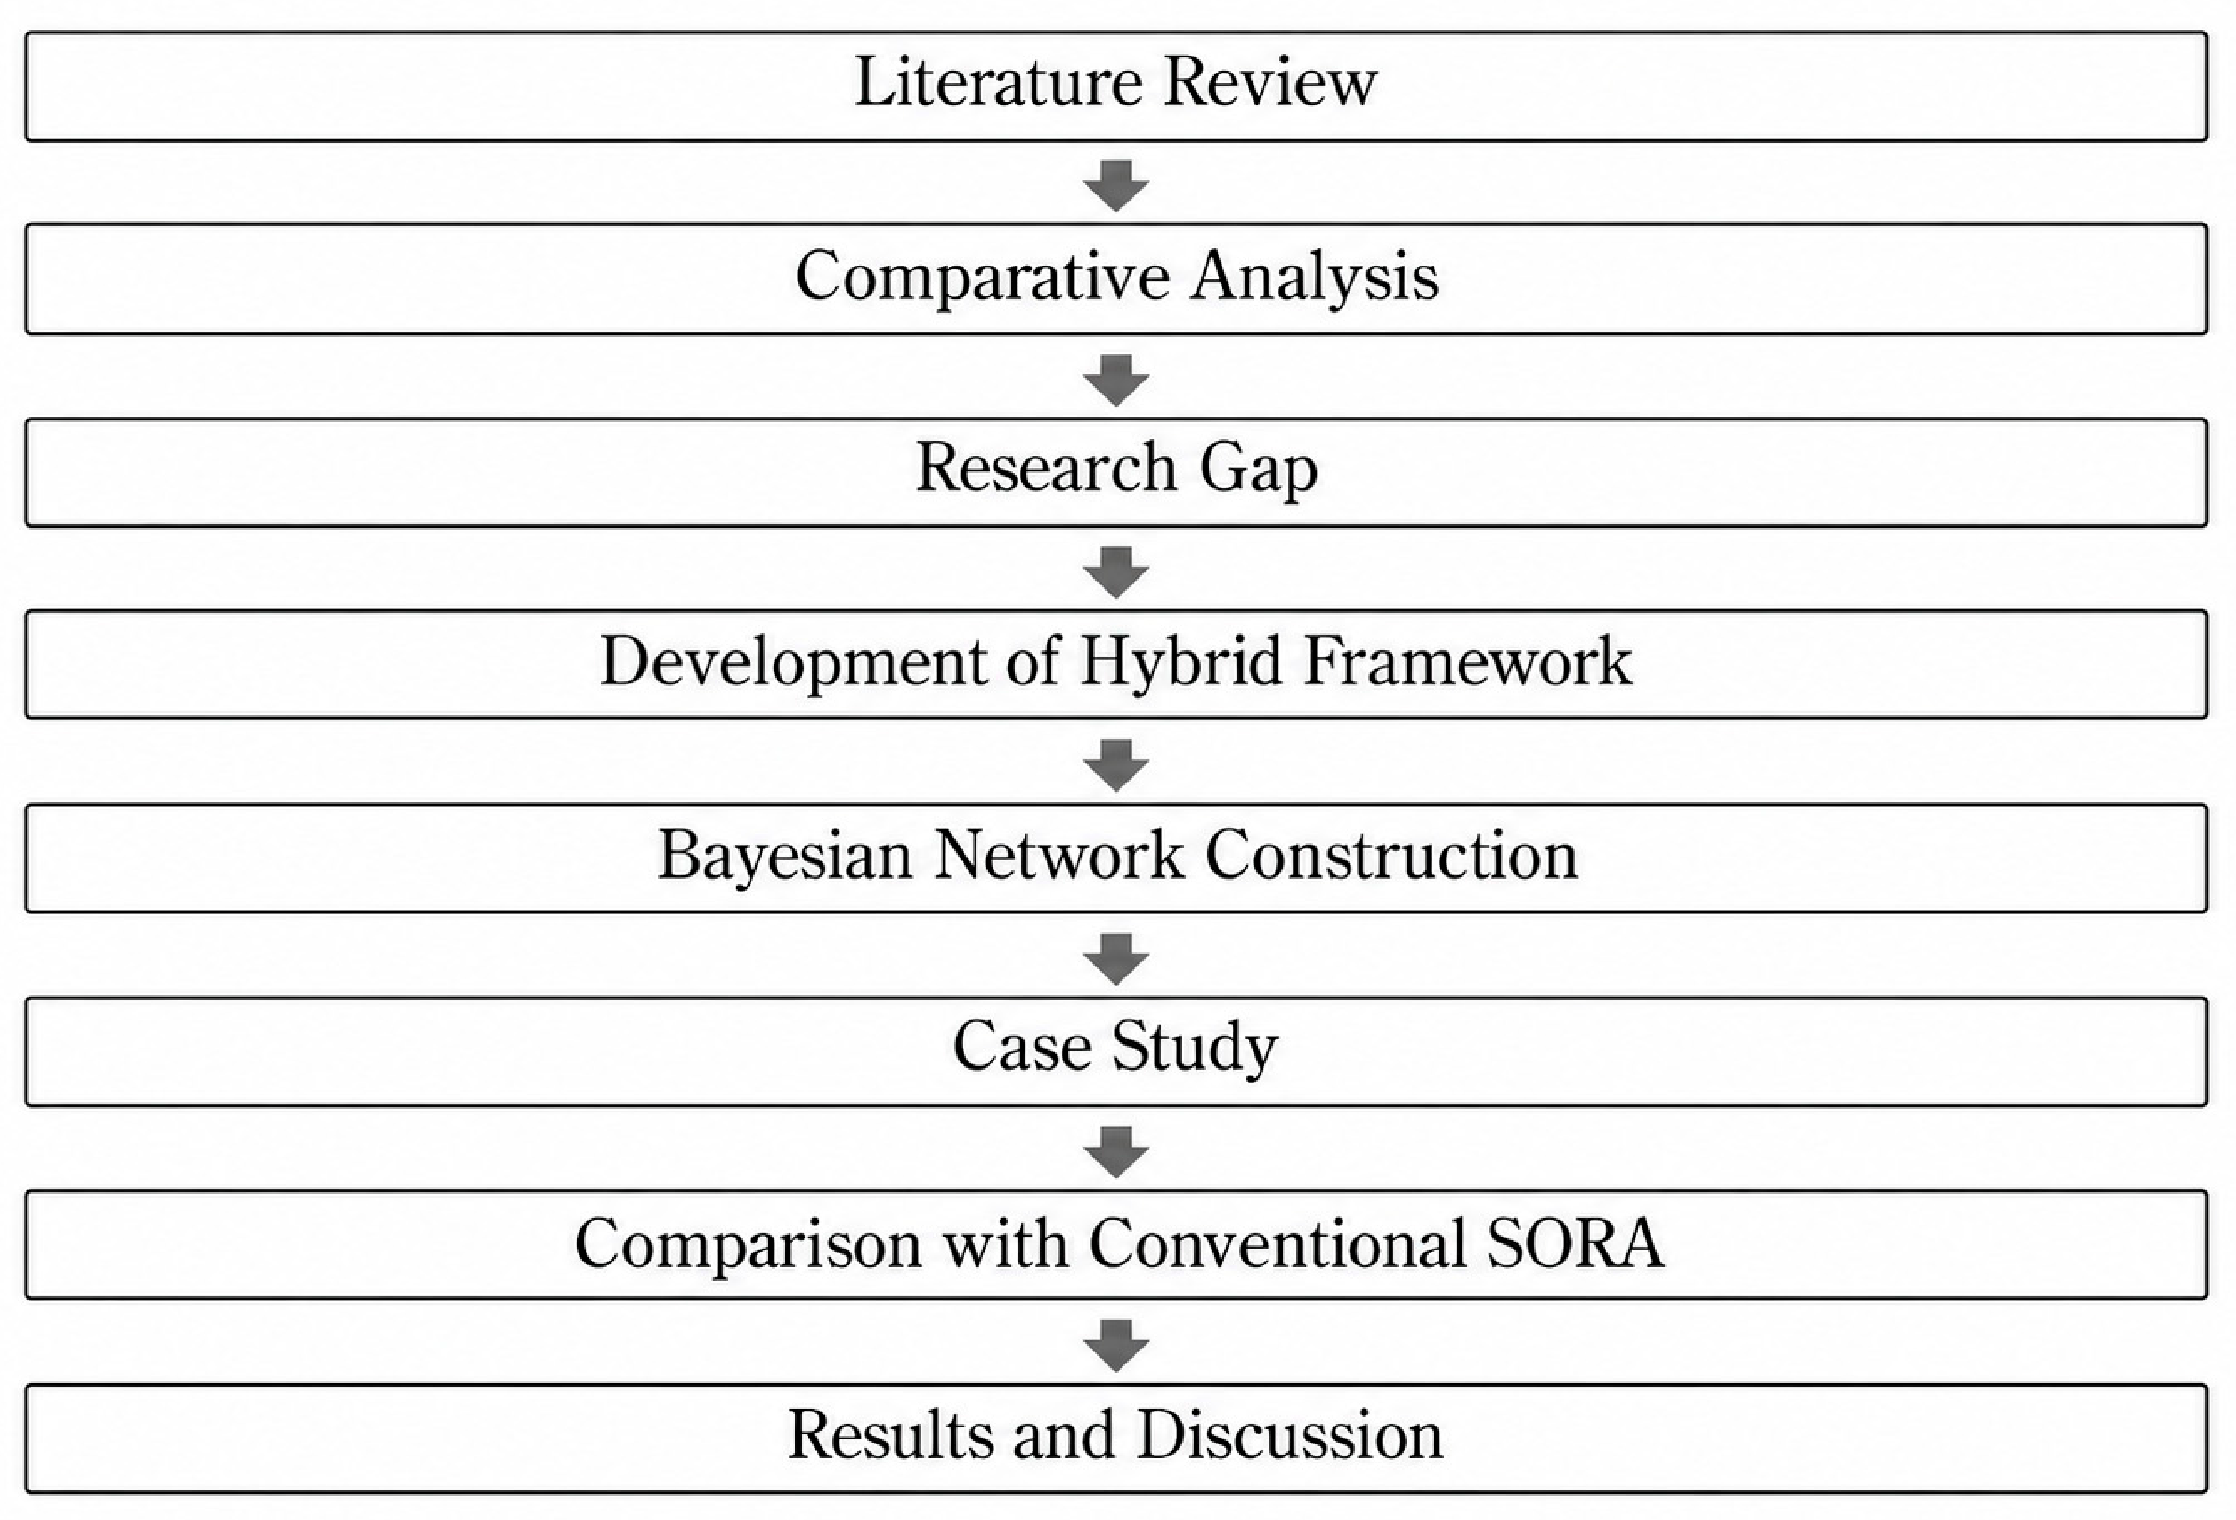
The research was conducted in five phases. First, relevant regulations and the scientific literature were reviewed to identify UAS risk assessment requirements and modeling constraints. Second, regulatory, engineering, and probabilistic approaches were compared. Third, Final GRC and Residual ARC state spaces were represented as probabilistic BN nodes, while the SAIL mapping remained deterministic. Fourth, the airport-inspection scenario was assessed using conventional SORA and the same scenario evidence was entered into the BN. Fifth, modal coherence, favorable and adverse boundary conditions, and one-way evidence-state sensitivity were examined. Figure 3 summarizes the workflow.

4.2. Data Sources and Regulatory Baseline

The framework draws on three source groups: regulatory documents, peer-reviewed literature, and an illustrative case description. JARUS and EASA documents define the regulatory workflow, state spaces, and deterministic mappings. The scientific literature on BNs, aviation safety, probabilistic risk assessment, human–machine–environment–procedure factors [35], and UAS operations informed the candidate variables and dependency rationale. The airport airframe-inspection example was selected because it combines ground-exposure, aircraft, mitigation, and controlled-airspace considerations.
The regulatory baseline is JARUS SORA Edition 2.5, introduced into EASA guidance by ED Decision 2025/018/R and incorporated into the June 2026 Easy Access Rules for Unmanned Aircraft Systems [5,6,7]. The BN extends only the evidentiary path to Final GRC and Residual ARC; SAIL is obtained through the official deterministic mapping. Containment Requirements (Step 8) and Operational Safety Objectives (Step 9) remain deterministic outputs of the SORA workflow and are not BN nodes.

4.3. Bayesian Network Implementation and Node Structure

The proposed BN was implemented in GeNIe Academic software 3.0. It contains eight evidence nodes, two probabilistic regulatory classification nodes (Final GRC and Residual ARC), and one deterministic SAIL node.
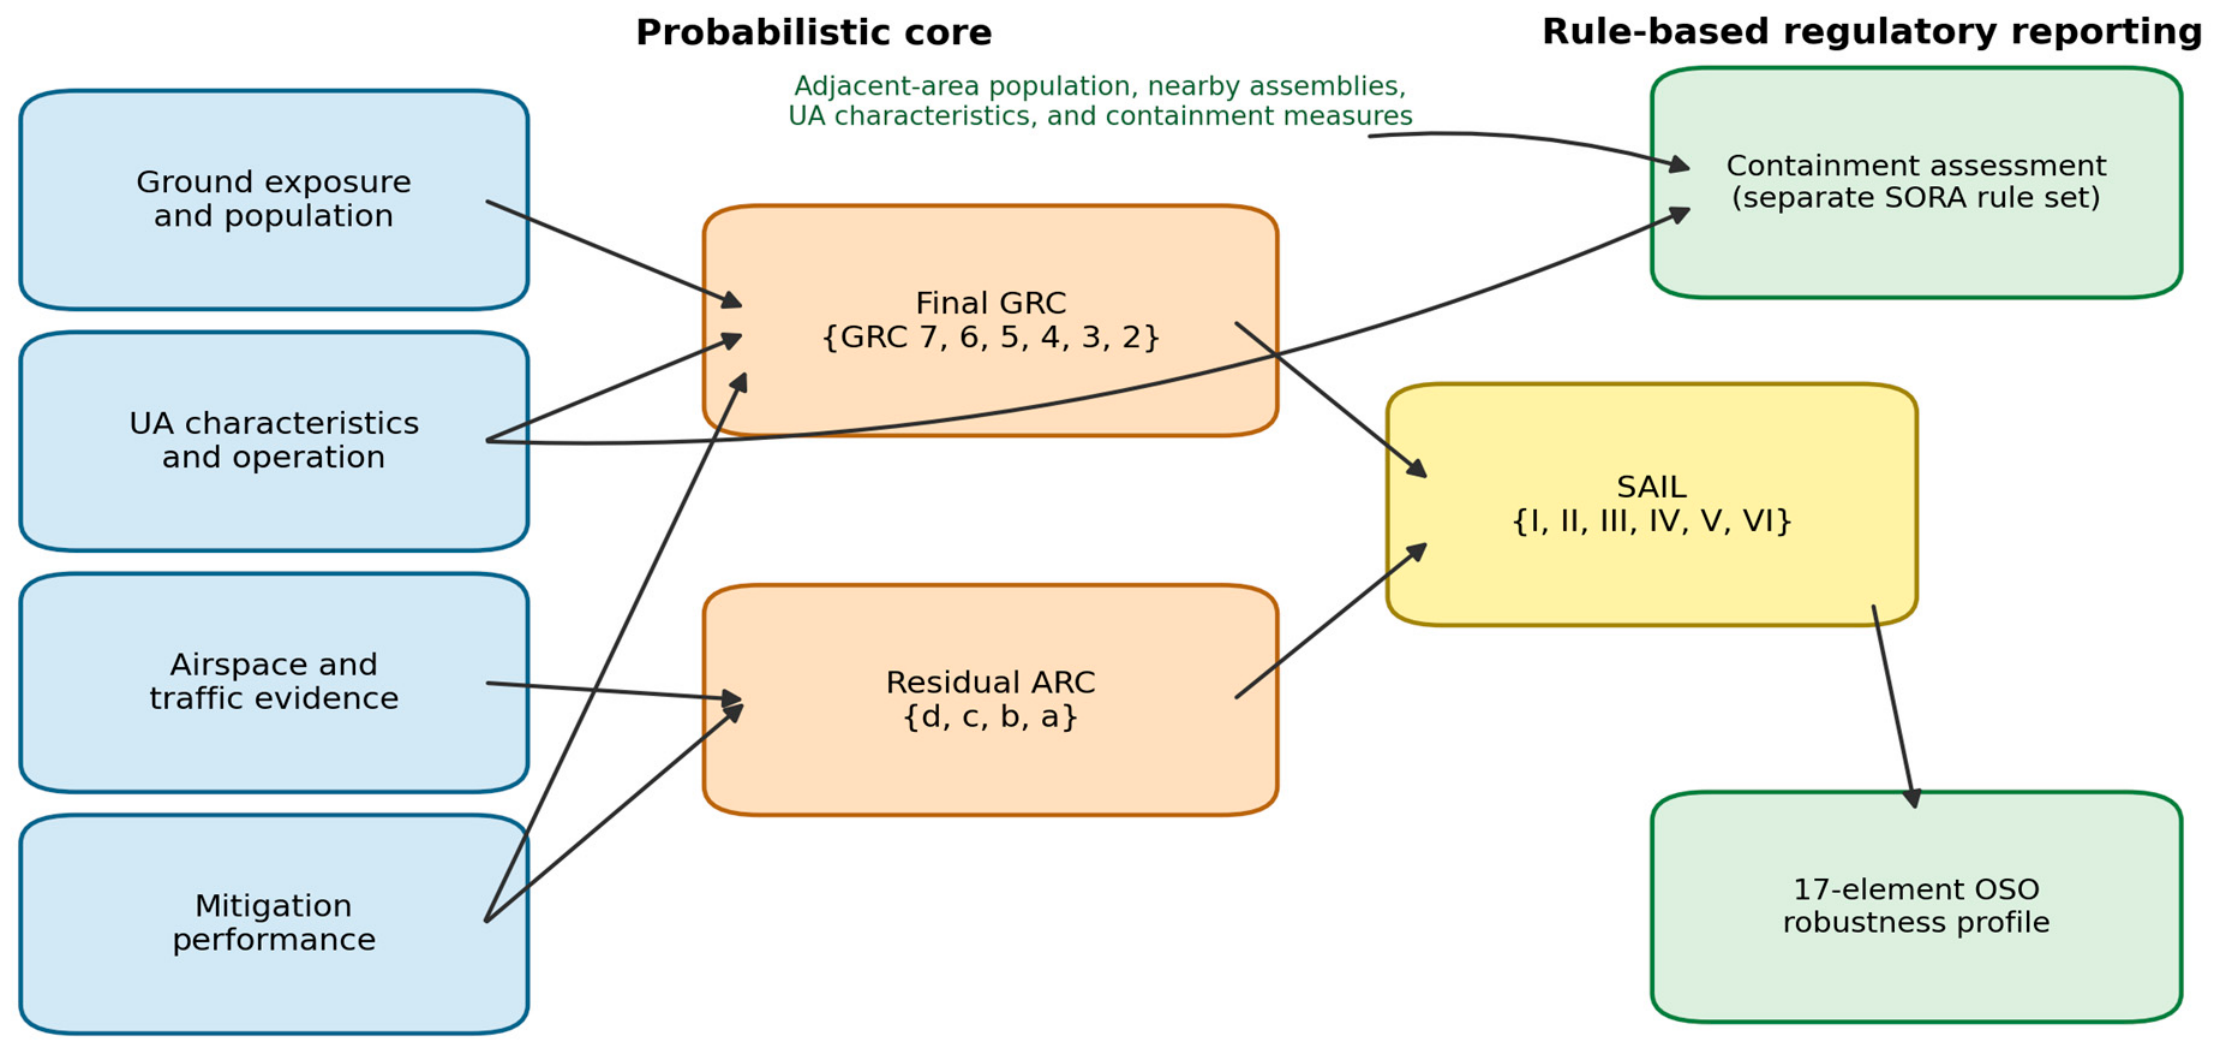
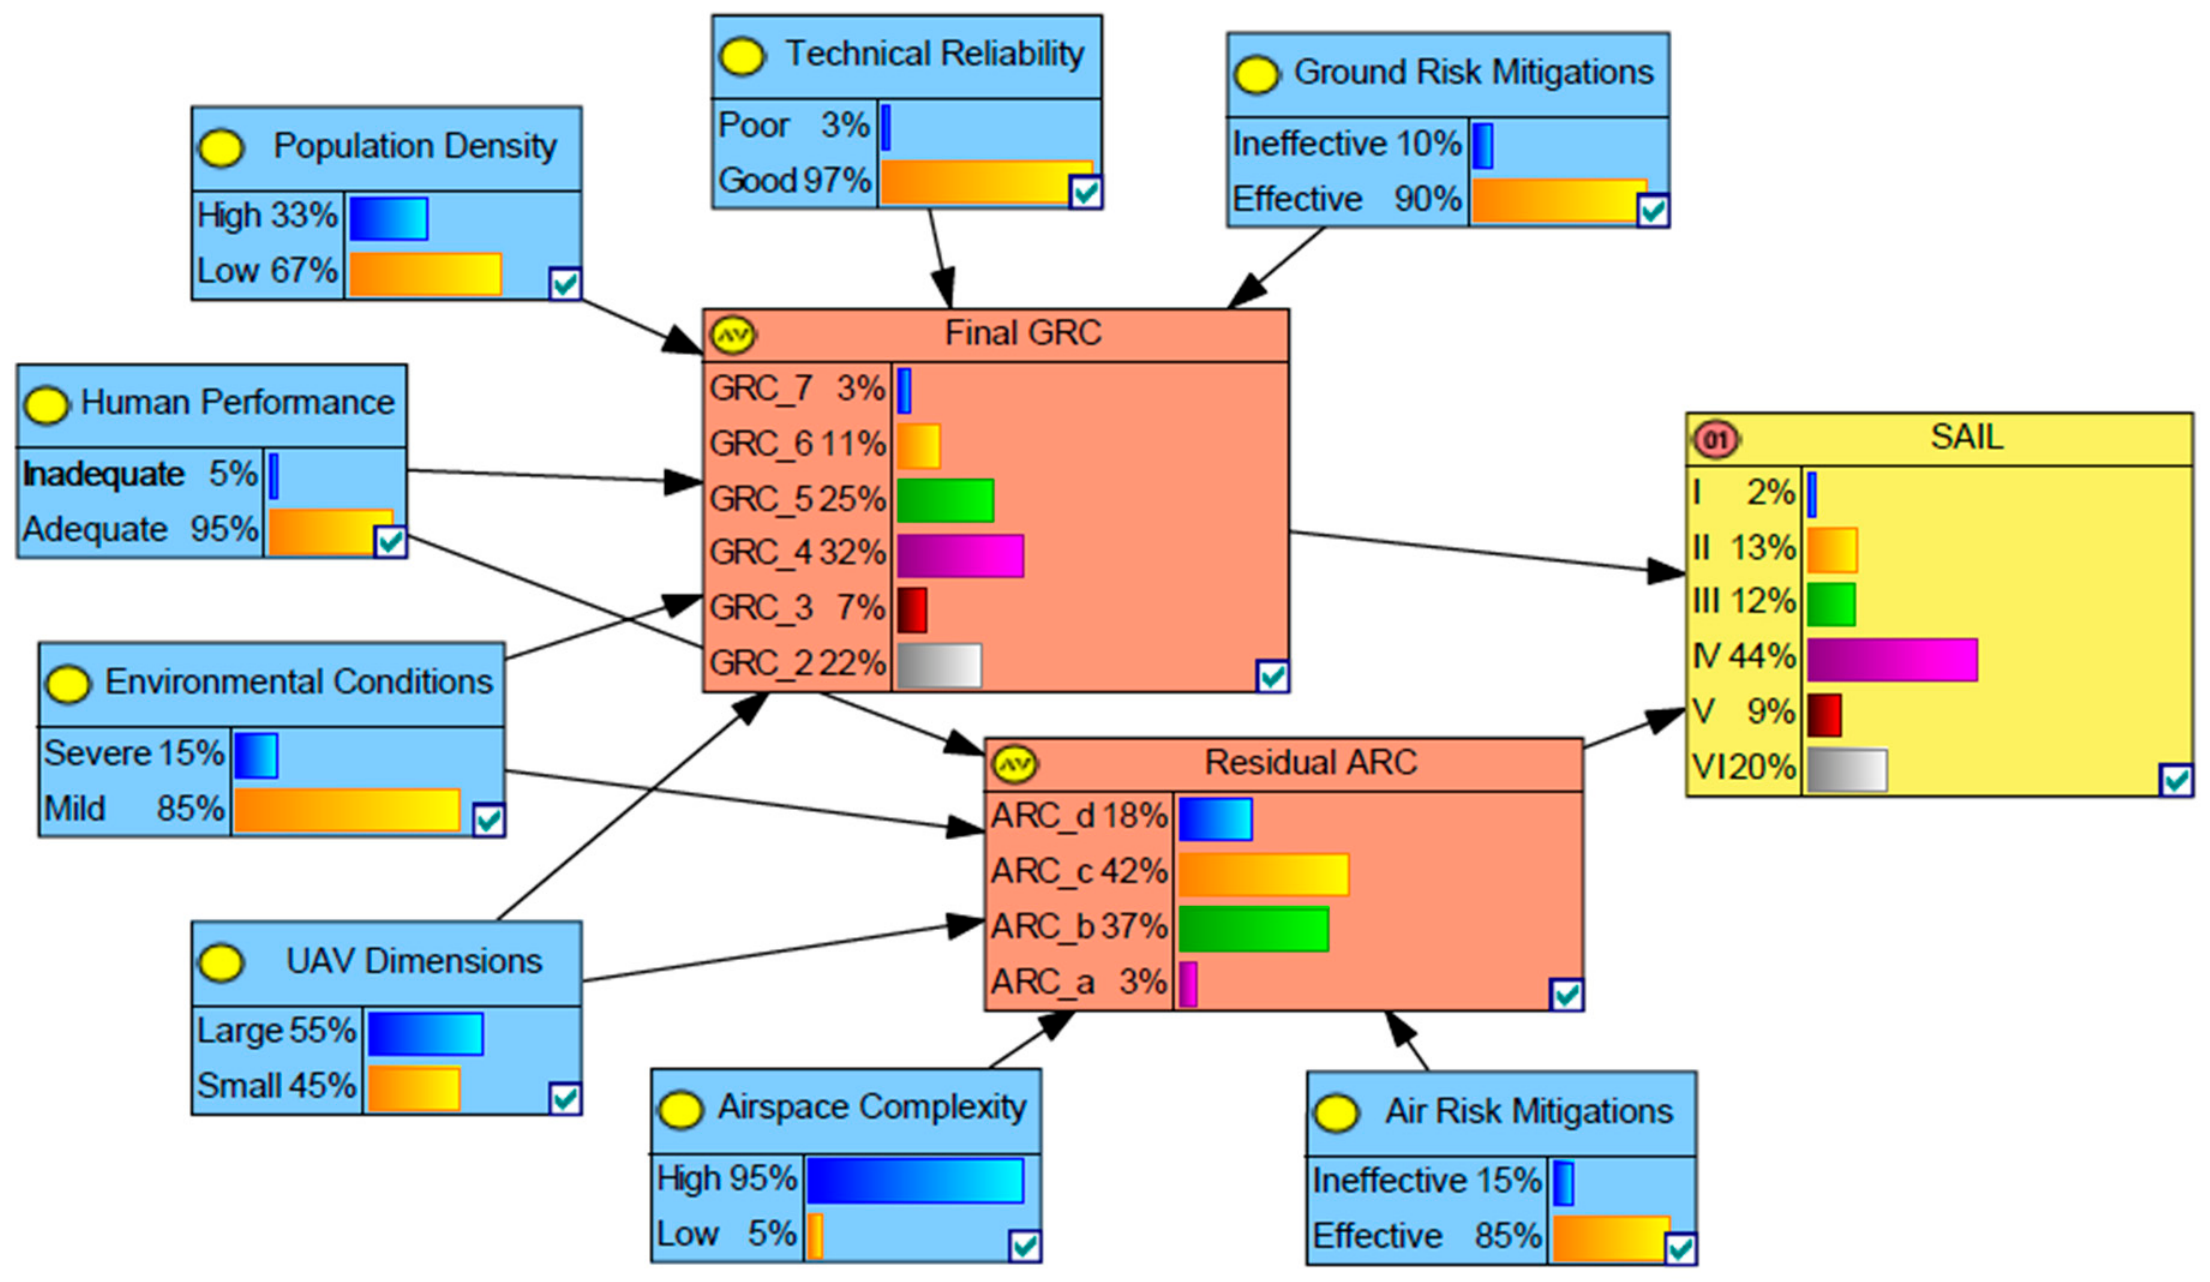
The evidence nodes are Human Performance, Technical Reliability, Environmental Conditions, UAV Dimensions, Population Density, Airspace Complexity, Ground Risk Mitigations, and Air Risk Mitigations. Final GRC has six parents: Population Density, UAV Dimensions, Technical Reliability, Environmental Conditions, Human Performance, and Ground Risk Mitigations. Residual ARC has five parents: Airspace Complexity, UAV Dimensions, Environmental Conditions, Human Performance, and Air Risk Mitigations.
The regulatory layer consists of the Final Ground Risk Class (GRC), Residual Air Risk Class (ARC), and Specific Assurance and Integrity Level (SAIL). The GRC and ARC nodes were modeled probabilistically using Noisy-MAX parameterization, allowing uncertainty in the evidence nodes to propagate through the network. The SAIL node preserves the official SORA 2.5 mapping between Final GRC and Residual ARC and therefore represents the regulatory outcome rather than an alternative risk metric.
The BN terminates at the SAIL node. Containment Requirements and OSO robustness are not represented as Bayesian nodes because SORA defines them through deterministic rule tables after SAIL has been established. They are therefore reported separately to preserve the official SORA workflow.

4.4. Model Parameter Development

Three source types were used during model development: (i) documented aircraft characteristics and explicit case assumptions; (ii) SORA 2.5 state definitions and rule tables; and (iii) published safety literature and engineering judgement used to define candidate dependencies and illustrative probability assignments. NASA ASRS material [36] was consulted only as a qualitative plausibility check for recurring human, environmental, communication, and airspace factors; it was not used to estimate priors, causal parameters, or CPT entries.
The submitted model uses soft two-state distributions for all eight evidence nodes, as reproduced in Table 6 and Figure 6. Documented aircraft dimensions and speed remain physical observations for the conventional SORA calculation, but the BN’s UAV Dimensions node uses a soft large/small assignment as a modeling assumption. Environmental conditions, population density, and mitigation effectiveness are likewise represented by soft distributions rather than 100-percentage-point evidence.
No reproducible ASRS search protocol, date window, report-identification list, inclusion criteria, or coding log was contained in the submitted materials. Consequently, this revision does not describe the ASRS consultation as a systematic screening and does not attribute any numerical parameter to ASRS. A future empirical study should preregister the query, retain report identifiers, define a coding framework, document duplicate handling, and report how each coded hazard maps to a node and state.
Final GRC and Residual ARC were parameterized in GeNIe using ordinal Noisy-MAX relationships. In a Noisy-MAX model, each parent state has a cause-specific distribution over the ordinal child states; the parent contributions and any leak term are combined under causal-independence and monotonicity assumptions to generate the full CPT [37]. These assumptions reduce the number of elicited values but do not make the parameters empirical. The SAIL node does not use Noisy-MAX: it applies the deterministic SORA 2.5 lookup from Final GRC and Residual ARC.

4.5. Proof-of-Concept Evaluation Method

The illustrative airport case was first assessed using SORA 2.5 to determine the reference classifications. Equivalent case evidence was then entered into the BN to obtain distributions over Final GRC, Residual ARC, and SAIL. Containment Requirements and OSO robustness were derived separately from the official SORA procedure.
The comparison focused on equivalent regulatory endpoints rather than alternative risk metrics. For each endpoint, the analysis reports the conventional SORA classification together with the posterior probability distribution obtained from the Bayesian Network. This permits examination of how the assumed input uncertainty is distributed across the regulatory state labels without modifying the underlying SORA decision process.

5. Development and Justification of the Proposed Model

5.1. Conceptual Framework of the Hybrid Model

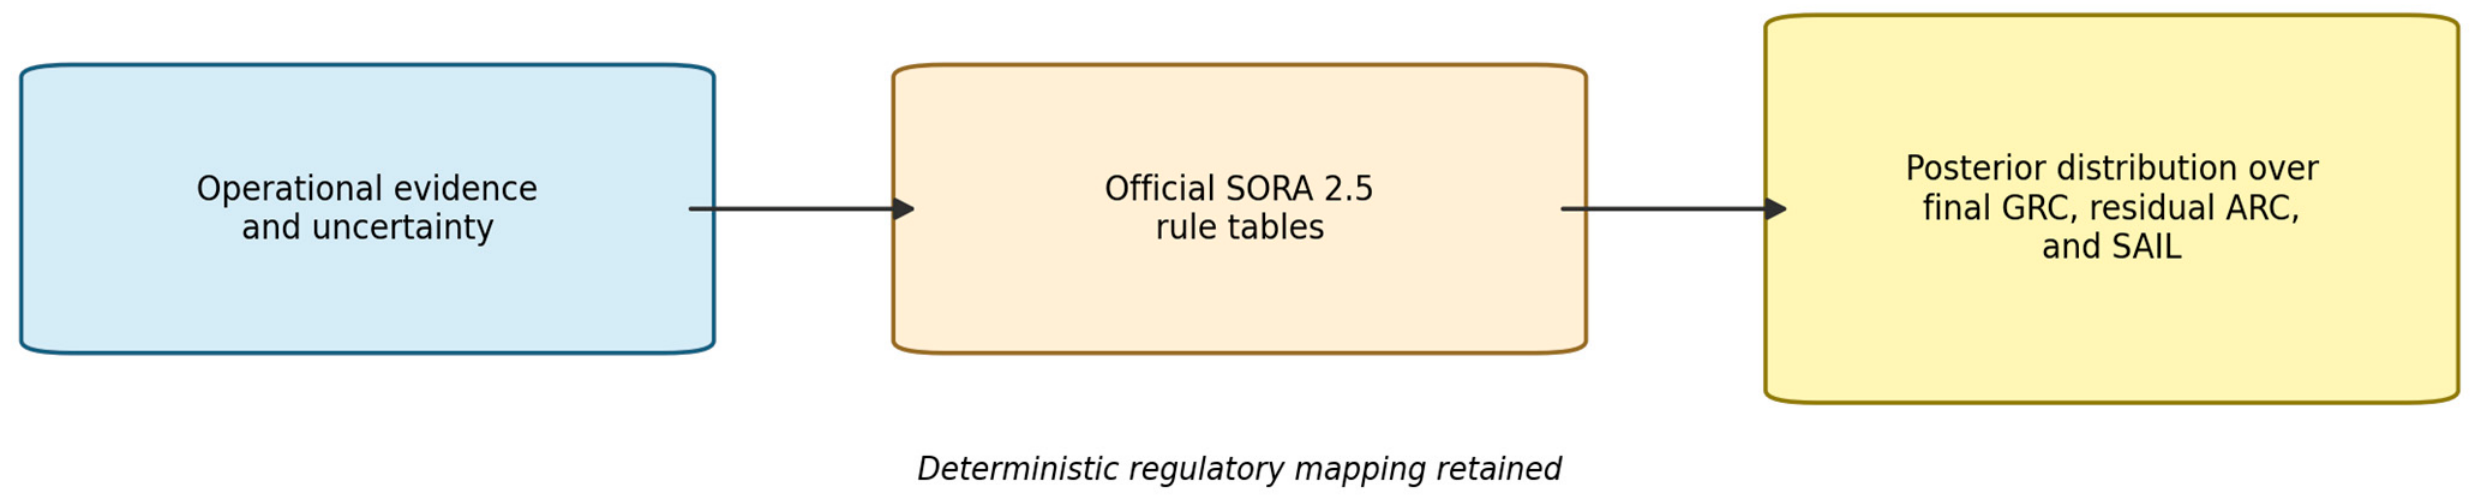
SORA 2.5 supplies the official classification and assurance structure. The BN represents uncertainty in the evidence entering Final GRC and Residual ARC, while SAIL remains a deterministic mapping. Containment and OSO reporting are kept outside the probabilistic core. Figure 4 summarizes this relationship.
The framework retains the official Final GRC, Residual ARC, and SAIL state spaces. Evidence and mitigation assumptions feed the probabilistic Final GRC and Residual ARC nodes, and the official lookup maps those states to SAIL. Containment Requirements and the OSO robustness profile are then obtained separately from the applicable SORA 2.5 rule tables. Figure 5 illustrates this traceable separation.

5.2. Why SORA and Bayesian Networks?

SORA was selected because it provides the recognized mission-level process for UAS operations in the European Specific category. Its standardized terminology and traceable classifications, mitigations, and assurance requirements provide the regulatory endpoints to which the BN states are aligned.
BNs were selected because they represent uncertainty explicitly, combine heterogeneous evidence, and update posterior distributions when evidence changes [30]. Here, their analytical role is to show how the assumed evidence distributions affect SORA-equivalent classifications and to identify the inputs with the greatest influence on the SAIL distribution.
The implementation is a static BN. It supports posterior updating when evidence is changed before or between assessments, but it does not model temporal state transitions, automatic sensor ingestion, or continuous in-flight risk. The terms “dynamic” and “real-time” therefore do not describe the present model.

5.3. Bayesian Network Architecture

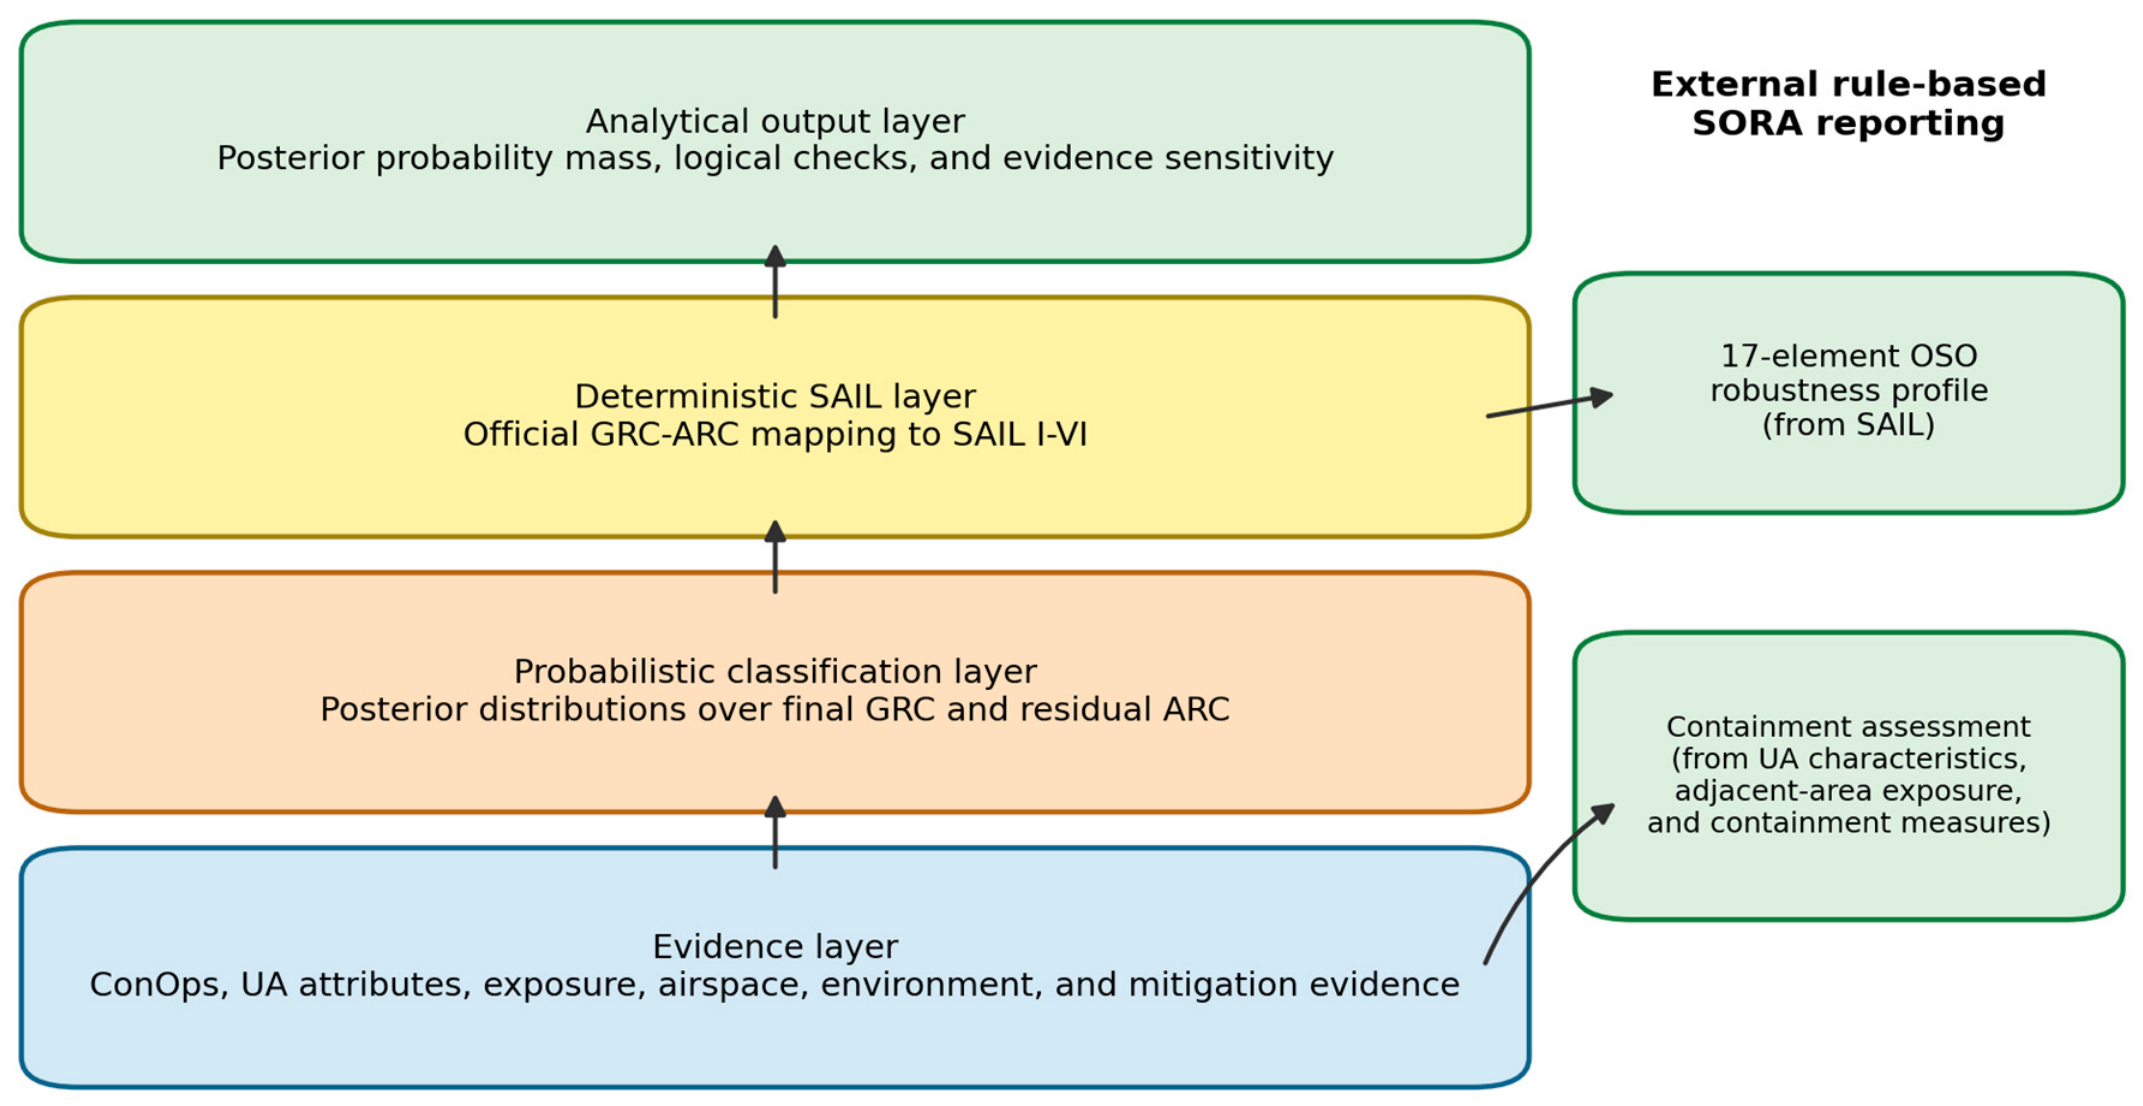
The network is implemented as a layered directed acyclic graph in GeNIe. The evidence layer contains eight operational variables represented by the distributions in Table 6. Final GRC has the state space {≤2, 3, 4, 5, 6, 7, >7}, and Residual ARC has {a, b, c, d}. SAIL has {I, II, III, IV, V, VI, certified-category outcome} and is mapped deterministically from Final GRC and Residual ARC. Containment Requirements and OSO robustness are determined after SAIL from the SORA 2.5 tables. The analytical outputs are posterior state distributions and sensitivity measures, not regulatory decisions. The four-layer structure is shown in Figure 6.
The implemented network contains eight root evidence nodes, two probabilistic regulatory classification nodes (Final GRC and Residual ARC), and one deterministic SAIL node.
The framework does not estimate the probability that a competent authority will grant an operational authorization. Under Article 12 of Commission Implementing Regulation (EU) 2019/947, authorization follows the competent authority’s evaluation of the operational risk assessment, mitigations, and supporting evidence. The outputs of the present model are therefore limited to uncertainty distributions over the official SORA classifications and to the identification of parameters that influence those classifications.

5.4. Variables and Causal Relationships

Variables are classified as documented observations, soft evidence assignments, or regulatory states. Documented dimensions, mass, and speed support conventional aircraft and kinetic energy characterization. The BN evidence nodes use the explicit soft distributions reported in Table 6, including the UAV Dimensions state assignment. Final GRC and Residual ARC are probabilistic regulatory-state nodes, while SAIL is deterministic. This distinction prevents a probability assignment from being misrepresented as a measured frequency.
The core regulatory nodes and their state spaces are presented in Table 7. Deterministic rule nodes are used where SORA prescribes an exact mapping; probabilistic conditional distributions are used only for uncertain evidence and mitigation performance. This separation prevents Bayesian assumptions from altering the regulatory classification logic.
Each directed edge represents an operationally interpretable parent–child relationship. The current structure nevertheless assumes conditional independence among parents given each child, as required by the selected canonical parameterization. Interactions among weather, communication, human performance, traffic, exposure, and mitigation effectiveness were not tested. Structural alternatives and d-separation implications should therefore be included in future validation.

5.5. Parameterization and Regulatory Mapping

Parameterization follows the evidence hierarchy in Section 4.4. Table 6 reports the baseline root node distributions visible in the implemented model. For the two ordinal classification nodes, a complete reproducibility record consists of every parent-state Noisy-MAX causal distribution, any leak distribution, the generated CPT, the node ordering, and the software/model version. The joint distribution factorizes as the product of each node’s conditional distribution given its parents [29]. Canonical Noisy-MAX is used only for ordinal probabilistic nodes satisfying causal-independence and monotonicity assumptions [37]; it is not used for the deterministic GRC-ARC-SAIL mapping, containment rules, or OSO robustness table.
The current numerical output should be interpreted primarily as a sensitivity analysis demonstration. They show how the assumed structure and parameters redistribute probability mass across official state labels, but they do not establish absolute real-world risk probabilities or the likelihood of authorization. Table 8 summarizes the required traceability for a fully reproducible model.

6. Case Study: Application of the Proposed Model

6.1. Description of the Case Study

A representative multirotor inspection of a stationary aircraft on an apron at Riga Airport was developed to illustrate the framework. The example combines restricted-ground-area assumptions with controlled-airspace coordination and is intentionally used as a methodological demonstration rather than as evidence that the model generalizes to other operations.
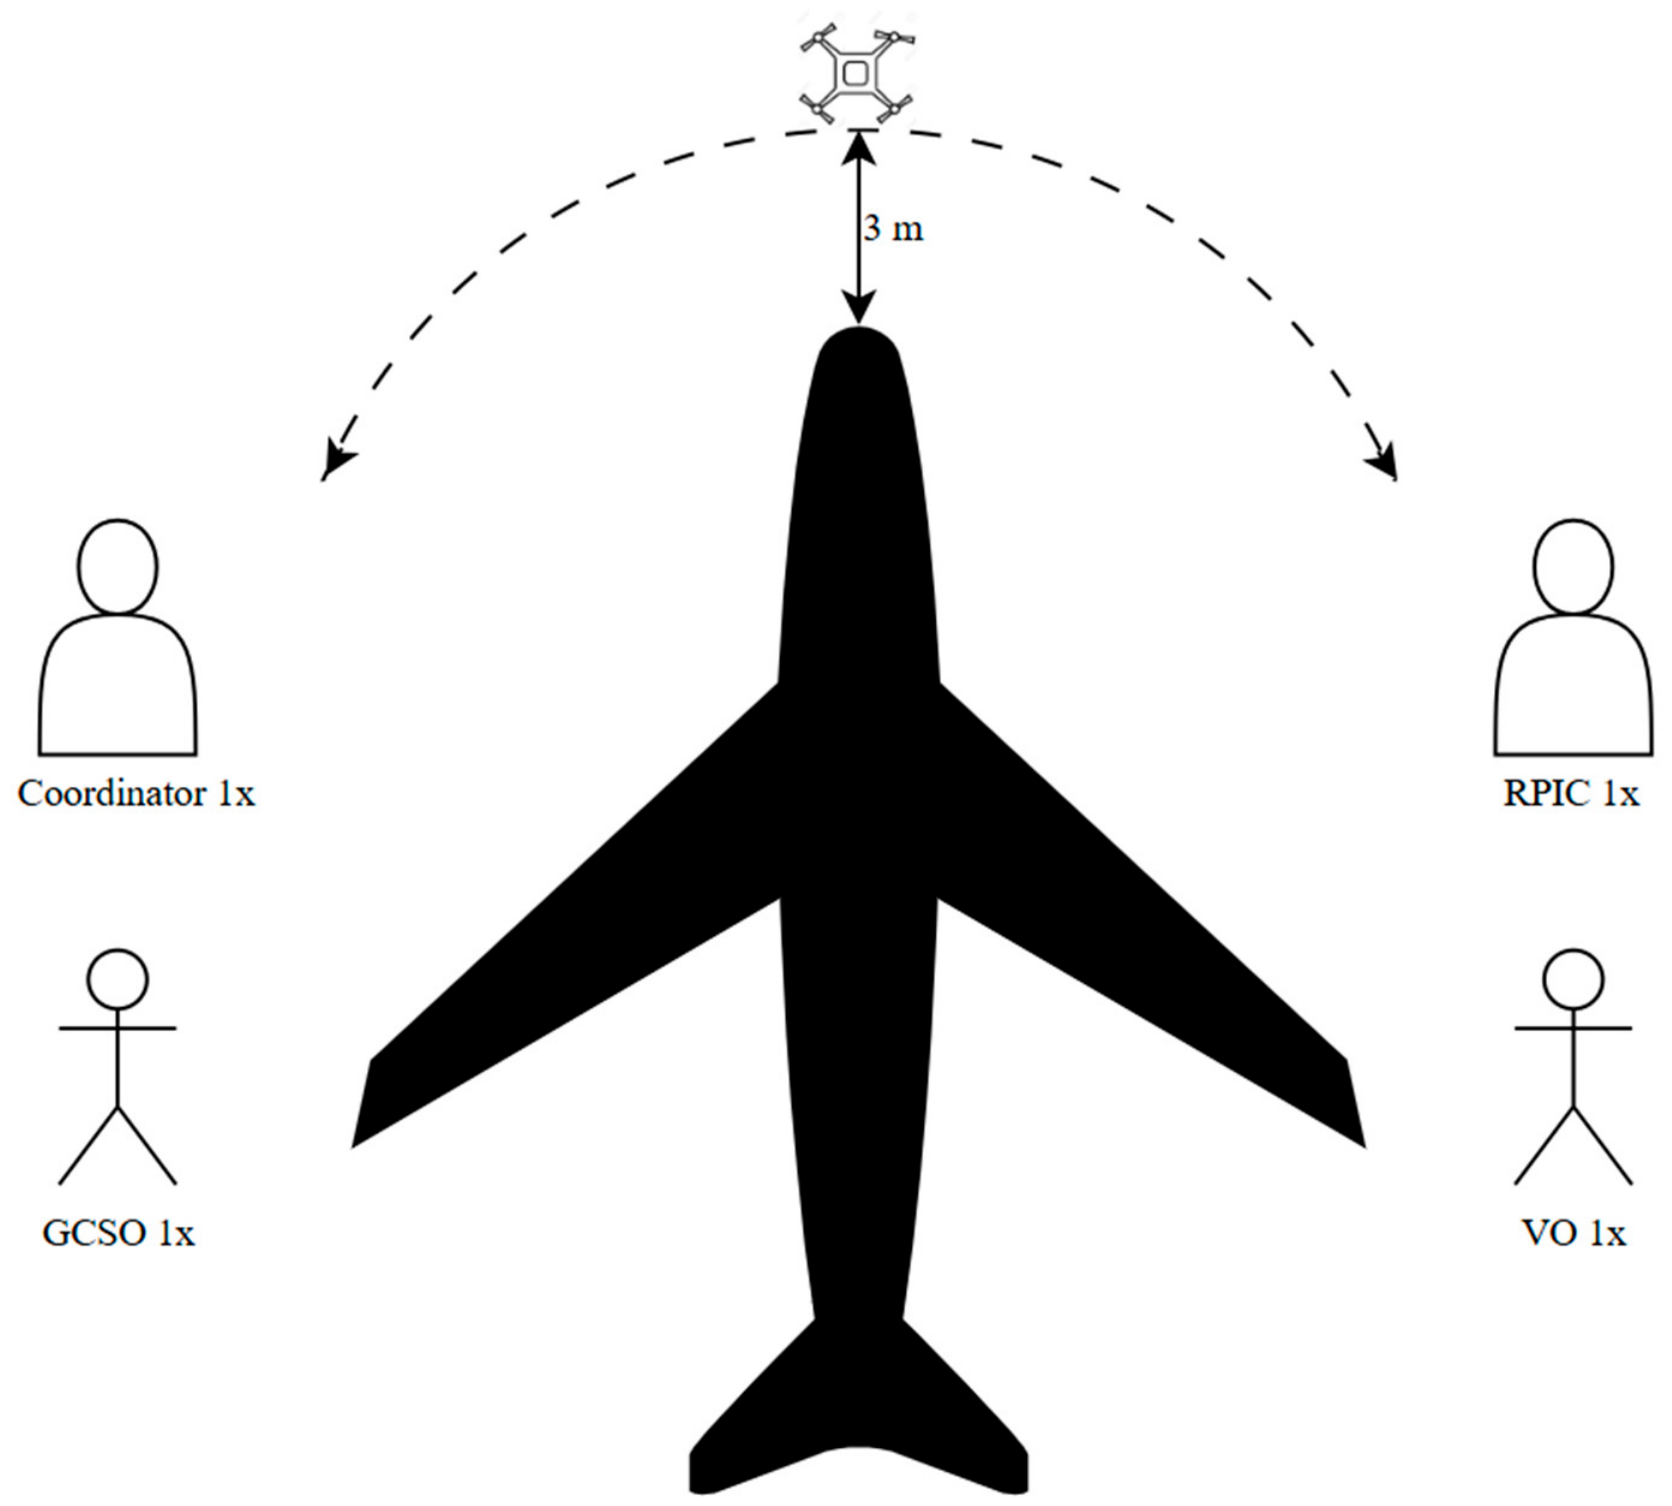
The mission is a single-UAS Visual Line-of-Sight (VLOS) operation. The crew consists of one Coordinator, one Remote Pilot-in-Command (RPIC), one Ground Control Station Operator (GCSO), and one Visual Observer (VO). The UAS maintains a nominal 3 m stand-off distance from the aircraft, flies at 1 m/s during inspection, and records visual data. The operation strategy is illustrated in Figure 7.
The mission employs a DJI Matrice 600 SZ DJI Technology Co., Ltd., Shenzhen, China [38] multirotor, which satisfies the operational requirements for infrastructure inspection while providing sufficient payload capacity and flight stability for visual data acquisition. The operation’s specifications are summarized in Table 9.
The case is a VLOS inspection in controlled airport airspace. A submission-grade ConOps would additionally require verified operational and adjacent-area boundaries, contingency volume, ground risk buffer, time-dependent exposed-person occupancy, local traffic data, ATC arrangements, emergency procedures, and evidence for each claimed mitigation. The simplified inputs used here are applied consistently to both assessments.

6.2. Risk Assessment Using SORA

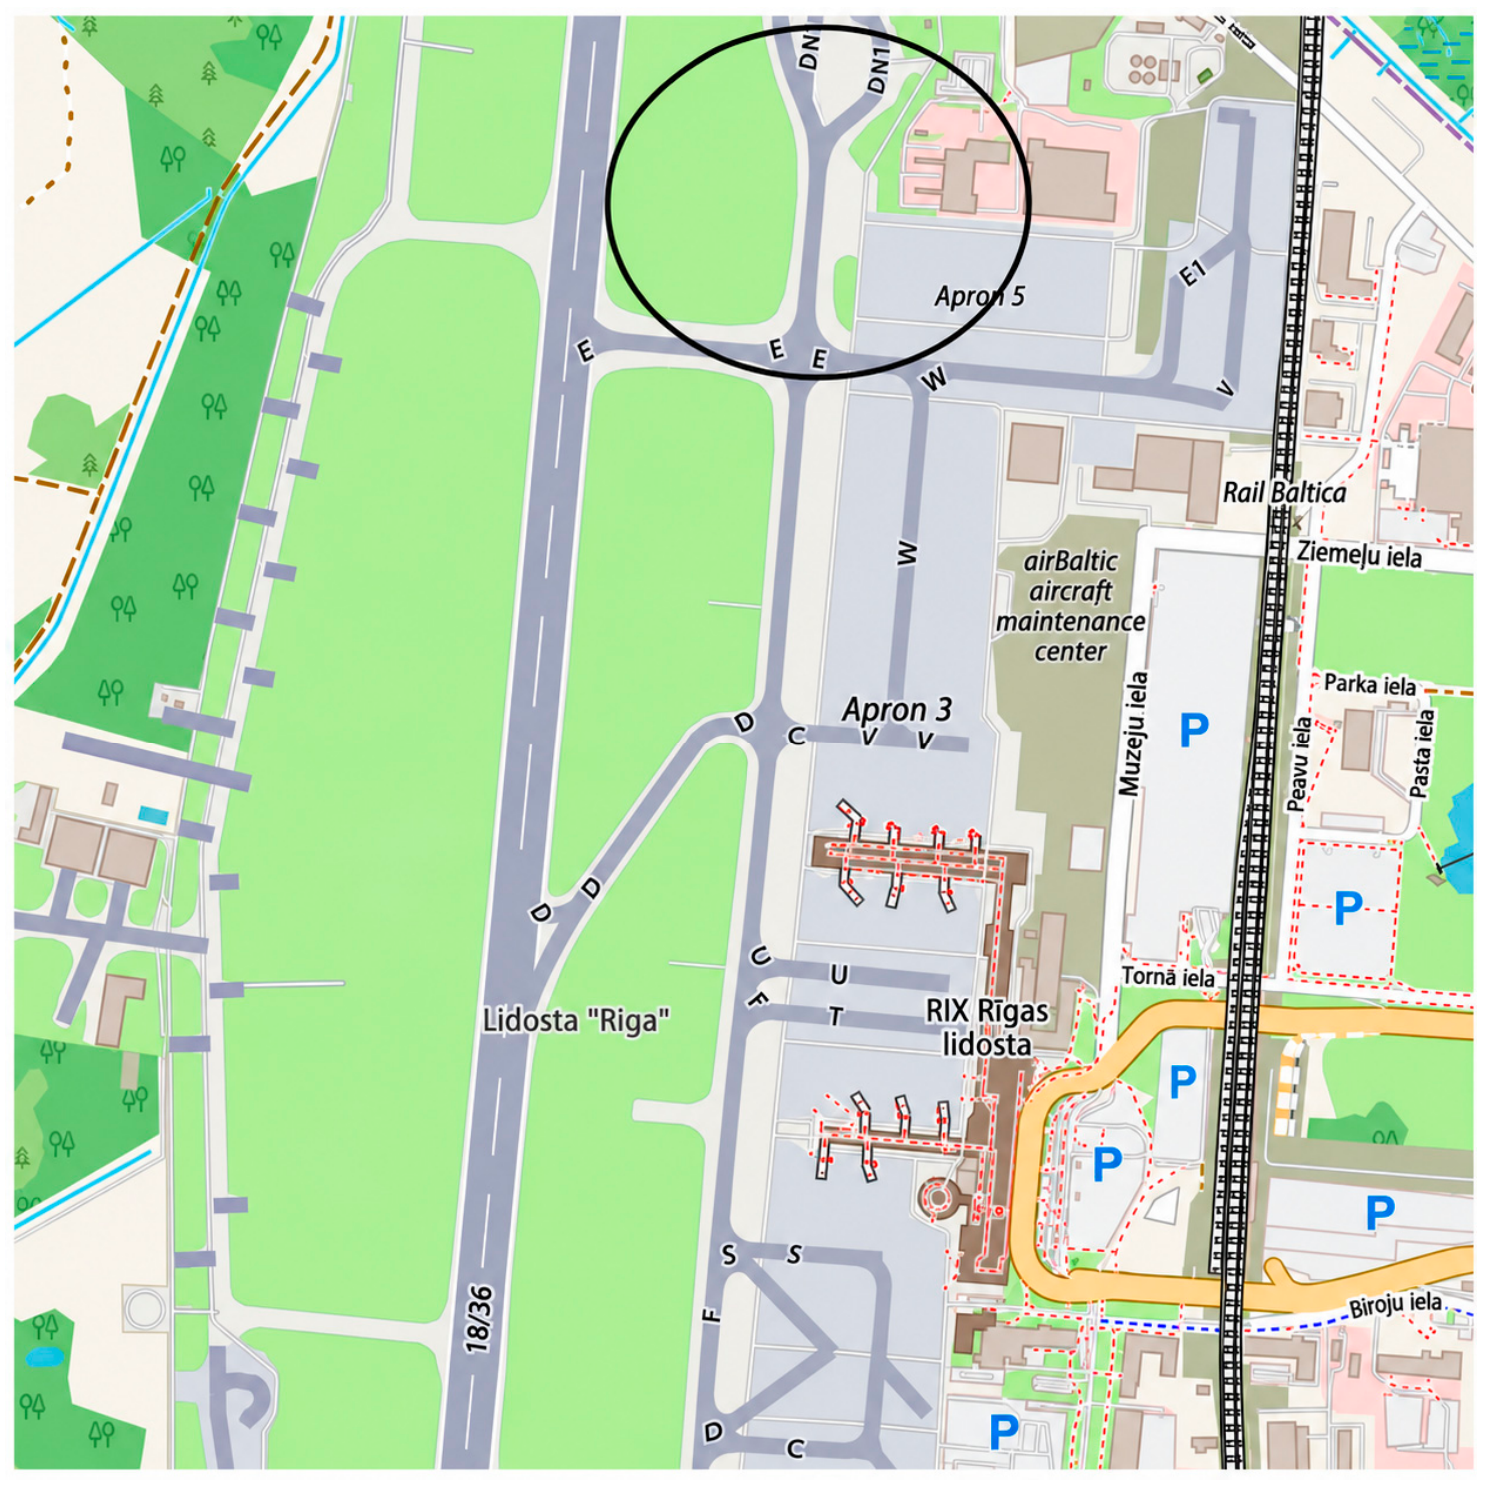
Step 1: ConOps. The illustrative operation concerns visual inspection of a stationary aircraft on Apron 5. Access to the operational area is assumed to be restricted to authorized personnel, with coordination between the remote crew, airport operations, and ATC. These coordination and access controls are scenario assumptions and require documentary evidence in an operational application. Figure 8 shows the stated mission location.
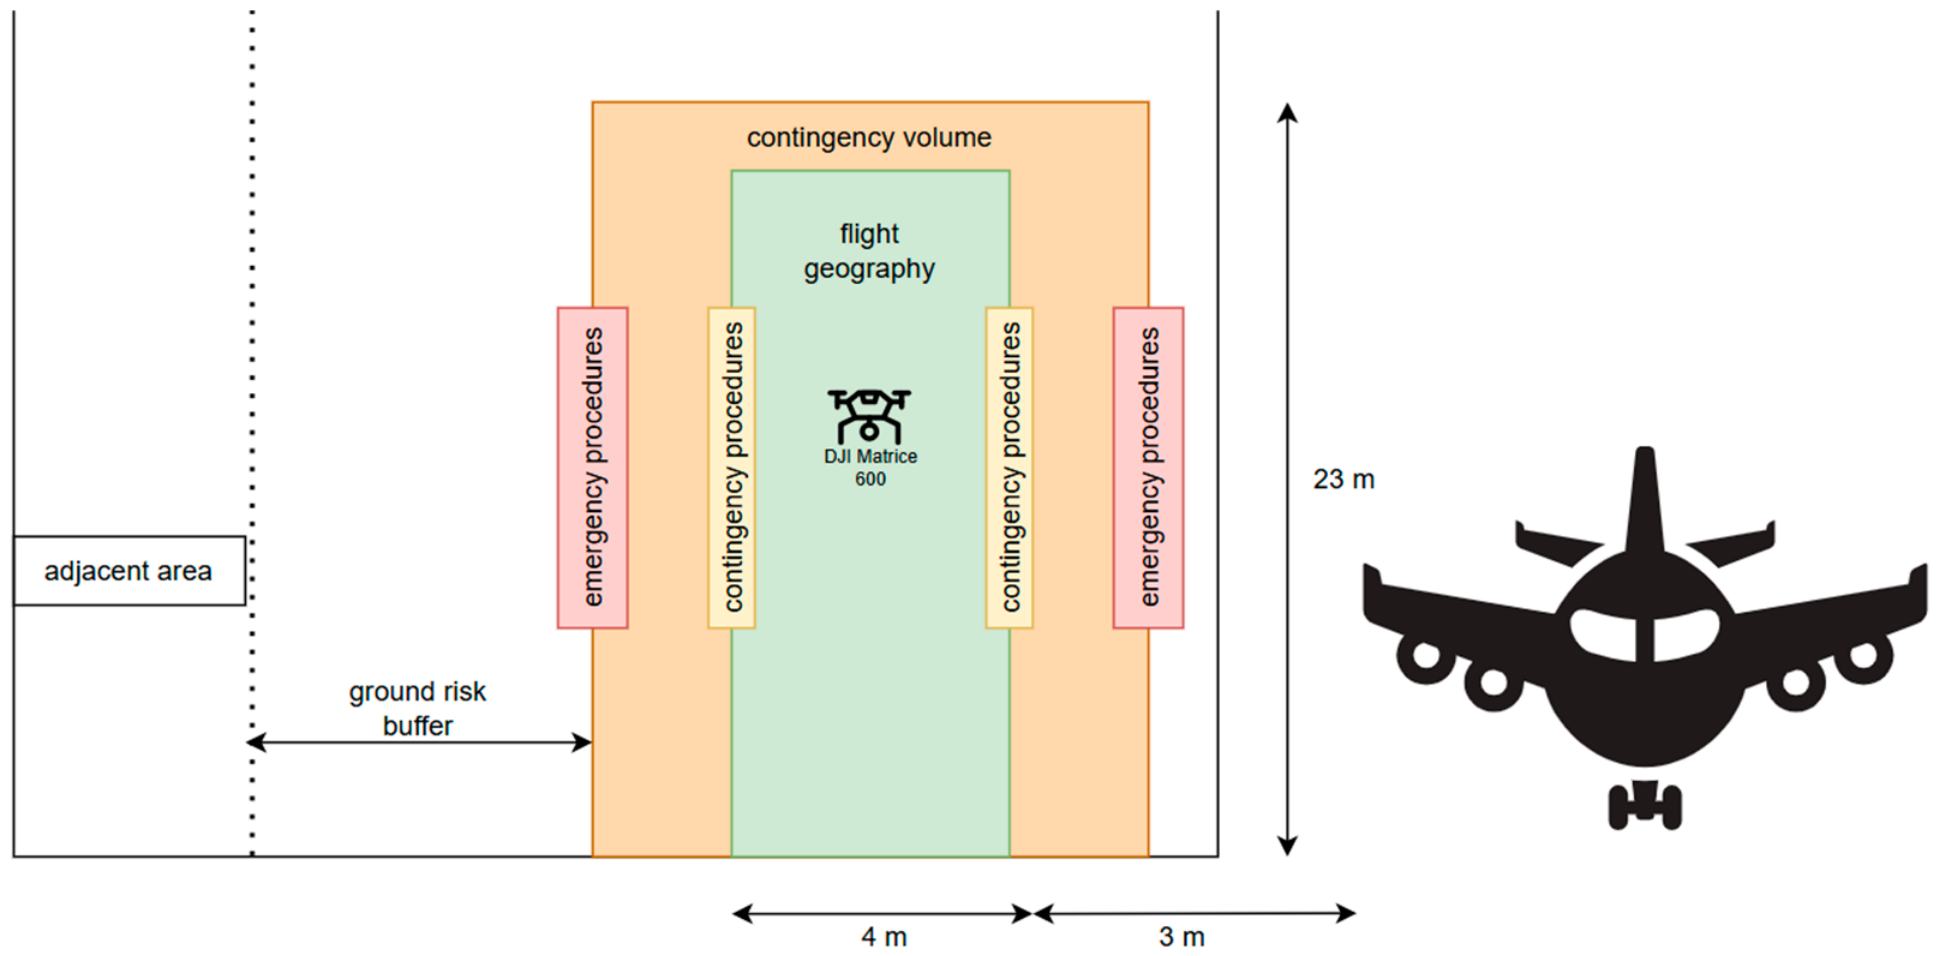
The DJI Matrice 600 characteristics are described in Section 6.1. The regional estimate of approximately 200 persons/km2 [39] is not a direct measurement of apron occupancy and is therefore not treated as certain evidence in the BN. The conventional SORA calculation uses a maximum aircraft speed of 18 m/s and the associated kinetic energy class, whereas 1 m/s is the nominal inspection speed. The maximum altitude is 23 m above ground level, and the nominal stand-off distance is 3 m. Figure 9 illustrates the operational volume:
The pre-flight scenario assumes that (1) the operational area is temporarily secured; (2) access is restricted to authorized maintenance personnel; (3) continuous communication is maintained among the RPIC, Coordinator, and airport operations; and (4) the activity is coordinated with ATC. During flight, the RPIC continuously maintains VLOS, the VO monitors the surrounding airspace, and an immediate controlled landing is initiated if unexpected traffic enters the operational volume.
Steps 2–3: Ground Risk Class (GRC) determination [6]. The quantitative SORA iGRC model uses a characteristic dimension of 1–3 m, a maximum speed of 18 m/s, and the case assumption of fewer than <500 people/km2. Under those assumptions, the intrinsic class is iGRC 5 before mitigation. The density value is a regional proxy and would need to be replaced by operation-specific occupancy evidence in a real application.
Three strategic mitigations are applied: (1) restricted operational area; (2) authorized personnel only; and (3) emergency procedures. After applying these mitigations, the Final GRC is reduced to 4.
Steps 4–5: Air Risk Class (ARC) determination. The operation takes place inside the Riga CTR—class C airspace [40]. The intrinsic ARC is ‘d’ (highest risk). Figure 10 illustrates the estimation of initial ARC for the UAS airframe inspection.
The scenario assumes ATC coordination and apron closure together with VLOS operation by a dedicated RPIC and VO. Under these assumptions, the Residual ARC is assessed as c.
Step 6: Tactical Mitigation Performance Requirement (TMPR) and robustness level. These mitigations are used after aircraft takeoff with the goal of reducing any remaining risk of a mid-air collision. Continuous visual observation of the operational volume was maintained by both RPIC and VO. In addition, communication with airport operations was maintained throughout the mission, and predefined emergency procedures were established to ensure the immediate termination of the operation whenever unexpected aircraft or vehicle movements were detected. Based on the operational characteristics of the mission and the selected tactical mitigations, the Tactical Mitigation Performance Requirement (TMPR) was assessed in accordance with the SORA 2.5 methodology [5,6].
Step 7: SAIL determination. The final SAIL was determined using the official SORA 2.5 mapping [5,6] between the Final Ground Risk Class (GRC 4) and the Residual Air Risk Class (ARC c). The resulting SAIL IV establishes the required level of robustness for the OSOs applicable to the proposed operation. This value serves as the regulatory baseline for the subsequent BN implementation.
Step 8: Containment Requirements. The operation was against SORA 2.5 containment provisions. The scenario assumes predefined operational boundaries, continuous visual monitoring, and immediate termination following an unexpected hazard. Containment remains a separate deterministic assessment and is not inferred from the BN or from the SAIL value alone.
Step 9: Operational Safety Objectives. SORA specifies OSOs and the robustness associated with each SAIL. Table 10 reports the applicable levels, using NR (not required), L (low robustness), M (medium robustness), and H (high robustness).
Based on the determination of SAIL IV, the required robustness levels across the 17 available OSOs are distributed as follows: one (1) OSO is recommended with low robustness, twelve (12) OSOs are recommended with medium robustness, and four (4) of them are recommended with high robustness. This distribution reflects the increased assurance demands of a high-SAIL operation. The operator must demonstrate compliance for each OSO at its prescribed robustness level. Low-robustness OSOs can be satisfied by operator declaration; medium-robustness OSOs require documented evidence and independent review by a recognized assessment entity; and high-robustness OSOs additionally demand a Design and Installation Appraisal (DIA) or equivalent rigorous verification. For the airframe-inspection scenario, meeting the medium and high robustness OSOs will constitute the main effort in compiling the safety case.
Step 10: Comprehensive Safety Portfolio (CSP). As the operation resulted in a SAIL IV determination, the CSP for the Riga Airport inspection is structured in two phases. Phase 1 contains Detailed Operational Information, the initial risk assessments (iGRC = 5, GRC = 4, and ARC = c), a demonstration of the resulting SAIL IV, and a list of the required 17 OSOs and their proposed means of compliance. Phase 2 provides the final evidence that all OSOs are satisfied at their required robustness levels, including documented evidence for the 12 medium and 4 high robustness OSOs. This evidence, together with the completed application forms and compliance matrix, forms the basis for an operational authorization request.
The results obtained using the conventional methodology represent the deterministic baseline against which the proposed probabilistic framework is evaluated.

6.3. Safety Assessment Using the Proposed Model

The BN described in Section 5 was implemented in GeNIe Modeler [41]. Final GRC and Residual ARC use ordinal Noisy-MAX parameterization, while SAIL uses deterministic SORA lookup. Containment and the OSO robustness profile are reported outside the BN and are not probabilistic endpoints.
Table 11 reproduces the evidence distributions displayed in Figure 11. These are soft assignments used by the submitted model, including for environmental conditions, UAV Dimensions, population density, and mitigation effectiveness. They are modeling assumptions rather than measured frequencies or guarantees of implementation.
The evidence assignments combine simplified ConOps, public information, DJI documentation, and engineering judgement [3,4,5,6,38]. In particular, the population distribution is not inferred from the regional average: 67% low and 33% high were assigned to acknowledge that a regional proxy does not measure the maximum number of people present on the apron. An operational application should replace this assumption with a time-resolved headcount or occupancy distribution for the operational and adjacent areas.
After evidence assignment, the GeNIe inference engine generated posterior distributions only for Final GRC, Residual ARC, and SAIL. Containment Requirements and OSO robustness were not BN nodes and remained deterministic SORA outputs. Figure 11 presents the network and the rounded probabilities displayed by GeNIe.
SORA reports the categorical results obtained from its tables and supporting evidence; those categories already embody conservative bins and judgement. The BN does not replace that treatment. Instead, it makes the consequences of the modeled input uncertainty explicit by distributing probability mass across possible GRC, ARC, and SAIL states.
For the airport scenario, the modal BN states coincide with the conventional classifications: Final GRC 4, Residual ARC c, and SAIL IV. This agreement is an internal coherence check under the chosen structure and parameters, not validation. The neighboring-state probabilities show how the assumed evidence distributions propagate through the model; they should not be interpreted as empirical frequencies.

6.4. Comparative Analysis of the Results

Table 12 compares the conventional classifications with the modal states of the BN under the same simplified case assumptions. The purpose is to test state-space and mapping coherence, not to show predictive superiority.
For the selected assumptions, the modal BN states match the conventional Final GRC, Residual ARC, and SAIL classifications. This is an implementation check only and does not demonstrate calibration or general validity.
The additional analytical output is the distribution across neighboring regulatory states and its sensitivity to evidence assignments. Because the CPTs are uncalibrated, the defensible use of these values is comparative: identifying influential assumptions and priorities for stronger evidence.
A contrasting stress scenario is examined next to test the direction of model response under a higher-risk combination of inputs.

6.5. Contrasting Higher-Complexity Stress Scenario

To provide a more demanding assessment than the nominal airport-inspection case, a contrasting higher-complexity stress scenario was evaluated using the same network structure. This scenario is not intended to represent an independently observed operational case. Instead, it is used to examine the internal behavior of the proposed BN when multiple risk-relevant evidence conditions deteriorate simultaneously. Human Performance, Technical Reliability, Environmental Conditions, Population Density, Ground Risk Mitigations, and Air Risk Mitigations were assigned to their adverse states, while UAV Dimensions and Airspace Complexity were fixed as large and high, respectively.
Under this configuration, the model produced a modal Final GRC of 6 (41.41%), a modal Residual ARC of c (51.46%), with substantial probability mass assigned to ARC d (42.38%), and a modal SAIL VI (52.06%).
Compared with the nominal airport-inspection scenario, this configuration simultaneously activates adverse human, technical, environmental, exposure, airspace, and mitigation pathways. The resulting shift toward higher GRC and SAIL states provides an internal directional-consistency check and demonstrates that the model responds coherently to a substantially more adverse combination of evidence. However, because the scenario is hypothetical and uses the same uncalibrated model parameters as the primary case, it should not be interpreted as an independent validation case or as evidence of predictive performance. A genuinely independent second case would require separate ConOps, operation-specific evidence assignments, and independently justified parameter inputs.

7. Discussion

This proof-of-concept evaluates whether a static BN can augment the evidentiary layer of SORA 2.5 while retaining its formal state definitions and deterministic SAIL mapping. The results test implementation behavior under stated assumptions; they do not establish predictive validity or generalizability.

7.1. Interpretation of the Findings

For the Riga Airport scenario, the conventional assessment and the modal BN outputs are Final GRC 4, Residual ARC c, and SAIL IV. SORA obtains its categorical outcome through predefined bins, conservative assumptions, supporting evidence, and expert judgement. The BN adds an explicit, assumption-dependent distribution over those states. Containment Requirements and OSO robustness remain deterministic regulatory outputs outside the network.
The principal analytical value at this stage is sensitivity rather than absolute probability estimation. The model shows which evidence assignments most change the SAIL distribution and therefore which inputs warrant stronger measurement, documentation, or elicitation.
The deterministic mapping between GRC, Residual ARC and SAIL was intentionally preserved in the proposed architecture. Consequently, uncertainty is introduced only through operational evidence and mitigation performance, while the official regulatory decision logic remains unchanged.

7.2. Sensitivity Metric and Analytical Value

One-way evidence-state sensitivity was quantified using the Total Variation Distance (TVD) between the posterior SAIL distributions obtained under the favorable and adverse states of each root evidence node. For given evidence node X i , the node was first fixed to its adverse state and then to its favourable state, while all other evidence nodes were kept at their baseline distributions. The sensitivity of X i , was calculated as:
T V D   X i =   1 2 s S ( P S A I L = s     X i   =   x i a d v e r s e ,   X i = x i b a s e l i n e ) P S A I L = s     X i =   x i f a v o r a b l e ,   X i = x i b a s e l i n e ) )
where X i denotes the evidence node under investigation, X i represents all remaining evidence nodes, and S is the set of possible SAIL states (I, II, III, IV, V, VI, certified-category outcome).
The terms x i a d v e r s e   and x i f a v o r a b l e denote the adverse and favorable states of the investigated node, respectively, whereas x i b a s e l i n e represents the baseline evidence assignments for all other nodes. P S A I L = s     is the posterior probability of SAIL state s produced by the Bayesian Network under the specified evidence configuration.
The TVD ranges from 0 to 1. A value of 0 indicates that changing the investigated node from its favorable to its adverse state produces no change in the posterior SAIL distribution, whereas a value approaching 1 indicates an increasingly strong redistribution of probability mass across SAIL states. Consequently, a larger TVD indicates greater sensitivity of the model output to the investigated evidence node.
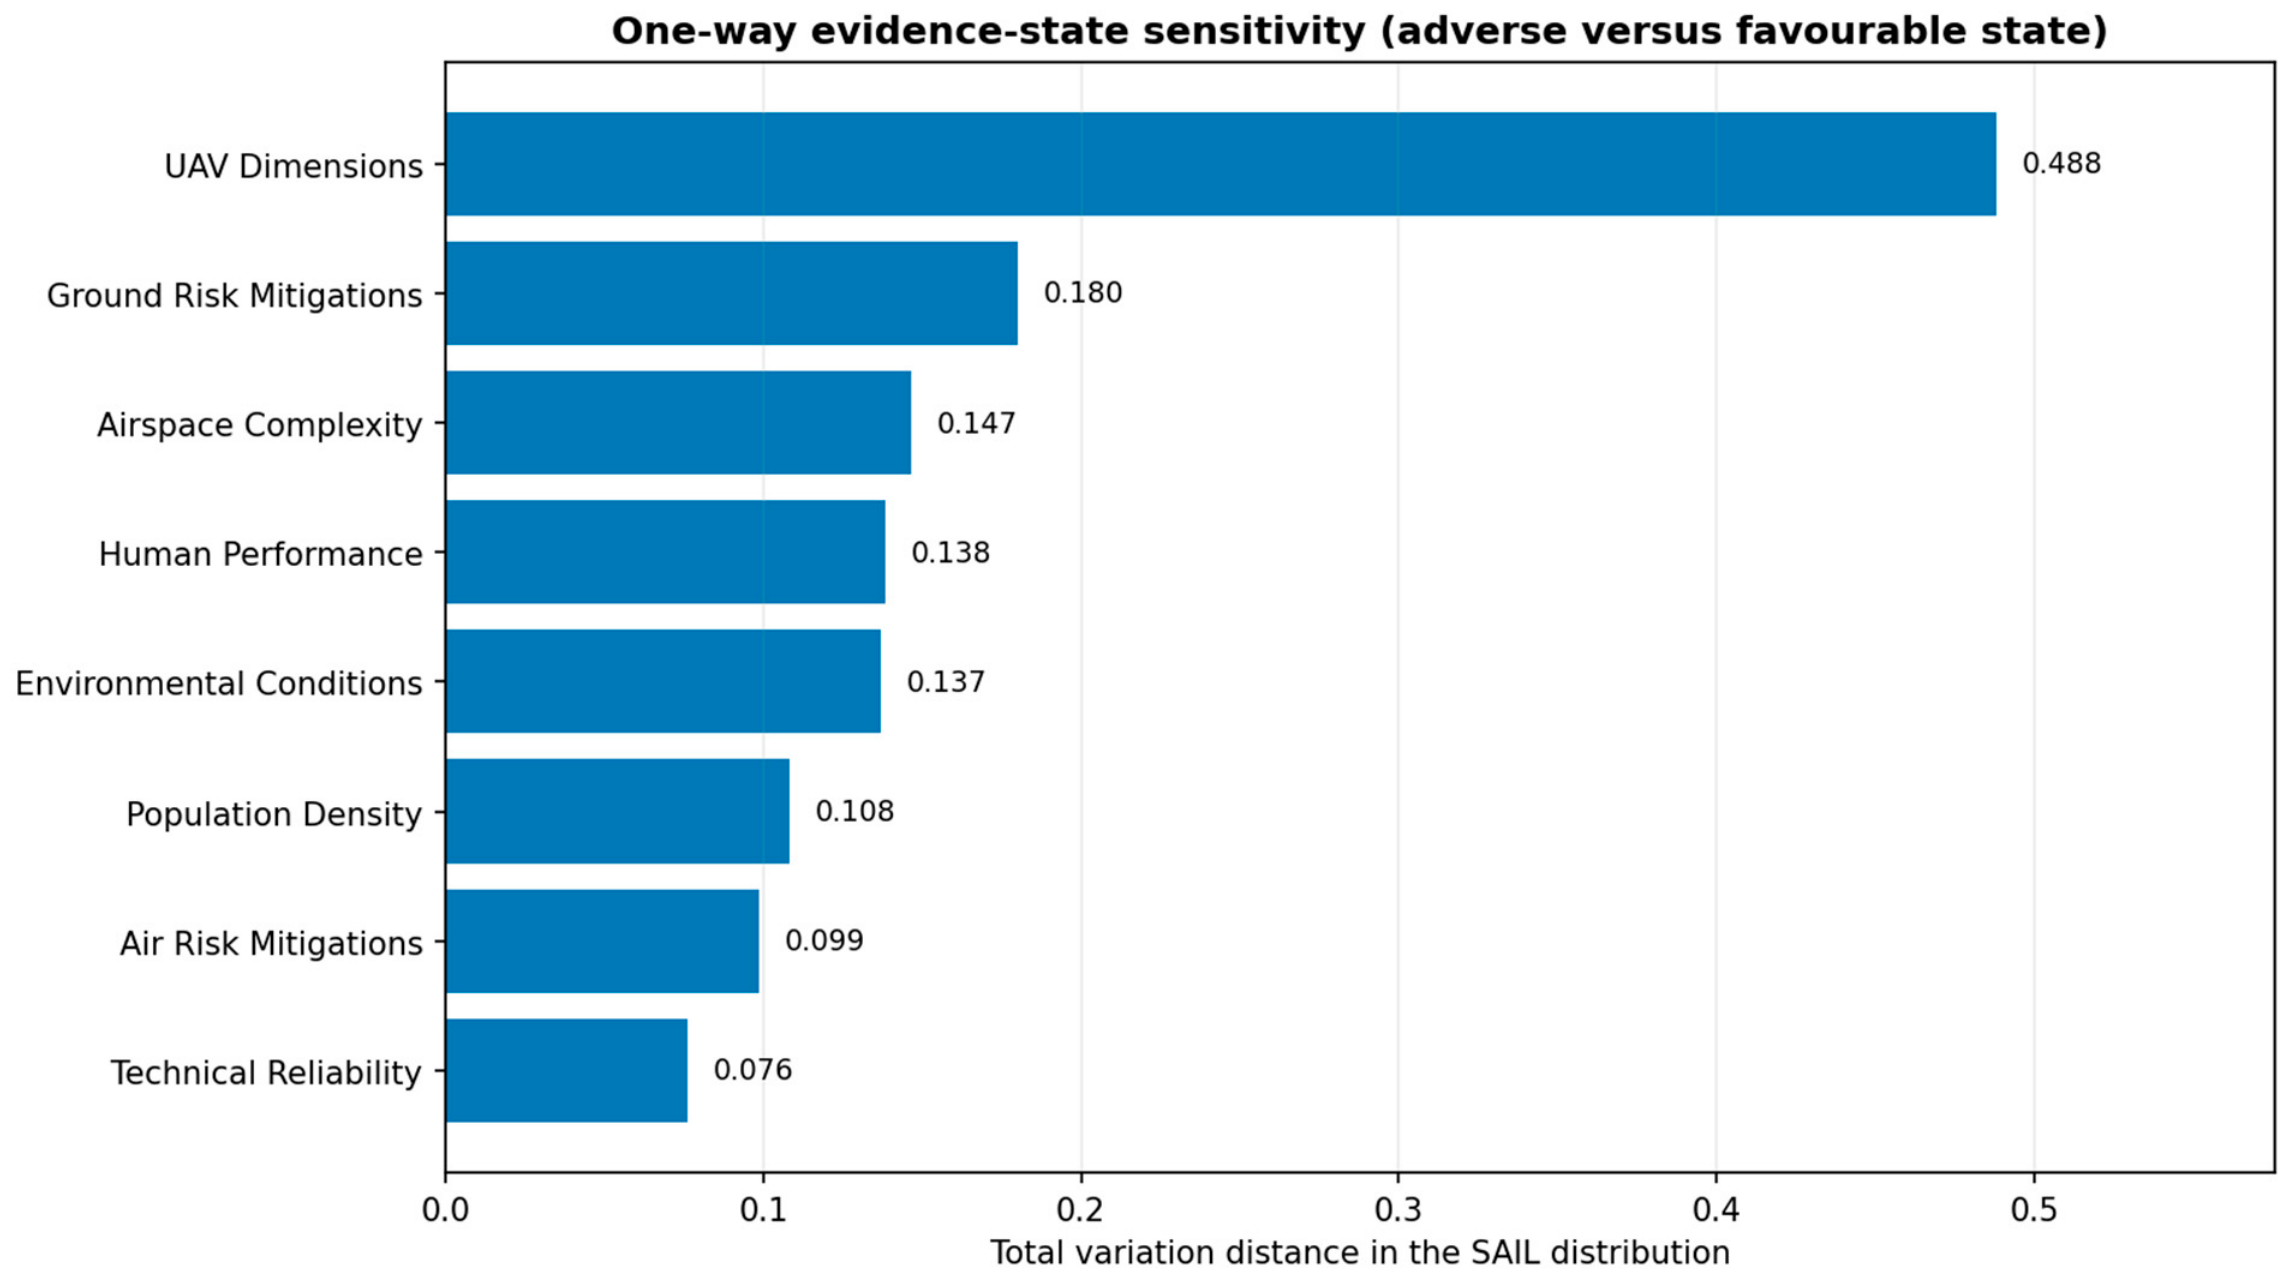
Moreover, TVD is used as a model-sensitivity measure. It quantifies how strongly the assumed state of an evidence node affects the resulting SAIL distribution within the specified Bayesian Network; it should not be interpreted as a real-world risk probability or as a measure of causal effect. Table 13 reports all eight root nodes; Figure 12 ranks the same values.
UAV Dimensions has the largest one-way influence on the SAIL distribution (TVD 0.488), followed by Ground Risk Mitigations (0.180), Airspace Complexity (0.147), Human Performance (0.138), Environmental Conditions (0.137), Population Density (0.108), Air Risk Mitigations (0.099), and Technical Reliability (0.076). These values rank influence within the assumed model; they do not measure real-world causal effects.

7.3. Practical Implications

After calibration and validation, this type of sensitivity analysis could support pre-application planning by showing which evidence assumptions move SORA-equivalent classifications and by prioritizing verification of mitigation occupancy and airspace inputs. The present rankings are illustrative and should be repeated across elicited parameter ranges and alternative network structures.
For competent-authority use, the method would require a complete, reviewable model specification and evidence base. The authority would continue to assess the ConOps, mitigations, containment, OSO evidence, and safety portfolio under SORA.
The implementation is static and supports evidence revision only between assessments. Continuous in-flight use would require Dynamic BN with explicit time slices, transitions, sensor ingestion, latency requirements, and operational decision thresholds.

7.4. Limitations

The primary case is a single, simplified VLOS airport-inspection scenario. The added adverse scenario is only an internal stress test, so performance across other GRC, ARC, and SAIL thresholds and across real operations remains unknown.
The root distributions and Noisy-MAX parameters are uncalibrated engineering judgements informed by SORA and the published literature. ASRS material was used only as a qualitative plausibility check, without a reproducible screening log, and did not determine numerical values. Therefore, the posterior probabilities are model-conditional belief assignments, not accident frequencies or calibrated absolute risks.
Structural uncertainty arises from the simplified DAG and its conditional-independence assumptions. Interactions among weather, communication, human performance, traffic, exposure, and mitigation effectiveness may be more complex than represented. Noisy-MAX additionally assumes monotonic, causally independent parent contributions and may not capture interaction effects.
The model has not been calibrated or externally validated against accidents, incidents, expert benchmark cases, or authorization decisions. It therefore cannot estimate the probability of regulatory approval, demonstrate improved safety outcomes, or support a claim of superiority over SORA.

7.5. Future Research

Future work should evaluate multiple heterogeneous and boundary cases, including rural VLOS, BVLOS infrastructure inspection, airport operations, and urban missions. It should include structured expert elicitation, independent SORA review, parameter uncertainty distributions, alternative DAGs, interaction tests, calibration where data exist, and value-of-information analysis.
Future validation should use field and flight-log data, occurrence data, traffic and exposure measurements, and structured expert elicitation. It should include logical boundary testing, independent SORA review, parameter and structural sensitivity, uncertainty propagation, and calibration where suitable reference outcomes exist. Dynamic BN development should be considered only after time-stamped evidence, state transitions, updating intervals, and sensor-integration requirements are defined. Further extensions could address cybersecurity, human–machine interaction, multi-UAS operations, and U-space/UTM integration.
A future extension should formulate the model as a Dynamic BN with explicit time slices, transition probabilities, evidence-update intervals, and operational decision thresholds. Such an extension would require time-stamped sensor and operational data and should be evaluated for computational latency, calibration, and safe human–automation interaction before any in-flight use is proposed.

8. Conclusions

This study demonstrates the feasibility of aligning a static BN with the Final GRC, Residual ARC, and SAIL state spaces of SORA 2.5 while retaining the deterministic SAIL lookup. Containment and the 17-element OSO robustness profile remain separate deterministic outputs.
Under the assumption of the illustrative airport case, the modal states are GRC 4, ARC c, and SAIL IV. Favorable and adverse boundary checks move the model toward lower and higher SAIL states, and one-way sensitivity identifies UAV Dimensions, ground-risk mitigation effectiveness, and Airspace Complexity as the strongest model drivers. These findings demonstrate internal model behavior only.
The numerical posteriors are assumption-dependent because the model uses uncalibrated engineering judgements, a simplified structure, and a single primary scenario. They must not be interpreted as real-world event frequencies, validated risk probabilities, improved safety performance, or the likelihood of competent-authority approval.
The framework should therefore be treated as an analytical sensitivity prototype. Release of the executable model and complete parameter tables, structured elicitation, multi-scenario evaluation, structural testing, empirical calibration, and independent replication are required before practical regulatory use can be considered.

Supplementary Materials

The following supporting information can be downloaded at: https://www.mdpi.com/article/10.3390/aerospace13090848/s1.

Author Contributions

Conceptualization, A.A. and J.M.; Methodology, I.A. and J.M.; Validation, A.A. and J.M.; Data Curation, A.A.; Writing—Original Draft, A.A.; Writing—Review and Editing, I.A., A.A. and J.M.; Visualization, I.A. and A.A.; Supervision, I.A. and J.M. All authors have read and agreed to the published version of the manuscript.

Funding

This research received no external funding.

Institutional Review Board Statement

Not applicable.

Informed Consent Statement

Not applicable.

Data Availability Statement

The original contributions presented in the study are included in the article. The developed software was presented as Supplementary Materials. The and further inquiries can be directed to the corresponding author.

Conflicts of Interest

All authors declare the absence of any commercial or financial relationships that could be construed as potential conflicts of interest.

References

  1. Atkins, E.; Ollero, A.; Tsourdos, A. (Eds.) Unmanned Aircraft Systems; John Wiley & Sons, Incorporated: Newark, NJ, USA, 2017. [Google Scholar]
  2. Hashim, H.A. Advances in UAV avionics systems architecture, classification and integration: A comprehensive review and future perspectives. Results Eng. 2025, 25, 103786. [Google Scholar] [CrossRef] [Scilit]
  3. European Union Aviation Safety Agency (EASA). Easy Access Rules for Unmanned Aircraft Systems (Regulation (EU) 2019/947 and Regulation (EU) 2019/945); EASA: Cologne, Germany, 2024; Available online: https://www.easa.europa.eu/en/document-library/regulations/commission-delegated-regulation-eu-2019945 (accessed on 10 July 2024).
  4. European Union Aviation Safety Agency. Specific Operations Risk Assessment (SORA). 2024. Available online: https://www.easa.europa.eu/en/domains/drones-air-mobility/operating-drone/specific-category-civil-drones/specific-operations-risk-assessment-sora (accessed on 10 July 2024).
  5. Joint Authorities for Rulemaking on Unmanned Systems (JARUS). Specific Operations Risk Assessment (SORA), Main Body, Edition 2.5; JARUS: Pittsburgh, PA, USA, 2024. [Google Scholar]
  6. European Union Aviation Safety Agency (EASA). Easy Access Rules for Unmanned Aircraft Systems, Revision from June 2026; EASA: Cologne, Germany, 2026; Available online: https://www.easa.europa.eu/en/document-library/easy-access-rules/easy-access-rules-unmanned-aircraft-systems-regulations-eu (accessed on 10 July 2024).
  7. European Union Aviation Safety Agency (EASA). ED Decision 2025/018/R of Regular Update of the AMC and GM to Commission Implementing Regulation (EU) 2019/947, Issue 1, Amendment 4, 29 September 2025; EASA: Cologne, Germany, 2025; Available online: https://www.easa.europa.eu/en/document-library/agency-decisions/ed-decision-2025018r (accessed on 10 July 2024).
  8. Capitán, C.; Capitán, J.; Castaño, Á.R.; Ollero, A. Risk assessment based on SORA methodology for a UAS media production application. In Proceedings of the 2019 International Conference on Unmanned Aircraft Systems (ICUAS), Atlanta, GA, USA, 11–14 June 2019; pp. 451–459. [Google Scholar] [CrossRef] [Scilit]
  9. Miles, T.; Suarez, B.; Kunzi, F.; Jackson, R. SORA application to large RPAS flight plans. In Proceedings of the 2019 IEEE/AIAA 38th Digital Avionics Systems Conference (DASC), San Diego, CA, USA, 8–12 September 2019; pp. 1–6. [Google Scholar] [CrossRef] [Scilit]
  10. Yu, J.; Zhao, J.; Wang, X.; Cao, Y. Maritime occupational accidents analysis: A data-driven Bayesian network approach. Ocean Coast. Manag. 2025, 269, 107785. [Google Scholar] [CrossRef] [Scilit]
  11. Ben-Gal, I. Bayesian networks. In Encyclopedia of Statistics in Quality and Reliability; Ruggeri, F., Kenett, R.S., Faltin, F.W., Eds.; John Wiley & Sons: Chichester, UK, 2008. [Google Scholar] [CrossRef] [Scilit]
  12. Wang, L.; Zhu, M.; Li, N. A Bayesian network approach for systemic risk analysis in unmanned aerial vehicle (UAV) operations. Sci. Rep. 2026, 16, 13546. [Google Scholar] [CrossRef] [Scilit] [PubMed]
  13. Merz, M.; Pedro, D.; Skliros, V.; Bergenhem, C.; Himanka, M.; Houge, T.; Matos-Carvalho, J.P.; Lundkvist, H.; Cürüklü, B.; Hamrén, R.; et al. Autonomous UAS-based agriculture applications: General overview and relevant European case studies. Drones 2022, 6, 128. [Google Scholar] [CrossRef] [Scilit]
  14. Kovalev, I.V.; Voroshilova, A.A.; Karaseva, M.V. Analysis of the current situation and development trend of the international cargo UAVs market. J. Phys. Conf. Ser. 2019, 1399, 055095. [Google Scholar] [CrossRef] [Scilit]
  15. O’Donnell, M. Investigation of UAS Accidents and Incidents; Federal Aviation Administration Office of Accident Investigation and Prevention: Washington, DC, USA, 2017.
  16. Zhang, X.; Liu, Y.; Zhang, Y.; Guan, X.; Delahaye, D.; Tang, L. Safety assessment and risk estimation for unmanned aerial vehicles operating in national airspace system. J. Adv. Transp. 2018, 2018, 4731585. [Google Scholar] [CrossRef] [Scilit]
  17. Gupta, S.; Ghonge, M.; Jawandhiya, P. Review of Unmanned Aircraft System (UAS). 2013. Available online: https://papers.ssrn.com/sol3/papers.cfm?abstract_id=3451039 (accessed on 14 September 2026).
  18. Tullo, F.J. Teamwork and organizational factors. In Crew Resource Management; Kanki, B.G., Anca, J., Chidester, T.R., Eds.; Academic Press: Cambridge, MA, USA, 2019. [Google Scholar] [CrossRef] [Scilit]
  19. Asghari, O.; Ivaki, N.; Madeira, H. UAV operations safety assessment: A systematic literature review. ACM Comput. Surv. 2025, 57, 1–37. [Google Scholar] [CrossRef] [Scilit]
  20. Wackwitz, K.; Boedecker, H. Safety Risk Assessment for UAV Operation: Safety Hazard Identification, Safety Risk Assessment, Safety Risk Mitigation, Safety Risk Documentation + Case Study; Drone Industry Insights: Hamburg, Germany, 2015. [Google Scholar]
  21. Martinez, C.; Sanchez-Cuevas, P.J.; Gerasimou, S.; Bera, A.; Olivares-Mendez, M.A. SORA methodology for multi-UAS airframe inspections in an airport. Drones 2021, 5, 141. [Google Scholar] [CrossRef] [Scilit]
  22. Jiang, C. Safety Risk Assessment of Unmanned Aircraft System Operations for Urban Air Mobility. Ph.D. Thesis, Delft University of Technology, Delft, The Netherlands, 2023. [Google Scholar] [CrossRef]
  23. Du, S.; Zhong, G.; Wang, F.; Pang, B.; Zhang, H.; Jiao, Q. Safety risk modelling and assessment of civil unmanned aircraft system operations: A comprehensive review. Drones 2024, 8, 354. [Google Scholar] [CrossRef] [Scilit]
  24. Rausand, M. Risk Assessment: Theory, Methods, and Applications; John Wiley & Sons: Hoboken, NJ, USA, 2011. [Google Scholar]
  25. Federal Aviation Administration. AC 23.1309-1E: System Safety Analysis and Assessment for Part 23 Airplanes; Federal Aviation Administration: Washington, DC, USA, 2011.
  26. International Civil Aviation Organization. Manual on Airspace Planning Methodology for the Determination of Separation Minima. Doc. 9689-AN/953, Amended Version, August 2002; International Civil Aviation Organization: Montreal, QC, Canada, 2002. [Google Scholar]
  27. Clothier, R.A.; Williams, B.P.; Fulton, N.L. Structuring the safety case for unmanned aircraft system operations in non-segregated airspace. Saf. Sci. 2015, 79, 213–228. [Google Scholar] [CrossRef] [Scilit]
  28. Weldon, W.T.; Hupy, J.; Lercel, D.; Gould, K. The use of aviation safety practices in UAS operations: A review. Coll. Aviat. Rev. Int. 2021, 39. [Google Scholar] [CrossRef] [Scilit]
  29. Allouch, A.; Koubâa, A.; Khalgui, M.; Abbes, T. Qualitative and quantitative risk analysis and safety assessment of unmanned aerial vehicle missions over the Internet. IEEE Access 2019, 7, 53392–53410. [Google Scholar] [CrossRef] [Scilit]
  30. Vileiniskis, M.; Remenyte-Prescott, R. Quantitative risk prognostics framework based on Petri Net and Bow-Tie models. Reliab. Eng. Syst. Saf. 2017, 165, 62–73. [Google Scholar] [CrossRef] [Scilit]
  31. McFadyen, A.; Martin, T. Understanding vertical collision risk and navigation performance for unmanned aircraft. In Proceedings of the 2018 IEEE/AIAA 37th Digital Avionics Systems Conference (DASC); IEEE: New York, NY, USA, 2018. [Google Scholar] [CrossRef] [Scilit]
  32. del Estal Herrero, A.; Apter, N.; Hristozov, S. A parametric comparison of JARUS SORA 2.0 and 2.5 ground risk models. Eng. Proc. 2025, 90, 47. [Google Scholar] [CrossRef] [Scilit]
  33. Schnüriger, P.; Schreiber, J.; Widmer, K.; Lenhart, P.M. SORA tool—A specific operation risk assessment tool for civilian drone operations. Drone Syst. Appl. 2025, 13, 1–11. [Google Scholar] [CrossRef] [Scilit]
  34. Han, P.; Yang, X.; Zhao, Y.; Guan, X.; Wang, S. Quantitative ground risk assessment for urban logistical unmanned aerial vehicle (UAV) based on Bayesian network. Sustainability 2022, 14, 5733. [Google Scholar] [CrossRef] [Scilit]
  35. Chi, C.-F.; Sigmund, D.; Lin, Y.-C.; Drury, C.G. The development of a scenario-based human-machine-environment-procedure (HMEP) classification scheme for the root cause analysis of helicopter accidents. Appl. Ergon. 2022, 103, 103771. [Google Scholar] [CrossRef] [Scilit] [PubMed]
  36. National Aeronautics and Space Administration (NASA). Aviation Safety Reporting System (ASRS). 2026. Available online: https://asrs.arc.nasa.gov/index.html (accessed on 14 September 2026).
  37. Díez, F.J.; Druzdzel, M.J. Canonical Probabilistic Models for Knowledge Engineering; Technical Report CISIAD-06-01, Version 0.9; UNED: Madrid, Spain, 2007. [Google Scholar]
  38. DJI. Matrice 600 User Manual. 2017. Available online: https://dl.djicdn.com/downloads/m600/20170717/Matrice_600_User_Manual_v1.0_EN.pdf (accessed on 14 September 2026).
  39. Central Statistical Bureau of Latvia. Population [K52 Map]. Available online: https://stat.gov.lv/en/statistics-themes/population/population/maps/k52-population (accessed on 14 September 2026).
  40. Latvijas Gaisa Satiksme. Airspace Structure. Available online: https://kb.lv-vacc.org/basics/airspace/airspace-structure (accessed on 14 September 2026).
  41. BayesFusion LLC. GeNIe Modeler. 2026. Available online: https://www.bayesfusion.com/genie/ (accessed on 14 September 2026).
Figure 1. Safety risk assessment phases [20].
Aerospace 13 00848 g001
Figure 2. SORA process [4].
Aerospace 13 00848 g002
Figure 3. Research workflow.
Aerospace 13 00848 g003
Figure 4. Relationship between the SORA 2.5 decision structure and the Bayesian augmentation.
Aerospace 13 00848 g004
Figure 5. Simplified directed acyclic graph of the SORA-BN framework.
Aerospace 13 00848 g005
Figure 6. Layered architecture of the revised Bayesian model.
Aerospace 13 00848 g006
Figure 7. Mission strategy.
Aerospace 13 00848 g007
Figure 8. Operation location at Riga Airport.
Aerospace 13 00848 g008
Figure 9. Operational volume for UAS airframe inspection.
Aerospace 13 00848 g009
Figure 10. Determination of initial ARC for the UAS airframe inspection.
Aerospace 13 00848 g010
Figure 11. Readability-enhanced reconstruction of the Bayesian Network implemented in GeNIe.
Aerospace 13 00848 g011
Figure 12. One-way evidence-state sensitivity of the SAIL distribution.
Aerospace 13 00848 g012
Table 1. Key risks and challenges in UAS operations [1].
Risk CategoryDescription
Mid-air collisionsSpread of UASs increases collision risk with other drones and manned aircraft [15,16]. Requires airspace congestion management, collision prevention systems, tracking technologies, and strict flight path compliance.
Technical failuresUASs rely on multiple sensors [17]; any may fail or provide inaccurate data. Mitigation includes component reliability, pre-flight checks, and backup systems.
Environmental factorsWind, rain, fog, and lightning affect stability and navigation. Real-time weather data integration into flight planning is essential.
Human errorMisinterpretation of data, navigation mistakes, poor decision making [18]. Requires strict training, certification, and procedural compliance.
Privacy concernsSurveillance raises privacy issues; requires guidelines for data collection, sharing, storage, and transparent public communication.
Cybersecurity threatsVulnerabilities in control systems, data transmission, and navigation. Mitigation includes encryption, intrusion detection systems, and secure communication protocols.
Regulatory complianceNavigating local/international laws, airspace restrictions, and operational limitations. Adhering to evolving frameworks is vital for safe, legal operations.
Table 2. Risk-based UAS categories under EASA and JARUS.
FeatureOpen CategorySpecific CategoryCertified Category
Risk levelLowestMediumHighest
Typical operationsRecreational flights and lightweight aerial photographyBVLOS, airport-adjacent, populated-area, or heavier-UAS operationsPassenger or dangerous-goods transport and other high-risk operations
Operational limitsVLOS, generally below 120 m, within prescribed category limitationsDefined case by case through the operational authorizationRequirements comparable to crewed aviation, including certified aircraft and organizations
Risk assessmentNo operation-specific assessment beyond category complianceFormal operational risk assessment, commonly using SORACertification and airworthiness requirements (e.g., AMC RPAS.1309)
Example of useHobby flying and real-estate photographyBVLOS infrastructure inspection and suburban drone deliveryAir taxi or cargo-drone operation over a city center
Table 3. Comparison of UAS risk assessment approaches.
MethodPrimary UseTemporal TreatmentData DemandRegulatory AcceptanceBest Suited for
SORAOperational authorizationPre-operational/staticLow–mediumHigh (EASA)Standard Specific-category operations
FTA/ETAFailure and consequence chainsStaticMediumMediumAccident-sequence analysis
Bow-TieBarrier and consequence mappingStaticMediumMediumCommunicating mitigations
Bayesian NetworksIntegrated probabilistic riskEvidence-updatableMedium–highLow/researchBVLOS, urban, and automated operations
Collision risk modelsMid-air encounter or collision probabilityScenario-basedHighMediumAirport and traffic-intensive environments
Ground risk modelsInjury or fatality consequenceScenario-basedHighMediumPopulated and urban areas
Table 4. Summary of SORA strengths and limitations.
AspectDetail
Strengths
Standardized processA step-by-step workflow improves transparency, repeatability, and comparison between missions.
Regulatory recognitionAccepted within major regulatory frameworks, including EASA and other authorities [32].
Integrated ground and air assessmentCombines GRC, ARC, SAIL, and mitigation requirements within one operational process.
Proactive safety managementRequires a detailed ConOps and documented mitigations before authorization.
Evolving methodologySORA Version 2.5 refined population density, aircraft size, and mitigation provisions [32].
Limitations
Categorical and expert-dependentRisk classes are derived from predefined tables and judgement, which may introduce variability.
Pre-operational/staticThe assessment does not continuously revise risk when weather, traffic, or system performance changes.
Limited representation of complex operationsAutonomous, multi-UAS, and shared-airspace interactions require additional modeling support [21].
Documentation burdenHigher SAIL levels may require extensive evidence and resources, especially for smaller operators [33].
Future-system integrationUTM/U-space, autonomous detect-and-avoid, and real-time data exchange are not represented probabilistically.
Table 5. Positioning of the present study relative to selected SORA and Bayesian approaches.
Study/ApproachRelationship to SORAArchitecture and Parameter BasisDecision-Support Capability and Limitation
JARUS SORA 2.5 [5,6,7]Official Specific-category frameworkDeterministic rule tables, defined evidence, and competent-authority judgementProduces regulatory classifications and assurance requirements; does not report posterior probability mass.
SORA Tool, Schnüriger et al. [33]Digital implementation of the SORA workflowEncodes the SORA process without a Bayesian uncertainty layerSupports structured completion and documentation of the regulatory assessment.
Han et al. [34]No complete GRC-ARC-SAIL mappingBN focused on quantitative urban logistical-UAS ground riskEstimates ground risk outcomes; does not retain the complete SORA decision structure.
Wang, Zhu, and Li [12]Independent of the complete SORA workflowHierarchical BN linking risk drivers to safety, mission success, and third-party riskProvides systemic risk and sensitivity insights but not posterior mass over official SORA states.
Present studyAligns Final GRC and Residual ARC states and retains deterministic SAIL mappingEight soft evidence nodes; Noisy-MAX for GRC/ARC; deterministic SAIL; uncalibrated engineering parametersDemonstrates assumption-dependent posterior and sensitivity reporting over SORA-equivalent states; no empirical validation or approval prediction.
Table 6. Principal evidence groups in the revised SORA-BN model.
Evidence GroupSORA FunctionRole in the Bayesian Model
Aircraft and operationSupports intrinsic ground risk and operational envelope determination.Documented dimensions and mass define the aircraft size category. Maximum speed is used in the conventional kinetic energy/iGRC calculation, whereas nominal speed describes the mission.
Ground exposureSupports intrinsic and Final GRC determination.Represents uncertainty in exposed-person density, occupancy, sheltering, and adjacent-area conditions.
Ground risk mitigationsSupports reduction from intrinsic to Final GRC where applicable.Represents evidence and uncertainty concerning mitigation applicability, integrity, and performance.
Airspace and trafficSupports initial and Residual ARC determination.Represents airspace class, encounter environment, traffic density, segregation, and operational altitude.
Air risk mitigationsSupports strategic mitigation and Tactical Mitigation Performance Requirements.Represents uncertainty in coordination, procedural separation, detect-and-avoid, and tactical performance.
Operational and environmental conditionsSupports relevant containment and OSO assessments.Represents weather, communication, navigation, human performance, and technical reliability evidence where they influence SORA requirements.
Table 7. Core Bayesian Network node groups and state spaces.
Node GroupRepresentative StatesParent Information/Function
Observed evidenceCase-specific measured or documented valuesConOps, aircraft data, operational area, airspace, planned procedures, and implemented mitigations.
Uncertain evidenceDiscrete states or fitted probability distributionsExposure, traffic conditions, environmental variation, technical reliability, and mitigation performance.
Final GRC{≤2, 3, 4, 5, 6, 7, >7}Derived from the applicable intrinsic GRC and ground-risk mitigation evidence.
Residual ARC{a, b, c, d}Derived from initial ARC and applicable strategic air-risk mitigation evidence.
SAIL{I, II, III, IV, V, VI, certified-category outcome}Deterministic SORA 2.5 mapping from Final GRC and Residual ARC.
Probabilistic assessment outputsPosterior probabilities and sensitivity measuresQuantifies confidence and identifies influential uncertain parameters; it is not an approval outcome.
Table 8. Treatment of model information and parameters.
Model ElementSpecificationReporting Requirement
Observed evidenceFixed case-study value entered as evidenceSource document, unit, date, and operational definition.
Uncertain evidence and mitigation performanceIllustrative probability assignments based on engineering judgement, SORA context, and published literatureDataset or expert-elicitation source, fitted distribution, uncertainty interval, and sensitivity range.
Probabilistic dependenciesConditional Probability Table derived from SORA logic and Bayesian modelingParent and child state order; all Noisy-MAX causal distributions and leak terms; generated CPTs; structural rationale; software/model version; and validation checks.
Regulatory mappingsDeterministic SORA 2.5 rule tablesExact source table, state mapping, and traceability to Final GRC, Residual ARC, and SAIL.
Analytical outputsPosterior distributions, uncertainty intervals, and sensitivity metricsFull state probabilities and identification of the modal state; no approval probability.
Table 9. Operational characteristics for the airframe-inspection scenario.
ParameterSpecification
Operation category (EASA)Specific
LocationRiga International Airport, class C
Type of operationVLOS
Flight conditionsDaytime, good weather
UAV MTOM, kinetic energy, size, max. speed15.1 kg, 3.4 kJ, 1.668 m, 18 m/s with no wind [35]
Nominal speed of the operation1 m/s
Flight limits3 m from airframe, 23 m above ground, semi-autonomous
Table 10. Recommended OSOs [40].
OSO IDOperational Safety ObjectiveSAIL
IIIIIIIVVVI
OSO#01Ensure that the UAS operator is a competent and/or proven organizationNRLMHHH
OSO#02UAS designed and produced by a competent and/or proven organizationNRNRLMHH
OSO#03UAS maintenanceLLMMHH
OSO#04UAS components essential to safe operations are designed to an airworthiness design standardLMHHHH
OSO#05UAS is designed considering system safety and reliabilityLLMMHH
OSO#06C3 link characteristics (e.g., performance spectrum use) are appropriate for the UAS operationLLMMHH
OSO#07Conformity check of the UAS configuration LLMMHH
OSO#08Operational procedures are defined, validated, and adhered toLLMHHH
OSO#09Remote crew trained and current and able to control the abnormal situationLLMMHH
OSO#13External services supporting UAS operations are
adequate for the UAS operation
LLMMHH
OSO#16Multi-crew coordinationNRNRLMMH
OSO#17Remote crew is fit to operateNRNRNRLMH
OSO#18Automatic protection of the flight envelope from human errorsNRNRLMHH
OSO#19Safe recovery from human errorNRNRLMHH
OSO#20A human factors evaluation has been performed and the HMI found appropriate for the intended UAS operationNRLLMMH
OSO#23Environmental conditions for safe operations defined and measurableNRLLMHH
OSO#24UAS designed and qualified to operate in adverse environmental conditionsNRNRMHHH
Table 11. Operational evidence assigned to the BN.
Input NodeDistribution Entered Evidence ClassSupplied MaterialsJustification
Human PerformanceAdequate (95%)Soft expert-informed assignmentCrew qualification and proceduresAssumed residual human performance uncertainty; not derived from observed frequencies.
Technical ReliabilityGood (97%)Soft expert-informed assignmentPlatform description and pre-flight checksAssumed reliability distribution; no fleet failure rate calibration.
Environmental ConditionsMild (85%)Soft scenario assignmentNominal daytime/good-weather ConOpsAllows residual adverse-weather uncertainty rather than 100% mild evidence.
UAV DimensionsLarge (55%)Soft model assignmentDJI Matrice 600 dimensions and mass [38]Reproduces the submitted BN input; physical dimensions remain documented observations for SORA.
Population DensityLow (67%)Soft exposure assignmentRegional proxy [39]; apron occupancy not measuredExplicitly represents uncertainty in applying a regional density proxy to time-varying apron occupancy.
Airspace ComplexityHigh (95%)Soft expert-informed assignmentControlled Class C airport contextAssumed high-complexity environment with residual state uncertainty.
Ground Risk MitigationsEffective (90%)Soft implementation assignmentRestricted area and stated proceduresRepresents uncertainty in implementation and performance; not a guarantee.
Air Risk MitigationsEffective (85%)Soft implementation assignmentVLOS, observers, restrictions, and coordinationRepresents uncertainty in coordination and tactical performance; not a guarantee.
Table 12. Comparative results between SORA and the Bayesian Network.
Assessment ElementSORAProposed Model
Ground RiskFinal GRC = 4Posterior probability distribution over GRC 2–7 (highest probability assigned to GRC 4)
Air RiskResidual ARC = cPosterior probability distribution over ARC a–d (highest probability assigned to ARC c)
SAILSAIL IVPosterior probability distribution over SAIL I–VI (highest probability assigned to SAIL IV)
Table 13. Internal verification and one-way evidence-state sensitivity for all root nodes.
CheckScenario or PerturbationResultInterpretation
Baseline modal coherenceCase evidence in Table 11GRC 4, ARC c, and SAIL IVInternal implementation coherence only.
Favorable extremeAll root nodes forced to favorable stateGRC 2: 94.00%; ARC a: 95.00%; SAIL I: 89.30%Directionally consistent low-risk boundary test.
Adverse stress scenarioAll root nodes forced to adverse stateGRC 6: 41.41%; ARC c: 51.46% (ARC d: 42.38%); SAIL VI: 52.06%Directionally consistent high-risk boundary test, not external validation.
One-way sensitivityUAV Dimensions: Large vs. SmallSAIL TVD = 0.488Largest model driver; state assignment requires justification.
One-way sensitivityGround Risk Mitigations: Ineffective vs. EffectiveSAIL TVD = 0.180Major evidence and implementation priority.
One-way sensitivityAirspace Complexity: High vs. LowSAIL TVD = 0.147Major driver of the air risk pathway.
One-way sensitivityHuman Performance: Inadequate vs. AdequateSAIL TVD = 0.138Influential uncalibrated expert-assignment pathway.
One-way sensitivityEnvironmental Conditions: Severe vs. MildSAIL TVD = 0.137Influence is similar to human performance.
One-way sensitivityPopulation Density: High vs. LowSAIL TVD = 0.108Supports replacing the regional proxy with occupancy evidence.
One-way sensitivityAir Risk Mitigations: Ineffective vs. EffectiveSAIL TVD = 0.099Moderate air-mitigation pathway influence.
One-way sensitivityTechnical Reliability: Poor vs. GoodSAIL TVD = 0.076Smallest one-way effect in the assumed model.
Disclaimer/Publisher’s Note: The statements, opinions and data contained in all publications are solely those of the individual author(s) and contributor(s) and not of MDPI and/or the editor(s). MDPI and/or the editor(s) disclaim responsibility for any injury to people or property resulting from any ideas, methods, instructions or products referred to in the content.