2. Particle System Construction and Sequential Packing Method
Lunar regolith particles form packing structures through contact interactions under natural conditions. Based on this characteristic, a sequential generation strategy is adopted in this study. New particles are generated within the neighborhood of existing particles such that they are in contact without overlap, and the computational domain is gradually filled. The sequence of particle sizes and mineral assignments is determined using Monte Carlo sampling. Particle shapes and initial orientation angles are generated randomly. This strategy ensures that the generated structure does not depend on the preceding packing process while maintaining overall randomness.
2.1. Packing Algorithm Framework and Parameter System
The proposed sequential packing algorithm aims to generate a statistically consistent particle system with multimineral composition, polydispersity, and angular geometry under non-overlapping geometric constraints. This is achieved by constructing a multi-parameter statistical description of particles and implementing progressive insertion based on available arc analysis.
The method consists of three key components: statistical modeling of particle parameters, geometric construction of angular particles, and a sequential packing strategy based on available arc analysis. These components are coupled and jointly determine the geometric and statistical characteristics of the final packing structure.
At the parameter level, a multi-parameter description system is established by introducing statistical variables such as equivalent particle size, mineral type, and shape coefficient. This system captures both average characteristics and stochastic variations, enabling unified modeling of polydisperse and multimineral particle systems.
At the geometric level, all particles are generated as convex polygons through radial perturbation and geometric reconstruction. This method preserves particle area while allowing quantitative control of shape irregularity, thereby reproducing angular features of lunar regolith particles with acceptable computational cost.
At the packing level, a sequential insertion mechanism is adopted. For each new particle, feasible insertion positions are determined using available arc analysis. Specifically, geometric interference regions induced by existing particles are computed to identify admissible angular intervals. Random sampling is then performed within the remaining effective arc segments to uniformly cover the accessible configuration space. This strategy ensures contact without overlap and avoids the computational expense of global search.
The overall algorithm forms a sequential packing framework based on geometric exclusion constraints, producing particle assemblies with good randomness and physical consistency.
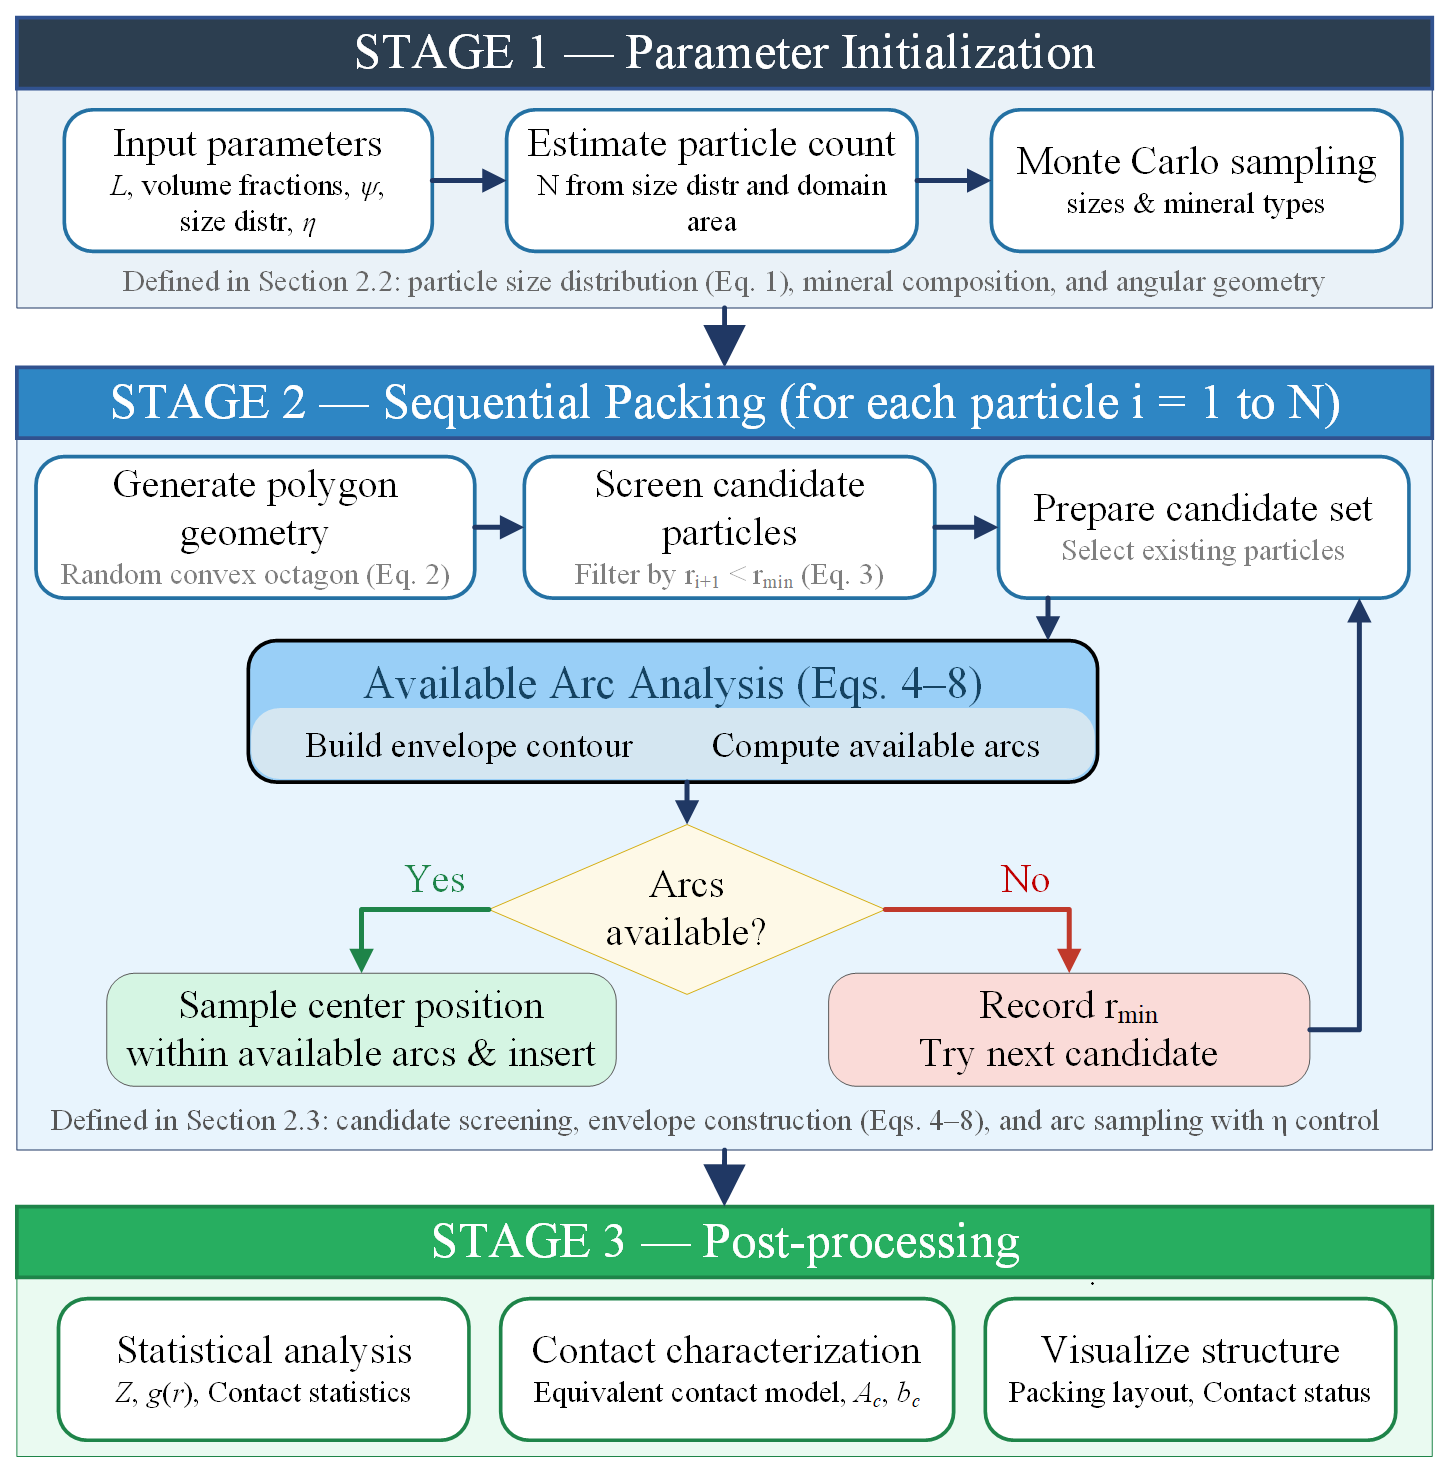
Figure 1 illustrates the random Sequential Packing Algorithm for Lunar Regolith Particles, which consists of three stages: parameter initialization (Stage 1), sequential packing generation (Stage 2), and post-processing (Stage 3).
Stage 1 (Parameter initialization). The required input parameters are first specified, including domain size L, mineral volume fractions, shape coefficients
ψ for different minerals, particle size distribution, and packing control coefficient
η. Based on the particle size distribution, the average particle area is calculated to estimate the total number of particles
N. Particle sizes and mineral types are then assigned using Monte Carlo sampling according to the prescribed distributions (Equation (1)). The data structure for storing particle properties (center coordinates, vertex coordinates, initial orientation, equivalent radius, edge-center distances, and mineral index) is initialized at this stage. Detailed descriptions of the particle size distribution model, mineral composition assignment, and angular geometry formulation are provided in
Section 2.2.
Stage 2 (Sequential packing generation). Particles are processed one by one. For the (i + 1)-th particle, its geometry is first generated: the edge-center distances [
rs]
i+1 are randomly computed via Equation (2) based on its mineral type and shape coefficient ψ, and the polygon vertex coordinates are derived from [
rs]
i+1. Candidate particles are then identified from the existing set of i already-inserted particles and screened using the criterion r
i+1 <
ri+1 (Equation (3)) to reduce the search space. For each screened candidate, an available arc analysis (Equations (4)–(8)) is performed: the envelope contour of the particle centers is constructed by vector addition of the candidate and new particle geometries, and the feasible angular intervals (available arcs) are computed by excluding the interference regions imposed by neighboring particles. If available arcs exist, the center coordinates of the new particle are randomly sampled within these arcs and the particle is inserted into the system. If no available arcs are found for any candidate, the minimum non-insertable radius
ri+1 among the examined candidates is recorded to tighten the screening condition for subsequent particles, reducing computational complexity. A packing control coefficient η is applied to the available arcs to enable continuous regulation of the packing density. The candidate screening strategy and the envelope construction procedure are detailed in
Section 2.3.
Stage 3 (Post-processing). After all N particles have been inserted, three parallel analyses are performed on the resulting packing structure: (i) statistical analyses including coordination number
Z, radial distribution function
g(
r), and contact strength distribution; (ii) extraction of contact parameters—specifically contact area
Ac and contact width
bc—through contact contour extraction and equivalent bow-shaped modeling (described in
Section 3.2); and (iii) visualization of the overall packing layout and local enlarged views.
Through the above procedure, high-fidelity packing structures of lunar regolith particles can be generated with a polydispersed size distribution, multimineral composition, and angular geometric features, while maintaining computational efficiency.
2.2. Parameter Initialization
This section establishes the parameter initialization method for lunar regolith particles, focusing on particle size distribution, mineral composition, and angular geometry representation.
2.2.1. Particle Size Distribution and Mineral Composition
The particle size distribution of lunar regolith originates from long-term impact fragmentation and accumulation processes. Under continuous micrometeoroid impacts, parent rocks undergo multiscale fragmentation, forming a stable power-law distribution governed by self-similar breakage mechanisms. In the absence of significant sorting effects, the particle system tends to exhibit a fractal size distribution, reflecting the cumulative effects of repeated impact-driven fragmentation over geological timescales.
For lunar regolith, the power-law distribution is reflected in both mass distribution and the statistical relationship between particle number and size, indicating self-similarity over a wide scale range from micrometers to centimeters. This distribution strongly influences pore structure, contact states, and packing behavior, and serves as a foundation for high-fidelity discrete element modeling.
Based on quantitative analyses of Chang’e-5 samples [
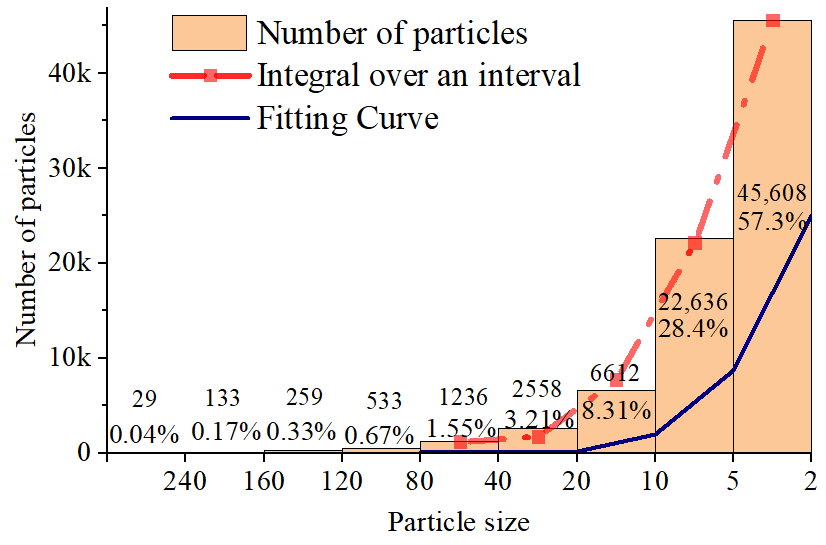
11], the relationship between particle size and particle number can be obtained. The corresponding particle size distribution histogram and its fitted results are shown in
Figure 2. By fitting the experimental data, the functional form of the particle number distribution with respect to particle size is derived, as given in Equation (1), where
d denotes particle diameter and
N(
d) represents the number of particles of size
d.
To reduce statistical fluctuations and ensure computational efficiency, the particle size range is limited to 2–40 μm. Within this range, particles larger than 35 μm account for approximately 0.091%. When the total particle number exceeds 11,000, sufficient sampling is ensured to maintain distribution stability.
In terms of mineral composition, Chang’e-5 samples mainly consist of pyroxene, feldspar, glass, olivine, ilmenite, and minor components [
11]. For the selected particle size range of 2–40 μm, the volume fractions of the corresponding mineral phases are 0.343 (glass), 0.315 (feldspar), 0.161 (pyroxene), 0.091 (olivine), 0.052 (ilmenite), and 0.038 (minor components), respectively. The minor components are merged into a single category for modeling purposes.
Mineral assignment is performed using random sampling based on volume fractions, ensuring statistical consistency and spatial randomness. Each particle is assigned a mineral label for subsequent contact statistics and multimineral interaction analysis. No correlation between particle size and mineral type is considered; such effects can be incorporated by introducing conditional probability distributions in the sampling process if needed.
2.2.2. Geometric Representation of Angular Particles
Lunar regolith particles are not subjected to hydraulic transport or aeolian rounding processes as on Earth. Their morphology is primarily governed by high-velocity micrometeoroid impacts and thermal fatigue fragmentation. As a result, lunar regolith particles typically exhibit pronounced angular features, irregular boundaries, and locally sharp edges, with overall shapes ranging from sub-angular to highly angular. This morphology is significantly different from the rounded or sub-rounded particles commonly observed in terrestrial sediments.
Compared with circular particle models, non-spherical polygonal representations can more realistically capture geometric interlocking effects, contact-induced rotational resistance, and shear dilation behavior. These characteristics play an important role in determining the pore structure and force chain distribution of granular systems. Therefore, to reasonably represent the irregular morphology of lunar regolith particles, random convex octagons are adopted as the basic two-dimensional geometric units in this study.
This modeling approach effectively captures key morphological characteristics, including angularity and boundary irregularity, while maintaining computational efficiency. Shape variability is introduced through perturbations of edge-center distances, enabling statistical reproduction of irregular particle geometries.
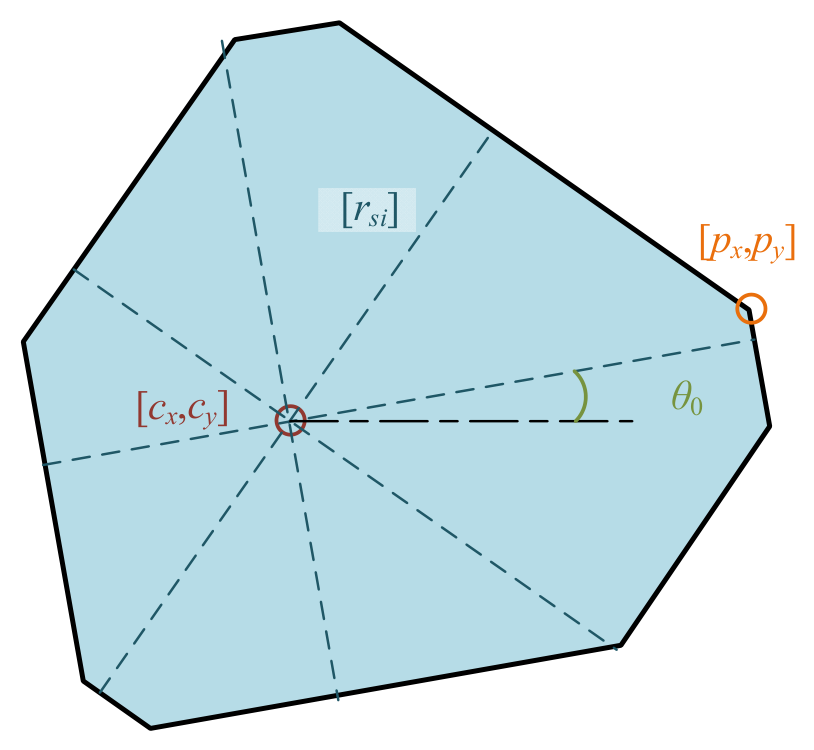
The particle geometry is generated as follows. First, the equivalent radius ri, shape coefficient, and initial orientation angle θ0 ∈ [0, π/4) are assigned. Then, edge-center distances [rs] are generated along eight equally spaced directions and perturbed according to the shape coefficient. Based on these distances, the polygon boundary is constructed, and vertex coordinates [px, py] are obtained from the intersections of adjacent edges.
After the initial geometry is constructed, the particle area is calculated, and the vertex coordinates [
px,
py] are uniformly scaled such that the particle area matches the target area
Ai corresponding to the equivalent radius
ri, i.e.,
Ai = π
ri2, thereby ensuring size consistency. The particle is then translated to the specified center position [
cx,
cy], yielding the vertex coordinates in the global coordinate system as [
px +
cx,
py +
cy]. The geometric parameters of a random octagonal particle are illustrated in
Figure 3.
It should be emphasized that particles of different mineral compositions exhibit distinct morphological characteristics. For example, feldspar particles are typically plate-like or elongated, with relatively large aspect ratios, whereas olivine and pyroxene particles tend to be more equiaxed. Glass particles generally exhibit greater irregularity. To account for these differences, a shape coefficient ψ is introduced to provide a unified description of particle morphology across different minerals. By adjusting the shape coefficient, a continuous transition from highly irregular shapes to nearly circular geometries can be achieved.
The edge-center distances [
rs] are generated through a weighted random perturbation based on the shape coefficient, as given by the following expression:
where
ξ ∈ (0, 1) is a random number.
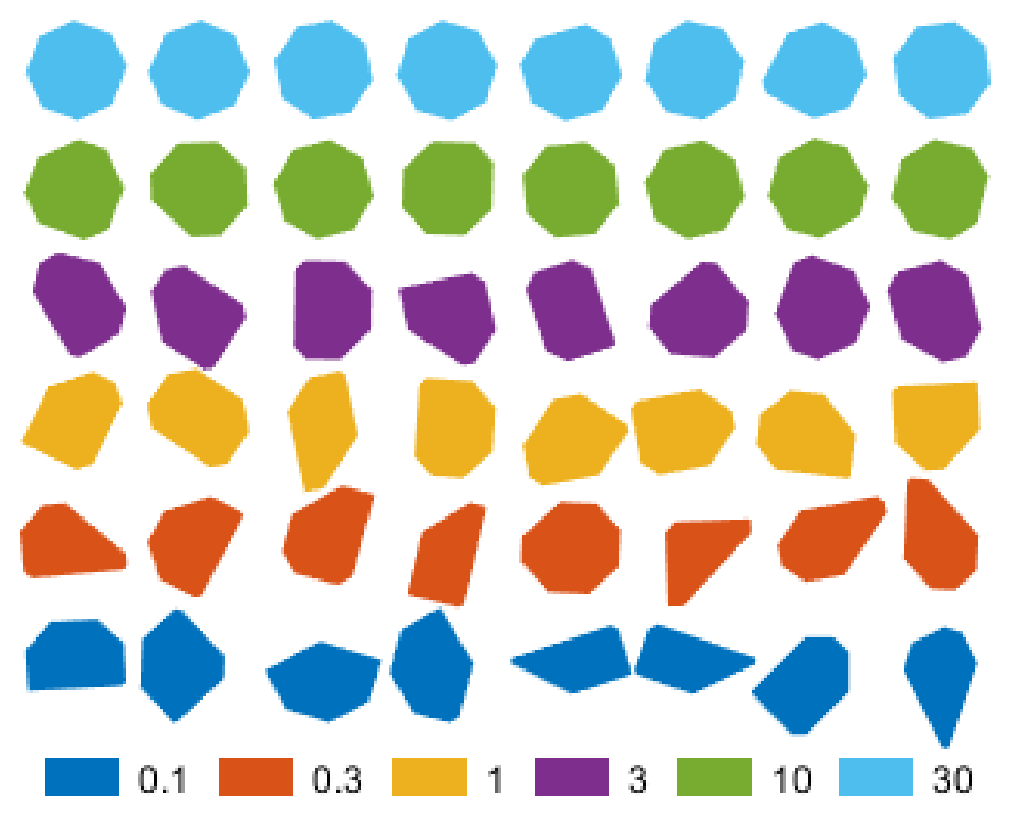
Figure 4 illustrates the influence of the shape coefficient
ψ on particle morphology. As
ψ increases, the distribution of ±(2
ξ − 1)
ψ becomes increasingly concentrated around zero, resulting in reduced random perturbations of the edge-center distances. Consequently, particle shapes gradually become more regular, and their overall contours approach circular forms. In contrast, for smaller values of
ψ, boundary fluctuations are amplified, leading to more pronounced angular features.
Through this approach, morphological differences among multimineral particles can be represented within a unified modeling framework, providing a geometric basis for subsequent analysis of packing structures and contact characteristics.
2.3. Sequential Packing Process
The sequential packing process consists of three key steps: particle geometry generation, candidate particle screening, and available arc analysis. The particle geometry generation method has been described in
Section 2.2.2. This section focuses on the implementation of candidate particle screening and available arc analysis.
During the sequential packing process, new particles are progressively inserted based on the existing particle assembly. For the (n + 1)-th particle, its insertion position must satisfy the constraint of contacting existing particles without geometric overlap. To improve computational efficiency, the search space is first reduced through candidate particle screening, followed by the determination of feasible insertion positions using available arc analysis.
2.3.1. Identification of Interfering Particles
When n particles have already been generated in the system, the insertion of the (n + 1)-th particle is performed. First, based on the constraint of the minimum insertable radius, a candidate particle set is selected from the existing particles. For a particle to be considered as a candidate, its equivalent radius must satisfy
where [
rmin] is the minimum non-insertable particle radius among the first
n particles. The particles satisfying this condition are treated as candidate particles, and each candidate is examined sequentially to determine whether there exists available space around it.
For each candidate particle
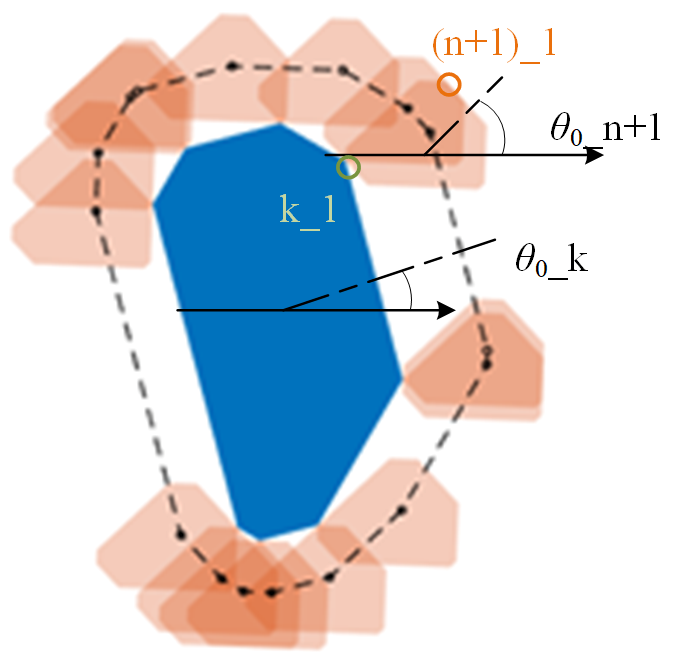
Pk, a feasible region for the center of the new particle is determined by constructing an envelope contour. This contour is jointly defined by the geometric boundaries of the candidate particle and the particle to be inserted. The construction process of the envelope contour is illustrated in
Figure 5.
The geometric parameters of both the candidate particle and the particle to be inserted are defined by their vertex coordinates and initial orientation angles. According to their relative orientations, the envelope contour of the new particle center is constructed through vertex sequence reordering and vector addition.
Let
sN denote the number of vertices of a particle. Depending on the relative initial orientation angles,
θ0,k and
θ0,n+1, the envelope contour vertex coordinates [
ecx,
ecy] are determined by Equation (4) when
θ0,k >
θ0,n+1, and by Equation (5) when
θ0,k < t
θ0,n+1.
The number of vertices of the envelope contour is twice that of the original particle. These vertices can be directly obtained by vector addition of the corresponding particle vertices, enabling efficient construction of the feasible boundary for the new particle center.
After obtaining the envelope contour of the candidate particle, it is necessary to identify the set of particles that may cause interference. This is achieved by calculating the center-to-center distance between the candidate particle and other particles and introducing a threshold coefficient τ. The interference criterion is defined as:
where [
dki] is the center distance between the candidate particle and the
i-th particle, and
rk,
ri are their equivalent radii.
Due to the irregular polygonal shape of particles, the geometric center may deviate from the actual contact boundary, and local sharp corners may introduce additional interference regions. Therefore, the threshold coefficient must be less than 1 to avoid omission of potential interference. Numerical tests indicate that when τ < 0.67, potential interfering particles can be effectively identified. In this study, τ = 0.65 is adopted as a balance between accuracy and efficiency.
This screening process significantly reduces the computational scale of subsequent envelope intersection calculations, thereby improving overall efficiency. After determining the interfering particle set, geometric intersection calculations are performed to identify unavailable regions on the envelope contour, which serves as the basis for the available arc analysis.
2.3.2. Available Arc Analysis and Center Position Determination
If the envelope contour of a candidate particle is not completely covered by interfering particles, the remaining portions constitute feasible regions for the new particle center, referred to as available arcs. If no available arc exists, the current candidate particle cannot accommodate the insertion of the particle with radius rn+1, and the algorithm proceeds to the next candidate particle.
The determination of available arcs relies on the intersection relationships between the envelope contour of the candidate particle and those of the interfering particles. Specifically, the angular ranges of the covered arcs are identified based on intersection points.
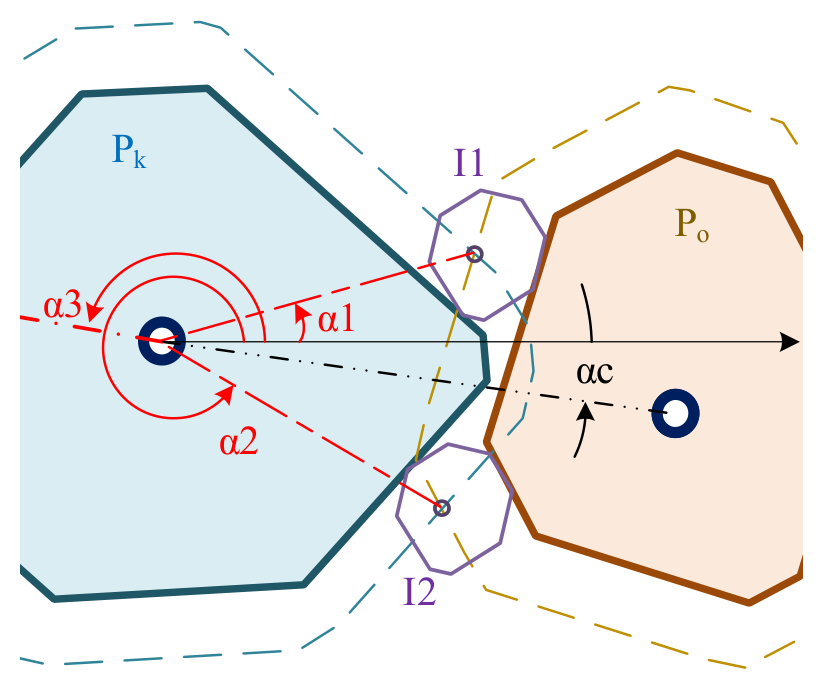
Let the candidate particle be Pk and an interfering particle be Po. Their envelope contours intersect at points I1 and I2. Taking the center of Pk as the pole, the corresponding polar angles of these intersection points are α1 and α2, where α1 < α2.
To determine the covered arc range, the relative position between the bisector angle α3 and the centerline angle αc (connecting the centers of the two particles) is considered. By evaluating the angular difference α3 − αc, it can be determined whether the covered arc crosses the polar axis.
If the arc does not cross the polar axis:
the start and end angles of the covered arc are α
1 and α
2, respectively.
If the arc crosses the polar axis:
the start and end angles must be swapped, i.e., the start angle becomes α
2 and the end angle becomes α
1, to ensure continuity of the angular interval.
Figure 6 shows the case where the covered arc crosses the polar axis.
After considering all interfering particles, the envelope contour is divided into multiple covered arcs and remaining arcs. By merging all covered arcs, the complete set of available arcs is obtained, which may consist of multiple discontinuous intervals.
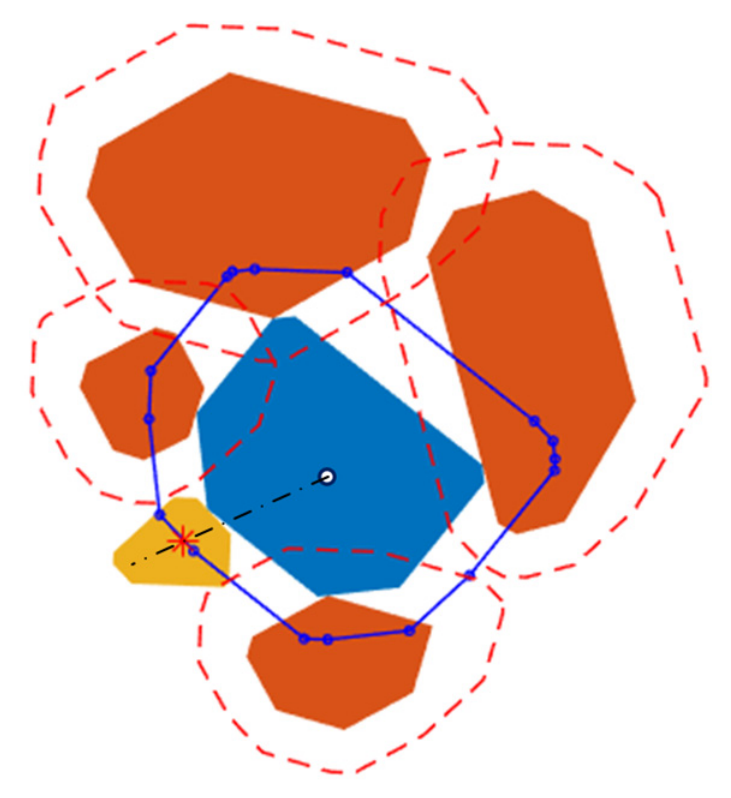
Let the set of available arc intervals be denoted as
, with total angular measure
. A uniformly distributed random variable is generated within
to determine the corresponding arc segment, from which the spatial position of the new particle center is obtained. The spatial position of the new particle center is then calculated as the intersection point between the selected direction and the envelope contour. The determination of the new particle center is illustrated in
Figure 7.
If no available arc exists for a candidate particle, it indicates that the current structure cannot accommodate a particle with radius rn+1, although smaller particles may still be inserted. In this case, rn+1 is recorded as the minimum non-insertable radius rmin,k for particle Pk, and this information is retained as a local geometric constraint.
In subsequent screening, candidate particles can be quickly filtered by comparing the radius of the particle to be inserted with rmin,k, thereby avoiding repeated available arc searches and improving computational efficiency.
2.3.3. Packing Control Coefficient η and Its Regulation Mechanism
In the basic sequential packing process, the center of a new particle can be uniformly distributed over all available arcs, leading the system toward the maximum packing density. To achieve continuous control of packing density, a packing control coefficient η is introduced. By restricting the selectable range of the new particle center within the available arcs, the inter-particle spacing can be regulated.
Specifically, angular shrinkage intervals are applied at both ends of each available arc, ensuring that the new particle center maintains a certain angular distance from the arc boundaries. The reduced arc length is jointly determined by the control coefficient η and the characteristic scale of the envelope contour. This treatment is equivalent to introducing a local geometric exclusion zone, thereby preventing particles from approaching excessively close.
By maintaining angular gaps between the new particle center and the start and end points of the available arc, the packing density can be controlled. The modified available arc is expressed as:
In the equation, introduces randomness into the packing control process. The term denotes the average radius of the envelope contour, and represents the angular coverage of the new particle. If , the arc segment is discarded.
When η = 0, no arc shrinkage is applied, and the system reaches the maximum packing density. As η increases, the available arcs gradually decrease, the average inter-particle distance increases, and the packing density decreases accordingly.
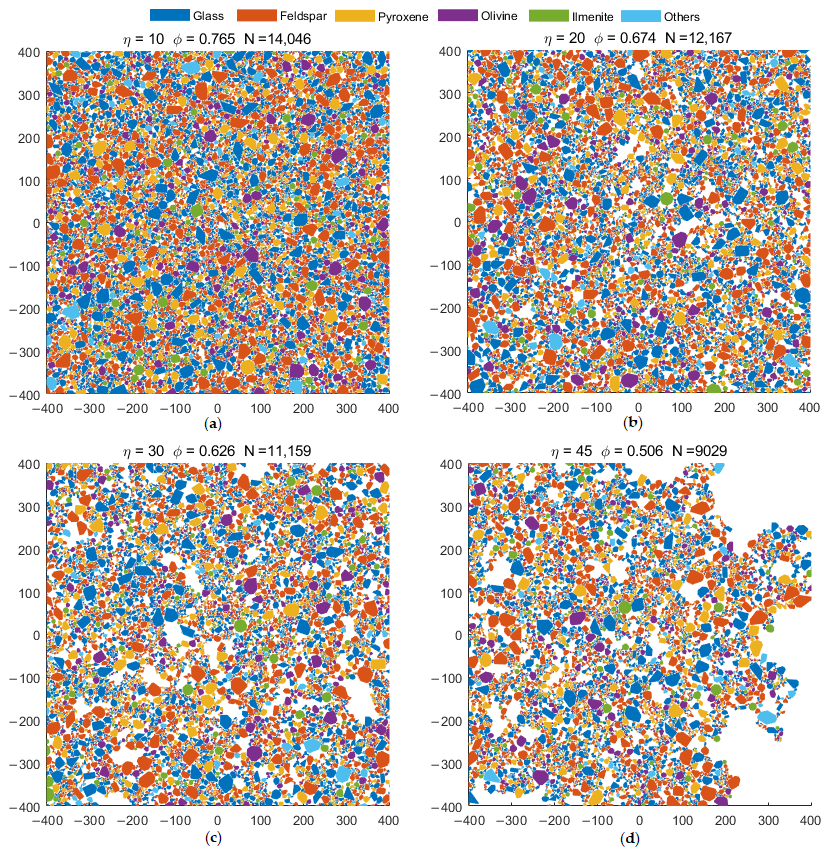
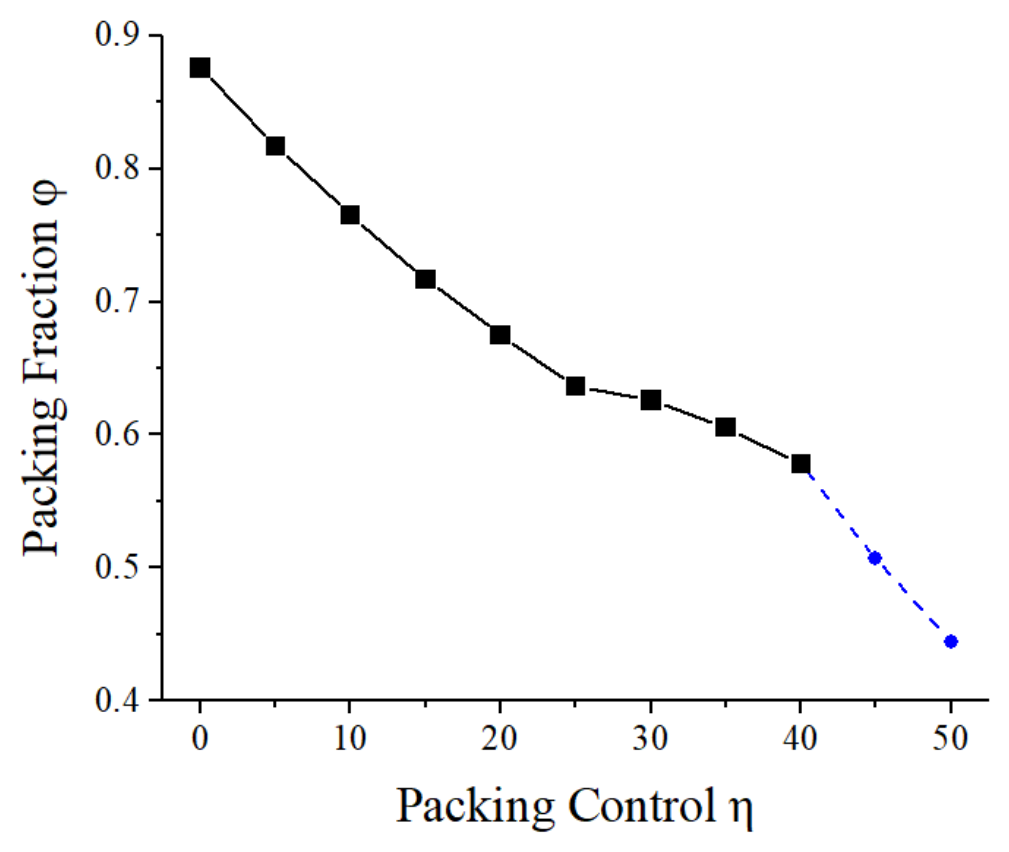
Comparisons of packing structures under different control coefficients are shown in
Figure 8, and the relationship between packing density
φ and
η is presented in
Figure 9.
From
Figure 8 and
Figure 9, it can be observed that when
η ranges from 0 to 25, the packing density decreases smoothly and monotonically, while the pore distribution remains uniform. As
η increases, inter-particle voids gradually expand. When η reaches 45, connected voids first appear within the packing structure. These connected pores hinder the ability of subsequently deposited particles to fill local regions effectively, resulting in distortion of the packing-density response. To distinguish this regime from the normal packing state, the data points at η = 45 and 50 are represented by blue circular markers in
Figure 9, whereas the results for η ≤ 40 are shown by black square markers.
Compared with traditional density control methods based on dynamic compaction [
2,
13], this method regulates density purely through geometric constraints, avoiding changes in contact states caused by particle rotation and sliding. This characteristic ensures statistical consistency of the initial contact types, which is crucial for subsequent contact mechanics analysis.
3. Particle Packing Results and Structural Characterization
Based on the particle generation and sequential packing method established in
Section 2, the generated lunar regolith particle system is further subjected to structural characterization and statistical analysis. The effectiveness and physical rationality of the proposed method are systematically validated in terms of packing density control, contact strength distribution, and spatial structural ordering. First, the particle packing structure under typical parameter conditions is presented, and its fundamental statistical characteristics are analyzed. Subsequently, quantitative analyses of contact parameters and coordination number distribution are performed. Finally, the spatial correlation of the system is evaluated using the radial distribution function.
3.1. Typical Packing Structure and Statistical Characteristics
In this section, the particle packing results are analyzed in detail under the condition of a packing control coefficient
η = 0. Under this condition, no angular shrinkage is applied to the available arcs, and particle centers are uniformly distributed over the entire set of available arcs. Consequently, the system reaches the maximum achievable packing density. The corresponding simulation parameters are listed in
Table 1.
To eliminate boundary effects, particles within a distance of one maximum particle diameter from the domain boundary are excluded from all statistical analyses reported below. This exclusion removes the boundary-induced size-sieving effect—whereby larger particles are geometrically restricted near the boundary while smaller particles can still infiltrate—that biases local packing statistics near the domain edge.
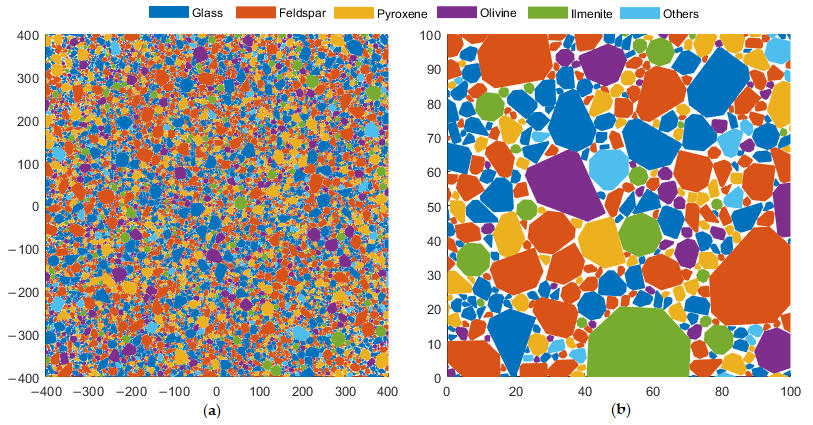
The particle packing results are shown in
Figure 10.
Figure 10a presents the overall packing structure within the computational domain of [−400, 400] × [−400, 400], where the total number of particles is 16,215 and the packing density reaches 0.8757.
Figure 10b shows an enlarged view of a local region [0, 100] × [0, 100]. Different colors represent different mineral components.
It can be observed that particles exhibit a highly dense and uniformly random spatial distribution, without evident macroscopic voids or artificial ordering. This indicates that the proposed sequential packing algorithm effectively avoids structural bias and generates particle assemblies with good statistical homogeneity. From a microscopic perspective, complex geometric interlocking occurs between particles, and local regions exhibit tight contacts among irregular polygons. Such structural features are consistent with the angular morphology of lunar regolith particles and contribute to enhanced overall stability and shear resistance of the system.
In summary, the generated packing structure agrees well with the physical characteristics of lunar regolith particle systems in terms of spatial distribution, mineral randomness, and local geometric features. This verifies the effectiveness and physical rationality of the proposed method in structural generation.
It should be noted that the packing densities reported herein, including the maximum value of φ ≈ 0.8757, represent geometric packing limits and are not directly comparable to the porosity of natural lunar regolith, which is typically in the range of 0.35–0.45 and is further influenced by agglutinate structures not modeled in this study. The high packing density achieved under η = 0 may be interpreted as a geometric upper bound for regolith compaction.
3.2. Contact Strength Characterization Method and Equivalent Modeling
To enable the transformation from geometric contact relationships to mechanical parameters, a contact strength characterization method based on contact contour extraction and equivalent modeling is proposed in this section. By reconstructing the geometry of particle contact regions and performing parameter equivalence, a unified quantitative description of contact strength is achieved.
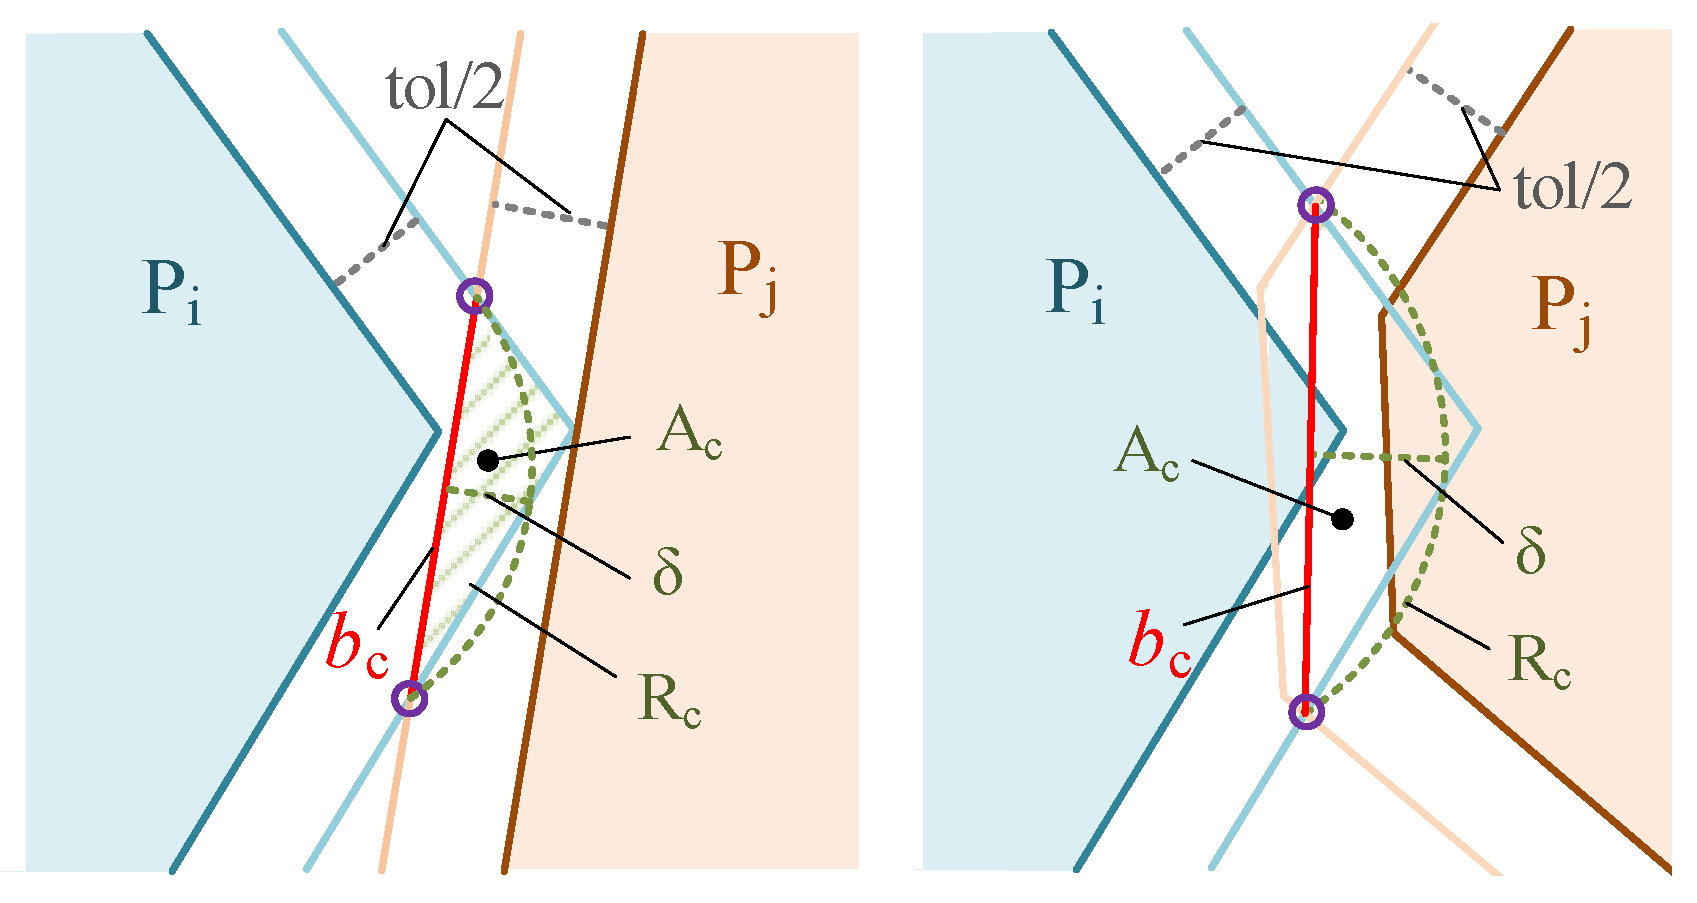
The calculation procedure of the contact region and the corresponding equivalent treatment are illustrated in
Figure 11. First, a contact tolerance parameter
tol is introduced to define the allowable range for contact detection between particles. In this study, the minimum equivalent particle radius is taken as 1 μm, and the contact tolerance is set to
tol = 0.05 μm, corresponding to 5% of the minimum particle radius and ensuring that the effective contact detection zone is sufficiently small. The sensitivity of the coordination number to tol is examined in
Section 3.3, which shows continuous and stable behavior across the examined range, confirming that the choice of tol does not qualitatively affect the contact statistics. Based on this, an isotropic expansion is applied to the edge-centered radius of each particle. Specifically, the original edge-centered radius
rs is increased by
tol/2 to obtain the modified radius:
Using the modified geometric boundaries, the contact contour between particles can be constructed. Through geometric computation of the contact contour, the contact width bc and the contact area Ac can be obtained. It should be noted that, due to the irregular polygonal shape of particles, the geometry of the contact region is highly uncertain and may take the form of triangles, quadrilaterals, or higher-order polygons. Therefore, it is difficult to directly adopt a unified geometric representation.
To address this issue, the actual contact region is equivalently represented as a circular segment. By preserving the contact area Ac and contact width bc, the equivalent radius Rc and contact depth δ can be determined. This equivalence enables a unified description of different geometric contact configurations and facilitates subsequent mechanical analysis. It should be noted that the circular-segment equivalence preserves the principal geometric characteristics of the contact region. The contact area Ac and contact width bc remain unchanged, while the equivalent contact depth δ is defined perpendicular to bc. Therefore, the direction of δ uniquely determines the contact normal direction. As a result, the key geometric quantities governing contact behaviour, including contact area, contact extent, and contact normal orientation, are retained after equivalence. The equivalence is introduced primarily to eliminate numerical singularities associated with vertex contacts and highly irregular local geometries, thereby providing a continuous and robust contact description for subsequent mechanical calculations. In terms of contact strength characterization, the contact area Ac is adopted as the representative metric. It should be emphasized that the contact strength defined here reflects the potential contact capacity under the current geometric configuration, rather than the actual contact force. The actual contact force needs to be further determined through mechanical models under external loading conditions.
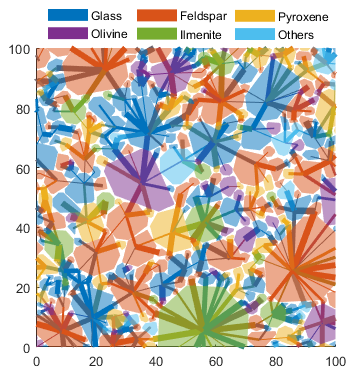
Based on the above method, the contact network within the packed structure is visualized, as shown in
Figure 12. In the figure, contact relationships are represented by lines connecting particle centers, and the line thickness indicates the magnitude of the contact area. The results show that the contact network exhibits a highly heterogeneous distribution: a small number of contacts possess relatively large contact areas and form localized clusters, while the majority of contacts remain relatively weak. From a global perspective, the contact network does not exhibit a pronounced directional bias and is approximately isotropic. This observation is consistent with the randomness of the packing structure and further validates the rationality of the proposed method in both structural generation and contact characterization.
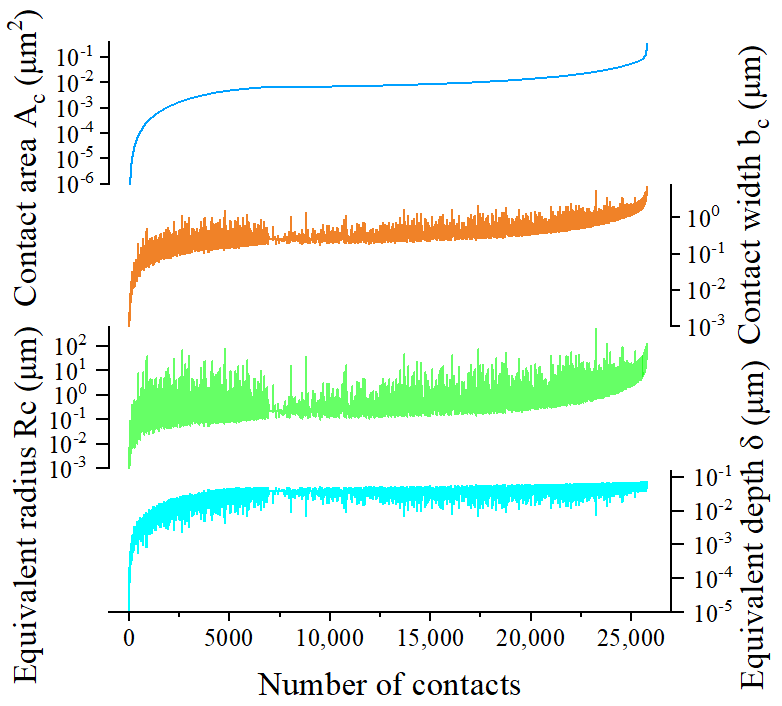
Statistical analysis of the contact parameters is presented in
Figure 13. The total number of contacts in the system is 25,784, and all parameters are displayed on a logarithmic scale. The equivalent contact radius
Rc and contact depth
δ are derived from the contact area
Ac and contact width
bc, indicating inherent correlations among these parameters. The statistical results show that the contact depth
δ is significantly smaller than the contact width
bc, with an average ratio of approximately 0.108. In addition,
δ exhibits a clear upper bound. It is found that 24,047 contacts have
δ smaller than the contact tolerance
tol, accounting for 93.26% of the total number of contacts.
These results indicate that the proposed equivalent contact modeling method does not introduce nonphysical excessive contact deformation, thereby ensuring the physical rationality of the extracted contact parameters. Meanwhile, the method provides a stable and consistent approach for parameter extraction under complex geometric contact conditions, offering a reliable foundation for subsequent mechanical modeling.
3.3. Coordination Number Statistical Characteristics
To quantitatively characterize the connectivity of the particle packing structure, the coordination number of the system is statistically analyzed in this section. The coordination number is defined as the number of neighboring particles in contact with a given particle, and it is an important indicator reflecting the compactness of the particle system and the characteristics of force chain transmission.
In contact detection, the contact tolerance is taken as tol = 0.05 μm. Based on this threshold, the total number of contacts in the system is 25,784, corresponding to an average coordination number of 3.18. This value is lower than that of a monodisperse disk random close packing system (typically about 4.0), but is consistent with the statistical characteristics of polydisperse non-spherical particle systems. This is mainly attributed to the pronounced geometric interlocking effect among angular particles, which allows the system to maintain stability at a relatively low coordination number, thereby exhibiting a structural feature of “high packing density–low connectivity.” This observation is in agreement with the general trend that the coordination number decreases with increasing shape irregularity in non-spherical particle systems, further indicating the physical rationality of the generated particle assembly.
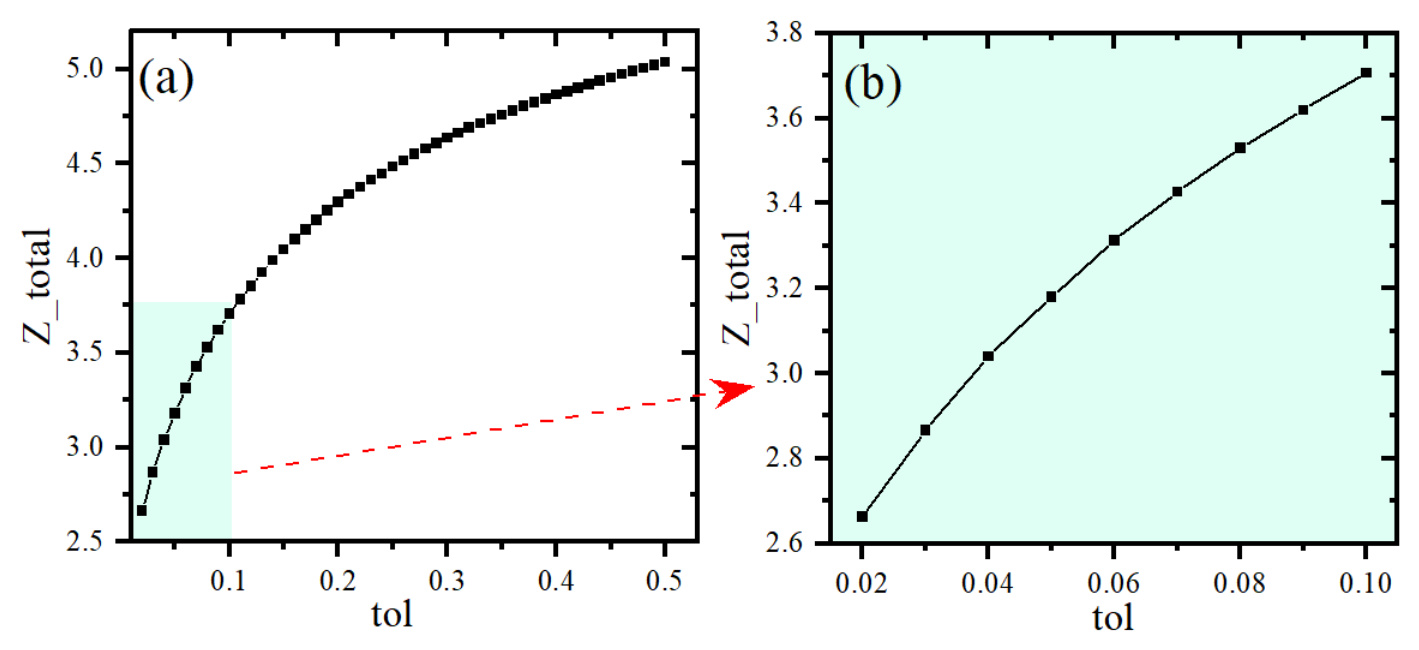
The variation in coordination number with contact tolerance is shown in
Figure 14.
Figure 14a presents the overall trend as
tol varies from 0.02 to 0.5 μm. As
tol increases, the coordination number gradually increases and tends to converge. This variation is continuous and smooth, without abrupt changes. This indicates that as the contact threshold is relaxed, potential contacts are progressively identified, and no large number of “critical contacts” emerge simultaneously. This behavior reflects the randomness and stability of the packing structure.
Figure 14b shows a local enlargement for
tol in the range of 0.02–0.1 μm. Considering that the minimum particle radius in the system is 1 μm, this range corresponds to very small contact scales. Even at this scale, the coordination number varies continuously, indicating that the proposed contact detection method remains stable and physically reasonable at small scales.
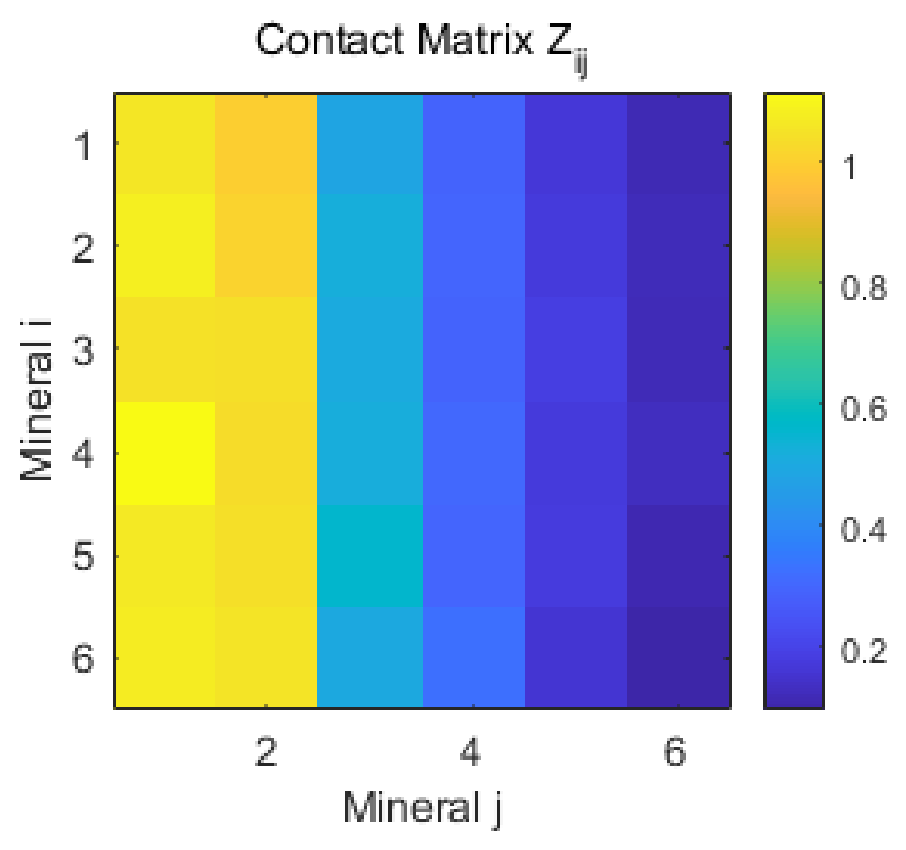
The coordination number distributions among different mineral components are shown in
Figure 15, and the average coordination numbers are listed in
Table 2. The statistical results indicate that the coordination numbers of different mineral components mainly range from 3.12 to 3.27, with relatively small differences overall. A weak increasing trend of coordination number with shape coefficient can be observed. This trend is consistent with the expectation that particles with more regular geometries may provide more stable local contact configurations. However, because the present system contains multiple mineral components with different shape coefficients, volume fractions, and local neighborhood environments, the observed trend should be interpreted qualitatively rather than as a direct causal relationship. No obvious relationship is observed between coordination number and particle perimeter. Within the present particle assembly, the observed variations in coordination number appear to be more closely associated with differences in particle morphology than with simple geometric size descriptors. Nevertheless, the influence of particle morphology cannot be isolated rigorously because coordination number is also affected by neighboring particle shapes, local packing configurations, and the sequential packing process.
In addition, no clear correlation is observed between coordination number and mineral volume fraction. This is because no coupling between particle size and mineral type is introduced during parameter initialization, and the mineral distribution remains uniform across different size ranges. If mineralogical segregation effects are to be considered, a coupled particle size–mineral type model can be introduced in future studies using conditional probability distributions, enabling further investigation of the influence of mineral heterogeneity on coordination structure.
Overall, the statistical results indicate that the generated particle system exhibits a combination of relatively high packing density, low coordination number, and pronounced geometric interlocking. These characteristics are qualitatively consistent with commonly reported structural features of lunar-regolith particle assemblies. However, the present analysis is limited to geometric and topological descriptors, and therefore should not be regarded as a direct validation of lunar-regolith mechanical behavior.
Because coordination number and contact-network evolution are collective properties of the entire particle assembly, their dependence on particle shape cannot be isolated within the present mixed-mineral framework. A dedicated parametric study in which particle angularity is varied independently would be required for rigorous statistical evaluation.
3.4. Radial Distribution Function Analysis
To characterize the spatial structural features of the particle system, the radial distribution function
g(
r) is introduced to statistically analyze the spatial correlation of particle centers. The radial distribution function describes the relative probability of finding a particle center at a distance
r, and its value reflects the degree of structural ordering at different length scales. In this study,
g(
r) is calculated based on the distances between particle centers:
where
rij denotes the distance between the centers of particles
i and
j, and
ρ represents the number density of the system. By statistically evaluating all particle pairs, the distribution function over different distance intervals can be obtained, thereby characterizing the spatial structure of the system.
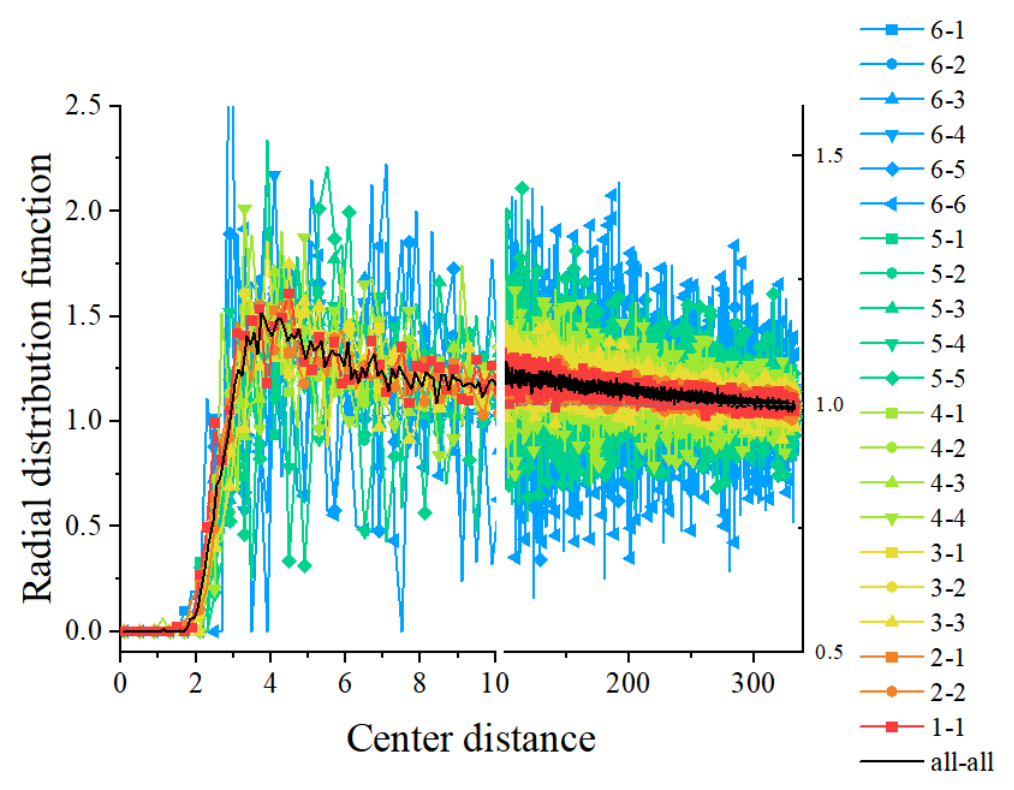
The results of the radial distribution function are shown in
Figure 16. To simultaneously illustrate near-field and far-field characteristics, the distributions are presented for r in the ranges of 0–10 μm and 100–340 μm. At small length scales,
g(
r) exhibits a pronounced primary peak near the particle contact distance, indicating the presence of typical short-range ordering in the system. As the distance increases,
g(
r) shows damped oscillations and gradually approaches 1, suggesting that spatial correlations between particles decay with distance and that the system tends toward a disordered state at large scales.
The statistical results indicate that the first peak of g(r) is located at approximately 3.75 μm, which is smaller than the average particle diameter of the system (about 5.65 μm). This phenomenon arises from the non-spherical geometry of the particles. In this study, particles are represented as random convex polygons, and the distance from the particle center to the boundary varies with direction. Therefore, when particles come into contact, the center-to-center distance is not fixed but distributed over a range, leading to a shift in the first peak toward smaller distances. In addition, two adjacent peaks are observed in the range of approximately 3.7–4.3 μm. This reflects the superposition of different contact configurations. For example, vertex–edge contacts and edge–edge contacts correspond to different center-to-center distance ranges, resulting in peak splitting in the statistical distribution. This feature is a typical geometric effect observed in non-spherical particle systems.
The radial distribution functions of different mineral components exhibit similar overall trends, all showing comparable decay behavior. This suggests that despite local mineral heterogeneity, the global spatial structure remains statistically uniform. Further analysis shows that mineral components with smaller volume fractions exhibit relatively larger fluctuations in their g(r) curves. This is mainly attributed to statistical fluctuations caused by smaller sample sizes rather than intrinsic structural differences.
Overall, the radial distribution function results demonstrate that the particle system exhibits clear short-range order and long-range disorder, consistent with the typical structural characteristics of dense particulate systems. Moreover, the shape of the g(r) curve and the distribution of its peaks are consistent with the geometric characteristics of non-spherical particles, further confirming the physical rationality of the generated packing structure from a spatial statistical perspective.
3.5. Computational Efficiency and Complexity Analysis
To evaluate the computational efficiency of the proposed sequential packing algorithm, the relationship between the number of particles and computation time is statistically analyzed. All simulations are performed under identical hardware conditions to ensure comparability of the results.
The variation in computation time with particle number is shown in
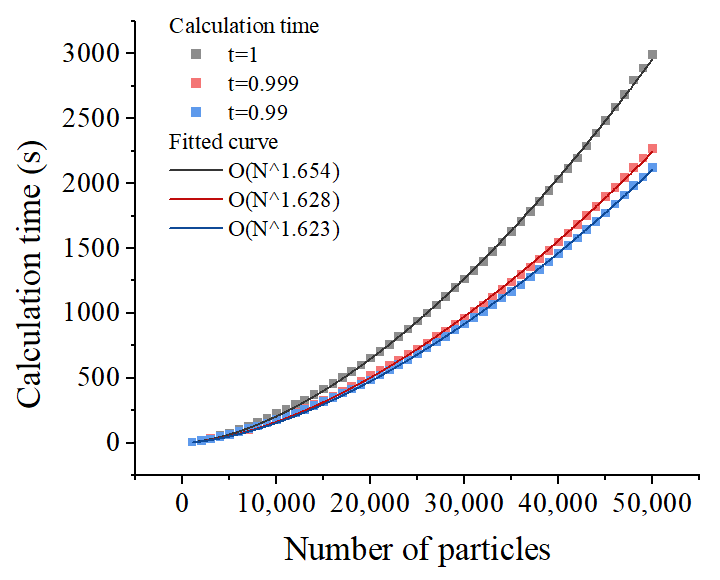
Figure 17. As the number of particles increases, the computation time exhibits a stable power-law growth trend. By fitting the statistical data, the relationship between computation time and particle number can be described by a power function, with a computational complexity of approximately O(
N1.628). The fitting results indicate that the growth of computation time is smooth and continuous, without noticeable fluctuations or abrupt changes. This suggests that no extreme search behavior or local degeneration occurs during the progressive particle insertion process, and the overall computation remains stable. Compared with exhaustive particle placement methods, the proposed algorithm avoids global search, thereby significantly reducing computational complexity. In addition, compared with dynamic relaxation-based packing methods, the present approach does not require time-stepping or mechanical iterations, resulting in higher computational efficiency. Overall, the proposed method achieves a favorable balance between structural fidelity and computational efficiency.
In practical implementation, the candidate particle screening strategy plays a critical role in computational efficiency. To further reduce computational complexity, the screening criterion is optimized. The original criterion [rmin] > rn+1 is modified by introducing a coefficient t, leading to the updated condition t·[rmin] > rn+1. Under identical computational conditions, the efficiency is compared for different values of t. When the number of particles reaches 5 × 10⁴, the computation times for t = 1, 0.999, and 0.99 are 2993 s, 2269 s, and 2120 s, respectively. The corresponding complexity exponents are 1.654, 1.628, and 1.623.
The results show that when t decreases from 1 to 0.999, the computation time is reduced by approximately 24.2%, and the complexity exponent decreases by 0.026. When t is further reduced to 0.99, the computation time decreases by only an additional 6.6%, and the complexity exponent decreases by 0.005. This indicates that t = 0.999 is sufficient to eliminate most invalid candidate particles, thereby significantly reducing the computational scale. Further reduction in t affects only a small number of boundary cases, resulting in limited additional efficiency gains. Although the reduction in the complexity exponent is relatively small, it can still lead to noticeable improvements in computational efficiency for large-scale particle systems.
It should be noted that this optimization does not alter the geometric results of the packing structure. When no available arc exists for a candidate particle, its envelope contour is already fully covered by interfering particles. In this case, not only particles with radius rmin,k cannot be inserted, but particles with slightly smaller radii are also infeasible. Therefore, moderately tightening the screening condition does not affect the determination of feasible insertion positions. Overall, the introduction of the screening coefficient t effectively reduces computational complexity without changing the packing structure. Among the tested values, t = 0.999 achieves a favorable balance between computational efficiency and structural fidelity.
In summary, the proposed algorithm achieves a good balance between computational complexity and efficiency. By incorporating an optimized candidate screening strategy, the computation time is effectively reduced without altering the packing structure, demonstrating strong potential for engineering applications.
3.6. Repeatability Under Different Random Seeds
To evaluate the robustness and repeatability of the proposed packing method, additional simulations were performed using different random seeds while keeping all model parameters unchanged. The resulting packing densities and mean coordination numbers are summarized in
Table 3.
The packing density varied from 0.8747 to 0.8785, with a coefficient of variation of approximately 0.15%. The mean coordination number ranged from 3.122 to 3.183, corresponding to a coefficient of variation of approximately 0.60%. These results indicate that although local contact topologies exhibit certain stochastic variations, the overall structural characteristics of the generated particle assemblies remain highly stable. Therefore, the proposed packing method demonstrates good repeatability and robustness with respect to random initialization.
These results demonstrate that the stochastic components of particle generation and sequential insertion do not significantly affect the overall structural characteristics of the generated assemblies. Therefore, the proposed method exhibits good repeatability and robustness with respect to random initialization.
4. Conclusions and Perspectives
4.1. Conclusions
This study proposes a particle packing method for lunar regolith based on sequential packing and available arc analysis, and establishes a corresponding framework for contact strength characterization and structural analysis. Through numerical simulations and statistical analysis, the main conclusions are summarized as follows:
(1) A sequential packing algorithm based on available arc determination is developed. By performing geometric constraint analysis on the feasible insertion regions of candidate particles, the method enables effective control of the progressive particle filling process. Without introducing dynamic iterations, particle assemblies with high packing density and uniform spatial distribution can be generated.
(2) A contact strength characterization method based on contact contour extraction is established. By introducing a contact tolerance and applying an equivalent circular segment model to the contact region, a unified description of complex polygonal contact relationships is achieved. The defined contact area can be used as a geometric indicator of contact strength, providing a parameter basis for subsequent mechanical analysis.
(3) The particle system exhibits structural characteristics of low coordination number, high packing density, and strong geometric interlocking. The average coordination number is approximately 3.18, which is lower than that of monodisperse disk systems but consistent with the general behavior of polydisperse non-spherical particle systems. This indicates that the system can maintain stability under relatively low-connectivity conditions.
(4) The radial distribution function results show that the system exhibits clear short-range order and long-range disorder. The position and shape of the first peak reflect the geometric contact characteristics of non-spherical particles, and different contact configurations are manifested as peak splitting in the statistical distribution. The overall results are consistent with the spatial distribution characteristics of non-spherical particle systems.
(5) The computational efficiency analysis indicates that the proposed algorithm follows a power-law growth in computational complexity. By introducing a candidate screening coefficient to optimize the selection criterion, the computational complexity can be reduced without altering the packing structure. The complexity exponent decreases from 1.654 to 1.628 (a reduction of 0.026), leading to improved computational efficiency.
In summary, the proposed method can efficiently generate physically representative lunar regolith particle packing structures while ensuring structural rationality. It provides a reliable geometric and statistical foundation for subsequent two-dimensional microstructural investigations and may serve as a methodological basis for future extensions to three-dimensional lunar regolith modeling.
4.2. Discussion and Outlook
A significant limitation of the present study is its restriction to two dimensions. As discussed in
Section 1.4, the mechanical behavior of real lunar regolith—including three-dimensional particle interlocking, stress field diffusion under penetrometers and footings, and shear band morphology—requires full 3D modeling for quantitative prediction [
20,
27,
33]. The packing density and coordination number values obtained in this study are 2D-specific and cannot be directly translated to 3D benchmarks.
The scope of the contact strength characterization warrants explicit clarification. The contact strength defined in this study is a geometric metric based on the dimensions of the contact region—specifically, the contact area Ac and contact width bc extracted from particle contacts. Its purpose is to demonstrate a systematic method for calculating microscopic contact dimensions under complex polygonal contact geometries, thereby providing geometric input parameters (contact area and width) for subsequent mechanical analysis. The contribution of this approach lies in offering a unified geometric framework for extracting the contact area and width of arbitrary polygonal contact configurations, addressing the difficulty of unified characterization caused by the shape uncertainty of contact regions in non-spherical particle systems. The computation of actual contact forces requires further coupling with mechanical models under external loading conditions (e.g., Hertz–Mindlin contact models, adhesive contact models), which falls within the domain of mechanical analysis and lies beyond the scope of the present geometric generation framework.
Future work may proceed in the following directions. First, the available-arc sequential packing framework may be extended to three dimensions by replacing 2D polygonal envelope construction with 3D polyhedral envelope analysis, and by sampling insertion positions on available surface patches rather than arcs. Second, the geometric contact parameters (Ac, bc) extracted by the proposed method may serve as direct inputs to mechanically validated contact laws, establishing a complete pipeline from geometric characterization to contact force computation [
2,
10]. Third, the particle generation module may incorporate 3D morphological descriptors—such as sphericity, aspect ratio, and convexity [
34]—derived from micro-CT analysis of lunar regolith samples, enabling the generation of statistically equivalent 3D polyhedral particle assemblies.
Additionally, direct microstructural validation of the generated packing structures against micro-CT-derived contact networks of physical lunar regolith simulants [
28,
34] would further strengthen confidence in the physical realism of the method.




 ,
,