Article

Numerical Investigation of Aerodynamic Characteristics and Test Environmental Interference for Scaled Civil Aircraft Thrust Reverser Configurations in Wind Tunnels


1
AVIC Aerodynamics Research Institute, Harbin 150001, China
2
AVIC First Aircraft Institute, Xi’an 710089, China
3
School of Aeronautics, Northwestern Polytechnical University, Xi’an 710072, China
4
National Key Laboratory of Land and Air Based Information Perception and Control, Xi’an 710065, China
5
Xi’an Modern Control Technology Research Institute, Xi’an 710065, China
*
Authors to whom correspondence should be addressed.
Aerospace 2026, 13(7), 599; https://doi.org/10.3390/aerospace13070599
Submission received: 21 April 2026 / Revised: 21 June 2026 / Accepted: 21 June 2026 / Published: 30 June 2026

Abstract

To address the challenges posed by the complex flow fields of civil aircraft thrust reversers and the difficulty of quantitatively decoupling multiple interference factors in wind tunnel tests, this paper employs numerical simulation methods to conduct an in-depth investigation into the aerodynamic characteristics and environmental interference effects of a scaled thrust reverser test configuration. The results indicate that the Fan Pressure Ratio (FPR) is the primary factor governing deceleration efficiency, while an increase in the freestream Mach number exerts a significant streamwise constraining effect on the reverse jets. Under sideslip conditions, the asymmetric interference moment induced by lateral dynamic pressure superimposes positively with the inherent stability of the configuration, thereby enhancing the directional recovery capability during crosswind rollout. Analysis of wind tunnel interference reveals that the boundary layer on the static floor induces a “ground cushion effect,” leading to an overestimation of lift; meanwhile, the support structure interference results in an overall increase in aerodynamic loads. This study elucidates the physical essence of thrust reverser flow fields within confined spaces, providing critical theoretical support for the design of test schemes and the correction of experimental data.

1. Introduction

With the steady increase in the takeoff weight and landing speed of modern large civil aircraft, deceleration performance during the landing phase has emerged as a critical factor in ensuring flight safety [1]. Under extreme weather conditions—such as wet, snowy, or icy runways—the efficiency of traditional wheel braking systems is severely compromised by the reduction in ground friction, significantly increasing the risk of hydroplaning or runway excursions. As an effective aerodynamic deceleration method, the thrust reverser generates reverse thrust by redirecting the engine exhaust flow, providing an essential safeguard for shortening rollout distances and alleviating the load on the braking system [2,3]. Among various designs, the cascade-type thrust reverser is widely adopted in high-bypass-ratio turbofan engines due to its precise jet flow control and superior thrust reversal efficiency [4,5,6].
Upon deployment of the thrust reverser, the highly disturbed jet plumes undergo intense aerodynamic coupling with the wing, fuselage, and control surfaces. This interaction significantly alters the aircraft’s load distribution and may even induce engine intake re-ingestion, thereby threatening the operational stability of the propulsion system [7,8,9]. With the rapid evolution of Computational Fluid Dynamics (CFD), the numerical simulation of integrated airframe-engine flow fields has become a vital tool for complex flow analysis. Qian et al. [10] employed numerical methods to calculate the disturbed flow fields of thrust reversers in their deployed state. Zhang [11] integrated CFD simulations into the design process of thrust reverser efflux patterns, conducting full-aircraft efflux configuration design. Although extensive research has been dedicated to engine intake flow evolution and wing aerodynamic interference effects [12,13,14,15,16,17,18,19,20], wind tunnel testing remains indispensable as a critical means for obtaining high-fidelity aerodynamic data and verifying aircraft airworthiness characteristics. However, existing studies have primarily focused on the underlying mechanisms using full-scale models, whereas research regarding the aerodynamic evolution patterns of scaled thrust reverser wind tunnel test configurations themselves remains relatively scarce.
In addition to the intrinsic reverse-jet/airframe interaction, wind tunnel testing introduces another source of uncertainty for scaled thrust reverser configurations. The environmental interference effects introduced by the confined wind tunnel space often cause experimental results to deviate from actual flight conditions [21,22]. The presence of the support mechanism alters the flow field around the model, thereby interfering with the experimental data. A more challenging interference stems from the boundary layer of the static ground during testing, which leads to significant discrepancies in the flow characteristics between the model and the ground compared to actual conditions, thus failing to accurately simulate ground effects. Conversely, a moving ground can authentically simulate the relative motion between the aircraft and the ground, enhancing the fidelity of the experimental results. Jia et al. [23] investigated the strut interference in wing-in-ground effect wind tunnel tests using numerical simulations. Marshall et al. [24] studied the impact of the boundary layer on wing ground effects, while Fago et al. [25] conducted wind tunnel tests on automotive models with various ground clearances using both moving belt and fixed floors. Nevertheless, research regarding the intense interaction between large-scale thrust reverser jets, the floor boundary layer, and support mechanisms in scaled wind tunnel testing remains severely lacking.
Therefore, this study investigates a scaled civil aircraft model by developing a high-fidelity numerical model that encompasses all experimental environmental factors to elucidate the physical mechanisms underlying the interference. Adopting a comprehensive numerical research framework, this work elaborates on the aerodynamic characteristics of the thrust reverser configuration under various rollout speeds, pressure ratios, and sideslip conditions. Furthermore, the influence patterns of the support strut and ground effects on the thrust reverser flow field are quantitatively analyzed. This research provides a scientific basis for the optimization of thrust reverser systems and the formulation of experimental guidelines in civil aircraft development.

2. Numerical Method and Case Validation

The flow field was solved using the commercial CFD software STAR-CCM+ [26]. The governing equations are the three-dimensional compressible RANS equations in Cartesian coordinates, expressed in integral conservation [27] form as:
t Q d V + f n d S = 0
where V is the control volume, S is the surface area of the control volume, Q is the vector of conserved variables, f represents the net flux vector—including both inviscid and viscous fluxes through surface S , and n denotes the unit outward normal vector to the surface.
A fully implicit time integration scheme, known for its numerical stability, was employed for time discretization, while a second-order upwind scheme was adopted for spatial discretization. Considering the strong convection characteristics of the thrust reverser flow field, the k ω S S T turbulence model [28] was used. This model is well-suited for simulating flows in adverse pressure gradients and separated regions and includes cross-diffusion terms to ensure accuracy near both the wall and the far-field.
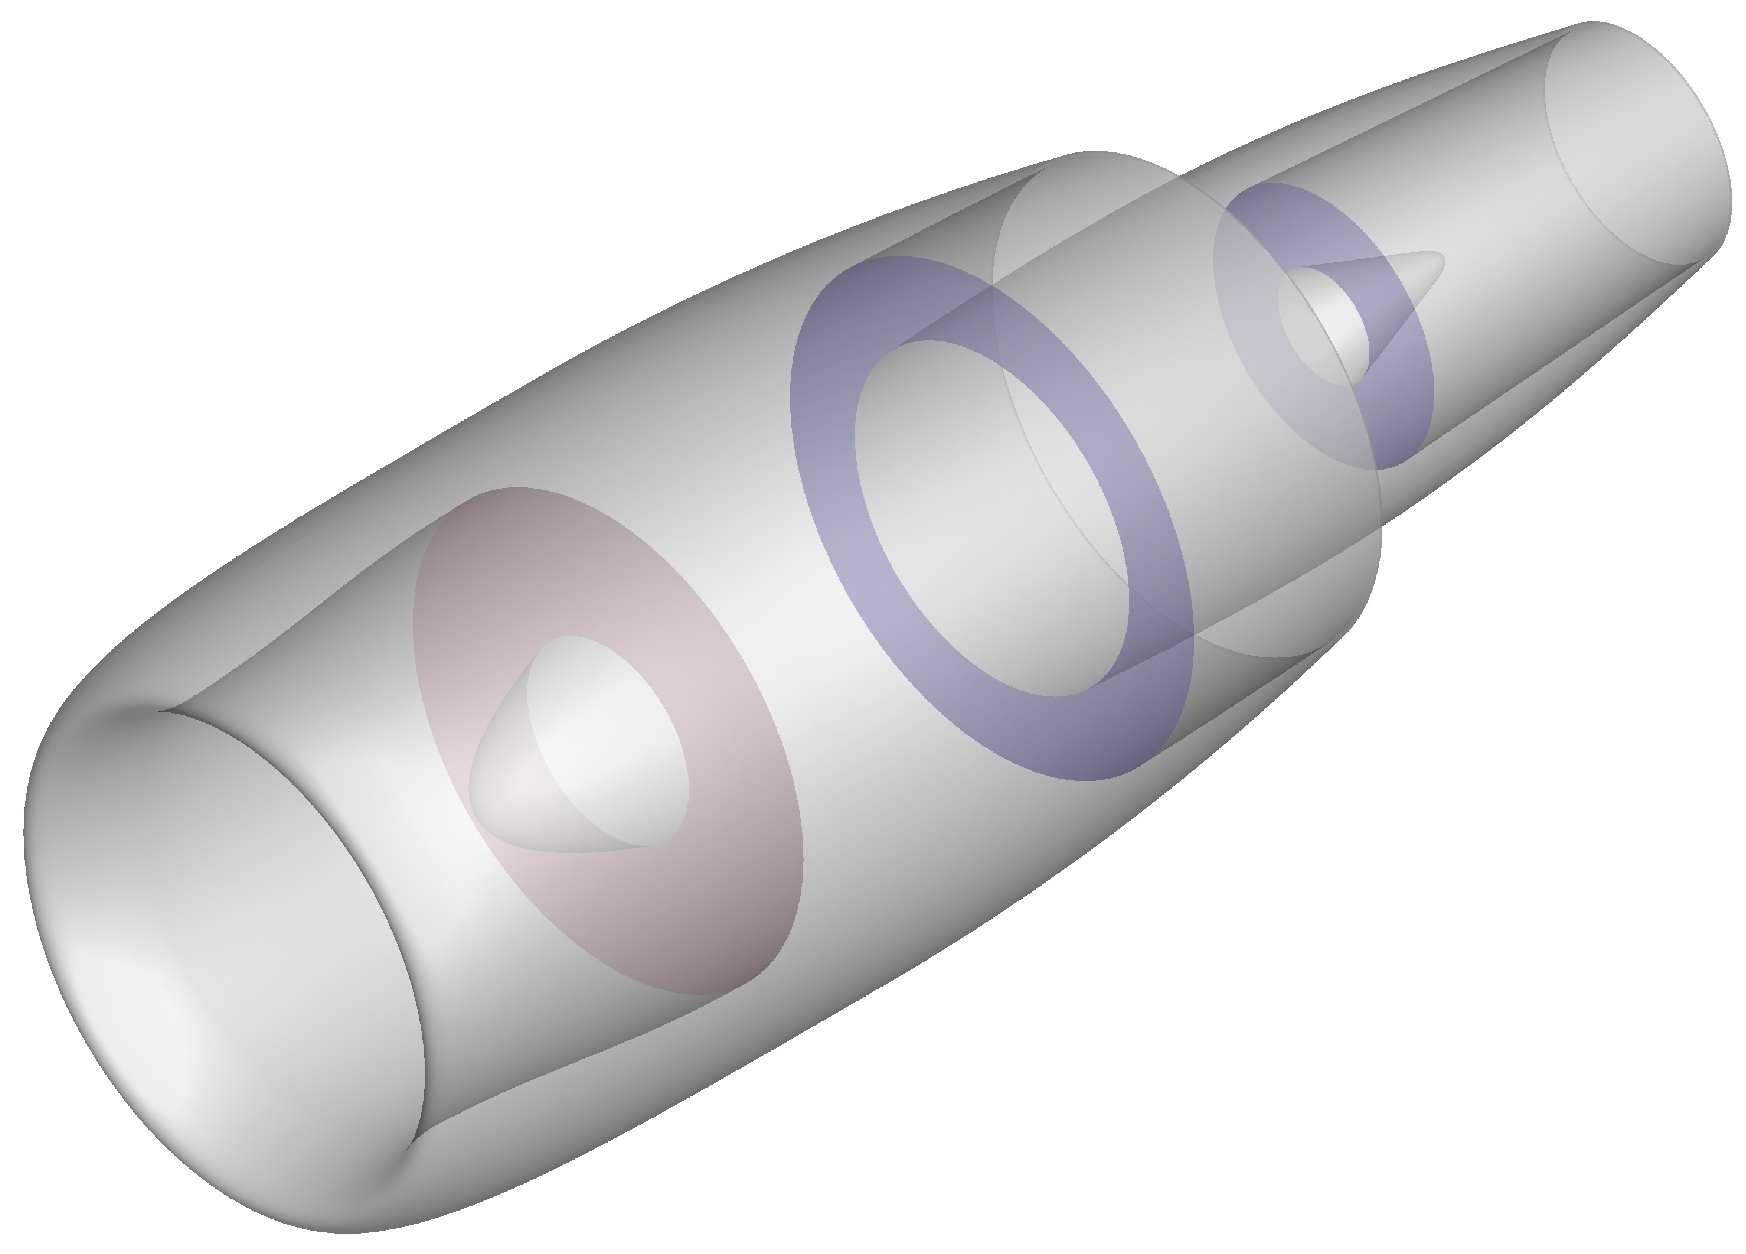
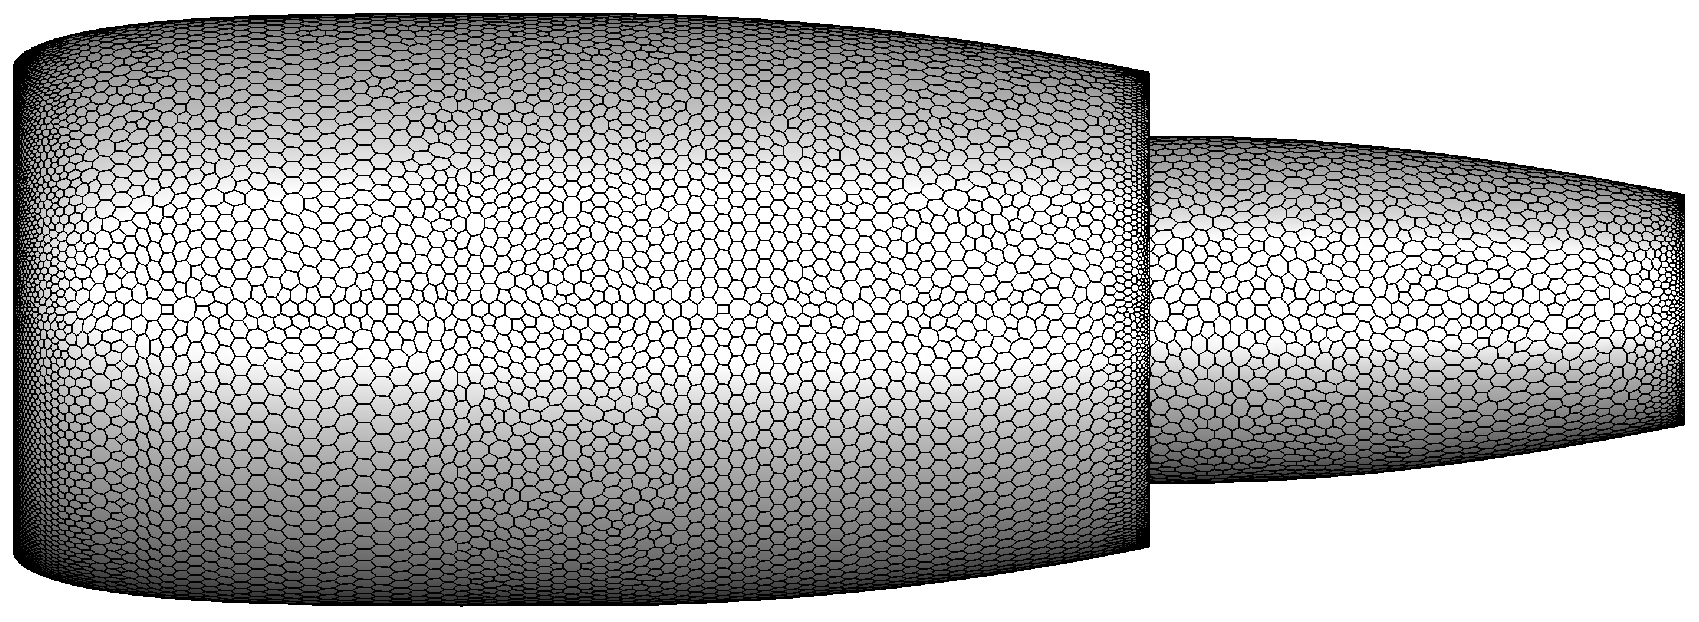
To verify the reliability of the numerical method for propulsion-related flow simulations, the NAL-AERO-02-01 TPS (Turbine Powered Simulator) engine model developed by the National Aerospace Laboratory of Japan [29] was selected as the validation case. This case provides publicly available experimental surface-pressure data for a powered nacelle configuration. The external geometry of the model is shown in Figure 1 and can be generated by rotating the meridional profile 360 degrees about the center axis. Based on the TPS engine configuration, unstructured meshes with scales of 0.9 million, 1.8 million, and 3.6 million elements were generated. The surface mesh corresponding to the 1.8 million case is shown in Figure 2.
The boundary conditions for the numerical case are defined as follows: The far-field of the computational domain is set as a freestream boundary condition, with parameters such as static temperature, static pressure, Mach number, and flow direction specified. The engine surfaces are assigned no-slip wall boundary conditions. For the engine’s internal flow, both the bypass and core ducts are defined as stagnation inlet boundary conditions, where the total pressure, total temperature, and flow direction are prescribed. The engine intake is set as a pressure outlet boundary condition; the initial static pressure, flow direction, and static temperature are specified, and the boundary pressure is dynamically adjusted through a target mass flow rate correction to achieve the designated mass flow.
The maximum diameter of the TPS model is 0.51163 m. The selected validation operating condition corresponds to Case 17 in the NAL-AERO-02-01 TPS experimental database, as listed in Table 1.
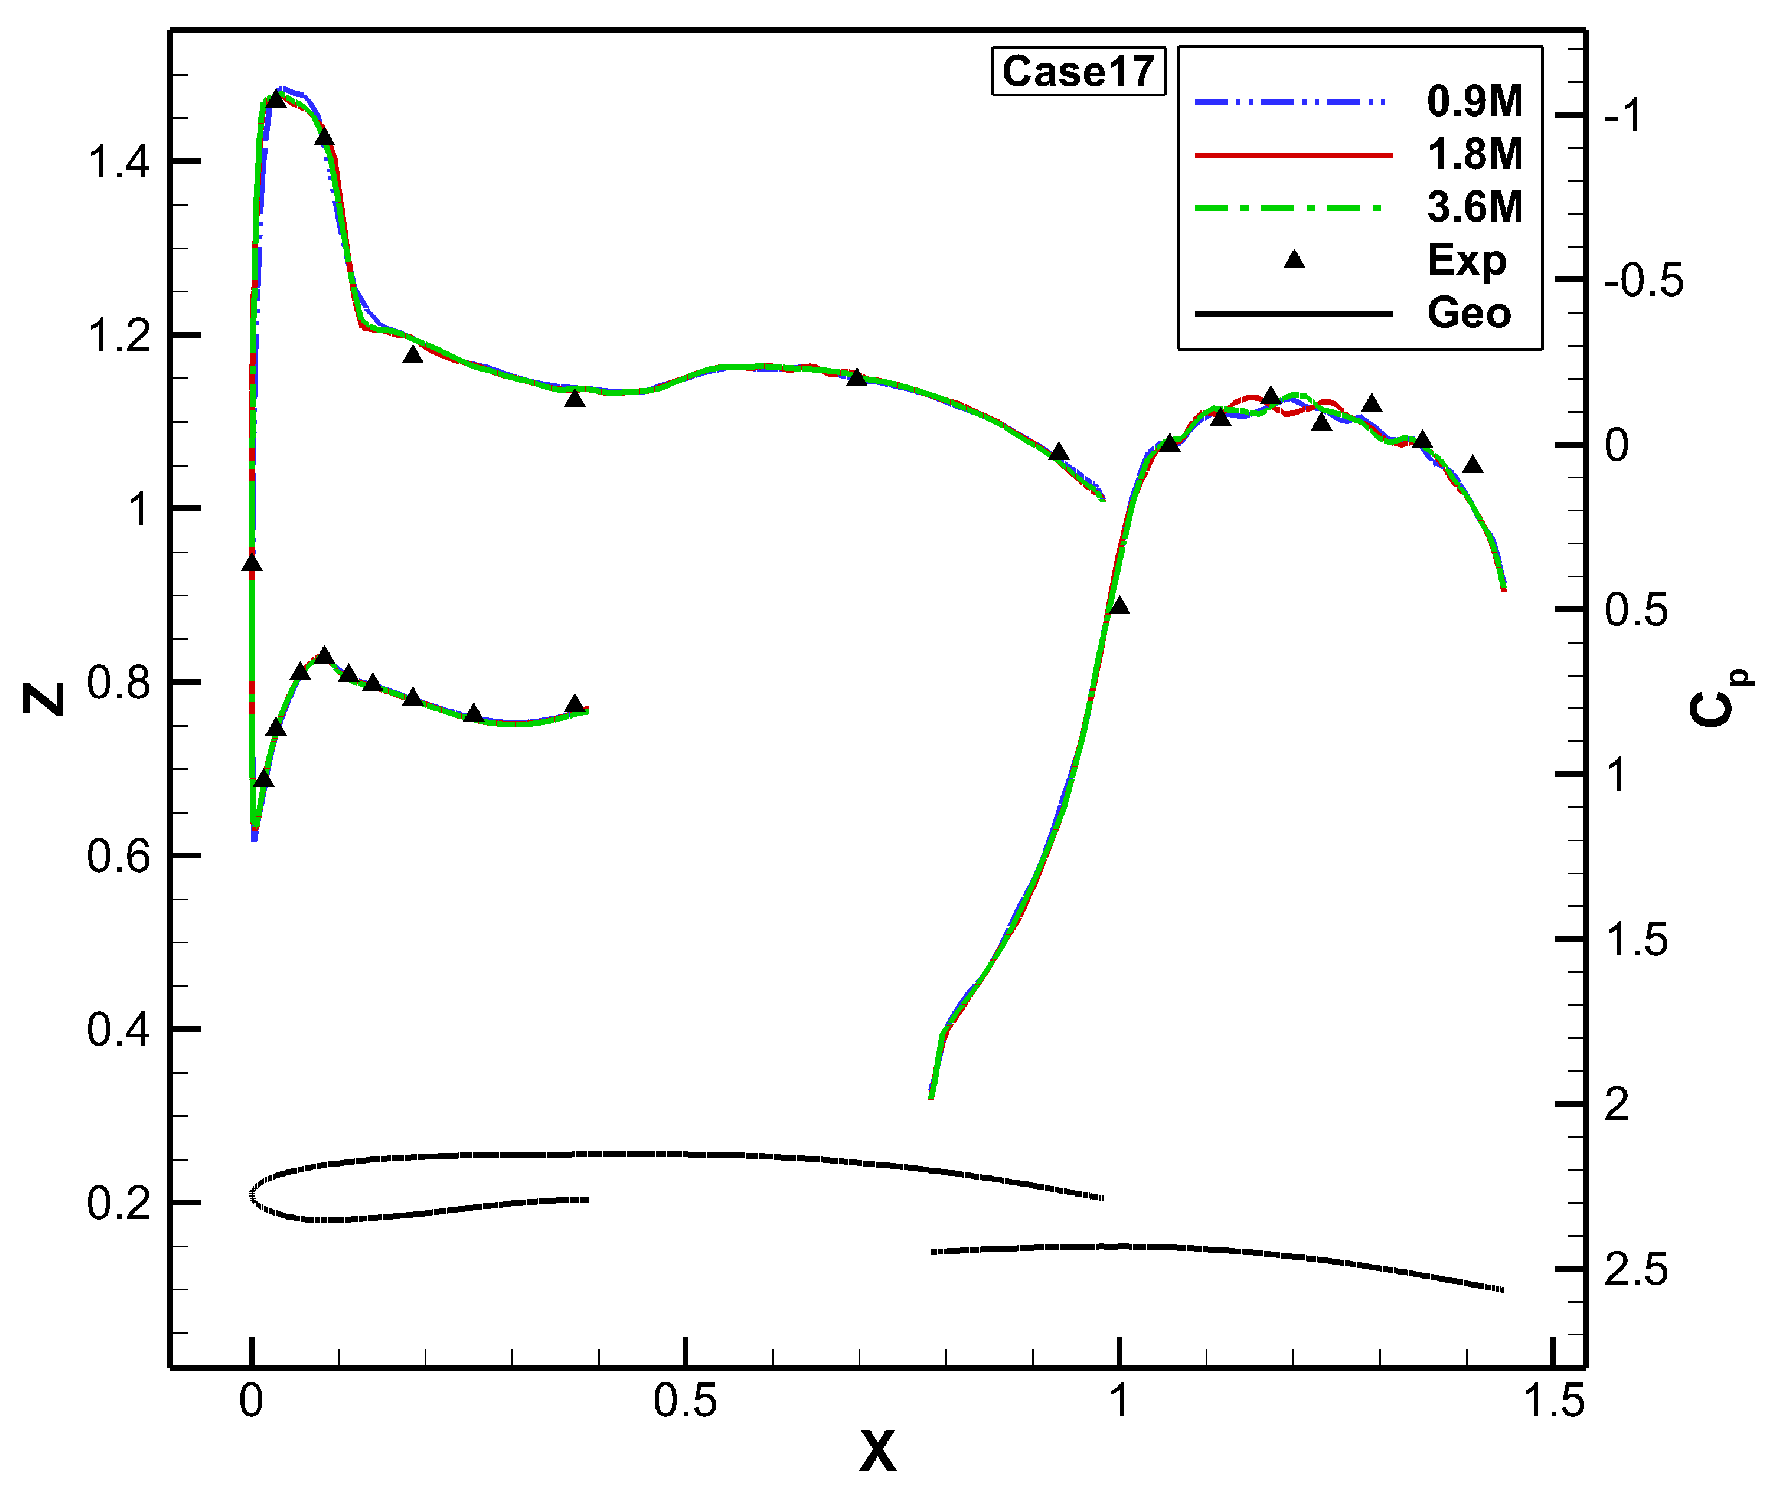
Figure 3 presents a comparison between the numerically simulated surface pressure coefficient distribution (ranging from 0.9 to 3.6 million cells) and wind tunnel experimental data (Exp) for the TPS engine model. In the figure, the horizontal axis X denotes the actual axial dimension, and Geo refers to the geometric profile of the engine. As shown, the computed pressure coefficient distributions on the surfaces of the nacelle inlet, outer cowl, and core fairing wall of the 1.8 million-cell case agree well with the experimental results, thereby validating the reliability of the numerical simulation method.
It should be noted that the TPS case is used here as an indirect validation of the numerical method rather than a direct validation of the deployed thrust reverser full-aircraft configuration. The TPS model verifies the solver, turbulence model, propulsion boundary treatment, and mesh strategy for powered nacelle flow and surface pressure prediction. However, it does not fully reproduce the jet–airframe interaction, ground effect, sideslip, wind tunnel wall effect, or support-strut interference involved in the present configuration. Therefore, the following results should be interpreted mainly as numerical predictions of flow mechanisms and relative variation trends. Direct validation using thrust reverser or full-aircraft wind tunnel data will be pursued in future work.

3. Aerodynamic Characteristic Analysis of Scaled Thrust Reverser Wind Tunnel Test Configurations

This section conducts a fundamental aerodynamic characteristic analysis of a scaled civil aircraft thrust reverser configuration for wind tunnel testing using numerical simulation methods. Based on the established physical model and mesh generation, the force characteristics and flow field structures of the thrust reverser under various operating conditions are quantitatively investigated by varying the fan pressure ratio (FPR), freestream velocity, and sideslip angle.

3.1. Physical Model and Mesh Generation

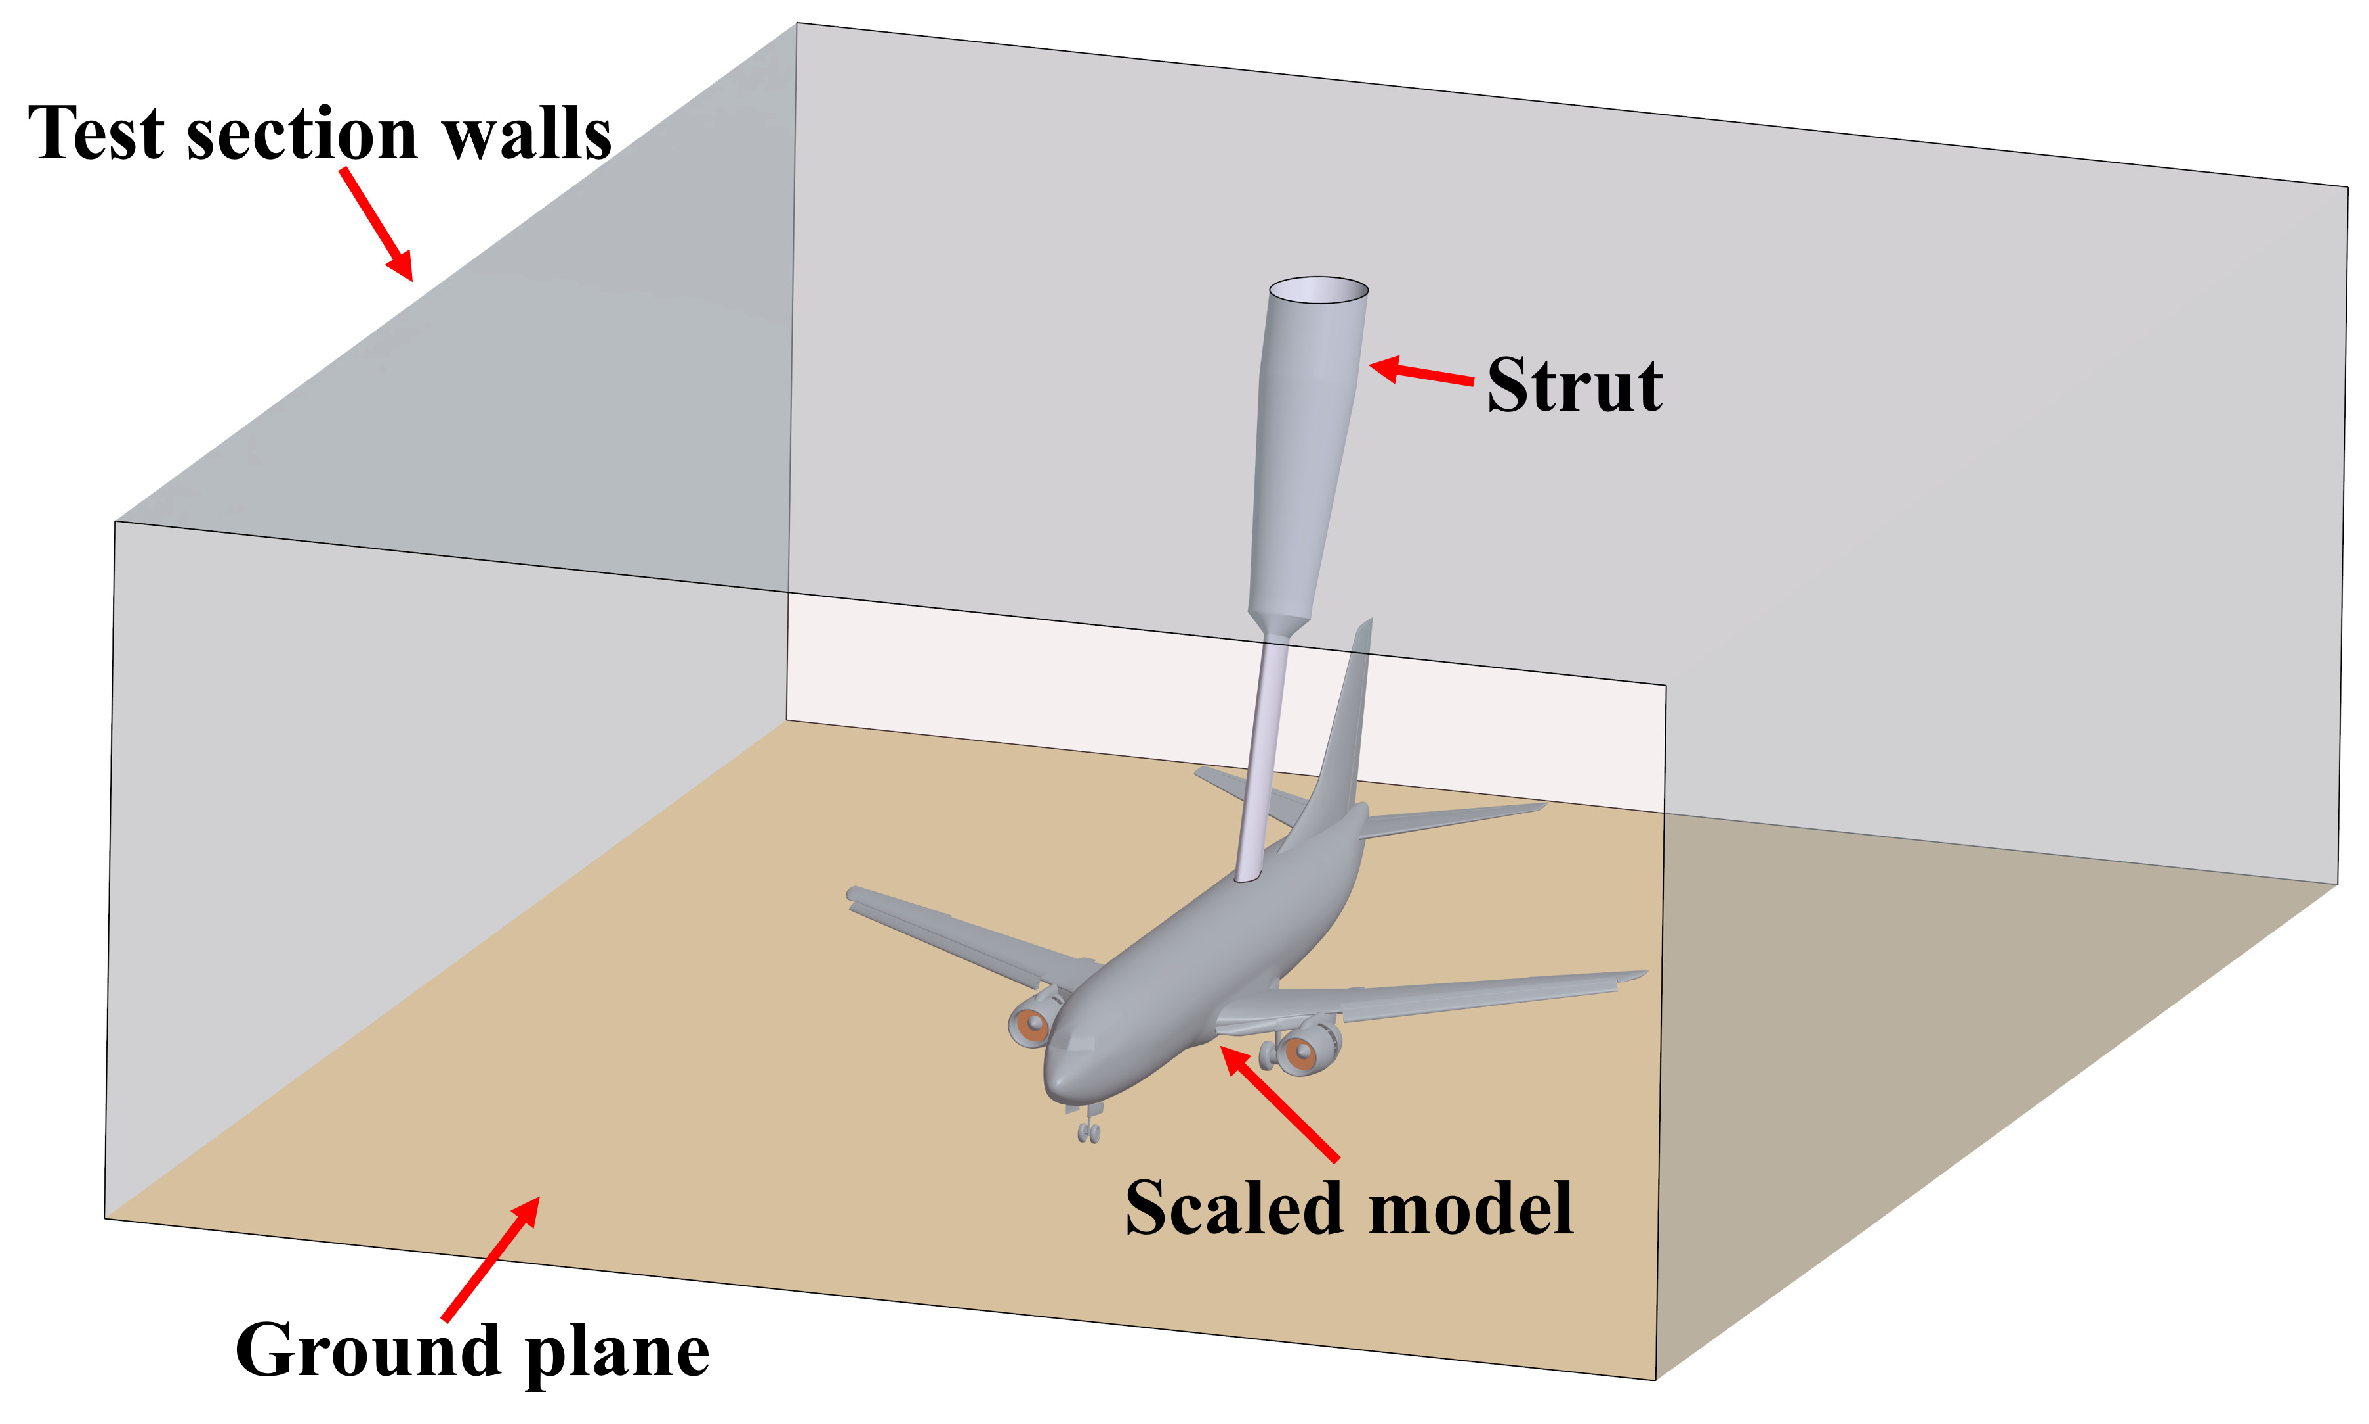
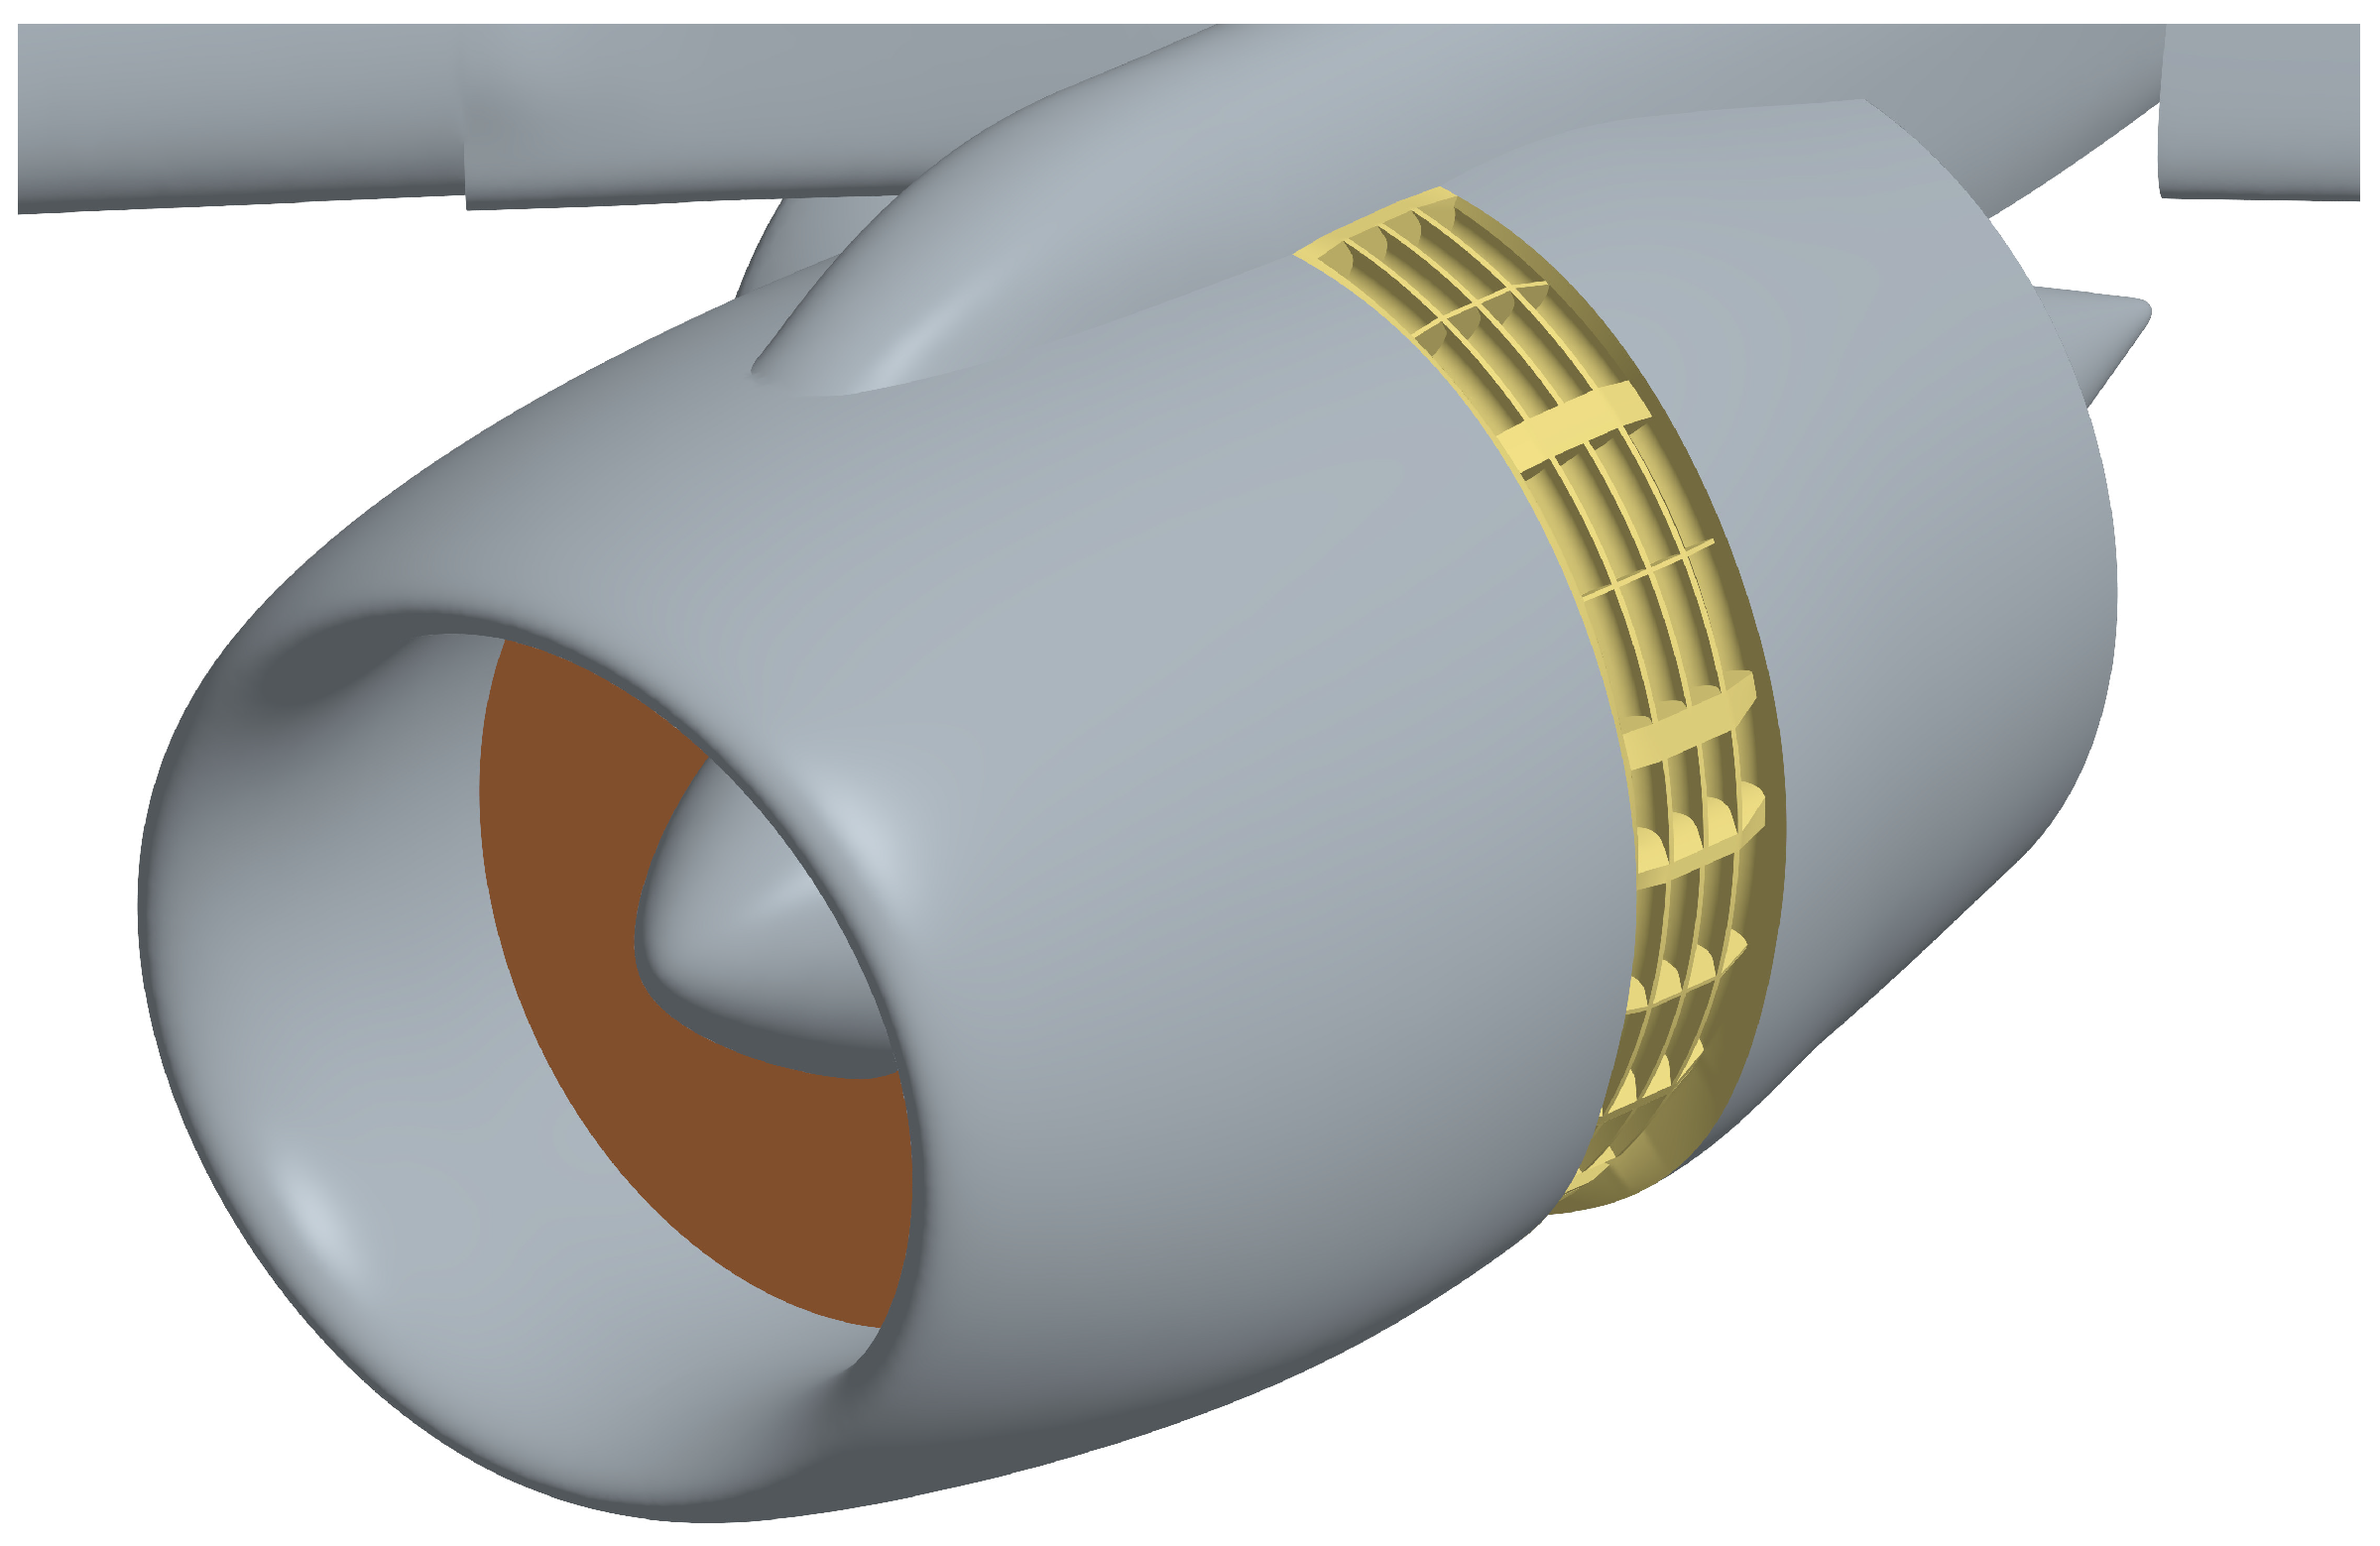
The research object is a 14.2–scale model of a specific civil aircraft, featuring a wing–body–tail–nacelle landing configuration with underwing-mounted engines. The aircraft model is symmetric about the centerline plane, with twin engines symmetrically positioned beneath the wings. The aircraft has a wingspan of 4.1 m and a reference area of 2.116 m2. The complete geometry encompasses key components such as the fuselage, wings, horizontal stabilizer, vertical stabilizer, nacelles, high-lift devices, and landing gear. Specifically, the engine bypass ducts are equipped with cascade-type thrust reversers, which generate reverse thrust by deflecting the bypass airflow. The numerical simulation model (Figure 4 and Figure 5) fully replicates the wind tunnel test environment, incorporating the test section walls, floor, and support structures, with dimensions of 10   m × 8   m × 3.5   m (L × W × H).
A dimensionless analysis was conducted to clarify the similarity criteria of the model test. Since the present study mainly focuses on the interference effects among the reversed jet, the external freestream, the nacelle, the wing/body, and the ground, and because the characteristic length of the scaled model is relatively small, it is difficult to simultaneously satisfy Mach number similarity and full-scale Reynolds number similarity under conventional wind tunnel conditions. Therefore, the test design mainly followed the principles of Mach number similarity and dynamic similarity.
First, geometric similarity between the model and the prototype was maintained. Second, the freestream Mach number in the test was kept consistent with that of the target operating condition to ensure the comparability of the compressibility effects in the external flow. In terms of dynamic similarity, it was achieved by matching the key aerodynamic boundary conditions of the engine, including the fan-inlet static pressure, the total pressure and total temperature at the core exit, and the total pressure and total temperature at the bypass exit, with those of the prototype condition. These parameters determine the expansion state, exit velocity, mass flow rate, and jet momentum flux of the core and bypass flows, and therefore can characterize the dynamic driving characteristics of the reversed jet.
The boundary conditions for the numerical simulation of the scaled thrust reverser wind tunnel test configuration are defined as follows: The wind tunnel inlet is assigned a velocity inlet boundary condition. For the static ground simulation, the floor is assigned a no-slip wall boundary condition. In the moving ground case, the ground is set with a translational velocity equal in magnitude and direction to the freestream. The wind tunnel outlet is defined as a pressure outlet boundary condition. The scaled model is assigned no-slip wall boundary conditions. The engine bypass and core boundaries are set as stagnation inlet boundary conditions, while the engine intake is defined as a pressure outlet boundary condition.
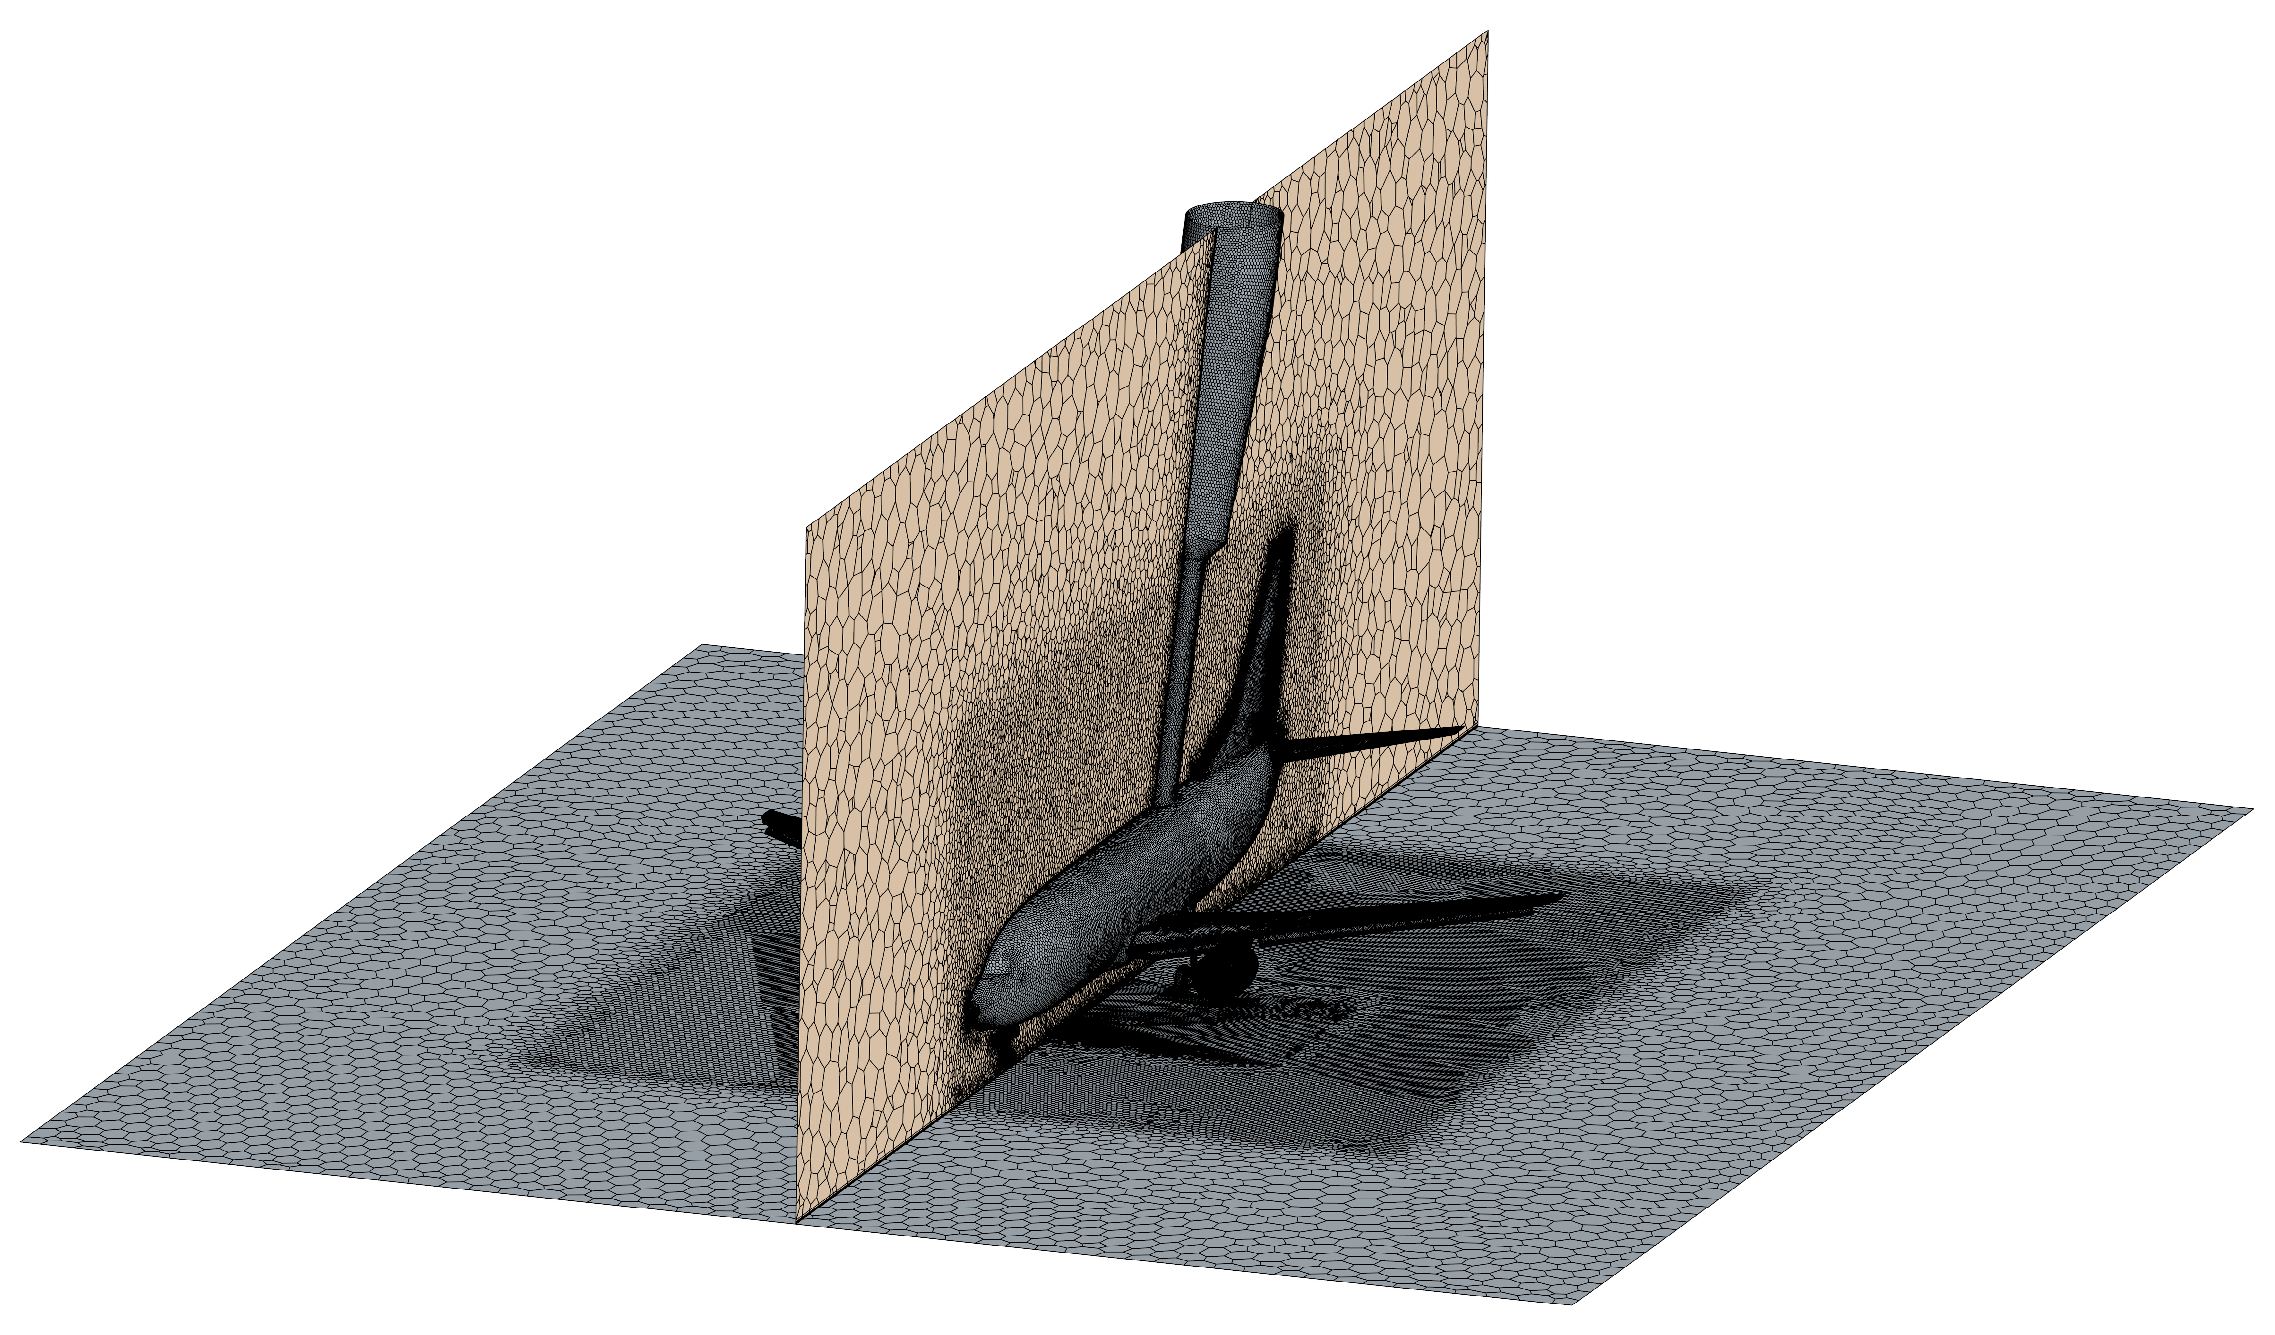
The computational domain utilizes a polyhedral unstructured mesh strategy. Local refinement zones are implemented in the vicinity of the thrust reverser to capture complex flow gradients, and 25 prism layers are generated on the solid walls to resolve the boundary layer. The first-layer cell height is specified to ensure that the dimensionless wall distance satisfies Y + 1 . Based on this, five sets of mesh configurations were designed and generated by adjusting the node density of the surface mesh. The ground is set as a moving ground. Steady-state simulations were then performed to select an appropriate mesh size.
The freestream Mach number is 0.2, and the static pressure and static temperature are p = 101,325   P a and T = 288.15   K . The fan-inlet static pressure is 96,500 Pa. The bypass pressure ratio (FPR), defined as the ratio of the total pressure at the bypass nozzle exit to the ambient static pressure, is 1.25, with a total temperature of 308 K. The core duct total pressure is 113,500 Pa, and its total temperature is 296 K. During the simulations, the residual convergence limit for all governing equations was set to 10−5.
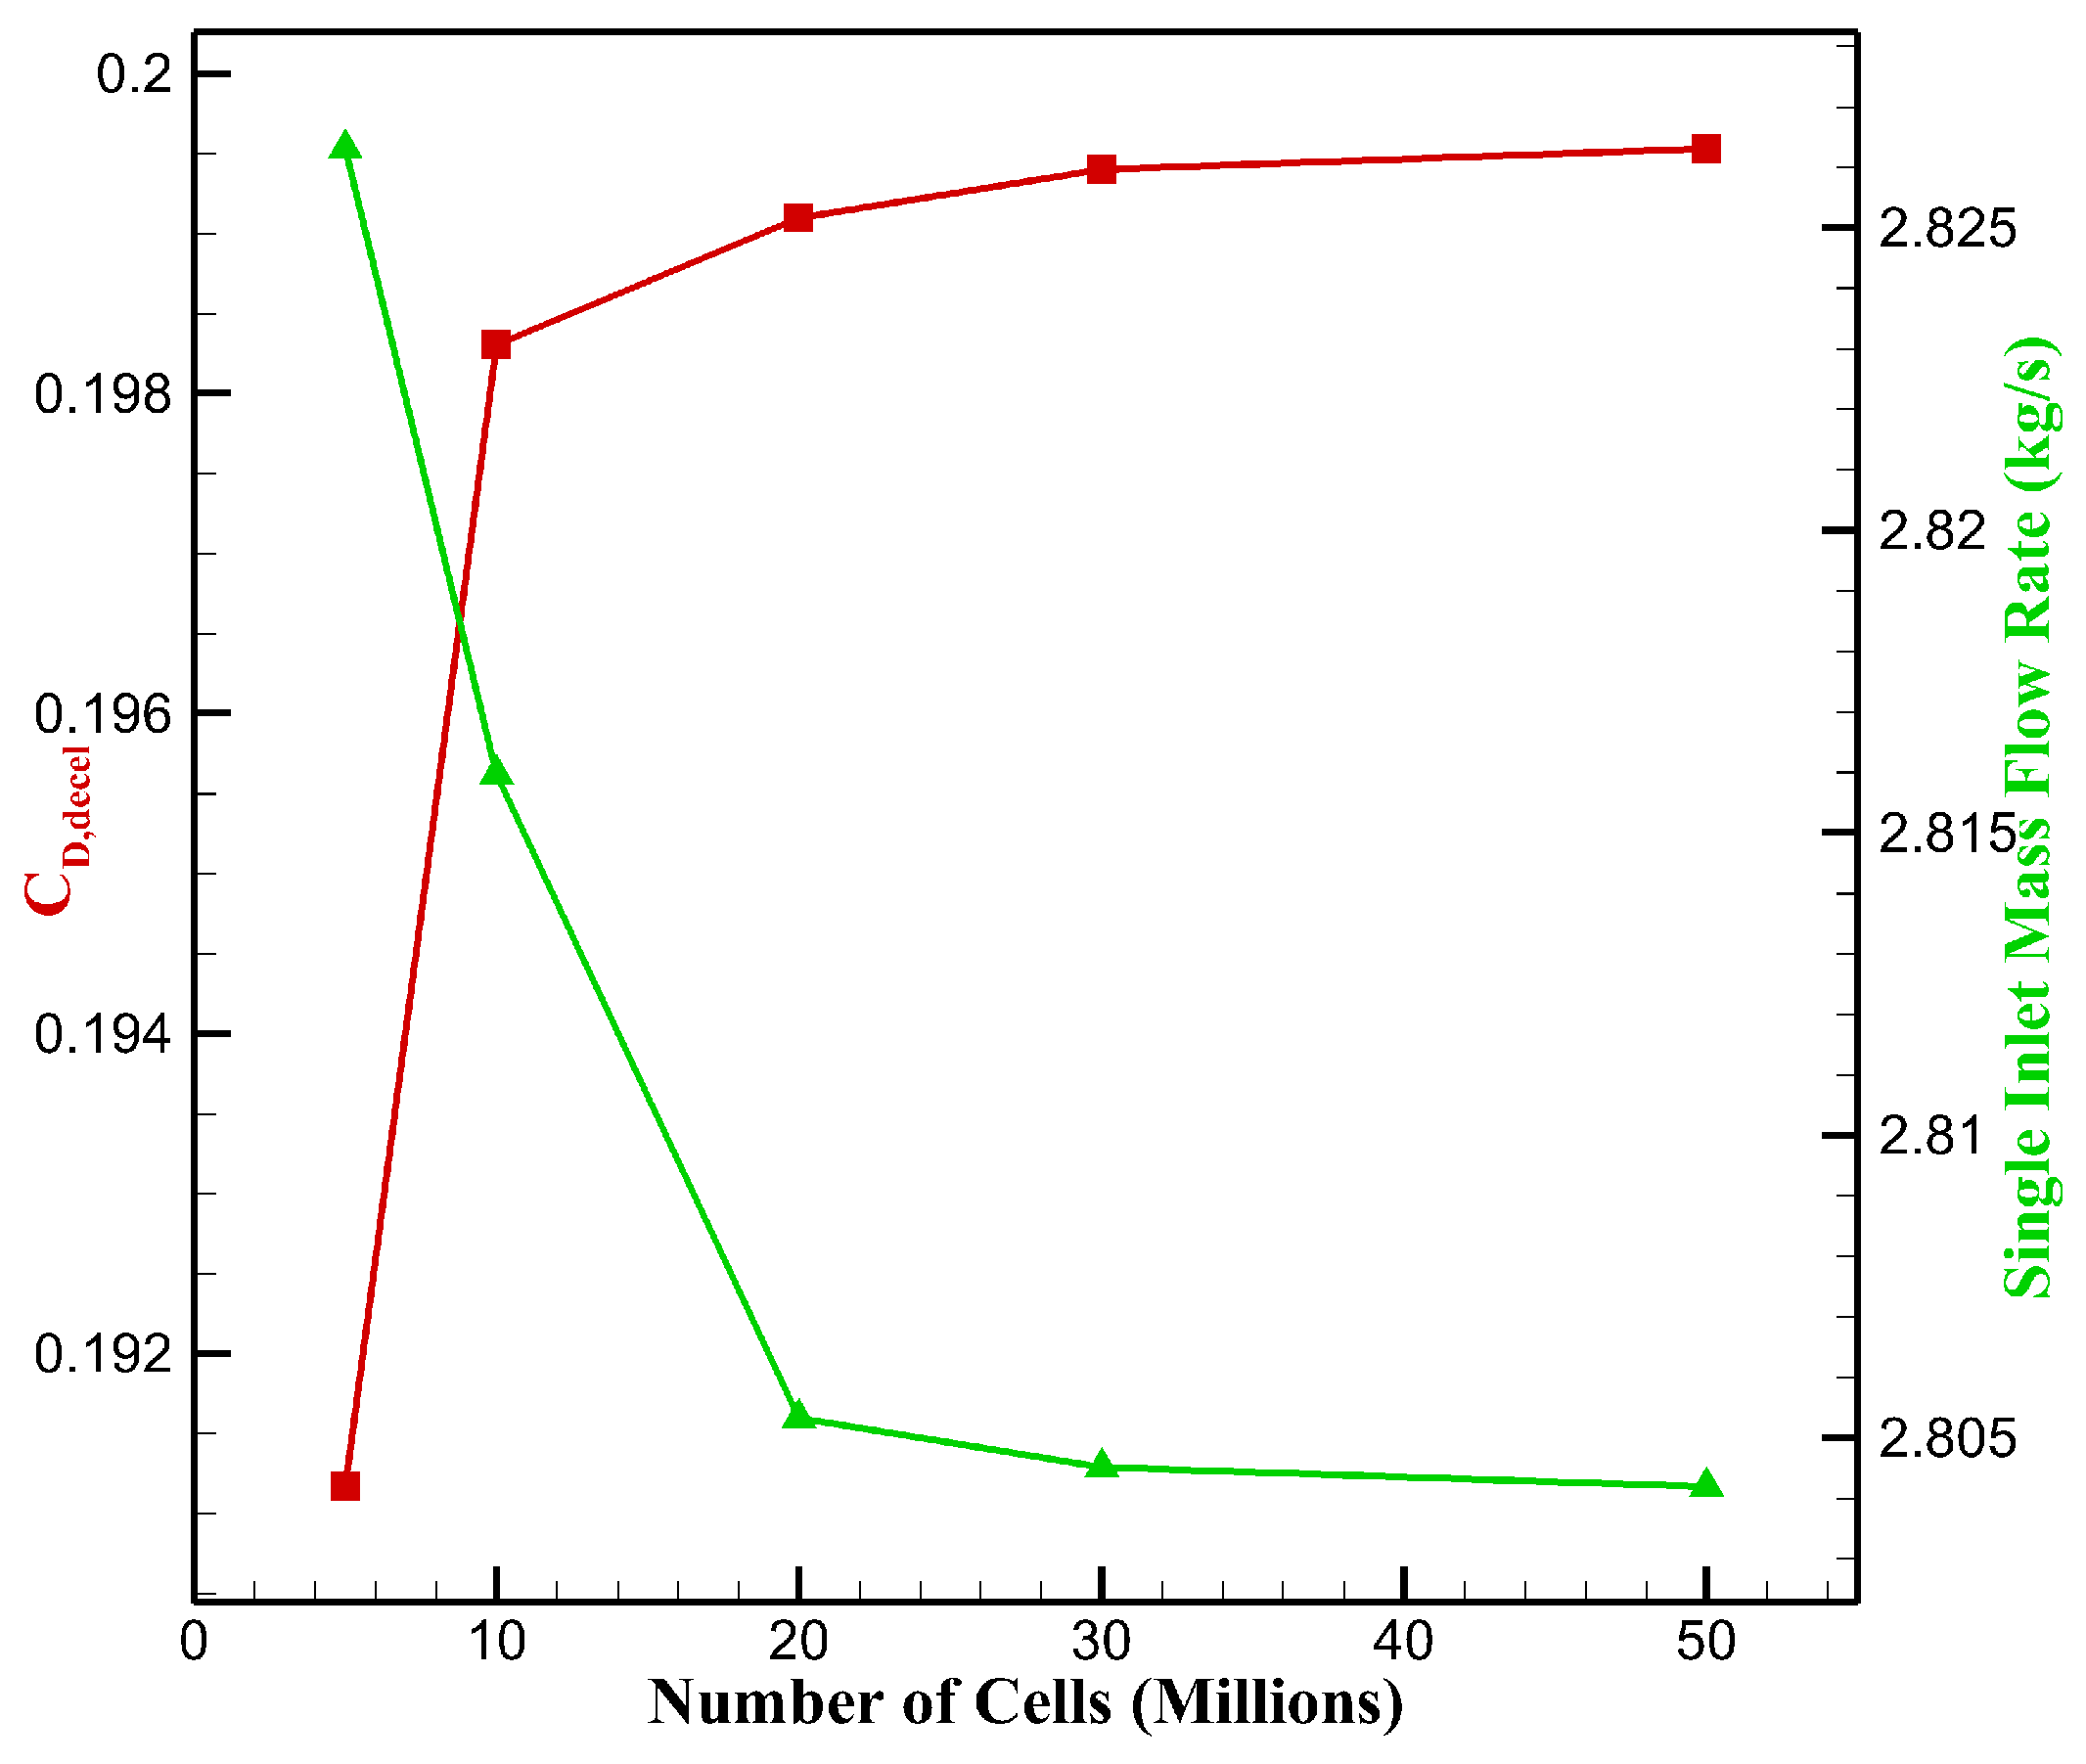
Figure 6 illustrates the variations of the deceleration force coefficient (CD,decel) and the single engine inlet mass flow rate with respect to the number of cells. It can be observed that the grid count exerts a certain impact on the numerical results; however, when the number of cells exceeds 30 million, the variation in the computational results becomes virtually negligible. Considering the trade-off between computational accuracy and efficiency, a mesh scale of 30 million cells was ultimately selected for subsequent simulations. The grid of the computational domain is depicted in Figure 7.

3.2. Effects of Fan Pressure Ratio and Freestream Velocity on Aerodynamic Characteristics

To comprehensively assess the coupled influence of the FPR and freestream velocity on the fundamental aerodynamic characteristics of the scaled thrust reverser configuration, a matrix of operating conditions is selected. These cases combine typical low-speed Mach numbers encountered during landing rollout with bypass FPR corresponding to various engine power settings. The evolution of the thrust reverser flow field under different dynamic and kinematic parameters is investigated through full-aircraft surface pressure coefficient (Cp) contours and streamline topologies. Furthermore, the reverse thrust generated by the nacelle and the drag forces acting on the remainder of the airframe are quantitatively extracted to elucidate the mechanism by which the thrust reverser contributes to the overall deceleration efficiency.
The freestream Mach numbers are set to 0.1 and 0.2. These values represent the critical landing rollout phase: Ma = 0.2 corresponds to the high-speed touchdown where reverse thrust is most effective, and Ma = 0.1 represents the low-speed taxiing condition. The bypass fan pressure ratio (FPR), defined as the ratio of the total pressure at the bypass nozzle exit to the ambient static pressure, is set at three typical states: 1.02, 1.25, and 1.35.
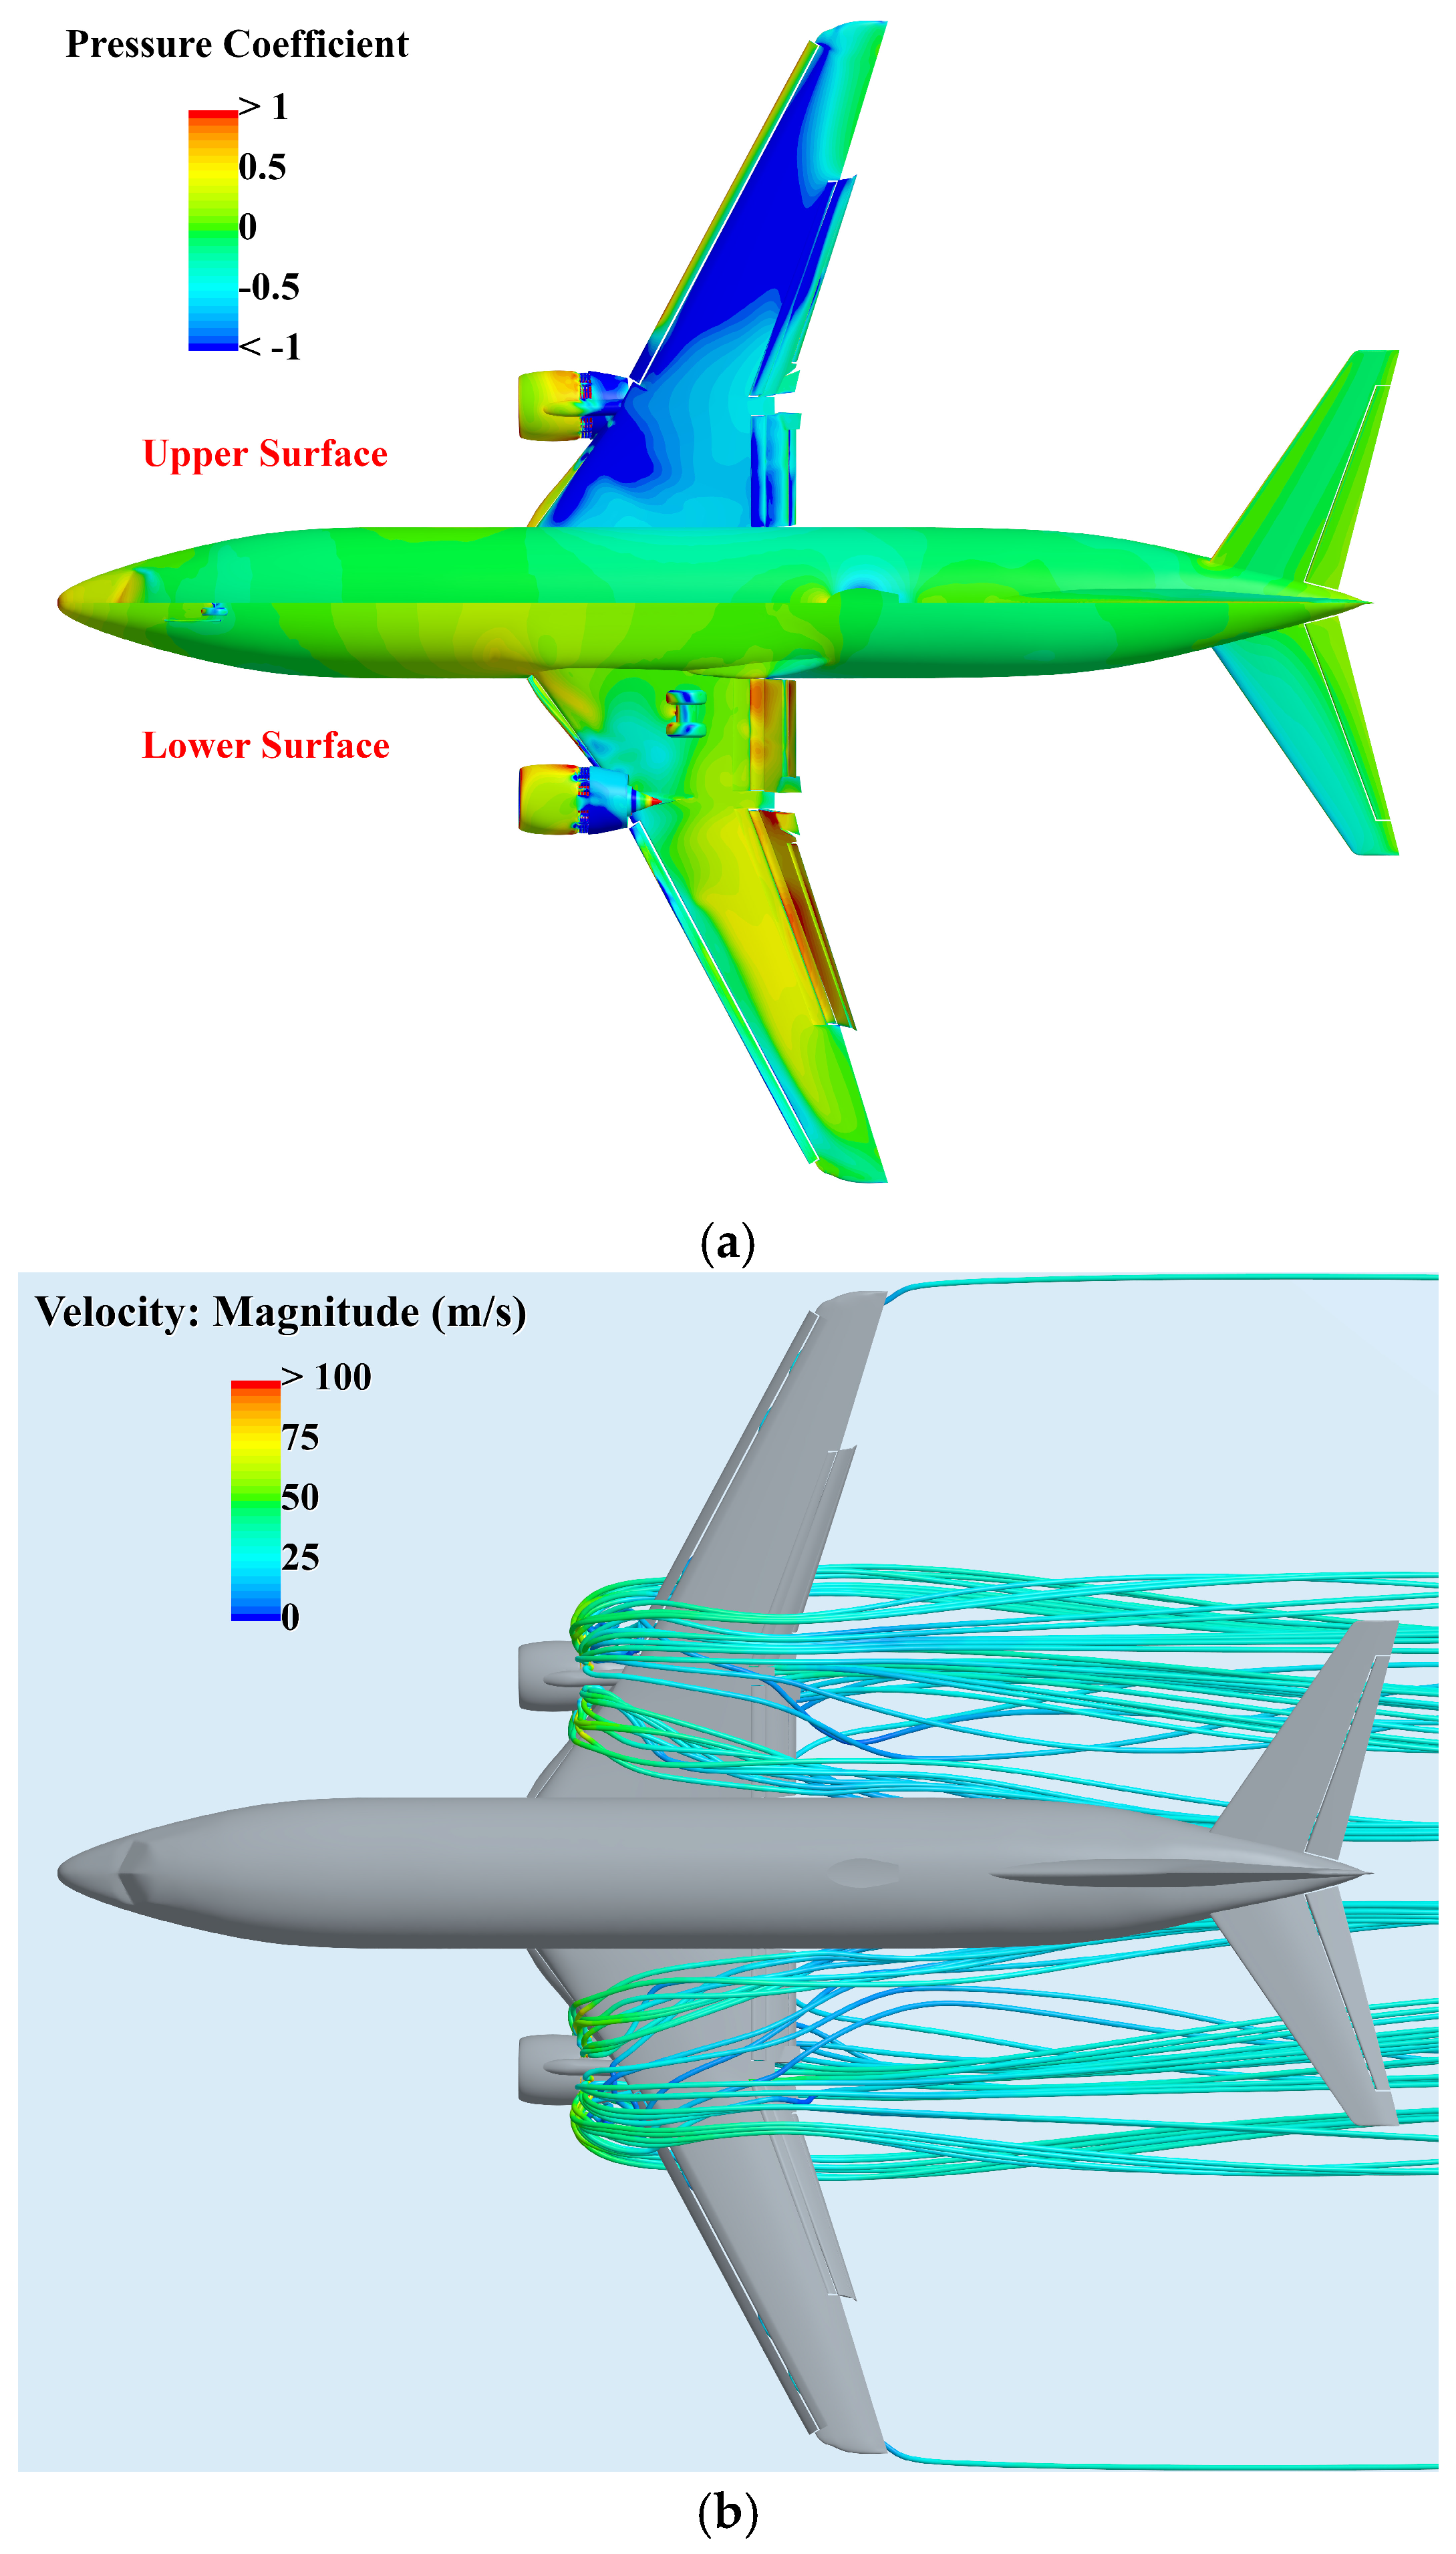
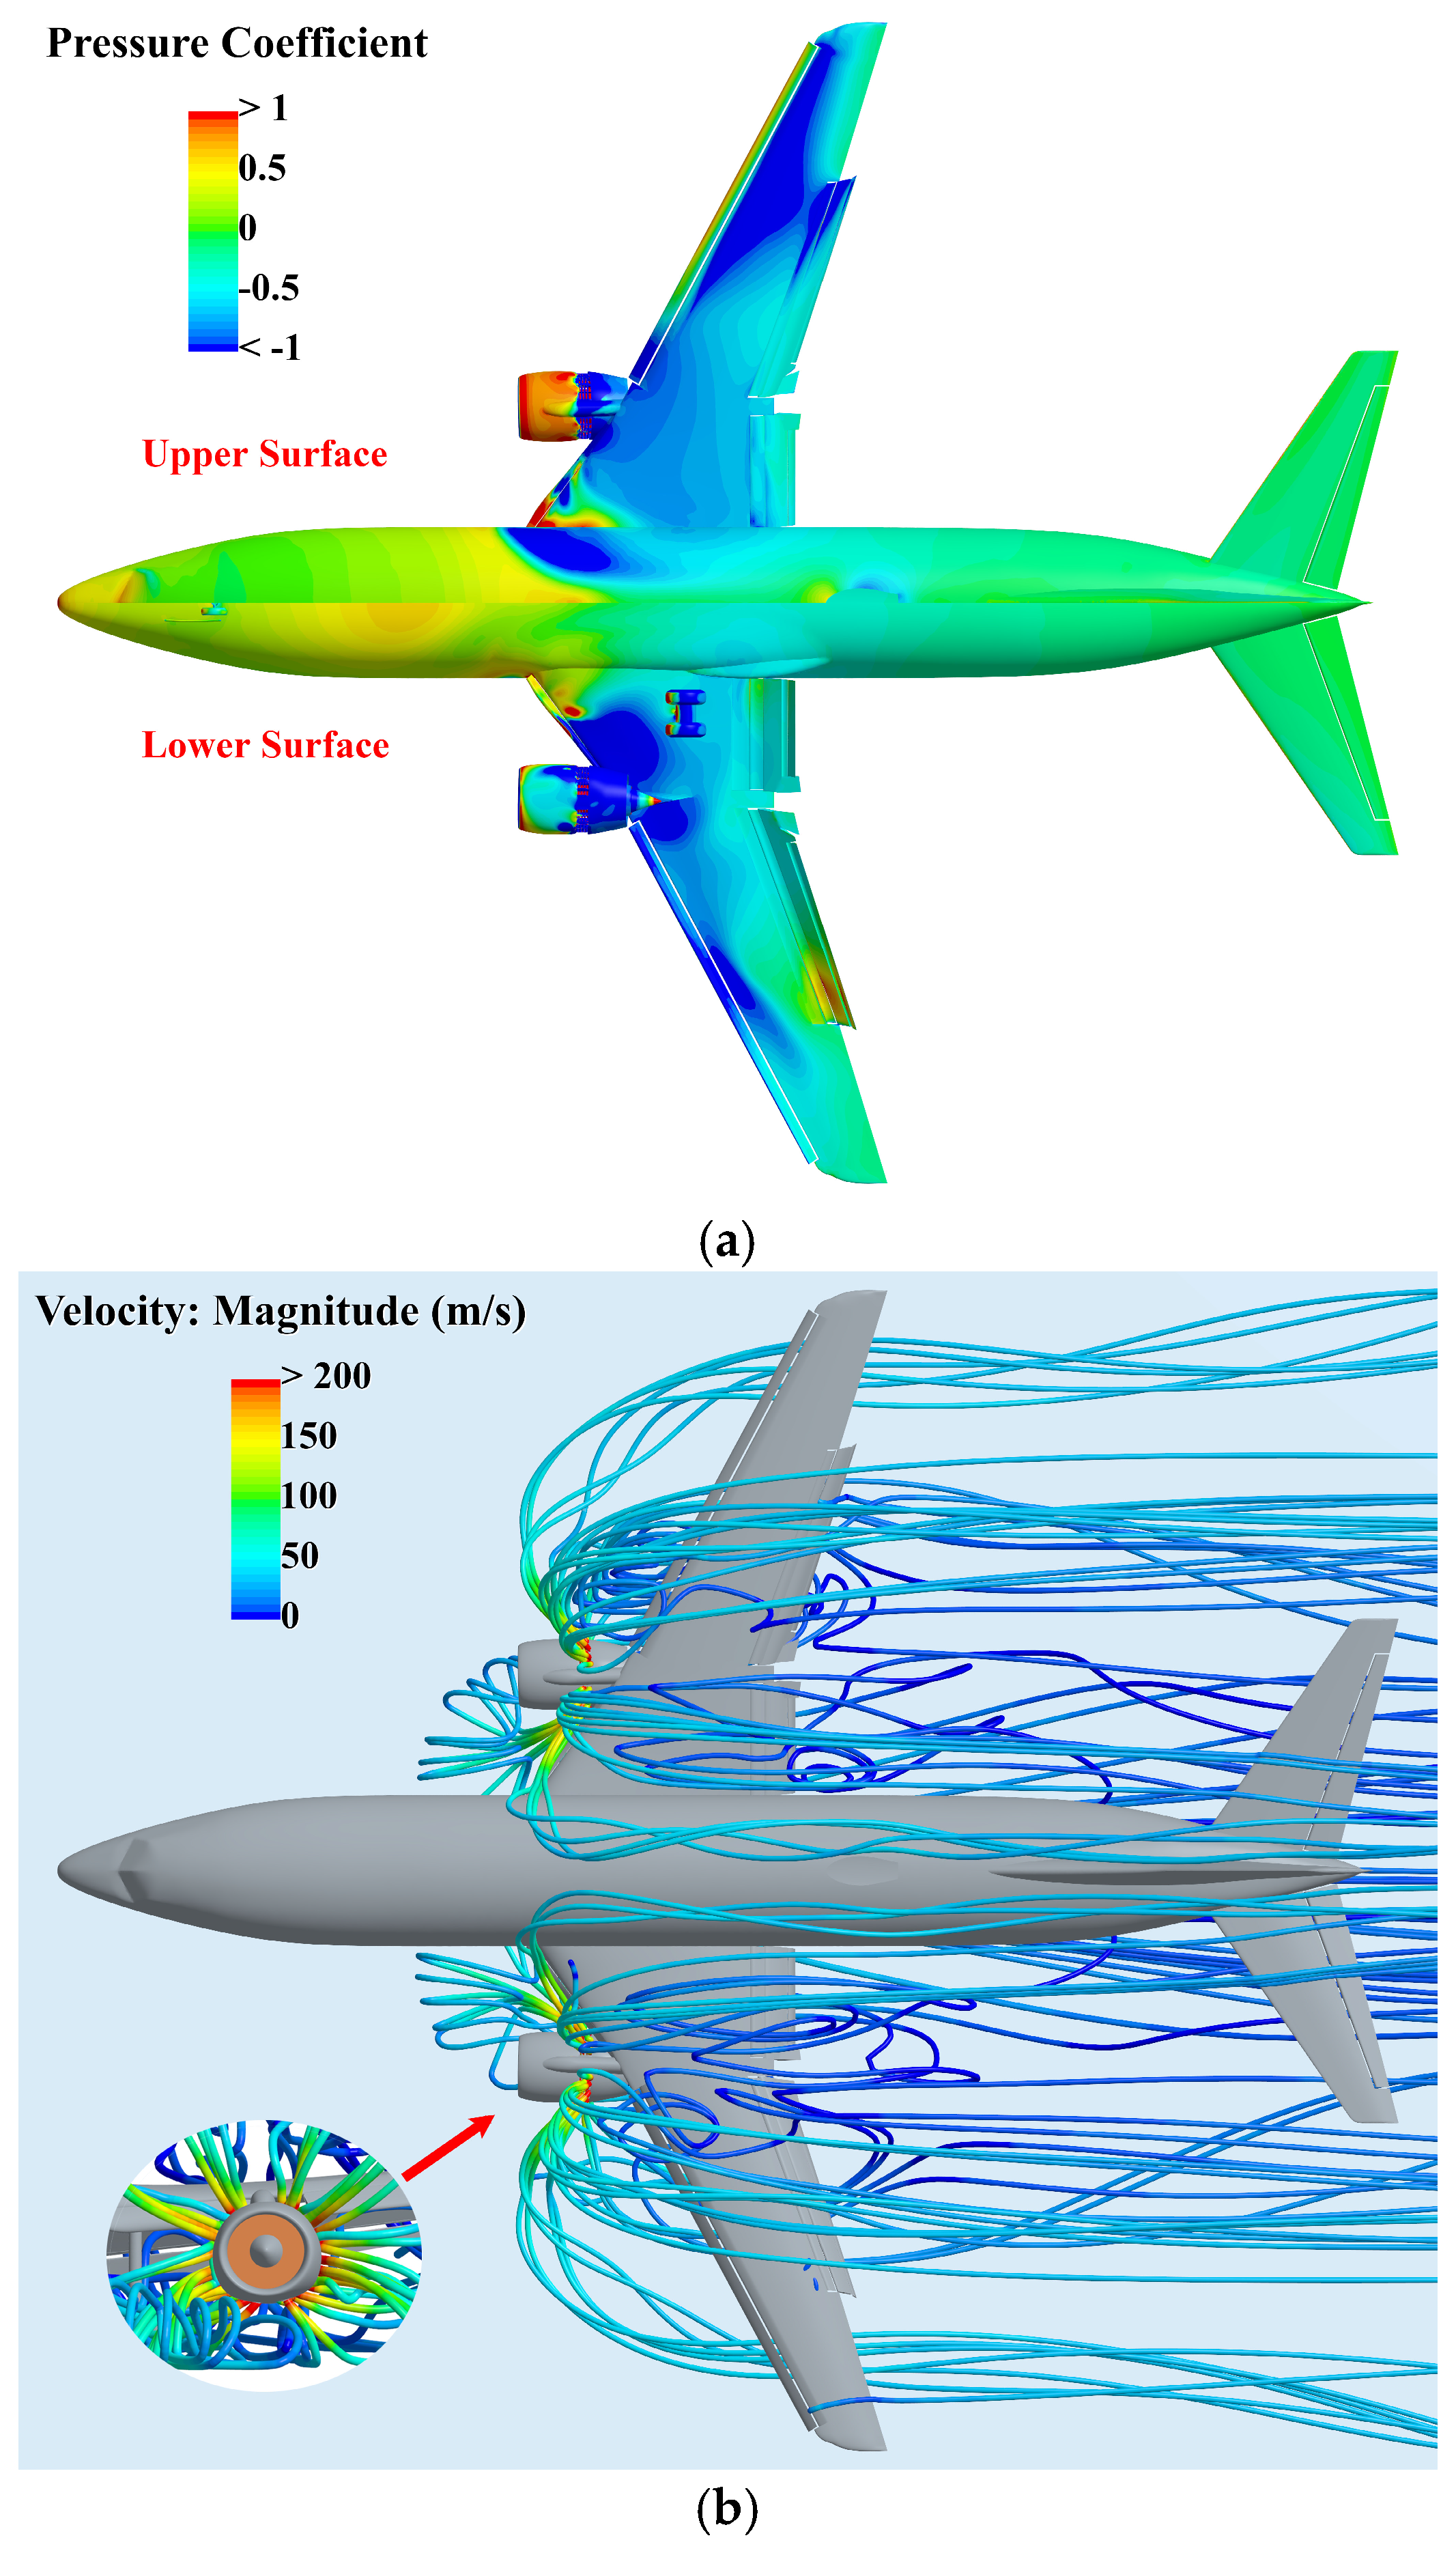
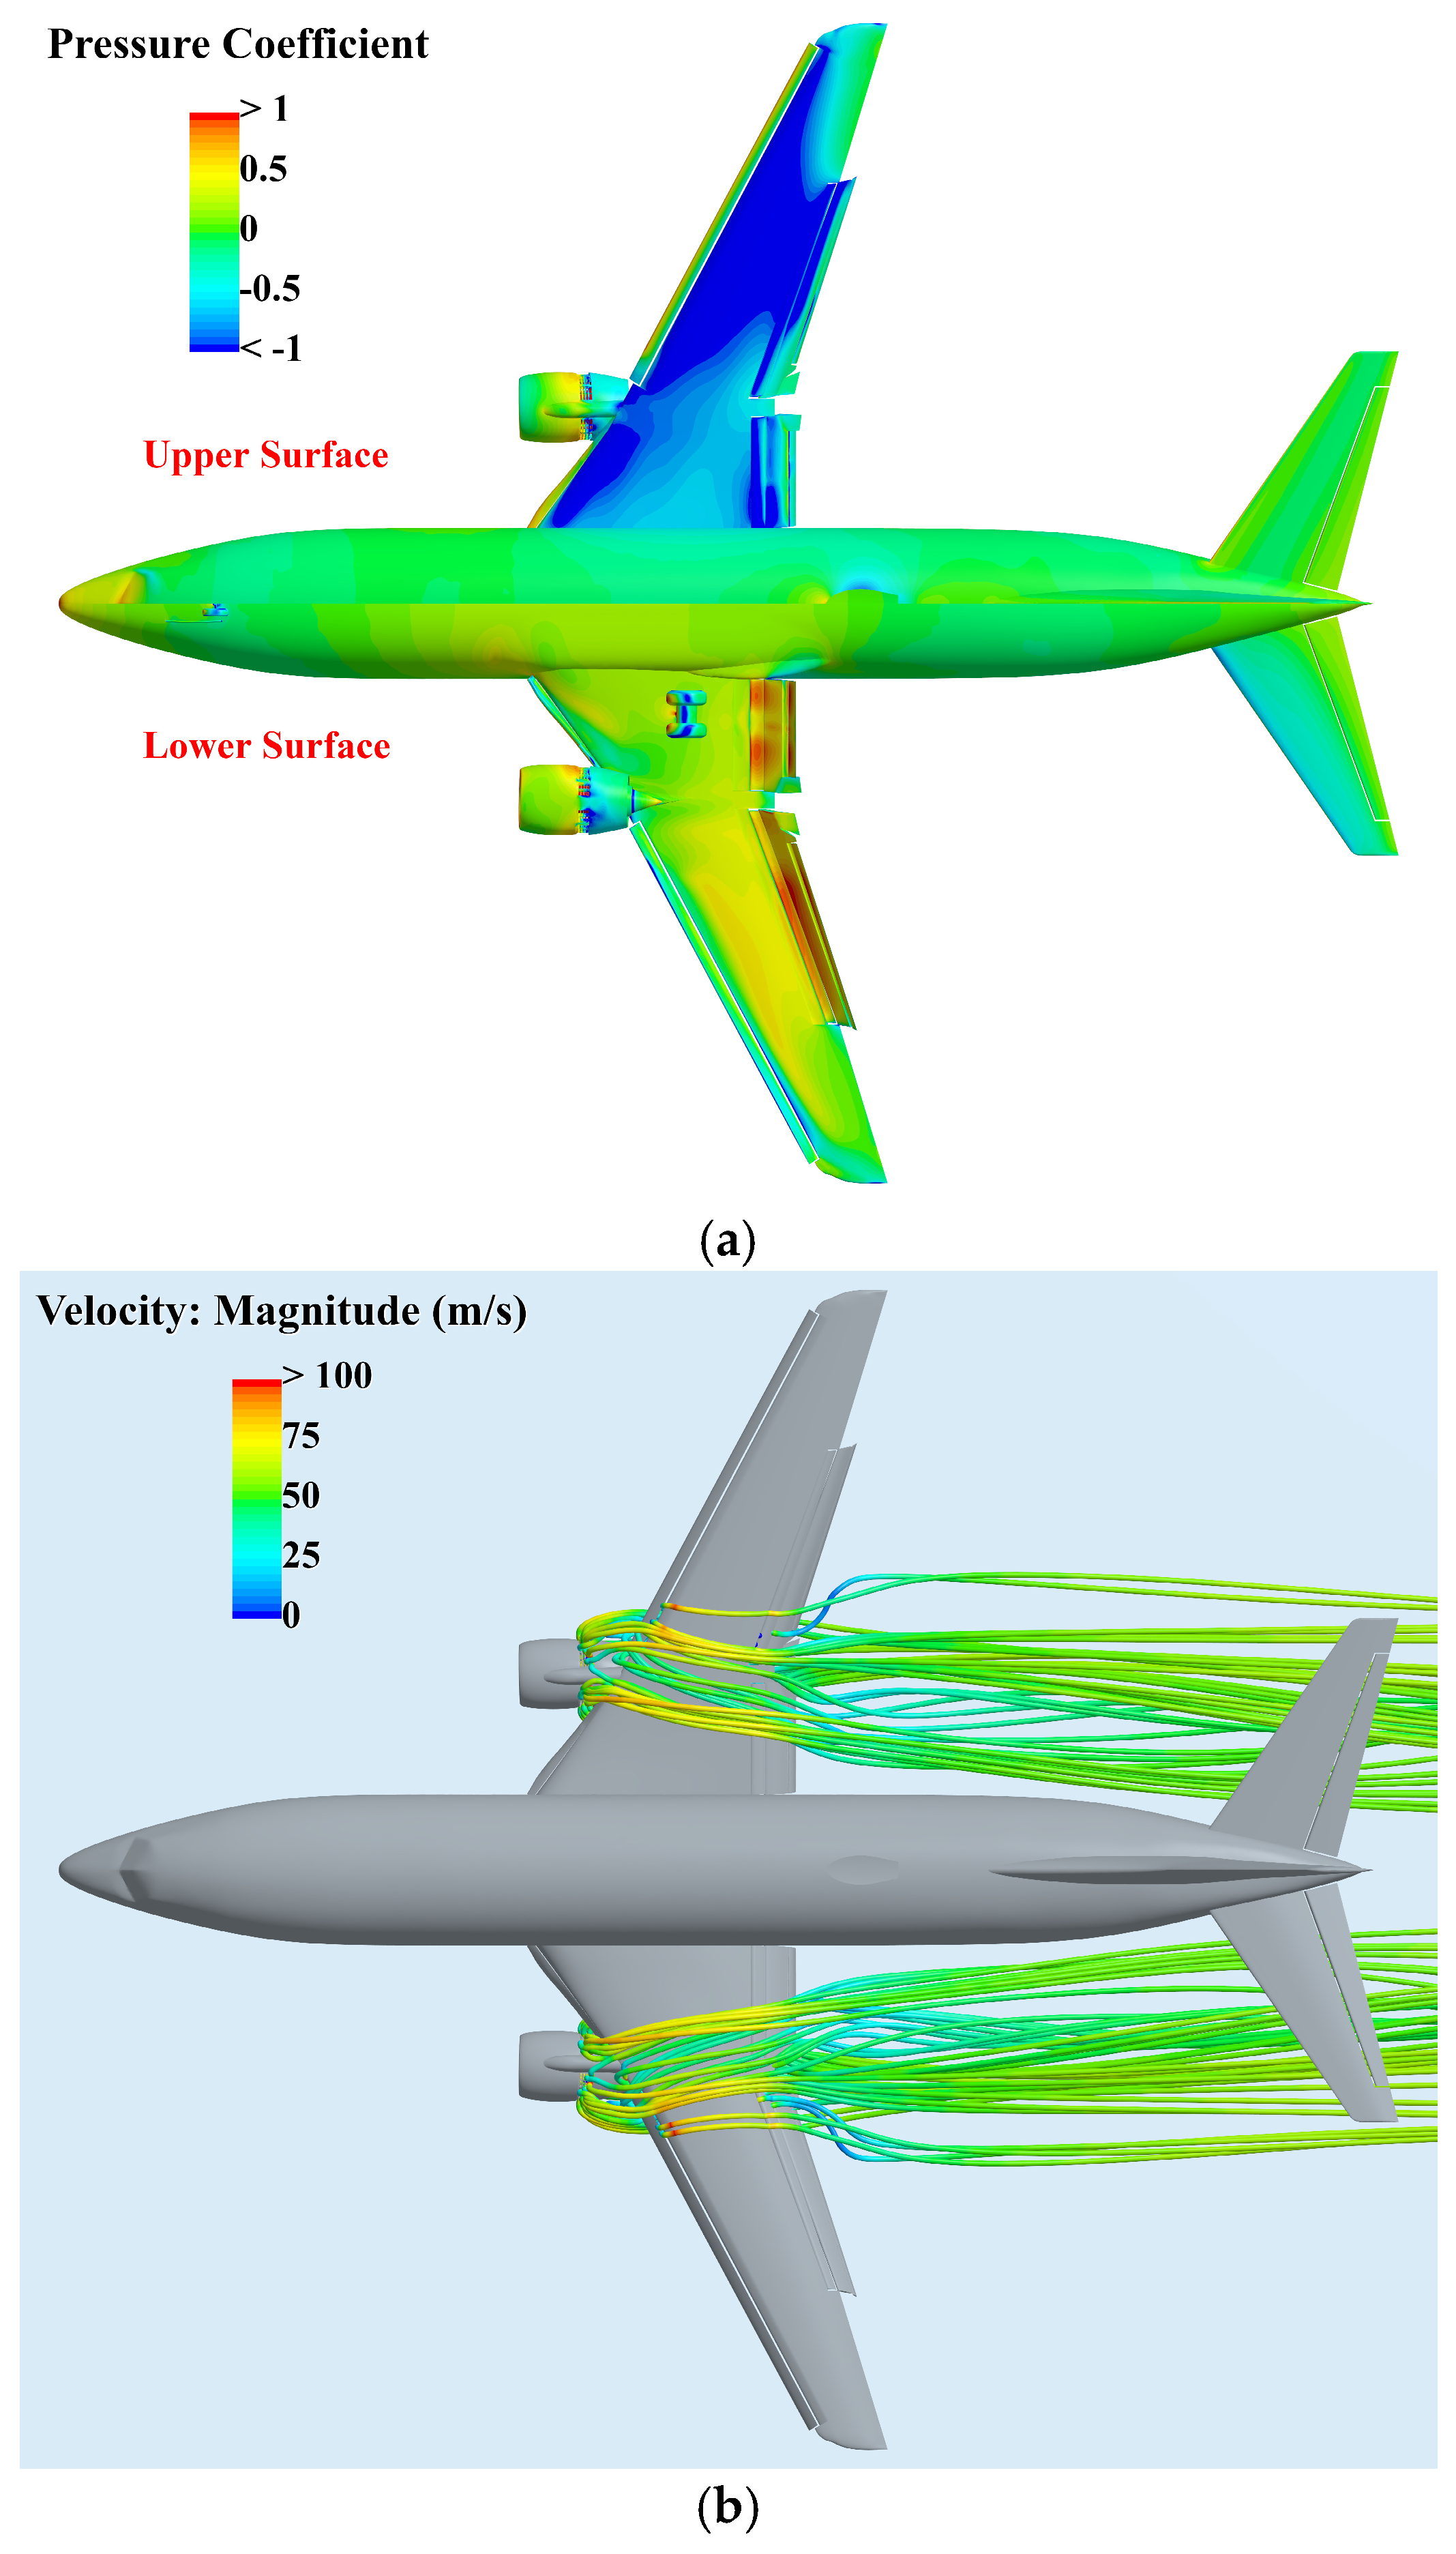
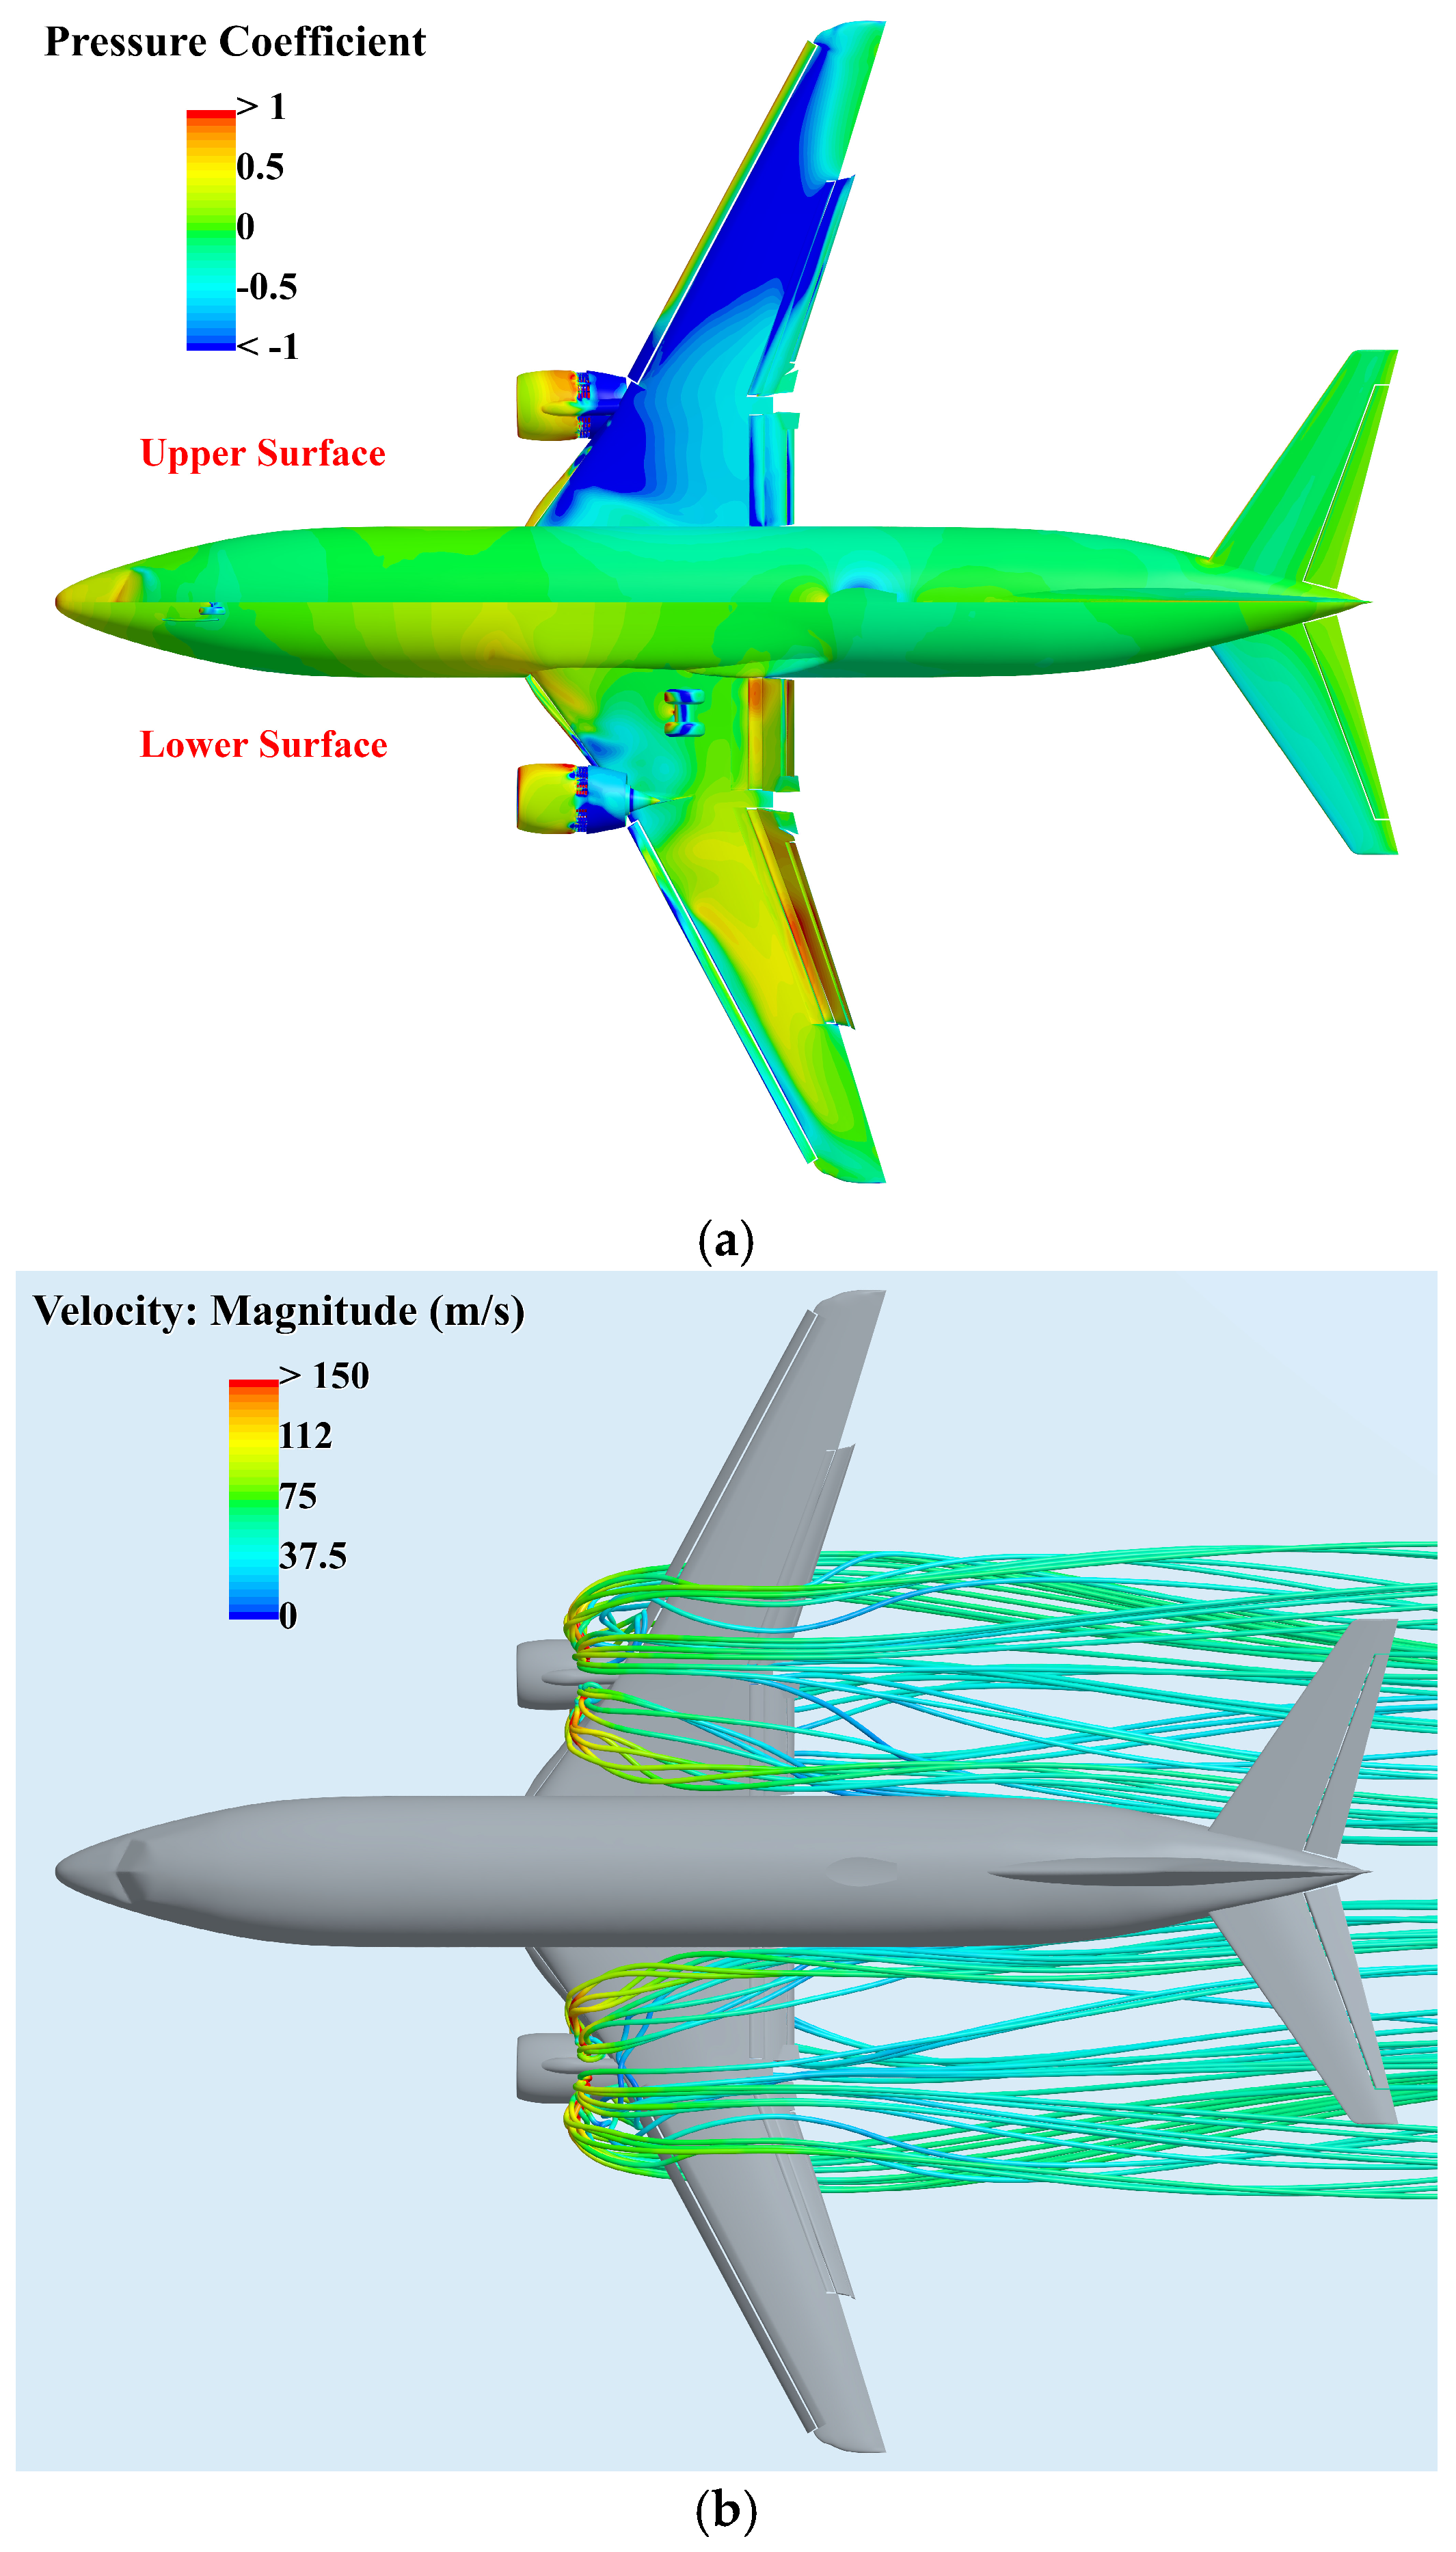
Figure 8, Figure 9 and Figure 10 illustrate the aircraft surface pressure contours and thrust reverser streamlines at a constant freestream Mach number for various FPR. These visualizations clearly reveal the evolutionary patterns of the thrust reverser flow field structure as a function of the pressure ratio, as well as the underlying interference mechanism affecting the fuselage surface pressure.
Under the extremely low pressure ratio condition (FPR = 1.02), the energy of the bypass exhaust is relatively low. The jet remains largely attached to the outer nacelle wall as it flows downstream, exerting minimal disturbance on the surrounding freestream. As the FPR further increases, the jet exhibits pronounced expansion characteristics and penetration capability. The high-energy flow not only expands in the spanwise direction but also undergoes significant displacement in the upstream direction, resulting in complex thrust reverser vortex systems. At an FPR of 1.35, the jet boundary extends beyond the nacelle leading edge and reaches the lateral regions of the fuselage, thereby disturbing the pressure distribution of the forward fuselage section. Despite the marked forward expansion of the jet, streamline tracing near the intake reveals that the reversed flow does not enter the engine inlet under this condition, indicating the absence of the re-ingestion phenomenon.
The evolution of the jet directly drives the redistribution of the airframe surface pressure. With the increase in FPR, the powerful obstruction of the high-energy jet against the external freestream induces distinct stagnation high-pressure zones (indicated by red regions) on the upper nacelle surface, the wing root leading edge, and localized fuselage areas. This aerodynamic blockage effect intensifies significantly as the pressure ratio rises. Concurrently, the entrainment effect of the reversed jet creates low-pressure suction zones (indicated by blue regions) aft of the nacelle and across localized areas of the wing lower surface. The interplay between high-pressure blockage and low-pressure suction leads to sharp variations in the pressure gradients across the wing.
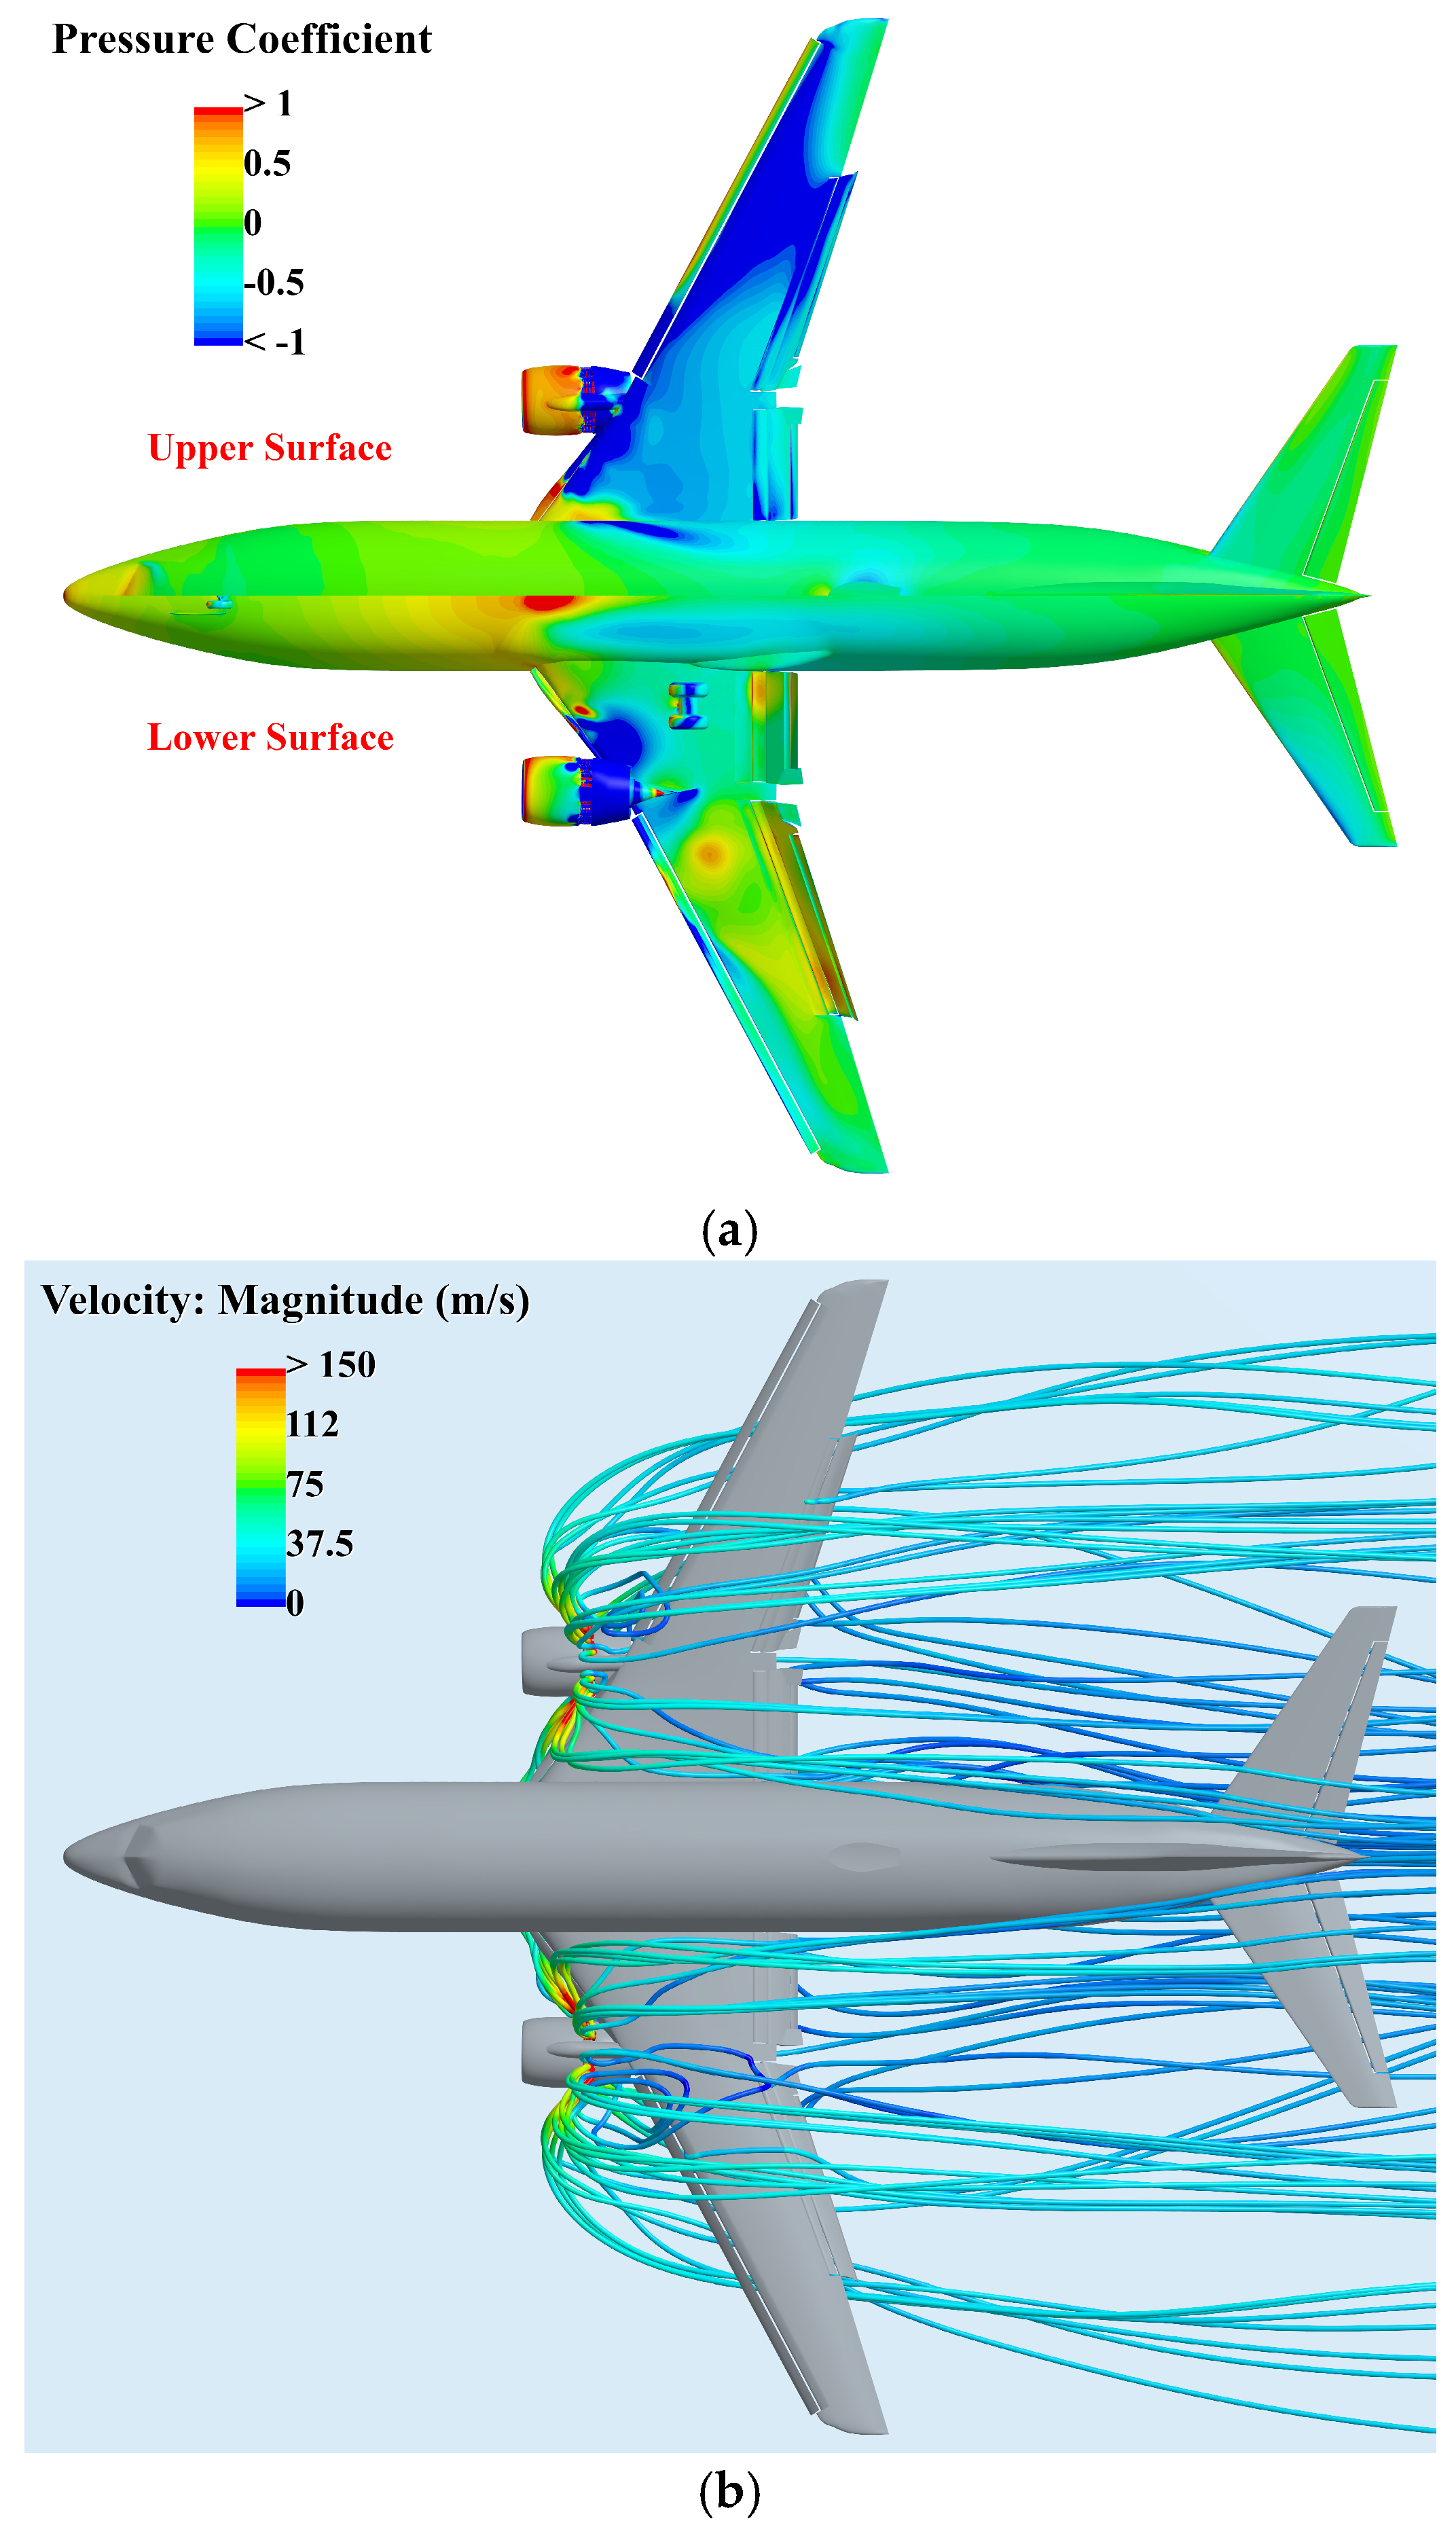
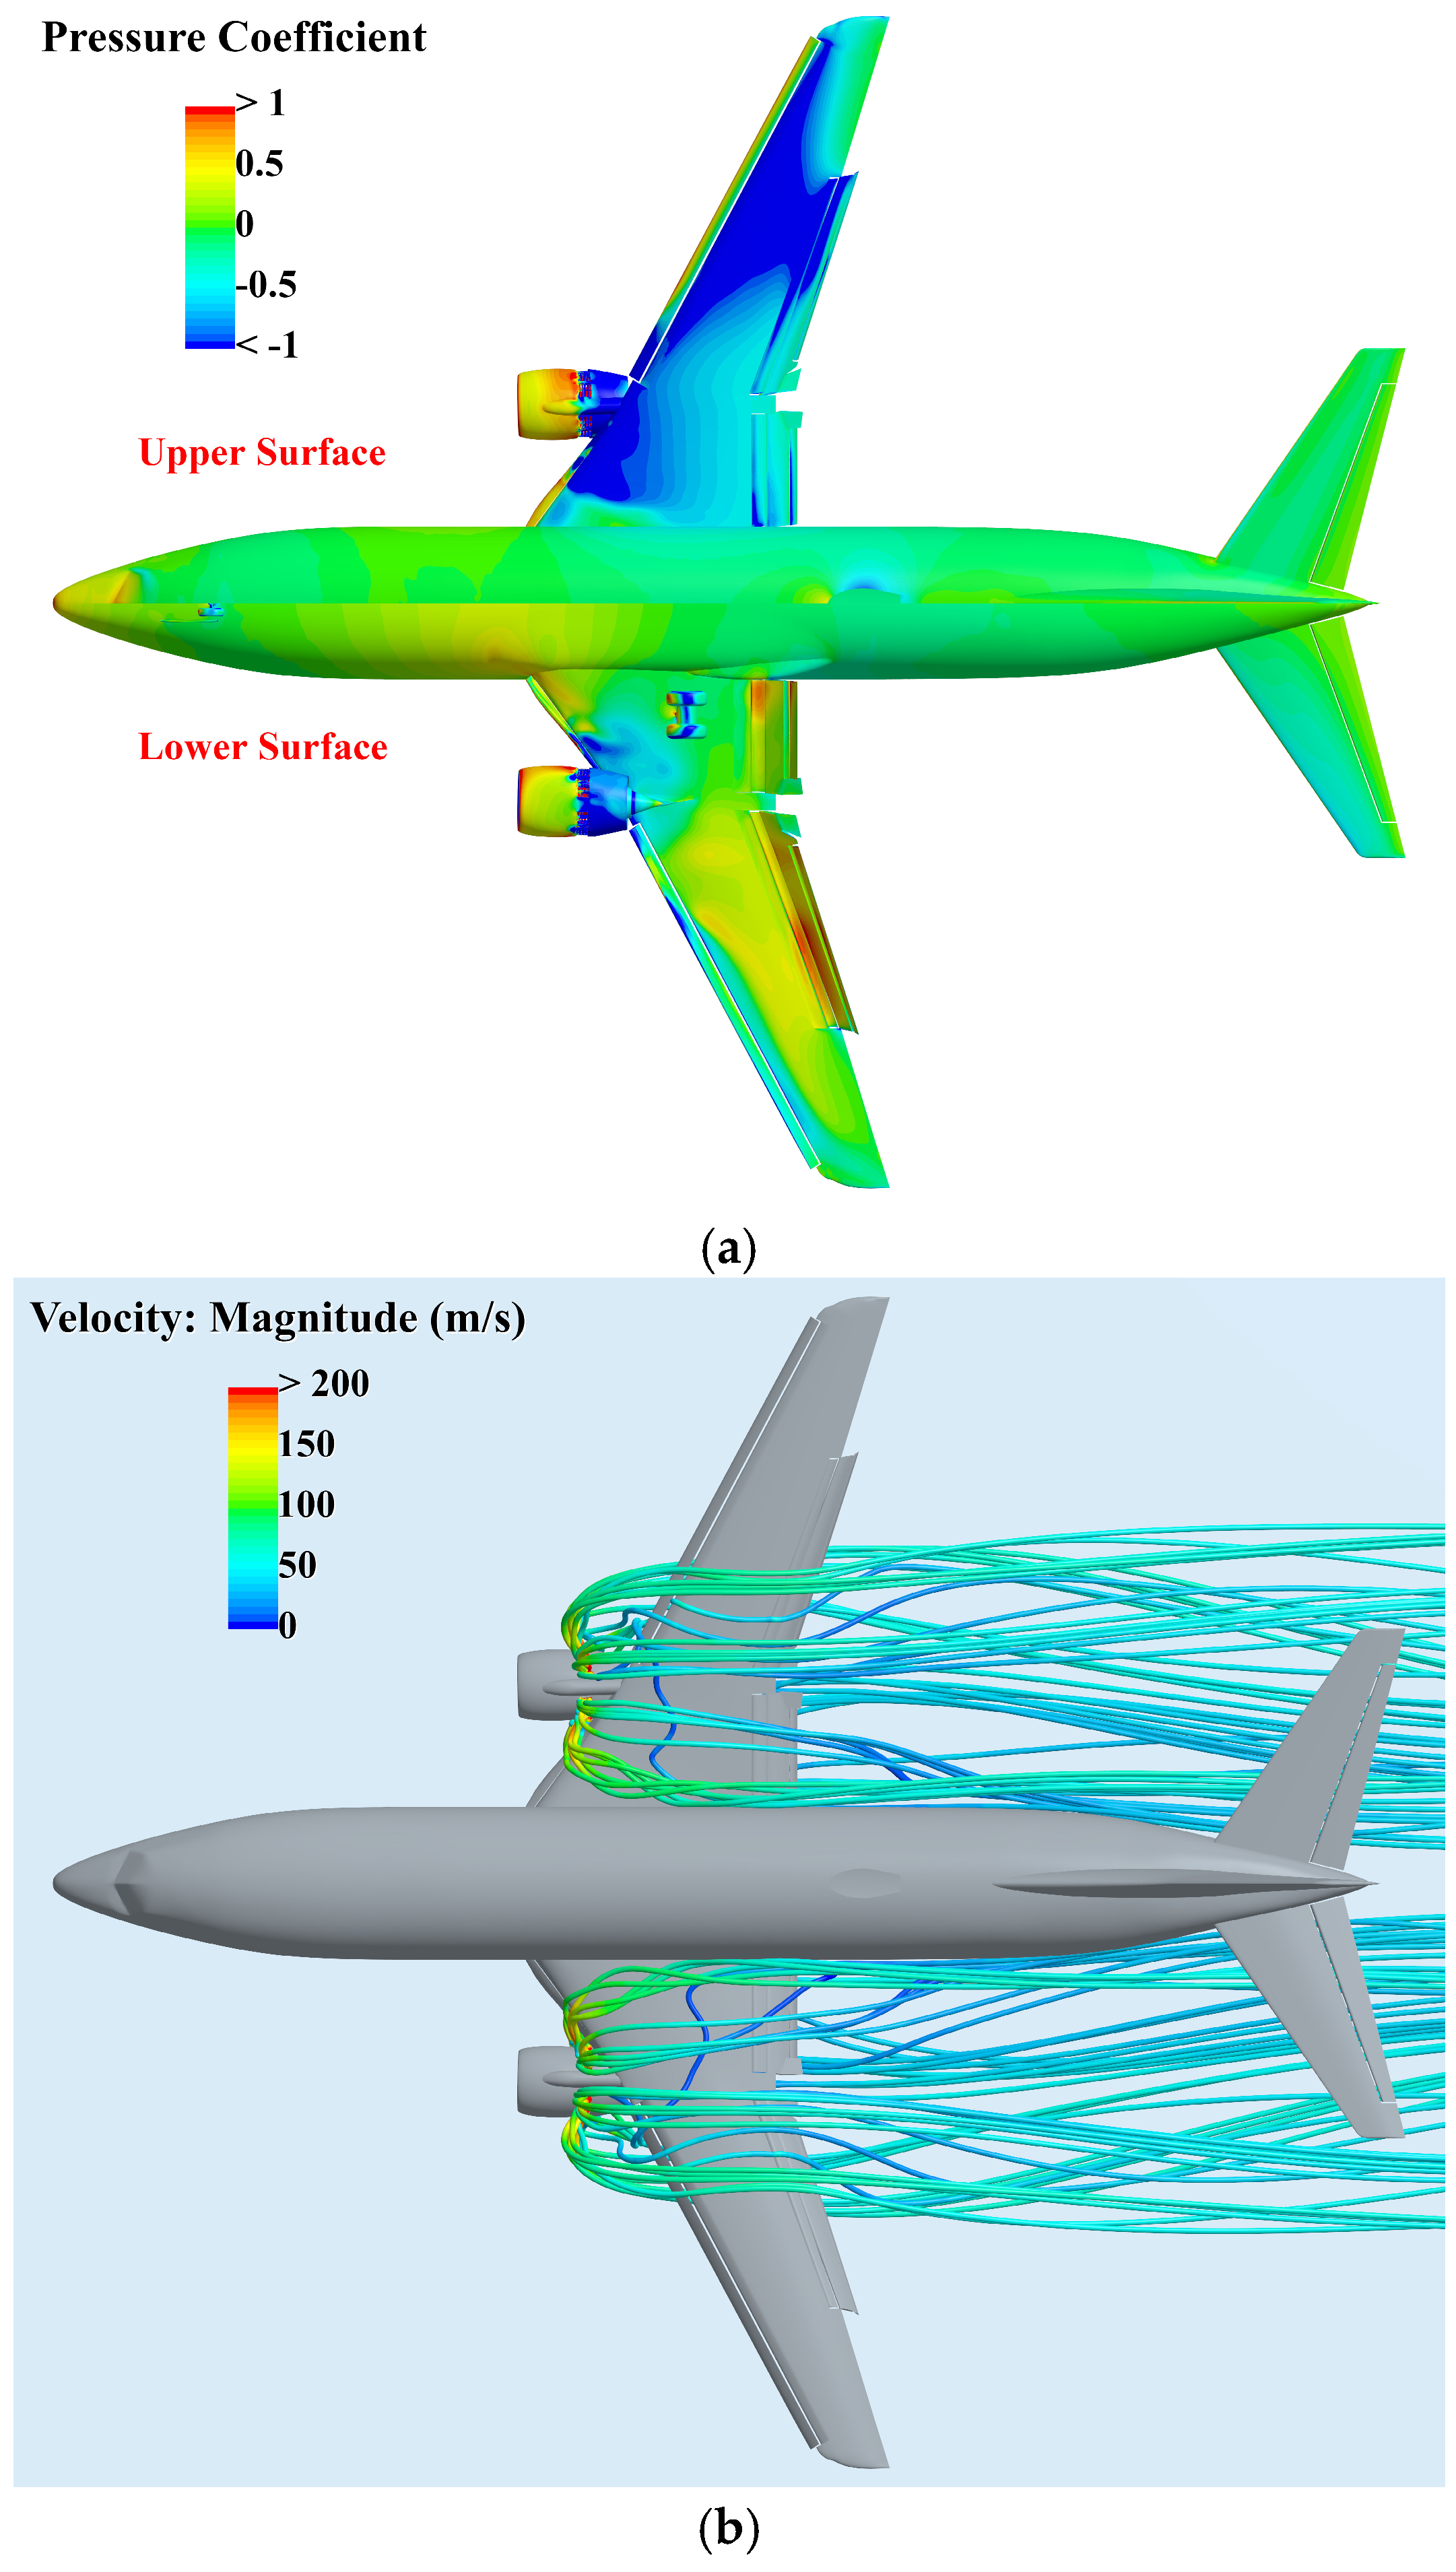
By comparing the simulation results at Ma = 0.2 (Figure 11, Figure 12 and Figure 13) with those at Ma = 0.1, the influence of freestream velocity on the aerodynamic characteristics of the thrust reverser can be elucidated.
The increase in the freestream Mach number exerts a significant constraining effect on the thrust reverser jet. Comparing the streamline plots at identical fan pressure ratios, it is evident that as Ma increases from 0.1 to 0.2, the angle between the jet boundary and the airframe surface decreases. The jet plume tends to stretch in the streamwise direction, and its expansion distance is markedly inhibited. This reduces the direct interference of the jet on the forward fuselage section and further mitigates the risk of engine re-ingestion.
Secondly, regarding the surface pressure coefficient distribution, variations in the Mach number lead to a redistribution of the overall pressure loads. With the increase in Mach number, the extent of high-pressure regions on the wing root and the upper nacelle surface is reduced. Concurrently, under the suppression of jet expansion by the high-speed freestream, the entrainment effect on the lower wing surface is weakened; as a result, the localized low-pressure zone undergoes a polarity inversion and transforms into a high-pressure region.
Table 2 presents the calculated total aerodynamic coefficients for various combinations of Mach numbers and Fan Pressure Ratios (FPRs). Specifically, the streamwise force coefficient is defined as the net deceleration force coefficient, denoted as CD,decel, rather than the conventional aerodynamic drag coefficient. It is normalized by the freestream dynamic pressure and the wing reference area. A positive CD,decel represents the total force acting opposite to the aircraft’s forward motion, including both the airframe aerodynamic contribution and the reverse-thrust-induced contribution; CL represents the total lift coefficient. The quantitative comparative analysis reveals the following patterns: the Fan Pressure Ratio (FPR) is the primary parameter governing the thrust reverser’s deceleration efficiency. At a constant Mach number, CD,decel exhibits a pronounced upward trend as the FPR increases. For instance, under the Ma = 0.1 condition, increasing the FPR from 1.02 to 1.35 results in a 129.1% increase in CD,decel. Concurrently, the increase in FPR leads to a reduction in lift, which is advantageous for increasing tire-to-ground pressure and enhancing braking efficiency during the landing rollout phase.
Furthermore, the high dynamic pressure of the freestream inhibits the forward expansion and displacement of the reverse jet, thereby reducing the range of aerodynamic blockage and leading to a decrease in the drag coefficient. Simultaneously, the higher Mach number weakens the entrainment effect of the jet on the lower wing surface, which mitigates the associated lift loss.

3.3. Effects of Sideslip Angle on Aerodynamic Characteristics

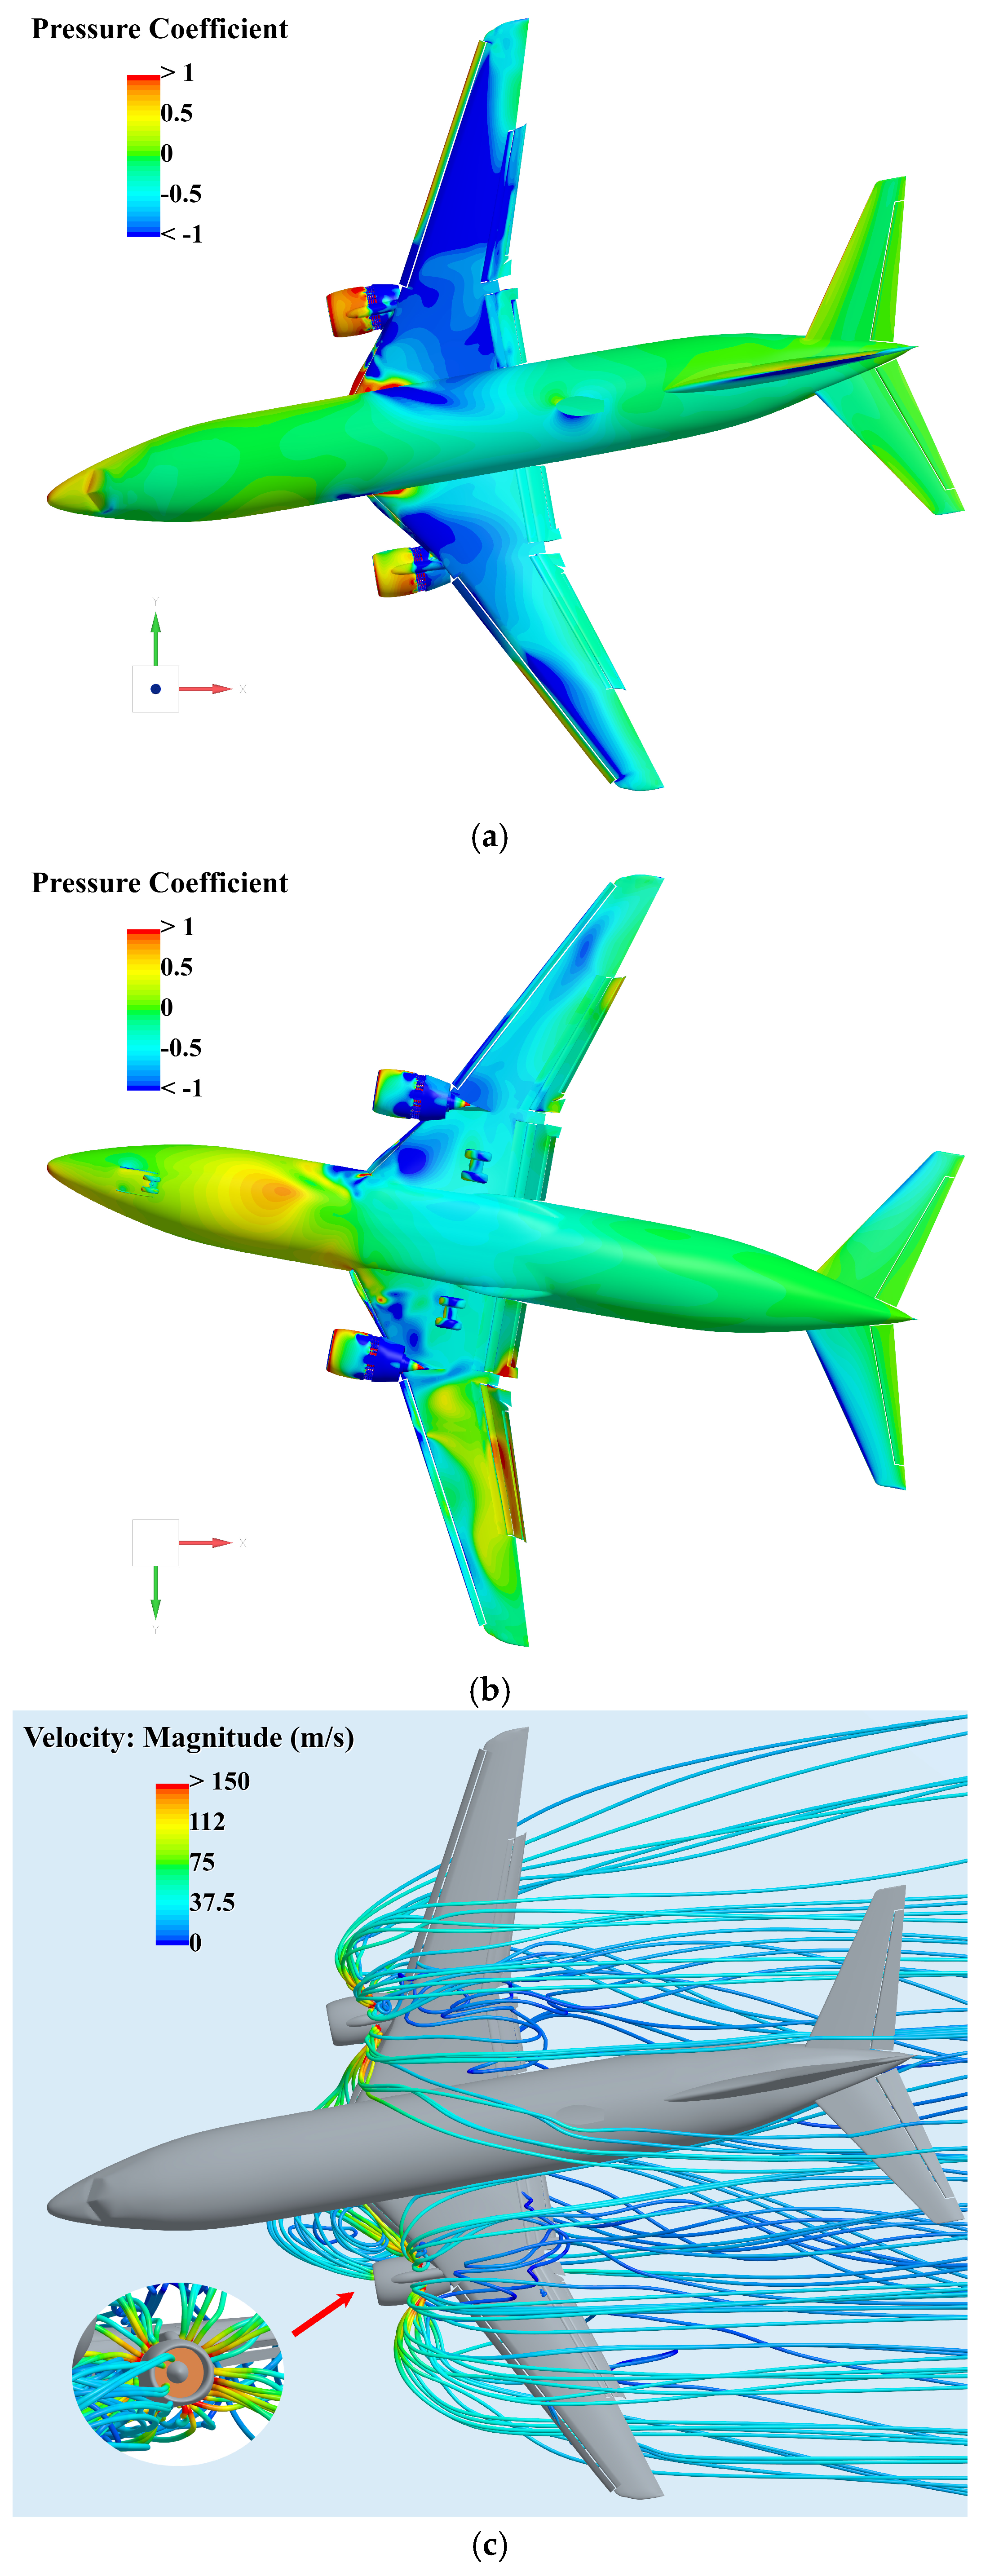
During the actual landing rollout phase, civil aircraft are frequently subjected to crosswind environments, necessitating the operation of thrust reversers at a specific sideslip angle (β). Based on a fixed FPR of 1.25 (simulating a typical thrust reverser operating condition), this section selects a 10° sideslip angle as the subject of study. A systematic comparative analysis is conducted to examine the asymmetric flow field evolution and pressure distribution characteristics under freestream Mach numbers of 0.1 and 0.2.
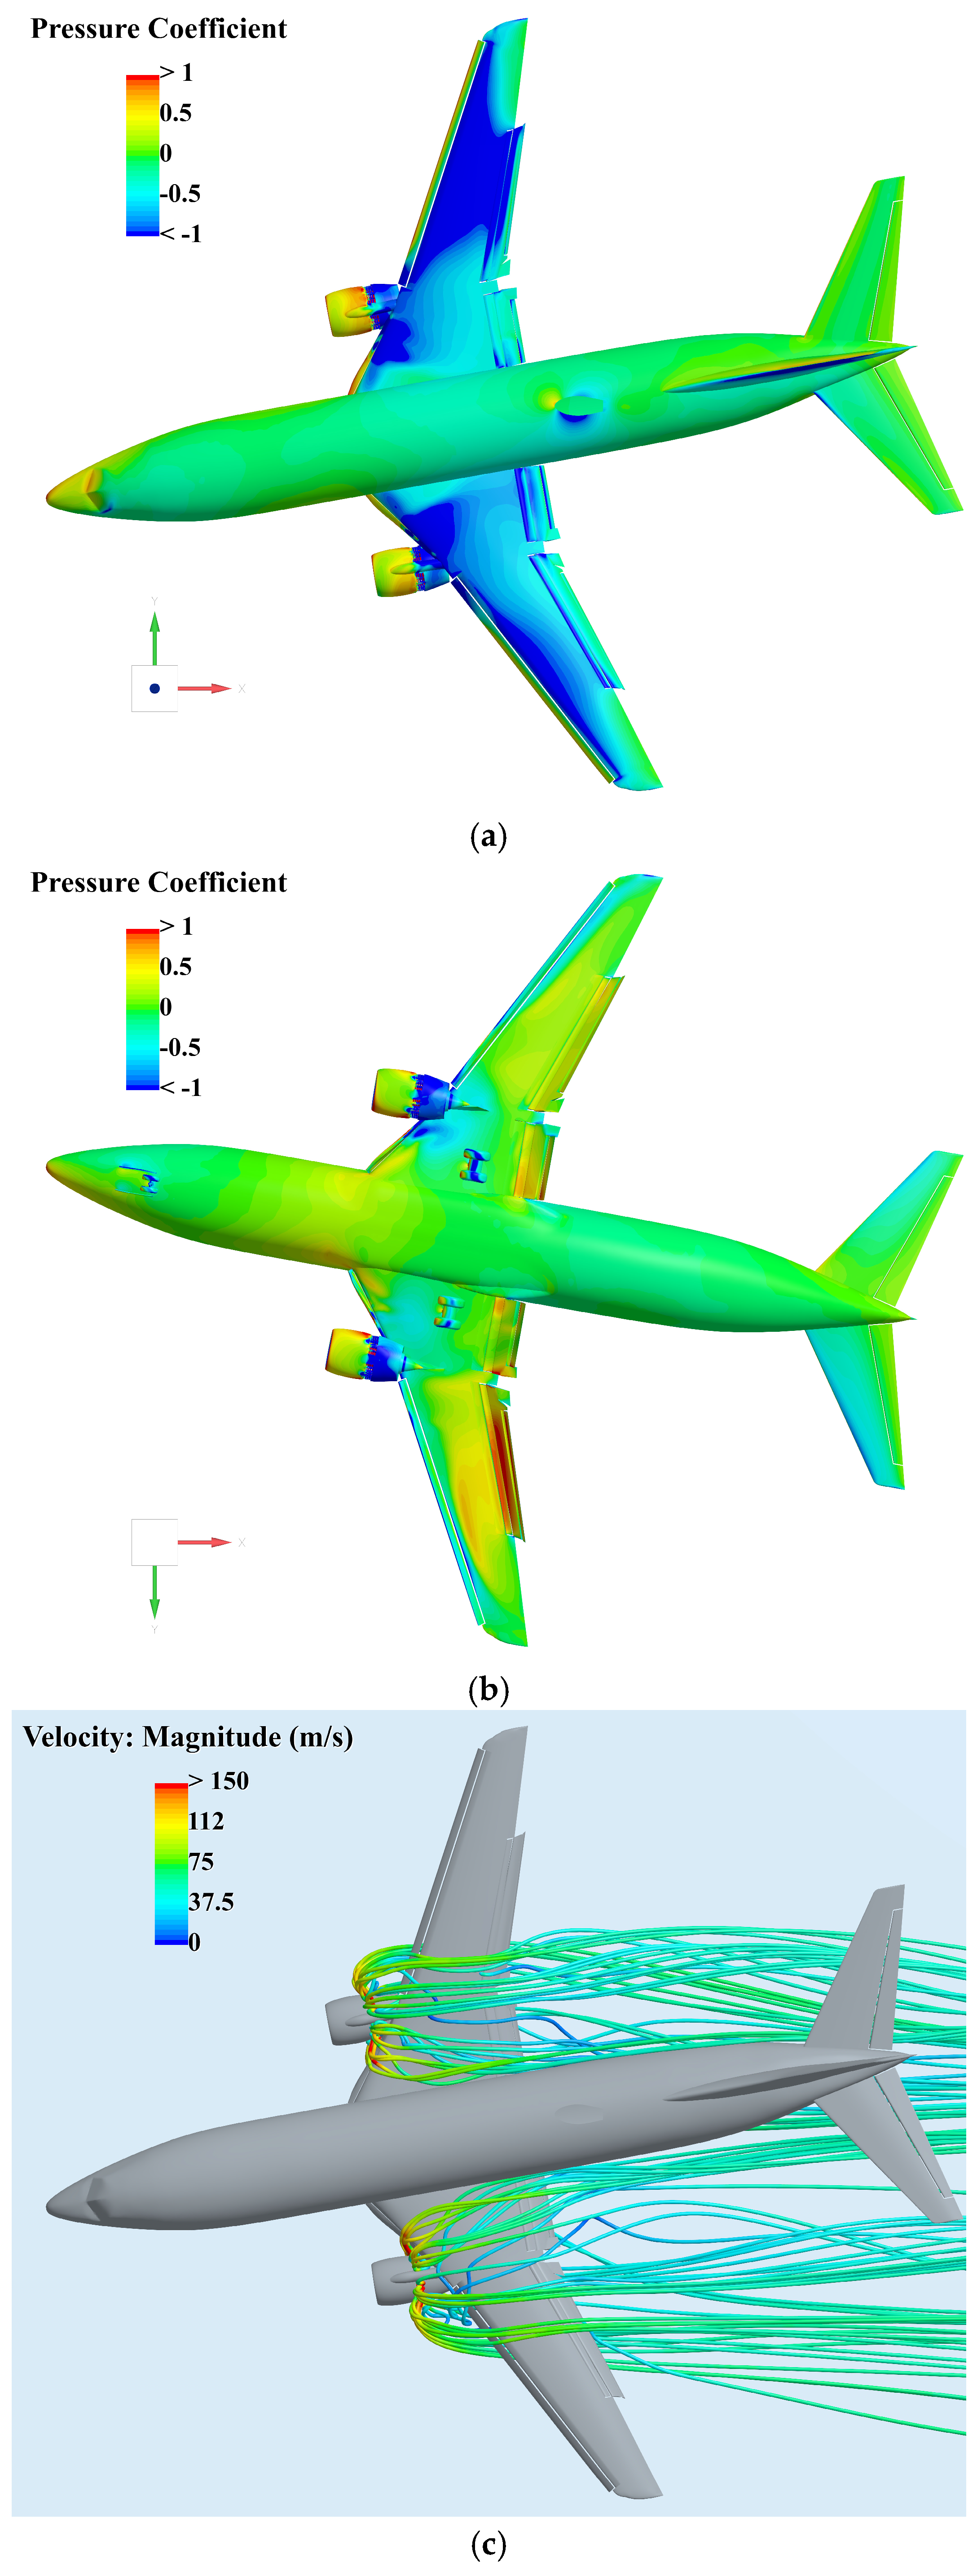
As illustrated by the simulation results in Figure 14 and Figure 15, under the β = 10° sideslip condition, the lateral component of the freestream exerts distinct physical effects on the thrust reverser jets of the left and right engines (the freestream direction in the figure is + X direction). On the windward side, the reverse jet is compressed by the lateral dynamic pressure, forced toward the fuselage, and bends sharply in the wing root region, inducing a stagnation high-pressure zone at the windward wing root leading edge. In contrast, the leeward jet develops toward the forward fuselage under the shielding effect of the fuselage. At Ma = 0.1, the reversed flow is entrained into the engine intake, leading to the re-ingestion phenomenon. A comparison of the surface pressure coefficient contours reveals significant asymmetries between the left and right wing roots: the windward wing upper surface exhibits a broader extent of high pressure, while the leeward lower surface experiences more interference from the reverse jet, resulting in lower surface pressures.
As indicated by the aerodynamic coefficient data under sideslip conditions in Table 3, the variation patterns of the total drag coefficient and lift coefficient remain consistent with those observed under zero-sideslip conditions. However, the introduction of the sideslip angle significantly disrupts the flow field symmetry, resulting in negative yawing moment coefficients (Cn), which represent a yawing moment opposite to the imposed sideslip disturbance and therefore act to reduce the sideslip angle. Firstly, the civil aircraft configuration inherently possesses robust directional static stability. Secondly, under sideslip, the fuselage exerts a physical shielding effect on the leeward thrust reverser. Consequently, the dynamic pressure suppression from the external freestream on the leeward jet is weakened, leading to a higher effective reverse thrust compared to the windward side. This coupling effect causes the magnitude of the restoring yawing moment coefficient to further increase as the Mach number (and thus dynamic pressure) rises.
In summary, this section systematically elucidates the aerodynamic evolution of the scaled civil aircraft thrust reverser configuration in a freestream environment. The modulation mechanisms of the FPR, freestream velocity, and sideslip angle on the aircraft’s pressure redistribution and deceleration efficiency are clarified, establishing a solid baseline for subsequent research. In addition, although the flow around the nose appears undisturbed in Figure 8, Figure 9, Figure 10, Figure 11, Figure 12, Figure 13, Figure 14 and Figure 15, the full-aircraft configuration is necessary to capture the global interference mechanism. The reverse jet induces a pressure field that propagates upstream, affecting the fuselage pressure distribution even without visible flow separation. A partial model would fail to predict this subtle but critical aerodynamic coupling.

4. Analysis of Wind Tunnel Environmental Interference

The above results indicate that the aerodynamic characteristics of the deployed thrust reverser configuration are governed by the coupling of several factors rather than by a single parameter. The FPR controls the reverse-jet momentum and penetration capability, while the freestream Mach number determines the external-flow constraint on the jet.
Scaled wind tunnel tests are conducted within a confined environment, where the flow blockage induced by the support system and the pronounced interference effects from the ground proximity inevitably affect the aerodynamic characteristics of the test configuration. Accurately assessing these disturbances is essential for data correction during the testing process, thereby ensuring the fidelity of the experimental results. To this end, this section establishes a confined-environment numerical model incorporating the complete support system and ground simulation device to quantitatively isolate and analyze the underlying mechanisms of various interference factors under selected representative operating conditions.
Regarding the Reynolds number discrepancy between simulation and wind tunnel tests, Mach number similarity was prioritized as the dominant parameter for this high-speed compressible flow. While skin friction may vary slightly, the pressure drag and jet interference mechanisms—which are the focus of this study—are governed by Mach number and pressure ratios, ensuring the validity of the simulation trends.

4.1. Ground Interference Effects

Currently, most wind tunnel facilities utilize a static ground to simulate ground effects. During operation, a boundary layer inevitably develops on the ground surface. However, in actual ground-proximity flight, no such boundary layer exists between the aircraft and the ground. The presence of this boundary layer alters the flow field characteristics within the test section, thereby compromising the fidelity of wind tunnel measurements [30]. To address this issue, the present section conducts a comparative numerical investigation of the same scaled thrust reverser configuration under two scenarios: a static ground (incorporating the ground boundary layer) and a moving ground (simulating the actual relative motion between the aircraft and the ground).
The numerical simulations are performed at FPR = 1.25 and Ma = 0.2. The computational model encompasses the scaled aircraft, wind tunnel walls, the strut, and the ground. For the static ground simulation, the floor is assigned a no-slip wall boundary condition. In the moving ground case, the ground is set with a translational velocity equal in magnitude and direction to the freestream.
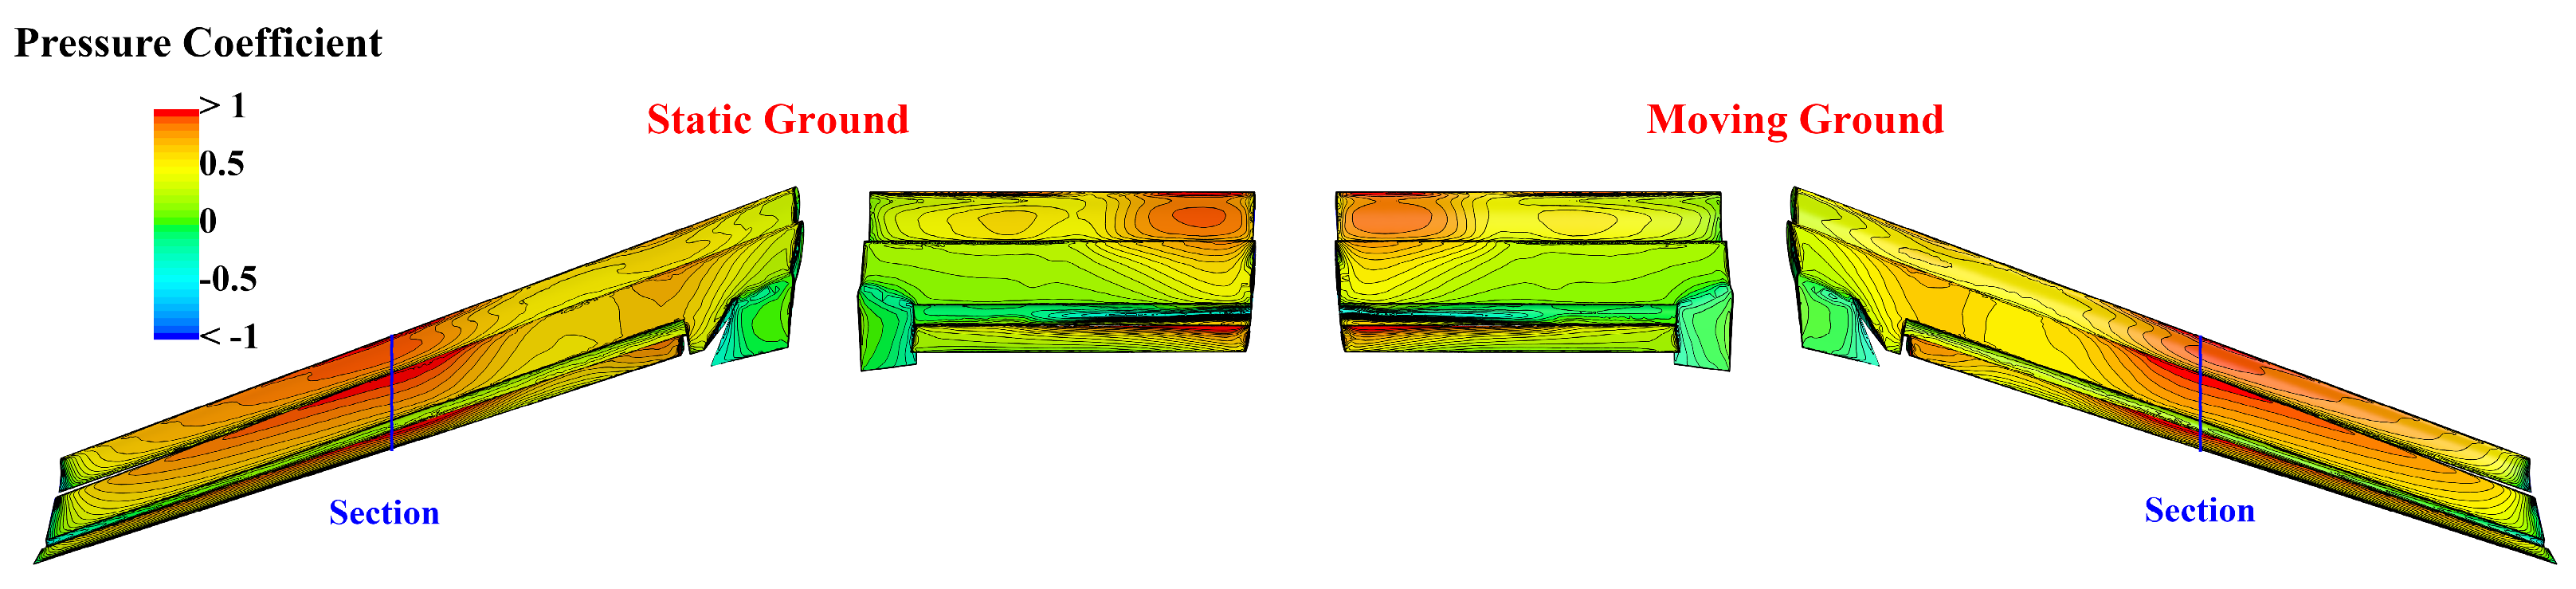
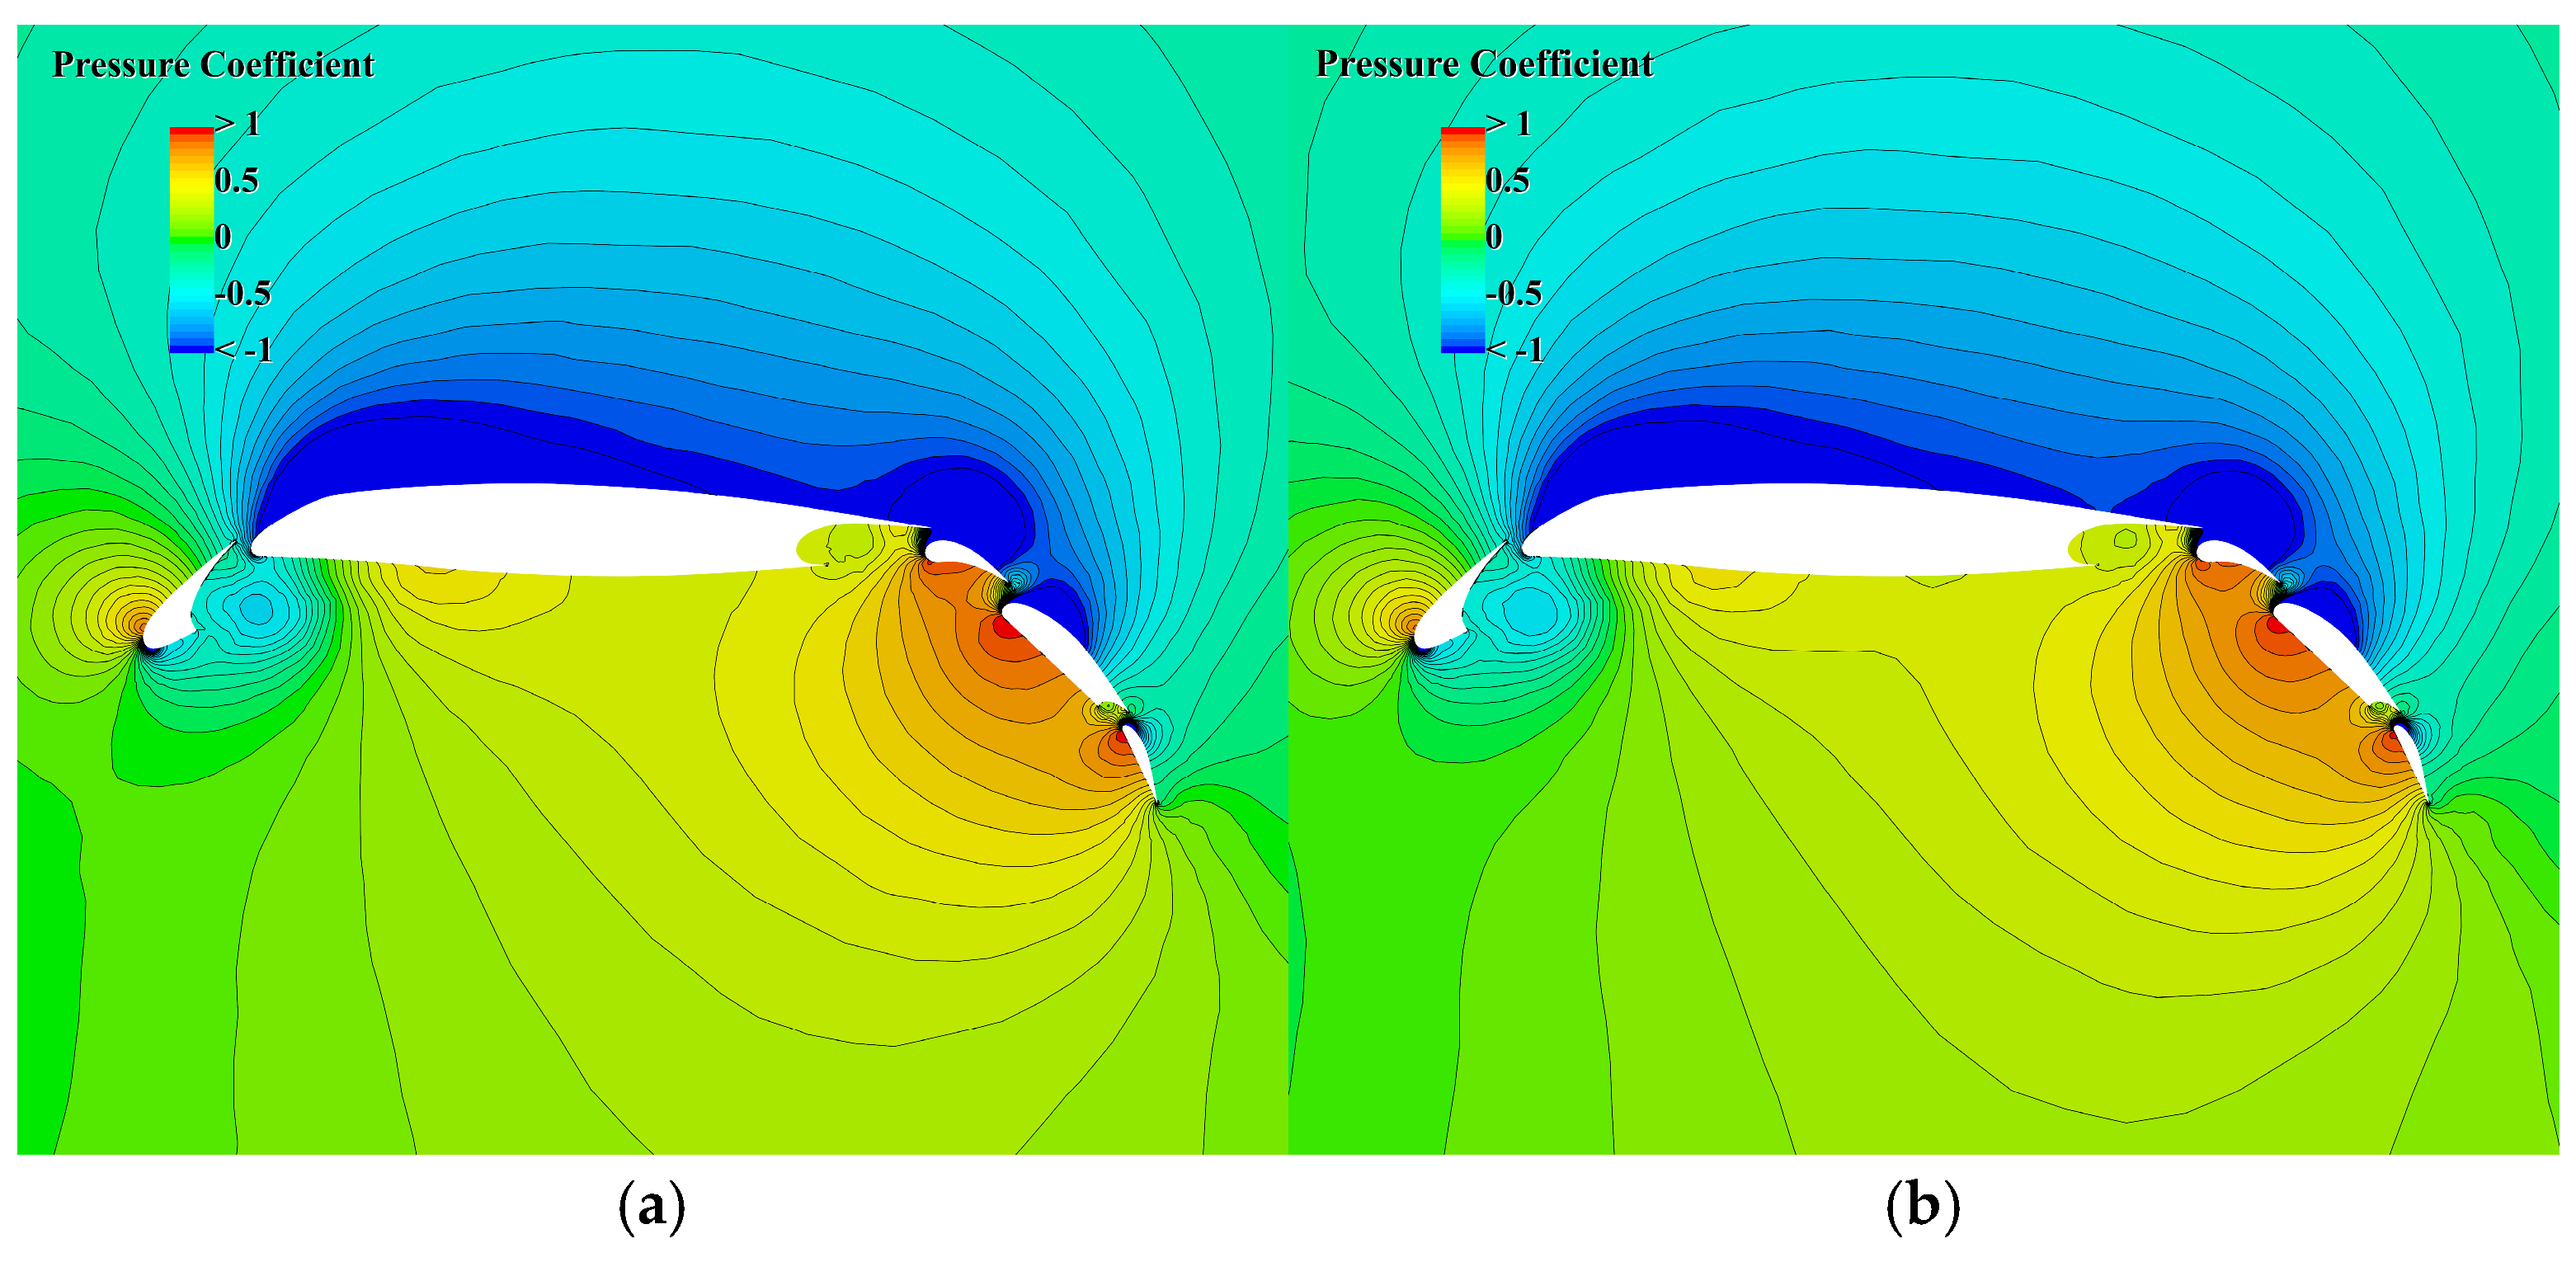
Figure 16 illustrates the comparison of pressure coefficient distributions on the flap lower surface under static and moving ground conditions. Under the static ground condition, the extent of the high-pressure region on the flap lower surface is broader than that of the moving ground, with a higher peak pressure. Further observation of the wing section pressure distributions in Figure 17 reveals that the boundary layer on the static ground induces flow blockage; this leads to an expansion of the suction region on the wing upper surface and an increase in the peak pressure on the flap lower surface. In contrast, the moving ground, by simulating the actual relative motion between the aircraft and the ground, mitigates the additional pressure rise induced by flow accumulation, resulting in a lower surface pressure distribution that is more representative of actual rollout conditions.
Table 4 presents the quantitative comparison of the total aerodynamic coefficients under the two ground boundary conditions. The data indicate that when transitioning from the static ground to the moving ground, the CL decreases from 0.8350 to 0.8050, representing a discrepancy of 3.7%, whereas the variation in the total drag coefficient CD,decel remains negligible. This quantitative trend accurately validates the previously discussed flow physics: the boundary layer on the static ground induces a virtual surface displacement effect, which enhances the pressure-increasing effect on the wing’s lower surface, thereby leading to an overestimation of the total lift performance.

4.2. Strut Interference Effects

Following the investigation of floor interference, this section conducts an in-depth study of the interference induced by the support mechanism in wind tunnel testing. As an indispensable physical apparatus for model mounting, power delivery, and signal transmission, the support system inevitably disrupts flow continuity and exerts pronounced aerodynamic interference [31]. In thrust reverser configuration tests, the support mechanism not only generates its own parasitic drag but also compromises the measurement precision of the aircraft’s aerodynamic characteristics through flow blockage effects and modifications to the downstream pressure gradient. To this end, this section develops a numerical model incorporating the complete support strut and compares it against a support-free (clean) configuration.
The numerical simulations are performed at FPR = 1.25 and Ma = 0.2. The computational model encompasses the scaled aircraft, wind tunnel walls, the strut, and the floor. For the support-free simulation, the strut structure is removed while all other parameters remain unchanged.
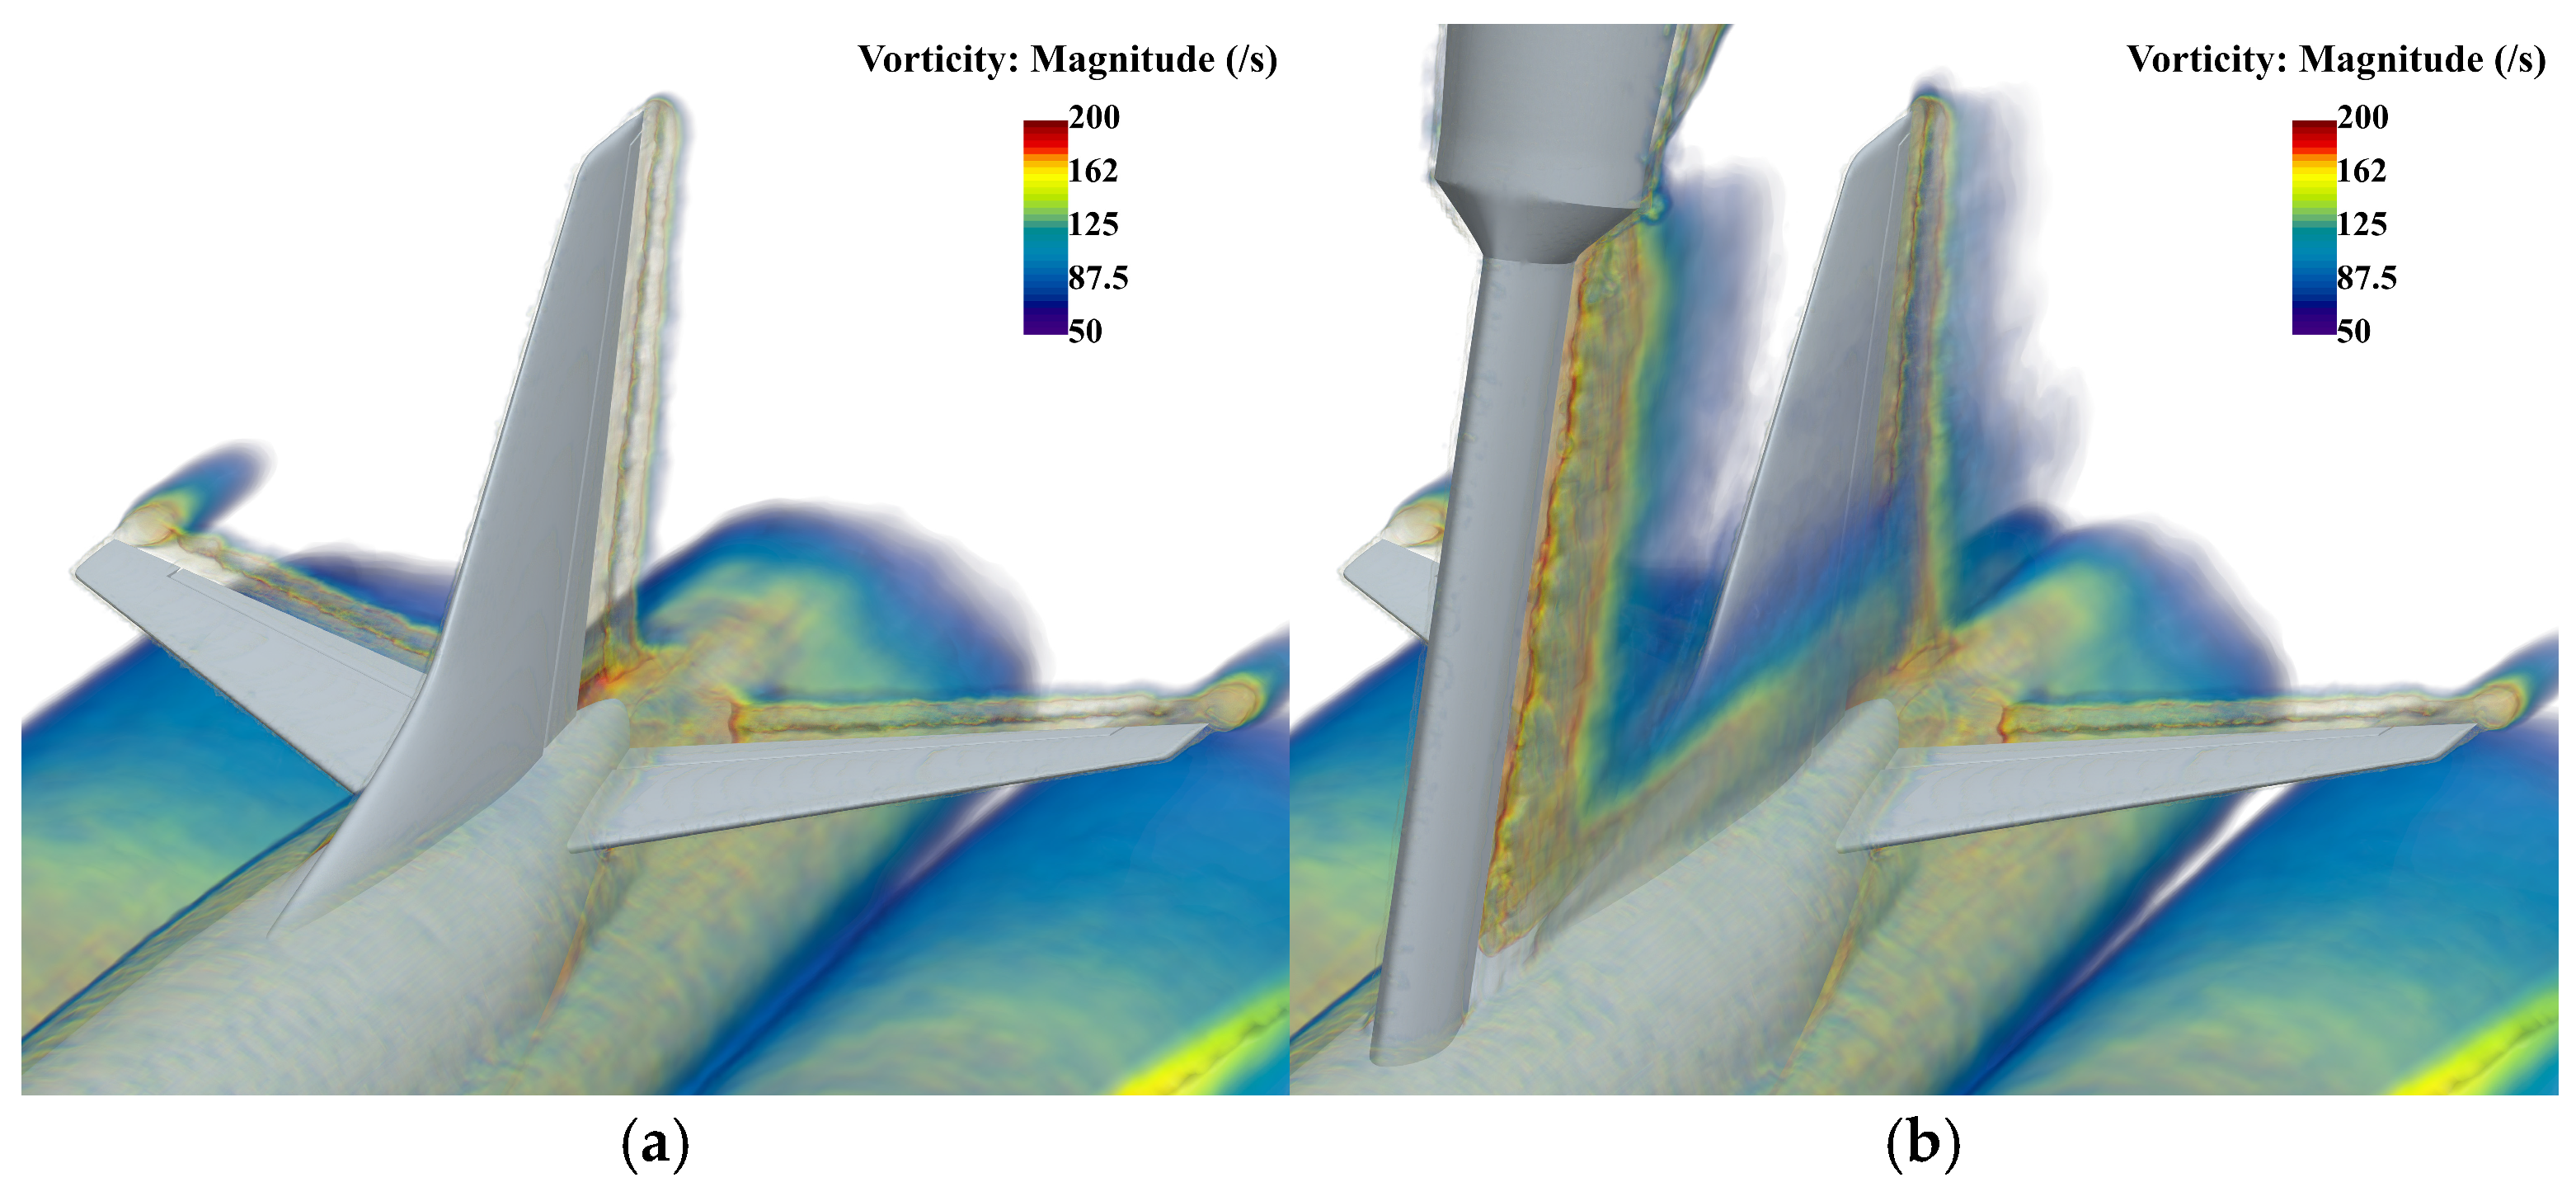
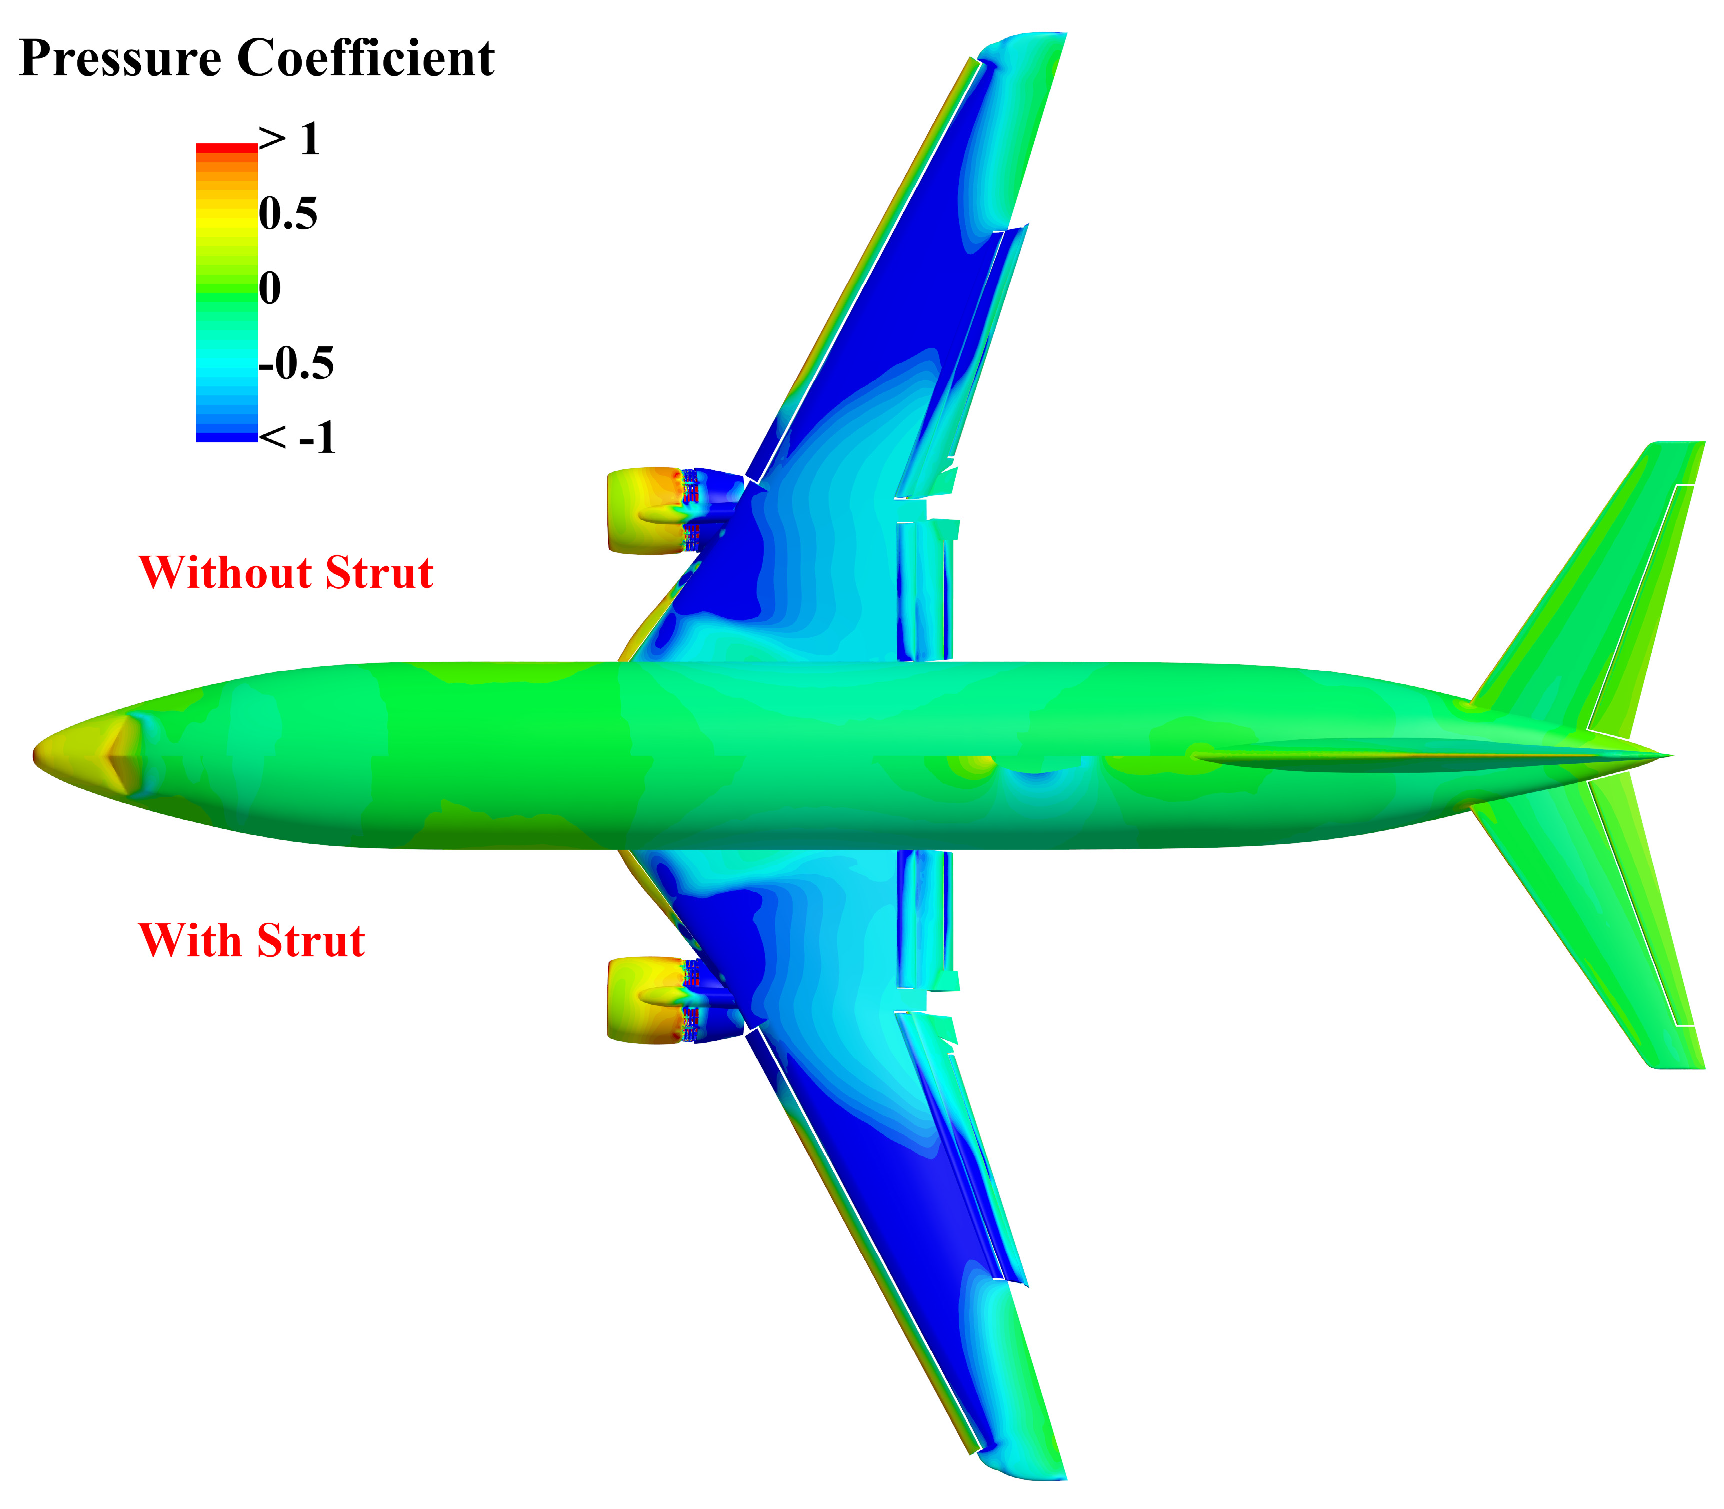
Figure 18 illustrates the surface pressure coefficient distributions of the full aircraft with and without support. It can be observed that the Cp distributions on the upper surface remain largely consistent between the two cases, with discrepancies occurring only near the junction of the fuselage and the support strut. The vorticity distribution near the aircraft tail in Figure 19 elucidates the mechanism of flow field modification induced by the support: in the support-free configuration, the tail flow field is relatively clean, showing only stable wake vortices generated from the trailing edges of the vertical and horizontal stabilizers. In contrast, under the support condition, the massive vertical strut induces intense shedding (separated) vortices downstream of the tail, resulting in extensive regions of concentrated vorticity. The high-load wake from the support strut undergoes vigorous momentum exchange and coupling with the aircraft’s own tail flow field. This “blockage effect,” along with the subsequent modifications to the downstream pressure gradient, directly leads to a deviation in the pressure characteristics of the rear fuselage, constituting the most significant source of flow interference in wind tunnel testing.
As indicated by the quantitative data in Table 5, the introduction of the support strut results in an increase of approximately 2.1% in the CL and 2.5% in the CD,decel. These deviations can be regarded as the systematic interference error introduced by the wind tunnel support system under the present operating condition. The rise in the deceleration force coefficient primarily stems from the additional interference drag generated by the aerodynamic interaction between the support mechanism and the airframe. Meanwhile, the increase in the lift coefficient is attributed to the flow blockage induced by the strut, which modifies the pressure distribution over the rear fuselage and horizontal stabilizer regions. Although both deviations are lower than 3%, they are not negligible for high-accuracy wind tunnel measurements because they introduce a consistent bias in the measured aerodynamic loads. Therefore, the support-strut effect should be considered in the uncertainty assessment and data-correction process for scaled thrust reverser wind tunnel tests.
The aforementioned analysis demonstrates that the magnitude of support interference on the aerodynamic force characteristics is comparable to that of floor interference. In high-precision wind tunnel testing of thrust reverser configurations, it is imperative to employ specialized interference-stripping tests or numerical correction methods to eliminate the systematic errors introduced by the support mechanism.

5. Conclusions

This paper numerically investigates aerodynamic characteristics and wind tunnel environmental interferences of a scaled civil aircraft thrust reverser model, aiming to resolve the difficulty of decoupling multiple interference factors in wind tunnel tests. Validated by a TPS nacelle case, the established CFD model is adopted to analyze the influences of fan pressure ratio (FPR), freestream Mach number, sideslip angle, static ground boundary layer and support strut. Major conclusions are summarized as follows:
(1)
FPR dominates deceleration efficiency: higher FPR brings larger deceleration drag and lower lift. Increasing freestream Mach number restrains forward expansion of reverse jets, weakens pressure distortion on the airframe and mitigates lift loss. No intake re-ingestion occurs under all simulated conditions.
(2)
A 10° sideslip angle induces asymmetric jet and pressure distribution. The windward jet is squeezed toward the fuselage while the leeward jet expands forward, even causing re-ingestion at Ma = 0.1. Negative yawing moment coefficients provide restoring directional stability, which strengthens at higher Mach numbers. Further calculations over more sideslip angles are required for full stability assessments.
(3)
Static ground creates a ground cushion effect from its boundary layer, overpredicting lift by 3.7% relative to moving ground, while its impact on deceleration drag is negligible. Moving ground is recommended for accurate ground-effect simulation.
(4)
The support strut generates massive trailing vortices and blocks empennage flow, leading to systematic increments of 2.1% in lift and 2.5% in deceleration drag. Such consistent bias below 3% cannot be ignored, so strut interference correction is necessary for high-precision test data.
Regarding the applicability of the findings, while the quantitative interference values (e.g., the specific magnitude of drag increment) are dependent on the specific geometry of the current model, the physical mechanisms revealed in this work are universally applicable to similar under-wing propulsion configurations. The identified trends—such as the suppression of jet expansion by freestream velocity and the asymmetry induced by sideslip angles—provide general theoretical guidance. Consequently, the methodology and the interference correction strategies proposed in this paper can serve as a valuable reference for the wind tunnel test design and data reduction of other civil aircraft models.

Author Contributions

Conceptualization, G.Y. and Y.J.; methodology, Y.J., W.W. and L.S.; software, L.S. and M.L.; validation, H.H. and A.J.; formal analysis, Y.J., W.W. and M.L.; investigation, Y.J., H.H. and A.J.; resources, G.Y. and X.F.; data curation, W.W., M.L. and A.J.; writing—original draft preparation, Y.J.; writing—review and editing, G.Y., W.W., L.S. and X.F.; visualization, H.H. and M.L.; supervision, G.Y. and X.F.; project administration, G.Y. and X.F.; funding acquisition, G.Y. and X.F. All authors have read and agreed to the published version of the manuscript.

Funding

This research was funded by National Key Laboratory of Land- and Air-Based Information Perception and Control, China (Grant, No. B124002) and Natural Science Foundation of Chongqing (Grant No. CSTB2023NSCQ-MSX0042).

Institutional Review Board Statement

Not applicable.

Informed Consent Statement

Not applicable.

Data Availability Statement

Data are contained within the article.

Conflicts of Interest

The authors declare no conflicts of interest.

References

  1. Colley, R.H.; Sutton, J.M.D. Thrust Reversers for Civil STOL Aircraft; SAE Technical Paper 730358; SAE International: Warrendale, PA, USA, 1973. [Google Scholar]
  2. Butterfield, J.; Yao, H.; Benard, E.; Price, M.; Cooper, R.; Armstrong, C.; Raghunathan, S.; Monaghan, D. Optimisation of a thrust reverser cascade: An assessment of dynamic response during reverse thrust. In Proceedings of the AIAA’s 3rd Annual Aviation Technology, Integration, and Operations (ATIO) Forum 2003, Denver, CO, USA, 17–19 November, 2003. [Google Scholar]
  3. Huang, H.; Liu, Y.; Zhan, J.; Jia, B.; Dong, Z.; Zhao, M.; Liu, Y.; Li, B. Recent progress of AI in CFRP: From design and manufacturing to structural health monitoring. Thin-Walled Struct. 2026, 226, 114936. [Google Scholar] [CrossRef]
  4. Tindell, R.H.; Marconi, F.; Kalkhoran, I.; Yetter, J. Deflection of Turbofan Exhaust Streams for Enhanced Engine/Nacelle Integration. J. Aircr. 1998, 35, 106–112. [Google Scholar] [CrossRef]
  5. Butterfield, J.; Yao, H.; Benard, E.; Price, M.; Cooper, R.; Monaghan, D.; Armstrong, C.; Raghunathan, R. Investigation of weight reduction in a thrust reverser cascade using aerodynamic and structural integration. In Proceedings of the AIAA Non-Deterministic Approaches Forum 2003, Norfolk, VA, USA, 7–10 April 2003; pp. 1578–1585. [Google Scholar]
  6. Jin, Y.; Yang, G.; Li, S.; Sun, X.; Gao, E.; Zhang, L. Nonlinear Aerodynamic Responses of Flight Control Surfaces to Thrust Reverser Jet-Induced Flow Interference. Aerospace 2025, 12, 705. [Google Scholar] [CrossRef]
  7. De Andrade, F.O.; Ferreira, S.B.; Da Silva, L.F.; de Jesus, A.; Lara Oliveira, G. Study of the influence of aircraft geometry on the computed flowfield during thrust reversers operation. In Proceedings of the 24th AIAA Applied Aerodynamics Conference, San Francisco, CA, USA, 5–8 June 2006; pp. 2181–2192. [Google Scholar]
  8. Turso, J.A.; Litt, J.S. A Foreign Object Damage Event Detector Data Fusion System for Turbofan Engines. J. Aerosp. Comput. Commun. 2004, 2, 291–308. [Google Scholar]
  9. De Siervi, F.; Viguier, H.C.; Greitzer, E.M. Mechanisms of Inlet-Vortex Formation. J. Fluid Mech. 1982, 124, 173–207. [Google Scholar] [CrossRef]
  10. Qian, R.Z.; Zhu, Z.Q.; Duan, Z.Y. Thrust Reverser Optimization for Safety with CFD. Procedia Eng. 2011, 17, 595–602. [Google Scholar] [CrossRef][Green Version]
  11. Zhang, D.Y.; Hu, Y.R.; Wang, Z.W.; Xu, H. Design and Verification of Thrust Reversers Efflux-pattern for Wing-mounted Layout Civil Aircraft Based on CFD. J. Xihua Univ. (Nat. Sci. Ed.) 2024, 43, 1–9. [Google Scholar]
  12. Zhao, H.G. Numerical Simulation Study on Influence of Reverser Flow on High Bypass Ratio Turbofan Engine Inlet Flowfield. Gas Turbine Exp. Res. 2019, 32, 20–25. [Google Scholar]
  13. Secareanu, A.; Moroianur, D.; Karlsson, A.; Fuchs, L. Experimental and numerical study of ground vortex interaction in an air-intake. In Proceedings of the 43rd AIAA Aerospace Sciences Meeting and Exhibit, Reno, NV, USA, 10–13 January 2005; pp. 4645–4654. [Google Scholar]
  14. Wang, F.; Chen, B.; Wang, Y.; Pang, Z.; Shao, Z.; Liu, Y.; Huang, H. Recent Progress of Ai-Based Intelligent Air-Confrontation Technology Test and Verification Framework. Aerospace 2025, 12, 959. [Google Scholar]
  15. Asbury, S.C.; Yetter, J.A. Static Performance of Six Innovative Thrust Reverser Concepts for Subsonic Transport Applications: Summary of the NASA Langley Innovative Thrust Reverser Test Program; National Aeronautics and Space Administration, Langley Research Center: Hampton, VA, USA, 2000. [Google Scholar]
  16. Fan, Y.; Zhan, H.; Zhang, M.; Mi, B. AirfoilAgent: Airfoil aerodynamics optimization design via large language model multi-agent collaborations. Adv. Eng. Inform. 2026, 71, 104246. [Google Scholar]
  17. Fan, Y.; Shi, L.; Sun, Y.; Mi, B. AirfoilRAG: Retrieval augmented generation framework for airfoil aerodynamic design knowledge discovery and application. Aerosp. Sci. Technol. 2025, 168, 110933. [Google Scholar] [CrossRef]
  18. Baigang, M.; Yi, F. A review: Development of named entity recognition (NER) technology for aeronautical information intelligence. Artif. Intell. Rev. 2023, 56, 1515–1542. [Google Scholar]
  19. Shi, L.; Xia, L.; Zhang, M.; Deng, J.; Zhang, W. Researches on the aerodynamic and stealth characteristics for flying wing fighter. J. Phys. Conf. Ser. 2024, 2746, 012003. [Google Scholar] [CrossRef]
  20. Zhang, M.; Xia, L.; Zhao, K.; Shi, L. Aerodynamic and stealth integrated design of hypersonic vehicle based on discrete adjoint method. Aerosp. Sci. Technol. 2025, 162, 110222. [Google Scholar] [CrossRef]
  21. Ocokoljić, G.; Rašuo, B.; Kozić, M. Supporting system interference on aerodynamic characteristics of an aircraft model in a low-speed wind tunnel. Aerosp. Sci. Technol. 2017, 64, 133–146. [Google Scholar] [CrossRef]
  22. Hetherington, B.; Sims-Williams, D.B. Wind tunnel model support strut interference. In Proceedings of the 2004 SAE World Congress, Detroit, MI, USA, 8–11 March 2004; SAE International: Warrendale, PA, USA, 2004; pp. 1–9. [Google Scholar]
  23. Jia, Q.; Yang, W.; Yang, Z. Numerical analysis on support interference on wing in ground effect wind tunnel test. J. Exp. Fluid Mech. 2014, 28, 44–48. [Google Scholar]
  24. Marshall, D.W.; Newman, S.; Williams, J. Boundary layer effects on a wing in ground-effect. Aircr. Eng. Aerosp. Technol. 2013, 82, 99–106. [Google Scholar]
  25. Fago, B.; Lindner, H.; Mahrenholtz, O. The effect of ground simulation on the flow around vehicles in wind tunnel testing. J. Wind Eng. Ind. Aerodyn. 1991, 38, 47–57. [Google Scholar] [CrossRef]
  26. Li, P.R. Numerical Simulation of Propeller Jet Field Based on Star-CCM+. Am. J. Sci. Res. Essays 2020, 5, 1–14. [Google Scholar] [CrossRef]
  27. Anderson, J.D. Fundamentals of Aerodynamics; McGraw-Hill: New York, NY, USA, 2016. [Google Scholar]
  28. Menter, F.R.; Kuntz, M.; Langtry, R. Ten years of industrial experience with the SST turbulence model. Turbulence 2003, 4, 625–632. [Google Scholar]
  29. Hirose, N.; Asai, K.; Ikawa, K. Transonic 3-D Euler Analysis of Flows Around Fanjet Engine and T.P.S. (Turbine Powered Simulator); NAL-TR-1045; National Aerospace Laboratory: Bengaluru, India, 1989. [Google Scholar]
  30. Zhou, D.; Pan, A.; Liu, J.; Li, P.; Shao, T.; Cui, L.; Li, L. Application Status and Prospect of the Technology for the Moving Belt Floor in Wind Tunnel. J. Mech. Eng. 2025, 61, 313–329. [Google Scholar] [CrossRef]
  31. Zhang, J.; Ai, Y.; Huang, D.; Liu, J. Numerical simulation investigation of aerodynamic interference of sting support in wind tunnel test of a delta wing at big angles of attack. Acta Aeronaut. Astronaut. Sin. 2016, 37, 2481–2489. [Google Scholar]
Figure 1. Geometry of the TPS Engine.
Aerospace 13 00599 g001
Figure 2. Surface Mesh of the TPS Engine.
Aerospace 13 00599 g002
Figure 3. Comparison of Computed and Experimental Surface Pressure Coefficients.
Aerospace 13 00599 g003
Figure 4. Geometry of the Scaled model and Wind Tunnel.
Aerospace 13 00599 g004
Figure 5. Geometry of the thrust reverser with a realistic cascade structure.
Aerospace 13 00599 g005
Figure 6. Variation of numerical results with number of cells.
Aerospace 13 00599 g006
Figure 7. Computational domain mesh.
Aerospace 13 00599 g007
Figure 8. Conditions at Ma = 0.1 and FPR = 1.02. (a) Pressure contours of the full aircraft. (b) Streamlines of the thrust reverser flow.
Aerospace 13 00599 g008
Figure 9. Conditions at Ma = 0.1 and FPR = 1.25. (a) Pressure contours of the full aircraft. (b) Streamlines of the thrust reverser flow.
Aerospace 13 00599 g009
Figure 10. Conditions at Ma = 0.1 and FPR = 1.35. (a) Pressure contours of the full aircraft. (b) Streamlines of the thrust reverser flow.
Aerospace 13 00599 g010
Figure 11. Conditions at Ma = 0.2 and FPR = 1.02. (a) Pressure contours of the full aircraft. (b) Streamlines of the thrust reverser flow.
Aerospace 13 00599 g011
Figure 12. Conditions at Ma = 0.2 and FPR = 1.25. (a) Pressure contours of the full aircraft. (b) Streamlines of the thrust reverser flow.
Aerospace 13 00599 g012
Figure 13. Conditions at Ma = 0.2 and FPR = 1.35. (a) Pressure contours of the full aircraft. (b) Streamlines of the thrust reverser flow.
Aerospace 13 00599 g013
Figure 14. Conditions at Ma = 0.1 and β = 10°. (a) Pressure contours of the upper aircraft. (b) Pressure contours of the lower surface. (c) Streamlines of the thrust reverser flow.
Aerospace 13 00599 g014
Figure 15. Conditions at Ma = 0.2 and β = 10°. (a) Pressure contours of the upper aircraft. (b) Pressure contours of the lower surface. (c) Streamlines of the thrust reverser flow.
Aerospace 13 00599 g015
Figure 16. Comparison of flap lower surface Cp distributions between static and moving ground.
Aerospace 13 00599 g016
Figure 17. Comparison of wing section Cp distributions for static and moving ground cases. (a) Static Ground. (b) Moving Ground.
Aerospace 13 00599 g017
Figure 18. Upper surface Cp distributions of the full aircraft with and without strut.
Aerospace 13 00599 g018
Figure 19. Vorticity distributions near the aircraft tail with and without strut. (a) Without strut. (b) With strut.
Aerospace 13 00599 g019
Table 1. Computational Setup of the TPS Engine.
Case M a m t a r g e t p 0 f p 0 T 0 f T 0 p 0 c p 0 T 0 c T 0
170.80112.68kg/s1.430351.132991.124510.60995
Where p 0 f ( c ) p 0 represents the total pressure ratio and T 0 f ( c ) T 0 represents the total temperature ratio. The total pressure and total temperature can be determined based on these two parameters.
Table 2. Aerodynamic coefficients variation laws.
MaAerodynamic ParametersFPR = 1.02FPR = 1.25FPR = 1.35
0.1CL0.85510.49410.0677
CD,decel0.31480.56660.7211
0.2CL1.01250.80500.7185
CD,decel0.19940.29640.3382
Table 3. Aerodynamic coefficient under sideslip conditions.
MaFPRCLCD,decelCn
0.11.250.40670.5510−0.028
0.21.250.75850.3032−0.032
Table 4. Aerodynamic coefficients under static and moving ground conditions.
CLCD,decel
Static ground0.83500.2969
Moving ground0.80500.2964
Table 5. Aerodynamic coefficients for configurations with and without strut.
CLCD,decel
Without strut0.78820.2891
With strut0.80500.2964
Disclaimer/Publisher’s Note: The statements, opinions and data contained in all publications are solely those of the individual author(s) and contributor(s) and not of MDPI and/or the editor(s). MDPI and/or the editor(s) disclaim responsibility for any injury to people or property resulting from any ideas, methods, instructions or products referred to in the content.