Article

Investigation on Subcritical Regenerative Cooling for Ignition Experiments on LOX/LNG Rocket Engine

1
School of Basic Sciences for Aviation, Naval Aviation University, Yantai 264001, China
2
College of Aerospace Science and Engineering, National University of Defense Technology, Changsha 410073, China
3
Beijing Institute of Tracking and Telecommunications Technology, Beijing 100094, China
*
Author to whom correspondence should be addressed.
Aerospace 2026, 13(7), 593; https://doi.org/10.3390/aerospace13070593
Submission received: 28 May 2026 / Revised: 23 June 2026 / Accepted: 29 June 2026 / Published: 30 June 2026
(This article belongs to the Special Issue High Speed Aircraft and Engine Design)

Abstract

This study presents a novel one-dimensional solution method to demonstrate the effects of fuel composition and channel roughness on phase-change heat transfer in spiral regenerative cooling systems. The calculated models are grounded in an experimental correlation of liquefied natural gas (LNG) flow boiling, and their accuracy is validated through ignition experiments conducted on a 1 kg/s-class thrust chamber. The experimental data shows that the physical characteristics of LNG contribute to an extended reach within the two-phase region, resulting in a calculated pressure drop that exceeds that of pure liquid methane. Variations in surface roughness influence the pressure drop by altering the frictional coefficient. Specifically, an increase in surface roughness from 2 µm to 8 µm results in a 47.8% rise in pressure drop. The proposed model demonstrates high accuracy, with deviations in the coolant temperature rise and the pressure drop being less than 9.0% and 7.6%, respectively, when compared to experimental data. The findings serve as an engineering guide for designing and optimizing heat transfer in LOX/LNG rocket engine cooling systems.

1. Introduction

With the continuous advancement of aerospace technology, new hydrocarbon fuels have gradually emerged as one of the ideal propellant combinations for cooling systems in variable thrust liquid rocket engines. Among them, liquid methane is preferred due to its high specific impulse, low cost and environmental friendliness [1,2]. For LOX/LCH4 variable thrust rocket engines, the fuel undergoes phase-change heat transfer within the regenerative cooling channels, with its flow and heat transfer characteristics directly affecting the reliability of engine thermal protection and operational stability [3,4]. However, as a multicomponent mixture, the LNG used in ignition experiments has exhibited more complex physical properties than pure liquid methane. Especially in the two-phase flow regions, the heat transfer mechanisms remain insufficiently understood [5]. In addition, under actual operating conditions, factors such as the surface roughness and geometric dimensions of the cooling channels significantly influence the frictional pressure drop and heat transfer efficiency. At present, systematic research on the effects of these factors is lacking, which has become a constraint on the design and optimization of high-performance cooling structures.
Undesired phenomena, such as pseudoboiling and two-phase flow, may be induced by hydrocarbon impurities present in liquid methane. Such issues may pose challenges for the cooling channels of LOX/LCH4 rocket engines [3]. As reported by Nasser et al. [6], rich LNG and lean LNG are two distinct categories of natural gas, differing in their hydrocarbon compositions. Rich LNG is characterized by a higher content of natural gas liquids (NGLs)—including propane, butane, and ethane—and possesses a higher calorific value than lean LNG, which signifies its stronger heating capacity. On the other hand, lean LNG has a lower concentration of NGLs, with methane serving as its main component. The research team led by Nasser investigated the heat transfer behaviors of regenerative cooling for various LNG mixtures under transcritical conditions. Their findings revealed that hydrocarbon impurities exert a notable influence on both the phase envelope and the cricondenbar pressure, with the latter being 5.1 MPa for lean LNG (composed of 97.5% methane) and 7.5 MPa for rich LNG (composed of 88.7% methane). Santese et al. [7] conducted an investigation into the effects of trace hydrocarbon components on the thermophysical characteristics of LNG. They found that, in comparison with relatively pure liquid methane, the Widom area predicted for mixed systems may either increase or decrease, depending on the specific thermophysical parameters involved. These findings can provide significant value for the design of rocket engines, particularly when carrying out transcritical and supercritical simulations of cooling systems. Urbano et al. [8,9] compared the performance of various LNG types in expander cycle engines. Their results indicated that augmenting the proportion of ethane and propane in the mixture leads to a reduction in pressure drop while impairing the cooling capacity of the mixture. On the contrary, an increase in the nitrogen content not only reduces the coolant efficiency but also results in a more substantial pressure drop.
The design of thrust chambers in contemporary liquid rocket engines increasingly incorporates additive manufacturing techniques. However, the production of suitably scaled cooling channels, which are generally defined by small cross-sections, frequently leads to relatively high surface roughness as a consequence of the manufacturing process. This, along with the influence of strengthening microstructures [10], significantly affects friction and heat transfer. Previous studies [11,12], have shown that a surface roughness of 10 µm improves heat transfer and cooling, thereby reducing the wall temperature. Pizzarelli et al. [13] reported that a roughness of 6.3 µm lowered wall temperature by 295 K in the throat region due to increased turbulence, despite an 85% rise in pressure drop. Shokri et al. [14] found that increasing the surface roughness of a copper alloy sixfold raised the pressure drop by 1.2% at 9 MPa, thereby enhancing thermal equilibrium and heat flux. Zhang et al. [15] demonstrated that artificial roughness, through the alteration of rib height or pitch, intensified flow disturbances and vortex formation, which improved heat transfer and increased the pressure drop while reducing the impact of extreme specific heat capacity. Latiniet al. [16] emphasized that high- roughness channels, despite a greater friction loss, improve heat transfer and cooling. Meanwhile, applying low-roughness assumptions to these channels can lead to errors. To address this issue, Aupoix’s correction to the Spalart–Allmaras model for high roughness in external flows has been adapted for high-roughness channels. Santese et al. [17] stressed the need to adjust models for high roughness to predict cooling performance in additively manufactured rocket engines accurately. Testing the Spalart–Allmaras model with the Boeing roughness correction in ANSYS Fluent 2021 R2 showed a need to adjust the turbulent Prandtl number. Nasser, as cited in [18], noted that aspect ratios, surface roughness, and hydrocarbon impurities present in LNG significantly impact heat transfer deterioration (HTD).
Studies have yet to investigate the influences of fuel composition and channel roughness under subcritical conditions in rocket engine cooling systems. Motivated by this research gap, this study characterized the thermophysical properties of the fuel, along with the surface roughness of the cooling channels, for ignition experiments conducted on a 1 kg/s-class thrust chamber. Specifically, the effects of variations in the above parameters on the flow and heat transfer characteristics of spiral-grooved cooling channels under subcritical conditions were investigated. Particular attention was given to elucidating the discrepancies between the observed convective cooling behavior and model predictions under actual ignition experiments. Furthermore, to validate the accuracy of the convective cooling calculation method, a comparative analysis of the experimental and predicted results was performed.

2. Experimental Method

2.1. Experimental Apparatus

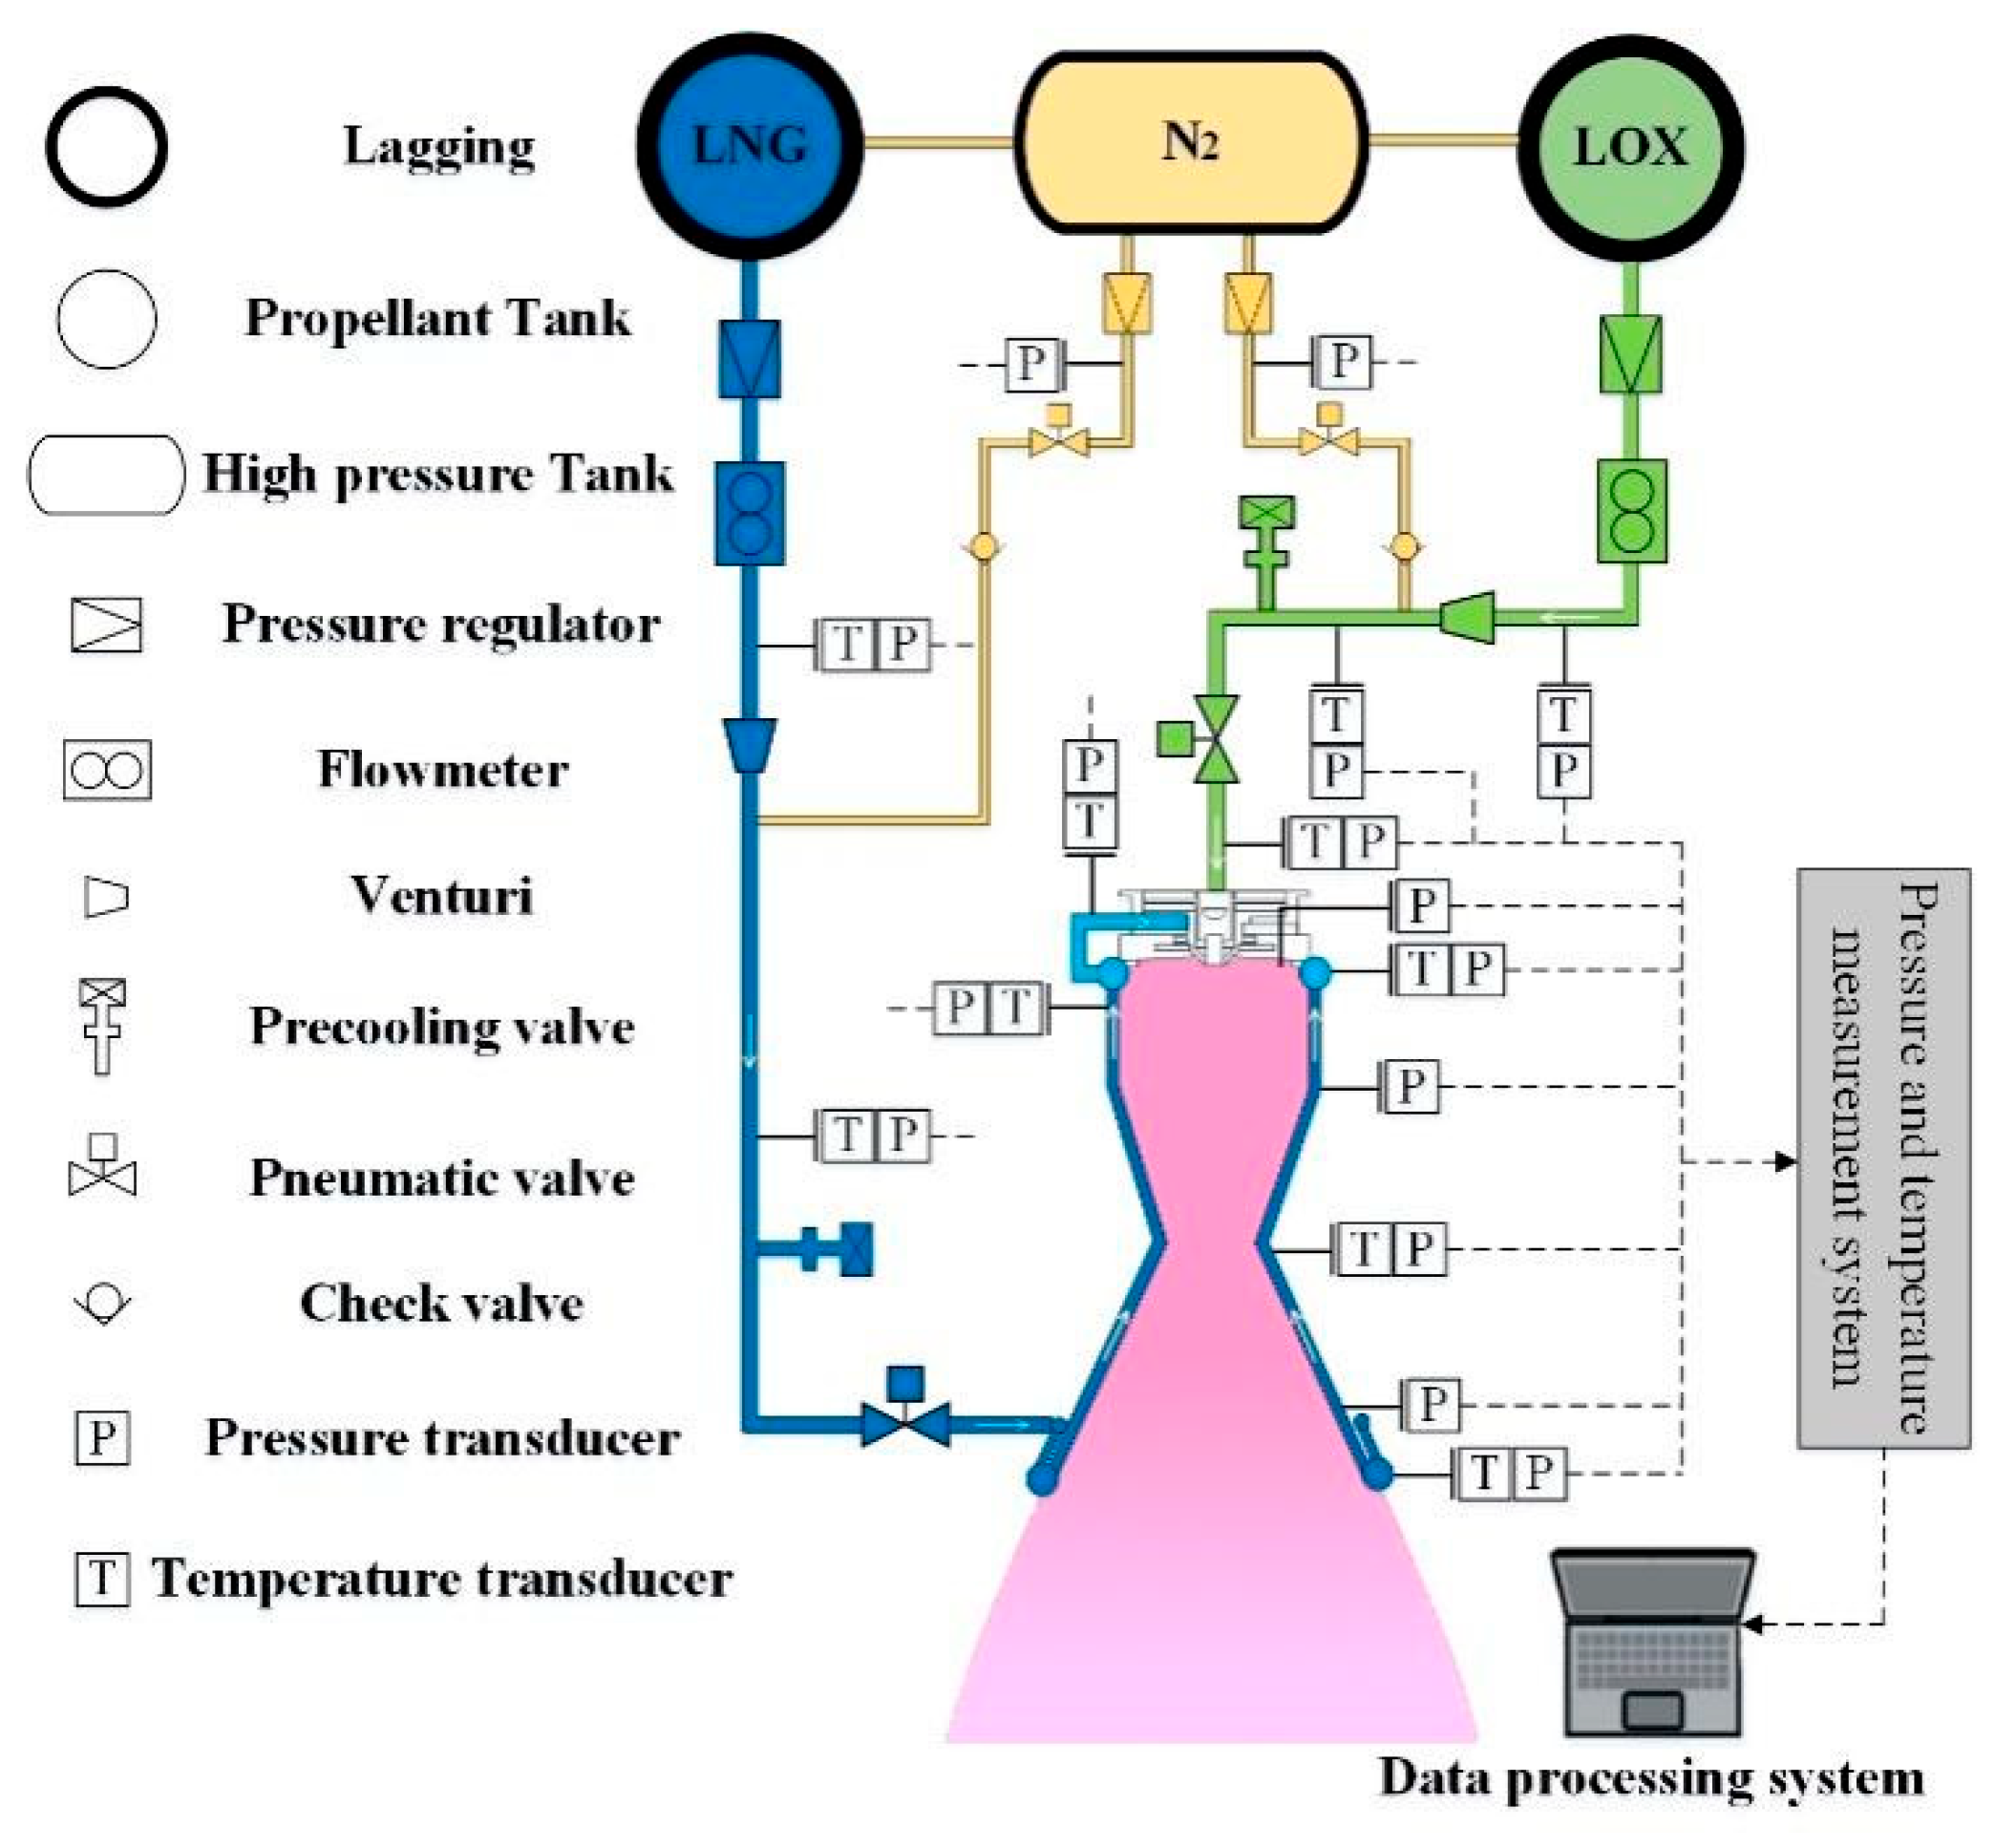
The LOX/LNG thrust chamber employed for ignition experiments is characterized by a 1 kg/s mass flow rate of propellant under 100% rated power level, as depicted in Figure 1. During the hot tests, high-pressure nitrogen is utilized to independently pressurize the LNG and LOX. Specifically, the LOX sequentially traverses the mass flowmeter and the Venturi tube, subsequently entering the collection cavity after passing through the main valve. The LOX pre-cooling valve, located upstream of the main valve, fulfills the dual functions of pre-cooling and shutdown discharge. Analogously, the LNG flows through the mass flowmeter and the Venturi tube, proceeds into the regenerative cooling channel to absorb heat, and then transitions into the LNG collection cavity. The LNG and the hot gas are arranged in a counter-flow configuration. The LNG pre-cooling valve is located upstream of the main valve, enabling pre-cooling and discharge during system shutdown. The ignition system utilized for the experiment features a spark plug igniter.
The experimental measurement parameters encompass the mass flow rate of LOX and LNG, as well as the temperature and pressure at various measuring points: before and after the Venturi tube of LOX/LNG, at each measuring point within the cooling channel, and prior to the injection of LOX/LNG. The data pertaining to temperature, pressure, and mass flow rate recorded during the ignition experiment are systematically collected and stored in a computer via a data acquisition device.
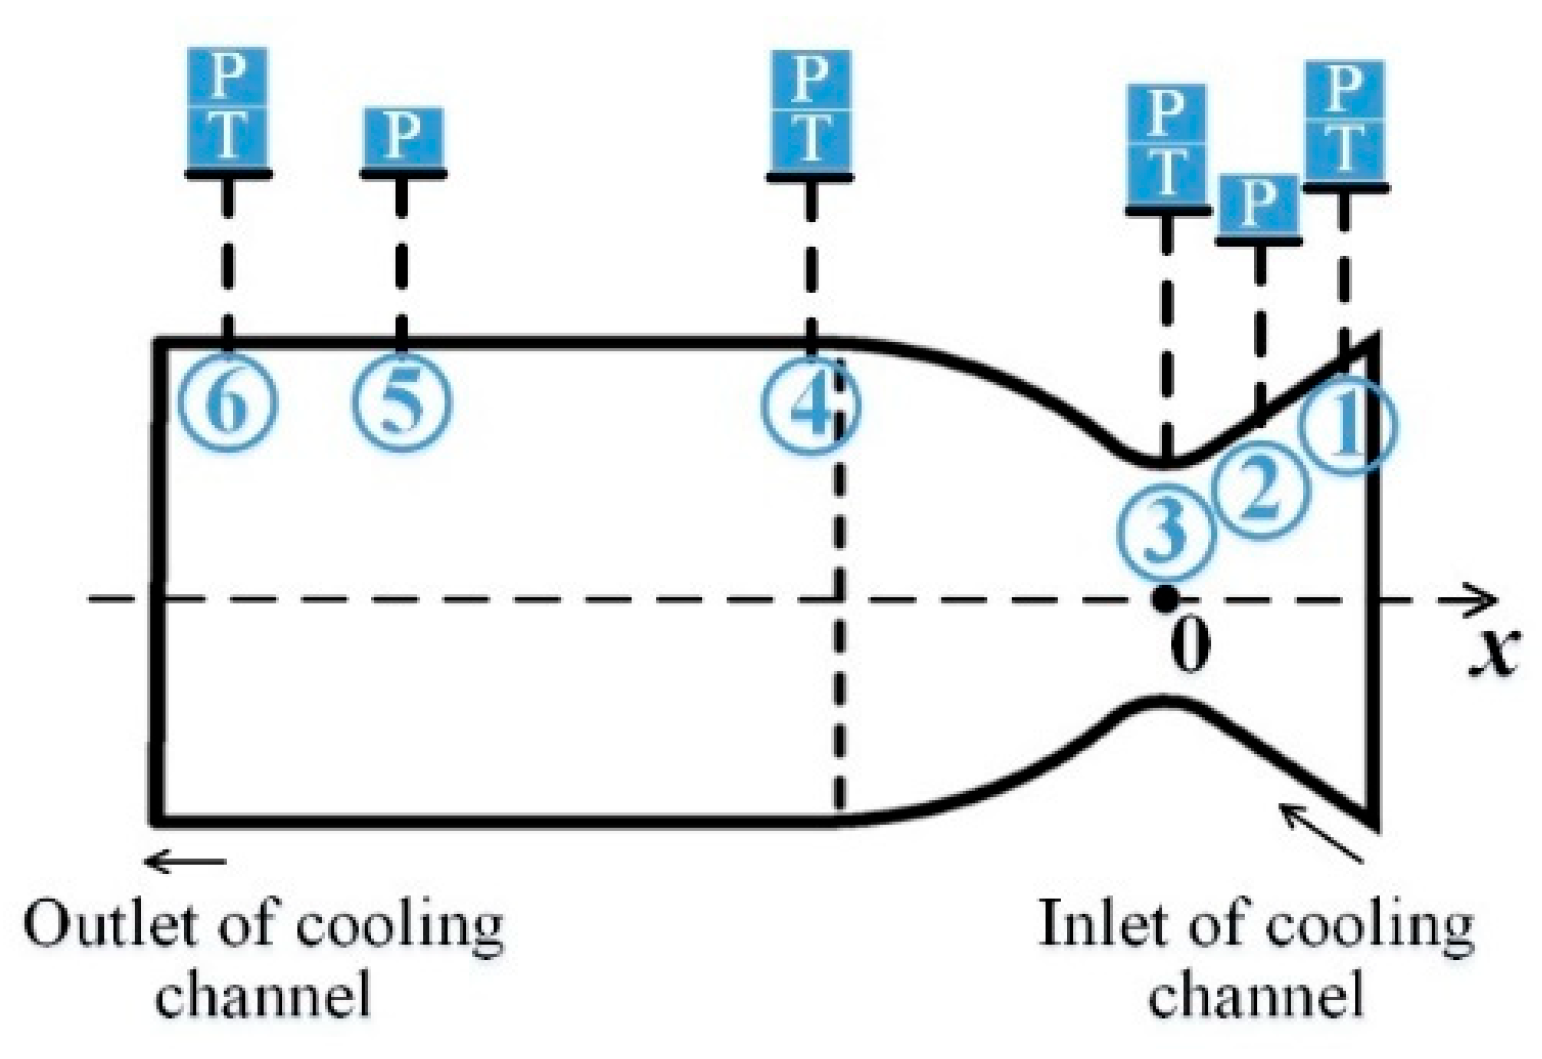
Figure 2 illustrates the spatial distribution of the temperature and pressure measurement points within the cooling channel of the thrust chamber. Specifically, temperature measurement points are positioned at the inlet collection cavity of the cooling channel (measurement point 1), the throat (measurement point 3), the nozzle contraction section (measurement point 4), and the outlet collection cavity of the cooling channel (measurement point 6). The pressure measurement locations are situated at the cooling channel inlet collection cavity (measurement point 1), the nozzle expansion section (measurement point 2), the throat (measurement point 3), the nozzle contraction section (measurement point 4), the cylindrical section (measurement point 5), and the outlet collection cavity of the cooling channel (measurement point 6).
For pressure measurements, the Hefei-Zhongya® (Hefei, China) differential pressure transmitter was selected, which features a measurement range of 0~10 MPa and a measurement accuracy of ±0.5% of the full scale. The platinum resistance temperature sensor, obtained from Beijing-Saiyiling® (Beijing, China), was employed for experimental measurements of fluid temperature within a range of 73.2 to 473.2 K, exhibiting an accuracy of ±(0.15 + 0.002|T|). In the ignition experimental system of the ground thrust chamber, mass flowmeters are installed ahead of the LOX and LNG Venturi tubes. The Endress + Hauser® (Reinach, Switzerland) Coriolis mass flowmeter, with an output current signal range of 4~20 mA, a measurement range of 0~1250 g/s, and an accuracy of ±0.5% of the reading value, was selected for mass flow measurement. A Wuhan-Puchuang® (Wuhan, China) data acquisition device was utilized to gather temperature, pressure, and mass flow rate signals for subsequent processing on a computer. It comprises 24 data acquisition channels and is capable of direct voltage signal collection within a range of ±10 V, with a sampling rate of 140 KSPS per channel. The measurement error for each channel is less than ±0.2% of the full scale.

2.2. Data Reduction and Uncertainty Analysis

The accuracy of experimental data is significantly influenced by the employed data processing methodology. To ensure that the experimental results are accurate, a comprehensive exposition is provided on the calculated models pertinent to experimental combustion efficiency, gas thermal properties, and other associated parameters.
The mixture ratio (MR) is delineated as the ratio of the oxidizer to the fuel mass flow rate.
M R = m ˙ ox m ˙ LNG
The combustion efficiency (ηc) represents the degree of energy conversion losses occurring in the combustion chamber.
η c = c c th
The theoretical characteristic speed (c) is computed utilizing RPA® V.4.0 software, while the actual characteristic speed ( c th ) is determined according to Equation (3).
c th = p c A t / ( m ˙ ox + m ˙ LNG )
Given the experimentally measured chamber pressure and mixture ratio, the gas thermal properties are also calculated using RPA® V.4.0 software.
In addition, utilizing the standard uncertainty analysis methodology, the uncertainties associated with the heat transfer coefficient (HTC), heat flux, mass flux, and other relevant parameters are determined. The maximum relative uncertainties for the experimental parameters are presented in Table 1.

3. Calculation Method

3.1. One-Dimensional Coupled Solution Models

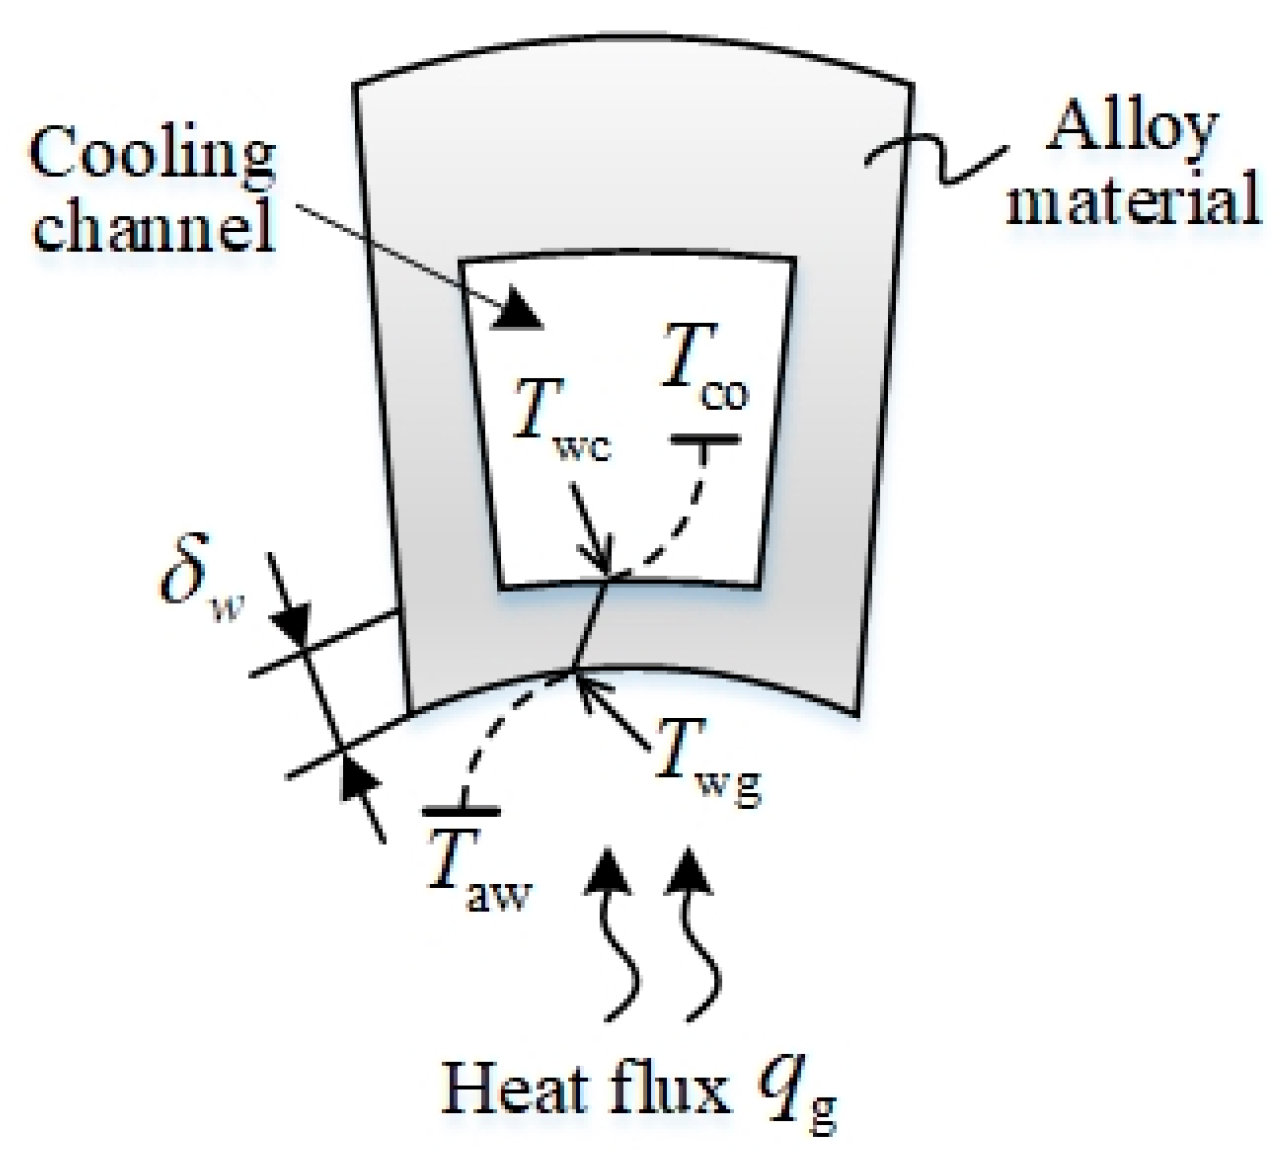
The process of convective cooling in conjunction with heat transfer is depicted in Figure 3. By disregarding the radiative heat transfer of the combustion chamber gas and the convective heat transfer between the outer wall of the thrust chamber and the external environment [19,20], the primary focus of convective cooling heat transfer is on the convective heat transfer between the combustion chamber gas and the gas-side wall, the conduction of heat through the inner wall of the thrust chamber, and the convective heat transfer between the coolant and the coolant-side wall.
The heat transfer of the regenerative cooling process (Q) can be expressed as:
Q = h tot A g T aw T co
The total HTC (htot) is calculated according to Equation (5).
h tot = 1 1 h g A g + δ w λ w + 1 h co η o A co
The one-dimensional model of the cooling channel is predicated upon the following assumptions: (1) the radiation heat loss from the combustion chamber wall is neglected, implying that all heat transferred from the gas to the chamber wall is entirely absorbed by the coolant; (2) the axial heat conduction within the combustion chamber wall is disregarded; (3) the coolant is assumed to flow completely within the channel, with all its parameters remaining uniform along the axial cross-section of the cooling channel; and (4) the outer wall of the combustion chamber is considered to be insulated.

3.1.1. Calculation Models of the Combustion Chamber Temperature Field

Within the combustion chamber, the propellant experiences a chemical reaction accompanied by vigorous combustion, resulting in the production of high-temperature, high-speed gases, which establish a turbulent boundary layer along the chamber walls. Thus, the heat transfer between the gases and the chamber walls is characterized by turbulent convective heat exchange. Amidst this turbulent gas flow, a stagnant gas layer, referred to as the laminar sublayer, is present adjacent to the wall, primarily due to the prevailing viscous forces. Consequently, the convective heat transfer occurring between the gas within the combustion chamber and the inner wall surface on the gas side encompasses both turbulent convective heat transfer and laminar boundary layer heat transfer. Given the complexity associated with boundary layer phenomena, and as discussed in the relevant literature [21], the heat flux (qg) on the gas side is determined using the following equation:
q g = h g ( T aw T wg )
The heat transfer of the gas side (Qg) is calculated as:
Q g = q g A g
The methodologies for calculating the adiabatic wall temperature (Taw) and the convective heat transfer coefficient of the gas (hg) are comprehensively outlined in the literature [22].

3.1.2. Calculation Models of Wall Temperature Field

Owing to the thin inner wall of the thrust chamber and the high thermal conductivity of the chosen material, the transient effects of heat transfer can be disregarded: it is assumed that the thrust chamber rapidly attains a stable thermal equilibrium state post-ignition. In accordance with Fourier’s law, the heat flux (qw) through the inner wall of the thrust chamber is determined:
q w = λ w δ w ( T wg T wc )
The heat transfer through the inner wall of the thrust chamber (Qw) is calculated as:
Q w = q w A g

3.1.3. Calculation Models of Temperature Field in the Cooling Channel

Within the cooling channel, heat is transferred from the coolant to the wall via convective heat transfer. The convective heat transfer coefficient on the coolant side (hco) is determined using the forced convective heat transfer formula applicable to flow within a channel.
q co = h co ( T wc T co )
The cooling channel of the thrust chamber consists of multiple parallel-connected channels, making it necessary to consider the rib effect in the convective heat transfer calculations. Consequently, the heat transfer on the coolant side (Qco) is calculated as:
Q co = q co A co η tot
The total efficiency of the rib surface (ηtot) is calculated according to Equation (12).
η tot = A 1 + η rib A 2 / A tot
The total rib area (Atot) is calculated as:
A tot = A 1 + A 2
The rib efficiency (ηrib) is calculated as:
η rib = t h ( m H ) m H
m H = 2 h λ w δ w H
The thermophysical properties of the coolant are crucial for heat transfer calculations within the cooling channel, particularly when phase-change heat transfer occurs. Numerous correlation criteria exist for convective heat transfer on the coolant side, making the selection of an appropriate heat transfer correlation essential for analyzing the heat transfer process in the cooling channel across different phase states.
For the calculation of heat transfer in the single-phase region of the methane coolant, the Gnielinski formula (Equation (16)) is selected, which incorporates the entrance effect correction factor (cl) and the temperature correction factor (ct).
N u = ( f / 8 ) ( R e 1000 ) P r 1 + 12.7 f / 8 ( P r 2 / 3 1 ) c l c t
The entrance effect correction coefficient (cl) and the temperature correction factor (ct) are determined using the following formulae:
c l = 1 + ( D rc L ) 2 / 3
For a liquid fluid,
c t = ( P r co P r wc ) 0.11
For a gaseous fluid,
c t = ( T co T wc ) 0.45
The definitions and calculation methods for the other parameters in Equation (16) are comprehensively detailed in Reference [23].
Importantly, two-phase heat transfer calculations are performed according to the correlation for LNG flow boiling heat transfer, derived from prior experimental studies [24].
N u = a B o a 1 W e b 1 K p c 1 X d 1 C o e 1 F t g f 1 , ( x 0.4 ) ( 5 10 x ) a B o a 1 W e b 1 K p c 1 X d 1 C o e 1 F t g f 1 + ( 10 x 4 ) β B o a 2 W e b 2 K p c 2 X d 2 C o e 2 F t g f 2 , ( 0.4 < x < 0.5 ) β B o a 2 W e b 2 K p c 2 X d 2 C o e 2 F t g f 2 , ( x 0.5 )
The values of each coefficient in Equation (20) are shown in Table 2. The definitions and calculated methods for each dimensionless parameter are thoroughly explained in Reference [24]. Given the difficulty in achieving a satisfactory fit for the heat transfer correlation via dimensionless parameters within the heat transfer transition (HTT) region (0.4 < x < 0.5). Accordingly, to maintain a smooth variation in the HTC with vapor quality, a linear interpolation approach based on vapor quality is employed herein to compute the HTC.
The convective heat transfer coefficient of the coolant is affected by numerous factors; the heat transfer characteristics are significantly dependent on the wall temperature of the coolant-side and the coolant pressure. The pressure drop (Δp) within the cooling channel primarily comprises the frictional pressure drop (Δpfr), the accelerated pressure drop (Δpac), the gravitational pressure drop (Δpgr), and the local pressure drop (Δplo) [24,25].
Δ p = Δ p fr + Δ p ac + Δ p gr + Δ p lo
The methodologies for calculating the friction pressure drop (Δpfr) and the accelerated pressure drop (Δpac), as outlined in Equation (21), are comprehensively explained in Reference [25]. The procedures for determining the gravitational pressure drop (Δpgr) and the local pressure drop (Δplo) are described below.
For single-phase fluids, the gravitational pressure drop of the single-phase flow (Δpgr) is calculated as:
Δ p gr = ρ g L
The local pressure drop of the single-phase flow (Δplo) is calculated as:
Δ p lo = φ G 2 2 ρ L D rc
The local resistance coefficient (φ) is determined by Equations (24) and (25).
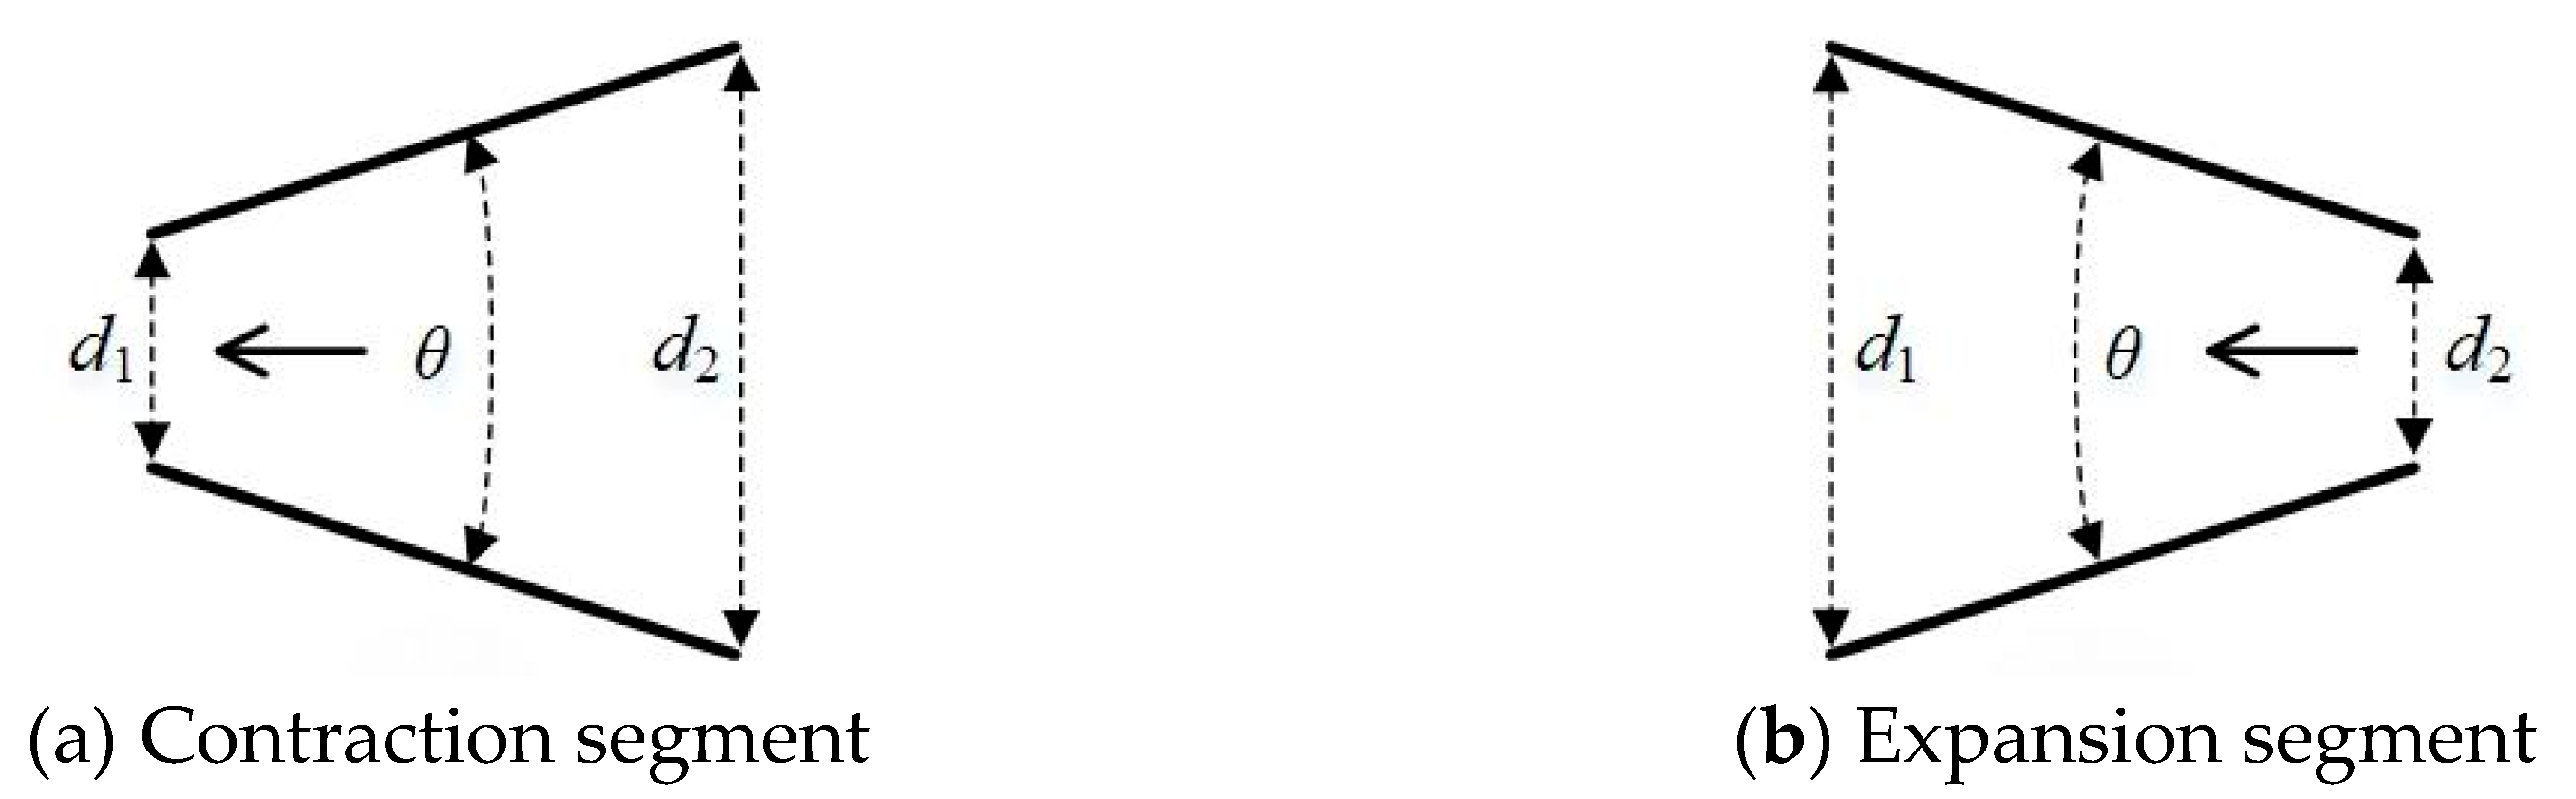
In the expansion section of the nozzle, aligned with the direction of coolant flow, the cooling channel exhibits a gradually converging configuration (Figure 4a). The local resistance coefficient (φ) is calculated as:
φ = f 8 sin ( θ 2 ) × ( 1 ( d 2 2 d 1 2 ) 2 )
The flow friction coefficient (f) is determined in accordance with the Colebrook Equation (25), as in Reference [26].
1 f = 2 lg R a / D rc 3.7 + 2.51 R e f
The inner wall of the experimental section is analyzed for surface roughness using a 3D optical surface profilometer from Bruker® (Billerica, MA, USA), revealing an average surface roughness (Ra) of 1.5 μm.
In the contraction section of the nozzle, aligned with the direction of coolant flow, the cooling channel exhibits a gradually expanding configuration (Figure 4b). The local resistance coefficient (φ) is calculated as:
φ = f ρ g sin ( θ 2 ) × ( 1 ( d 1 2 d 2 2 ) 2 ) + K × ( 1 d 1 2 d 2 2 )
The K is derived from Equation (27).
K = 1.025 + 2.5 ( d 2 d 1 ) × 10 3 + 0.8 d 1 × 10 3
For two-phase fluids, under the assumption that the two-phase flow behaves as a homogeneous mixture with uniform flow velocity, a homogeneous model is utilized to calculate the pressure drop associated with the two-phase flow [26].
The gravitational pressure drop of two-phase flow (Δpgr) is calculated as:
Δ p gr = ρ v ε + ρ l ( 1 ε ) g
The bubble fraction of the two-phase flow within the homogeneous model ( ε ) is calculated via Equation (29).
ε = ρ l / ρ v 1 / x + ρ l / ρ v 1
The local pressure drop of the two-phase flow (Δplo) is calculated as:
Δ p lo = φ G 2 2 ρ hm L D rc
The local resistance coefficient (φ) is determined by Equations (26) and 27.
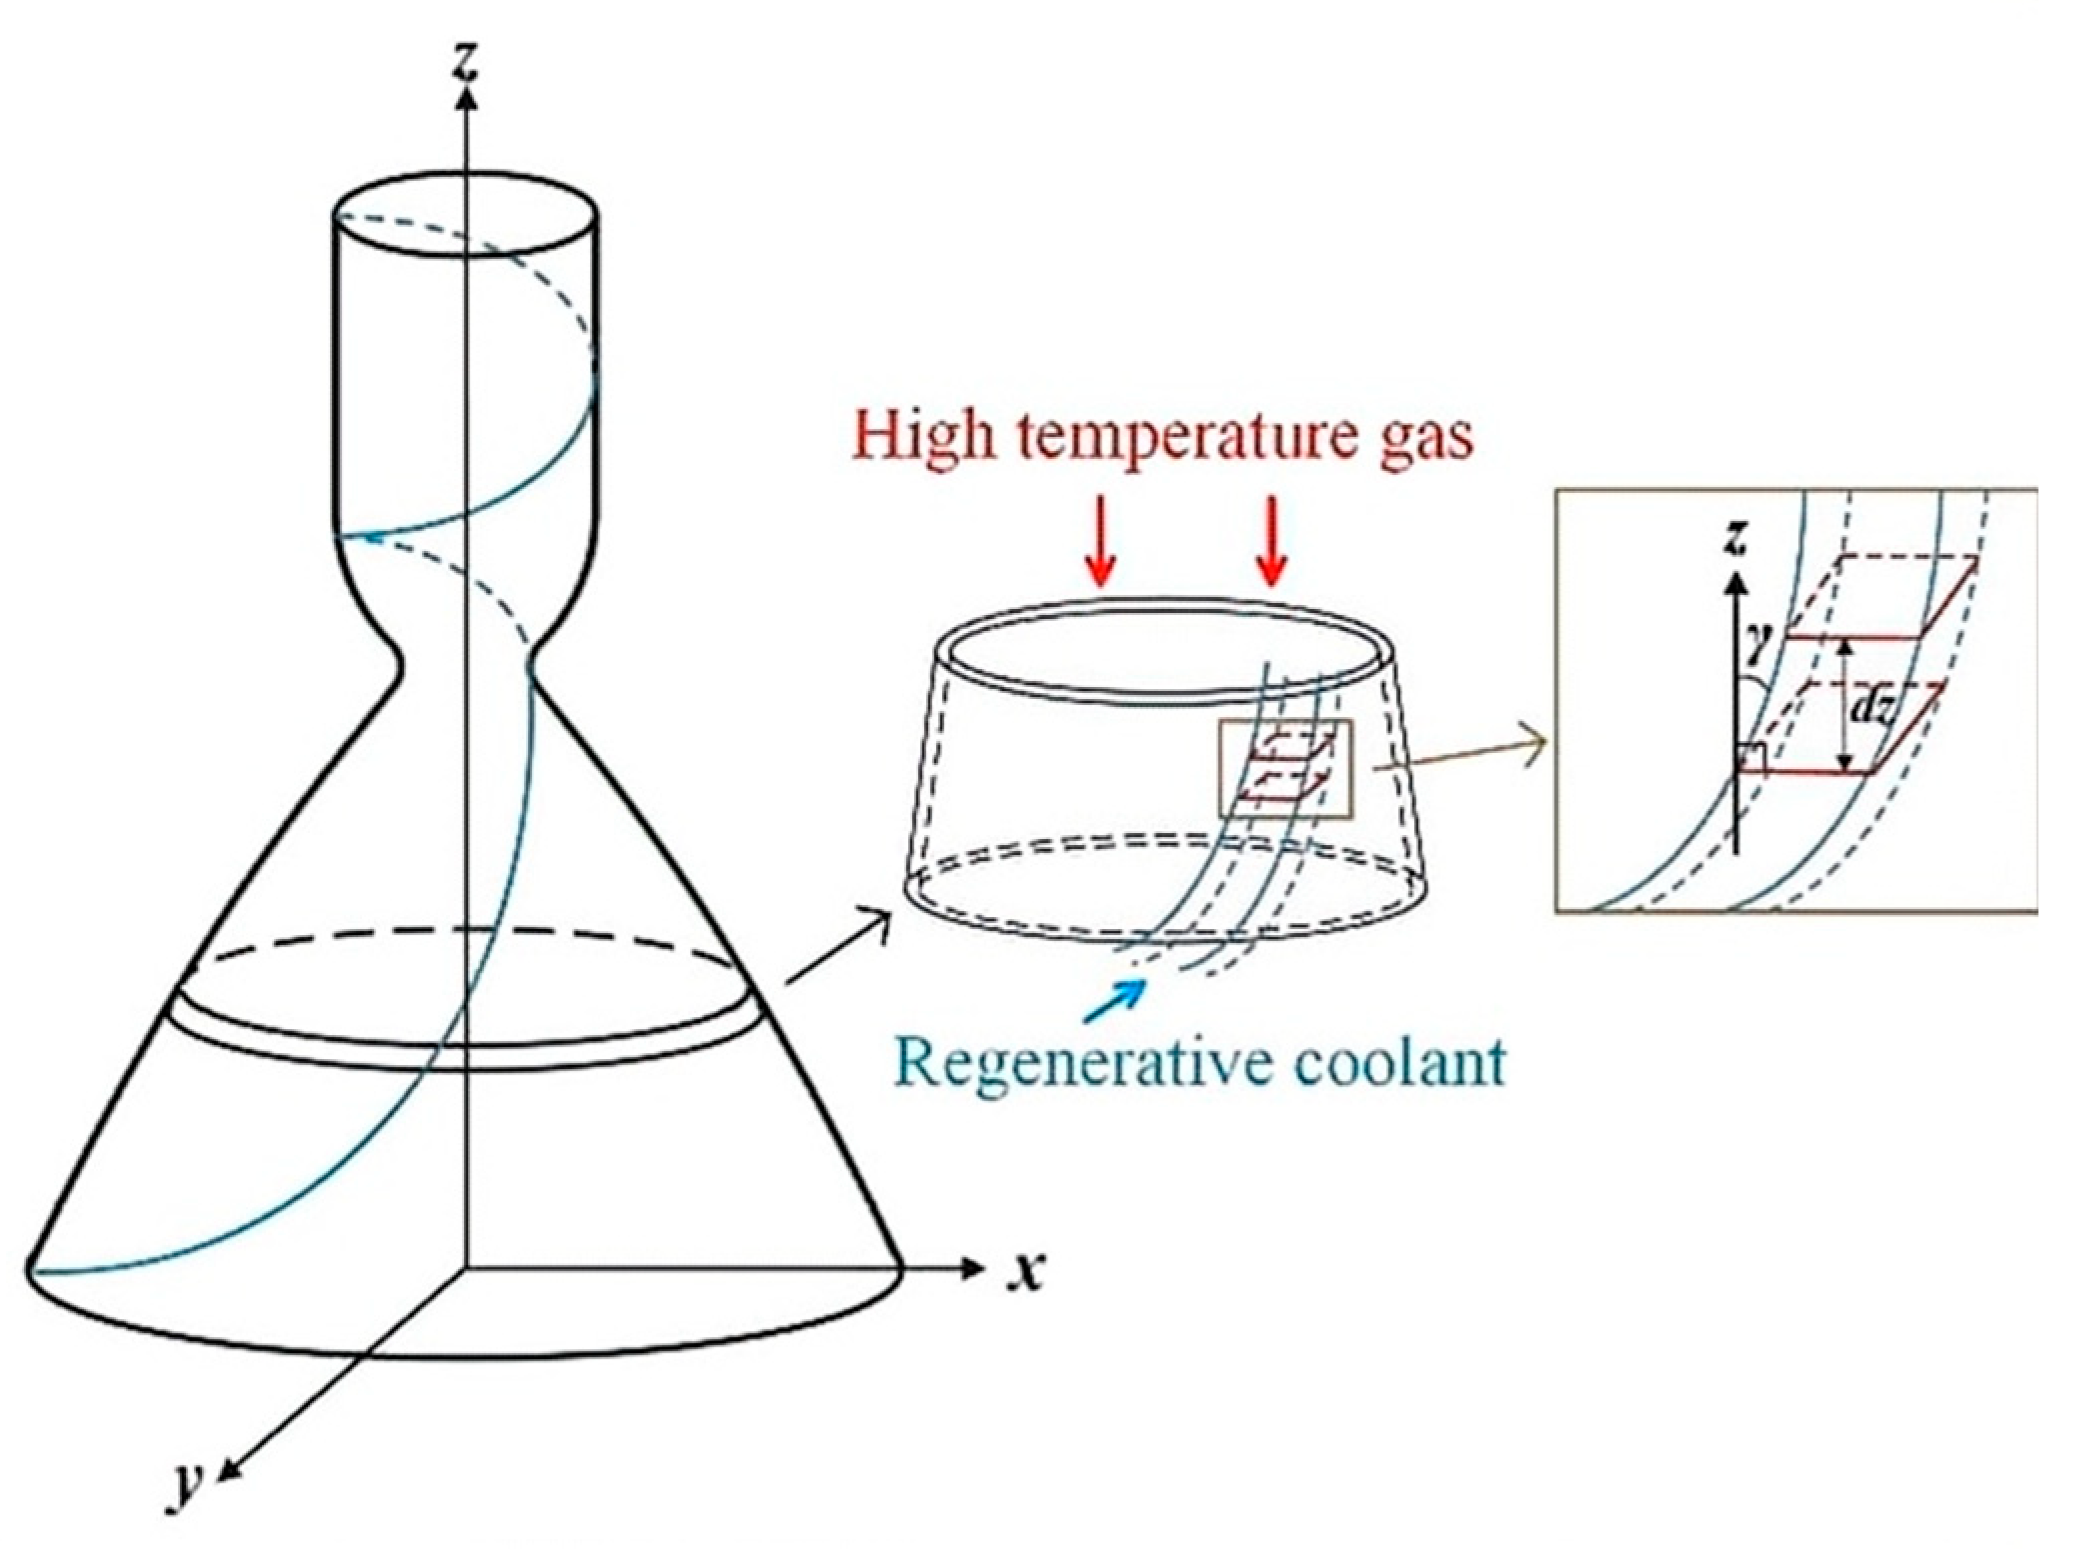
The inclination of the spiral line creates an angle γ (Figure 5) between the horizontal section and the flow section of the cooling channel, leading to a variation in the mass flux (G) between the spiral channel and the straight channel.
The mass flux (G) is calculated as:
G = m ˙ co N S cos γ
The precise determination of parameters associated with spiral lines is discussed in Reference [21].

3.2. One-Dimensional Coupled Solution Method

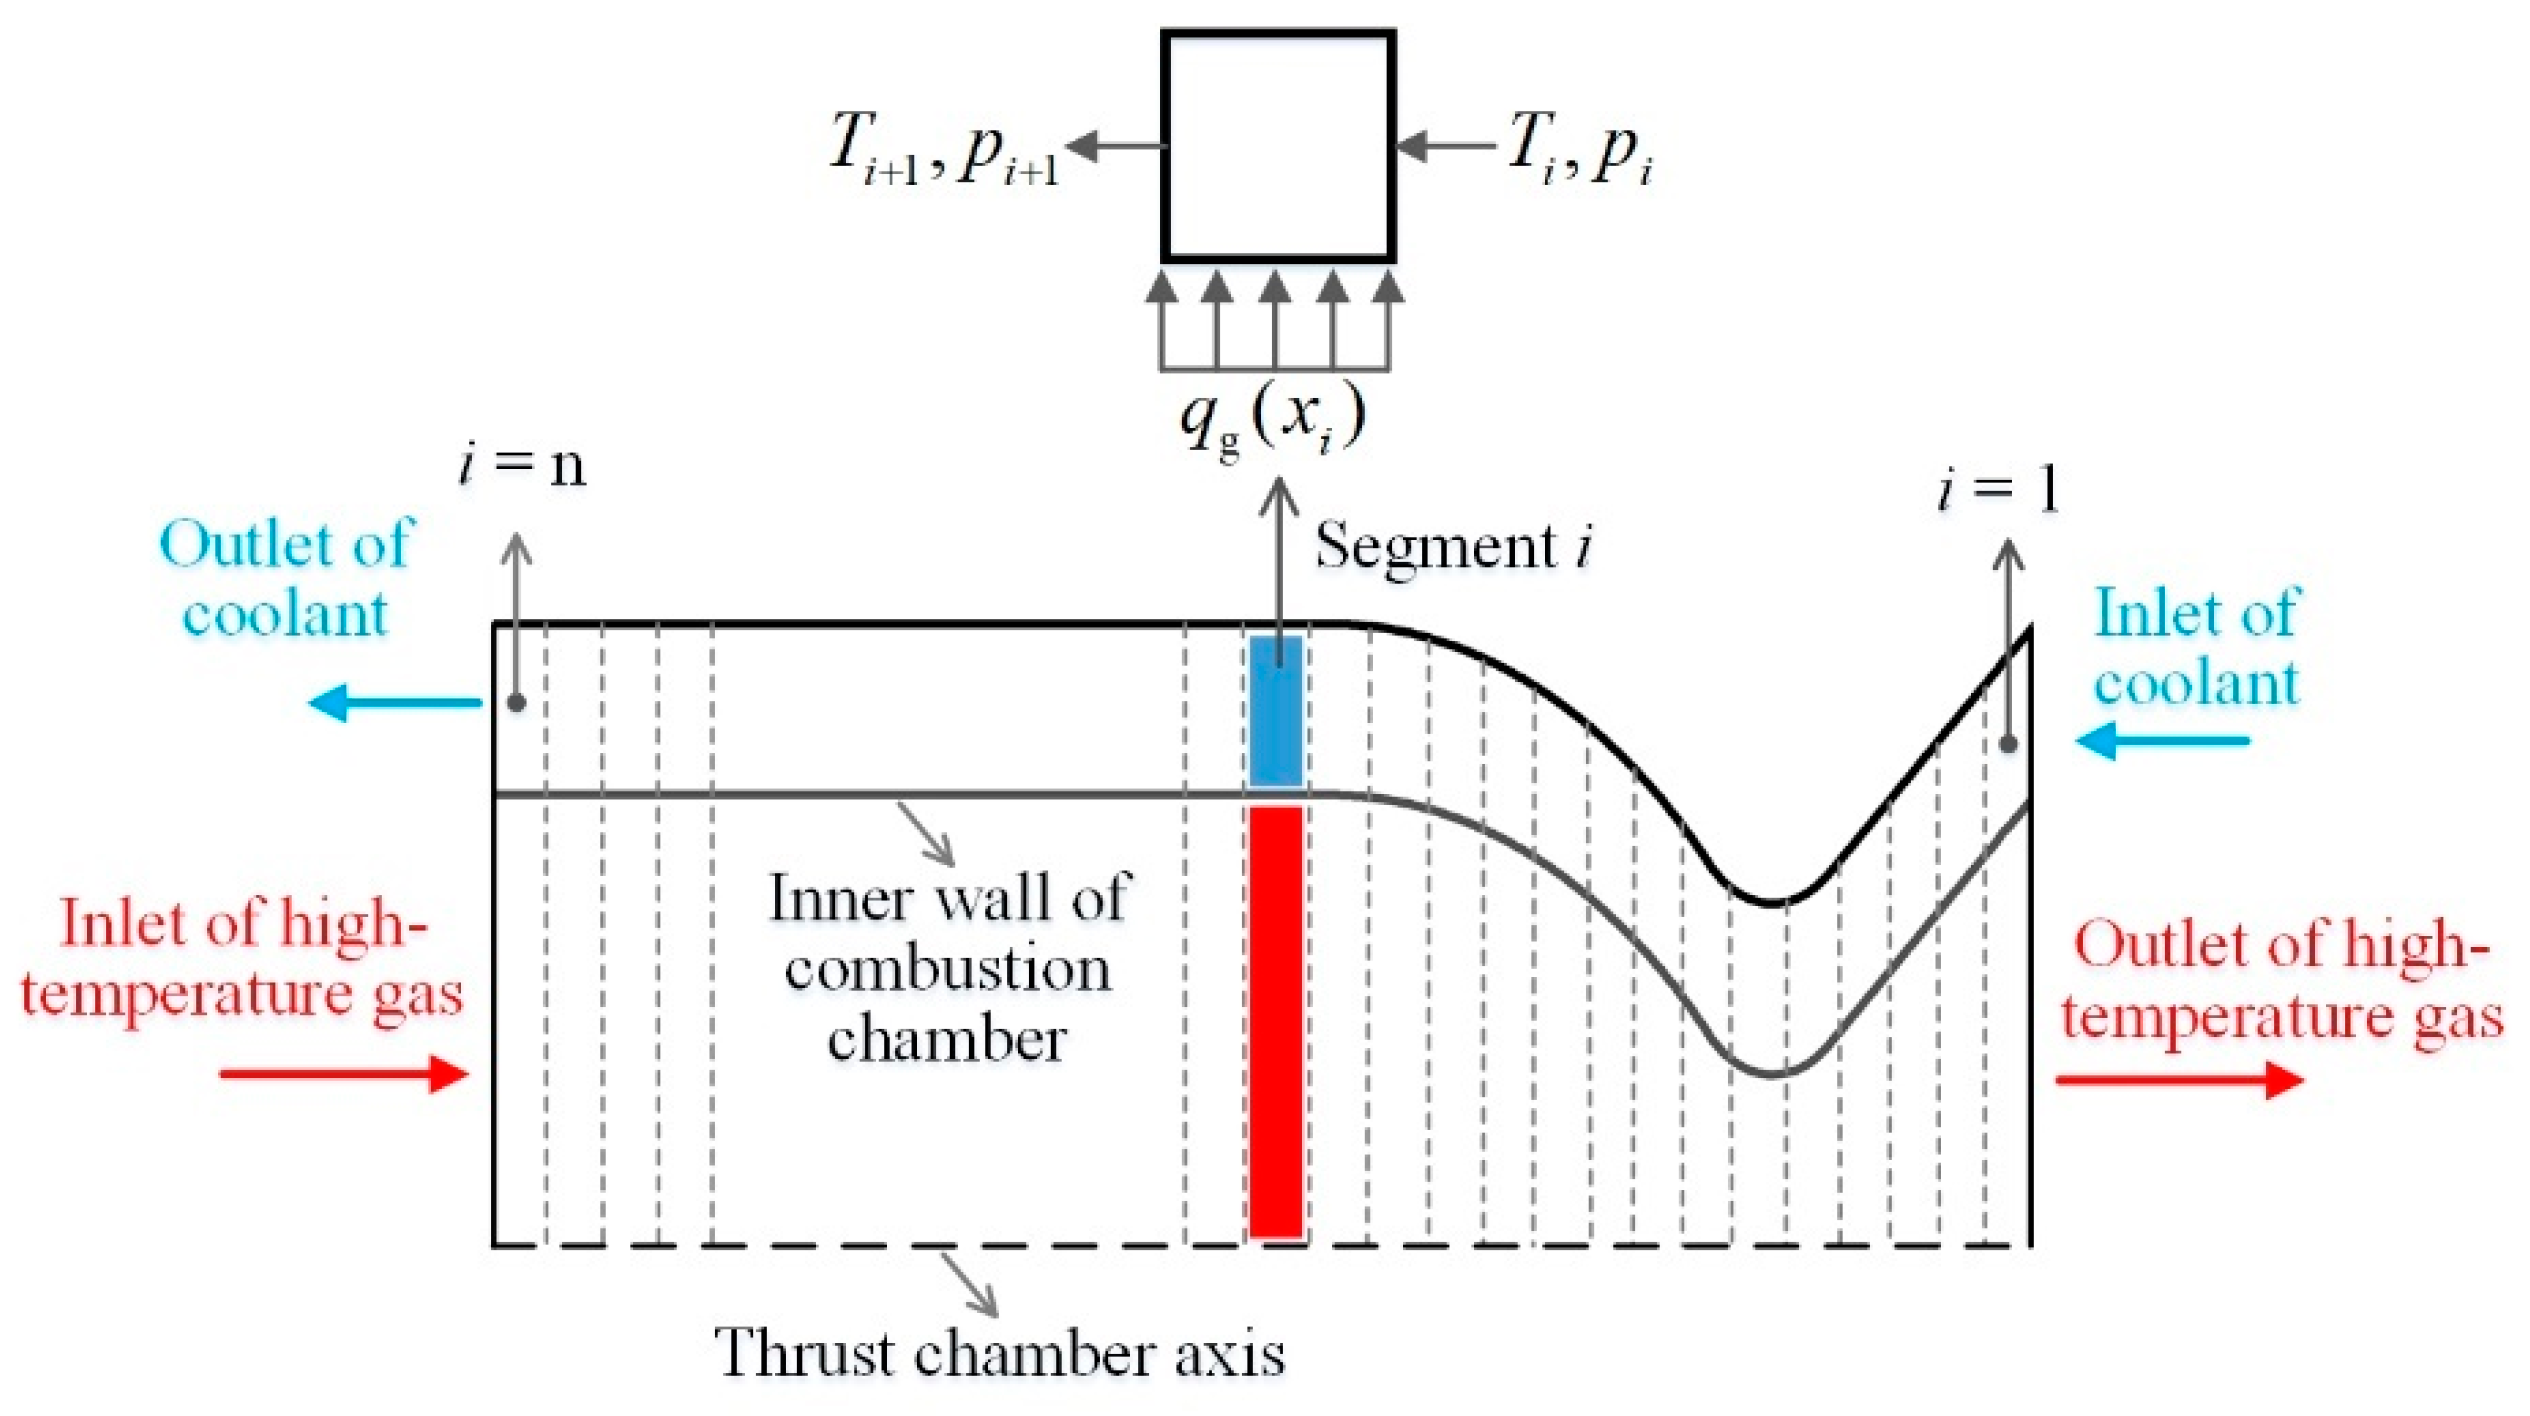
Figure 6 presents a schematic diagram of the heat transfer calculations. In the process of calculating heat transfer within the thrust chamber, the chamber is segmented into n axial micro-units, each of which is modeled as a cylindrical element. The distribution of these micro-units need does not need to be uniform; in regions experiencing elevated heat flux, the number of micro-units may be increased.
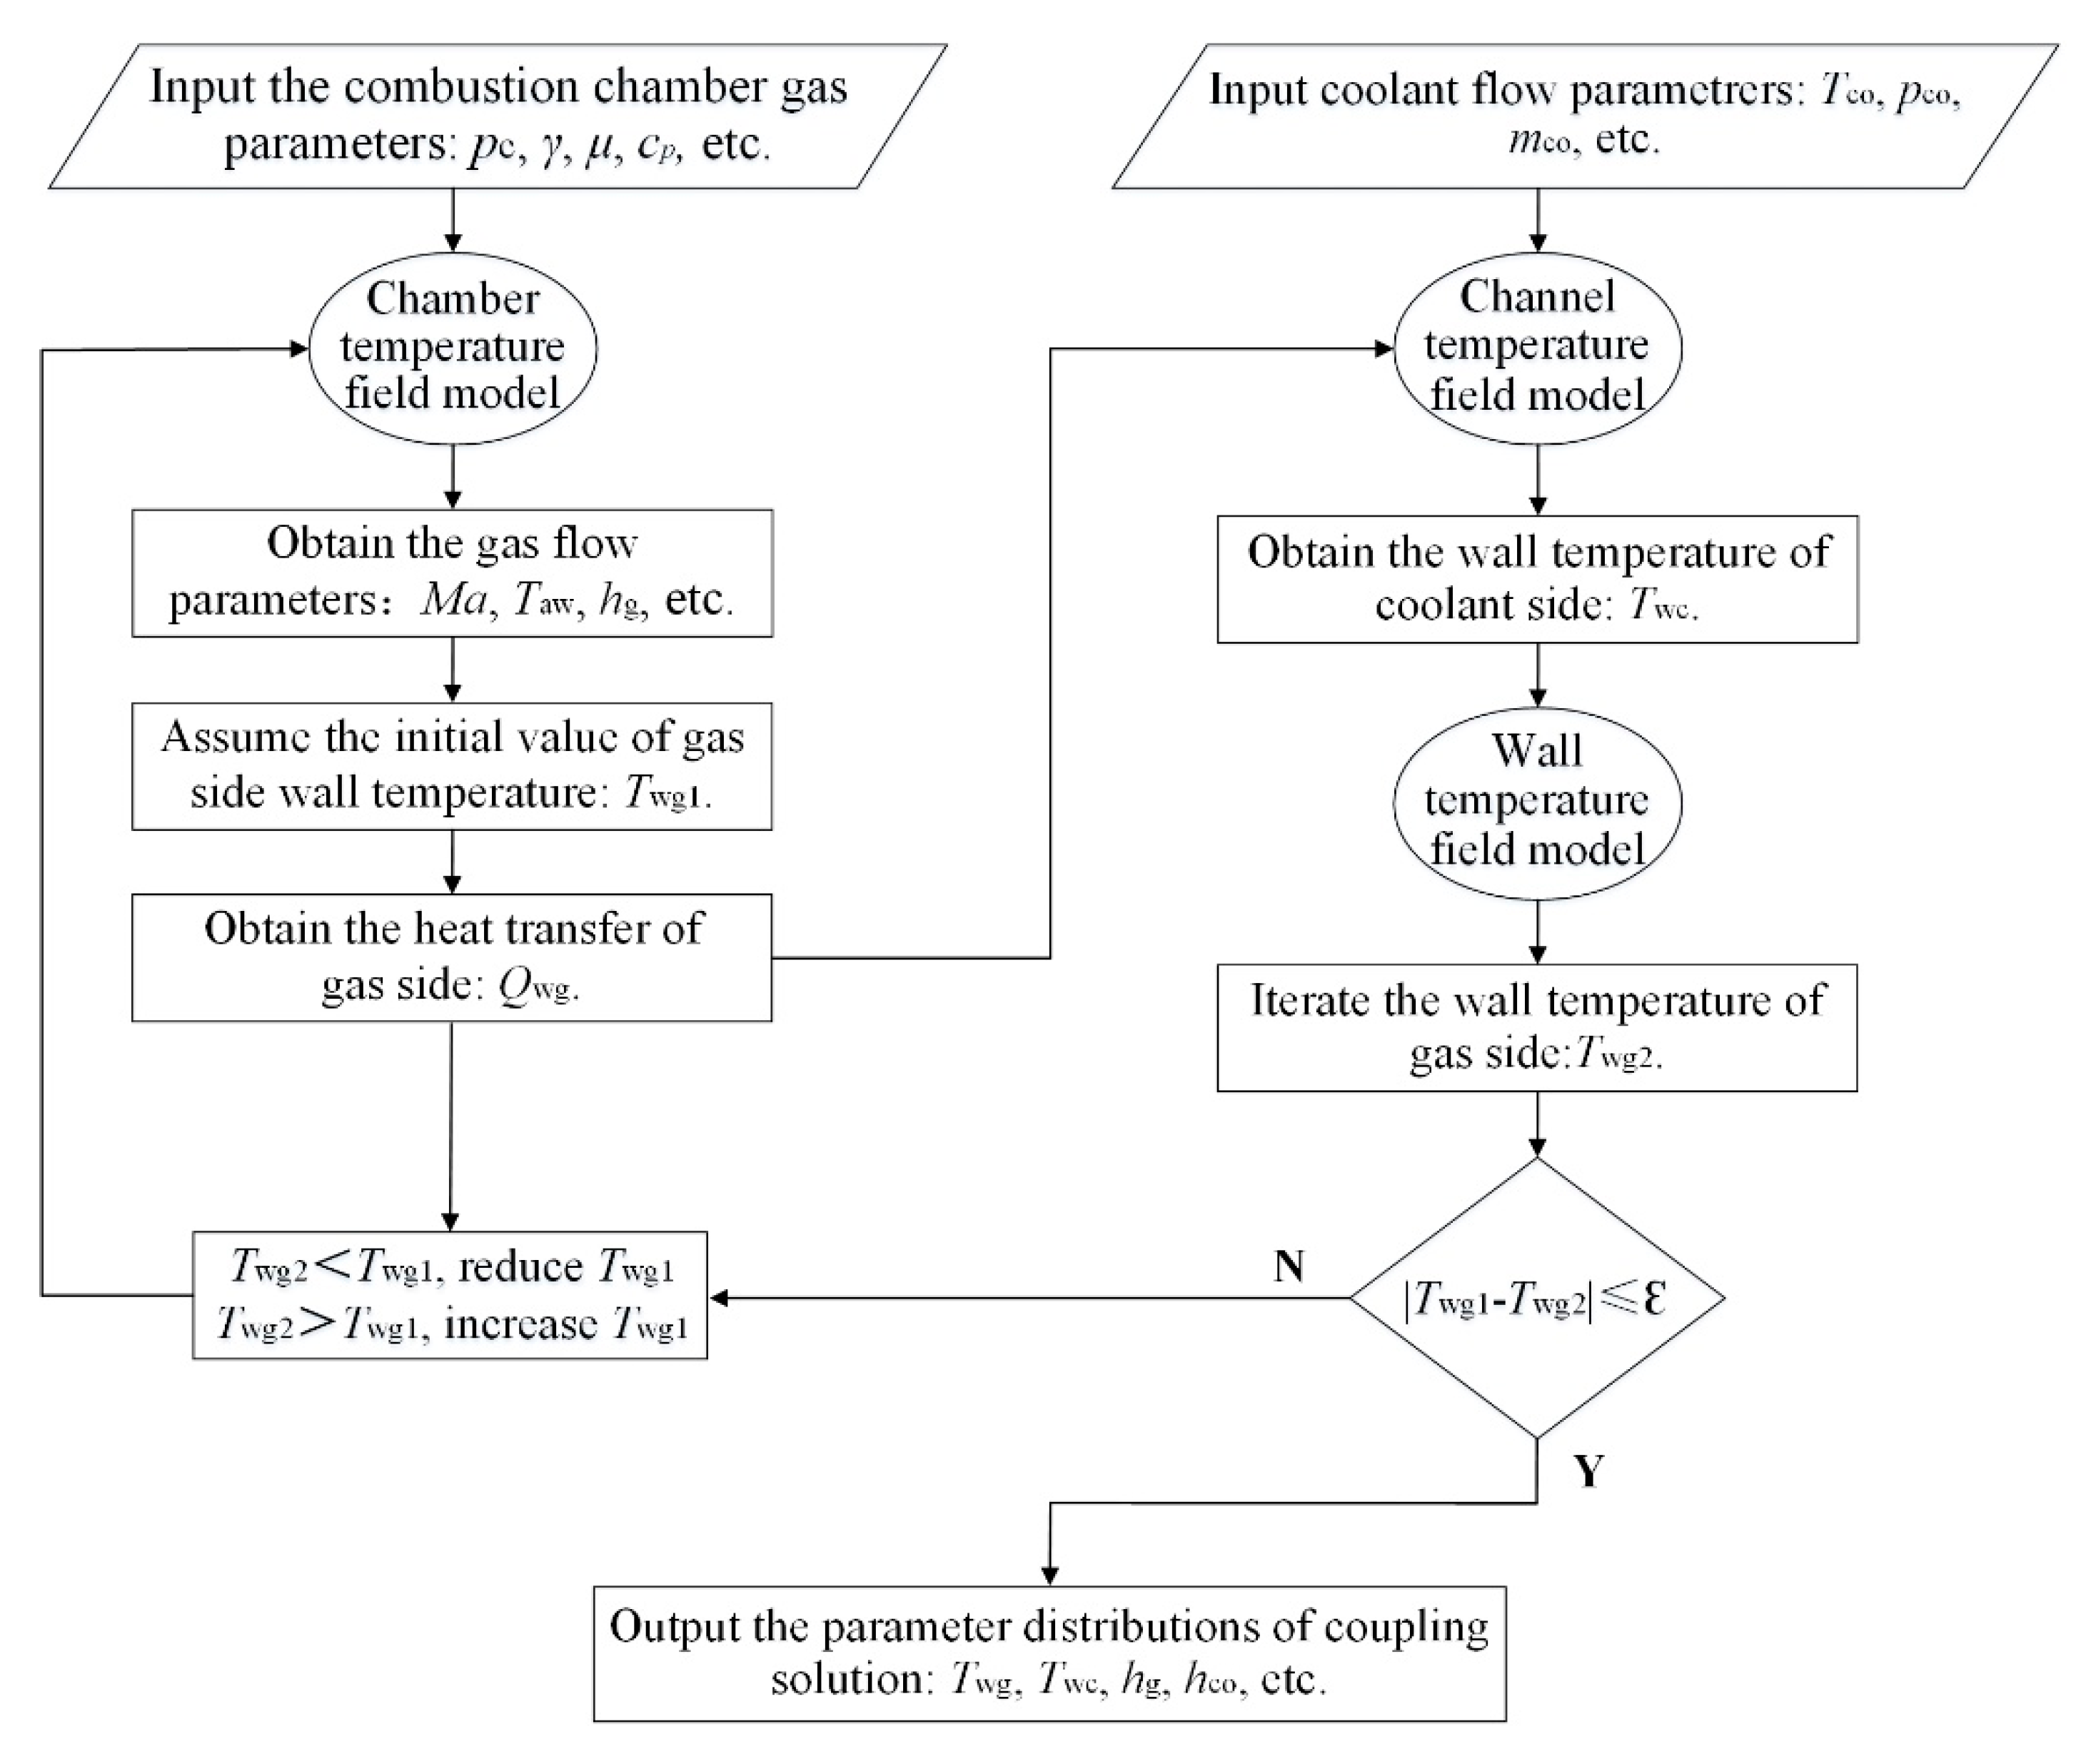
For the coolant side, given the known inlet conditions of temperature, pressure, and mass flow rate at the inlet of the cooling channel (i = 1), and assuming a heat flux for each micro-unit of the cooling channel, it is possible to determine parameters such as the coolant outlet temperature, pressure, HTC, and wall temperature on the coolant side of the i-th unit. These parameters function as the inlet conditions for the subsequent i + 1th unit, thereby facilitating the computation of wall temperatures and the thermal properties of the coolant throughout the cooling channel. For the gas side, the calculation of heat flux for any micro-unit necessitates an assumption regarding the gas-side wall temperature. Upon calculating the heat flux on the gas side, the wall temperature on the coolant side can be determined by utilizing the cooling channel temperature field calculation model. Furthermore, a revised gas-side wall temperature can be derived through the wall temperature field calculation model. Consequently, it is imperative to couple and solve the temperature fields on both the gas and coolant sides, as depicted in Figure 7. The aim of the coupled solution is to ensure that the heat transfer determined by the combustion chamber temperature field calculation model corresponds with the outcomes derived from the cooling channel temperature field calculation model for each micro-unit.

4. Results and Discussion

Table 3 shows the input parameters for the heat transfer simulation, in which the coolant (methane/LNG) at the inlet of the thrust chamber cooling channel is maintained in a subcritical state.

4.1. Simulation Analysis of Different Fuel Components

In the ground ignition experiment with a 1 kg/s propellant, LNG was selected as the fuel. The composition of the LNG was analyzed using a gas chromatograph, revealing that LNG consists of methane (CH4), ethane (C2H6), propane (C3H8), isobutane (C4H10), butane (C4H10), isopentane (C5H12), pentane (C5H12), and nitrogen (N2), as detailed in Table 4. Compared to pure methane, LNG exhibited higher critical pressure and critical temperature, with values of 4.94 MPa and 195.7 K, respectively.
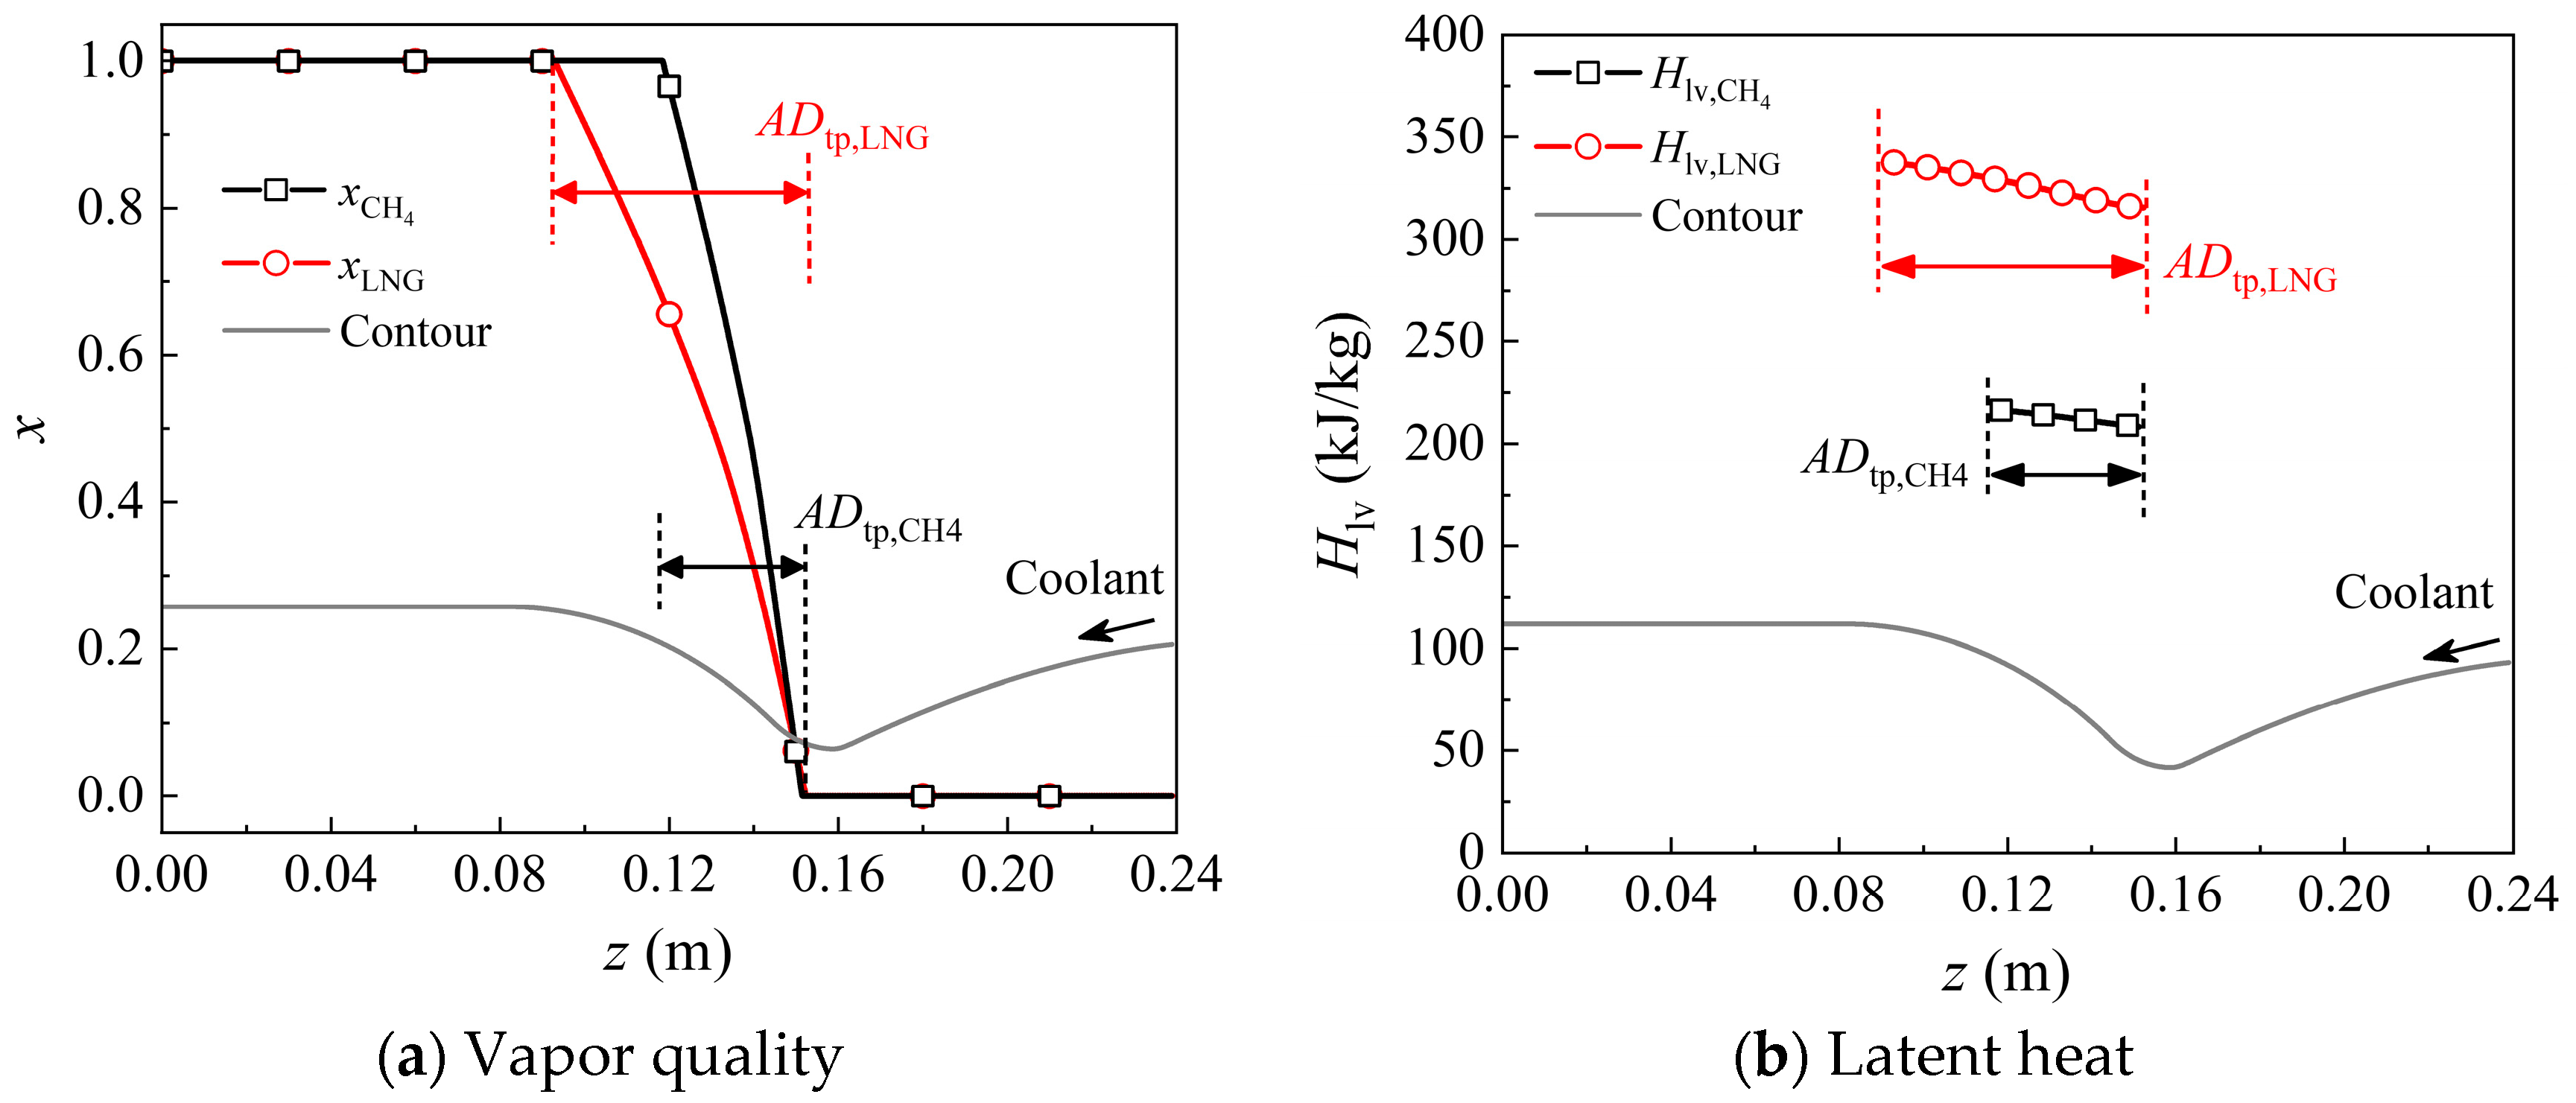
According to the vapor quality curve, both methane and LNG transition from the liquid phase to the two-phase region upstream of the nozzle contraction section. Notably, LNG demonstrates an extended axial distance within the two-phase region (ADtp,LNG), with its phase-transition point between the two-phase and gas-phase region occurring in the cylindrical section of the thrust chamber (Figure 8). In contrast, the phase-transition point for methane is situated within the contraction section of the nozzle. Further analysis of the latent heat of phase-transition for methane and LNG shows that the latent heat of LNG increases from 315.5 to 337.5 kJ/kg. Meanwhile, the latent heat of methane remains relatively low, rising from 208.3 to 216.5 kJ/kg. The high latent heat extends the two-phase region of LNG and leads to variations in the thrust chamber wall temperature, coolant temperature and pressure.
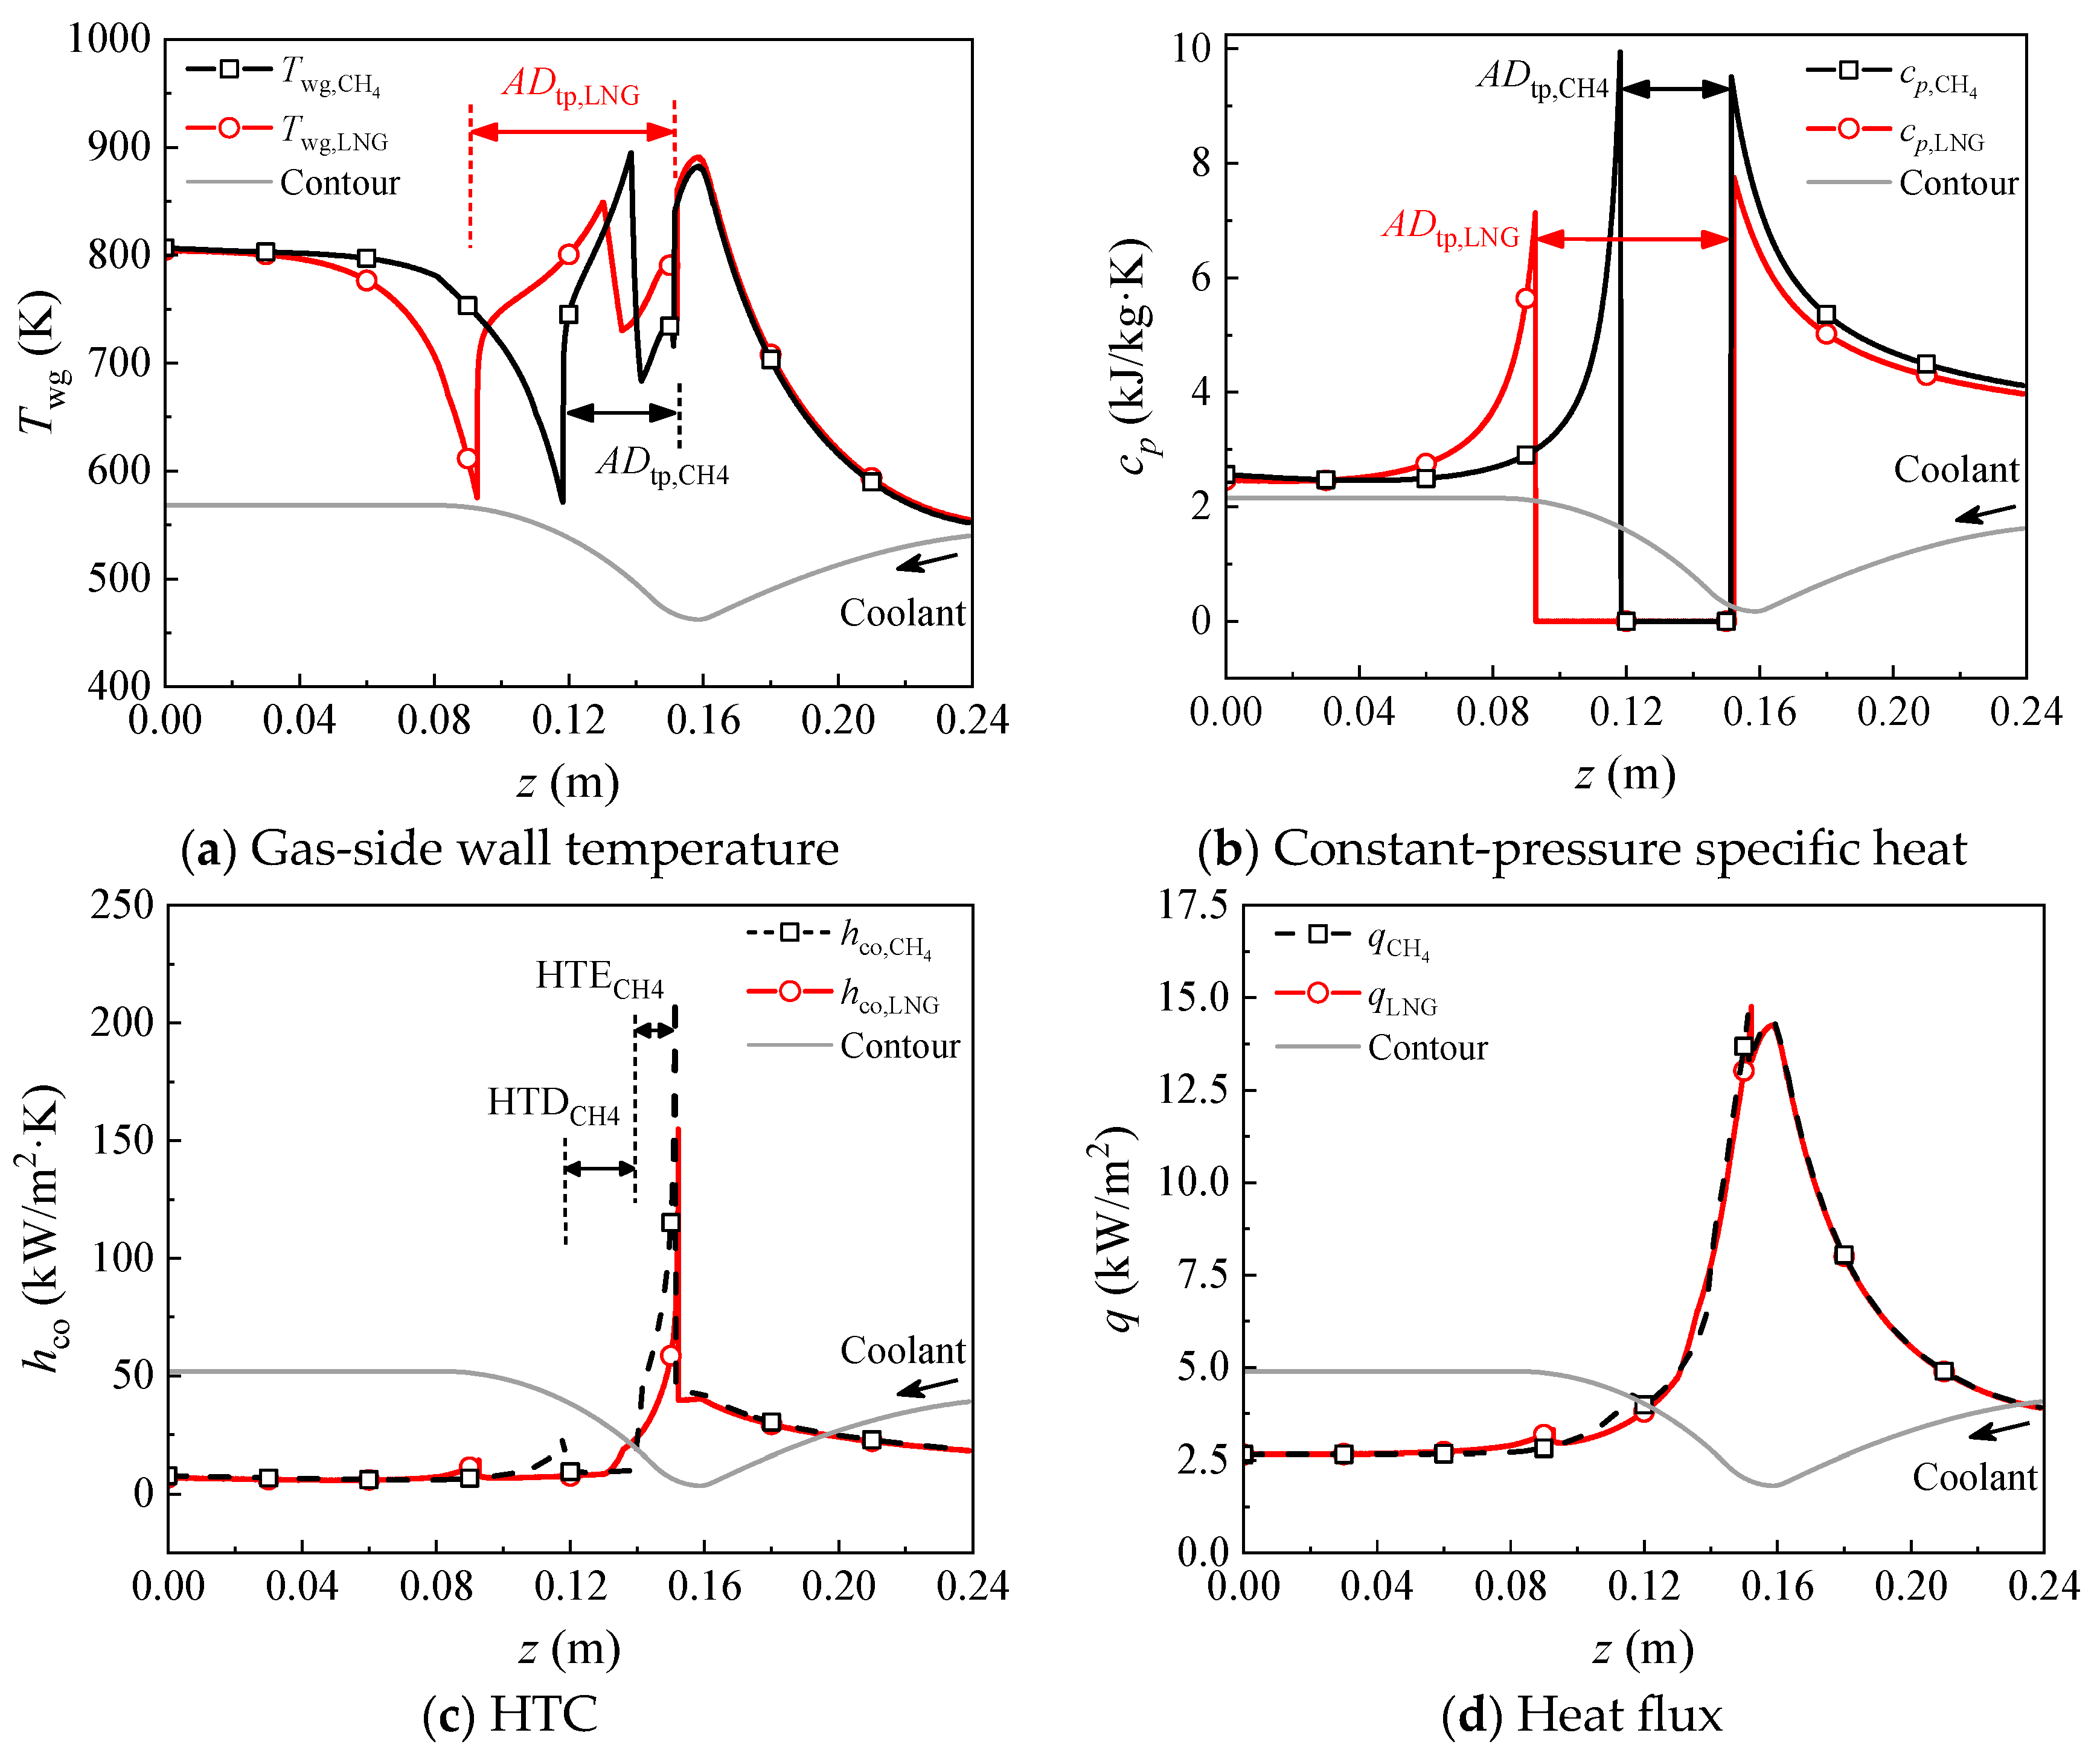
In the liquid-phase region, the gas-side wall temperature calculated for LNG is slightly higher than that for methane. At the nozzle throat, the temperatures are 890.6 K for LNG and 882.2 K for methane. As illustrated in Figure 9b, the specific heat at constant pressure for LNG in the liquid-phase region is lower than that for methane, with maximum specific heat values of 9.554 kJ/kg·K for methane and 7.751 kJ/kg·K for LNG. Consequently, methane demonstrates a superior heat absorption capacity, facilitating enhanced heat removal from the thrust chamber wall. This results in a slightly lower calculated gas-side wall temperature compared to that of LNG. Upon transitioning into the two-phase region, a notable temperature variation is observed on the gas-side wall. In the two-phase heat transfer enhancement (HTE) region, the HTC of methane is generally higher than that of LNG, as illustrated in Figure 9c. This yields a comparatively lower calculated gas-side wall temperature for methane. Conversely, in the two-phase HTD region, the HTC significantly decreases, leading to a marked reduction in the heat transfer capacity and thus an increase in the gas-side wall temperatures for both methane and LNG. Given that the heat flux is predominantly influenced by internal heat sources on the gas-side, the variations in heat flux for methane and LNG exhibit a similar pattern.
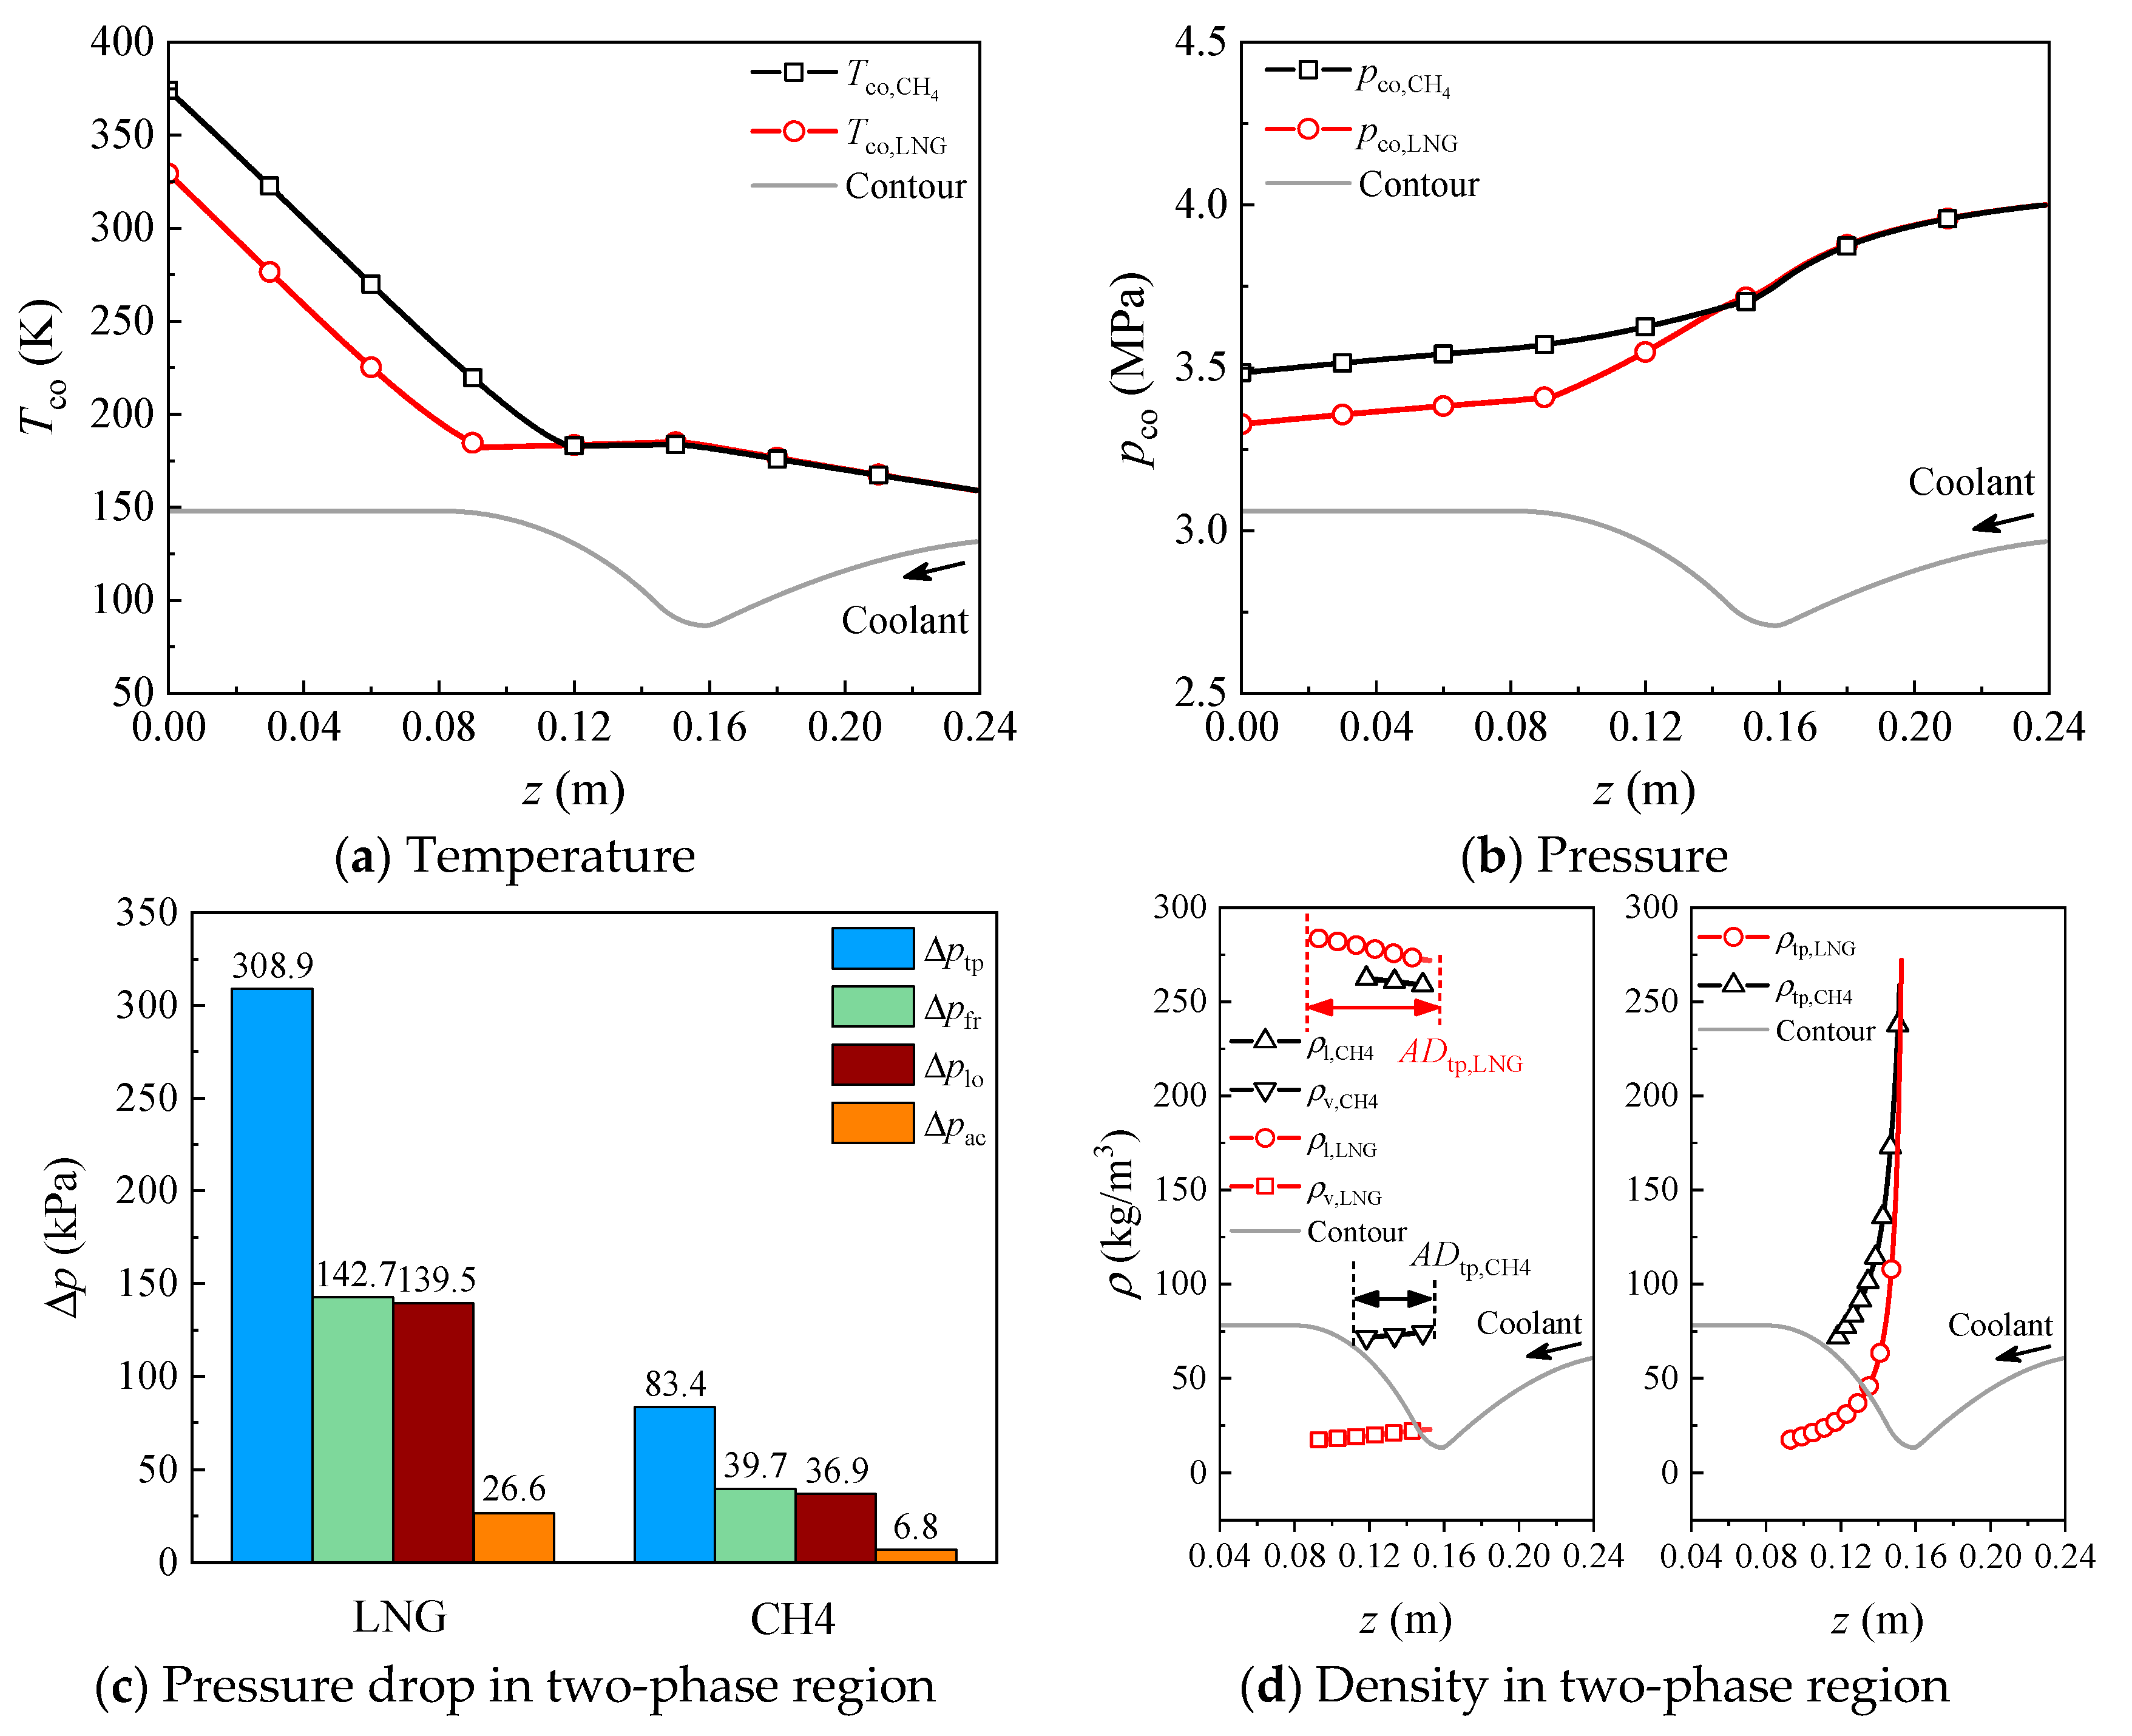
As illustrated in Figure 10, the calculated temperature rise for methane exceeds that of LNG, whereas the calculated pressure drop is comparatively lower for methane than for LNG. For both gaseous methane and LNG, the specific heat capacity is relatively low compared to their liquid states. Consequently, when methane and LNG undergo phase transitions to the gaseous state, their temperatures rise significantly. Due to the shorter axial distance in the methane two-phase region (ADtp,CH4), methane transitions from the two-phase region to the gas-phase region more rapidly, resulting in a greater temperature increase compared to LNG. Based on the analysis of experimental results, it is evident that the pressure drop is substantial within the two-phase region, with notable discrepancies in the pressure drop calculations between methane and LNG predominantly manifesting in this region (Figure 10b).
In the two-phase region, pressure drops are attributed to frictional, local, accelerated, and gravitational pressure losses. Figure 10c illustrates both the total and individual pressure drop components within the two-phase region. Given the negligible impact of the gravitational pressure drop, it can be excluded from consideration. It is evident that the pressure drops associated with the LNG components consistently exceed those of methane, with frictional and localized pressure drops being the primary contributors in the two-phase region. According to the definition of the frictional pressure drop provided in Equation (21), it can be inferred that the frictional pressure drop in the two-phase region is inversely proportional to the coolant density within a homogeneous model. In the two-phase region, the homogeneous density of LNG is lower than that of methane, which further explains the significant pressure drop observed for LNG in this region (Figure 10d). Consequently, the variations in parameters such as temperature, pressure, and the gas-side wall temperature, influenced by the physical properties of the coolant, merit thorough consideration.

4.2. Simulation Analysis of Different Surface Roughness

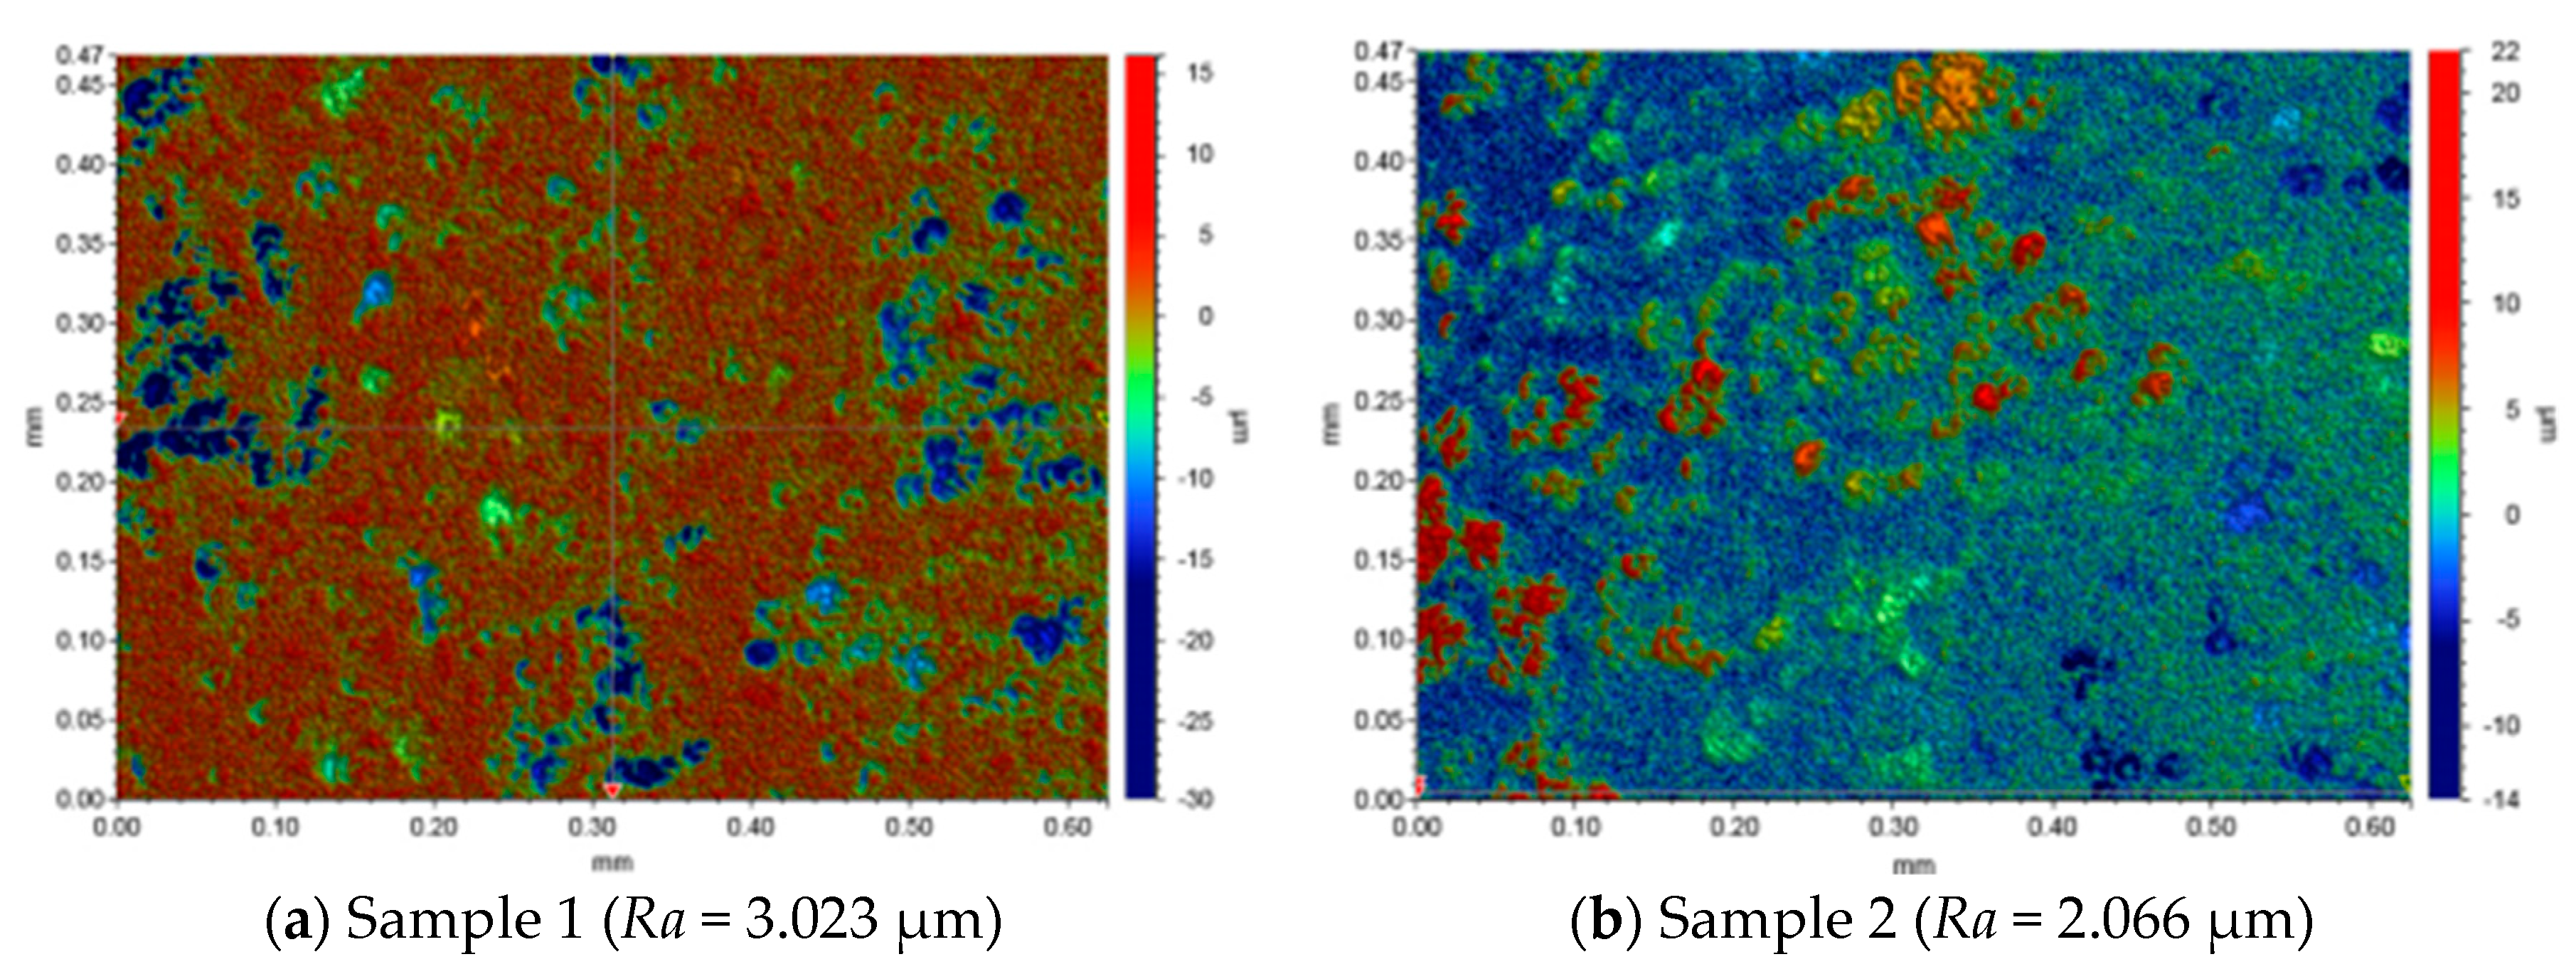
To evaluate the surface roughness of the cooling channel within the thrust chamber, the Bruker® (Billerica, MA, USA) 3D optical surface profilometer was utilized, which was fabricated using 3D printing technology by Bright Laser Technologies® (Xi’an, China). Surface roughness measurements were performed at three distinct locations, with two areas (0.6 mm × 0.5 mm) assessed at each site, resulting in a total of six samples, some of which are illustrated in Figure 11. The findings demonstrate that the surface roughness of the inner surface of the cooling channel in the 3D-printed thrust chamber is uniform across the different locations. The surface roughness of the six samples ranges from 2.066 to 3.059 µm, with an average of 2.540 µm.
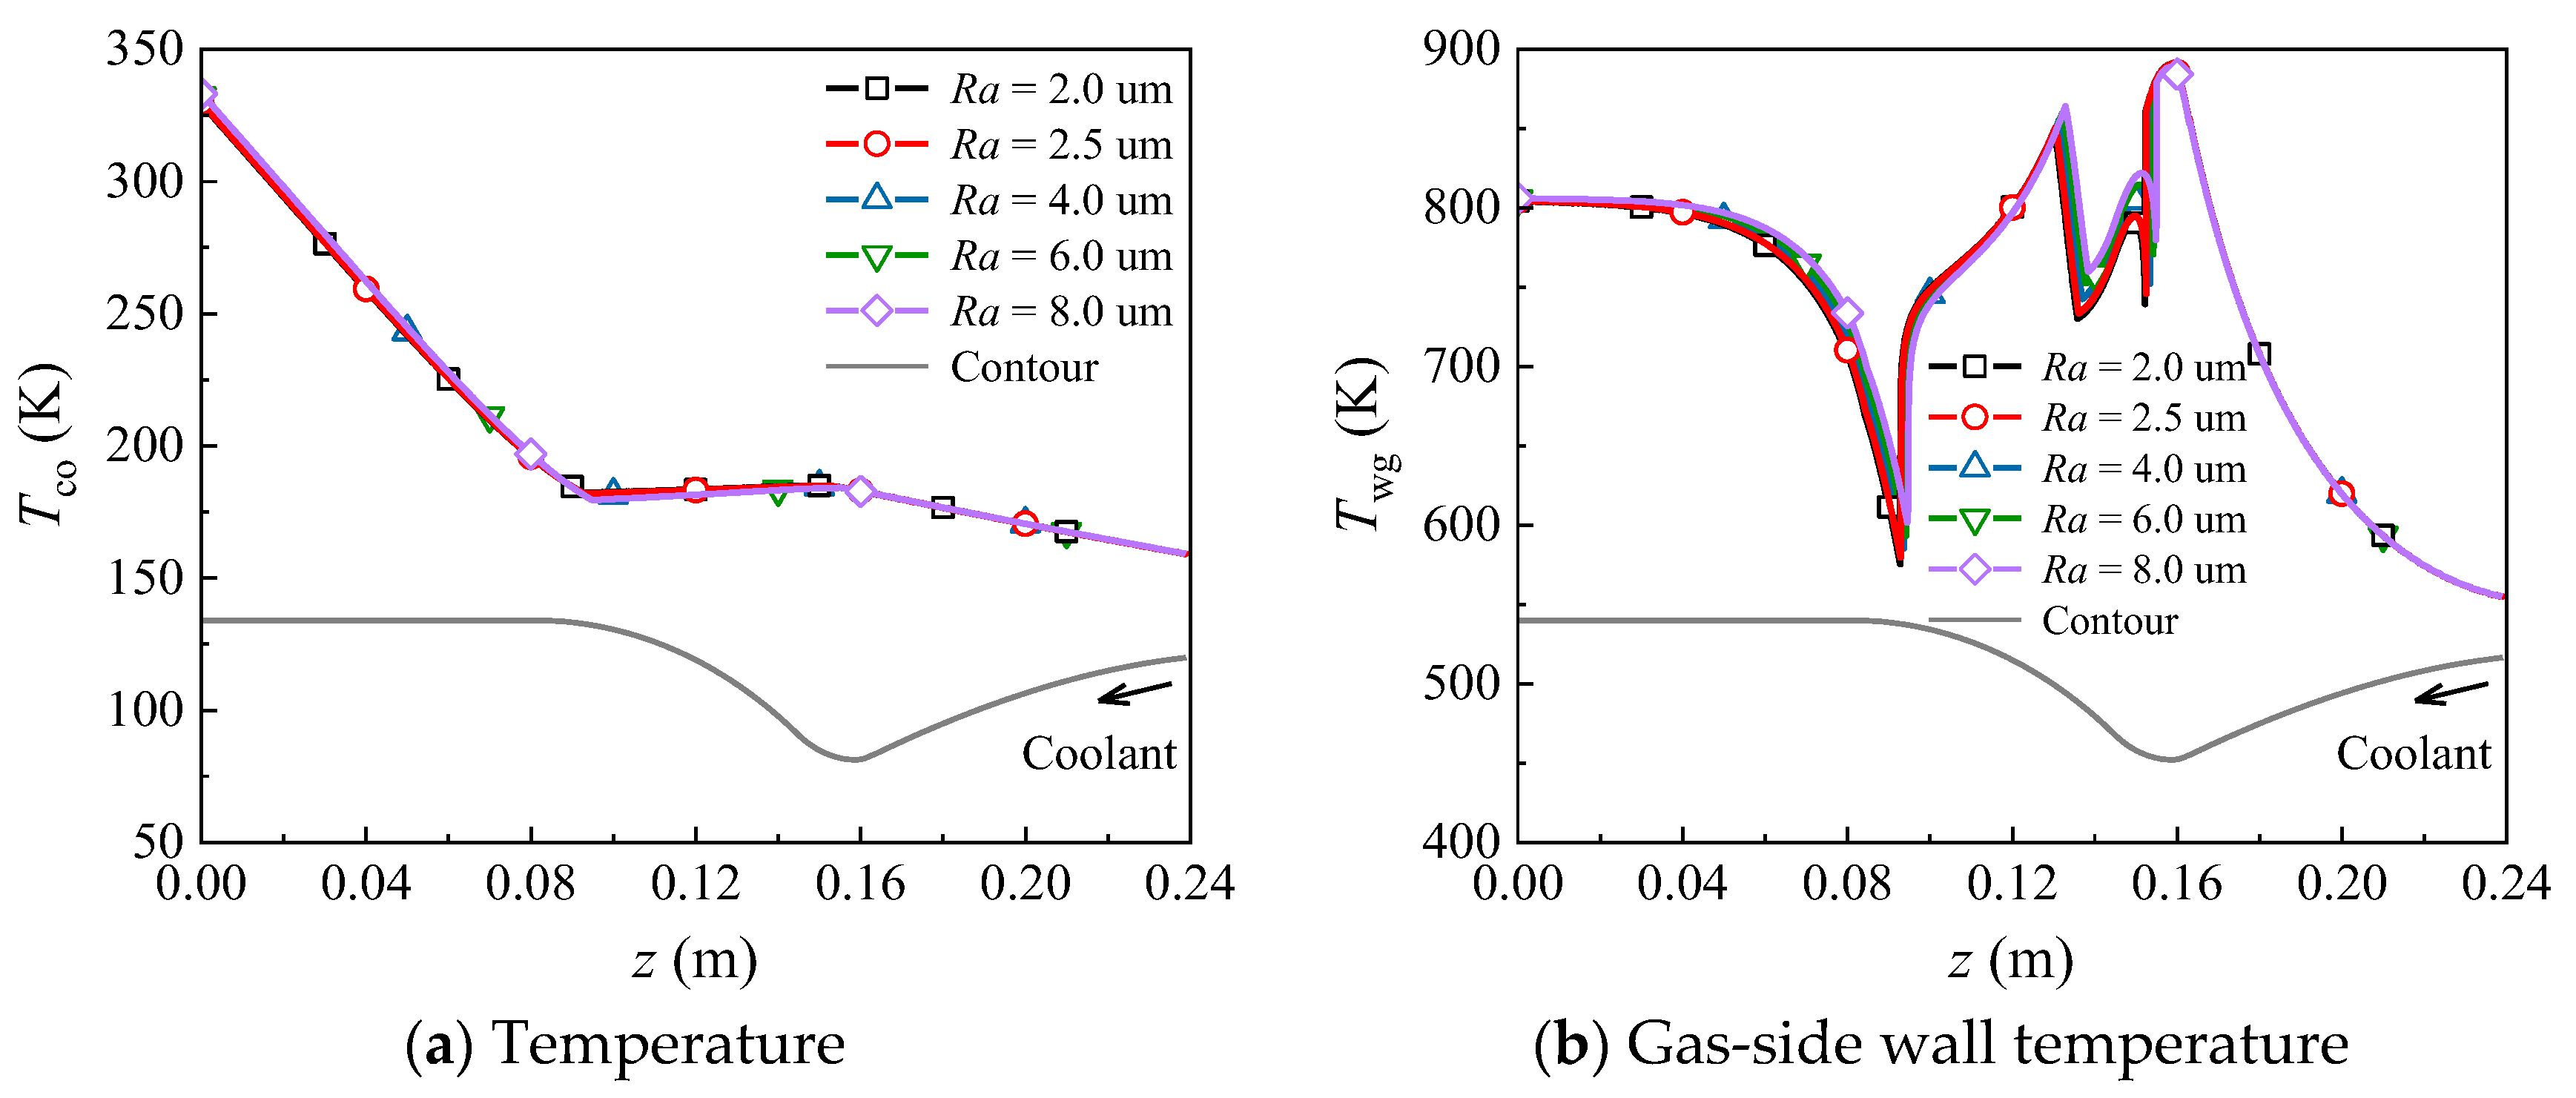
It can be deduced that when the surface roughness varies within the range of 2.0 to 8.0 µm, the trends in vapor quality, temperature, the gas-side wall temperature, and the HTC remain largely consistent (Figure 12). This observation suggests that the temperature rise in the coolant and the gas-side wall temperatures exhibit a relatively weak dependence on surface roughness.
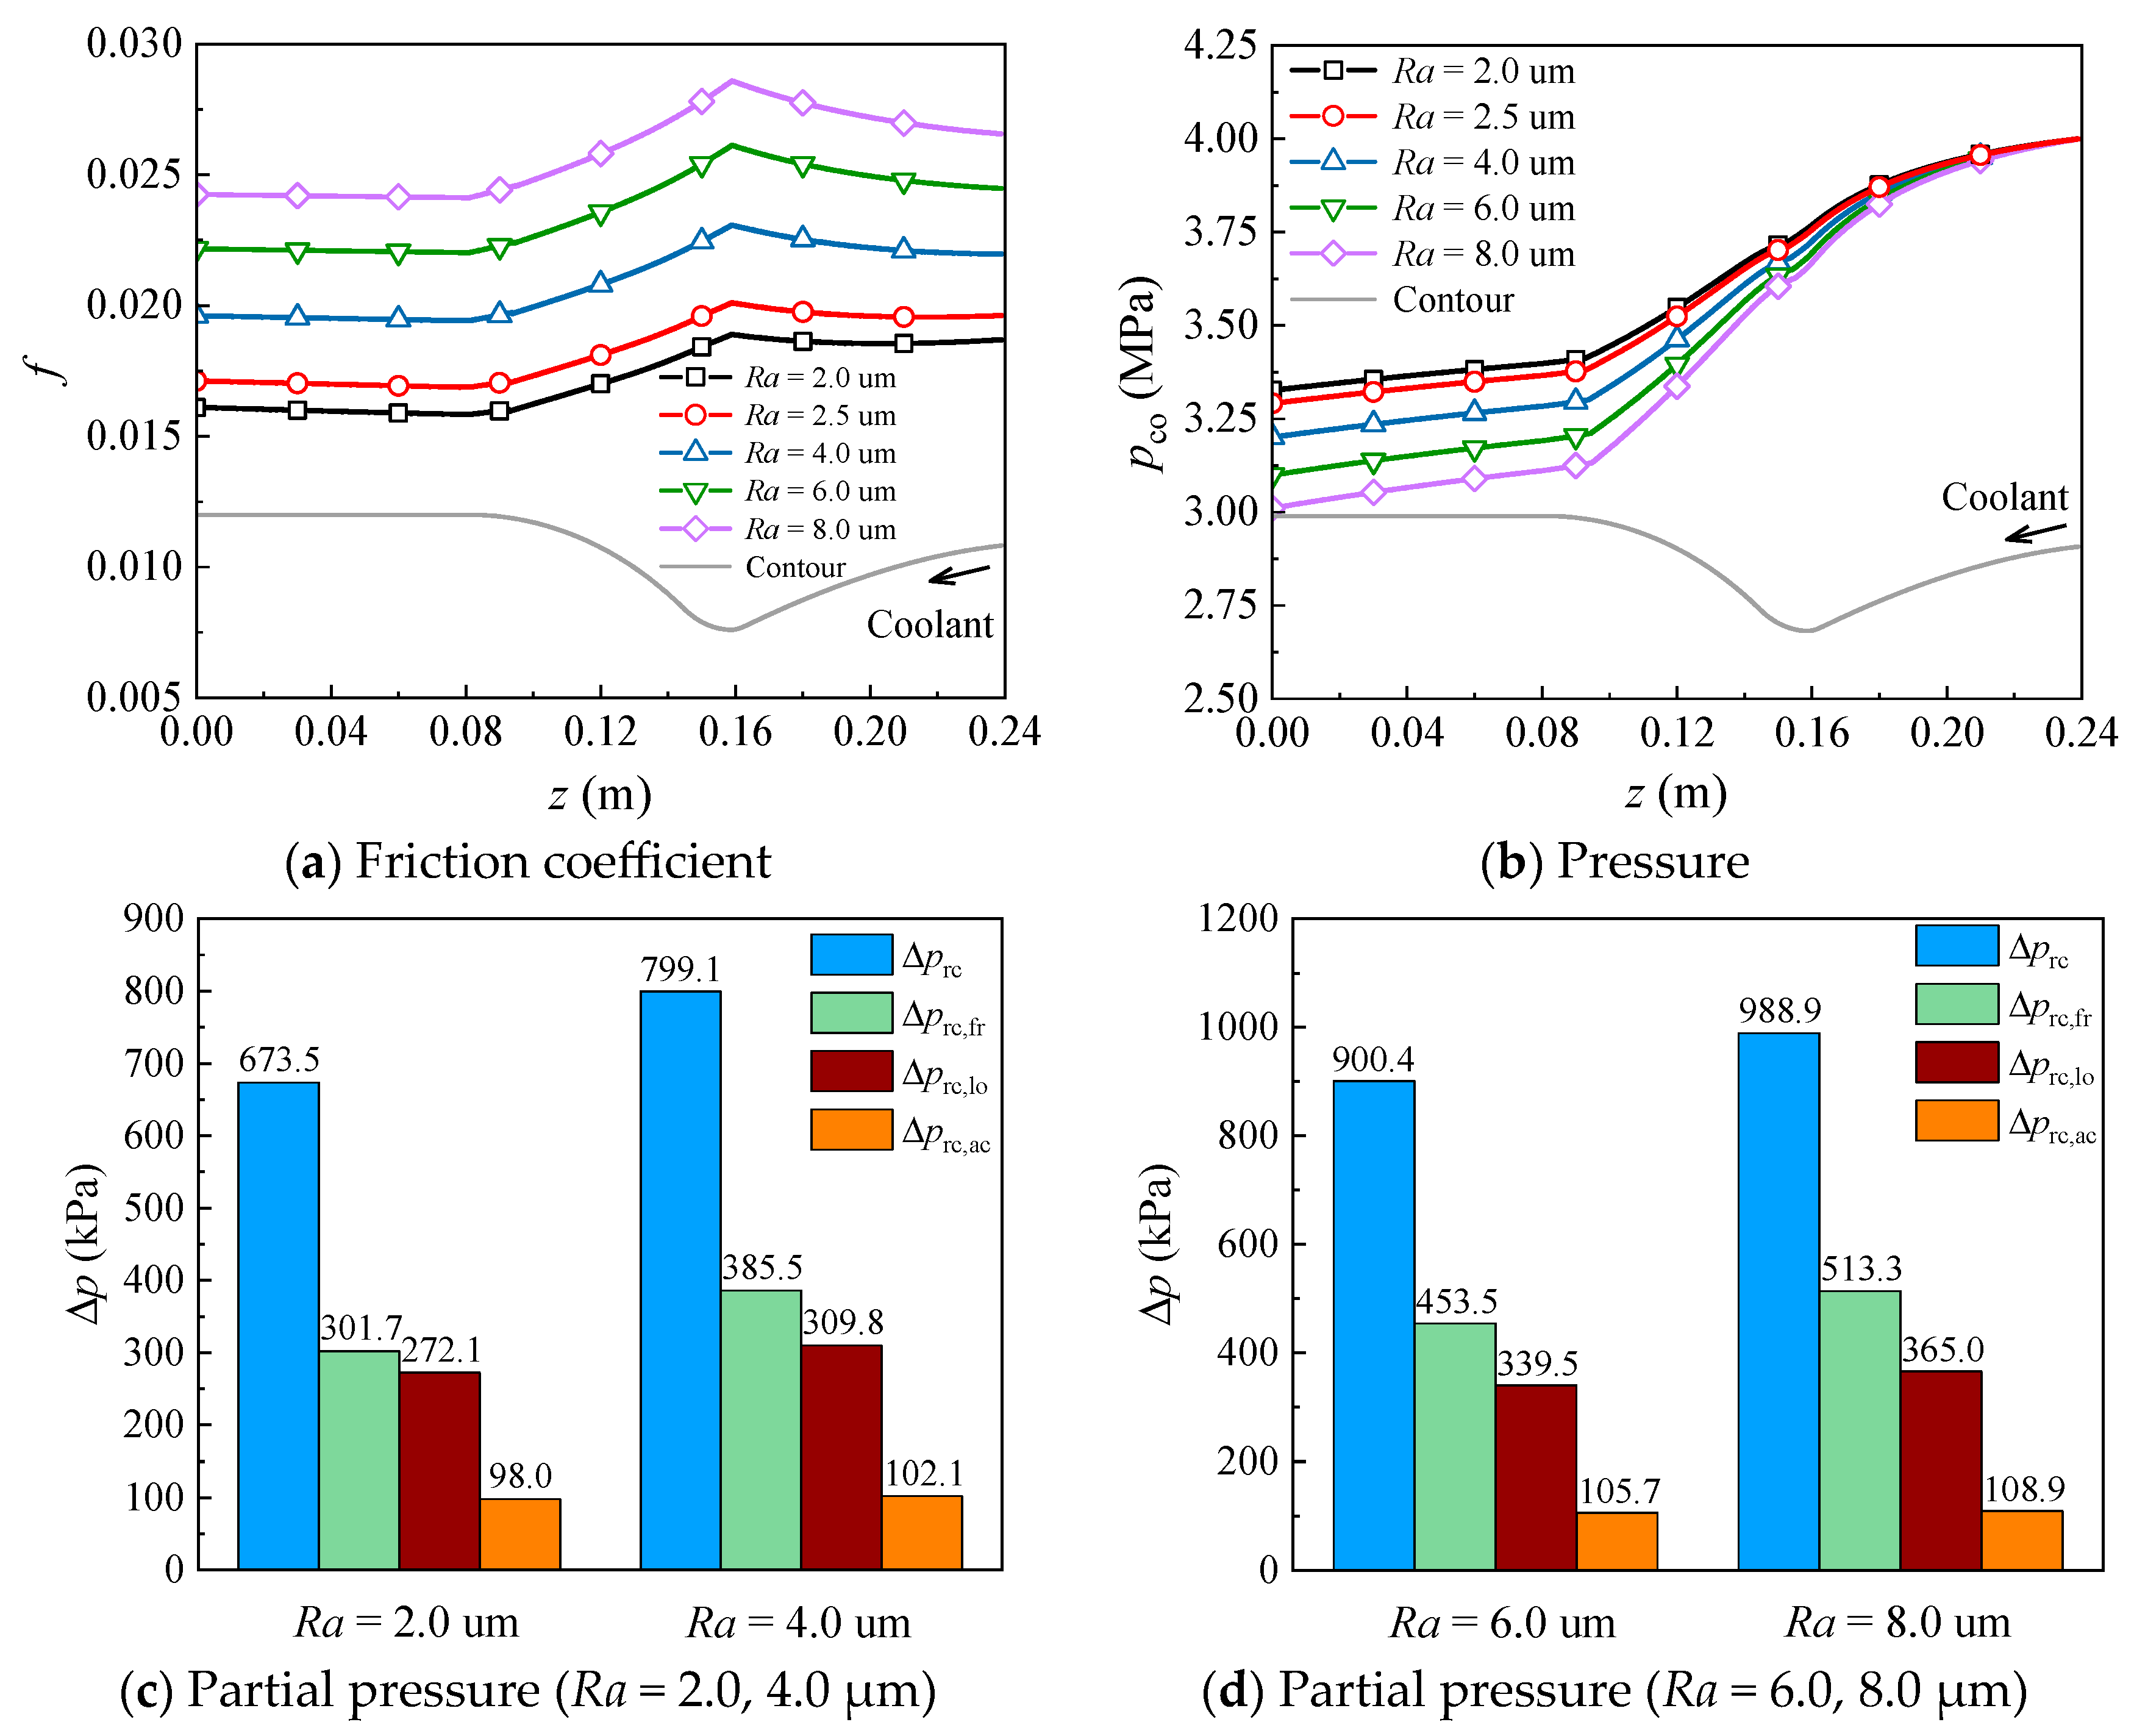
According to Equation (25), the surface roughness predominantly influences the pressure along the coolant flow direction via the friction coefficient. This parameter exhibits an initial increase, followed by a decrease, and then a slight increase in the cylindrical section, ultimately reaching its maximum value at the nozzle throat. As the surface roughness increases within the range of 2.0 to 8.0 μm, the friction coefficient correspondingly rises, reaching a maximum at the nozzle throat, where it escalates from 0.0188 to 0.0285. The friction coefficient modulates the frictional, local, and accelerated pressure drop. Figure 13c,d illustrate the total and segmented pressure drops of LNG across varying surface roughness levels. Specifically, at a surface roughness of 2 μm, the LNG pressure drop is observed to be 0.67 MPa. When the surface roughness is elevated to 8 μm, the pressure drop increases to 0.99 MPa, representing a 47.8% rise. Further examination of the influence on pressure drops reveals that the frictional pressure drop is impacted most significantly, followed by the local pressure drop, with the accelerated pressure drop being the least affected. Specifically, the frictional pressure drop increases from 0.30 MPa to 0.51 MPa, while the local pressure drop rises from 0.27 MPa to 0.37 MPa. According to [25], since the accelerated pressure drop is predominantly influenced by fluid density, its increase remains relatively modest as the surface roughness increases. Consequently, variations in the LNG pressure drop attributable to surface roughness necessitate particular attention.

4.3. Comparison of Experimental and Simulation Results

4.3.1. Analysis of Experimental Results

The ignition experiments on a 1 kg/s-class LOX/LNG thrust chamber were conducted [21]. Table 5 presents the experimental data for two representative operating conditions of the thrust chamber. In comparison to Experiment 1, Experiment 2 exhibits an increase in both the chamber pressure and the mixture ratio.
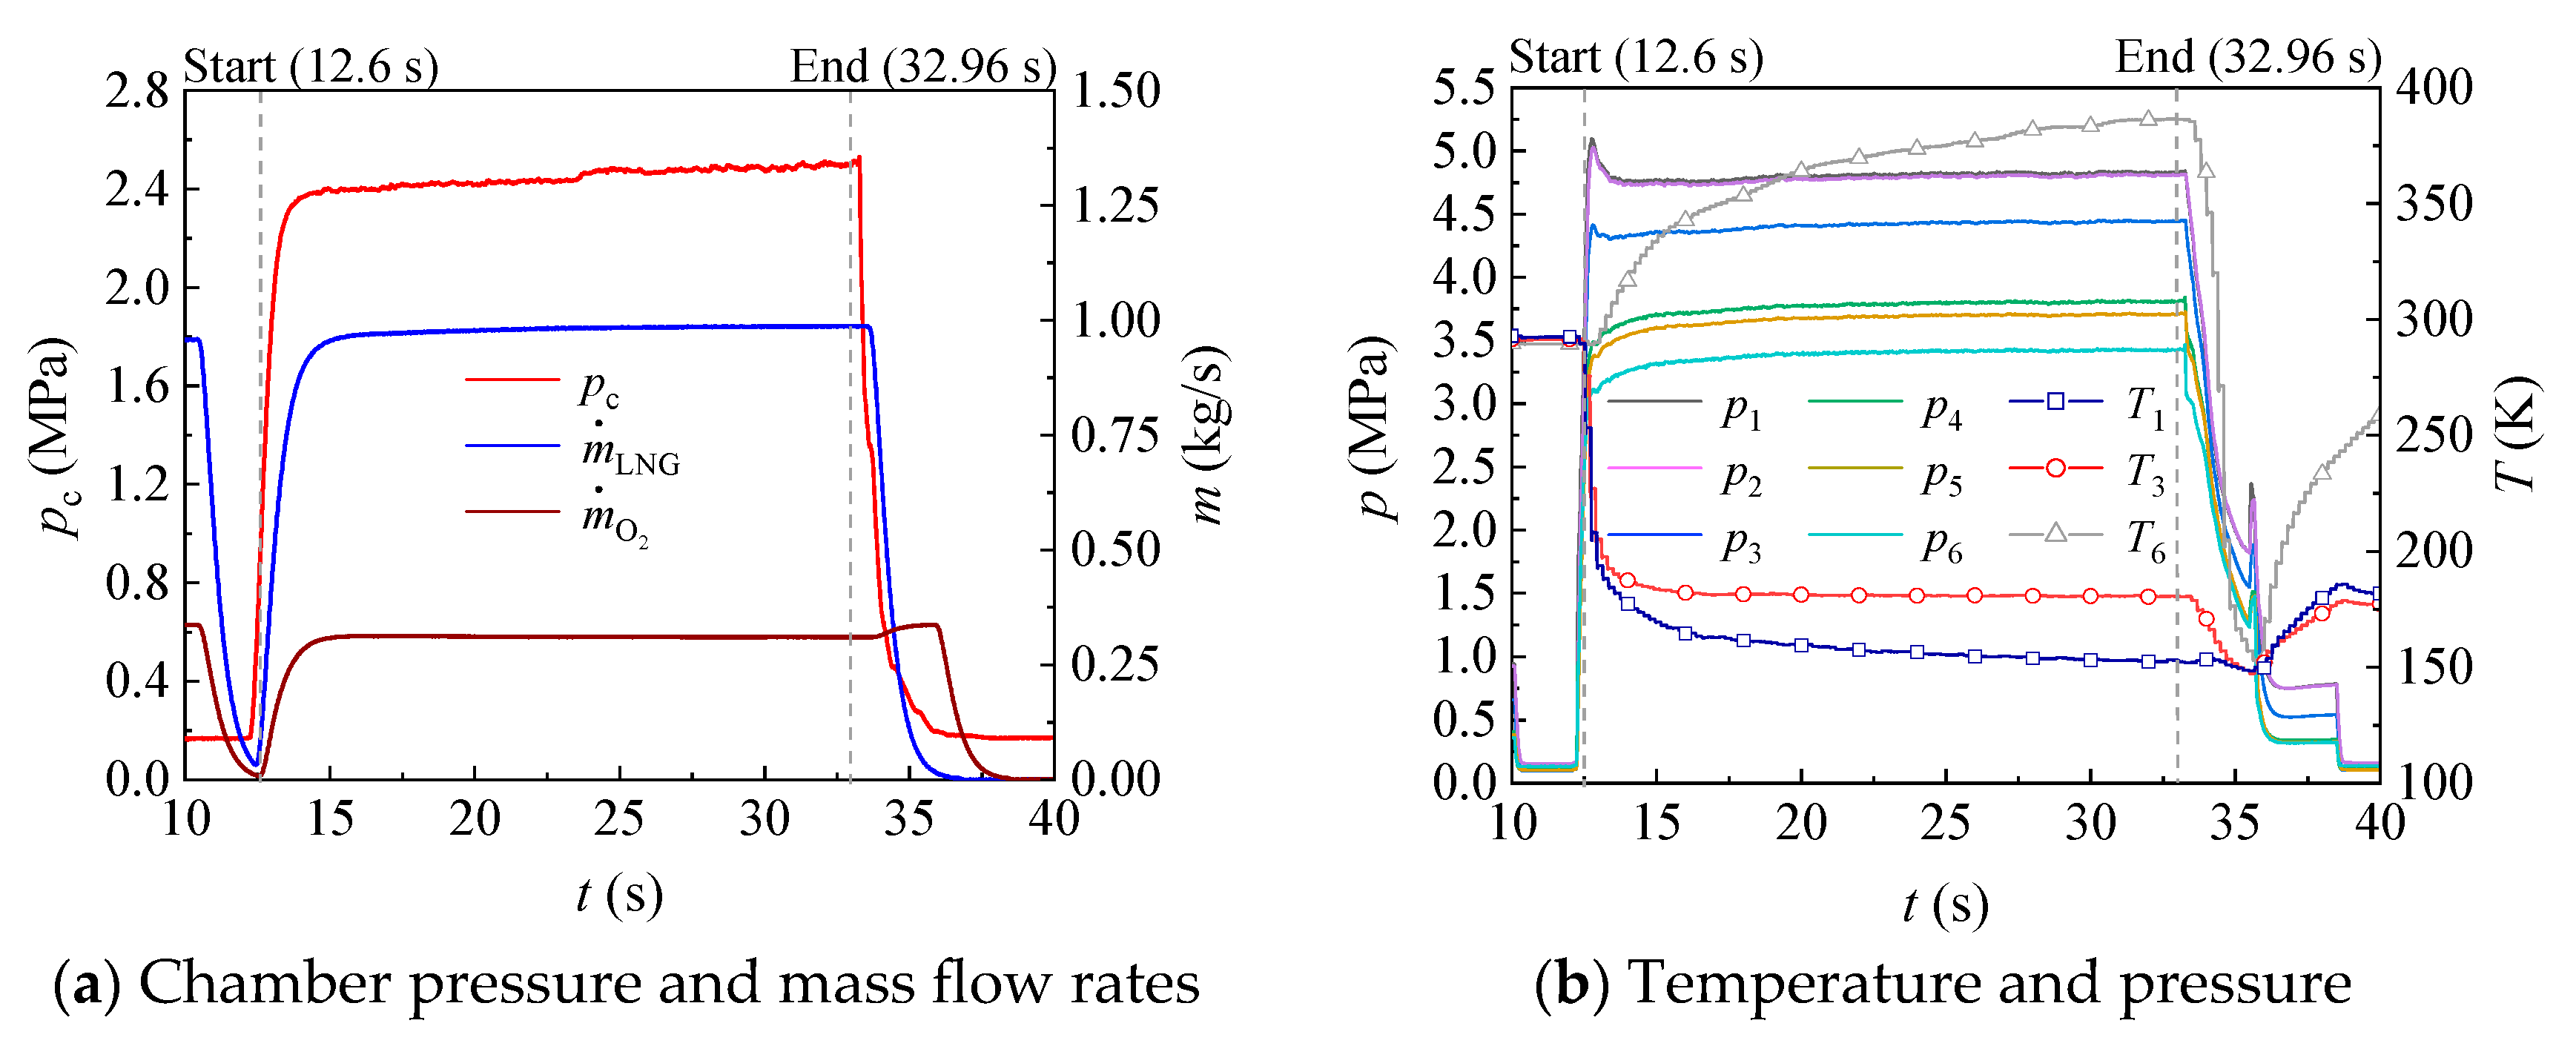
Focusing on Experiment 2, the ignition duration of the thrust chamber was recorded as 20.36 s, spanning from 12.6 to 32.96 s (as illustrated in Figure 14). Following the issuance of the ignition command, the chamber pressure escalated rapidly to 2.40 MPa within 2.2 s and stabilized around 2.50 MPa after 23.8 s, maintaining this pressure until the shutdown command was executed.
Table 6 delineates the mean values of the temperature and pressure measurements at various points within the cooling channels. It is noteworthy that, due to the malfunction of the temperature sensor at measuring point 4, located in the nozzle contraction section during experiment 2, the LNG temperature at this specific section could not be recorded under the given operating condition.
For illustrative purposes, in experiment 1, the overall temperature increase and pressure decrease within the cooling channel were 193.3 K and 1.19 MPa, respectively. The pressure at the measurement location (point 3) within the nozzle throat was recorded at 3.67 MPa, with the LNG remaining in a liquid state, corresponding to a saturation temperature of 187.1 K under the given local pressure. The observed temperature rise along the cooling channel is predominantly concentrated within the cylindrical section (points 4 to 6), exhibiting a temperature rise of 66.1 K. Within this cylindrical section, the LNG transitions to a gaseous state. Notably, the specific heat of the gaseous state is lower compared to the liquid state of LNG, which leads to a pronounced temperature increase in the gaseous state of LNG within the cylindrical section. The pressure drop along the cooling channel is predominantly concentrated in the contraction section of the nozzle (from point 3 to point 4), reaching a magnitude of 0.57 MPa. This phenomenon can be attributed to two primary factors: firstly, the increase in the accelerated pressure drop resulting from the phase transition of LNG, and secondly, the rise in the local pressure drop due to the gradual expansion of the channel.

4.3.2. Verification of Simulation Calculations

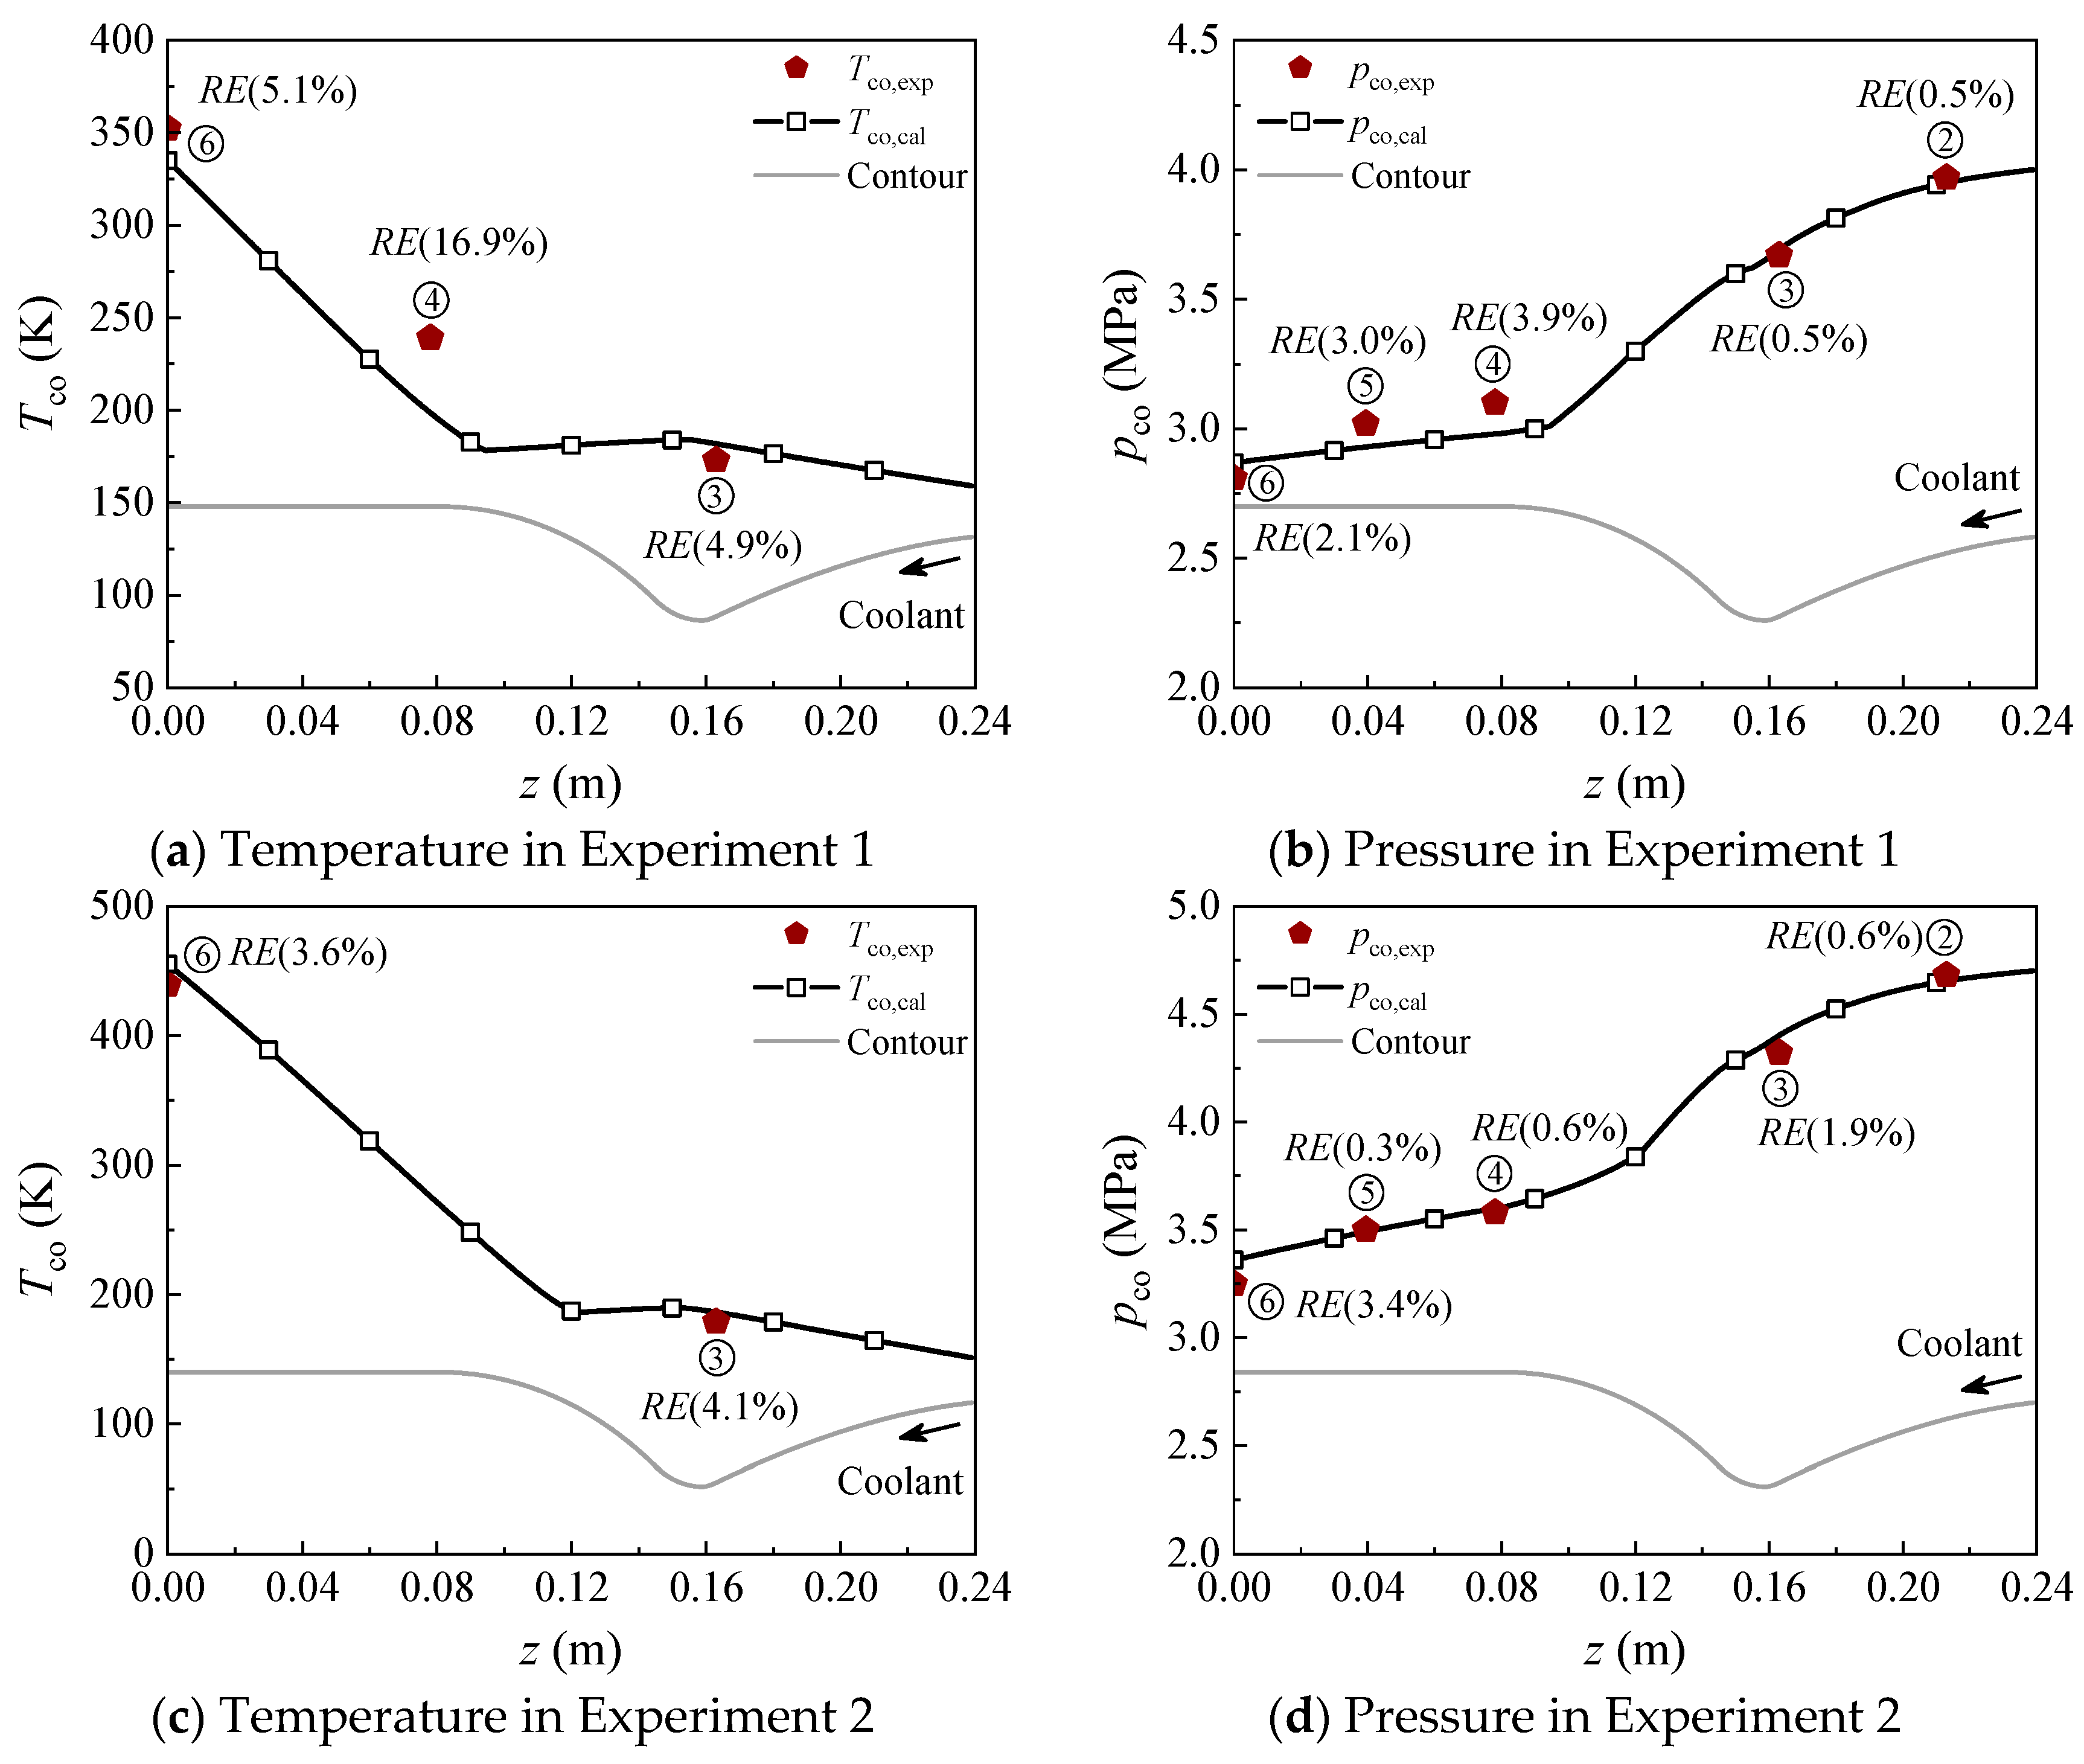
Figure 15 illustrates the comparative analysis of the temperature and pressure results derived from the heat transfer calculations against the experimental data. The results indicate that when the LNG mixture properties, surface roughness measurements, and channel dimension measurements are incorporated into the heat transfer calculations, relatively precise predictions of the LNG temperature and pressure values under the specified experimental conditions are achieved. The relative error (RE) of the maximum temperature rise observed was 9.0% (Experiment 1), while the RE of the maximum pressure drop is 7.6% (Experiment 1). The calculated pressure curve demonstrates a closer alignment with the experimental data, particularly in Experiment 2, where the RE of the pressure at measuring point 5 was only 0.3%. Along the fluid flow direction, the RE of the temperature at each measuring point surpasses the RE of the pressure, with the RE of the temperature at measuring point 4 reaching 16.9% in Experiment 1.
As demonstrated in Figure 15a and Table 5, the LNG two-phase region, under the conditions of Experiment 1, is determined to be situated within the contraction section of the nozzle, extending over a considerable distance. The transition between the LNG two-phase region and the gas-phase region occurs proximate to measuring point 4, with the calculated LNG temperature at this juncture being 198.6 K. Experimental observations from Experiment 1 reveal that LNG at point 3, located at the throat of the nozzle, remains in a liquid state, whereas LNG at point 4, situated in the cylindrical section of the thrust chamber, transitions to the gaseous state. Consequently, the actual phase transition point of LNG during the experiment is located between points 3 and 4. Based on the LNG pressures recorded at these measuring points, the temperature of the two-phase region ranges from 179.2 K to 184.5 K, which is significantly lower than the measured temperature of 239.1 K at point 4. This discrepancy indicates that the actual extent of the two-phase region in Experiment 1 is shorter than the calculated region, and the transition point between the two-phase region and gas-phase region is situated farther from point 4 than initially anticipated.
Overall, the convective cooling solution developed in Section 3.2 facilitates precise predictions of coolant temperature and pressure values within the cooling channels. This methodology is applicable for the design of cooling channels and the prediction of ignition experiments in LOX/LCH4 rocket engines.

5. Conclusions

Variations in the physical properties, including the specific heat at constant pressure, latent heat of vaporization, and fluid density, contribute to an extended LNG two-phase region. This extension results in higher calculated pressure drops for LNG compared to methane, exhibiting inverse trends in temperature rise. An increase in surface roughness from 2 µm to 8 µm leads to a 47.8% surge in the pressure drop. Surface roughness significantly influences the frictional pressure drop by modifying the friction coefficient, with the local pressure drop being the second most significant factor and the accelerated pressure drop being the least significant.
The ignition duration for both experimental conditions (1 kg/s-class) was recorded at 20.36 s, with chamber pressures measured at 1.91 MPa and 2.24 MPa, respectively. The model validation analysis was performed considering the LNG composition and the surface roughness. Compared with the experimental results, the maximum temperature rise error observed across the two experimental conditions was 9.0%, while the maximum pressure drop error was 7.6%. The calculated models proposed in this work demonstrate a strong capability to predict subcritical thermodynamic parameters, including variations in the temperature and pressure of the coolant. Overall, the calculated models applied to the analysis of heat transfer characteristics in cooling channels demonstrate their substantial engineering relevance.

Author Contributions

Conceptualization, J.S. and D.Z.; methodology, J.S. and P.C.; software, L.W. and Y.T.; validation, J.S. and D.Z.; formal analysis, J.S. and X.L.; investigation, J.S. and L.W.; data curation, X.L. and Y.T.; writing—original draft preparation, J.S. and P.C.; funding acquisition, D.Z. All authors have read and agreed to the published version of the manuscript.

Funding

This research was funded by the National Natural Science Foundation of China (grant number 12002372), the Natural Science Foundation of Hunan Province (grant number 2021JJ40674) and the Young Elite Scientists Sponsorship Program by CAST (grant number 2022QNRC001).

Data Availability Statement

The data that support the findings of this study are available from the corresponding author upon reasonable request.

Conflicts of Interest

The authors declare no conflicts of interest.

Nomenclature

NomenclatureGreek symbols
AArea, m2ρDensity, kg/m3
ADAxial distanceλThermal conductivity coefficient, W/m·K
BoBoiling numberδThickness, m
cpSpecific heat at constant pressure, J/kg·KSubscripts
CoConfinement numberacAcceleration
DHydraulic diameter, mawAdiabatic wall
fFriction coefficientcChamber
FtgVapor-like film temperature gradient numbercoCoolant
gGravitational acceleration, m/s2frFriction
GMass flux, kg/m2·sgGas
hHeat transfer coefficient, W/m2·KgrGravity
KpDimensionless pressure parameterhmHomogeneous mixture
LChannel length, mlLiquid
m ˙ Mass flow rate, kg/sloLocal
NNumber of cooling channelsoxOxygen
NuNusselt numberrcRegenerative cooling channel
pPressure, MPatpTwo-phase
PrPrandtl numbervVapor
qHeat flux, W/m2wWall
QHeat, WwcCoolant-side wall
RaSurface roughness, µmwgGas-side wall
ReReynolds number
SCross-sectional area of cooling channel perpendicular to the coolant flow, m2
TTemperature, K
WeWeber number
xVapor quality
XMartinelli number

Abbreviations

The following abbreviations are used in this manuscript:
HTCHeat transfer coefficient
HTDHeat transfer deterioration
HTEHeat transfer enhancement
HTTHeat transfer transition
LNGLiquefied natural gas
MRMixture ratio
NGLsNatural gas liquids

References

  1. Yao, Y.; Qi, C.; Feng, B.; Qiu, Y.; Yang, Z.; Zhao, Y.; Wei, X. Fundamental research progress in regenerative cooling for methane engine thrust chambers. Appl. Therm. Eng. 2024, 258, 124572. [Google Scholar] [CrossRef]
  2. Hossain, M.A.; Morse, A.; Hernandez, J.C.A. Liquid rocket engine performance characterization using computational modeling: Preliminary analysis and validation. Aerospace 2024, 11, 824. [Google Scholar] [CrossRef]
  3. Pizzarelli, M.; Battista, F. Oxygen–methane rocket thrust chambers: Review of heat transfer experimental studies. Acta Astronaut. 2023, 209, 48–66. [Google Scholar] [CrossRef]
  4. Ricci, D.; Battista, F.; Fragiacomo, M.; French, A.D. Thermal behaviour of the cooling jacket belonging to a liquid oxygen/liquid methane rocket engine demonstrator in the operation box. Aerospace 2023, 10, 607. [Google Scholar] [CrossRef]
  5. Fiore, M.; Nasuti, F.; Pizzarelli, M.; Ierardo, N. Homogeneous equilibrium modeling for subcritical flows in liquid rocket engine cooling systems. J. Thermophys. Heat Transf. 2025, 39, 53–67. [Google Scholar] [CrossRef]
  6. Nasser, I.; Haidn, O.; Manfletti, C. Numerical investigation of rocket engine cooling channel heat transfer for different lng under trans-critical conditions. Int. J. Thermofluids. 2023, 20, 100461. [Google Scholar] [CrossRef]
  7. Santese, T.; Shvab, J.; Suslov, D.; Haidn, O.; Slavinskaya, N. Impact of impurities on liquid methane properties under typical rocket operation conditions. Int. J. Thermofluids. 2023, 18, 100343. [Google Scholar] [CrossRef]
  8. Urbano, A.; Nasuti, F. Numerical study of liquefied natural gas as a coolant in liquid rocket engines. Proc. Inst. Mech. Eng. G J. Aerosp. Eng. 2012, 227, 1130–1143. [Google Scholar] [CrossRef]
  9. Urbano, A.; Nasuti, F. Parametric analysis of cooling properties of candidate expander-cycle fuels. J. Propuls. Power. 2015, 30, 153–163. [Google Scholar]
  10. Immich, H.; Alting, J.; Kretschmer, J.; Preclik, D. Technology developments for thrust chambers of future launch vehicle liquid rocket engines. Acta Astronaut. 2003, 53, 597–605. [Google Scholar] [CrossRef]
  11. Votta, R.; Battista, F.; Ferraiuolo, M.; Roncioni, P.; Matteis, P.D. Design of an experimental campaign on methane regenerative liquid rocket engine cooling system. In Proceedings of the 49th AIAA/ASME/SAE/ASEE Joint Propulsion Conference, San Jose, CA, USA, 15–17 July 2013. [Google Scholar]
  12. Votta, R.; Battista, F.; Gianvito, A.; Smoraldi, A.; Meyer, R.F.S. Experimental investigation on methane in transcritical conditions. In Proceedings of the 50th AIAA/ASME/SAE/ASEE Joint Propulsion Conference, Cleveland, OH, USA, 28–30 July 2014. [Google Scholar]
  13. Pizzarelli, M.; Nasuti, F.; Votta, R.; Battista, F. Assessment of a conjugate heat transfer model for rocket engine cooling channels fed with supercritical methane. In Proceedings of the 51st AIAA Propulsion and Energy Forum, Orlando, FL, USA, 27–29 July 2015. [Google Scholar]
  14. Shokri, M.; Ebrahimi, A. Heat transfer aspects of regenerative-cooling in methane-based propulsion systems. Aerosp. Sci. Technol. 2018, 82–83, 412–424. [Google Scholar]
  15. Zhang, M.; Sun, B. Effect of artificial roughness on flow and heat transfer of transcritical methane. Int. J. Therm. Sci. 2020, 158, 106528. [Google Scholar] [CrossRef]
  16. Latini, B.; Fiore, M.; Nasuti, F. Modeling liquid rocket engine coolant flow and heat transfer in high roughness channels. Aerosp. Sci. Technol. 2022, 126, 107672. [Google Scholar] [CrossRef]
  17. Santese, T.; Nasser, I.; Soller, S.; Manfletti, C. Friction factor and heat transfer prediction of rocket engine cooling channels in numerical simulations with high roughness reynolds number. Appl. Therm. Eng. 2025, 259, 124899. [Google Scholar]
  18. Nasser, I.; Haidn, O.; Manfletti, C. Evaluation of the influence of surface roughness on the deterioration of heat transfer in methane rocket engine cooling systems. Acta Astronaut. 2025, 228, 617–630. [Google Scholar] [CrossRef]
  19. Gndara, T.; Costa, V.; Dias, J. A novel heat transfer modeling methodology for regenerative cooling in liquid propellant rocket engines. Case Stud. Therm. Eng. 2025, 73, 106623. [Google Scholar] [CrossRef]
  20. Xu, B.; Chen, B.; Peng, J.; Zhou, W.; Xu, X. A coupled heat transfer calculation strategy for composite cooling liquid rocket engine. Aerospace 2023, 10, 473. [Google Scholar] [CrossRef]
  21. Liu, X.; Jiang, Z.; Cheng, P.; Peng, J.; Bai, X.; Li, Q.; Chen, L. Heat transfer characteristics analysis of spiral regenerative cooling channel with variable helix angle in lox/ch4 engine. Aerosp. Sci. Technol. 2026, 170, 111473. [Google Scholar] [CrossRef]
  22. Popp, M.; Hulka, J.; Yang, V.; Habiballah, M. Liquid Rocket Thrust Chambers: Aspects of Modeling, Analysis, and Design; American Institute of Aeronautics and Astronautics, Inc.: Reston, VA, USA, 2004. [Google Scholar]
  23. Nellis, G.; Klein, S. Heat Transfer; Cambridge University Press: Cambridge, UK, 2008. [Google Scholar]
  24. Song, J.; Li, Q.; Sun, J.; Liu, X.; Chen, L. Experimental investigation on boiling heat transfer characteristics of liquid methane in mini channel. Defect. Diffus. Forum. 2023, 429, 239–246. [Google Scholar] [CrossRef]
  25. Song, J.; Liang, T.; Li, Q.; Cheng, P.; Zhang, D.; Cui, P.; Sun, J. Study on the heat transfer characteristics of regenerative cooling for lox/lch4 variable thrust rocket engine. Case Stud. Therm. Eng. 2021, 28, 101664. [Google Scholar] [CrossRef]
  26. Qi, S.; Zhang, P.; Wang, R.; Xu, L. Flow boiling of liquid nitrogen in micro-tubes: Part I—The onset of nucleate boiling, two-phase flow instability and two-phase flow pressure drop. Int. J. Heat Mass Transf. 2007, 50, 4999–5016. [Google Scholar] [CrossRef]
Figure 1. Schematic diagram of the LOX/LNG thrust chamber ignition experiment.
Aerospace 13 00593 g001
Figure 2. Distributions of the utilized temperature and pressure measurement points.
Aerospace 13 00593 g002
Figure 3. Schematic diagram of heat transfer in the cooling channel.
Aerospace 13 00593 g003
Figure 4. Schematic diagram of a gradually expanding and converging cooling channel.
Aerospace 13 00593 g004
Figure 5. Schematic diagram of the thrust chamber unit.
Aerospace 13 00593 g005
Figure 6. Schematic diagram of heat transfer calculation.
Aerospace 13 00593 g006
Figure 7. Schematic diagram of coupled heat transfer solution.
Aerospace 13 00593 g007
Figure 8. Distributions of coolant vapor quality and phase-change latent heat.
Aerospace 13 00593 g008
Figure 9. Distributions of gas-side and coolant parameters.
Aerospace 13 00593 g009
Figure 10. Distributions of coolant parameters.
Aerospace 13 00593 g010
Figure 11. Surface roughness measurements.
Aerospace 13 00593 g011
Figure 12. Distributions of coolant and gas-side parameters.
Aerospace 13 00593 g012
Figure 13. Distribution of coolant friction coefficient and pressure drop.
Aerospace 13 00593 g013
Figure 14. Parameter distributions of experiment 2.
Aerospace 13 00593 g014
Figure 15. Comparison between the calculated values and the experimental results.
Aerospace 13 00593 g015
Table 1. Uncertainties of experimental parameters.
ParameterMaximum Relative UncertaintyParameterMaximum Relative Uncertainty
TLNG0.95%LNG0.98%
pLNG2.82%MR1.09%
ox0.47%ηc3.02%
Table 2. The coefficients in Equation (20).
CoefficientsValuesCoefficientsValues
α0.687β3.580
a10.388a2−0.238
b10.027b20.407
c10.409c2−0.212
d10.317d2−0.015
e10.468e20.067
f10.131f2−0.029
Table 3. Input parameters for heat transfer simulation.
Input ParametersUnitValues
Thrust chamber pressureMPa2.50
MR/3.18
Mass flow rate of coolantkg/s0.310
Inlet temperature of cooling channelK159.0
Inlet pressure of cooling channelMPa4.00
Table 4. Comparison of LNG and CH4 components.
LNG
(pcr = 4.94 MPa, Tcr = 195.7 K)
CH4
(pcr = 4.60 MPa, Tcr = 190.6 K)
ComponentMole FractionComponentMole FractionComponentMole
Fraction
CH497.440%C4H100.071%CH4100%
C2H61.798%C5H120.006%
C3H80.402%C5H120.005%
C4H100.072%N20.206%
Table 5. Experimental conditions of the thrust chamber.
ParametersSymbolUnitsExperiment 1Experiment 2
Chamber pressurepcMPa2.242.50
Mixture ratior/2.893.18
Mass flow rate of LNGLNGkg/s0.2580.310
Inlet temperatureTrc,inK151.0159.0
Inlet pressureprc,inMPa4.704.00
Ignition durationts20.3620.36
Table 6. Mean values of temperature and pressure measurement points.
Temperature (K)Experimental ValuesTemperature (K)Experimental Values
Experiment 1159.0Experiment 2151.0
173.0179.0
239.1/
352.3439.2
ΔTrc193.3ΔTrc288.2
Pressure (MPa)Experimental ValuesPressure (MPa)Experimental Values
Experiment 14.00Experiment 24.70
3.974.68
3.674.32
3.103.58
3.023.50
2.813.25
Δprc1.19Δprc1.45
Disclaimer/Publisher’s Note: The statements, opinions and data contained in all publications are solely those of the individual author(s) and contributor(s) and not of MDPI and/or the editor(s). MDPI and/or the editor(s) disclaim responsibility for any injury to people or property resulting from any ideas, methods, instructions or products referred to in the content.