Article

Fleet-Level Assessment of Hydrogen-Powered Aircraft Using Scenario-Based Modeling

Bauhaus Luftfahrt e.V., Willy-Messerschmitt-Straße 1, 82024 Taufkirchen, Germany
*
Author to whom correspondence should be addressed.
Aerospace 2026, 13(6), 517; https://doi.org/10.3390/aerospace13060517
Submission received: 31 March 2026 / Revised: 7 May 2026 / Accepted: 12 May 2026 / Published: 31 May 2026

Abstract

This paper presents the main results of a fleet-level assessment of H2-powered aircraft defined within the H2Avia research project, focusing on their energy performance and climate impact. The assessment is based on a global, long-term fleet evolution framework using scenario-based inputs for an in-house model which applies linear optimization to minimize the energy component of direct operating costs and the climate impact of a global fleet. Different transition scenarios from fossil-based aviation toward an H2-powered aviation system are evaluated. The main findings show that H2-based scenarios result in up to 15% higher block energy consumption at the fleet level compared with an SAF-based baseline in 2050, while providing the highest potential for a climate impact reduction of up to 60% relative to the same baseline. However, this benefit depends strongly on the inclusion and modeling of non-CO2 effects for hydrogen, as well as on the weighting between energy cost and climate impact-driven objectives. The findings demonstrate the added value of an integrated assessment framework for capturing long-term fleet evolution and enabling rapid evaluation of emerging aircraft technologies in support of climate-neutral aviation strategies.

1. Introduction

The aviation sector is a key enabler of global mobility and economic exchange but also accounts for approximately 2–3% of global CO2 emissions, a share that is expected to increase in the coming decades. In addition to CO2, non-CO2 effects such as contrails and NOx emissions further increase its climate impact [1,2,3,4]. Hydrogen (H2) is considered a promising long-term energy carrier for aviation [5]. The research project “H2Avia—Hydrogen in Aviation” [6,7] provides its holistic system-level analysis, covering the full value chain from production and distribution of liquid hydrogen (LH2) to aircraft design and operation. This study combines the insights from the H2Avia project within an in-house fleet modeling framework capturing fleet development and distribution, as well as the resulting energy use and emissions.

1.1. Literature Review

The literature review for this study was structured gradually to examine the research on fleet assignment models, the integration of climate considerations into fleet planning, and the treatment of hydrogen as a future aviation technology within the fleet assessments.

1.1.1. Fleet Assignment Models

The fleet assignment problem (FAP) is a core airline planning task that allocates aircraft to scheduled flights subject to operational constraints, traditionally aiming to minimize costs or maximize revenues on fixed airline networks. Early work on the FAP established mathematical programming, particularly integer linear programming (ILP) and mixed integer linear programming (MILP) formulations, as the dominant approach. Abara [8] formulated the FAP as an integer linear program allowing multiple aircraft to be assigned on a single-airline network for a daily schedule and demonstrated practical applicability. Hane et al. [9] introduced solution techniques to solve the FAP on a large-scale domestic network by modeling the problem as a large multi-commodity flow on a time-expanded network. Subsequent research improved modeling while maintaining a short-term operational scope. Lohatepanont [10] examined fleet assignment jointly with schedule design in hub-and-spoke networks, emphasizing network effects as well as passenger spill and demonstrating their impact on revenue outcomes. Sherali et al. [11] and Mancel and Mora-Camino [12] reviewed state-of-the-art LP- and MILP-based fleet assignment models, which use advanced techniques and consider operational extensions such as maintenance and crew integration, demand-related considerations, and robustness in short-term airline operations. Alternative solution strategies were explored to enhance computational efficiency, including large-scale ILP case studies [13], heuristic genetic algorithms [14], and branch-and-bound methods [15], applied to fixed daily networks and solved for a single airline. More recently, Birolini et al. [16] introduced an integrated scheduling and fleet assignment model that endogenizes passenger demand using a nested logit formulation, representing a move toward scenario-based analysis, while Kühlen [17] proposed an optimization-based fleet assignment model at the global air transportation system level, providing a conceptual bridge toward system-wide assessments.

1.1.2. Climate Impact as an Objective

Increasing recognition of aviation’s contribution to climate change has motivated the integration of environmental metrics into fleet and network planning models [18]. Early work incorporating climate considerations into fleet and network planning adopted system-level, scenario-based approaches. Apffelstaedt [19] developed a global fleet rollover framework to assess the long-term impact of advanced engines and biofuels. Zhao [20] extended this perspective with offering an LP-based aircraft allocation model with a global surrogate network linking aircraft technology to fleet-wide CO2, NOx, and noise emissions, while Schaefer [21] introduced a simulation framework using global schedule data to forecast fuel consumption and emissions under alternative traffic growth and technology scenarios.
Tetzloff [22] formulated a linear optimization model to allocate existing and future aircraft to minimize fuel burn and emissions, demonstrating that fleet-level environmental targets could be achievable through technology improvements. Randt [23] significantly advanced this stream by developing a global, scenario-based, fleet-level methodology that models fleet rollover, production limits, and retirement dynamics to assess the fuel and emissions impacts of next-generation aircraft up to 2050. These studies provided valuable insights, especially into long-term emissions trajectories.
More recent studies embed climate impact directly into fleet assignment optimization models, often in multi-objective or stochastic settings with a short-to-medium-term planning horizon. Justin [24] proposed an integrated MILP for fleet assignment and scheduling in electrified regional air mobility, balancing profitability and emissions, while Wang [25] introduced an MILP on a time–space network model incorporating carbon emission limits. In the multi-objective, multi-agent model proposed by Noorafza [26], average temperature response is minimized alongside profit maximization for three different airline types. Liu [27] formulated a two-stage stochastic fleet assignment model accounting for uncertain demand and fuel prices for daily operations, and Chan [28] developed an MILP fleet assignment model for a regional airline that integrates hybrid-electric aircraft to quantify cost–emissions trade-offs under realistic operational constraints.

1.1.3. Hydrogen as a Future Aviation Technology

Hydrogen propulsion has emerged as an important candidate for decarbonization of aviation, offering the potential to eliminate in-flight CO2 emissions and substantially reduce overall climate impact [29]. Research in this area predominantly focused on conceptual aircraft design and simulation-based approaches, focusing on aircraft feasibility and fleet-level impacts rather than airline decision making. Lammen [30] analyzed the global fleet-level energy consumption and flight-by-flight emissions of hydrogen-powered aircraft under different traffic growth and technology scenarios, while Hoelzen et al. [31] provided an assessment of LH2 supply infrastructure, hydrogen-powered aircraft design, and operational strategies within an exemplary European air traffic network.
More recent work has also begun to integrate hydrogen aircraft into optimization-based assessment frameworks, with applications typically at limited network scales. Proesmans [32] developed a multidisciplinary, multi-objective framework combining optimal aircraft design and fleet allocation, explicitly considering hydrogen and sustainable aviation fuels and using the average temperature response as a climate objective. Finally, Sirtori et al. [33] proposed an optimization-based methodology to assess the transition of short- and medium-haul fleets to hydrogen propulsion under refueling infrastructure constraints, optimizing aircraft assignments to routes to minimize energy use, or fuel cost across predefined scenarios.

1.2. Research Gap and Contributions

Substantial progress has been made in fleet assignment modeling, environmental assessment, and alternative propulsion research, yet these advances leave room for further integration and refinement. Classical fleet assignment models are mathematically rigorous but mostly focus on short-term, cost-driven decision making for single airlines or regional networks, while global assessments of fleet evolution typically rely on simulation-based approaches rather than optimization-based formulations. Although more recent studies incorporate climate impact into planning models, they often treat economic and environmental objectives separately or prioritize one over the other, rather than jointly optimizing direct operating costs (DOCs) and climate impact. Moreover, uncertainty handling is limited; passenger demand is sometimes considered but mostly deterministically, and key long-term drivers such as aircraft retirement dynamics, production constraints, and technology availability are rarely modeled endogenously. Finally, while hydrogen-powered aircraft are recognized as a promising pathway for decarbonization, they are often assessed through conceptual aircraft design studies and are rarely integrated explicitly into long-term, optimization-based fleet assignment models. As a result, a global framework capable of evaluating long-term fleet evolution under uncertainty while simultaneously accounting for economic performance, climate impact, and future aviation technologies is still lacking.
Hence, the primary contributions of the present study are as follows:
  • A global, optimization-based fleet distribution and development framework capable of evaluating long-term fleet evolution;
  • A multi-objective formulation that jointly minimizes the energy component of DOCs and climate impact;
  • Explicit integration of future aviation technologies, including H2-powered aircraft, within the same modeling framework;
  • Incorporation of key operational factors such as demand evolution, fleet retirement, and aircraft production within the assessment framework.
Following the introduction and literature review in Section 1, the methodology used for the scenario creation and fleet modeling framework is explained in Section 2. Then, in Section 3, the main results of this study based on the selected scenarios and aircraft technologies are presented. Subsequently, the main conclusions and an outlook for future work are given in Section 4. A compact overview of the underlying data used for the assessment is provided in Appendix A.

2. Methodology

This study uses a scenario-based approach to assess the potential of H2-powered aircraft which are defined within the H2Avia project [6]. Aside from the aircraft technology, the assessment also includes sensitivity analyses addressing fuel costs and policy framework. The study was conducted at fleet level, providing insights into the fleet composition and its evolution over time, as well as the resulting energy consumption and climate impact.
In the following, the methodology is described by introducing the Bauhaus Luftfahrt in-house fleet model as part of a broader air transport system (ATS) assessment framework as well as the underlying mathematical model. Furthermore, the scenario creation process is briefly outlined, along with the associated assumptions and requirements.

2.1. ATS Assessment Framework

The ATS comprises three essential stakeholders (airlines, airports, and air traffic management), which take responsibility for transporting passengers and freight by air [34,35]. Also, further stakeholders such as aircraft manufacturers, energy system providers, and policy makers might be involved in the ATS assessment.
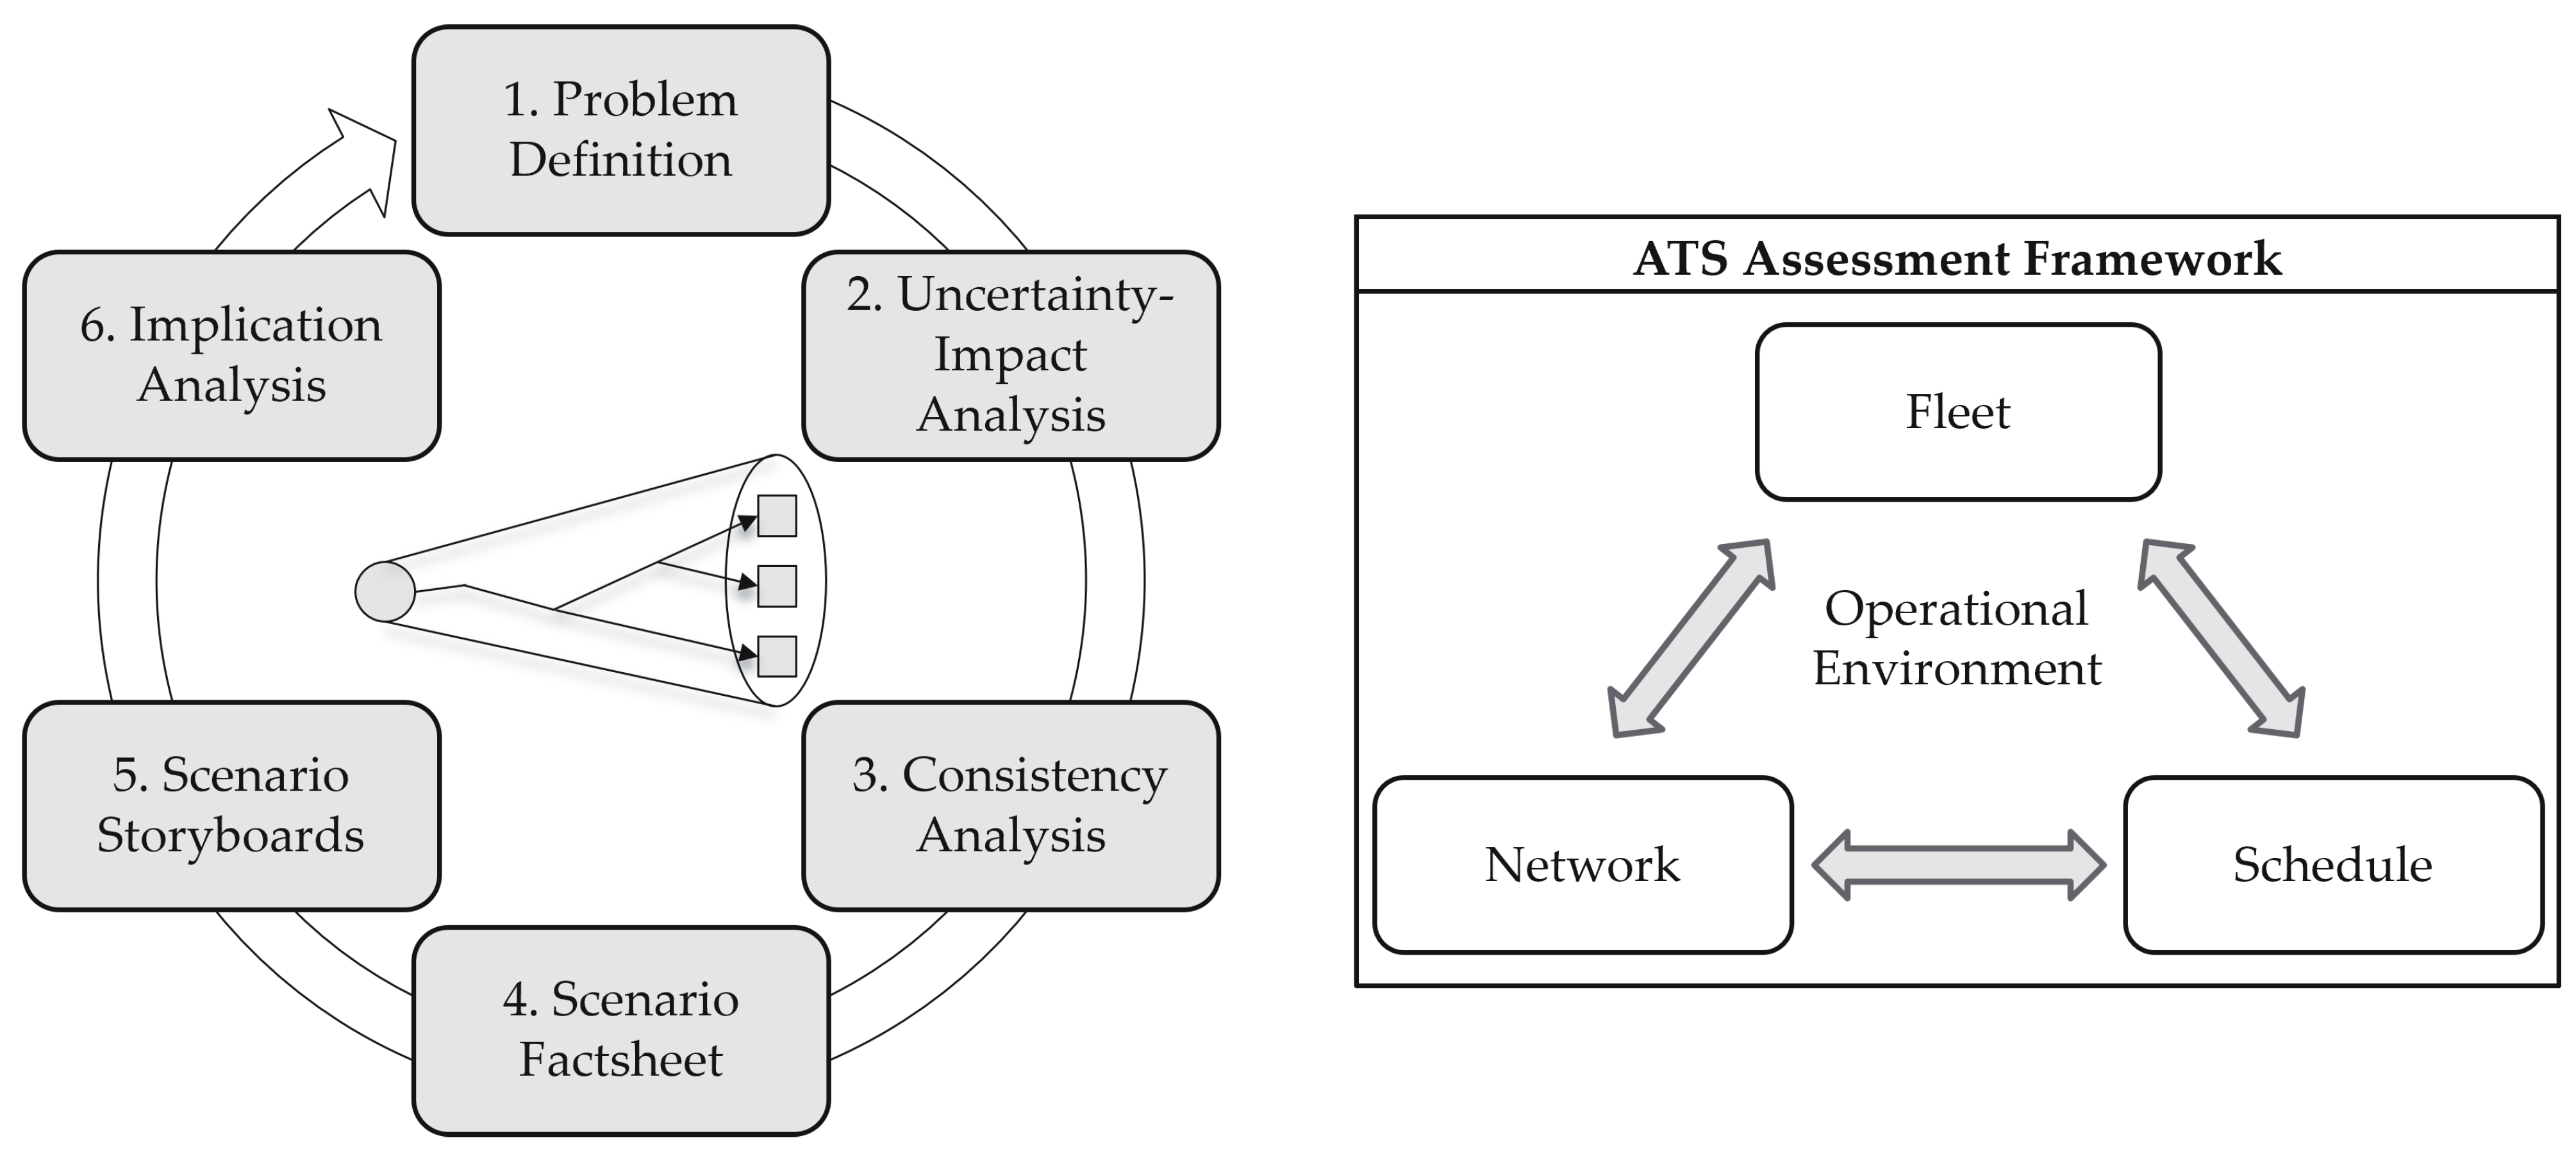
Within the scope of this study, the ATS assessment framework is defined in a narrower way, following the approach in [23], which focuses on the aircraft fleet that operates on the specific network of air routes and the underlying flight schedule coming from the OAG 2024 database [36]. Figure 1 illustrates the methodological scheme for such a scenario-based and system-wide level approach, following the basic steps of an explorative scenario creation process, as described in [37,38].
The main task is to derive scenarios with regard to the introduction of hydrogen as a future energy carrier in aviation. Following this problem definition, an uncertainty-impact analysis is performed to identify key factors and critical uncertainties. This was carried out in several expert workshops by specifying the socioeconomic, technical, and environmental trends that affect the air transport industry. Eventually, a consistency analysis is performed to visualize potential interdependencies between the identified factors which are subsequently used as key drivers for scenarios. Hence, scenarios are defined so that they represent plausible projections of the future of hydrogen aviation. The scenario fact sheet represents the main interface between the ATS assessment framework and the scenario creation process, since it provides the necessary inputs to describe the operational environment for the aircraft fleet. Finally, storyboards are created based on the ATS assessment results, and the implication analysis of the results is discussed.

2.2. The Fleet Model

The core part of the ATS assessment framework in this study represents the fleet model, which uses the top-down (also called macro) approach, as described in [39]. Such an approach enables a mid-to-long-term evaluation of new aircraft types, using assumptions about the operational environment at a relatively high level of aggregation. In contrast to the bottom-up approach, which involves detailed analysis via a single flight and route, the simpler top-down approach is more commonly used for fleet assessments over longer time horizons (more than 10 years) due to high uncertainty in future scenarios, such as constantly changing market conditions and political decisions [40].
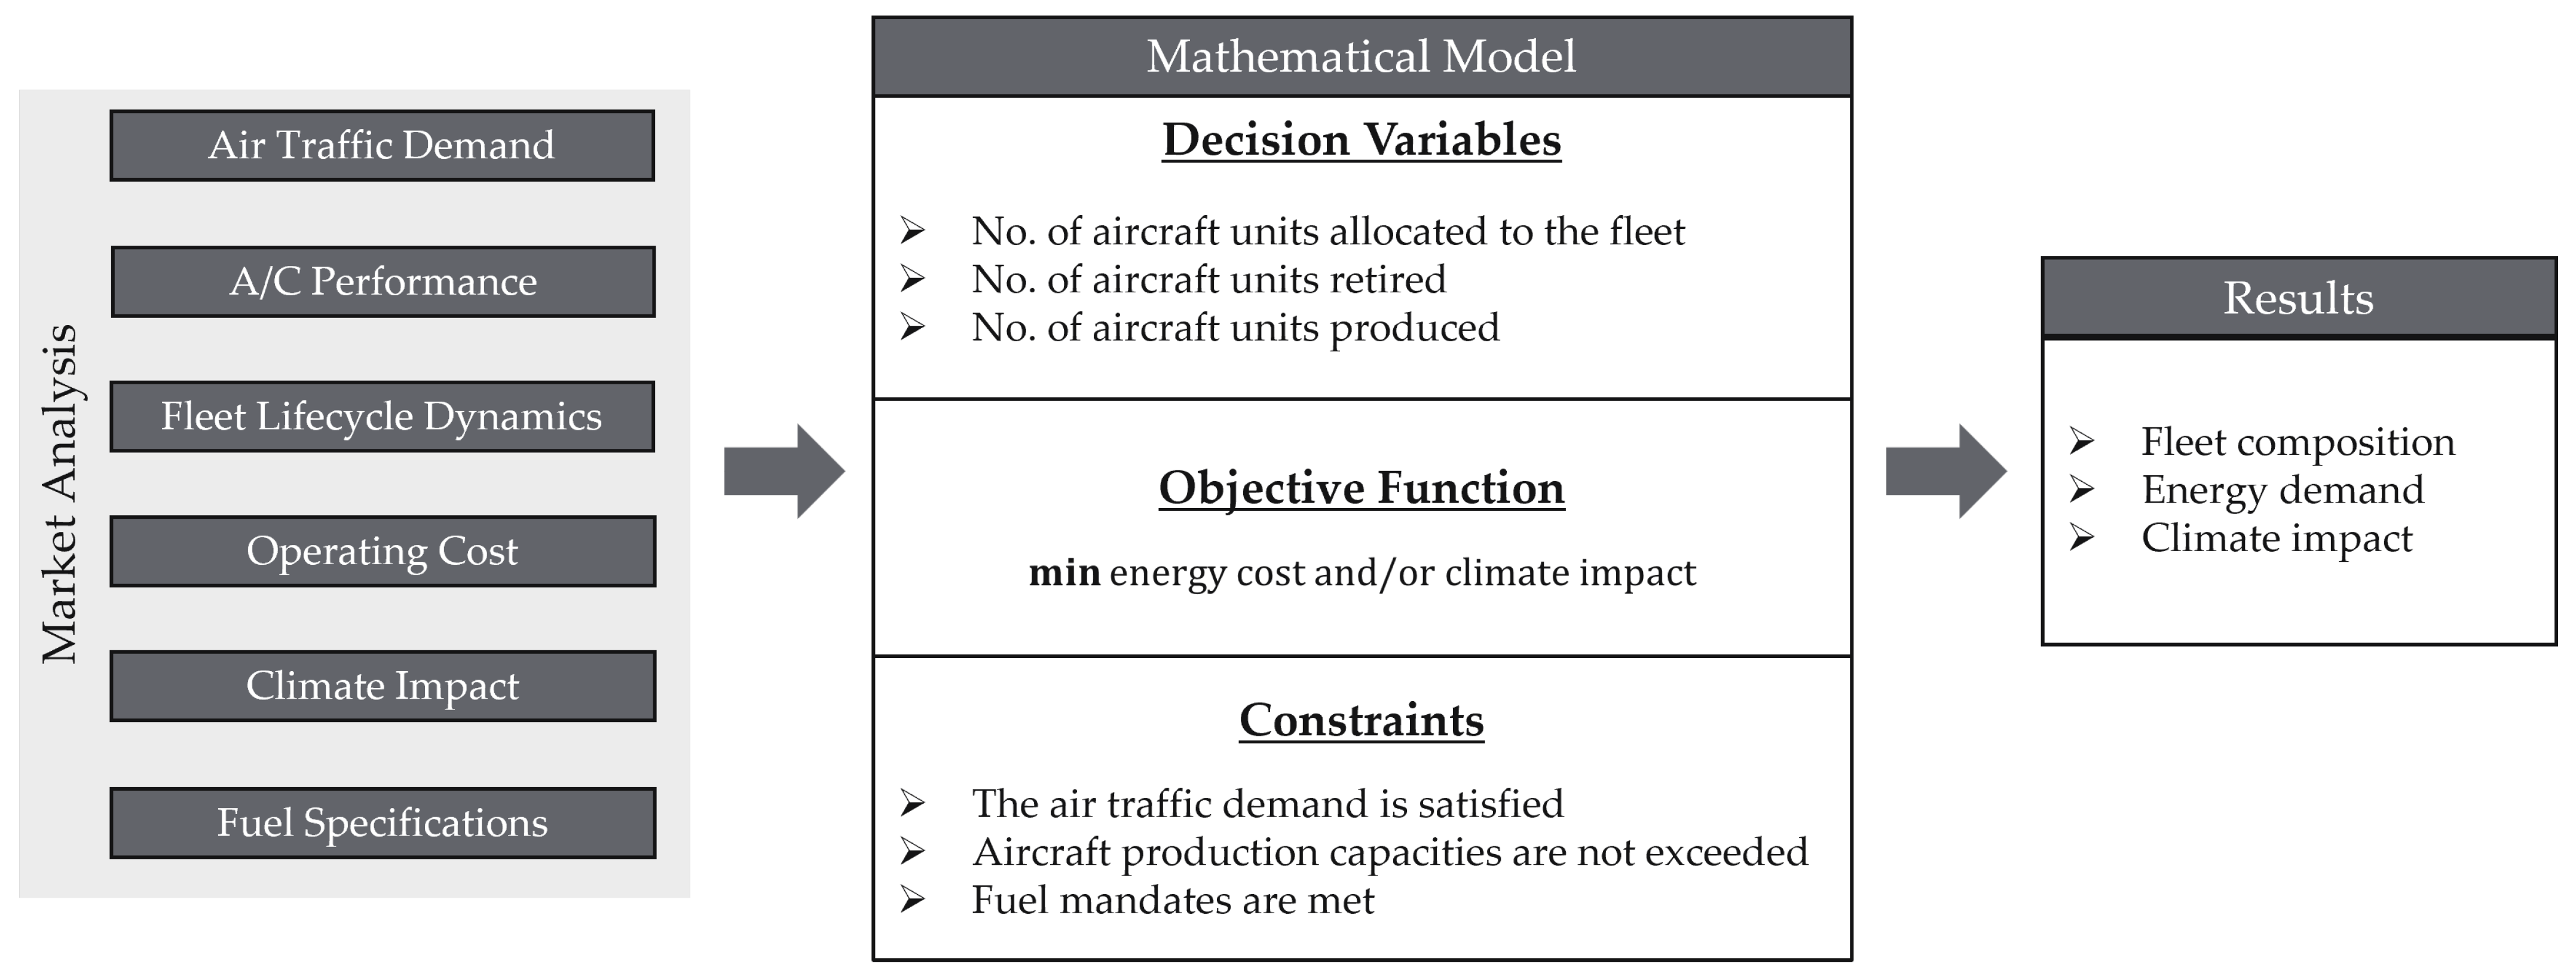
While the in-house fleet model was initially introduced in [23] using the fleet system dynamics model (FSDM) method, the model presented in this study formulates the problem using a linear programming approach. The main goal of the model is to decide on the fleet composition (i.e., fleet allocation) in a specified network of aggregated routes while minimizing the overall fuel cost or climate impact for a defined time horizon. Figure 2 illustrates a schematic overview of the fleet modeling tool, where the left block contains all necessary inputs, the middle block explains the underlying mathematical model for the fleet allocation, and the right block outlines the main outputs of the tool. The model uses the commercial Gurobi Optimizer [41]. The required assumptions, inputs, and outputs as well as the mathematical formulation of the model itself are described in the following.

2.2.1. Inputs and Assumptions

Following the top-down approach, the fleet model relies on decisive assumptions with regard to the representation of the global aircraft fleet and the global routes network to reduce the complexity level.
While the OAG 2024 database of scheduled flights [36] lists 221 aircraft types, only passenger aircraft are considered within the scope of this study. The unique aircraft types are clustered based on their range capability and seat capacity, resulting in seven representative aircraft clusters, which are listed in Table A1. Furthermore, the model assumes a single global airline and thus does not capture airline competition or the impact of different business models. While commercial aviation is inherently competitive, modeling such dynamics would require detailed representations of airline cost structures and strategies, which are beyond the scope of this study. Therefore, a single benevolent, monopolistic airline is assumed to focus on system-level fleet and technology effects, following the approach in [23].
In addition, there are more than 36,000 different airport pairs forming the global route network in the OAG 2024 database. Accordingly, unique airport pairs are aggregated to representative route pairs based on global market regions (e.g., EUNA stands for the representative route pair between Europe and North America). An overview of all representative route pairs can be found in Table A2.
The main inputs needed for the fleet model are as follows:
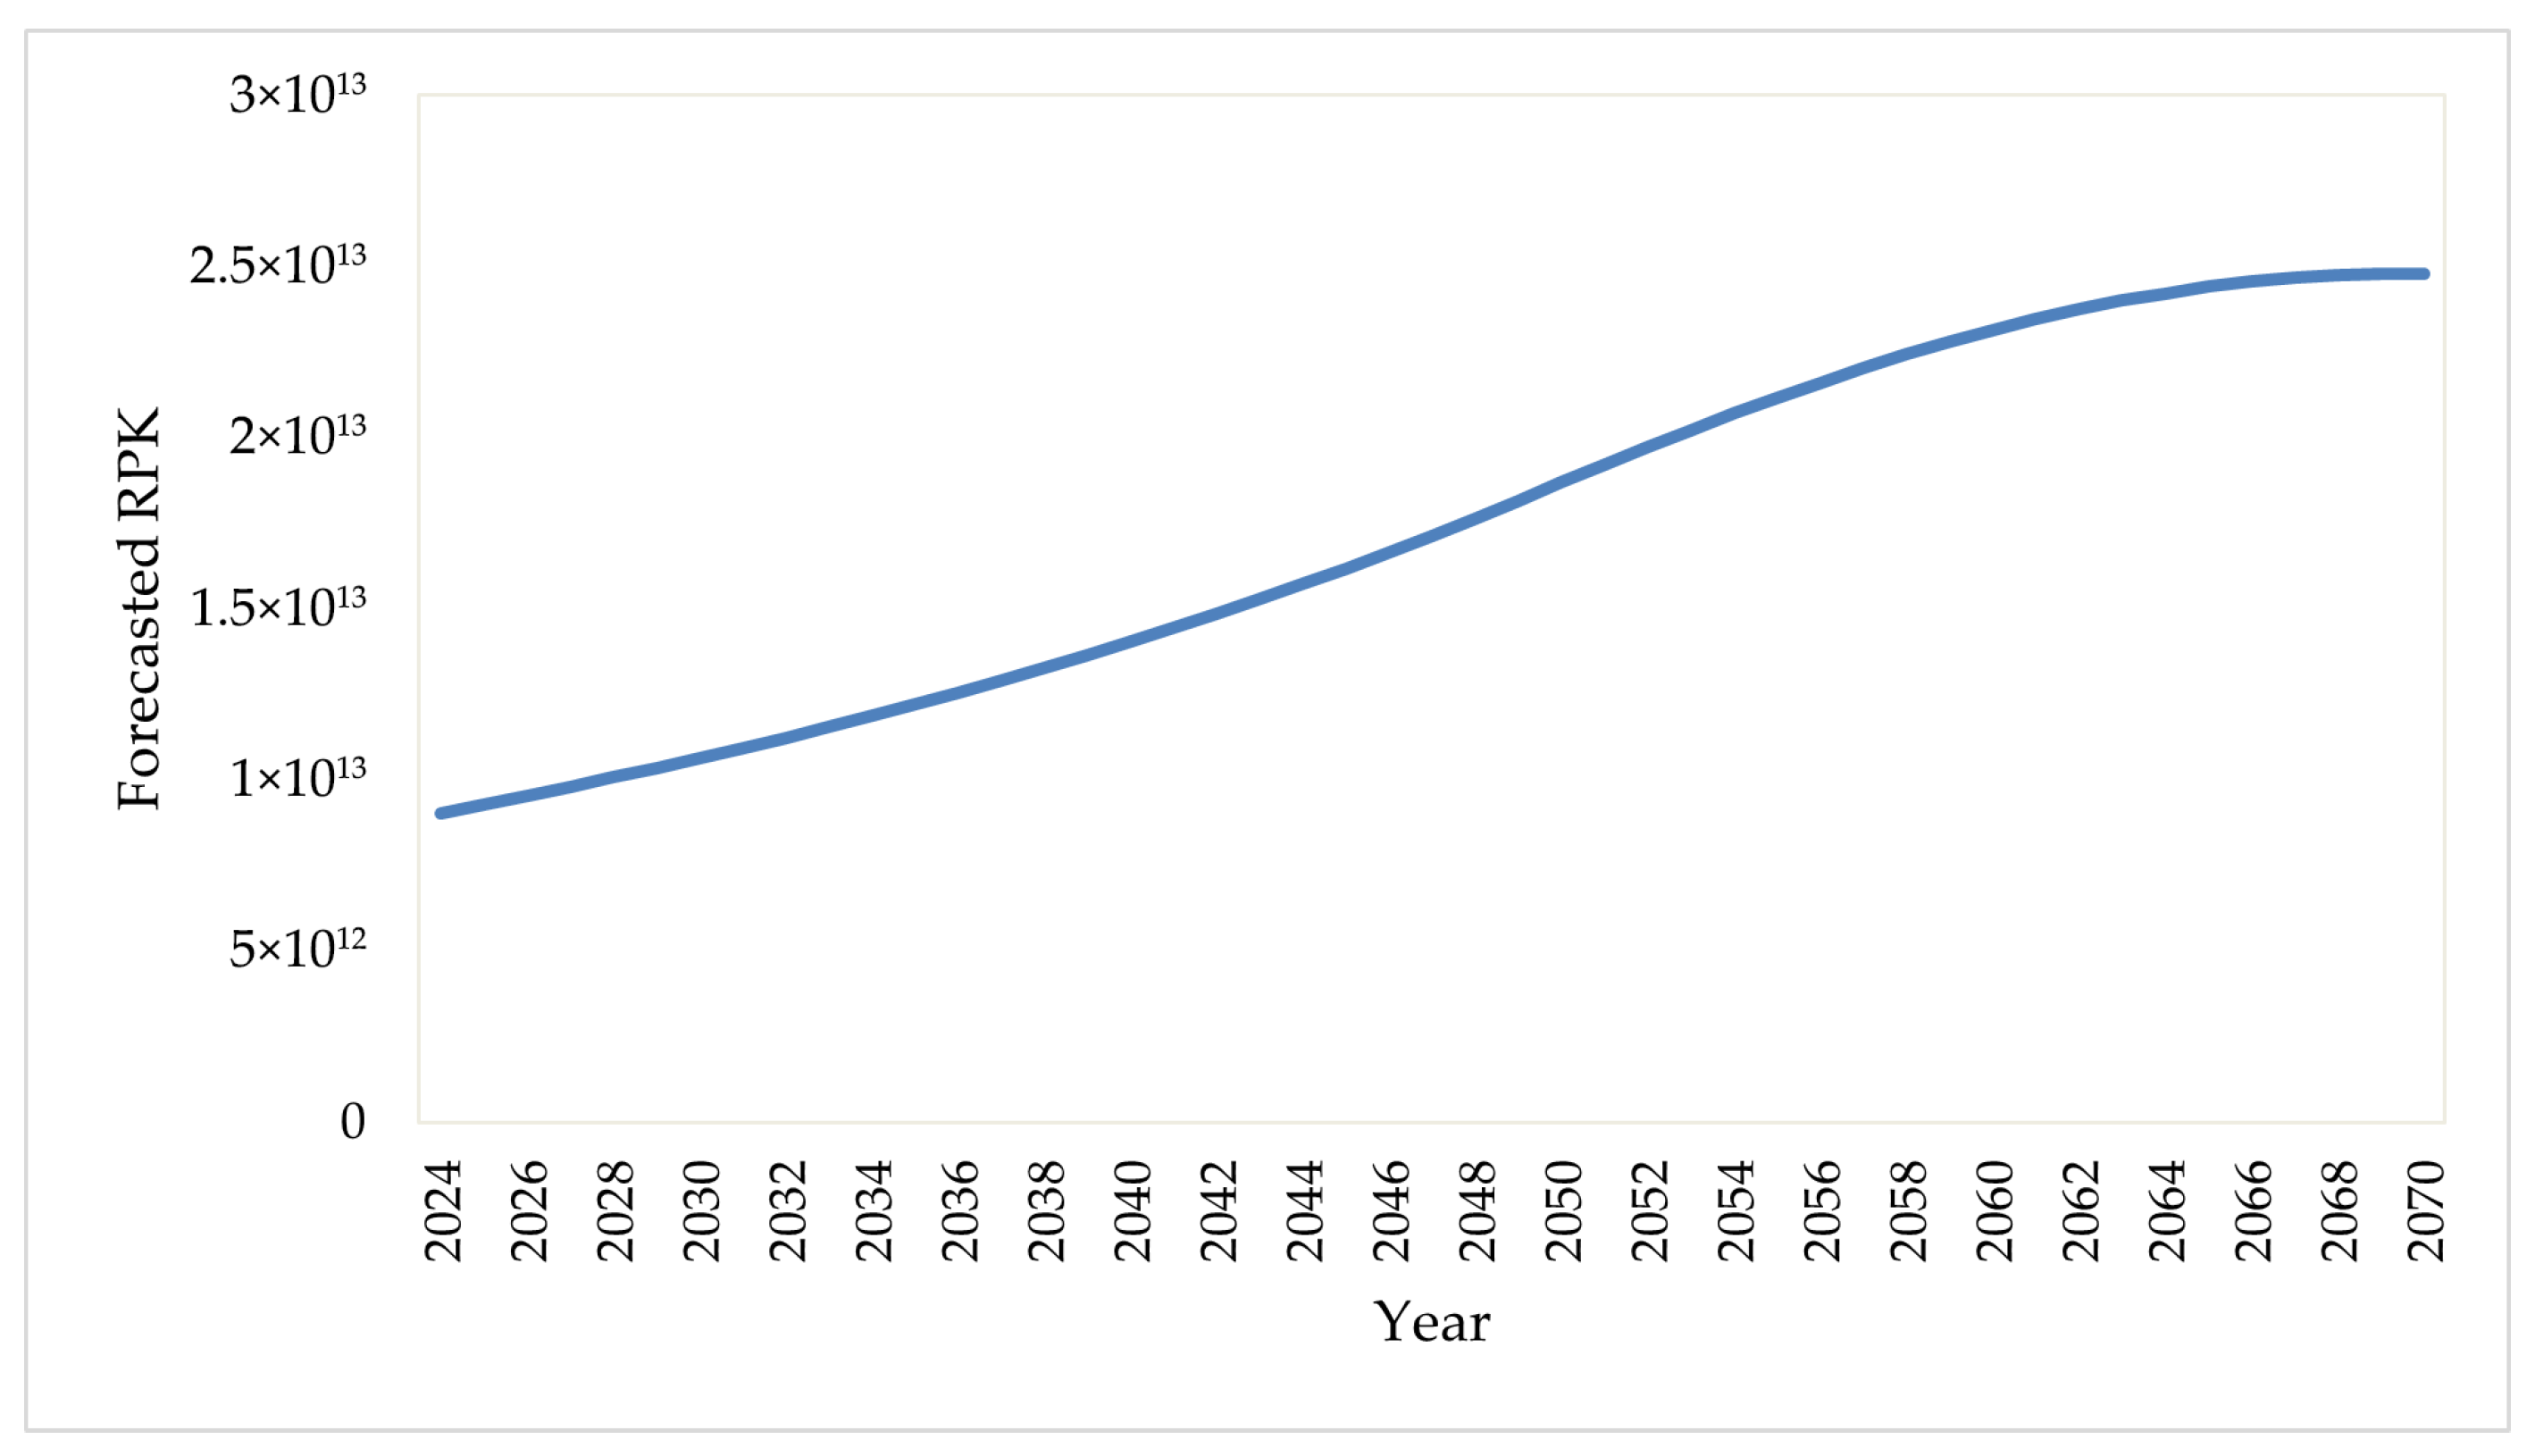
  • Air traffic demand is determined by the revenue passenger kilometers (RPK) growth and indicates the assumed annual growth rate for each representative route pair during the observed time horizon. Combined with a passenger loading factor (PLF) forecast, the required amount of available seat kilometers (ASK) to accommodate the RPK growth is established. The RPK growth rate is derived from industry outlook sources [42,43] as well as scenarios for post-COVID development of passenger demand in aviation [44]. The PLF is extrapolated using the historical data provided in [45]. This study assumes a constant increase in passenger demand across all representative routes until 2050, followed by a gradual saturation in the period between 2050 and 2070, reflecting a decoupling of the gross domestic product (GDP) and passenger demand growth rates. The total RPK forecast aggregated over all representative route pairs is shown in Figure A2.
  • Aircraft performance data include the fuel burn and energy consumption for each feasible pair of representative aircraft cluster and representative route (i.e., feasible flight mission) based on their payload-range curves. The performance data for reference aircraft can be obtained from external tools such as the EUROCONTROL Base of Aircraft Data (BADA) [46], UNICADO [47], or OpenAP [48]. This study uses the BADA 3.16 aircraft performance model via the official pyBADA interface in Python 3.14.2 [49]. The performance of future (i.e., H2-powered) aircraft is approximated by scaling the integral block energy demand, accounting for efficiency improvements derived within the H2Avia project, and adjustments based on the lower heating value (LHV), as stated in Equation (A1).
  • Aircraft cost parameters refer to the DOC components of representative aircraft clusters. Although the optimization models executed from an airline perspective mostly apply profit maximization as the objective function [23,40], the focus of this study is set on fuel cost minimization, which is represented by the DOC energy component.
  • Fleet lifecycle dynamics provide information on aircraft retirement, fleet age structure, and aircraft production. Aircraft retirement is modeled using survival probability curves, with parameters refined by Randt [23] based on the extensive analysis conducted by Engelke [50]. Production capacities are estimated using linear regression parameters derived from Engelke’s study on the historical evolution of aircraft deliveries [50]. The study provides two linear functions to estimate the total production capacity for single-aisle and twin-aisle aircraft which can be seen in Equations (A2) and (A3), respectively. The initial age distribution of each aircraft cluster was determined by fitting normal distributions to fleet age data obtained from Planespotters [51], and the initial fleet is determined by combining the OAG 2024 dataset [36] and information on aircraft utilization from the RDC database [52].
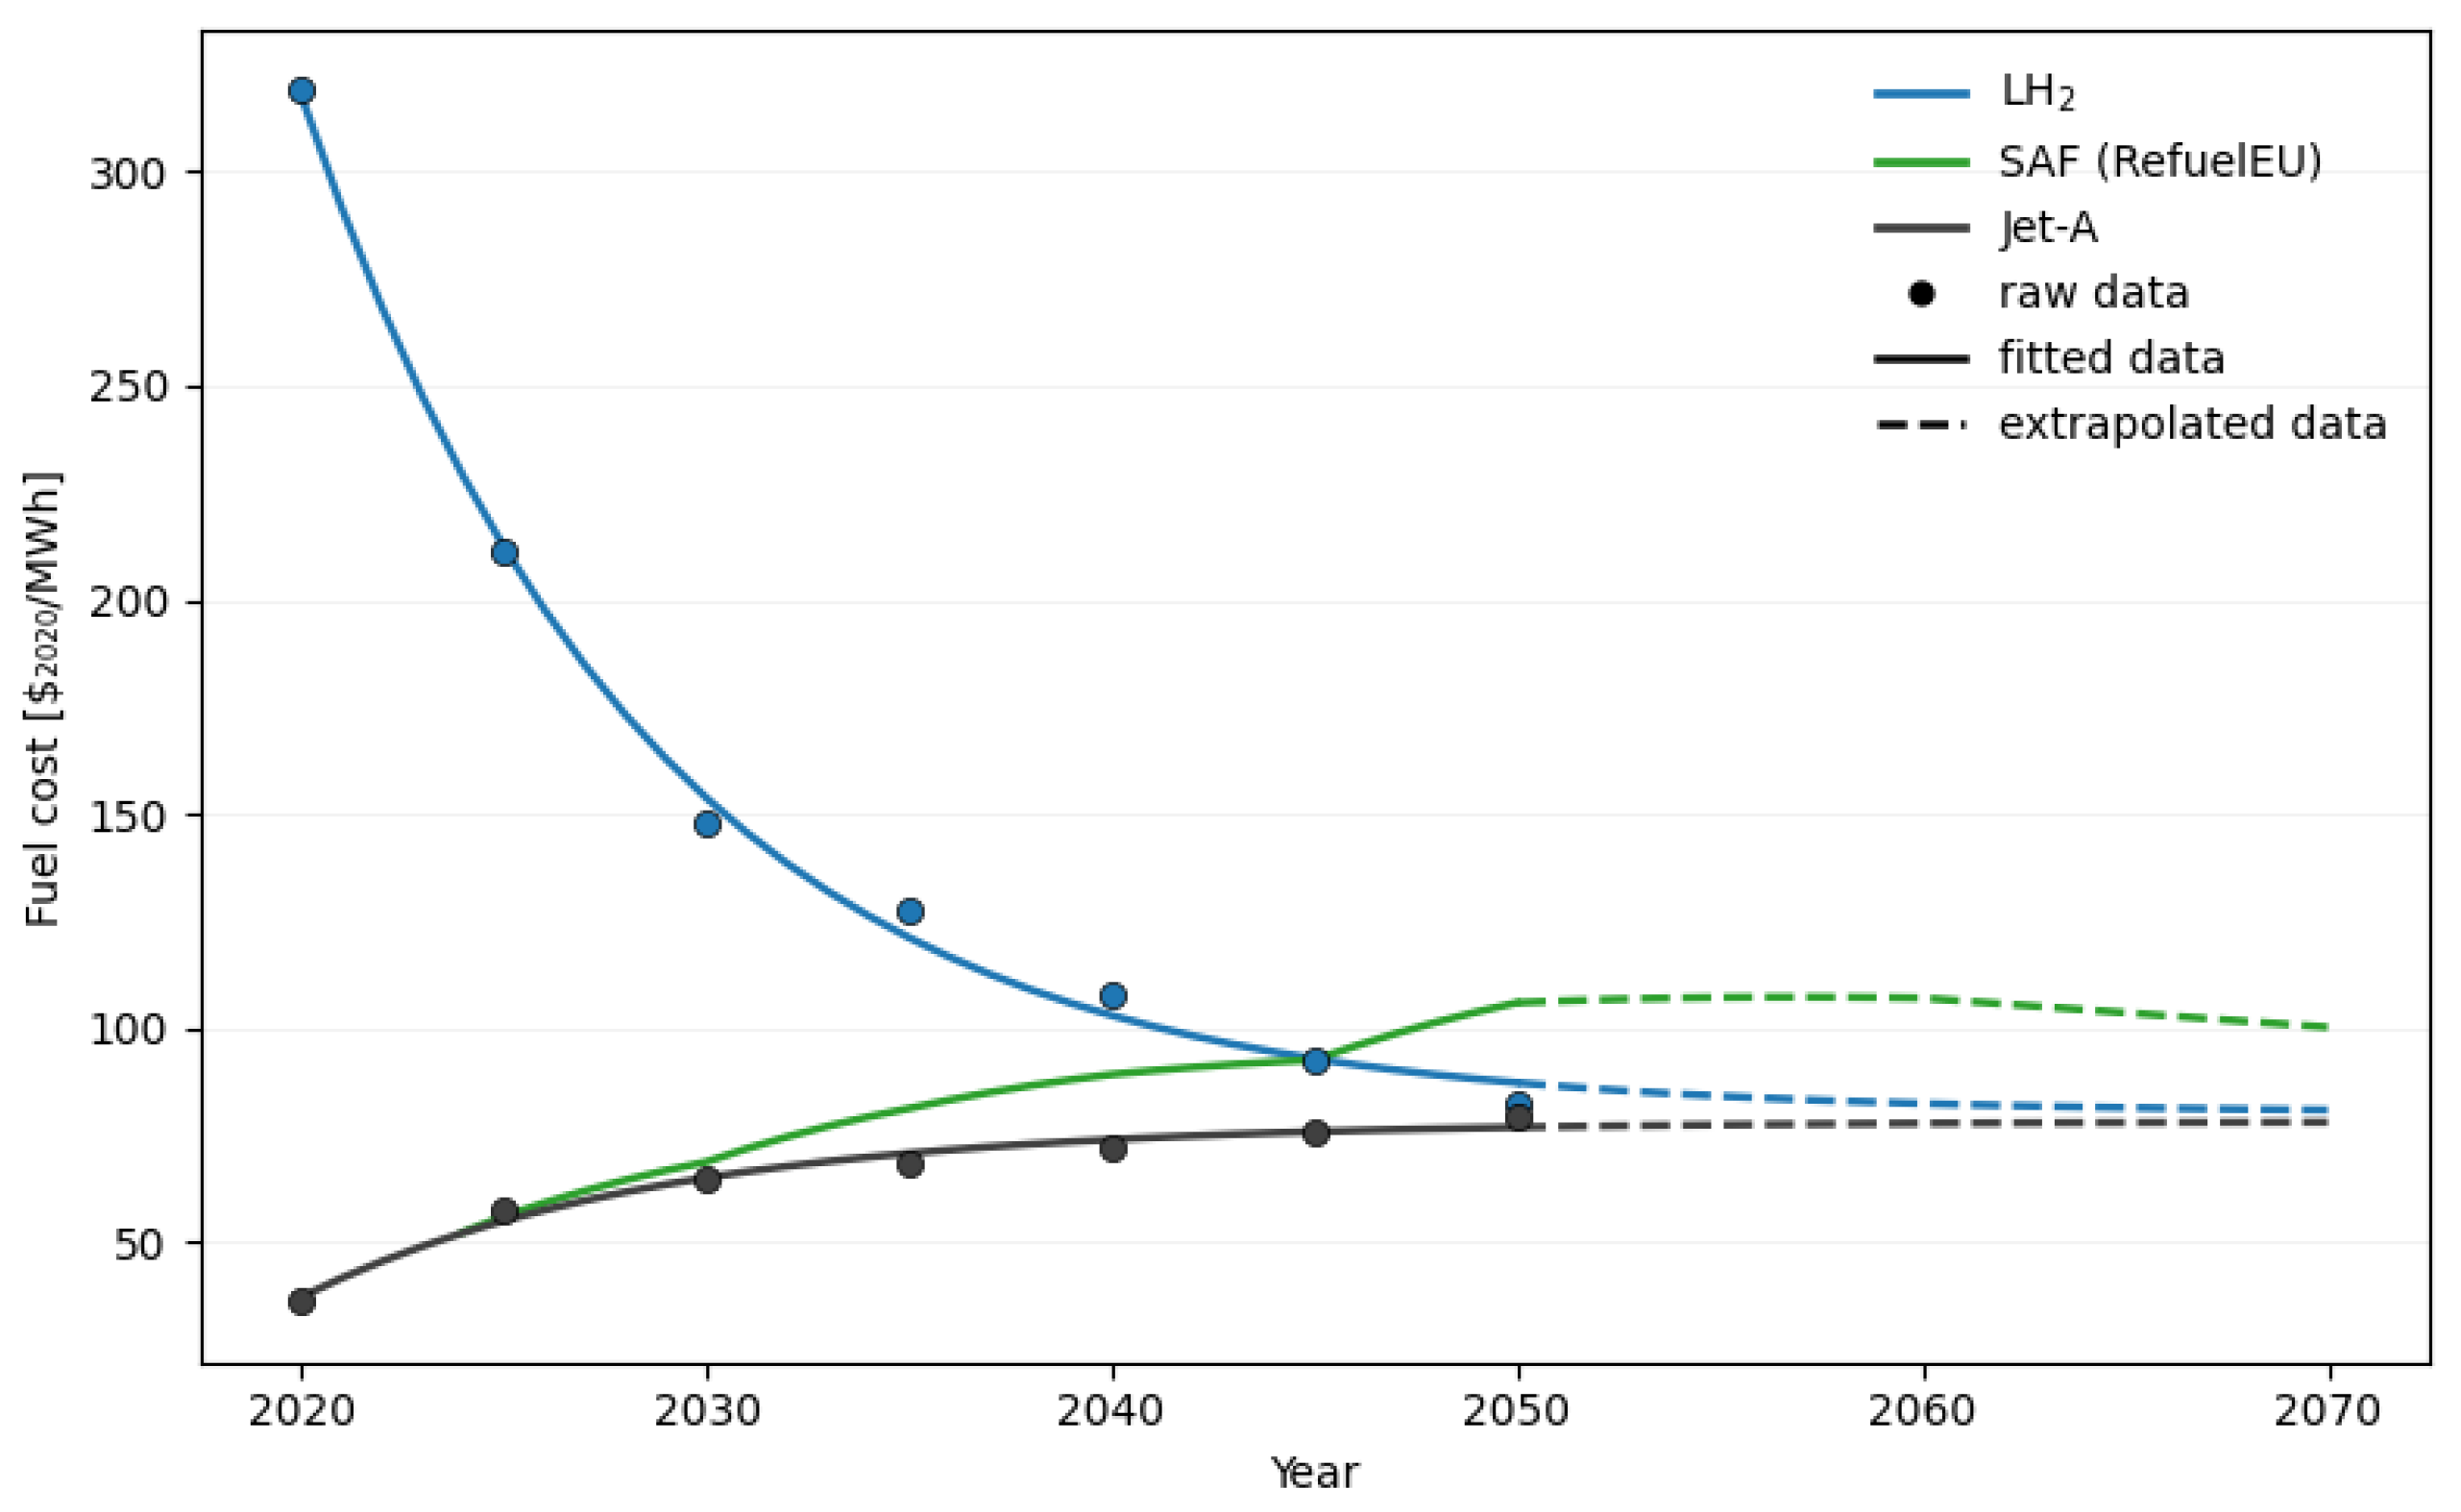
  • Fuel specifications contain data about fuel properties, fuel cost, and eventually fuel mandates for the observed time horizon and market regions. In this study, different sources are synthesized to derive cost scenarios for kerosene, LH2, as well as SAF mandates according to RefuelEU [53,54,55]. The reference fuel cost trajectories are provided in Figure A3.
  • Climate impact data is provided from an in-house tool based on the simple climate model proposed in [56,57]. The climate data is provided for each flight mission contained in the aircraft performance data. For this study, the efficacy-weighted global warming potential ( f - G W P 100 ) is used. Furthermore, the contrail properties of H2-powered aircraft remain an open question in the scientific community, as experimental evidence is still limited, and the expected reduction in ice crystal numbers due to lower soot emissions may be partly offset by increased water vapor emissions, affecting contrail formation, persistence, and radiative forcing [58,59]. In particular, recent in-flight observational evidence suggests that contrail ice crystals can still form at low nvPM emission levels, nucleating on volatile particles even in the near absence of soot [60]. To address this uncertainty, two bounding scenarios are defined for each flight mission operated by H2-powered aircraft. These scenarios are not derived from empirical data but based on simplifying assumptions intended to represent extreme limiting cases for the possible contribution of contrail effects. Therefore, they should not be interpreted as uncertainty ranges or likely outcomes. In the high-impact case, the contrail-induced radiative forcing is assumed to be comparable to that of kerosene-powered aviation. In the low-impact case, contrail effects are considered negligible due to lower nvPM emissions and/or operational mitigation strategies such as trajectory optimization to avoid ice-supersaturated regions.

2.2.2. Model Formulation

The fleet assignment and development model is implemented as a linear programming model that determines the optimal allocation of aircraft clusters and fuel types to the representative route pairs while satisfying air traffic demand and aircraft production constraints. The sets and their associated indices used throughout the model formulation are summarized in Table 1.
The main decision variables of the mathematical model are as follows:
  • x k , r , f t , the number of units per aircraft cluster k and fuel type f assigned to route r in year t;
  • u k , a t , the number of aircraft units of age a in cluster k retired at year t;
  • y k t , the number of new units per aircraft cluster k added at year t to the fleet;
  • m k , a t , the number of units per aircraft cluster k that are age a in year t.
The objective function is expressed in Equation (1), and it minimizes the selected fleet-level performance metric. The performance metric is calculated as product of the performance parameter η k , r , f t , the number of selected aircraft units per cluster x k , r , f t , and the number of frequencies n k , r with which an aircraft unit of the aircraft cluster k K , using fuel type f F , operates on route r R . The objective function seeks to minimize this metric over all years t T :
min t T ( k , r , f ) K R F η k , r , f t · n k , r · x k , r , f t
The performance parameter η k , r , f t in this study represents a linear combination of the fuel cost, here expressed as the energy cost D O C energy t k , r , f , and the climate impact, here expressed as the efficacy-weighted global warming potential f - G W P 100 t k , r , f . As shown in Equation (2), both parameters are normalized by their respective maximum values to ensure comparability due to different scales. Furthermore, a factor α [ 0 , 1 ] is applied to allow for different weighting between the energy cost and climate impact as performance parameter:
η k , r , f t = α · D O C energy t k , r , f D O C energy max + ( 1 α ) · f - G W P 100 t k , r , f f - G W P 100 max
The fleet model is subject to several constraints:
  • The demand constraint ensures that the capacity gap, i.e., the difference between the future ASK, which is required to accommodate the forecasted passenger demand, and the remaining ASK after aircraft retirement is met. This gap must be filled by existing aircraft (subject to aircraft availability and utilization hours) or newly introduced aircraft, selected based on their performance parameters, which are used in the objective function. Equation (3) requires that the seat kilometers supplied on route r in year t, given by the product of available seats s k , r , route distance d r , flight frequency n k , r , and assigned aircraft units x k , r , f t , are greater than or equal to the forecasted A S K r t :
    k : ( k , r ) K R f : ( k , f ) K F s k , r · d r · n k , r · x k , r , f t A S K r t r R , t T { 0 }
  • The fleet number constraint ensures that the number of aircraft units assigned in any year is equal to the total aircraft units available based on their age distribution, as expressed in Equation (4):
    r : ( k , r ) K R f : ( k , f ) K F x k , r , f t = a A m k , a t k K , t T { 0 }
  • The production capacity constraint restricts the number of new aircraft that can be introduced each year based on aircraft manufacturing limits, as shown in Equation (5):
    y k t C k t k K , t T { 0 }
  • The aging and retirement constraint tracks how aircraft age from one year to the next while accounting for aircraft retirements, as shown in Equation (6). Additionally, the initial age a = 0 is assigned to all newly delivered aircraft in Equation (7). Furthermore, the number of retired aircraft is calculated in Equation (8) for each year based on the survival probability p k ( a ) :
    m k , a t = m k , a 1 t 1 u k , a 1 t 1 k K , t T { 0 } , a A { 0 }
    m k , 0 t = y k t k K , t T { 0 }
    u k , a t = 1 p k ( a ) m k , a t k K , t T , a A
  • The SAF fuel mandate constraint ensures that the SAF quota is fulfilled according to the mandated fraction β SAF t of total non-hydrogen fuel used in each time period t, as shown in Equation (9):
    ( k , r , f ) K R F f = SAF b f k , r , f t · n k , r · x k , r , f t β SAF t ( k , r , f ) K R F f F { H 2 } b f k , r , f t · n k , r · x k , r , f t t T
  • The domain constraint defines all decision variables as non-negative real numbers.

2.2.3. Outputs

The outputs consists of the following indicators which are used to analyze the implications of each scenario: the fleet composition and its evolution over time, the amount of fuel burned (or block energy consumed), and climate impact. Each output is presented at fleet level within the observed time horizon. The concrete computational experiments and their corresponding results are presented in the subsequent section.

3. Computational Experiments and Results

The overarching objective of the H2Avia project [6] is to holistically assess the potential of H2-powered aircraft. The assessment was performed based on scenarios which define the operational environment for the fleet development model, as introduced in Section 2.1. In the following, the scenario matrix as well as the investigated aircraft types are introduced as a set-up for the fleet assessment. Subsequently, the main results are presented.

3.1. Aircraft Technologies

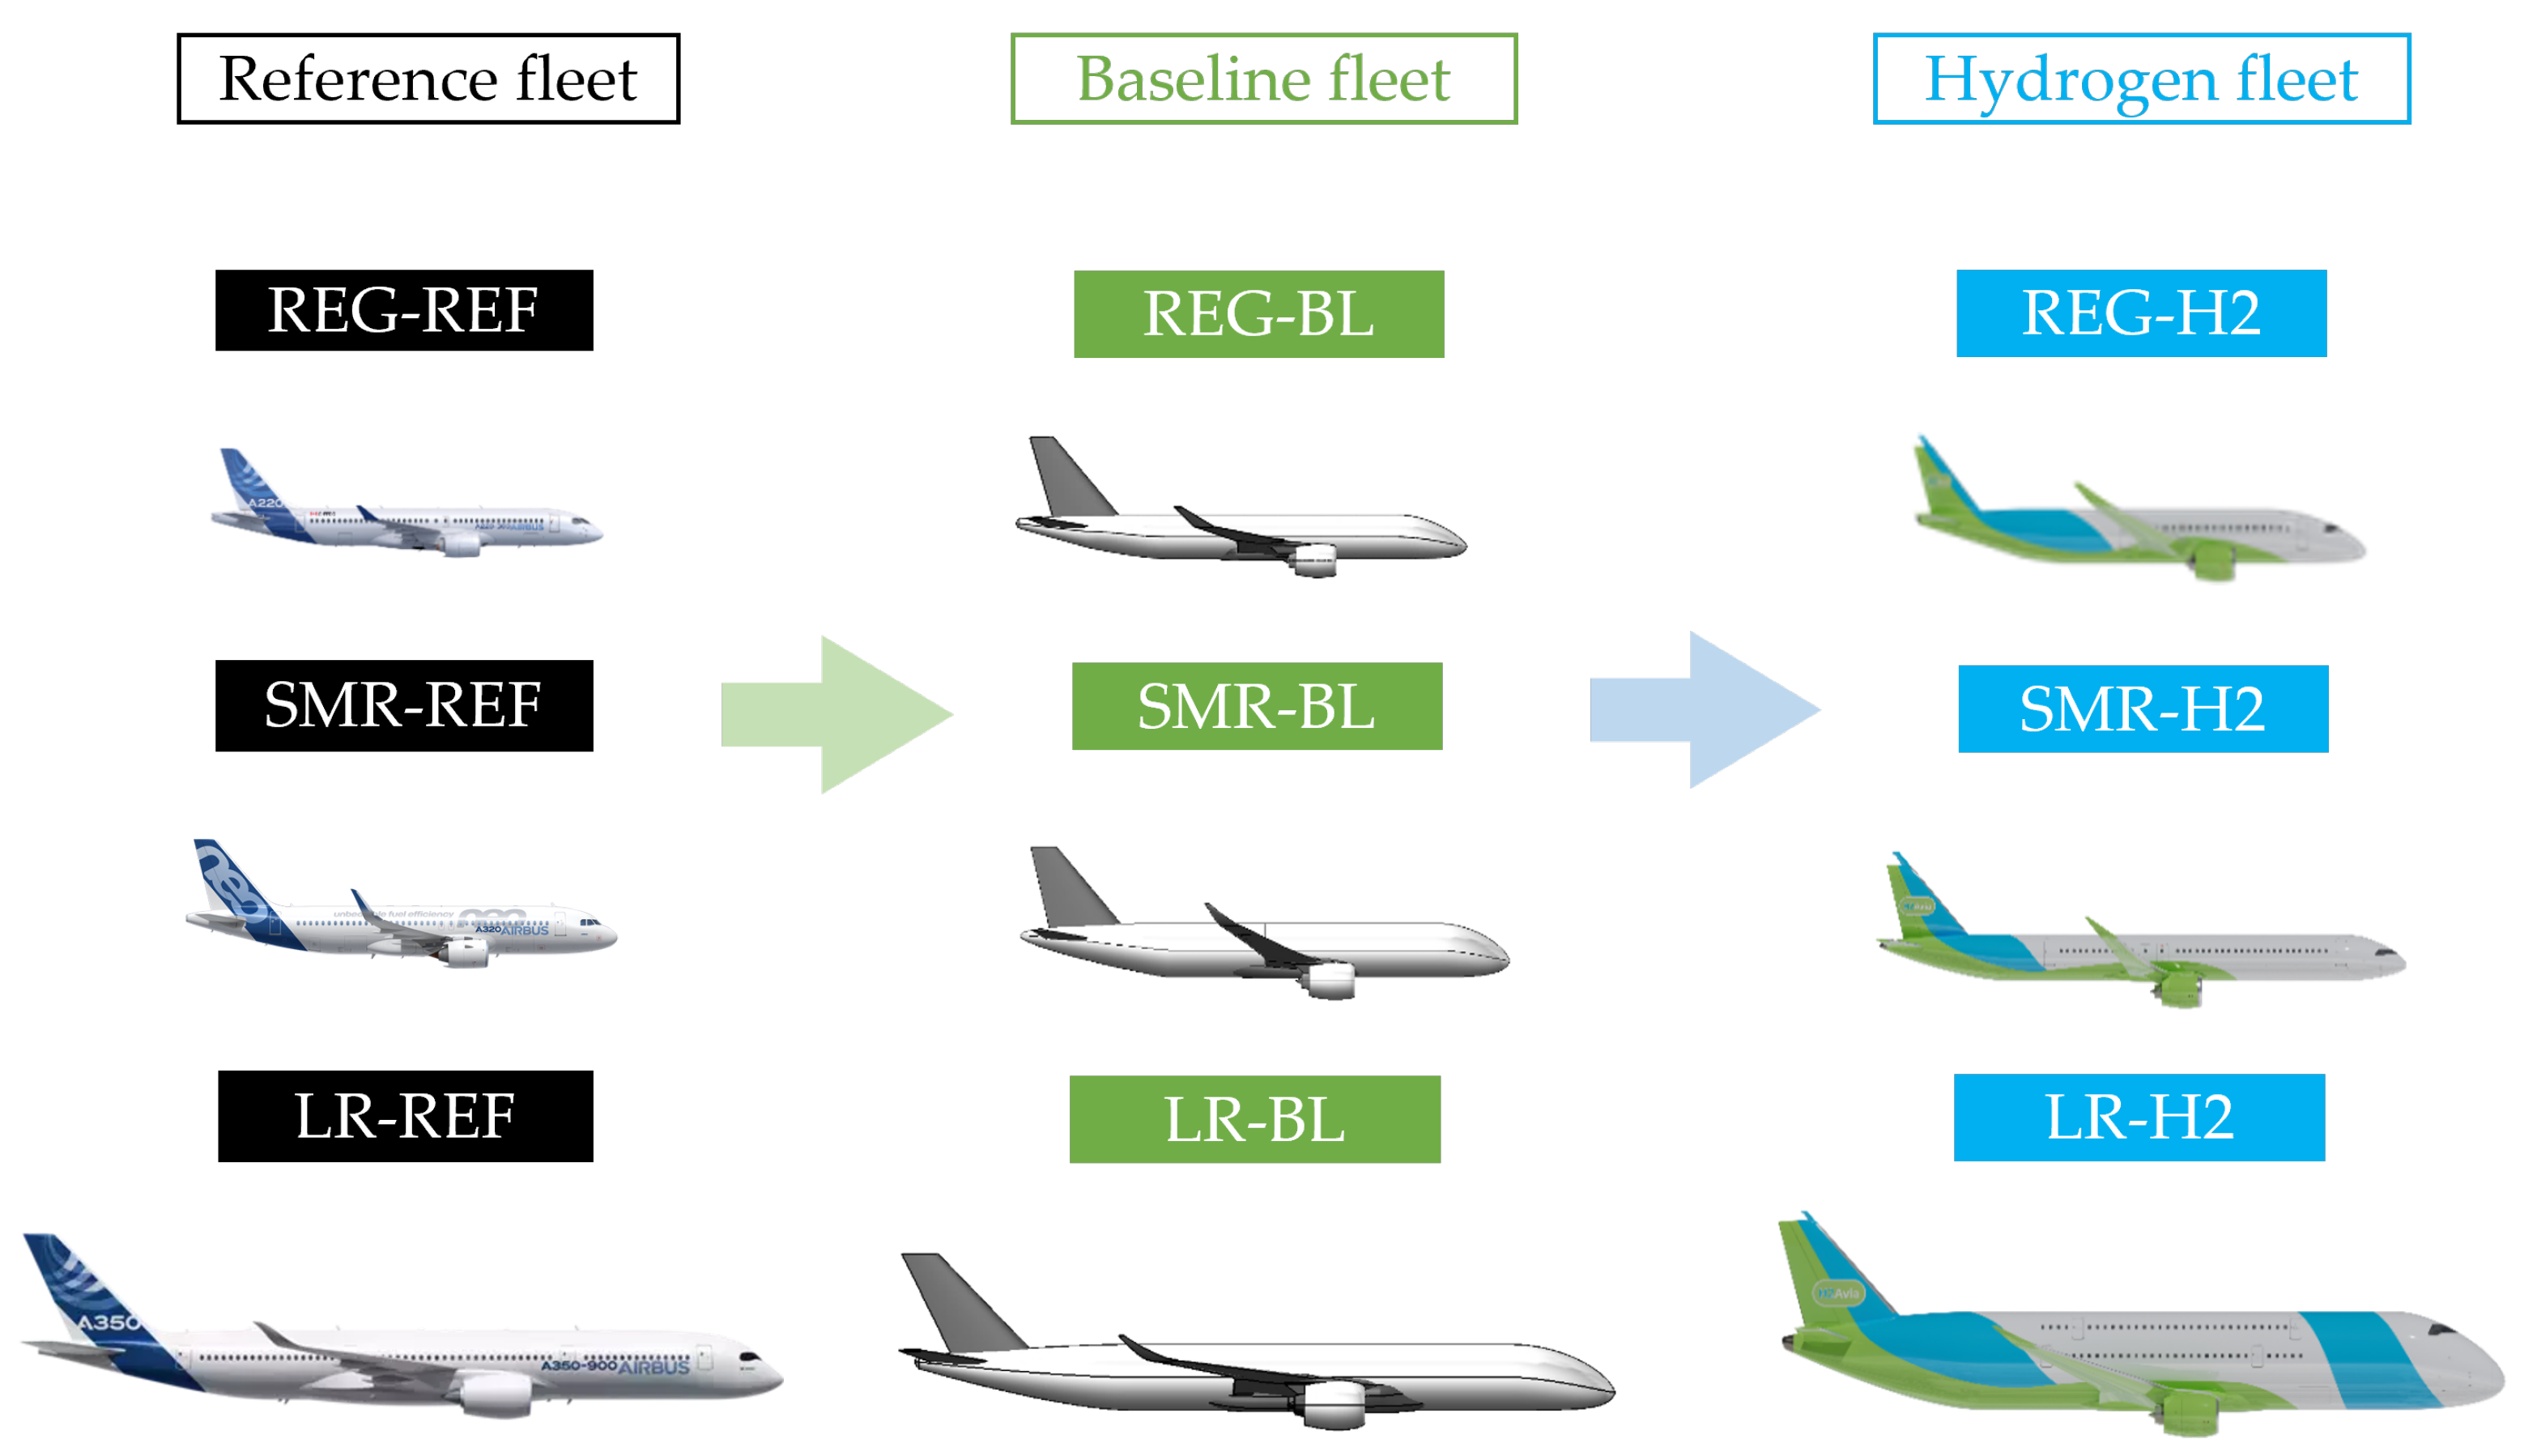
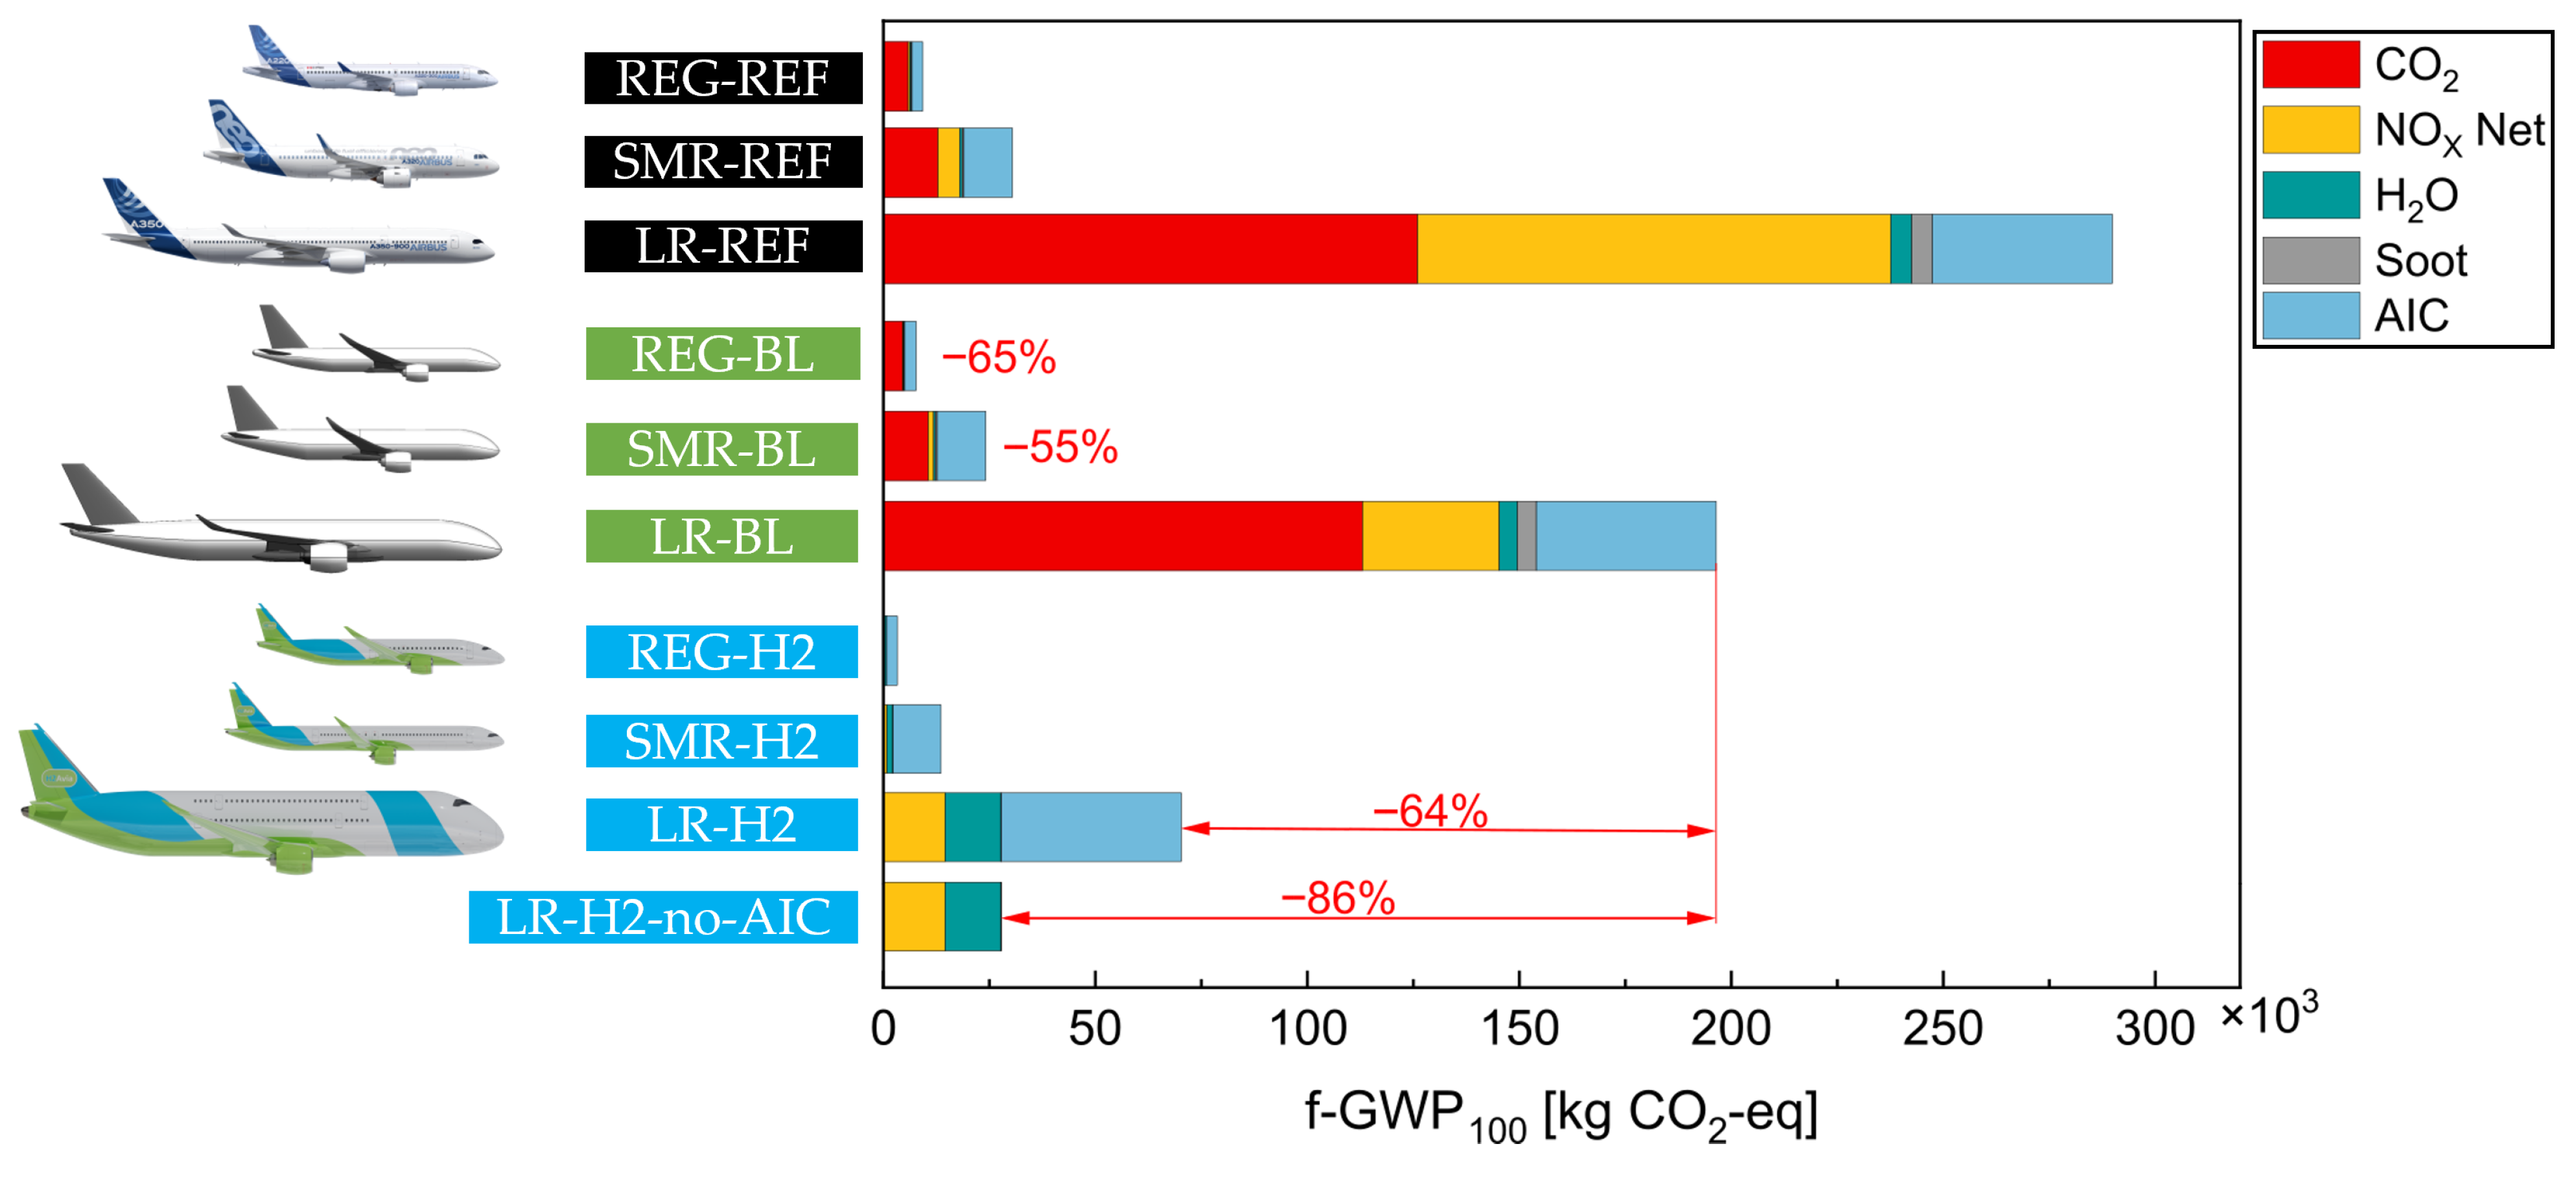
The following aircraft clusters are investigated within the H2Avia project: regional aircraft (REG), short-medium-range aircraft (SMR), and long-range aircraft (LR). As shown in Figure 3, these three aircraft clusters belong to the reference aircraft fleet, which is used to design their successors, i.e., baseline aircraft. Subsequently, the hydrogen aircraft are designed and compared to their baseline equivalents. An overview of the top-level aircraft requirements and block energy performance for the investigated aircraft configurations is provided in Table A3 and Table A4, respectively. Figure A4 provides a comparison of the climate impact for these aircraft on a representative mission. Furthermore, the reference fleet contains additional aircraft clusters, as already introduced in Table A1, in order to realistically represent the initial fleet based on the OAG 2024 schedule data [36].

3.2. Scenario Matrix

The introduced aircraft clusters in Section 3.1 are analyzed at fleet level based on three scenarios. All scenarios consider the same passenger demand growth over a time horizon from 2024 to 2070 (Figure A2) and the same set of the representative route pairs (Table A2) at the global fleet level. Table 2 summarizes the main scenario narratives, reflecting different levels of policy and investment ambition, technology readiness level, and fuel cost dynamics. The underlying reference fuel cost trajectories are introduced in Figure A3.
The SAF Shield scenario assumes a fragmented global policy landscape focusing primarily on scaling SAF under existing instruments such as the ReFuelEU mandate. In the absence of carbon pricing, SAF deployment increases but remains more costly than conventional jet fuel. Investments in hydrogen aircraft and infrastructure remain low due to high technological and economic risks.
The H2 Acceleration scenario represents an upper-bound policy and investment sensitivity case, characterized by strong policy support (e.g., carbon pricing on fossil fuels) and coordinated action across the aviation and energy sectors, enabling the rapid deployment of hydrogen in aviation. A steep learning curve and economies of scale in hydrogen production and infrastructure allow LH2 to become economically competitive soon after the introduction of H2-powered aircraft in 2040 and lead to a significant reduction in LH2 costs in the long term. At the same time, the assumed SAF cost evolution reflects incremental scaling of established production pathways without strong disruptive cost reductions, making it more expensive than LH2 but cheaper than kerosene due to high taxes on fossil fuels. Gradual cost reductions of SAF are partly driven by the increasing availability of low-cost LH2 for e-SAF production. Two variants of the H2 Acceleration scenario are considered: S2, assuming an optimistic climate impact with negligible contrail effects, and S2*, representing a pessimistic case with high contrail impact.
The H2 Hesitation scenario considers a slower and more uncertain transition toward hydrogen aviation, which is reflected in both the policy landscape and investment readiness. Coordination challenges between the main stakeholders in aviation and energy infrastructure providers delay both the development of H2-powered aircraft and the build-up of necessary infrastructure, resulting in a later entry-into-service around 2050. Hence, the cost reduction of LH2 compared with fossil fuels is limited and highly fragmented across market regions such that an economic advantage of LH2 over kerosene or SAF is restricted to favorable market conditions. At the same time, SAF costs show a similar gradual decrease to that in the H2 Acceleration scenario, which given the delayed cost competitiveness of LH2 lead to a stronger reliance on SAF as the primary decarbonization option in aviation. The H2 Hesitation scenario is also considered with two variants: S3, assuming no contrail effects, and S3*, with high contrail impact.
Furthermore, a reference scenario (S0) is introduced as well, presenting today’s state-of-the-art aircraft technology and taking only the passenger demand growth into account without the introduction of new aircraft and without additional policy measures. The above-mentioned scenario narratives were translated into model input parameters and form the basis for the results presented in the following section.

3.3. Energy Consumption and Climate Impact

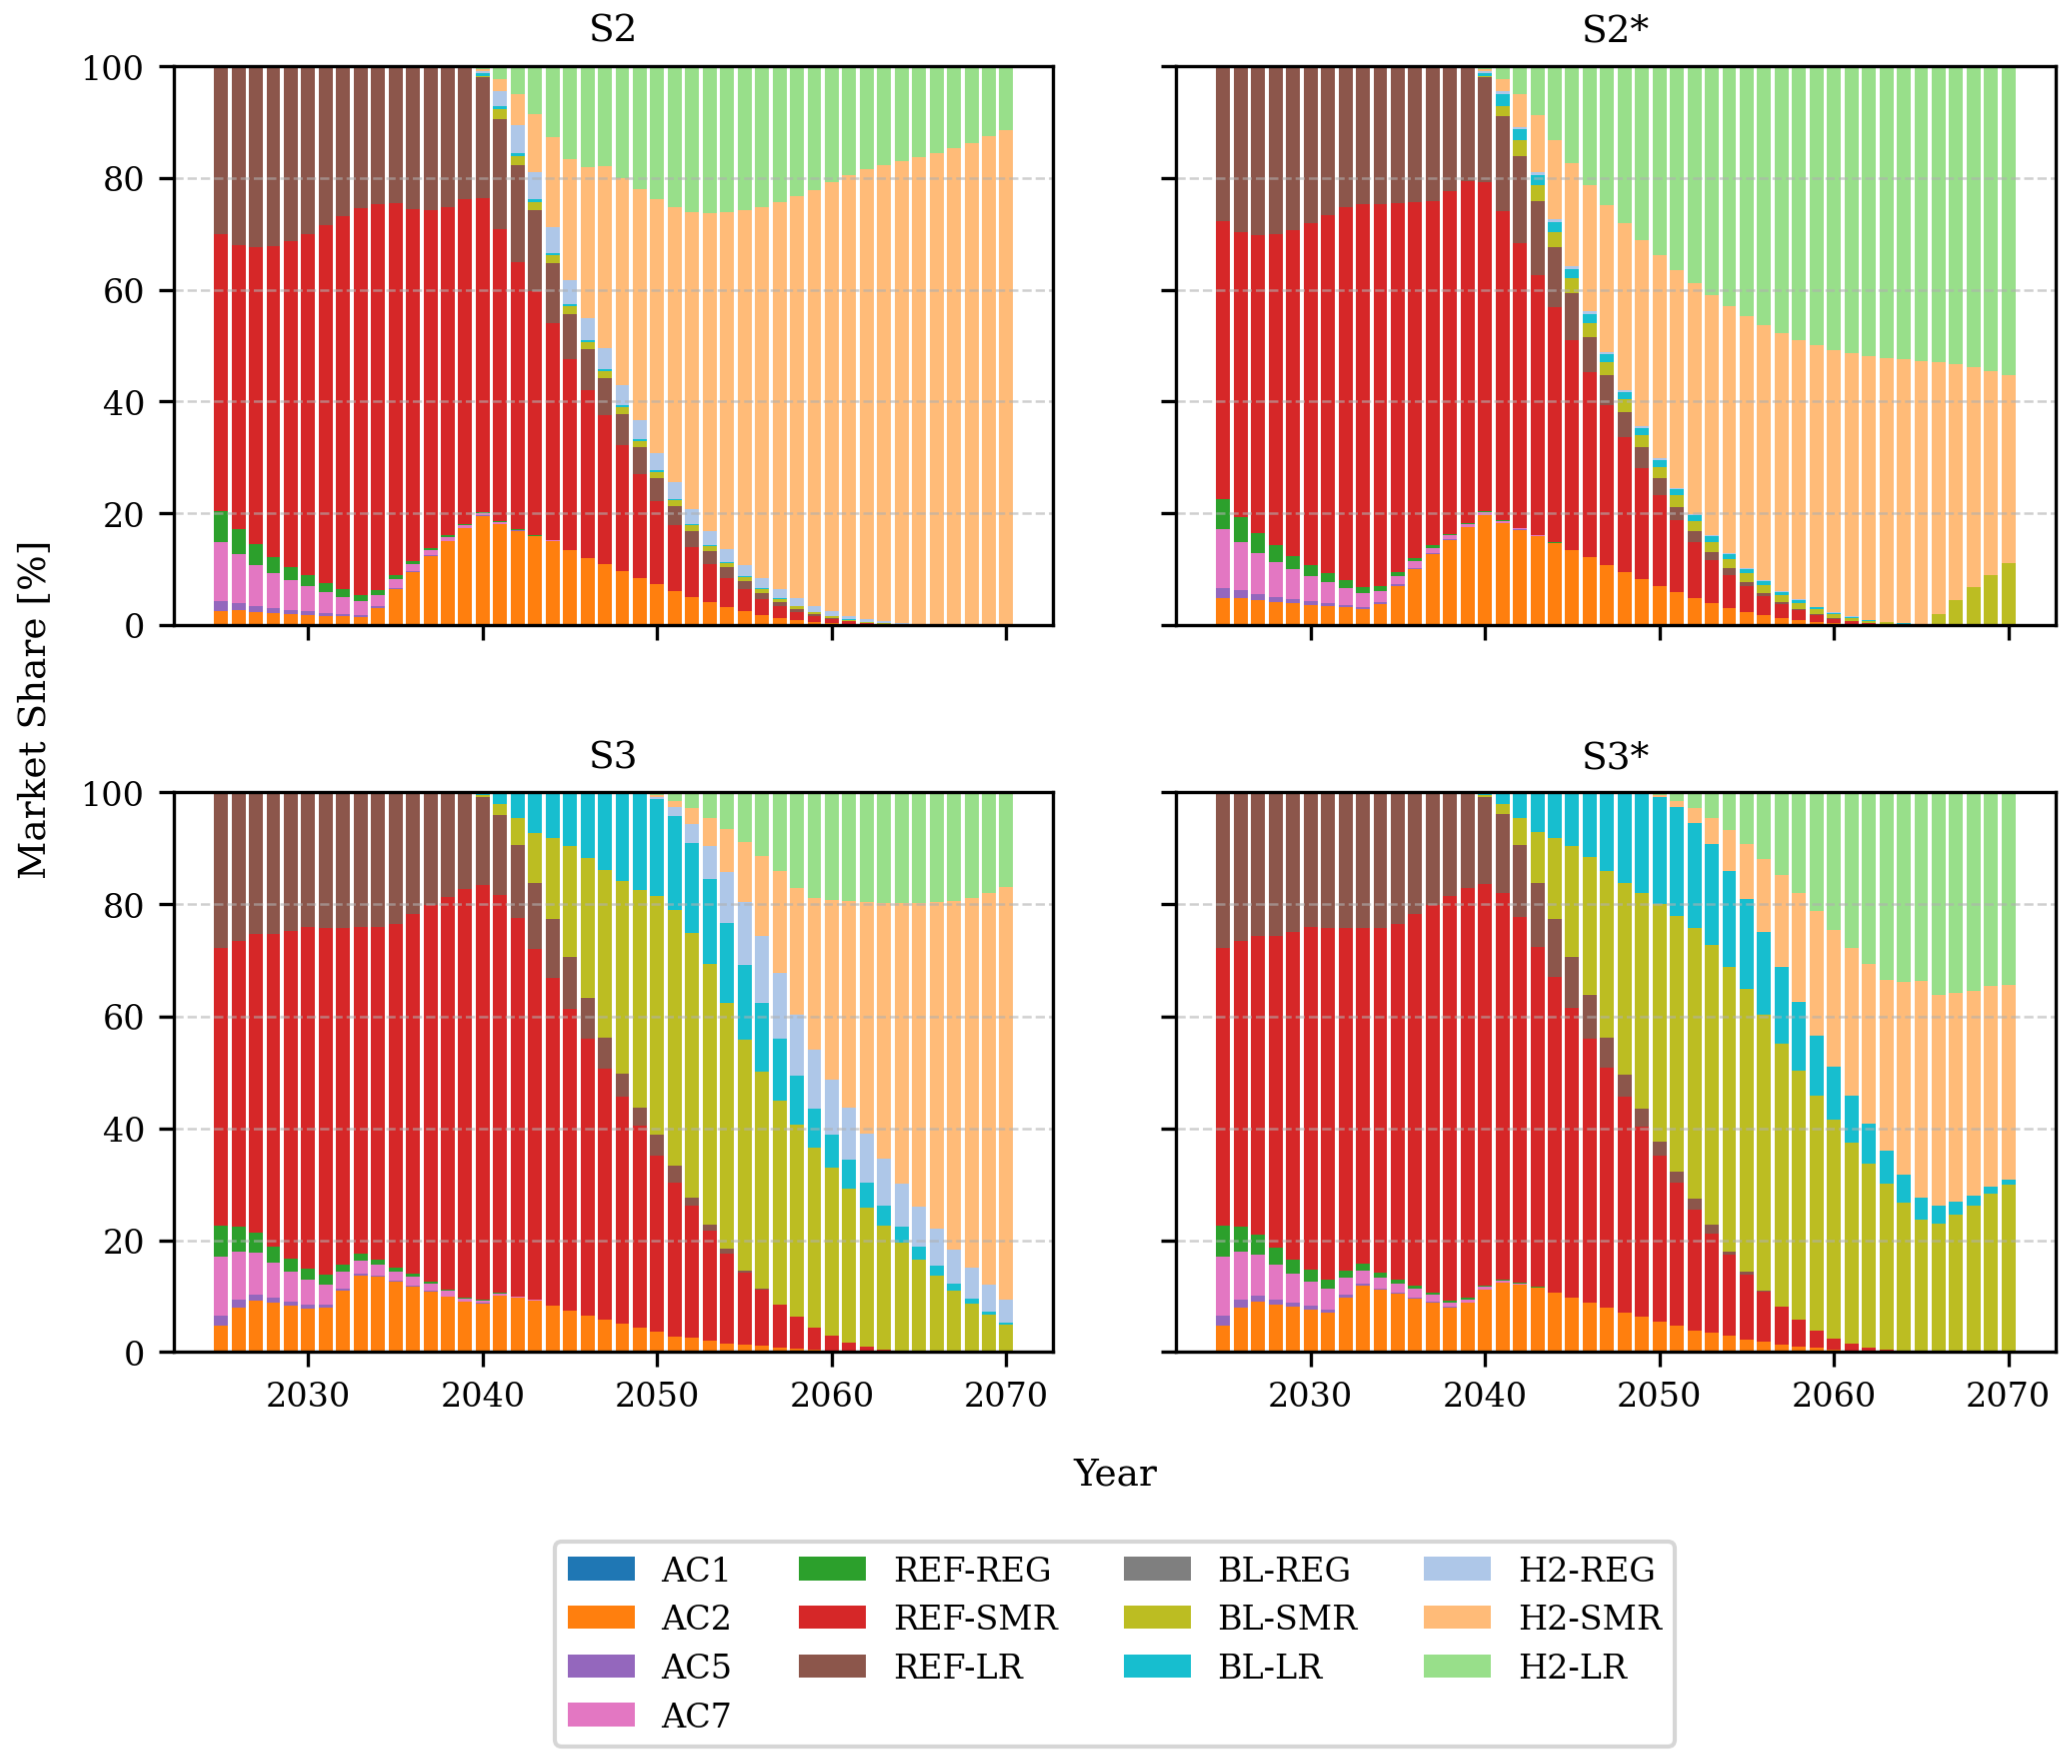
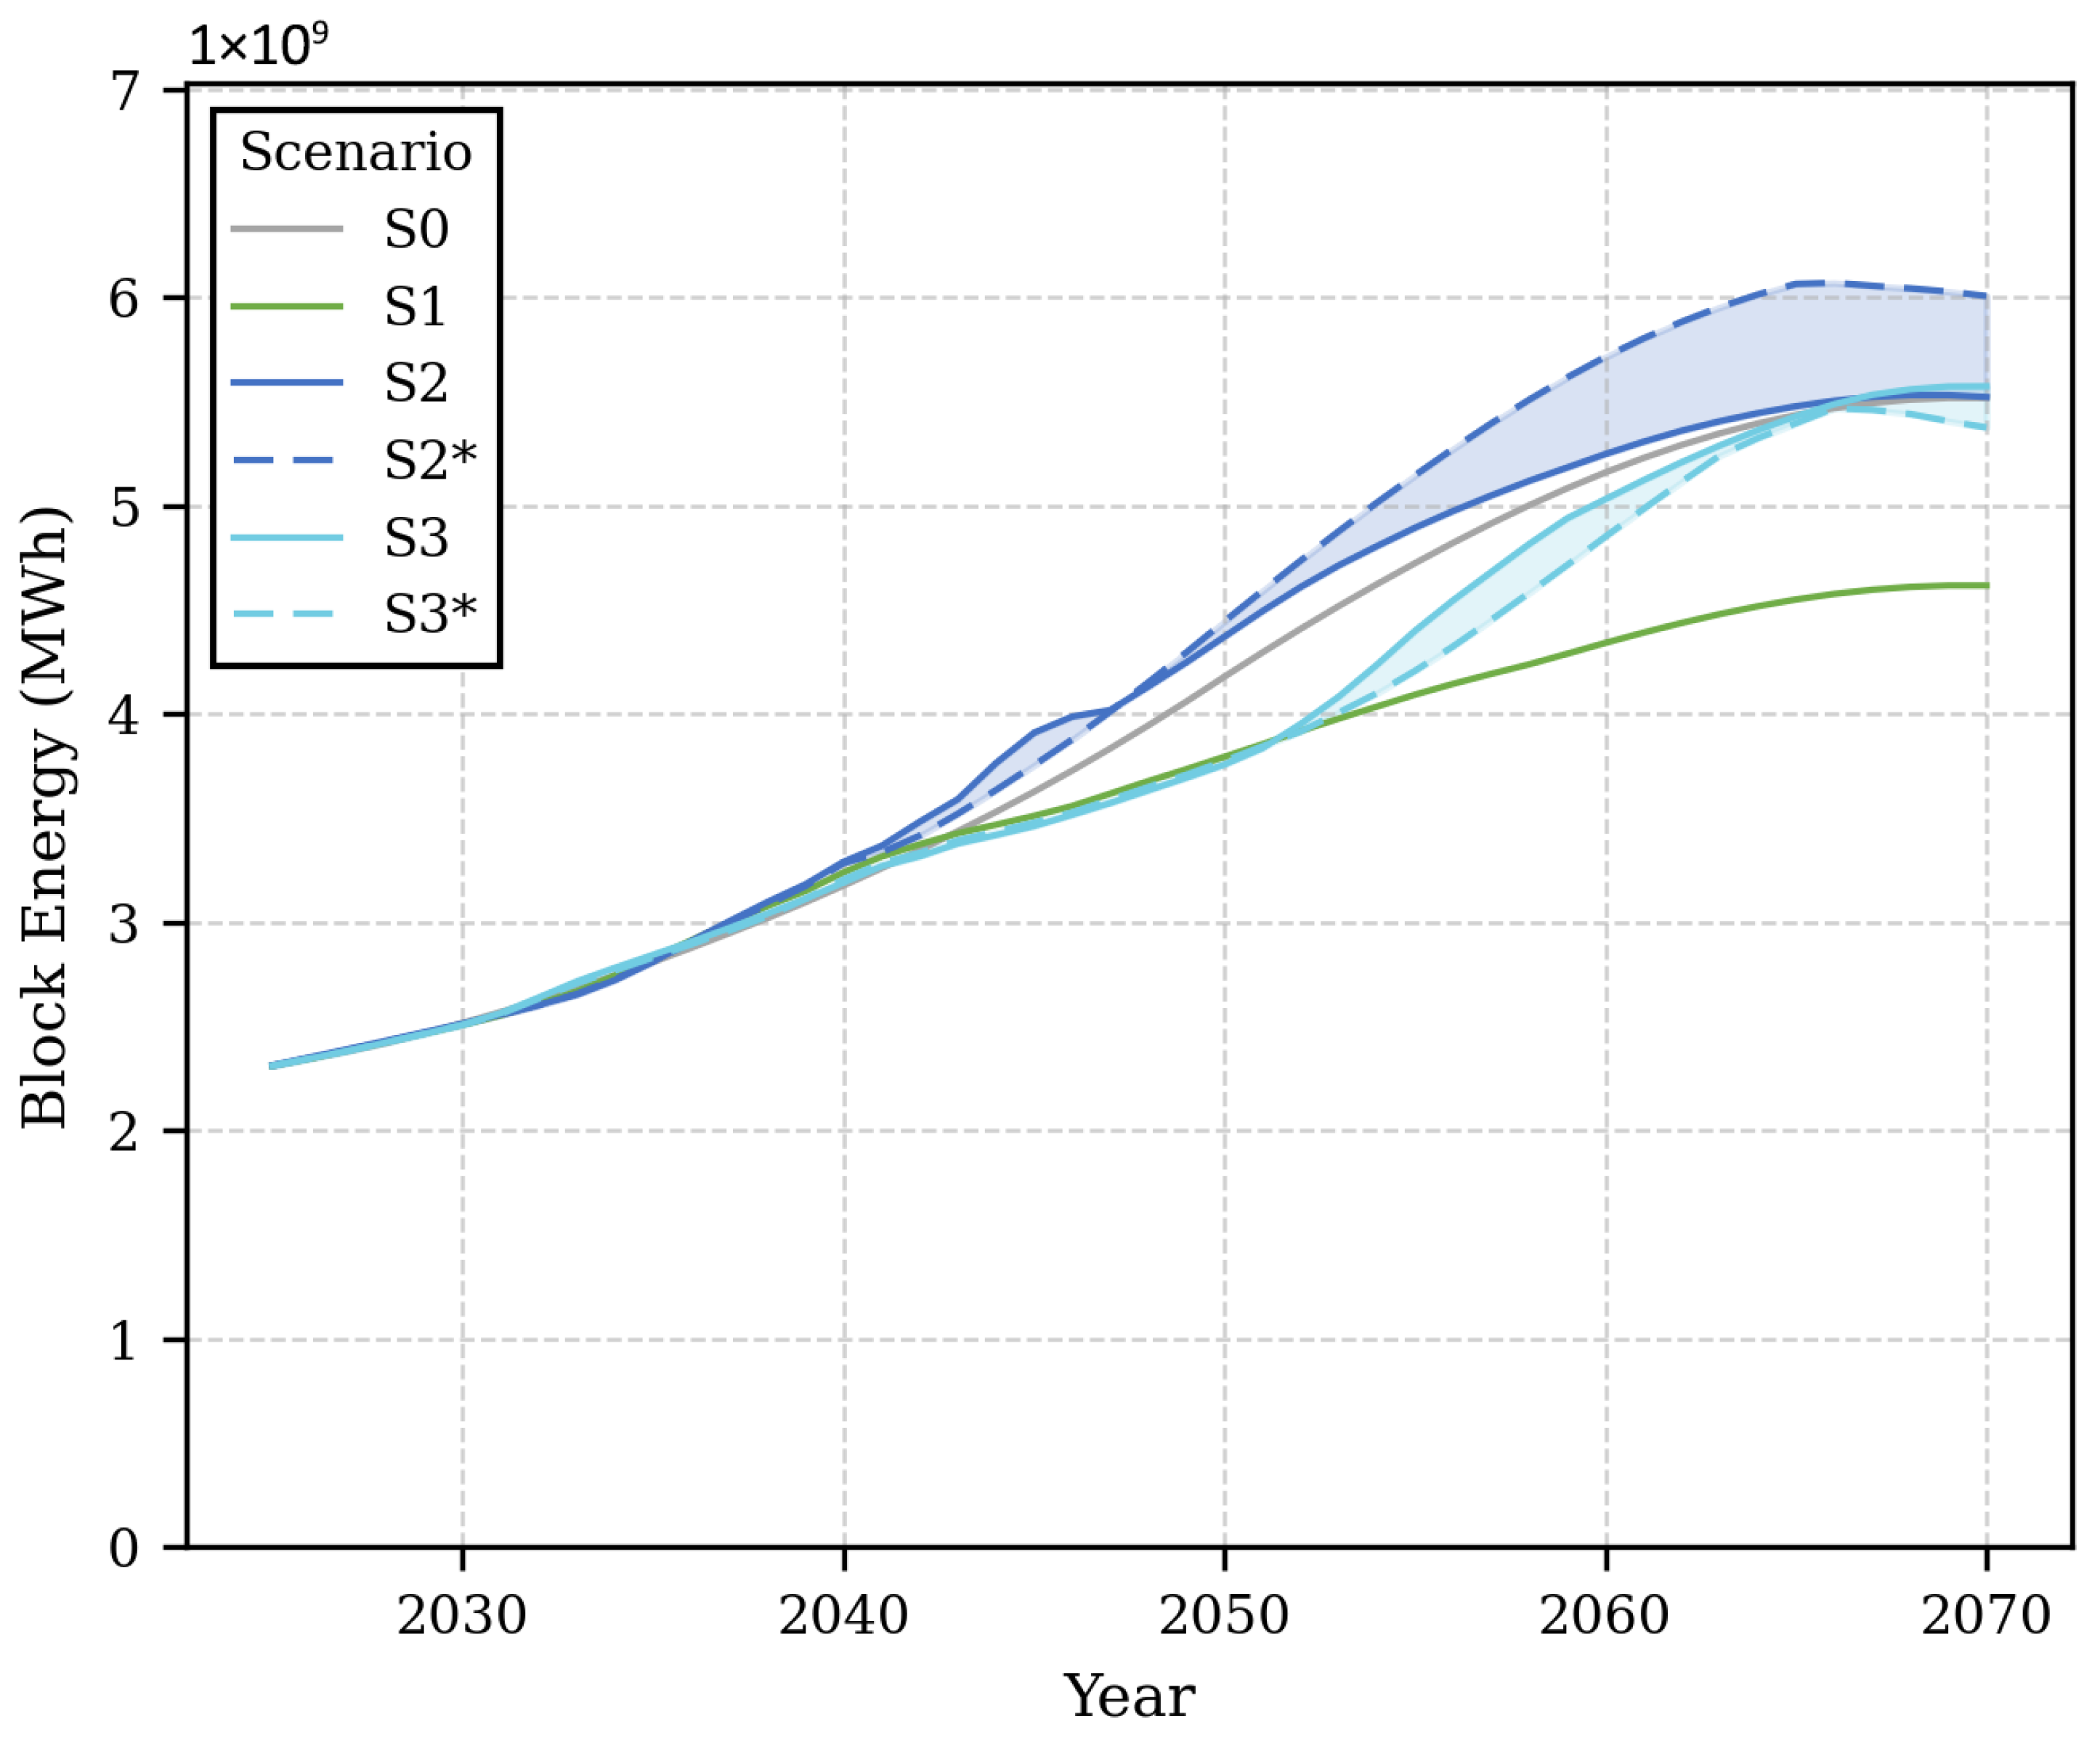
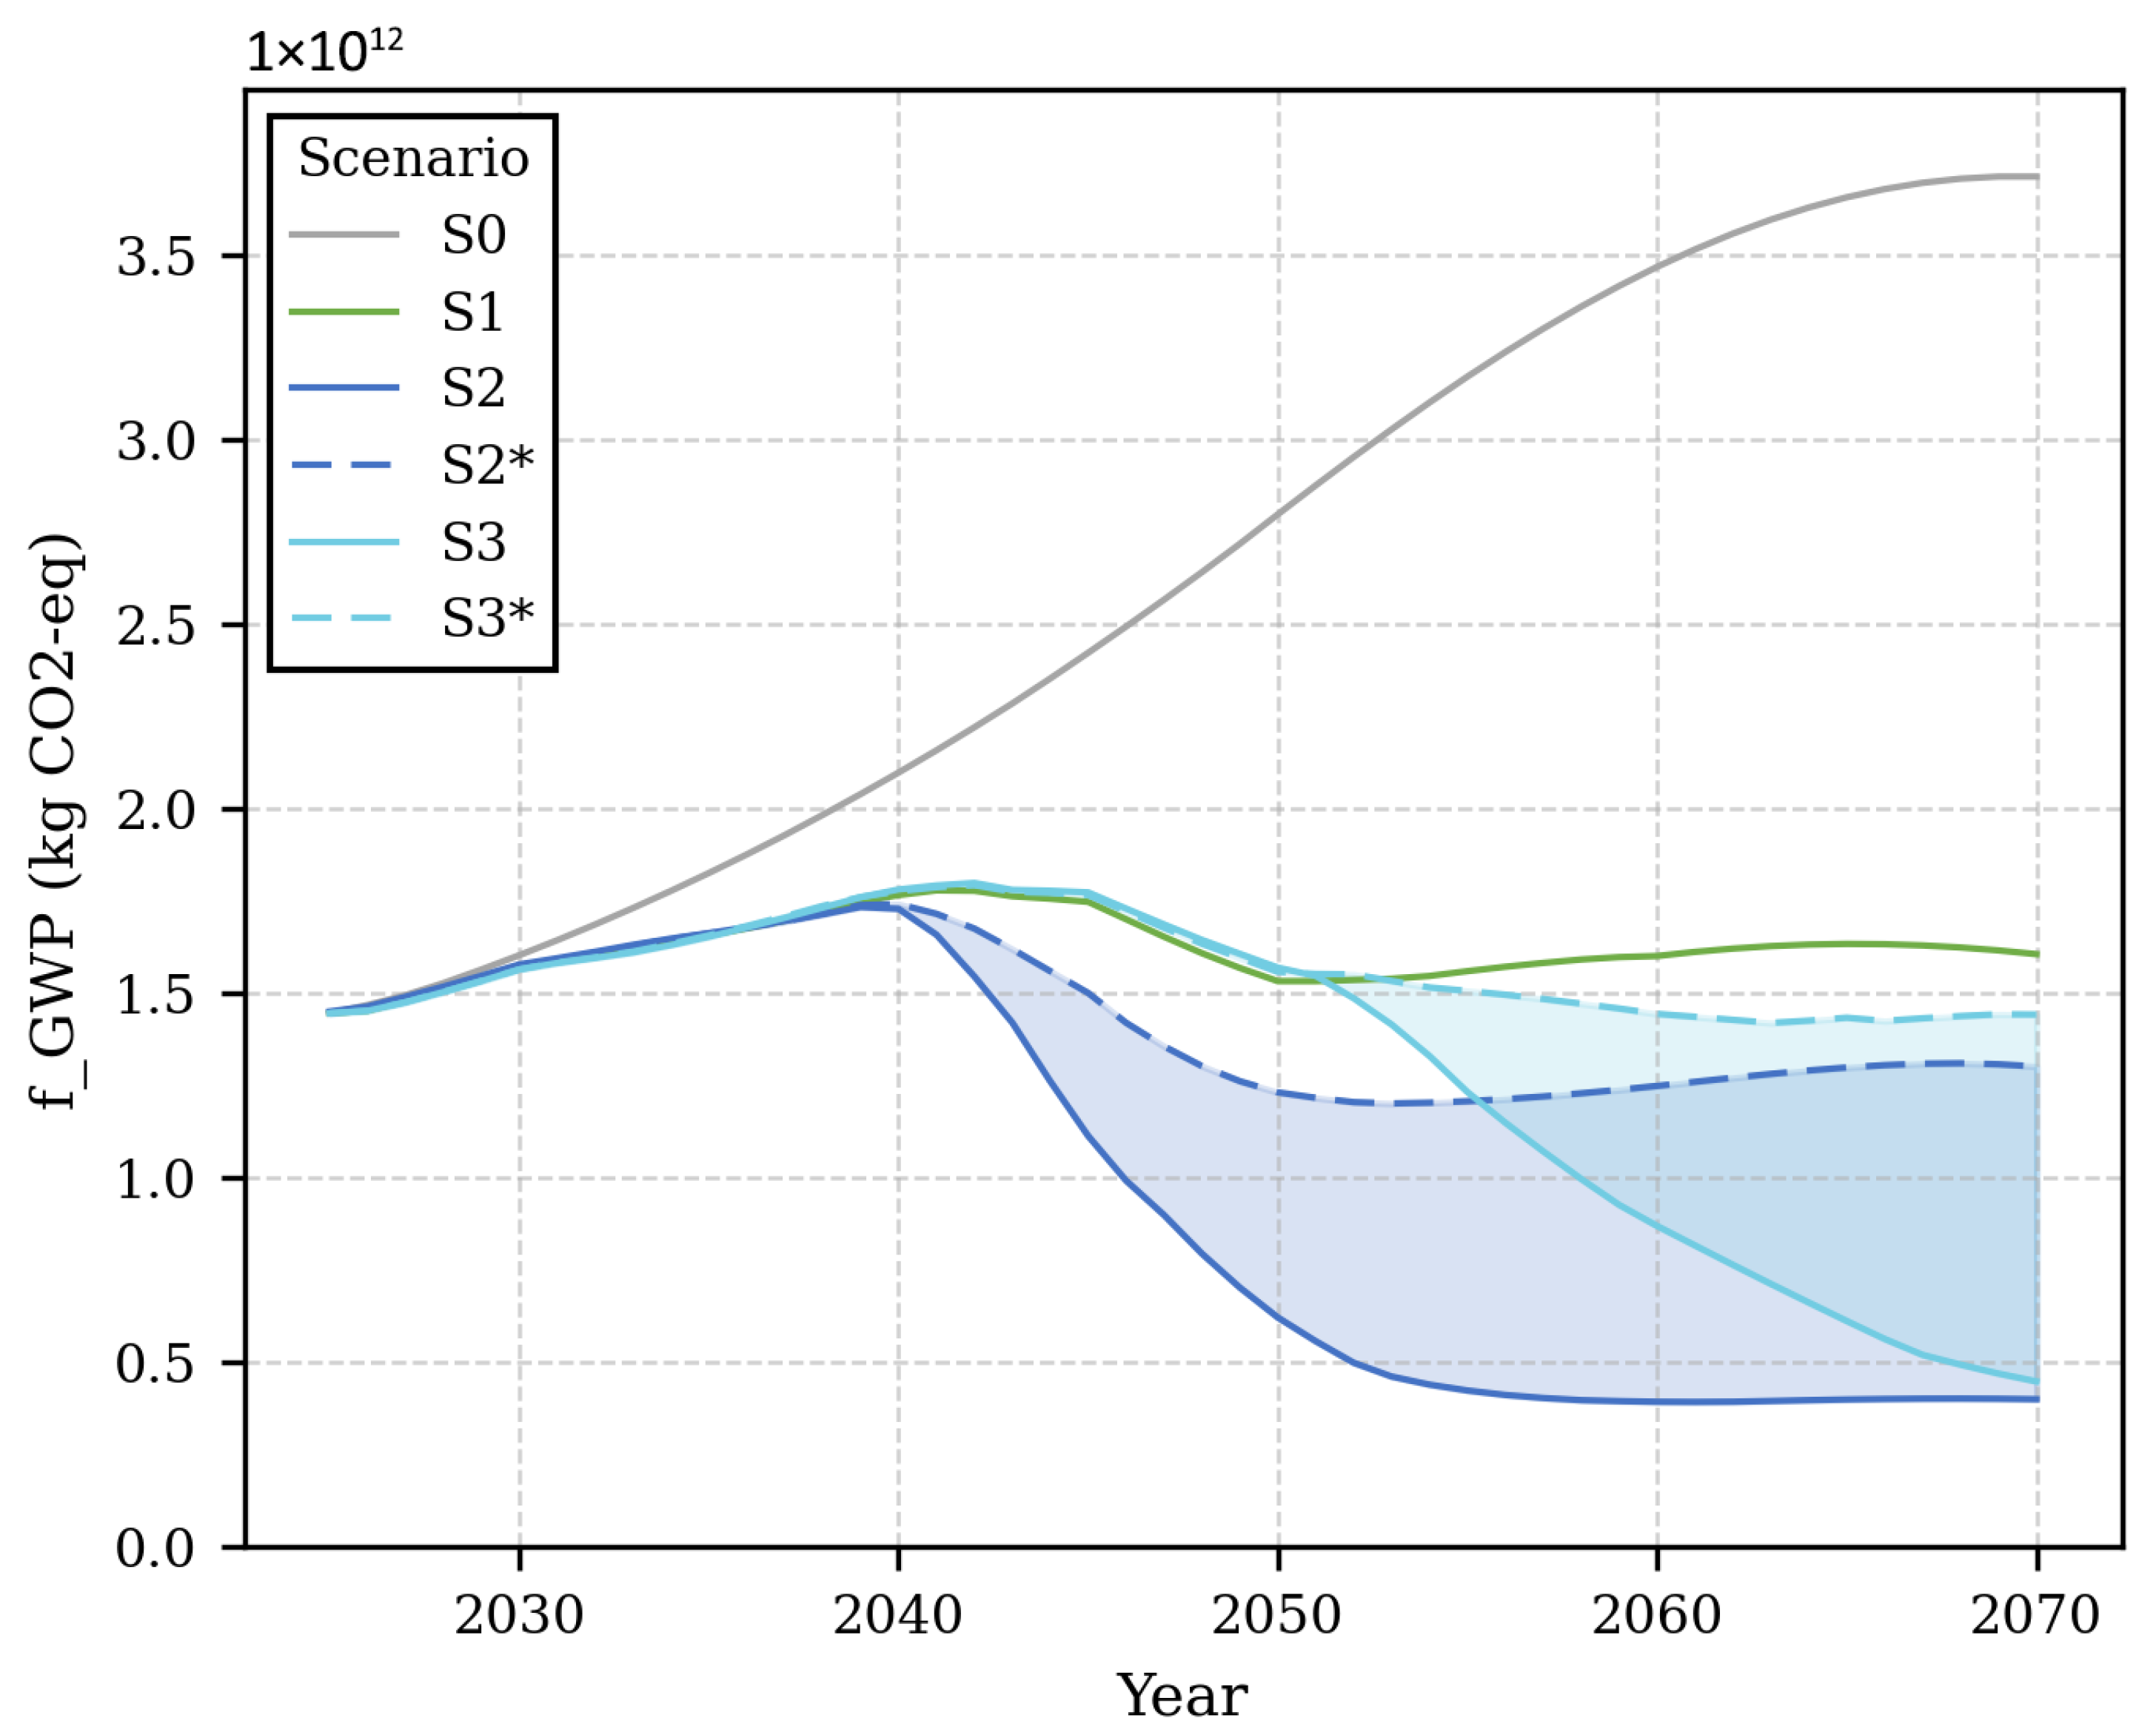
Figure 4 and Figure 5 show the evolution of block energy and climate impact, expressed as the global warming potential efficacy ( f - G W P 100 ) , across the considered scenarios at fleet level. The climate impact accounts for both the well-to-tank (WTT) and tank-to-wake (TTW) emissions of the respective fuel. The results are shown for the configuration α = 0.5 , i.e., when the weighting in the performance parameter (Equation (2)) is equal for both fuel cost and climate impact. In addition, Figure 6 provides the corresponding block energy consumption broken down by fleet composition over time for the hydrogen-based scenarios, enabling a direct interpretation of the underlying drivers of the observed energy and climate impact trends.

3.3.1. Reference Scenario (S0)

The reference scenario shows a steady increase in both energy consumption and climate impact, reflecting passenger demand growth, the freeze of current aircraft technology, and the absence of further policy measures. The curves gradually stabilize toward 2070, corresponding to the assumed saturation of passenger demand over this period in the input data.

3.3.2. SAF Shield Scenario (S1)

The SAF Shield scenario exhibits the lowest energy demand, with reductions of approximately 9 % in 2050 and 16 % in 2070 relative to S0, reflecting efficiency improvements from the next-generation baseline aircraft introduced in 2040. At the same time, climate impact decreases by 45 % in 2050 and 57 % in 2070 compared with S0. The f - G W P 100 trajectory decouples from S0 already before 2030 due to SAF mandates and decreases further after 2040 with the introduction of the baseline aircraft.

3.3.3. Hydrogen Acceleration Scenario (S2)

In the hydrogen acceleration scenario, block energy consumption increases to around 5 % above S0 in 2050 and converges toward similar levels by 2070. Compared with S1, block energy consumption is higher by 15 % in 2050 and increases to almost 20 % in 2070. This increase is driven by the rapid adoption of H2-powered aircraft, which is enabled by the low cost of LH2 relative to kerosene and SAF, the favorable policy environment, and the resulting rapid ramp-up of the hydrogen production capacity. Furthermore, H2-powered aircraft are also favored over the baseline aircraft due to negligible contrail effects in S2. In particular, SMR-H2 aircraft dominate the fleet due to their favorable combined performance among hydrogen aircraft, providing the best trade-off between climate impact and block energy consumption under the chosen objective weighting, which leads to fast replacement of the conventional aircraft after 2040, as shown in Figure 6 (S2). Despite the higher energy demand, S2 achieves the strongest climate impact reduction in this study, with reductions of around 78 % in 2050 and 89 % in 2070 relative to S0, as well as 60 % and 75 % compared with S1.

3.3.4. Hydrogen Acceleration with Contrails (S2*)

In contrast to S2, the inclusion of contrail effects in S2* leads to approximately two to three times higher climate impact over time, as shown in Figure 5. Furthermore, the energy demand in S2* is higher than that in S2, which is primarily caused by a larger share of LR-H2 aircraft in the fleet, as shown in Figure 6 (S2*). While LR-H2 aircraft exhibit higher energy consumption than SMR-H2 aircraft, they perform better in terms of climate impact when contrails are considered. The latter is due to their higher average cruise altitude, as defined in the aircraft input parameters, which lies above the contrail-sensitive altitude of 10 km, whereas SMR-H2 aircraft operate closer to this threshold. As a result, under the unchanged objective weighting ( α = 0.5 ), the lower contrail-induced climate impact of LR-H2 aircraft outweighs their higher energy demand, leading to their selection over SMR-H2 and REG-H2 aircraft. In addition, SMR-BL aircraft are reintroduced after 2065, as their high efficiency and lower climate impact make them competitive once the cost penalty of SAF relative to LH2 is offset by their efficient performance and as contrail effects reduce the advantage of SMR-H2 aircraft.

3.3.5. Hydrogen Hesitation Scenario (S3)

The hydrogen hesitation scenario shows a delayed increase in energy consumption compared with S2, reflecting the later entry into service of H2-powered aircraft, as shown in Figure 4. This delayed uptake is driven by a less favorable policy environment, limited infrastructure development, and a highly fragmented LH2 cost landscape, with cost competitiveness relative to kerosene and SAF emerging only in regions with favorable policy frameworks and infrastructure availability. At the same time, SAF costs follow a similar trajectory to that in S2, maintaining SAF as a competitive decarbonization option for aviation. This is reflected in Figure 6 (S3), showing how the slower adoption of H2-powered aircraft results in a delayed fleet transition, with baseline aircraft remaining more dominant. Consequently, the reduction in climate impact follows a similar pattern to that in S2 but occurrs later in time.

3.3.6. Hydrogen Hesitation with Contrails (S3*)

In S3*, block energy consumption remains slightly lower in 2070 than in S3, which is in contrast to the behavior observed between S2 and S2*. This is driven by the later entry into service of H2-powered aircraft, resulting in a persistently higher share of baseline aircraft (LR-BL and REG-BL), as shown in Figure 6 (S3*). In combination with contrail effects, this further reduces the competitiveness of H2-powered aircraft, limiting their overall share in the fleet. Analogous to S2*, SMR-BL regains competitiveness once the cost disadvantage of SAF is offset by its higher efficiency, thereby further limiting the share of H2-powered aircraft. The climate impact follows the same (but delayed) trend as that in S2*. Overall, the global warming potential in S3* stabilizes at approximately 11 % higher than in S2*.

3.4. Sensitivity of the Objective Function

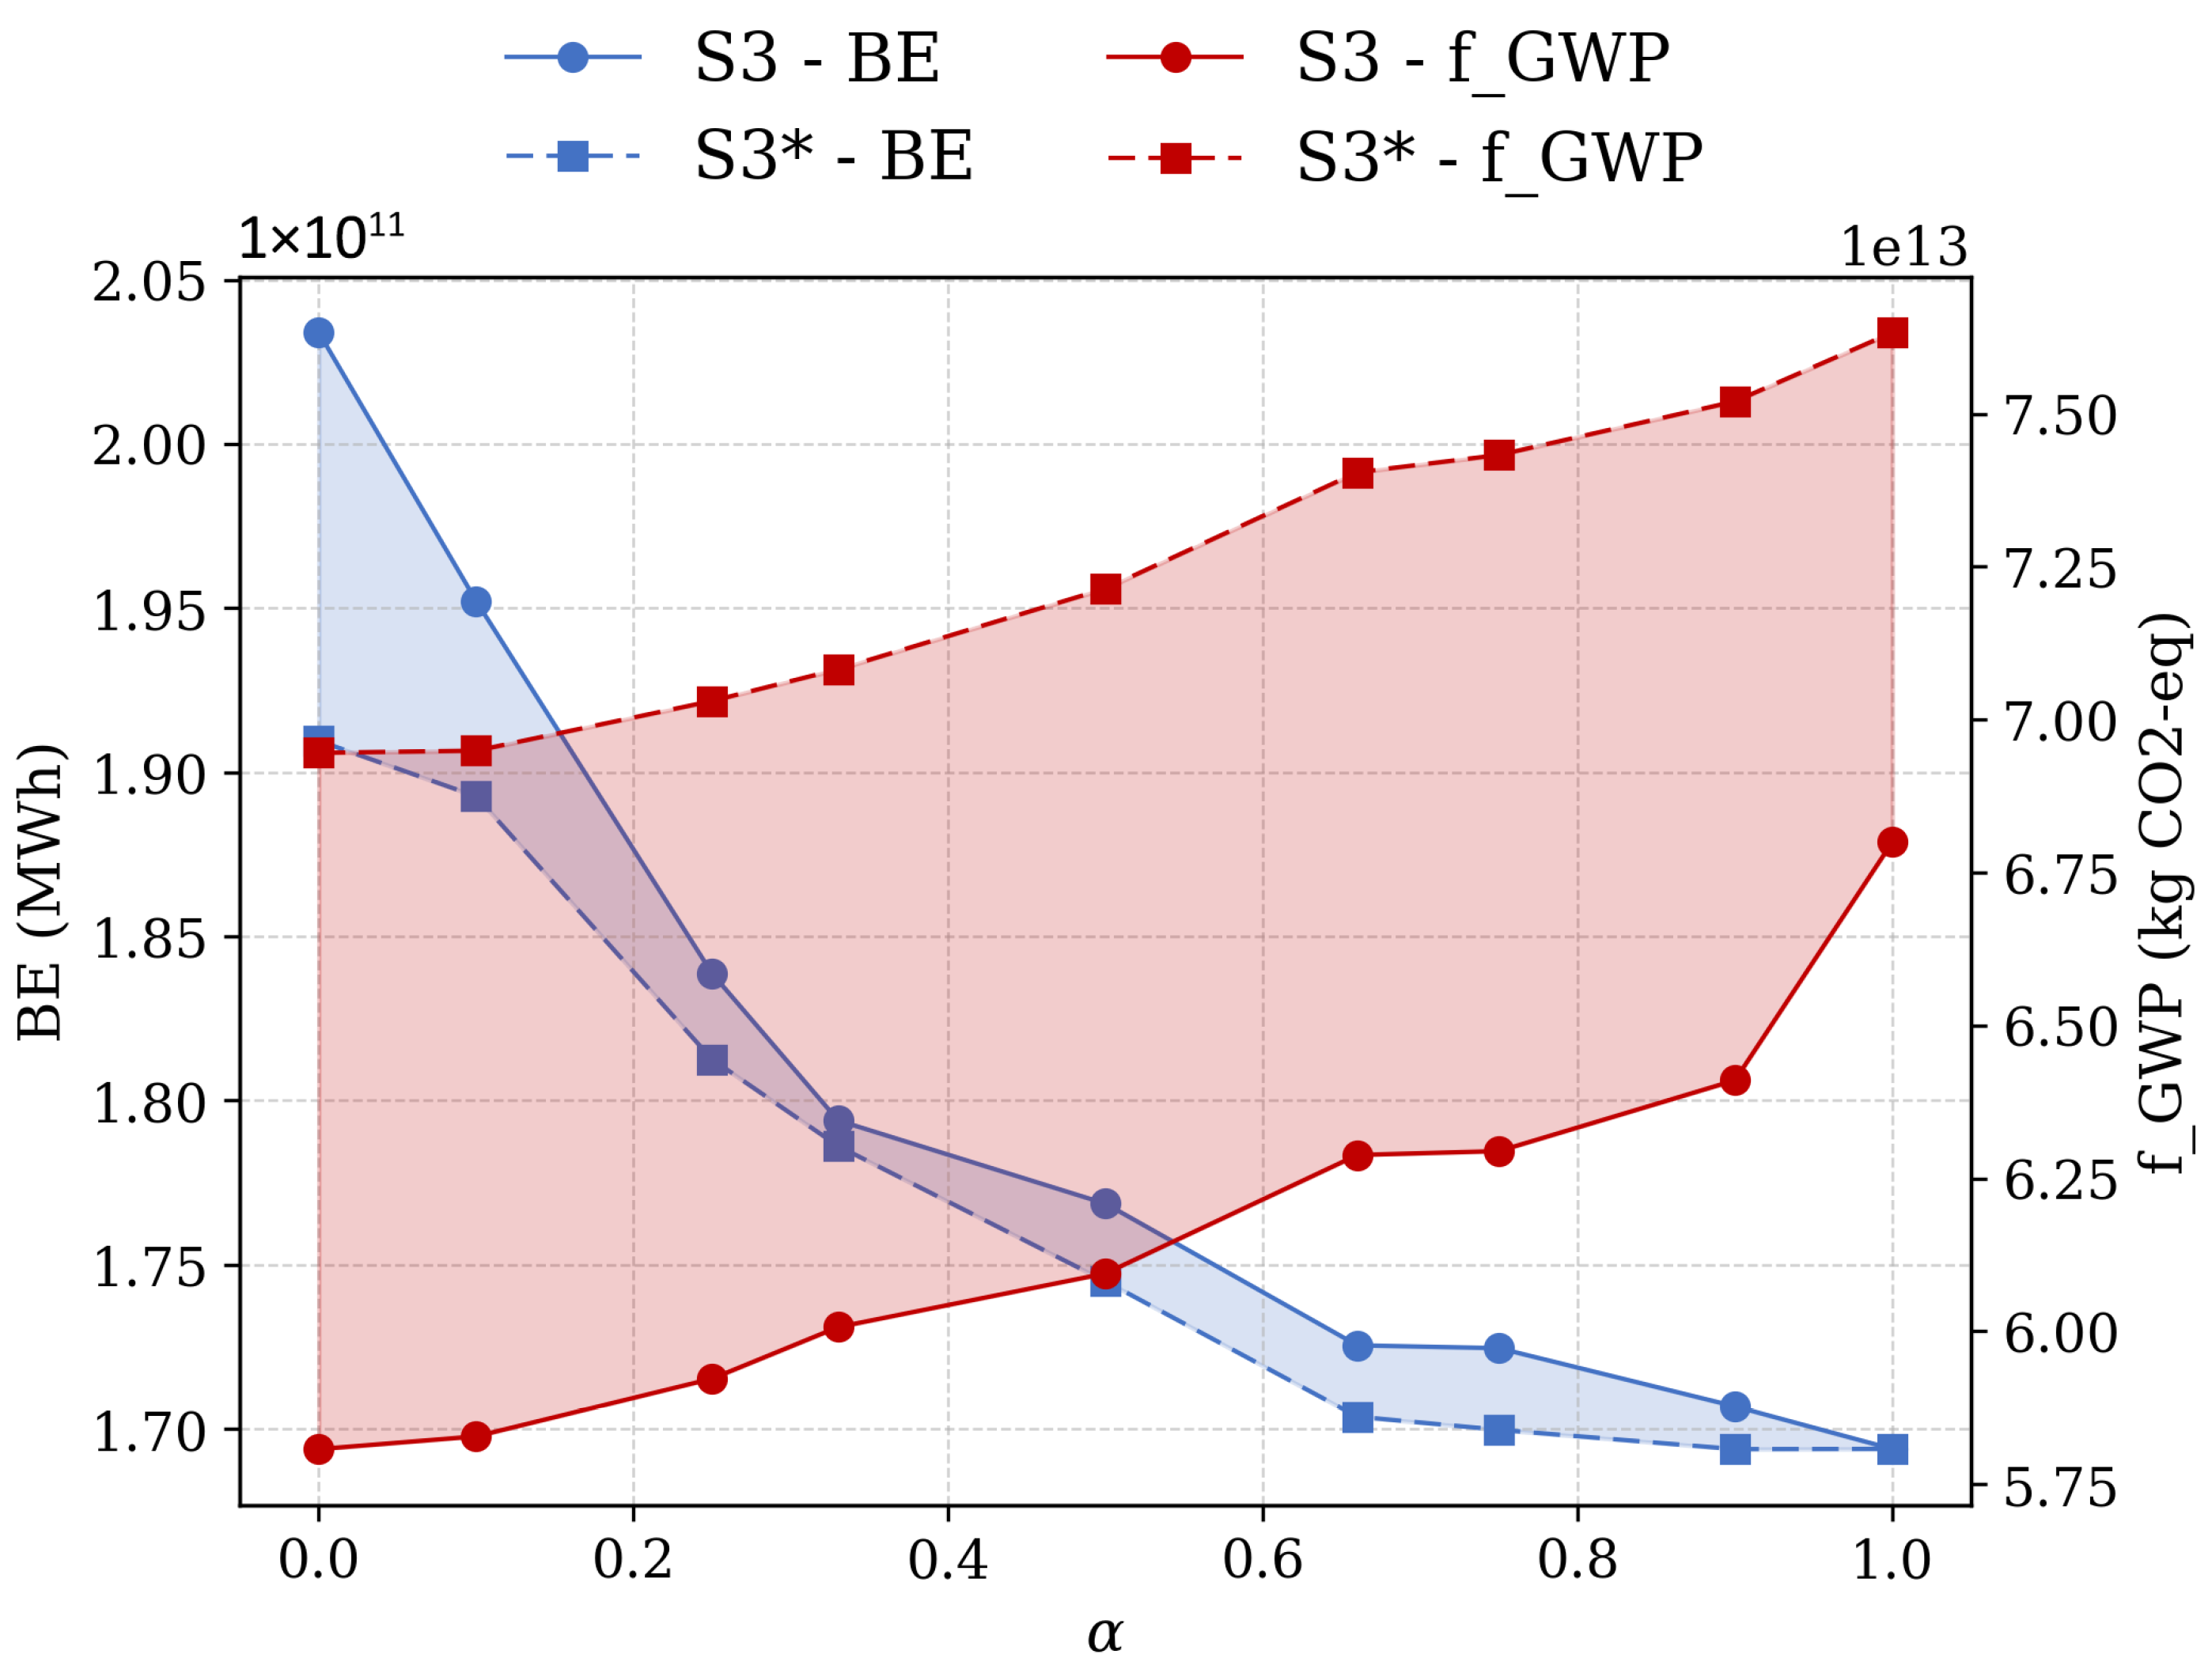
Figure 7 shows the sensitivity of the cumulative block energy demand and climate impact with regard to the objective function weighting parameter α for hydrogen scenarios S3 (negligible contrail impact) and S3* (high contrail impact). Increasing α reduces the cumulative block energy demand but increases the cumulative global warming potential efficacy f - G W P 100 , which reflects the trade-off between both objectives. The reduction in block energy demand is significant up to approximately α = 0.7 , after which both scenarios converge toward the same minimum, which reflects the irrelevance of f - G W P 100 in the objective function for α = 1 . Across the full α range, the climate impact remains higher in S3* than in S3 due to the additional contrail impact. At lower α values, S3* also exhibits lower block energy demand, reflecting a larger share of energy-efficient baseline aircraft. It should be noted that S3 and S3* represent mutually exclusive scenario assumptions and cannot occur simultaneously; therefore, the trade-offs and minima must be interpreted within each scenario individually. Accordingly, each scenario exhibits its own minimum: at approximately α 0.55 for S3, where block energy demand and climate impact are balanced according to the objective function, and at α 0 for S3*, where climate impact is minimized. The minimum of S3* lies on a higher overall level compared with S3. Figure 7 illustrates the general trade-off between both objectives rather than a break-even point, since block energy and climate impact are expressed in different units.

4. Summary and Conclusions

This study applied an in-house fleet-level assessment framework to evaluate the potential of three H2-powered aircraft configurations (REG, SMR, and LR), designed within the H2Avia project, under different transition scenarios. The analysis considered varying levels of hydrogen technology uptake, fuel cost evolution and mandates, the inclusion of contrail effects, and different weightings of energy cost and climate impact in the objective function. The main takeaways from the results are as follows:
  • The SAF Shield scenario (S1) results in the lowest energy demand, while the hydrogen scenarios (S2 and S3) provide the highest potential for climate impact reduction. However, the climate impact of H2-powered aircraft is associated with significant uncertainty related to contrail formation, as reflected by the wide range of global warming potential efficacy observed in the scenario results.
  • Energy demand and climate impact exhibit a clear trade-off with respect to the weighting of the performance parameter in the objective function; increasing the weight on minimization of the climate impact reduces f - G W P 100 at the expense of higher energy consumption, and vice versa.
  • A high share of H2-powered aircraft, particularly H2-SMR, allows for a substantial climate impact reduction without a proportional increase in energy demand. At the same time, H2-LR aircraft gain a larger share of the fleet, with increasing emphasis on climate impact minimization due to their lower contrail-related impact.
  • As the cost disadvantage of SAF relative to LH2 decreases over time, baseline aircraft regain competitiveness, as their higher fuel cost is offset by their efficient performance. This results in a renewed increase in baseline aircraft production, limiting the penetration of H2-powered aircraft and highlighting the important role of SAF mandates in achieving climate reduction in aviation.
  • In the case of delayed entry into service of H2-powered aircraft, as it is assumed in scenarios S3 and S3*, the transition toward hydrogen is further constrained. This results in a persistently higher share of baseline aircraft and additionally limits the ramp-up of hydrogen aircraft production capacity.

4.1. Limitations of This Study

The proposed framework uses an aggregated representation of the air transport system in which aircraft types are clustered and airport pairs are grouped into representative regional routes. This aggregation enables long-term scenario analysis but ignores flight-level operational aspects such as airport-specific constraints and turnaround processes. In addition, the model assumes a single global airline and therefore does not capture different business models or airline competition. This assumption may lead to an overestimation of fleet utilization, as a single global airline can optimally allocate aircraft across the entire network, potentially resulting in a smaller total fleet size compared with a system with multiple competing airlines.
Moreover, future demand and key techno-economic drivers are specified through scenarios and treated deterministically within each run. Although multiple assumptions are explored parametrically, the framework does not model adaptive decision making under uncertainty or feedback effects between fleet composition, costs, and demand. Hydrogen infrastructure availability is likewise represented implicitly through technology and cost assumptions rather than through a supply network. Therefore, the operational feasibility related to airport readiness and supply chain ramp-up cannot be fully considered.
Furthermore, contrail impacts for H2-powered aircraft are represented by two bounding cases with negligible and high contrail effects. While this approach enables the assessment of the sensitivity of fleet transition pathways to non-CO2 uncertainties, these cases are not intended to reflect the most likely outcomes but rather to delimit the potential range of contrail-related climate impacts.
Finally, the objective function of the model focuses on the energy component of the direct operating cost together with climate impact, while other airline decision criteria such as capital, maintenance, and crew costs are not explicitly modeled. These cost components are associated with high uncertainty for H2-powered aircraft. Their exclusion may affect the relative competitiveness of different aircraft technologies and fuels, although they are not expected to fundamentally alter the system-level trends observed in this study. Also, differences in airline cost structures and business models are not considered, which can affect the economic viability of H2 and SAF adoption, leading to heterogeneous adoption patterns across airlines, regions, and airports in reality. Consequently, the results should be interpreted as a system-level transition evaluation rather than airline-optimal fleet plans.

4.2. Future Work

Future research should aim to progressively relax the structural simplifications of the current framework and move toward a more dynamic system representation. Specifically, the system representation should allow the network to dynamically change over time in the modeling context such that route availability can vary based on the composition of the fleet and the introduction of new technology. This extension would more accurately capture how new aircraft capabilities affect market structure rather than operating on a fixed aggregated network. In addition, the current formulation assumes that newly produced aircraft are immediately introduced into the fleet, while retired aircraft are permanently removed without the possibility of parking or reactivation. Consequently, demand growth is met through new aircraft production only. Future work should relax this assumption by introducing fleet buffering, such as temporary storage.
Anticipative scenario development could also be integrated with the optimization framework to derive technology-level aircraft requirements (TLARs) for H2-powered aircraft, connecting system requirements at the fleet level to aircraft design characteristics and supporting iterative design–operation assessment.
Furthermore, the current modeling approach represents the aviation system as a single global airline and therefore does not capture competitive interactions between airlines or the diversity of business models. Incorporating airline competition through multiple operators with distinct cost structures, network strategies, and fleet assignment behaviors could improve the representation of market dynamics. This would enable further investigation of how airline business model competition influences fleet evolution, technology adoption, and the resulting environmental impact of aviation.
A more detailed representation of the liquid hydrogen (LH2) supply chain should also be incorporated, combining infrastructure with network, fleet, and scheduling decisions. This would allow assessment of transitional bottlenecks and regional deployment strategies instead of implicitly assuming availability. Lastly, uncertainty treatment can be improved by introducing stochastic modeling, such as through a year-by-year simulation framework reflecting variability in passenger demand and economic conditions. Such an approach would enable evaluating adaptive decisions and provide more realistic insights into technology adoption under uncertainty.
With regard to climate impact, further work is needed to refine current estimates of the contrail impact for H2-powered aircraft and to narrow the uncertainty ranges of the hydrogen scenarios presented in this study.

Author Contributions

Conceptualization, A.M.; methodology, A.M. and E.E.; software, A.M. and E.E.; validation, A.M., E.E., R.B.-X. and F.N.P.; investigation, A.M., R.B.-X. and F.N.P.; data curation, A.M. and E.E.; writing—original draft preparation, A.M. and E.E.; writing—review and editing, A.M., F.N.P., R.B.-X. and M.H.; visualization, A.M. and E.E.; supervision, A.M. and F.N.P.; project administration, F.N.P.; funding acquisition, F.N.P. All authors have read and agreed to the published version of the manuscript.

Funding

H2Avia was a project of the German federally funded aviation research program (LuFo) VI-2FKZ 20E2106A.

Data Availability Statement

The original contributions presented in this study are included in this article. Further inquiries should be directed to the corresponding author.

Acknowledgments

This study used the Base of Aircraft Data (BADA) 3.16, which has been made available by EUROCONTROL to Bauhaus Luftfahrt e.V. Furthermore, during the preparation of this work, the authors used ChatGPT 5.4 in order to improve readability and language.

Conflicts of Interest

The authors declare no conflicts of interest. The funders had no role in the design of the study; in the collection, analyses, or interpretation of data; in the writing of the manuscript; or in the decision to publish the results.

Abbreviations

The following abbreviations are used in this manuscript:
A/CAircraft
A/PAirport
AICAviation-induced cloudiness
ATSAir transport system
BEBlock energy
BLBaseline aircraft
CO2Carbon dioxide
DOCDirect operating costs
EISEntry into service
FAPFleet assignment problem
FSDMFleet system dynamics model
GDPGross domestic product
GWPGlobal warming potential
ILPInteger linear programming
LCALife cycle assessment
LHVLower heating value
LRLong-range aircraft
(L)H2(Liquid) hydrogen
MILPMixed integer linear programming
NOxNitrogen oxides
nvPMNon-volatile particulate matter
PLFPassenger loading factor
REFReference aircraft
REGRegional aircraft
SAFSustainable aviation fuel
SMRShort-medium-range aircraft
TLARsTop-level aircraft requirements
TTWTank-to-wake
WTTWell-to-tank

Appendix A

Appendix A.1. Representative Aircraft Clusters

Table A1. Representative aircraft clusters used in the fleet model, with the REG, SMR, and LR clusters highlighted as the primary focus of the H2Avia project.
A/C ClusterDescription
AC1≤19 seats, small turboprop and piston aircraft
AC2turboprop commuter (e.g., ATR 42/72, Dash 8 family)
AC3 (REG)regional jet (e.g., BCS, Embraer E-Jet, CRJ family)
AC4 (SMR)short-to-medium-range narrow-body (e.g., A320, B737 family)
AC5medium-haul (e.g., B757/B767 class)
AC6 (LR)long-range wide-body (e.g., A330/A350, B787/B777 class)
AC7long-range heavy wide-body (e.g., A380, B747 class)

Appendix A.2. Representative Route Pairs

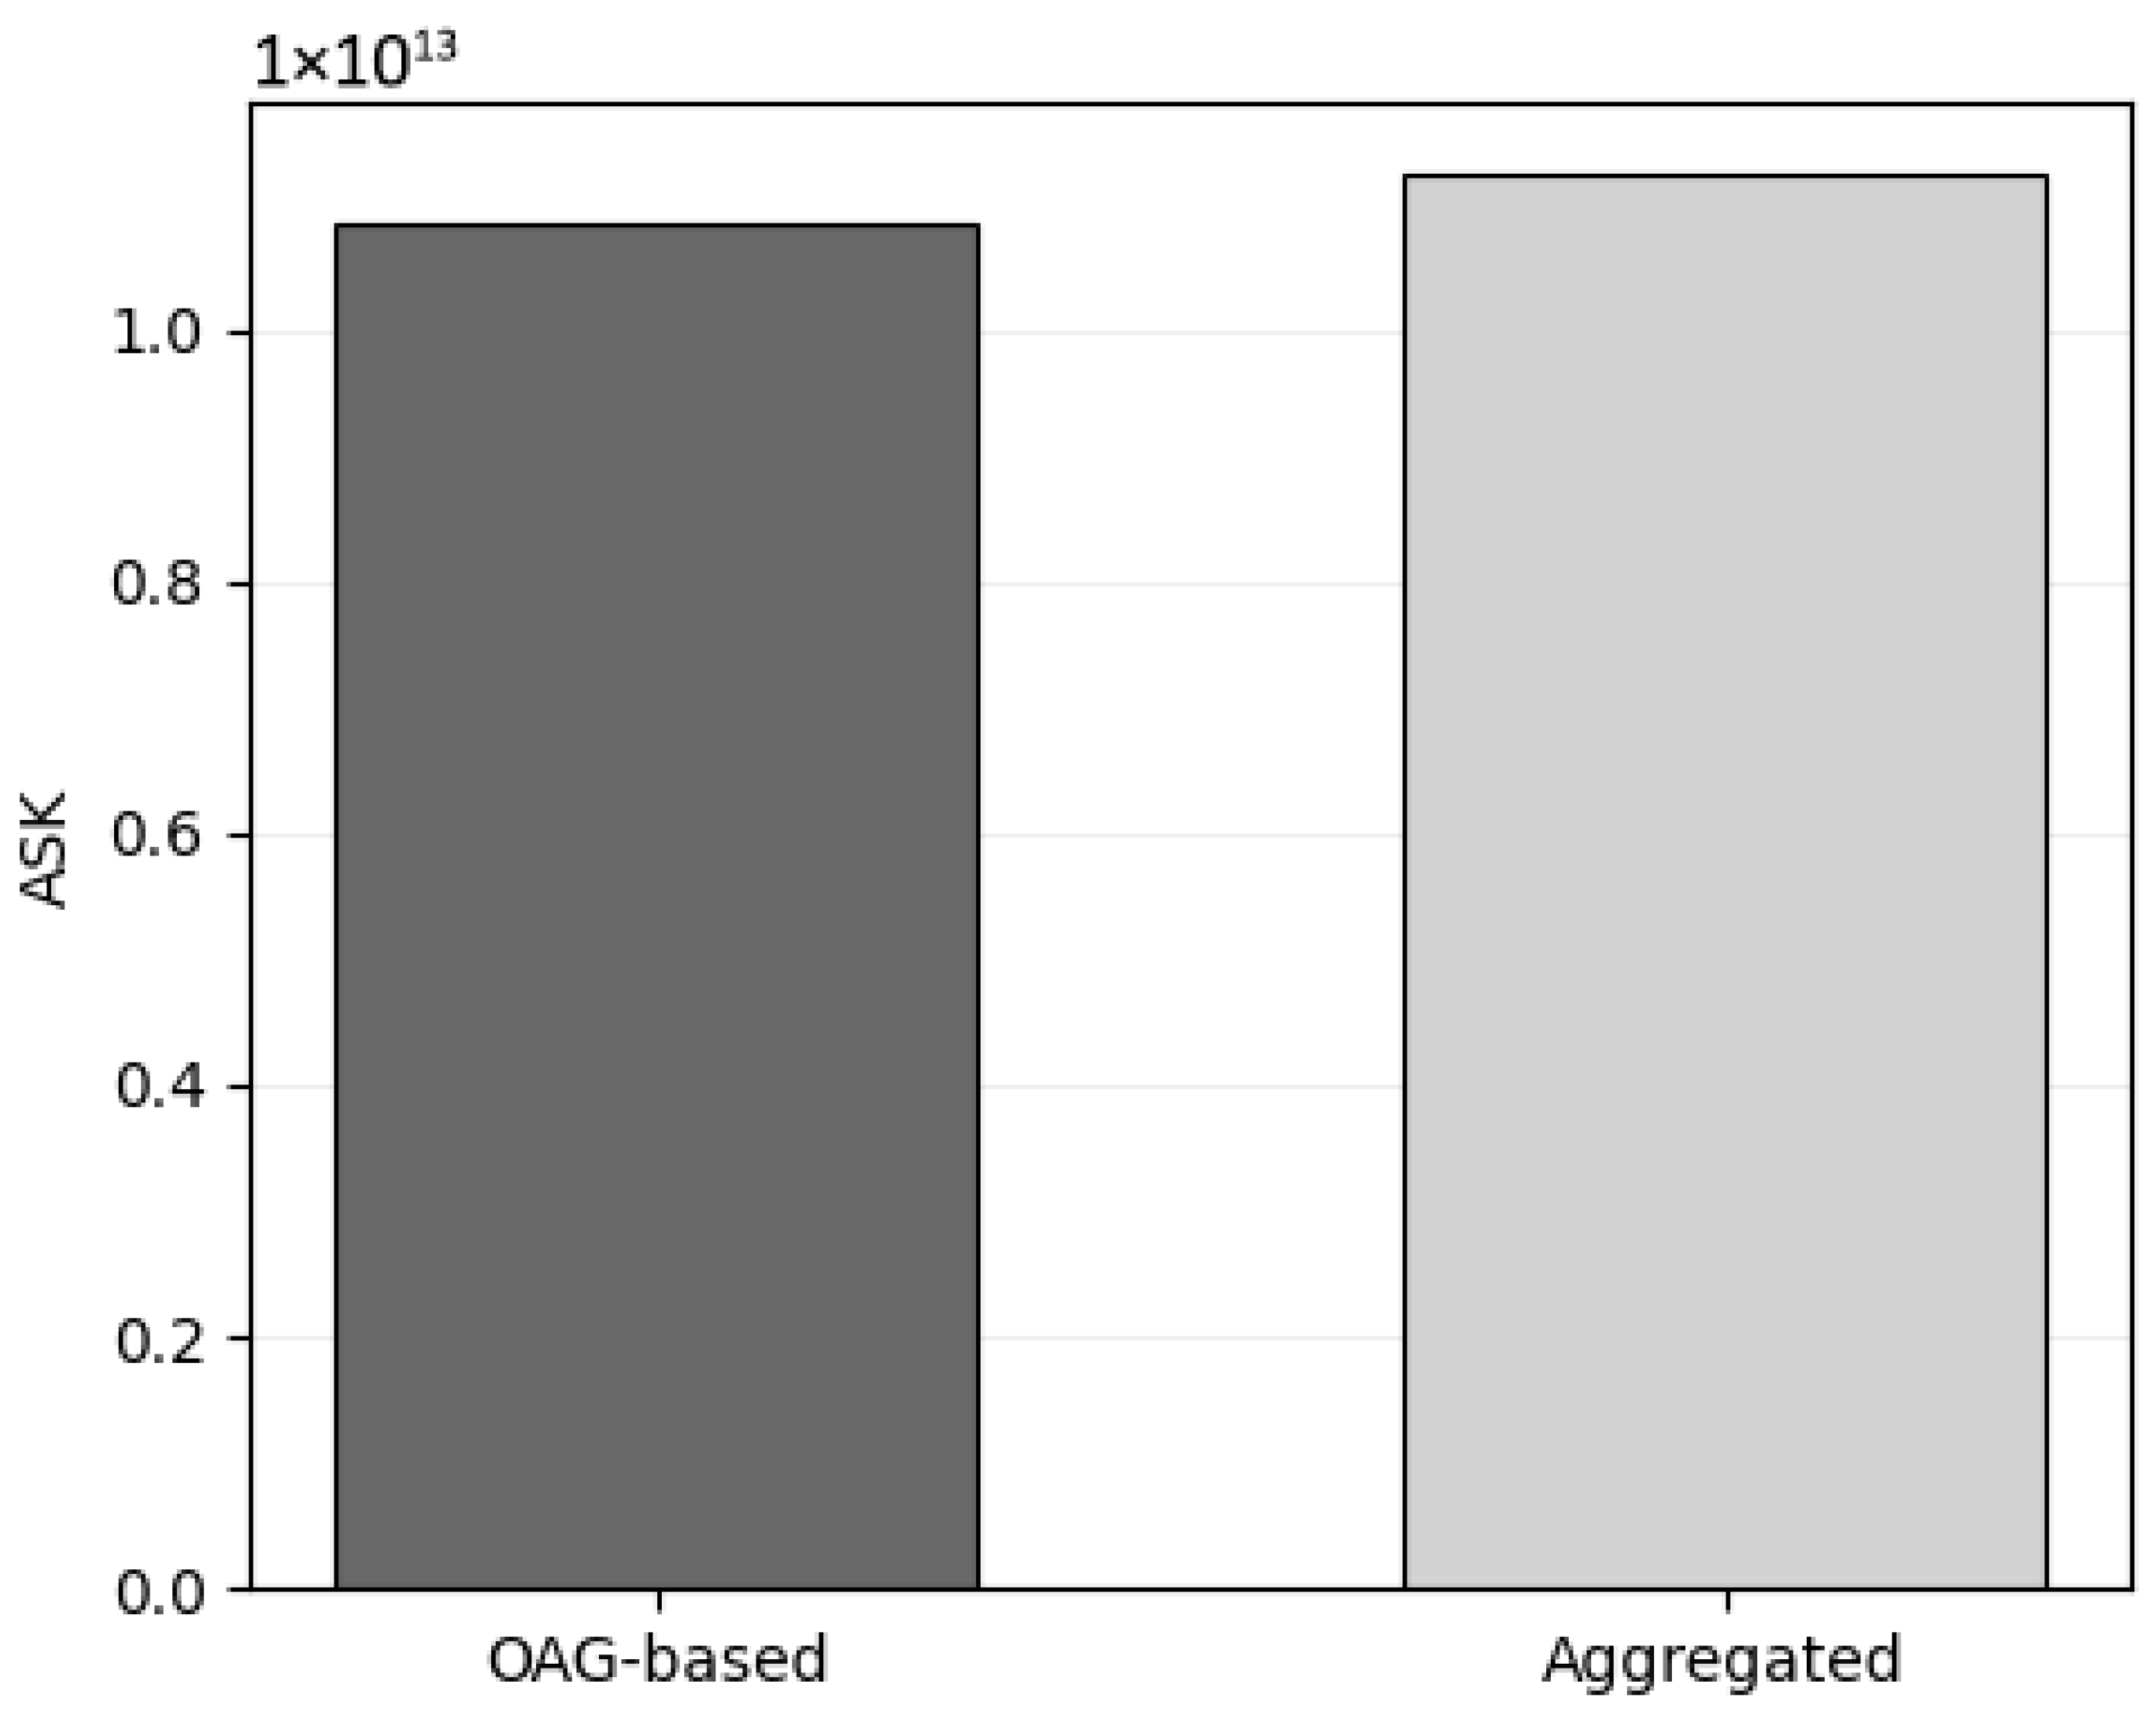
The OAG 2024 database contains more than 36,000 different airport pairs forming the global route network. Accordingly, unique airport pairs are aggregated to 48 representative route pairs based on global market regions and further divided into short-, medium-, and long-haul segments. The impact of this aggregation on the overall transport capacity is assessed by comparing the total available seat kilometers (ASK) derived from the OAG 2024 dataset with the corresponding ASK obtained from the aggregated model representation, as shown in Figure A1. The comparison shows a deviation of 3.66%, indicating that the aggregation preserves the overall capacity level and is suitable for the system-level analysis performed in this study.
Table A2. Aggregated representative route pairs used in the fleet model.
LabelAverage Distance (km)Description
AFAF_S403Africa (short haul)
AFAF_M1593Africa (medium haul)
AFAF_L3771Africa (long haul)
AFAS_M2623Africa to Asia (medium haul)
AFAS_L6360Africa to Asia (long haul)
AFEU_S715Africa to Europe (short haul)
AFEU_M1847Africa to Europe (medium haul)
AFEU_L4912Africa to Europe (long haul)
AFLA_L7466Africa to Latin America (long haul)
AFME_S579Africa to Middle East (short haul)
AFME_M1768Africa to Middle East (medium haul)
AFME_L4681Africa to Middle East (long haul)
AFNA_L8931Africa to North America (long haul)
ASAS_S579Asia (short haul)
ASAS_M1574Asia (medium haul)
ASAS_L4370Asia (long haul)
ASEU_S633Asia to Europe (short haul)
ASEU_M2155Asia to Europe (medium haul)
ASEU_L7039Asia to Europe (long haul)
ASLA_L11,216Asia to Latin America (long haul)
ASME_S894Asia to Middle East (short haul)
ASME_M2306Asia to Middle East (medium haul)
ASME_L5238Asia to Middle East (long haul)
ASNA_M2148Asia to North America (medium haul)
ASNA_L9832Asia to North America (long haul)
EUEU_S550Europe (short haul)
EUEU_M1655Europe (medium haul)
EUEU_L3343Europe (long haul)
EULA_L8471Europe to Latin America (long haul)
EUME_S565Europe to Middle East (short haul)
EUME_M2054Europe to Middle East (medium haul)
EUME_L4403Europe to Middle East (long haul)
EUNA_S698Europe to North America (short haul)
EUNA_M1369Europe to North America (medium haul)
EUNA_L6730Europe to North America (long haul)
LALA_S438Latin America (short haul)
LALA_M1634Latin America (medium haul)
LALA_L4268Latin America (long haul)
LAME_L11,954Latin America to Middle East (long haul)
LANA_S583Latin America to North America (short haul)
LANA_M2080Latin America to North America (medium haul)
LANA_L4243Latin America to North America (long haul)
MEME_S637Middle East (short haul)
MEME_M1428Middle East (medium haul)
MENA_L11,232Middle East to North America (long haul)
NANA_S518North America (short haul)
NANA_M1659North America (medium haul)
NANA_L3808North America (long haul)
Figure A1. Comparison of total available seat kilometers (ASK) derived from the OAG 2024 dataset and from the aggregated model representation for the base year 2024.
Aerospace 13 00517 g0a1

Appendix A.3. Revenue Passenger Kilometers (RPK) Forecast

Figure A2. Total RPK forecast across all representative route pairs over time.
Aerospace 13 00517 g0a2

Appendix A.4. Top-Level Aircraft Requirements and Performance of Assessed Aircraft Configurations

This study uses the BADA 3.16 performance model via the official pyBADA Python interface [49] to calculate the performance of the reference aircraft in the fleet. The performance of the successor (i.e., H2-powered) aircraft is approximated by scaling the block energy demand, accounting for efficiency improvements derived within the H2Avia project and adjustments based on the lower heating value (LHV) as shown in Equation (A1). A similar approach was also applied in [63]. The change in block energy demand between the reference, baseline, and H2-powered aircraft is studied in detail in [7], while a summary, including top-level aircraft requirements (TLARs), is provided here in Table A3 and Table A4.
B F H 2 = B F Ref · ( 1 + Δ B E ) · L H V Jet - A 1 L H V H 2
Table A3. Top-level aircraft requirements (TLARs) of the analyzed aircraft configurations, adapted from [7].
RequirementUnitREGSMRLR
Design payloadkg11,40017,10030,875
Maximum payloadkg15,12819,30053,400
Design PAX120180325
Design rangenm294029438100
Study rangenm8008004000
Cruise Mach numberMa0.780.780.85
MTOF lengthm187319512588
MLF lengthm172018801960
Max. approach speedkts132138140
Max. operating altitudeft38,50040,00043,100
Max. Mach numberMa0.820.820.89
Table A4. Block energy performance of baseline (BL) and hydrogen (H2) configurations, adapted from [7].
MetricUnitREGSMRLR
Design mission (BL)GJ4105223229
Design mission (H2)GJ4646163492
Δ rel. (H2 vs. BL)%+13+18+8
Study mission (BL)GJ1211571468
Study mission (H2)GJ1431881697
Δ rel. (H2 vs. BL)%+18+20+16

Appendix A.5. Production Capacity Forecast

To estimate production capacities, linear regression parameters are adopted from Engelke’s study on the historical evolution of aircraft deliveries [50]. The study presents two linear equations for estimating total production capacity for single-aisle and twin-aisle aircraft, expressed as functions of time with 1980 as the reference year, which can be seen below:
C single - aisle ( t ) = 28.7 · ( t 1980 ) + 133.2
C twin - aisle ( t ) = 5.1 · ( t 1980 ) + 142.8
Due to limited data availability, aircraft clusters AC1–AC5 are mapped to Equation (A2), while AC6–AC7 are mapped to Equation (A2). The description of the mentioned aircraft clusters can be seen in Table A1.

Appendix A.6. Fuel Cost Projections

The fuel cost projections for kerosene, LH2, and SAF are based on data from [53,54]. To match the time horizon of the scenario-based analysis in this study (up to 2070), these data were extrapolated using curve-fitting techniques that preserve the underlying trends of each fuel pathway. Furthermore, SAF blending based on RefuelEU mandates is considered in the fuel projections as well. Figure A3 shows the fuel cost reference, which serves as the starting point for the scenario-specific fuel cost assumptions. Subsequent adjustments, such as scaling factors and trend modifications, are applied to reflect differences in policy support, technological development, and infrastructure availability, according to the scenario matrix provided in Table 2.
Figure A3. Reference fuel cost trajectories for Jet-A [53], LH2 [54], and SAF [53] based on literature data up to 2050, including fitted curves and extrapolation to 2070. These curves serve as the basis for scenario-specific adjustments applied in the model.
Aerospace 13 00517 g0a3

Appendix A.7. Climate Impact Data of Assessed Aircraft Configurations

Figure A4. Comparison of the climate impact using the efficacy-weighted global warming potential ( f - G W P 100 ) metric, showing the relative contributions of individual emissions and forcing mechanisms for a representative mission for REF, BL and H2-powered aircraft. Adapted from [7].
Aerospace 13 00517 g0a4

References

  1. Aviation Impact Accelerator. Five Years to Chart a New Future for Aviation. 2024, p. 56. Available online: https://report.aiazero.org/ (accessed on 15 December 2025).
  2. ICAO. Trends in Emissions that Affect Climate Change. Available online: https://www.icao.int/environmental-protection/trends-emissions-affect-climate-change (accessed on 2 March 2026).
  3. Lee, D.; Fahey, D.; Skowron, A.; Allen, M.; Burkhardt, U.; Chen, Q.; Doherty, S.; Freeman, S.; Forster, P.; Fuglestvedt, J.; et al. The contribution of global aviation to anthropogenic climate forcing for 2000 to 2018. Atmos. Environ. 2021, 244, 117834. [Google Scholar] [CrossRef]
  4. CATF. Clean Air Task Force: Decarbonizing Aviation: Enabling Technologies for a Net-Zero Future; Technical Report; CATF: Boston, MA, USA, 2024. [Google Scholar]
  5. Publications Office of the European Union. Hydrogen-Powered Aviation: A Fact-Based Study of Hydrogen Technology, Economics, and Climate Impact by 2050, 1st ed.; Technical Report; Publications Office of the European Union: Luxembourg, 2020; p. 96. [Google Scholar] [CrossRef]
  6. Peter, F.N. The H2Avia Project—Goals and Aircraft Synthesis Strategy; Zenodo: Geneva, Switzerland, 2024. [Google Scholar]
  7. Peter, F.N.; Engelmann, M.; Fikry, M.; Lüdemann, M.; Moser, L.; Warsch, C.; Balderas-Xicohtencatl, R.; Muslić, A.; Erden, E.; Hornung, M.; et al. Results of the H2Avia Project—Potential of Hydrogen for Global Aviation. Aerospace, 2026; under review.
  8. Abara, J. Applying Integer Linear Programming to the Fleet Assignment Problem. Interfaces 1989, 19, 20–28. [Google Scholar] [CrossRef]
  9. Hane, C.A.; Barnhart, C.; Johnson, E.L.; Marsten, R.E.; Nemhauser, G.L.; Sigismondi, G. The fleet assignment problem: Solving a large-scale integer program. Math. Program. 1995, 70, 211–232. [Google Scholar] [CrossRef]
  10. Lohatepanont, M. Airline Fleet Assignment and Schedule Design: Integrated Models and Algorithms. Doctoral Dissertation, Massachusetts Institute of Technology, Cambridge, MA, USA, 2002. [Google Scholar]
  11. Sherali, H.D.; Bish, E.K.; Zhu, X. Airline fleet assignment concepts, models, and algorithms. Eur. J. Oper. Res. 2006, 172, 1–30. [Google Scholar] [CrossRef]
  12. Mancel, C. Airline fleet assignment: A state of the art. In Proceedings of the ATRS 2006, 10th Air Transportation Research Society Conference, Nagoya, Japan, 27–28 May 2006. [Google Scholar]
  13. Ozdemir, Y.; Basligil, H.; Sarsenov, B. A Large Scale Integer Linear Programming to the Daily Fleet Assignment Problem: A Case Study in Turkey. Procedia-Soc. Behav. Sci. 2012, 62, 849–853. [Google Scholar] [CrossRef][Green Version]
  14. Li, Y.; Tan, N. Study on Fleet Assignment Problem Model and Algorithm. Math. Probl. Eng. 2013, 2013, 581586. [Google Scholar] [CrossRef]
  15. Wu, D.; Fan, Y.; Xia, H.; Zhang, J. Fleet Assignment Problem Study Based on Branch-and-Bound Algorithm; Atlantis Press: Dordrecht, The Netherlands, 2014; pp. 16–20. [Google Scholar] [CrossRef]
  16. Birolini, S.; Antunes, A.P.; Cattaneo, M.; Malighetti, P.; Paleari, S. Integrated flight scheduling and fleet assignment with improved supply-demand interactions. Transp. Res. Part B Methodol. 2021, 149, 162–180. [Google Scholar] [CrossRef]
  17. Kühlen, M.; Lütjens, K.; Linke, F.; Gollnick, V. An explanatory approach to modeling the fleet assignment in the global air transportation system. CEAS Aeronaut. J. 2023, 14, 255–269. [Google Scholar] [CrossRef]
  18. Klöwer, M.; Allen, M.; Lee, D.; Proud, S.; Gallagher, L.; Skowron, A. Quantifying aviation’s contribution to global warming. Environ. Res. Lett. 2021, 16, 104027. [Google Scholar] [CrossRef]
  19. Apffelstaedt, A.; Langhans, S.; Gollnick, V. Identifying CO2 Reducing Aircraft Technologies and Estimating Their Impact on Global Emissions. Ph.D. Thesis, HAW Hamburg, Hamburg, Germany, 2009. [Google Scholar]
  20. Zhao, J.; Tetzloff, I.; Tyagi, A.; Dikshit, P.; Mane, M.; Agusdinata, D.; Crossley, W.; DeLaurentis, D. Assessing New Aircraft and Technology Impacts on Fleet-Wide Environmental Metrics including Future Scenarios. In 48th AIAA Aerospace Sciences Meeting Including the New Horizons Forum and Aerospace Exposition; Aerospace Sciences Meetings; American Institute of Aeronautics and Astronautics: Reston, VA, USA, 2010. [Google Scholar] [CrossRef]
  21. Schaefer, M. Development of a Forecast Model for Global Air Traffic Emissions; Berichtsreihe; Deutsches Zentrum für Luft- und Raumfahrt: Cologne, Germany, 2012. [Google Scholar]
  22. Tetzloff, I.J.; Crossley, W.A. Measuring Systemwide Impacts of New Aircraft on the Environment. J. Aircr. 2014, 51, 5. [Google Scholar] [CrossRef]
  23. Randt, N.P.R. Aircraft Technology Assessment Using Fleet-Level Metrics. Ph.D. Thesis, Technische Universität München, Munich, Germany, 2016. [Google Scholar]
  24. Justin, C.Y.; Payan, A.P.; Mavris, D.N. Integrated fleet assignment and scheduling for environmentally friendly electrified regional air mobility. Transp. Res. Part C Emerg. Technol. 2022, 138, 103567. [Google Scholar] [CrossRef]
  25. Wang, Y.; Yuan, K.; Zhu, M.; Li, S. A Time-and-Space-Network-Based Green Fleet Planning Model and Its Application for a Hub-and-Spoke Network. Sustainability 2023, 15, 5832. [Google Scholar] [CrossRef]
  26. Noorafza, M.; Santos, B.F.; Sharpanskykh, A.; Zengerling, Z.L.; Weder, C.M.; Linke, F.; Grewe, V. Airline Network Planning Considering Climate Impact: Assessing New Operational Improvements. Appl. Sci. 2023, 13, 6722. [Google Scholar] [CrossRef]
  27. Liu, M.; Ding, Y.; Sun, L.; Zhang, R.; Dong, Y.; Zhao, Z.; Wang, Y.; Liu, C. Green Airline-Fleet Assignment with Uncertain Passenger Demand and Fuel Price. Sustainability 2023, 15, 899. [Google Scholar] [CrossRef]
  28. Chan, B.; Deng, Y.; Tran, N.; Wu, H.; Ikeda, M.; Cinar, G.; Li, M.Z. Optimizing Fleet Assignment Decisions for Regional Airlines with Hybrid Electric Aircraft Uptake. In Proceedings of the 34th Congress of the International Council of the Aeronautical Sciences, Firenze, Italy, 9–13 September 2024. [Google Scholar]
  29. Fuel Cells and Hydrogen Joint Undertaking, European Union. Hydrogen-Powered Aviation; Technical Report; Fuel Cells and Hydrogen Joint Undertaking, European Union: Brussels, Belgium, 2020; Available online: https://www.clean-hydrogen.europa.eu/media/publications/hydrogen-powered-aviation_en (accessed on 2 May 2025).
  30. Lammen, W.F.; Peerlings, B.; van der Sman, E.S.; Kos, J. Hydrogen-powered propulsion aircraft: Conceptual sizing and fleet level impact analysis. In Proceedings of the 9th European Conference for Aeronautics and Space Sciences (EUCASS), Lille, France, 27 June–1 July 2022. [Google Scholar]
  31. Hoelzen, J.; Silberhorn, D.; Schenke, F.; Stabenow, E.; Zill, T.; Bensmann, A.; Hanke-Rauschenbach, R. H2-powered aviation–Optimized aircraft and green LH2 supply in air transport networks. Appl. Energy 2025, 380, 124999. [Google Scholar] [CrossRef]
  32. Proesmans, P. Climate-Optimal Aircraft Design and Fleet Allocation: Evaluating the Impact of Sustainable Aviation Fuels. Doctoral Thesis, TU Delft, Delft, The Netherlands, 2024. [Google Scholar] [CrossRef]
  33. Sirtori, G.; Trainelli, L. From Potential Routes to Climate Impact: Assessing the Fleet Transition to Hydrogen-Powered Aircraft. Aerospace 2025, 12, 1075. [Google Scholar] [CrossRef]
  34. Mensen, H. Planung, Anlage und Betrieb von Flugplätzen; Springer: Berlin/Heidelberg, Germany, 2007. (In German) [Google Scholar]
  35. Hirst, M. The Air Transport System; Elsevier: Amsterdam, The Netherlands, 2008. [Google Scholar]
  36. OAG. Scheduled Flight Data 2024; OAG: Luton, UK, 2024. [Google Scholar]
  37. Michelmann, J.; Paul, A.; Habersetzer, A.; Martin, U. Scenarios for the Introduction of Hydrogen as an Energy Carrier in Aviation. In Proceedings of the Deutscher Luft- und Raumfahrtkongress (DLRK) 2022, Dresden, Germany, 27–29 September 2022; p. 9. [Google Scholar]
  38. Schwenker, B.; Wulf, T. (Eds.) Scenario-Based Strategic Planning: Developing Strategies in an Uncertain World; Roland Berger School of Strategy and Economics, Springer Fachmedien: Wiesbaden, Germany, 2013. [Google Scholar] [CrossRef]
  39. McDonnell Douglas Aircraft Company. Airline fleet planning, Unpublished Presentation, 1981. In The Global Airline Industry; Wiley: Chichester, UK, 2009; p. 160. [Google Scholar]
  40. Belobaba, P.; Odoni, A.; Barnhart, C. The Global Airline Industry; John Wiley & Sons: Hoboken, NJ, USA, 2015. [Google Scholar]
  41. Gurobi Optimization, LLC. Gurobi Optimizer Reference Manual, Release 12.0.2. Available online: https://docs.gurobi.com/projects/optimizer/en/current/index.html (accessed on 15 May 2025).
  42. Boeing. Commercial Market Outlook 2023–2042. 2023. Available online: https://www.boeing.com/content/dam/boeing/boeingdotcom/market/assets/downloads/2023-CMO_Hulst-Presentation.pdf (accessed on 17 June 2025).
  43. Airbus. Global Market Forecast 2025–2044. 2025. Available online: https://www.airbus.com/en/products-services/commercial-aircraft/global-market-forecast (accessed on 17 June 2025).
  44. Franz, S.; Rottoli, M.; Bertram, C. The wide range of possible aviation demand futures after the COVID-19 pandemic. Environ. Res. Lett. 2022, 17, 064009. [Google Scholar] [CrossRef]
  45. IATA. Global Outlook for Air Transport (December 2025). 2025. Available online: https://www.iata.org/en/publications/economics/reports/global-outlook-for-air-transport-december-2025/ (accessed on 23 December 2025).
  46. Nuic, A.; Poles, D.; Mouillet, V. BADA: An advanced aircraft performance model for present and future ATM systems. Int. J. Adapt. Control Signal Process. 2010, 24, 850–866. [Google Scholar] [CrossRef]
  47. Schültke, F.; Stumpf, E. UNICADO—Development and Establishment of a University Conceptual Aircraft Design Environment. 2020. Available online: https://assets-eu.researchsquare.com/files/rs-7013058/v1/6638ae34-33e2-4eb1-a9e2-9afec40d46d0.pdf (accessed on 11 February 2026).
  48. Sun, J.; Hoekstra, J.M.; Ellerbroek, J. OpenAP: An open-source aircraft performance model for air transportation studies and simulations. Aerospace 2020, 7, 104. [Google Scholar] [CrossRef]
  49. EUROCONTROL. pyBADA Release 0.1.7: Python Interface for the BADA 3.16 Aircraft Performance Model. Available online: https://github.com/eurocontrol-bada/pybada (accessed on 15 September 2025).
  50. Engelke, C. Flottenplanung und -Einsatz: Untersuchungen zur Weiterentwicklung Eines Dynamischen Flottenmodells für Leistungsanalysen der Weltflotte. Bachelor’s Thesis, Technical University of Munich, Munich, Germany, 2014. (In German) [Google Scholar]
  51. Planespotters.net. Aircraft Production Lists|Planespotters.net: Berlin, Germany. Available online: https://www.planespotters.net/aircraft/index (accessed on 5 August 2025).
  52. RDC Aviation. Aircraft Reference Data; RDC Aviation: Nottingham, UK, 2021; Available online: https://rdcaviation.com/data/ (accessed on 11 September 2023).
  53. Zhou, Y.; Searle, S.; Pavlenko, N. Current and Future Cost of E-Kerosene in the United States and Europe. 2022. Available online: https://theicct.org/publication/fuels-us-eu-cost-ekerosene-mar22/ (accessed on 5 February 2025).
  54. International Renewable Energy Agency (IRENA). Global Renewables Outlook: Energy Transformation 2050; International Renewable Energy Agency: Abu Dhabi, United Arab Emirates, 2020. [Google Scholar]
  55. Regulation (EU) 2023/2405 of the European Parliament and of the Council of 18 October 2023 on Ensuring a Level Playing Field for Sustainable Air Transport (ReFuelEU Aviation). Available online: https://www.easa.europa.eu/en/document-library/regulations/regulation-eu-20232405-european-parliament-and-council (accessed on 5 February 2025).
  56. Dallara, E.S.; Kroo, I.M.; Waitz, I.A. Metric for Comparing Lifetime average Climate Impact of Aircraft. AIAA J. 2011, 49, 1600–1613. [Google Scholar] [CrossRef]
  57. Wiegand, M.; Koops, L.; Mailach, R.; Balderas-Xicohtencatl, R. Uncertainty Quantification in Aviation Climate Impact: A Stochastic Approach to CO2 and Non-CO2 Effects. Prepr. Res. Sq. 2026. [Google Scholar] [CrossRef]
  58. Bier, A.; Unterstrasser, S.; Zink, J.; Hillenbrand, D.; Jurkat-Witschas, T.; Lottermoser, A. Contrail formation on ambient aerosol particles for aircraft with hydrogen combustion: A box model trajectory study. Atmos. Chem. Phys. 2024, 24, 2319–2344. [Google Scholar] [CrossRef]
  59. Lottermoser, A.; Unterstrasser, S. High-resolution modeling of early contrail evolution from hydrogen-powered aircraft. Atmos. Chem. Phys. 2025, 25, 7903–7924. [Google Scholar] [CrossRef]
  60. Voigt, C.; Märkl, R.; Sauer, D.; Dischl, R.; Renard, C.; Seeliger, K.; Yu, F.; Kaufmann, S.; Bräuer, T.; Jurkat-Witschas, T.; et al. Substantial aircraft contrail formation at low soot emission levels. Nature 2026, 652, 112–118. [Google Scholar] [CrossRef] [PubMed]
  61. Agency, I.R.E. Accelerating Hydrogen Deployment in the G7-Recommendations for the Hydrogen Action Pact; International Renewable Energy Agency IRENA: Abu Dhabi, United Arab Emirates, 2022. [Google Scholar]
  62. van Velzen, A. Environmental and Economic Impacts of EU ETS and CORSIA Policy Scenarios for European Aviation. 2022. Available online: https://uploads.transportenvironment.org/production/files/20220523-Environmental-and-economic-impacts-of-EU-ETS-and-CORSIA-policy-scenarios-for-European-aviation-Final-report-1.pdf?dm=1714404326 (accessed on 22 January 2026).
  63. Hoelzen, J.; Flohr, M.; Silberhorn, D.; Mangold, J.; Bensmann, A.; Hanke-Rauschenbach, R. H2-powered aviation at airports—Design and economics of LH2 refueling systems. Energy Convers. Manag. X 2022, 14, 100206. [Google Scholar] [CrossRef]
Figure 1. Scenario creation process (left) and air transport system (ATS) assessment framework (right), adapted from [23,37,38].
Aerospace 13 00517 g001
Figure 2. Schematic overview of the Bauhaus Luftfahrt in-house fleet model.
Aerospace 13 00517 g002
Figure 3. Overview of the investigated aircraft clusters within the H2Avia [6] project.
Aerospace 13 00517 g003
Figure 4. Results of the fleet model simulation for all scenarios, showing block energy (BE) demand.
Aerospace 13 00517 g004
Figure 5. Results of the fleet model simulation for all scenarios, showing climate impact as global warming potential efficacy f - G W P 100 .
Aerospace 13 00517 g005
Figure 6. Share of block energy consumed per aircraft cluster: (S2) hydrogen acceleration scenario, (S2*) hydrogen acceleration with contrails, (S3) hydrogen hesitation scenario, and (S3*) hydrogen hesitation with contrails.
Aerospace 13 00517 g006
Figure 7. Sensitivity of cumulative block energy (BE) and efficacy-weighted global warming potential ( f - G W P 100 ) with respect to the objective function weighting parameter α for hydrogen scenarios S3 (negligible contrail impact) and S3* (high contrail impact).
Aerospace 13 00517 g007
Table 1. List of sets and indices used in the model formulation.
SetDescription
TPlanning years; indexed by t
KAircraft clusters; indexed by k
RRoute pairs in the network; indexed by r
FFuel types; indexed by f
AAircraft ages ( a = 0 , 1 , ); indexed by a
K R Compatible aircraft–route pairs; indexed by ( k , r )
K F Compatible aircraft–fuel pairs; indexed by ( k , f )
K R F Compatible aircraft–route–fuel triples; indexed by ( k , r , f )
Table 2. Overview of scenarios used in the ATS assessment. In the A/C Technology category, values are reported as entry-into-service year (EIS)/qualitative production capacity ramp-up. Fuel costs are expressed as qualitative relative cost levels ($ = low, $$ = medium, $$$ = high).
ScenarioSAF Shield (S1) H 2 Acceleration (S2 and S2*) H 2 Hesitation (S3 and S3*)
A/C Technology
Baseline aircraft2040/rapid ramp-up2040/rapid ramp-up2040/rapid ramp-up
Hydrogen aircraft2040/rapid ramp-up2050/slow ramp-up
Fuel Cost Assumptions
Jet-A$$$$$$$$
SAF$$$$$$$$$$$$$
LH2$$$$$$$$$
Policy Framework
ReFuelEU mandate [55]yesyesyes
Carbon tax on Jet A-1 [61,62]nonestrongdelayed/weak
Disclaimer/Publisher’s Note: The statements, opinions and data contained in all publications are solely those of the individual author(s) and contributor(s) and not of MDPI and/or the editor(s). MDPI and/or the editor(s) disclaim responsibility for any injury to people or property resulting from any ideas, methods, instructions or products referred to in the content.