


1. Error in Figure
In the original publication [1], there was a mistake in Figures 14–18 as published. The fan rotational speed in Equations (4) and (5), and the nomenclature must be expressed in rad/s instead of rpm. While both Equations (4) and (5) remain fundamentally correct, this unit conversion alters the value of the rotational speed. Consequently, the recalculated fan rotational speed in (4) and (5) leads to a corresponding change in the Figure of Merit (FM) calculated in Equation (6). This necessitates an adjustment of the ordinate values, specifically CP, CT, and FM, in the original Figures 14–19. Notably, the revised Figure 16 shows no significant deviation from the original, as the concurrent changes in the numerator and denominator mitigate the overall impact on the FM value.
Additionally, in the revised version, the relationship between CT and CP has been incorporated into a new Figure 17 to further elucidate their interaction. This addition identifies an optimal energy-efficient point at 5500 rpm. These supplementary findings do not alter the existing research outcomes but rather clarify the significance of the CT—CP relationship; this observation has also been integrated into the fourth point of the conclusions. Accordingly, the original Figures 17 and 18 have been renumbered as the revised Figures 18 and 19.
The corrected Figure 14, Figure 15, Figure 16, Figure 18 and Figure 19 and additional new Figure 17 appears below. The authors state that the scientific conclusions are unaffected. This correction was approved by the Academic Editor. The original publication has also been updated.
Figure 14.
Power coefficient according to the battery packs.
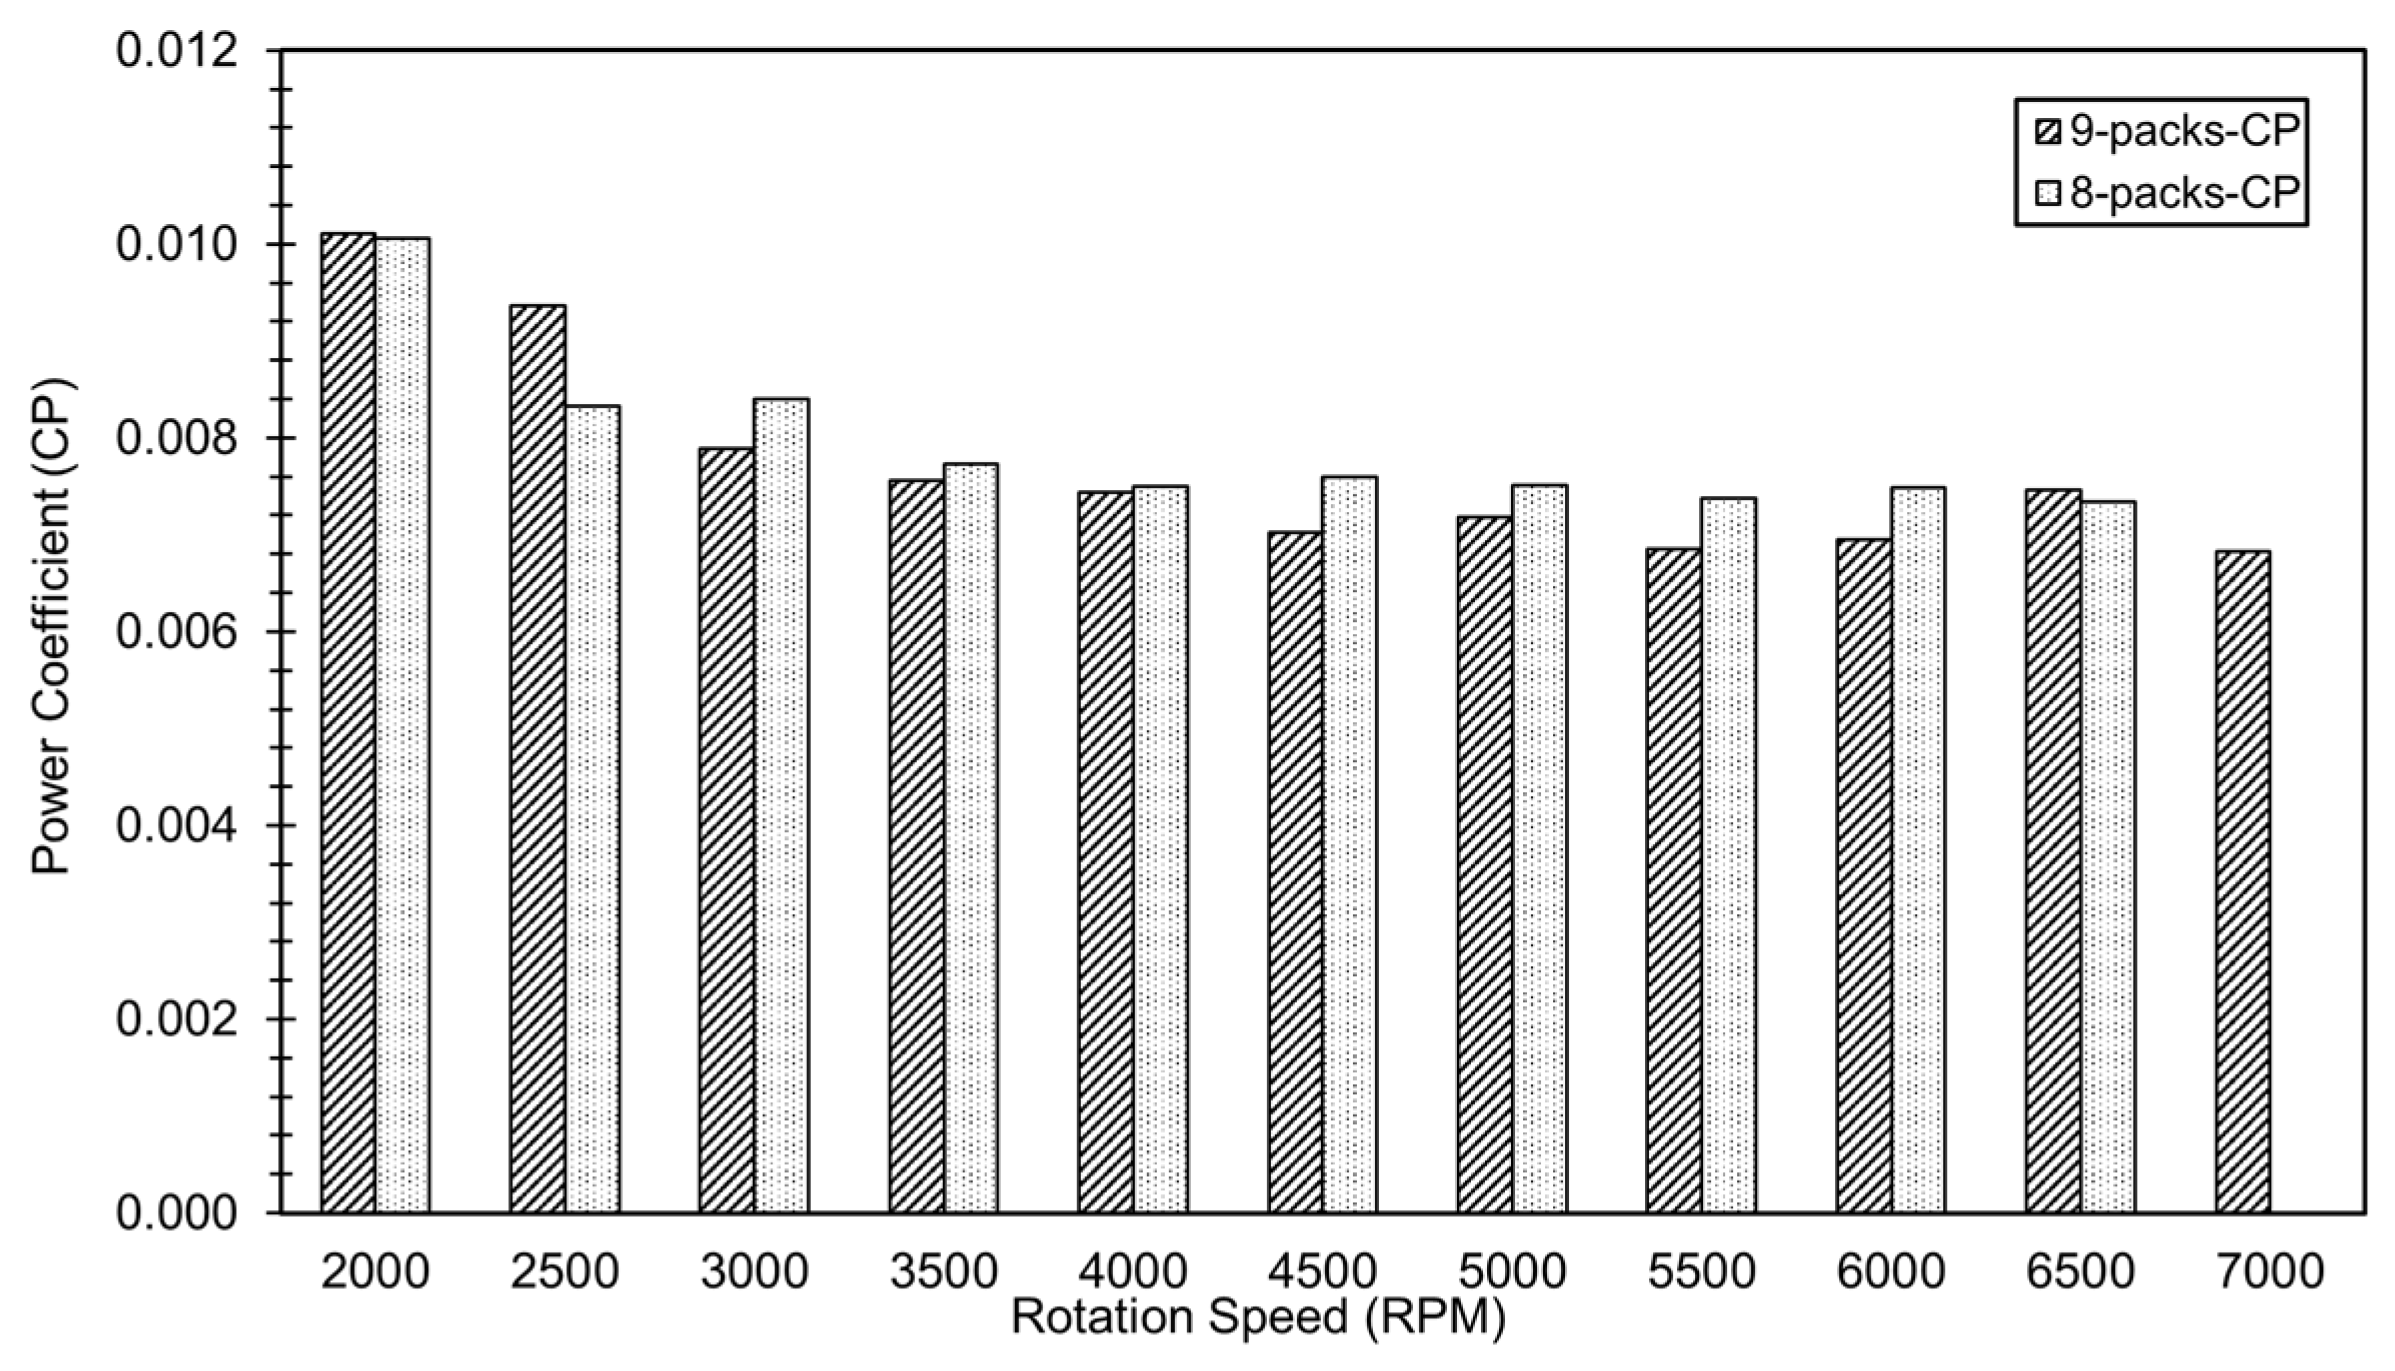
Figure 15.
Thrust coefficient according to the battery packs.
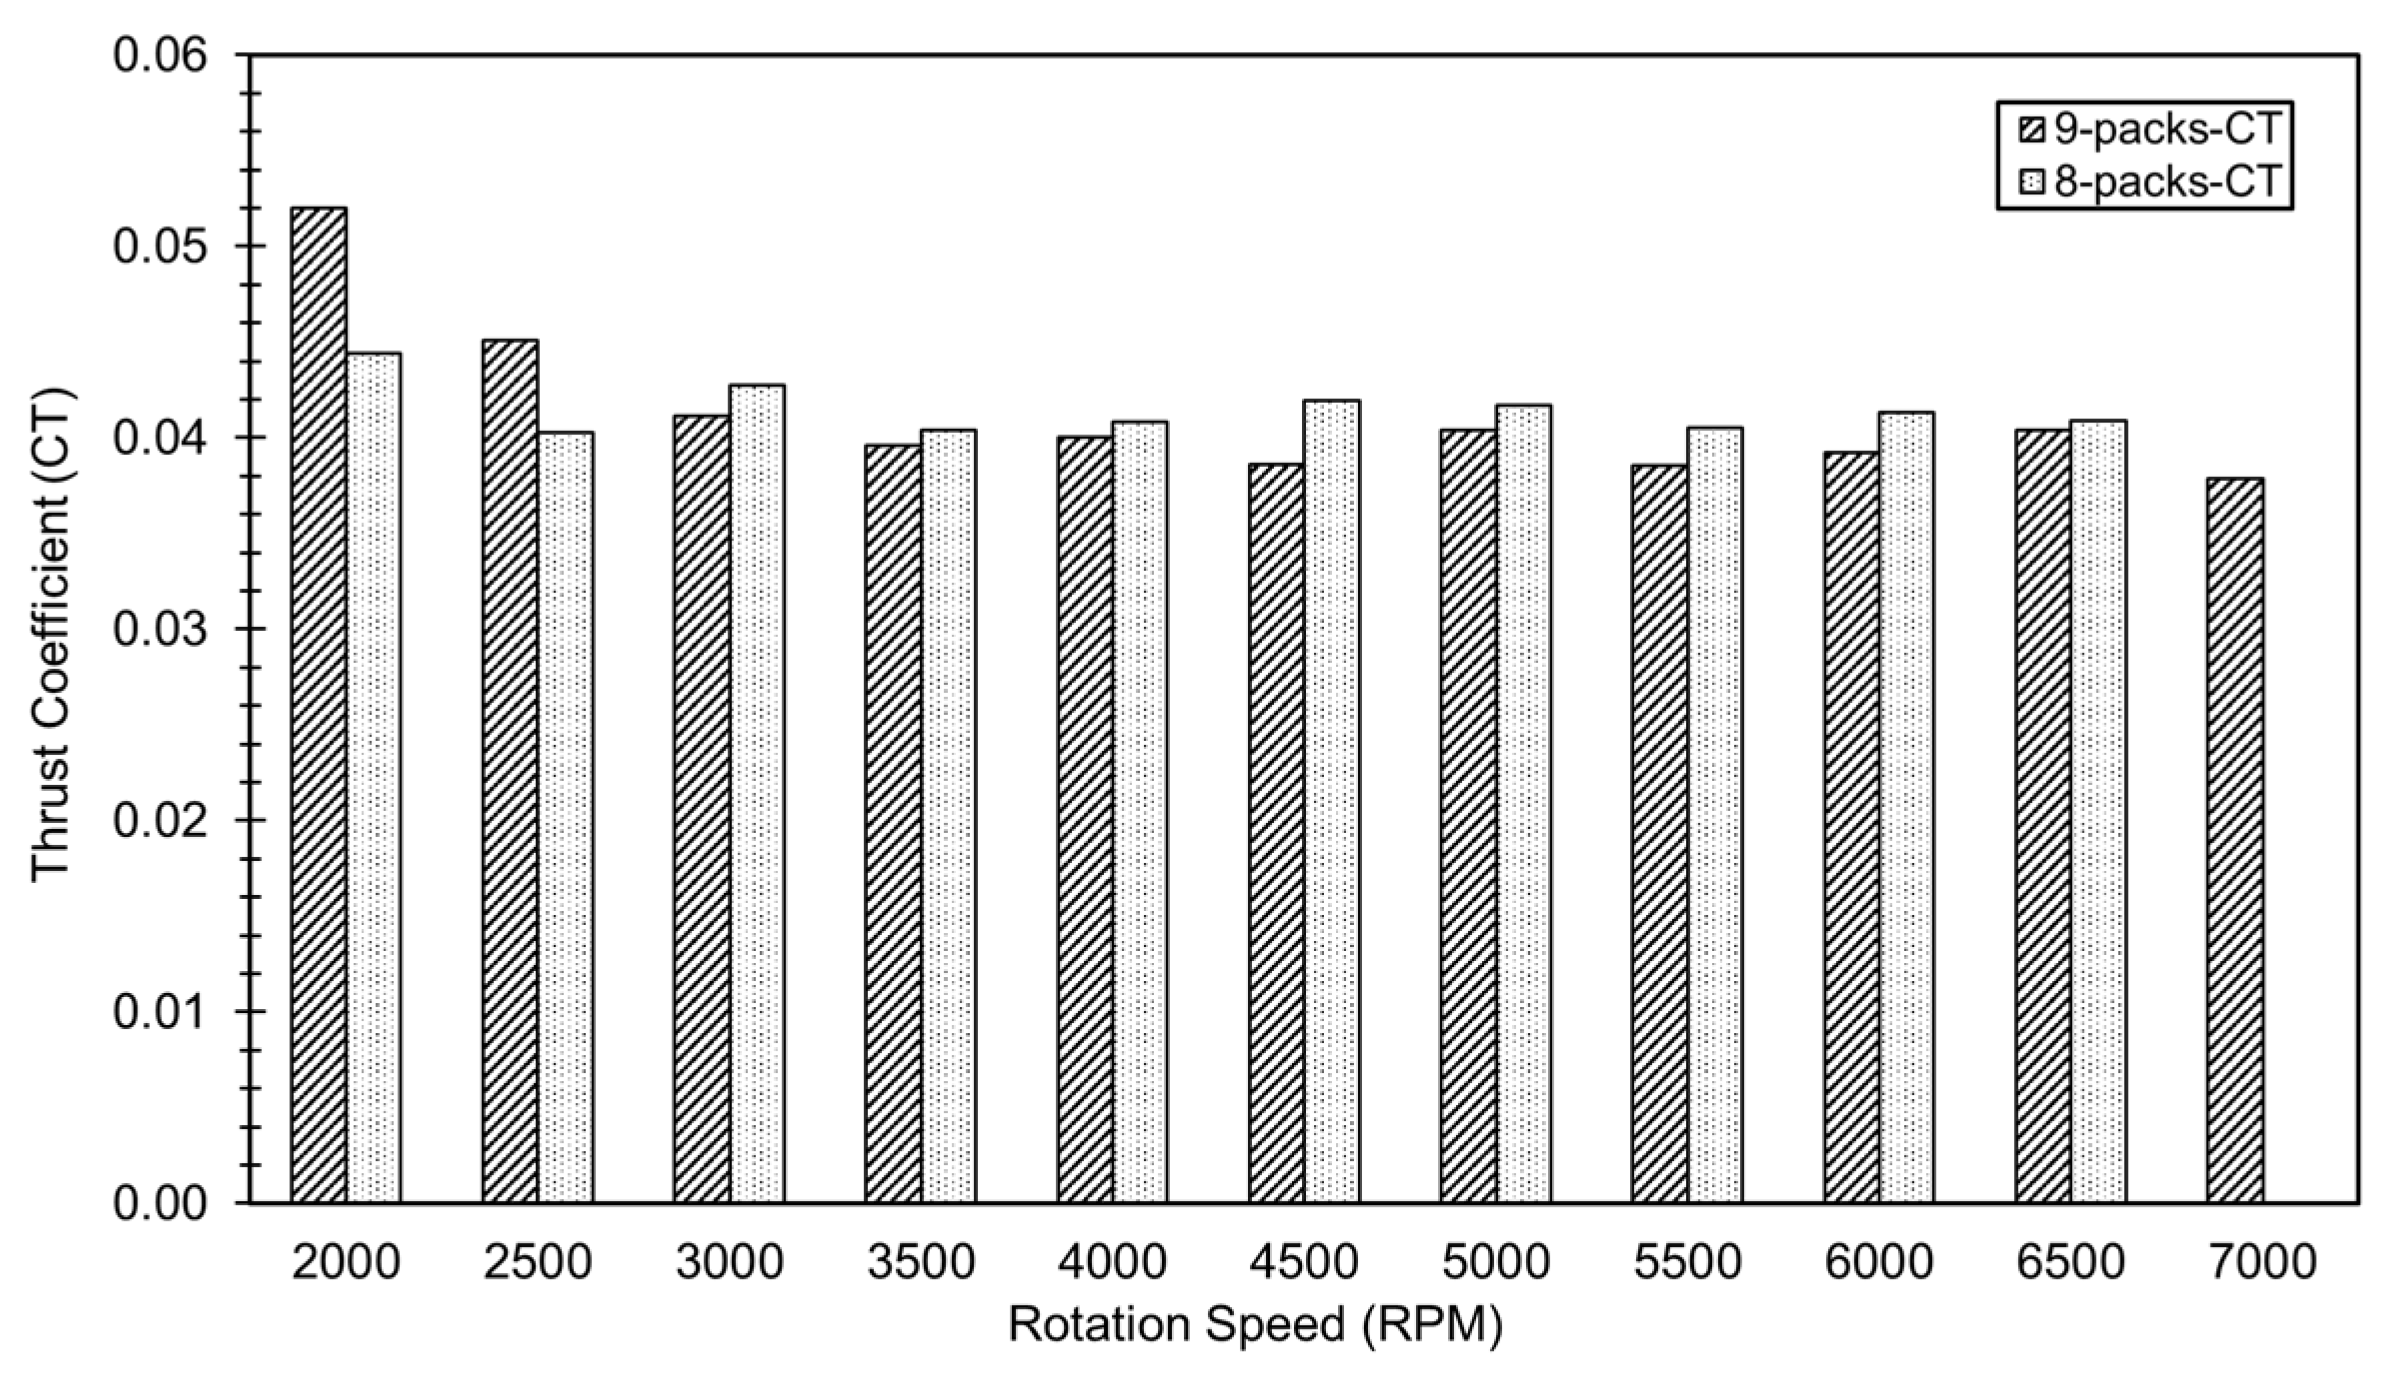
Figure 16.
Figure of merit according to the battery packs.
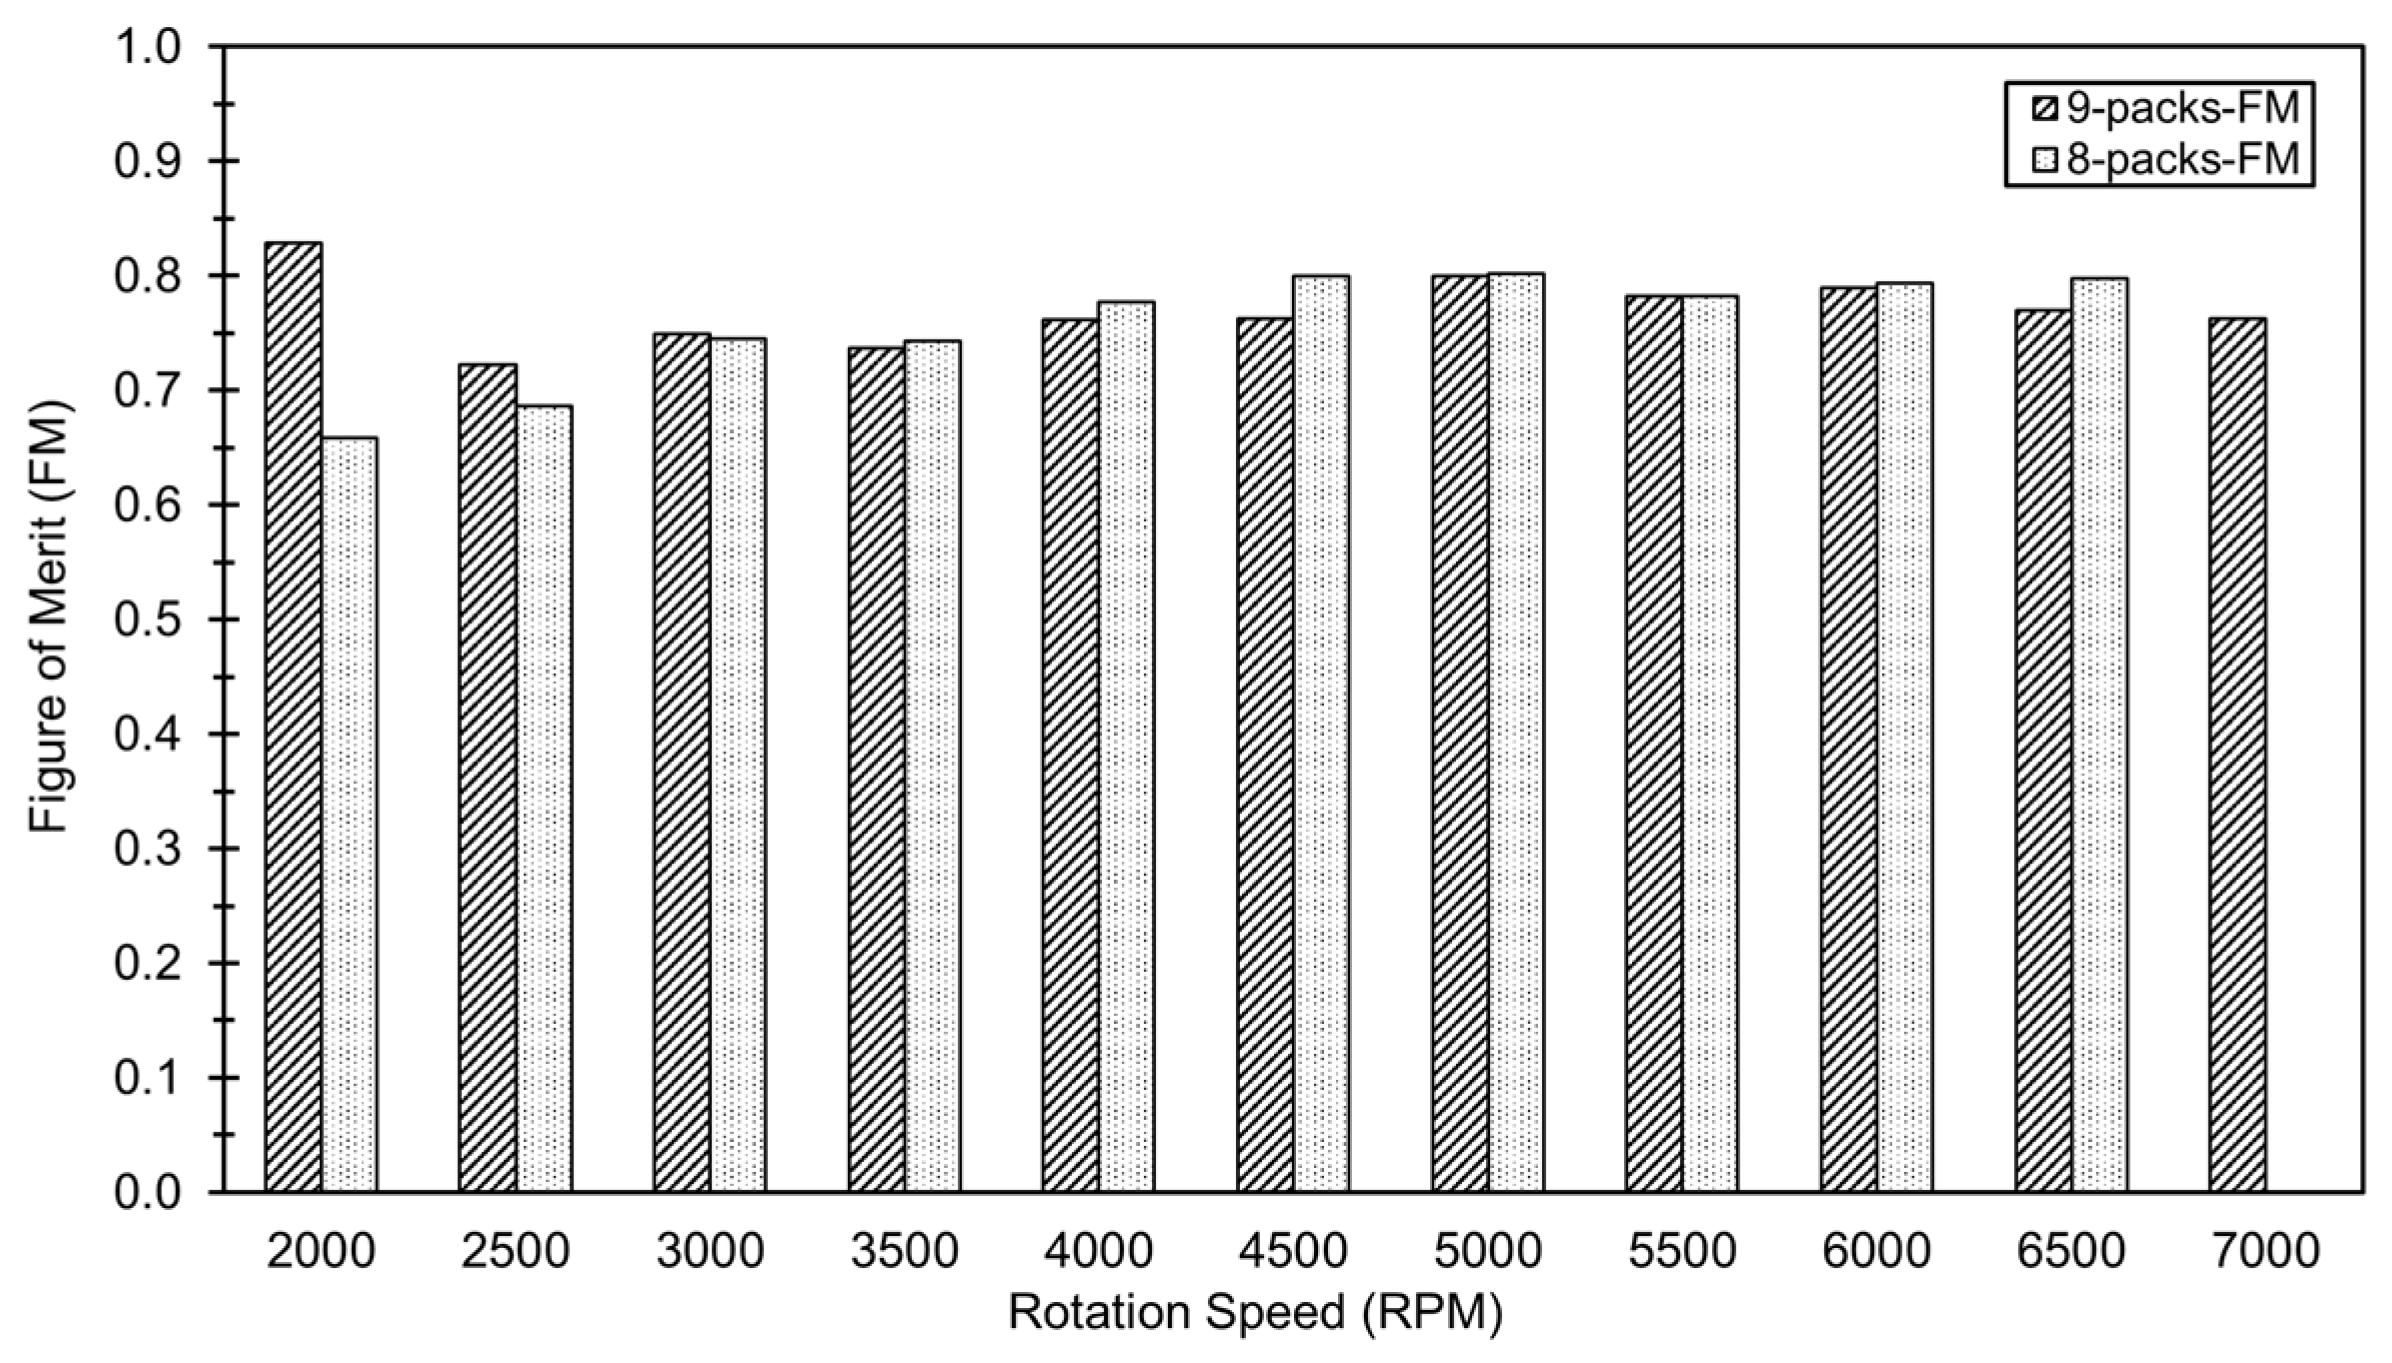
Figure 17.
Thrust coefficient versus power coefficient.
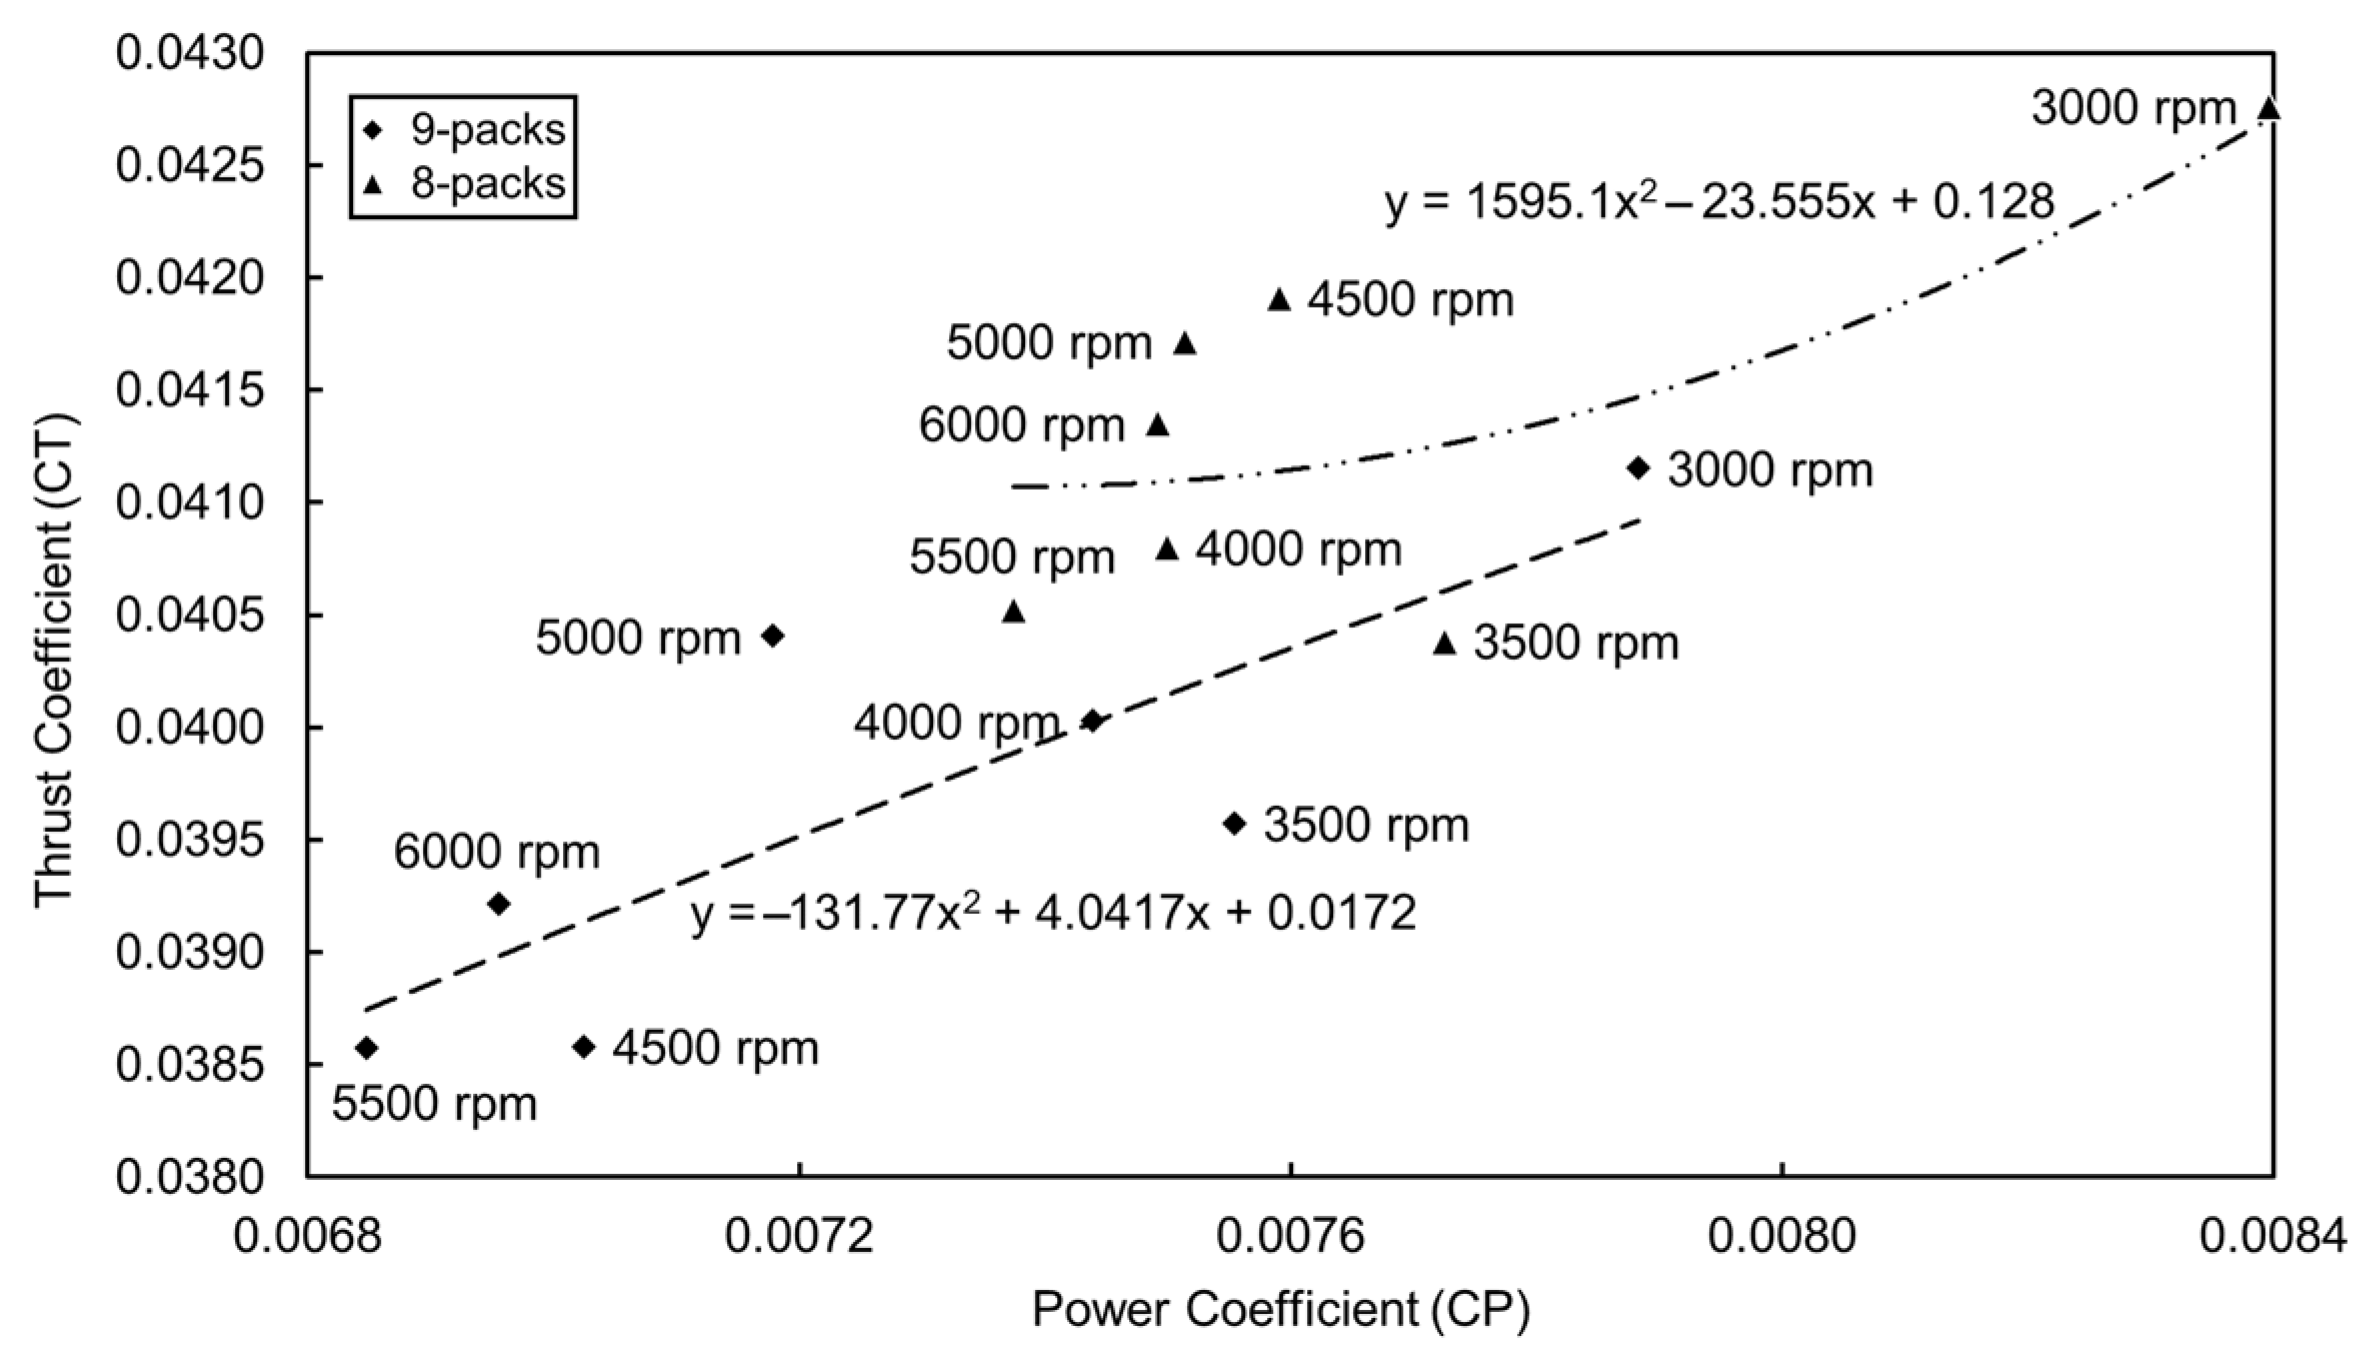
Figure 18.
Radar diagram of CT-CP-FM in the case of 8 battery packs.
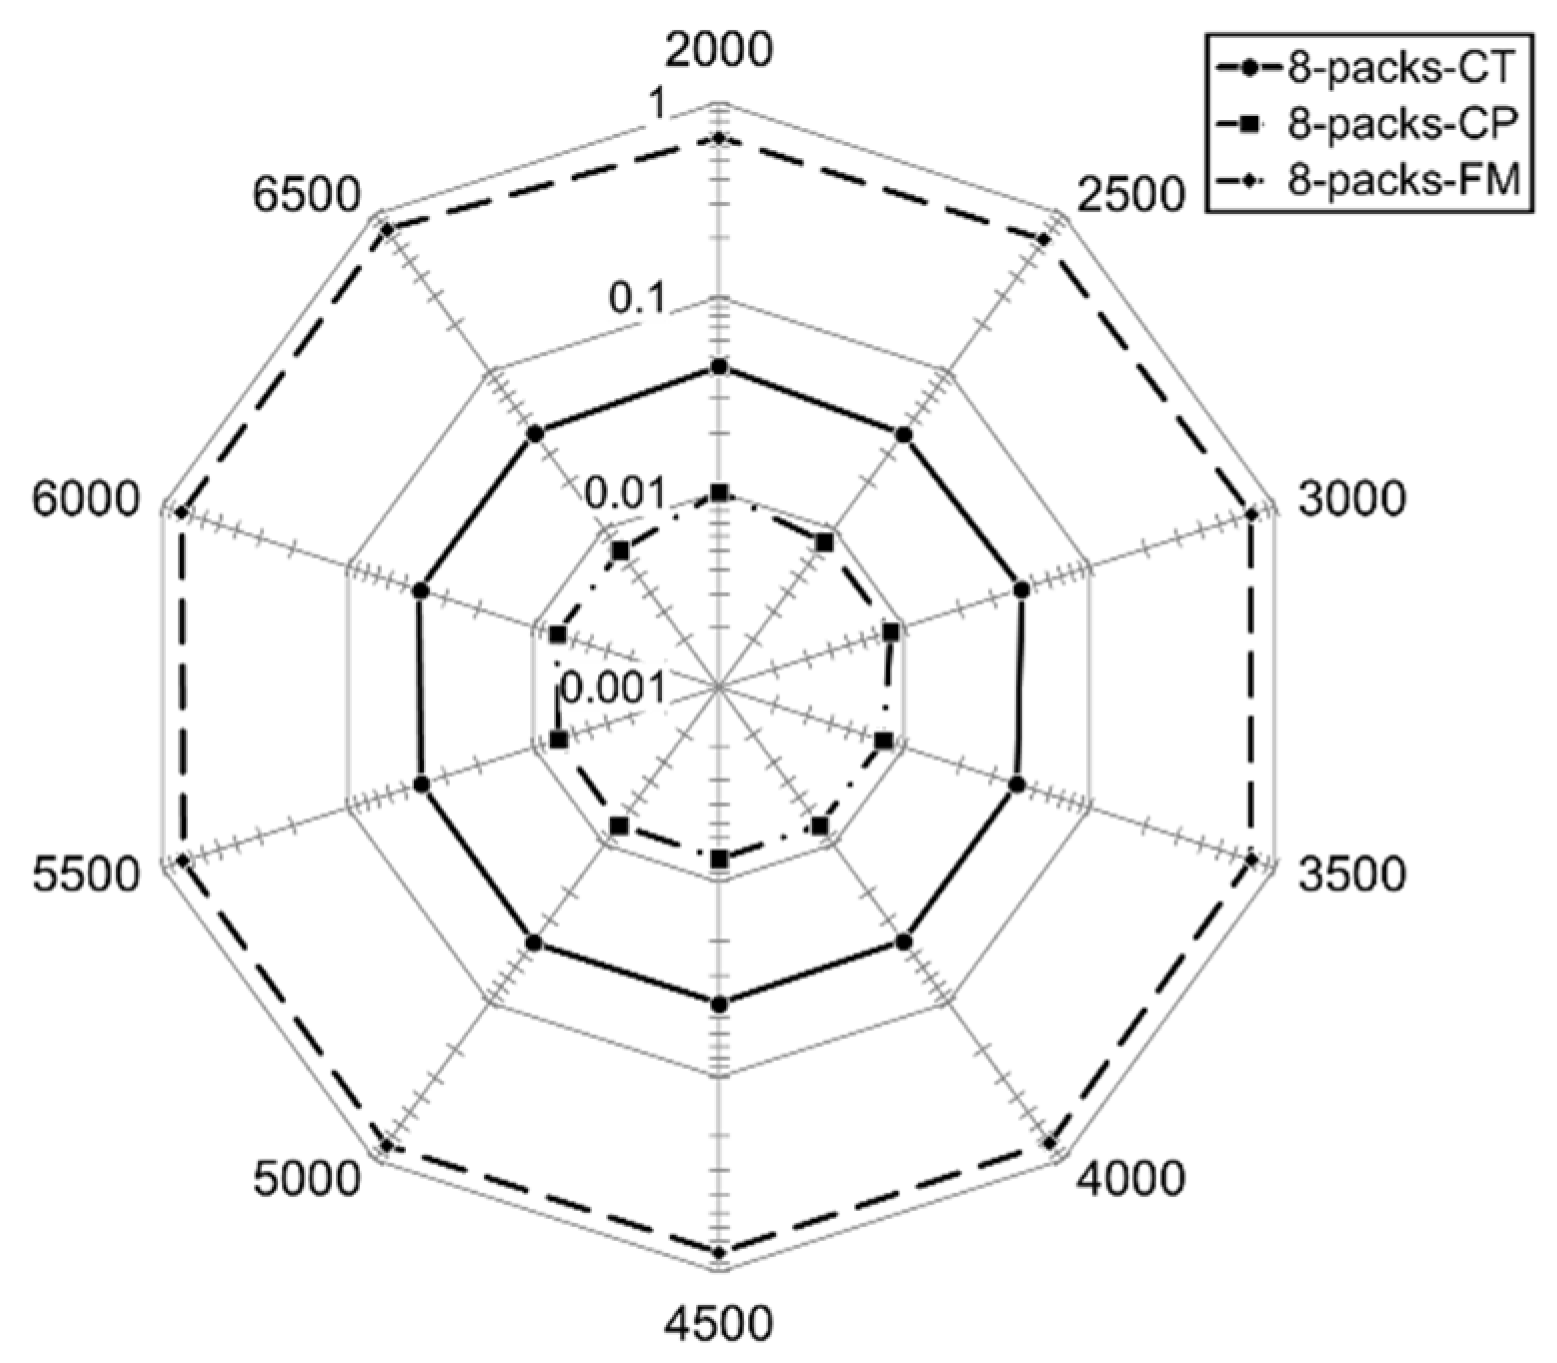
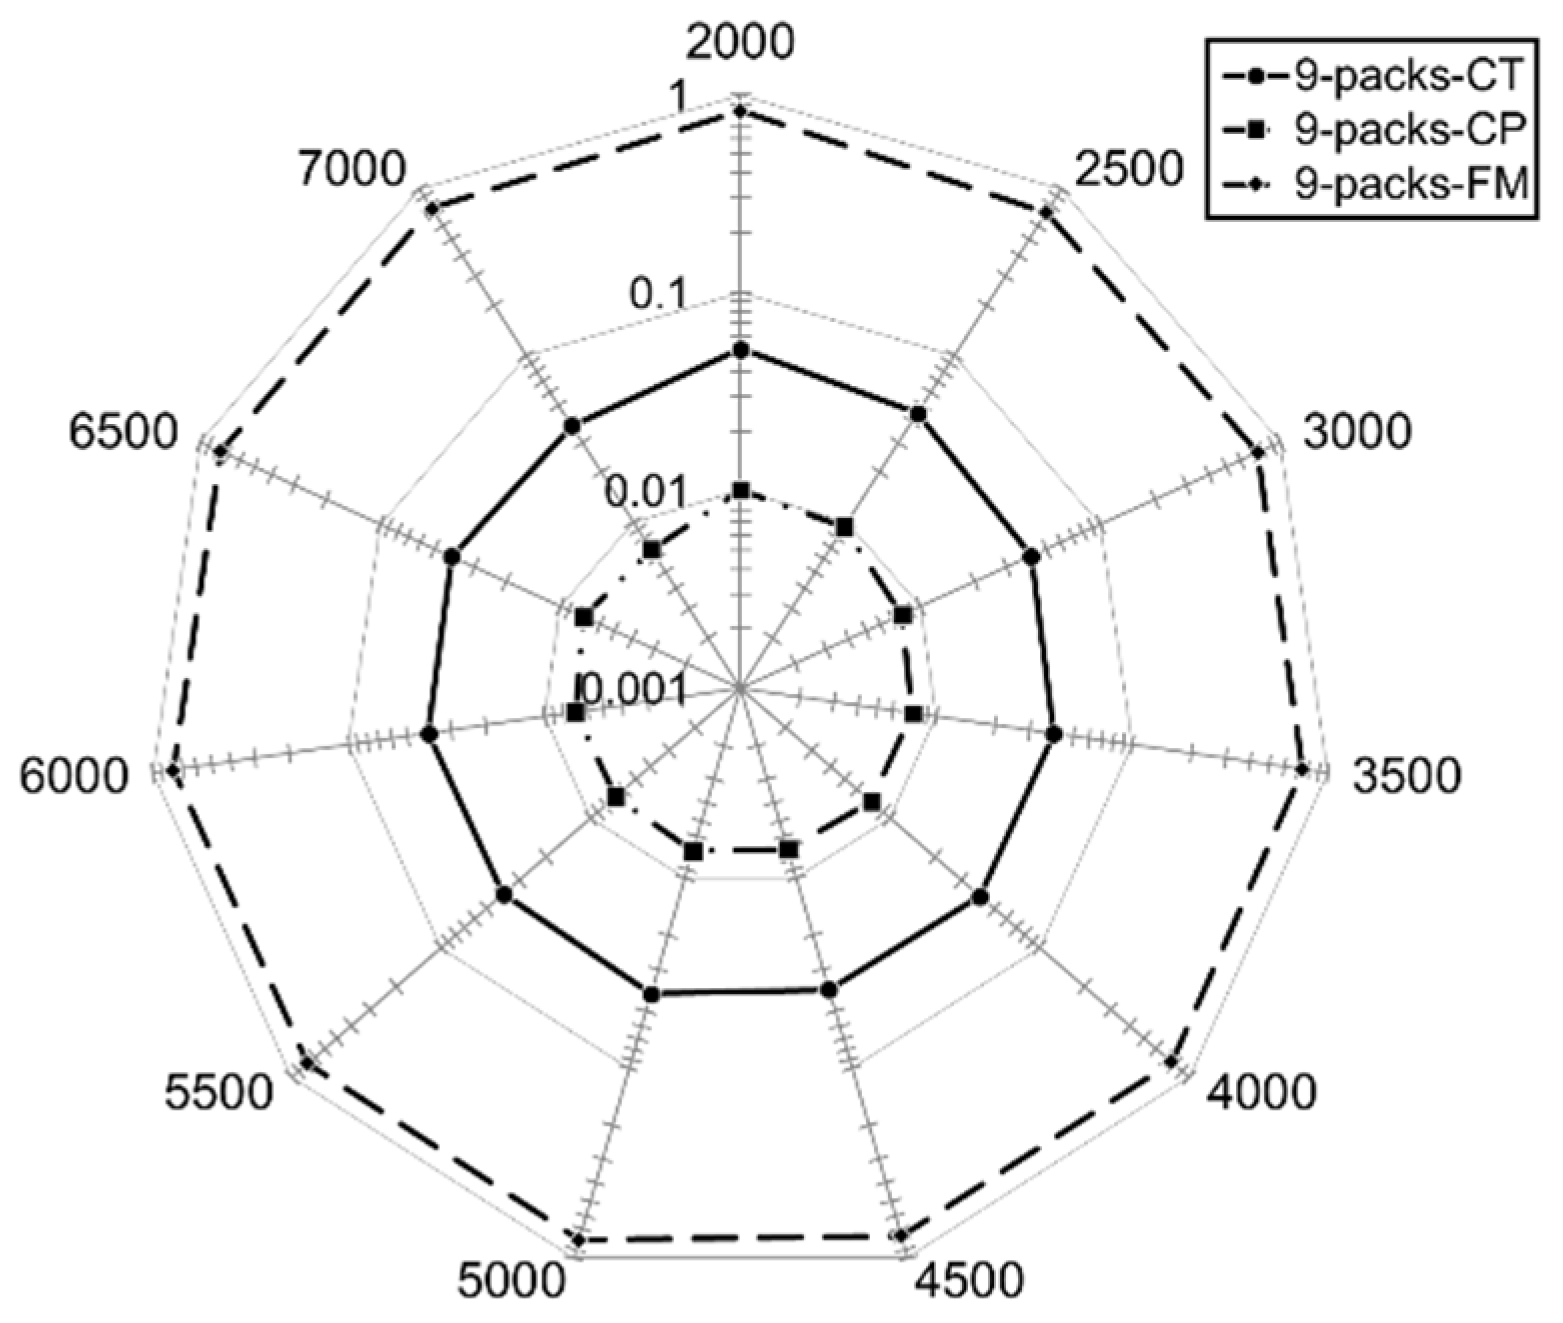
Figure 19.
Radar diagram of CT-CP-FM in the case of 9 battery packs.
2. Text Correction
There was an error in the original publication. Due to the updated values of CT, CP, and FM in the original Figures 14–19, along with the inclusion of the new Figure 17, several paragraphs and specific statements have been revised or expanded. A correction has been made to paragraphs 6 and 7 of Section 4.5. (Non-Dimensional eDPF Data). Moreover, the second sentence of the fourth point in the Conclusions has been expanded:
1. Paragraph 6 of Section 4.5:
At average rotational speeds ranging from 3000 to 6000 rpm (Figure 17), several consistent patterns emerge across both battery configurations. First, a negative correlation is observed between rotational speed and the coordinates of (CP, CT); lower speeds shift the operating points toward the upper-right quadrant, suggesting that the eDPF requires higher energy input to achieve superior thrust. Second, the 5500 rpm case represents the lower bound of the performance curve in both configurations, indicating a state of minimum power consumption and stability, albeit at the cost of the lowest CT. Furthermore, the 8-pack battery configuration exhibits a higher power-to-thrust profile compared to the 9-pack system, as evidenced by its shift toward higher CP and CT values.
2. Bolded terms and the second sentence of Paragraph 7, Section 4.5:
When examining the eight- and nine-battery-pack configurations, as shown in Figures 18 and 19, respectively, it appears that at medium rpms, the thrust and power level remain relatively stable. Meanwhile, at low rpms of 2000 rpm and 2500 rpm, a higher CP value indicates higher energy requirements. In addition, a clear logarithmic trend is observed across both plots, where the closed-loop contours expand in scale as they transition from the CP to the CT, and finally to the FM.
3. The second sentence within the fourth point of the Conclusions:
Performance analysis reveals a consistent 3000–6000 rpm trend, where 5500 rpm marks the minimum power state. The 8-packs configuration offers enhanced thrust through increased power expenditure.
The authors state that the scientific conclusions are unaffected. The supplementary remark in the second sentence of the fourth point in the Conclusion serves solely to clarify the research findings. This correction was approved by the Academic Editor. The original publication has also been updated.
Reference
- Chu, H.-Q.; Dinh, Q.-N.; Vu, T.-S.; Pham, V.-Y.; Bui, V.-T.; Hoang, N.-M.; Nguyen, T.-K.; Nguyen, D.; Pham, G.-D.; Dinh, C.-T. Static Aero-Propulsion Experiment of an Electric Ducted Fan. Aerospace 2025, 12, 509. [Google Scholar] [CrossRef] [Scilit]
Disclaimer/Publisher’s Note: The statements, opinions and data contained in all publications are solely those of the individual author(s) and contributor(s) and not of MDPI and/or the editor(s). MDPI and/or the editor(s) disclaim responsibility for any injury to people or property resulting from any ideas, methods, instructions or products referred to in the content. |
© 2026 by the authors. Licensee MDPI, Basel, Switzerland. This article is an open access article distributed under the terms and conditions of the Creative Commons Attribution (CC BY) license.