1. Introduction
The aerospace industry is currently witnessing a paradigm shift towards satellite containerization and its operations in Very Low Earth Orbits (VLEOs). Operating satellites in VLEOs offers strategic advantages, including higher-resolution Earth observation, reduced communication latency, and natural orbital debris mitigation through atmospheric re-entry [
1]. However, the VLEO environment presents significant aerothermodynamic challenges. The substantially higher atmospheric density in low Earth orbit leads to severe aerodynamic drag and surface erosion due to highly reactive atomic oxygen (O). Furthermore, reproducing these hyperthermal gas–surface interactions in ground-based vacuum chambers is exceedingly difficult and requires complex sub-scaled testing methodologies [
2], reinforcing the critical need for high-fidelity numerical models to predict satellite performance in this chemically aggressive regime.
Historically, the CubeSat standard democratized access to space by providing a modular and cost-effective platform [
3]. Successful missions such as NASA’s Nanosail-D2 and Chile’s SUCHAI-1 demonstrated the utility of nanosatellites for scientific research [
4,
5]. Nevertheless, as mission requirements evolve toward high-power payloads, the CubeSat’s cubic form factor has reached its volumetric limits. The limited surface area of solar cells often necessitates complex deployable mechanisms, increasing failure risk. In response, the industry is shifting towards novel planar architectures designed specifically for containerization and use in VLEO, such as the hexagonal HexSat [
6] and the circular DiskSat concept [
7,
8].
The DiskSat architecture features a plate-shaped geometry, typically 1.0 m in diameter and 2.5 cm thick, that maximizes the area-to-mass ratio. This expansive, rigid surface is particularly advantageous for next-generation payloads, such as Synthetic Aperture Radar (SAR) antennas, which require large apertures for high-resolution ground imaging—a capability validated in recent mission concepts for mega-constellations [
9]. Furthermore, recent technology demonstrations by NASA and The Aerospace Corporation have confirmed the mechanical flight readiness of this architecture [
10].
Despite these mechanical and operational advancements, the aerodynamic behavior of such a large planar body in the VLEO regime remains underexplored. At these altitudes, the flow physics are governed by the Knudsen number (
), which defines the transition from continuum to free-molecular flow. In the transition regime (
), the Navier–Stokes equations fail to capture non-equilibrium phenomena, requiring particle-based methods, such as Direct Simulation Monte Carlo (DSMC), to compute rarefied gas flows around the satellite [
11].
Recent studies have explored attitude determination and control systems (ADCS) for DiskSats to mitigate aerodynamic disturbances in ultra-low orbits [
12]. However, the effectiveness of these control strategies inherently relies on accurate aerodynamic predictions. While DSMC has been extensively validated for re-entry capsules [
13] and standard 10 cm CubeSats [
14], the literature on the macroscopic flowfields for planar satellites remains sparse. Most existing aerodynamic databases rely on scaling laws derived from smaller geometries, which fail to accurately capture the diffuse shock-layer expansion and the expansive, thermally frozen wake unique to a 1-meter-diameter plate under rarefied conditions.
Therefore, the primary research objective of this study is to establish a fundamental aerothermodynamic baseline for DiskSats operating in VLEO. In doing so, the present investigation aims to characterize the macroscopic flowfield structure around the DiskSat at altitudes between 100 and 200 km. By isolating these flow physics, this work provides the critical aerodynamic data required for future mission design and orbital stability analyses.
2. Computational Method
The appropriate numerical technique for simulating gas dynamics depends on the gas’s degree of rarefaction, quantified by the Knudsen number (
). For cases of low rarefaction (
), a continuum approach is suitable, as the gas behavior aligns with the Maxwellian velocity distribution. However, when the Knudsen number exceeds 0.05, continuum-based models become inadequate, and a molecular-level approach is required. This approach accounts for the motion of individual molecules and involves solving the Boltzmann equation [
15]. Given the complexity of solving the Boltzmann equation directly, the Direct Simulation Monte Carlo (DSMC) technique [
11,
16,
17,
18] has been chosen for this work.
The DSMC method is a versatile tool applicable to the entire range of rarefied flows. Rooted in the kinetic theory of gases [
16,
19], it employs a particle-based approach, where a finite number of simulated particles represent a large number of physical molecules. This framework allows molecular motion to be decoupled from molecular collisions across discrete time steps (
), provided these are kept small relative to the local mean collision time [
20].
To accurately represent flow properties and determine probable collision pairs, the DSMC method uses a computational cell grid to discretize the computational domain [
11]. For reliable results, the cell size is constrained by the local mean free path (
), and an adequate number of particles per cell is required to avoid statistical biases [
21,
22].
The results in this study were obtained using the open-source solver dsmcFoam+ [
23,
24] within the OpenFOAM framework. A key advantage of this solver is its ability to handle arbitrary unstructured meshes, enabling complex geometries—such as the DiskSat—to be meshed efficiently without the constraints of structured grids often found in legacy DSMC codes. dsmcFoam+ supports parallel simulations (MPI) and includes features for modeling internal energy exchange, chemical reactions, and surface interaction models.
To accurately replicate the physics of the VLEO environment, the following models are employed:
Collision Model: The Variable Hard Sphere (VHS) model [
11] is used to calculate collision probabilities and scattering angles. This model accounts for the temperature dependence of viscosity, which is critical in hypersonic flows.
Sampling Algorithm: Binary collisions are selected using the No Time Counter (NTC) algorithm, which ensures computational efficiency linear to the number of particles. Eight sub-cells per computational cell were utilized to improve the selection of nearest-neighbor collision pairs.
Energy Exchange: The Larsen–Borgnakke model [
25] is applied to manage the relaxation of internal energy, specifically the rotational degrees of freedom for diatomic species (
,
).
Chemistry: Chemical reactions and high-temperature gas effects, including vibrational excitation, were neglected to establish a conservative baseline for aerothermodynamic loads.
Gas–Surface Interaction: The Maxwellian diffuse reflection model is applied at the satellite surfaces, assuming full thermal accommodation.
3. Validation and Verification
To ensure the reliability of the numerical results presented in this study, a comprehensive validation and verification process was conducted using the dsmcFoam+ solver [
26]. The assessment relies on a standard benchmark in rarefied gas dynamics: the hypersonic flow over a flat plate [
27]. The following subsections detail the simulation setup, followed by validation against the data available in the open literature and verification of the computational code.
3.1. Benchmark Simulation Setup
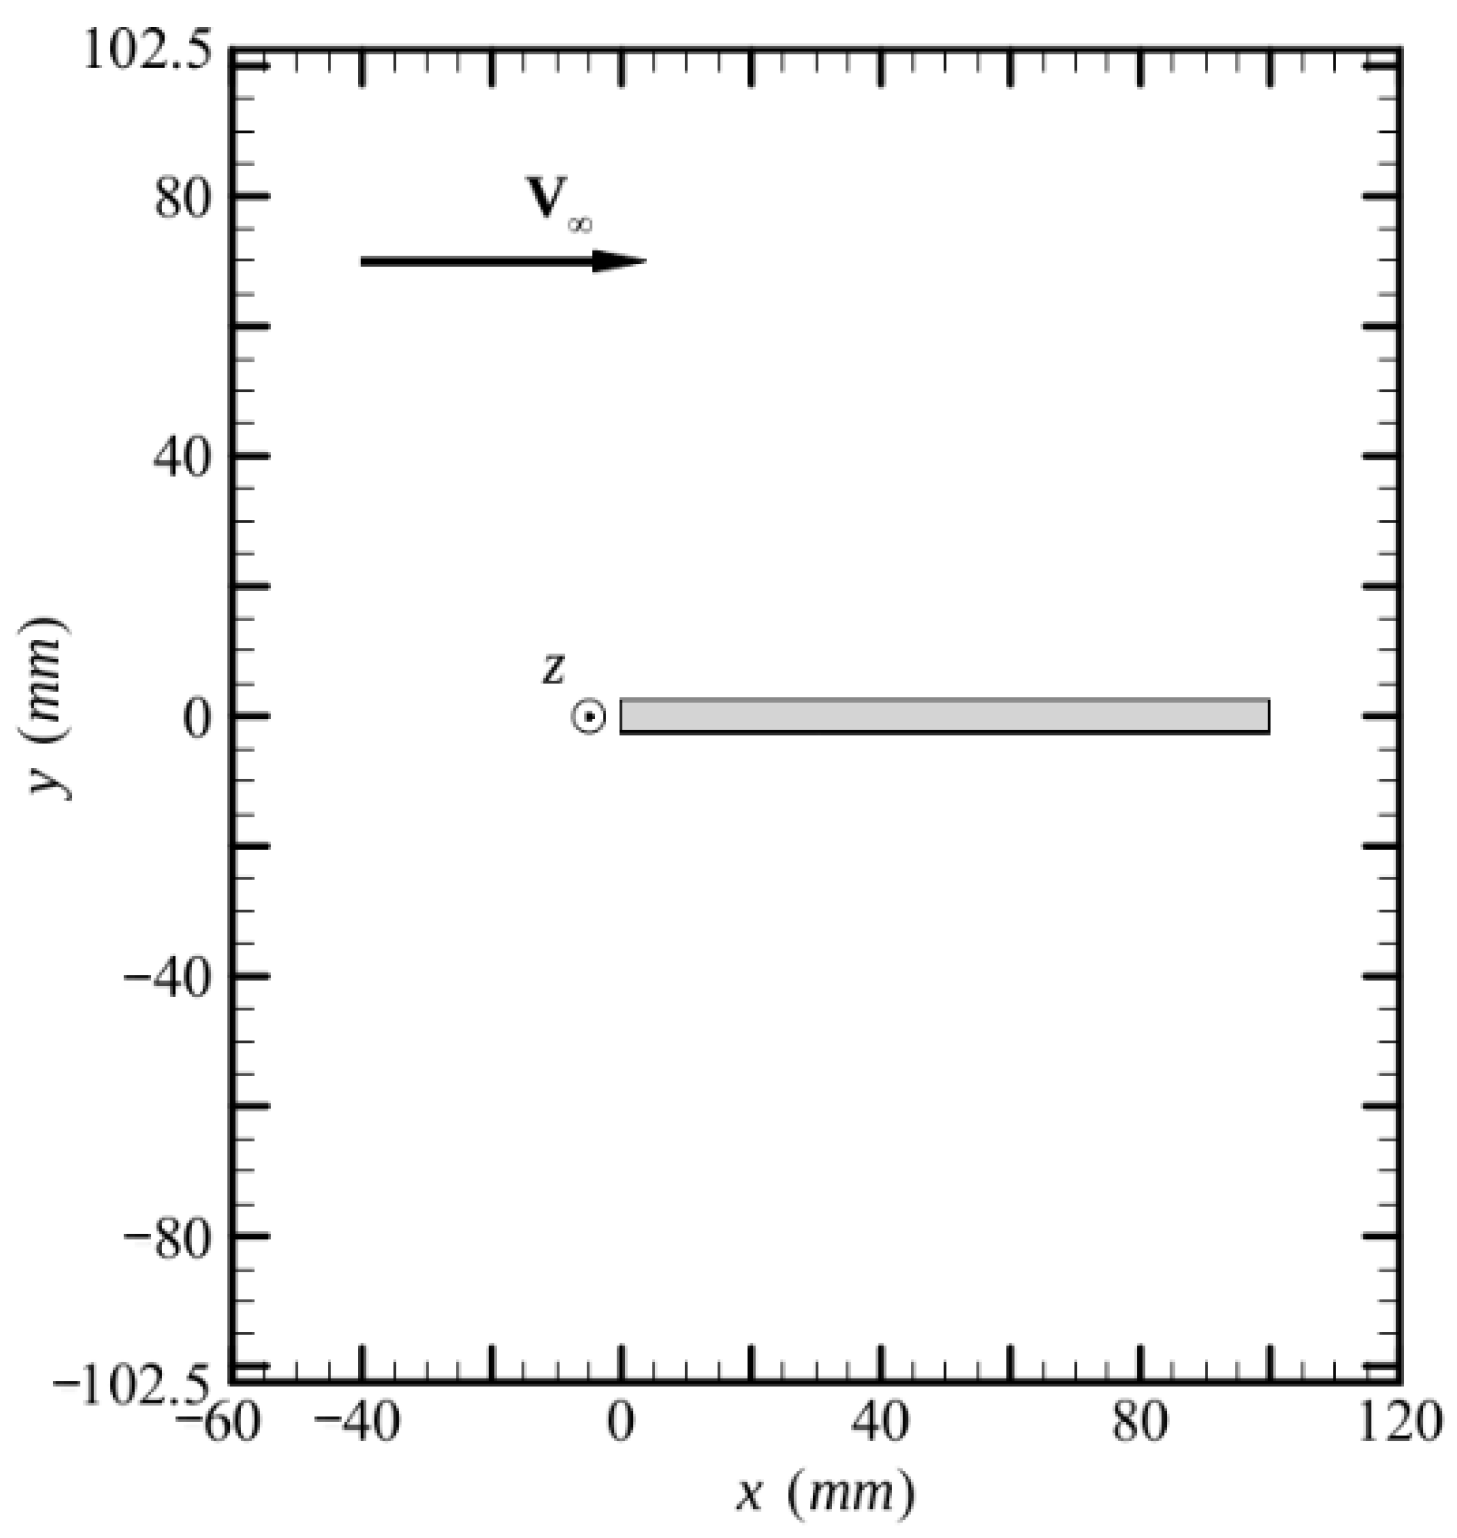
The simulation configuration replicates the benchmark defined by Padilla [
27]. The geometry consists of a sharp flat plate with length
mm and width 5 mm. The Variable Hard Sphere (VHS) and Larsen–Borgnakke models are used to compute molecular collisions and manage energy exchange, respectively. The No Time Counter (NTC) sampling algorithm is used to ensure computational efficiency. The computational domain and boundary conditions are illustrated in
Figure 1.
The molecular properties of nitrogen gas are shown in
Table 1, and the freestream conditions that define the high-velocity freestream are detailed in
Table 2. Finally, the discrete numerical parameters and sampling criteria used to ensure the statistical convergence of the DSMC solver are summarized in
Table 3.
3.2. Validation Results
The results obtained in this work are compared with numerical data generated by Padilla [
27] using two DSMC codes, DAC and MONACO.
Since the primary objective is to characterize the flow structure over the DiskSat at different altitudes, the validation focuses on the contours of the macroscopic properties.
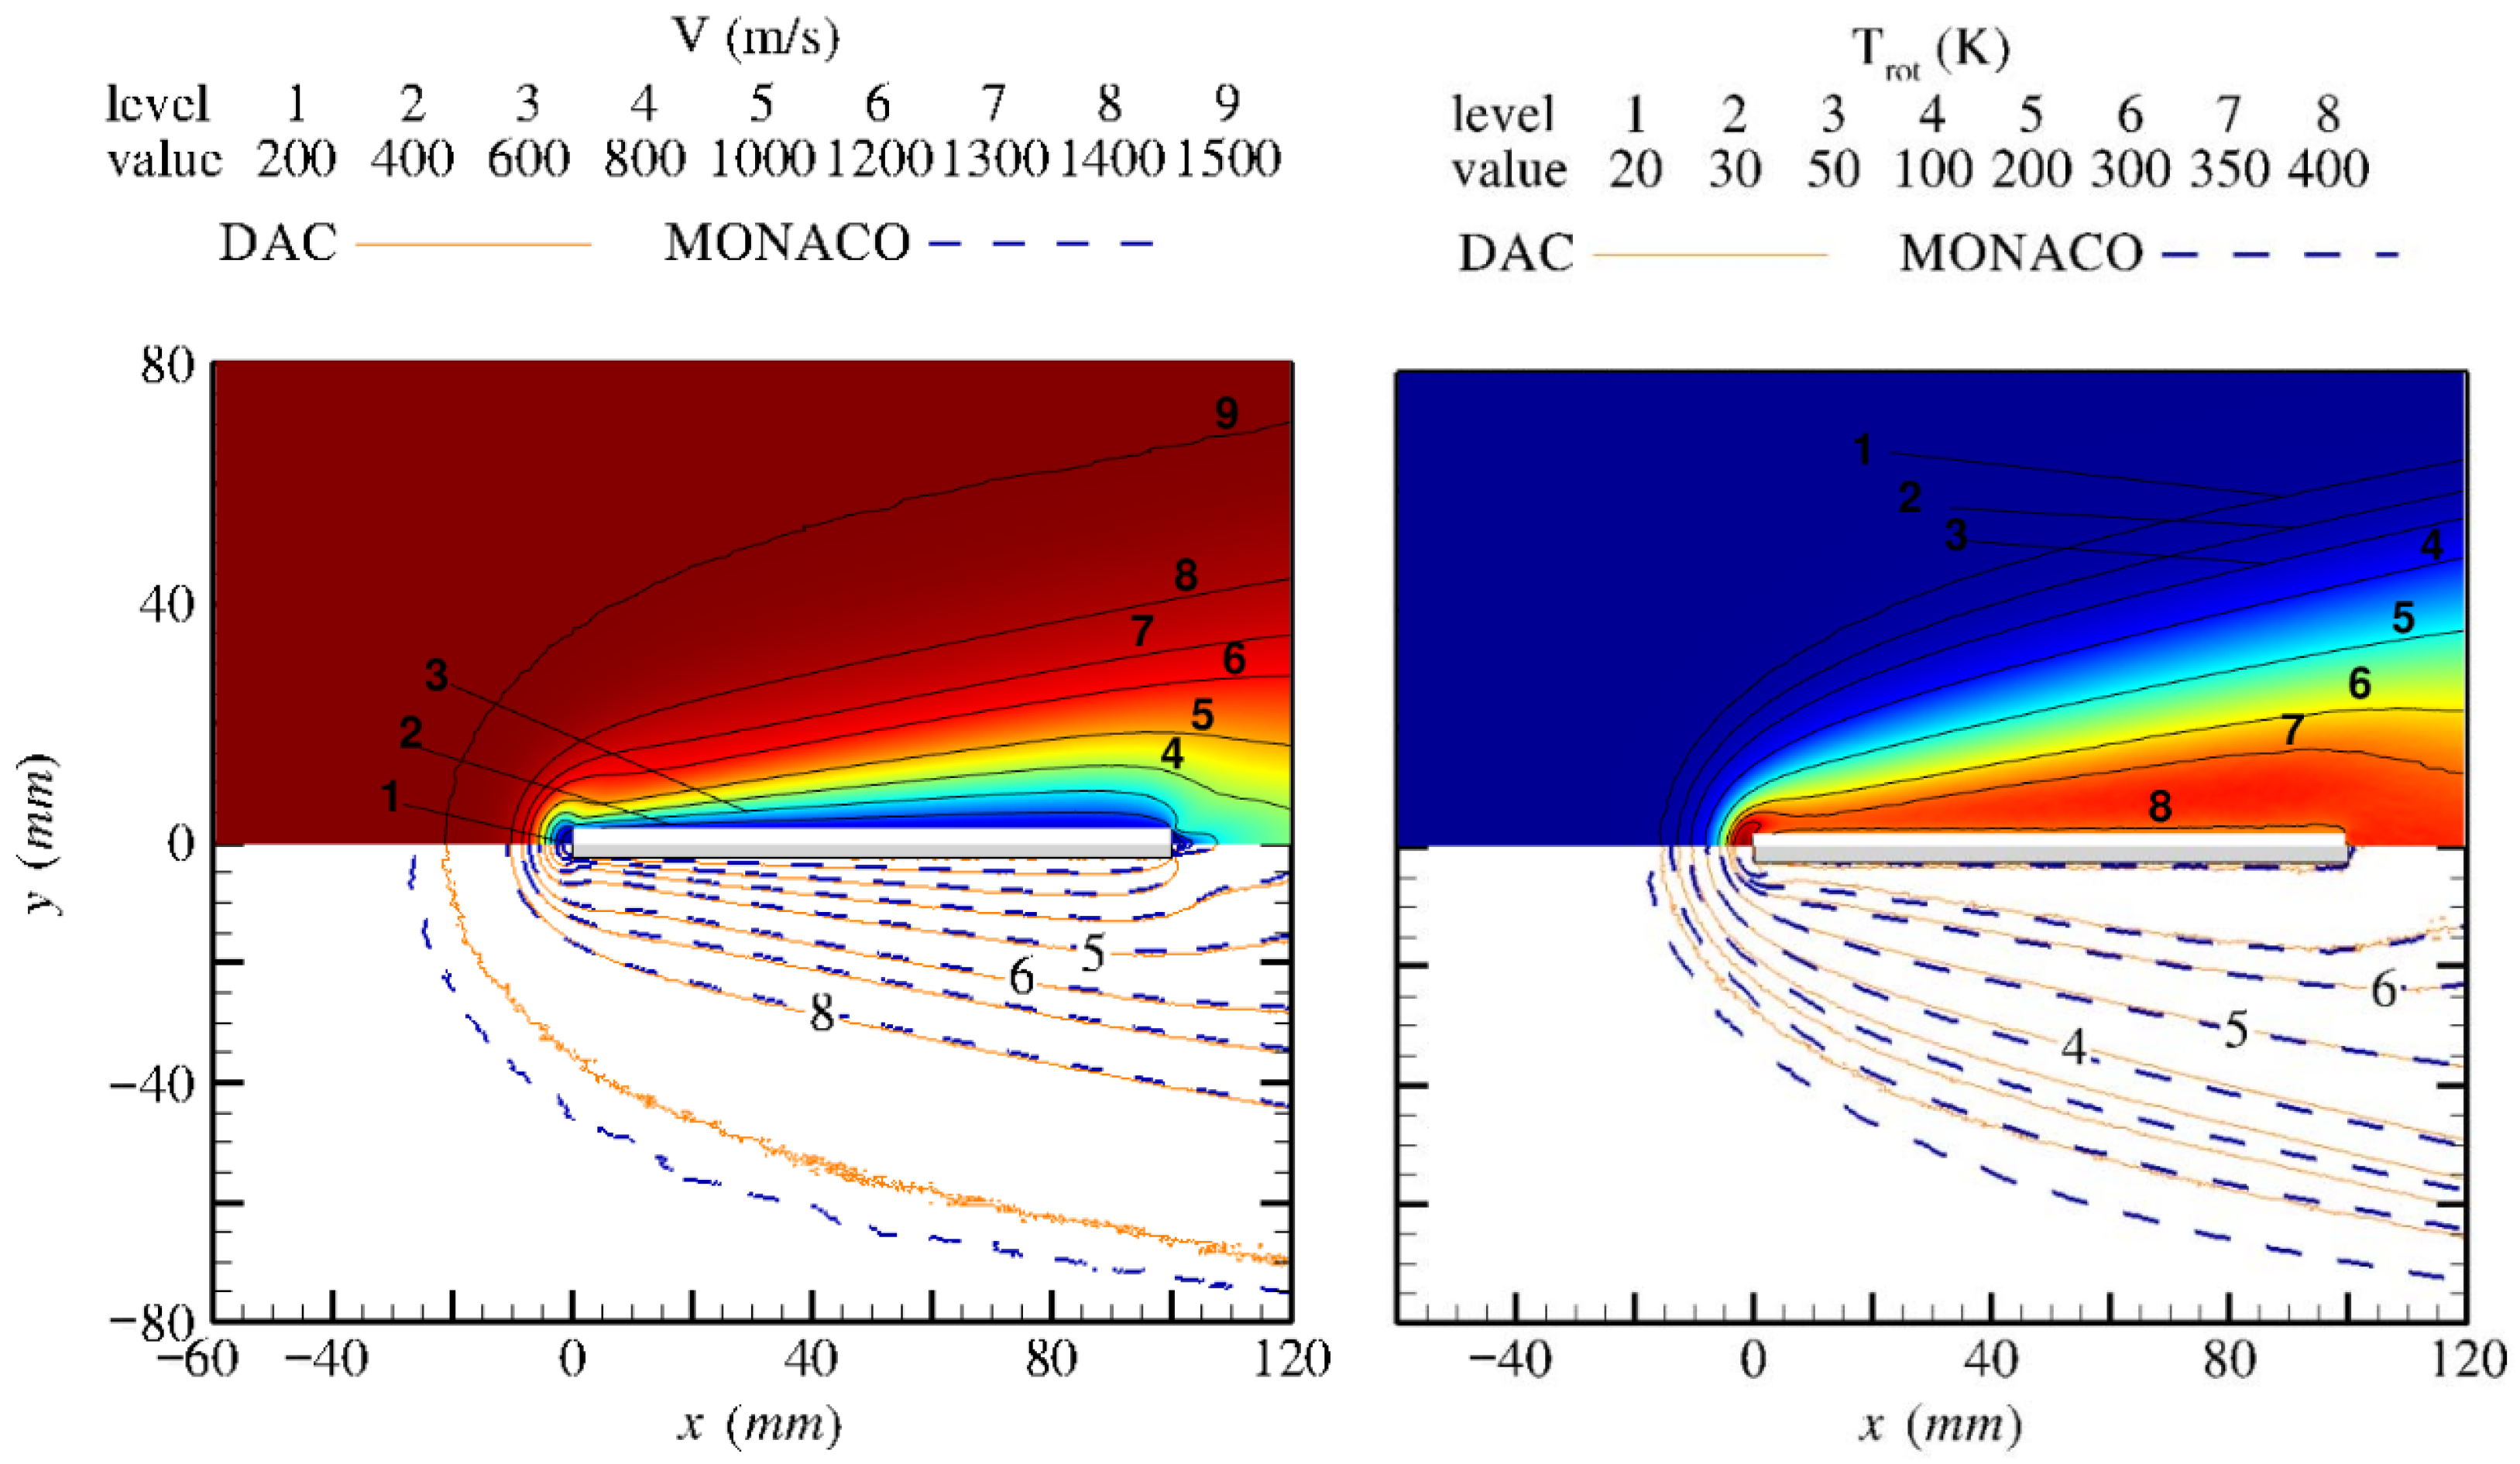
Figure 2 presents a comparison of the rotational temperature and velocity isolines. As shown in
Figure 2 on the left, the velocity field yields excellent agreement with the DAC solver. In addition, dsmcFoam+ and DAC accurately captured the shock wave and boundary-layer growth as the flow developed over the flat plate. Similarly, the rotational temperature contours in
Figure 2 on the right confirm that the Larsen–Borgnakke model is correctly implemented, reproducing the thermal relaxation zone behind the shock wave.
3.3. Verification Results
To assess the simulation’s numerical robustness, a sensitivity analysis was performed on the benchmark flat-plate geometry. Four critical discretization parameters were examined: time-step size, grid resolution, number of particles per cell (PPC), and the sampling interval. The analysis focuses on the influence of the computational parameters on the velocity, density, temperature, and pressure ratios measured along the stagnation streamline.
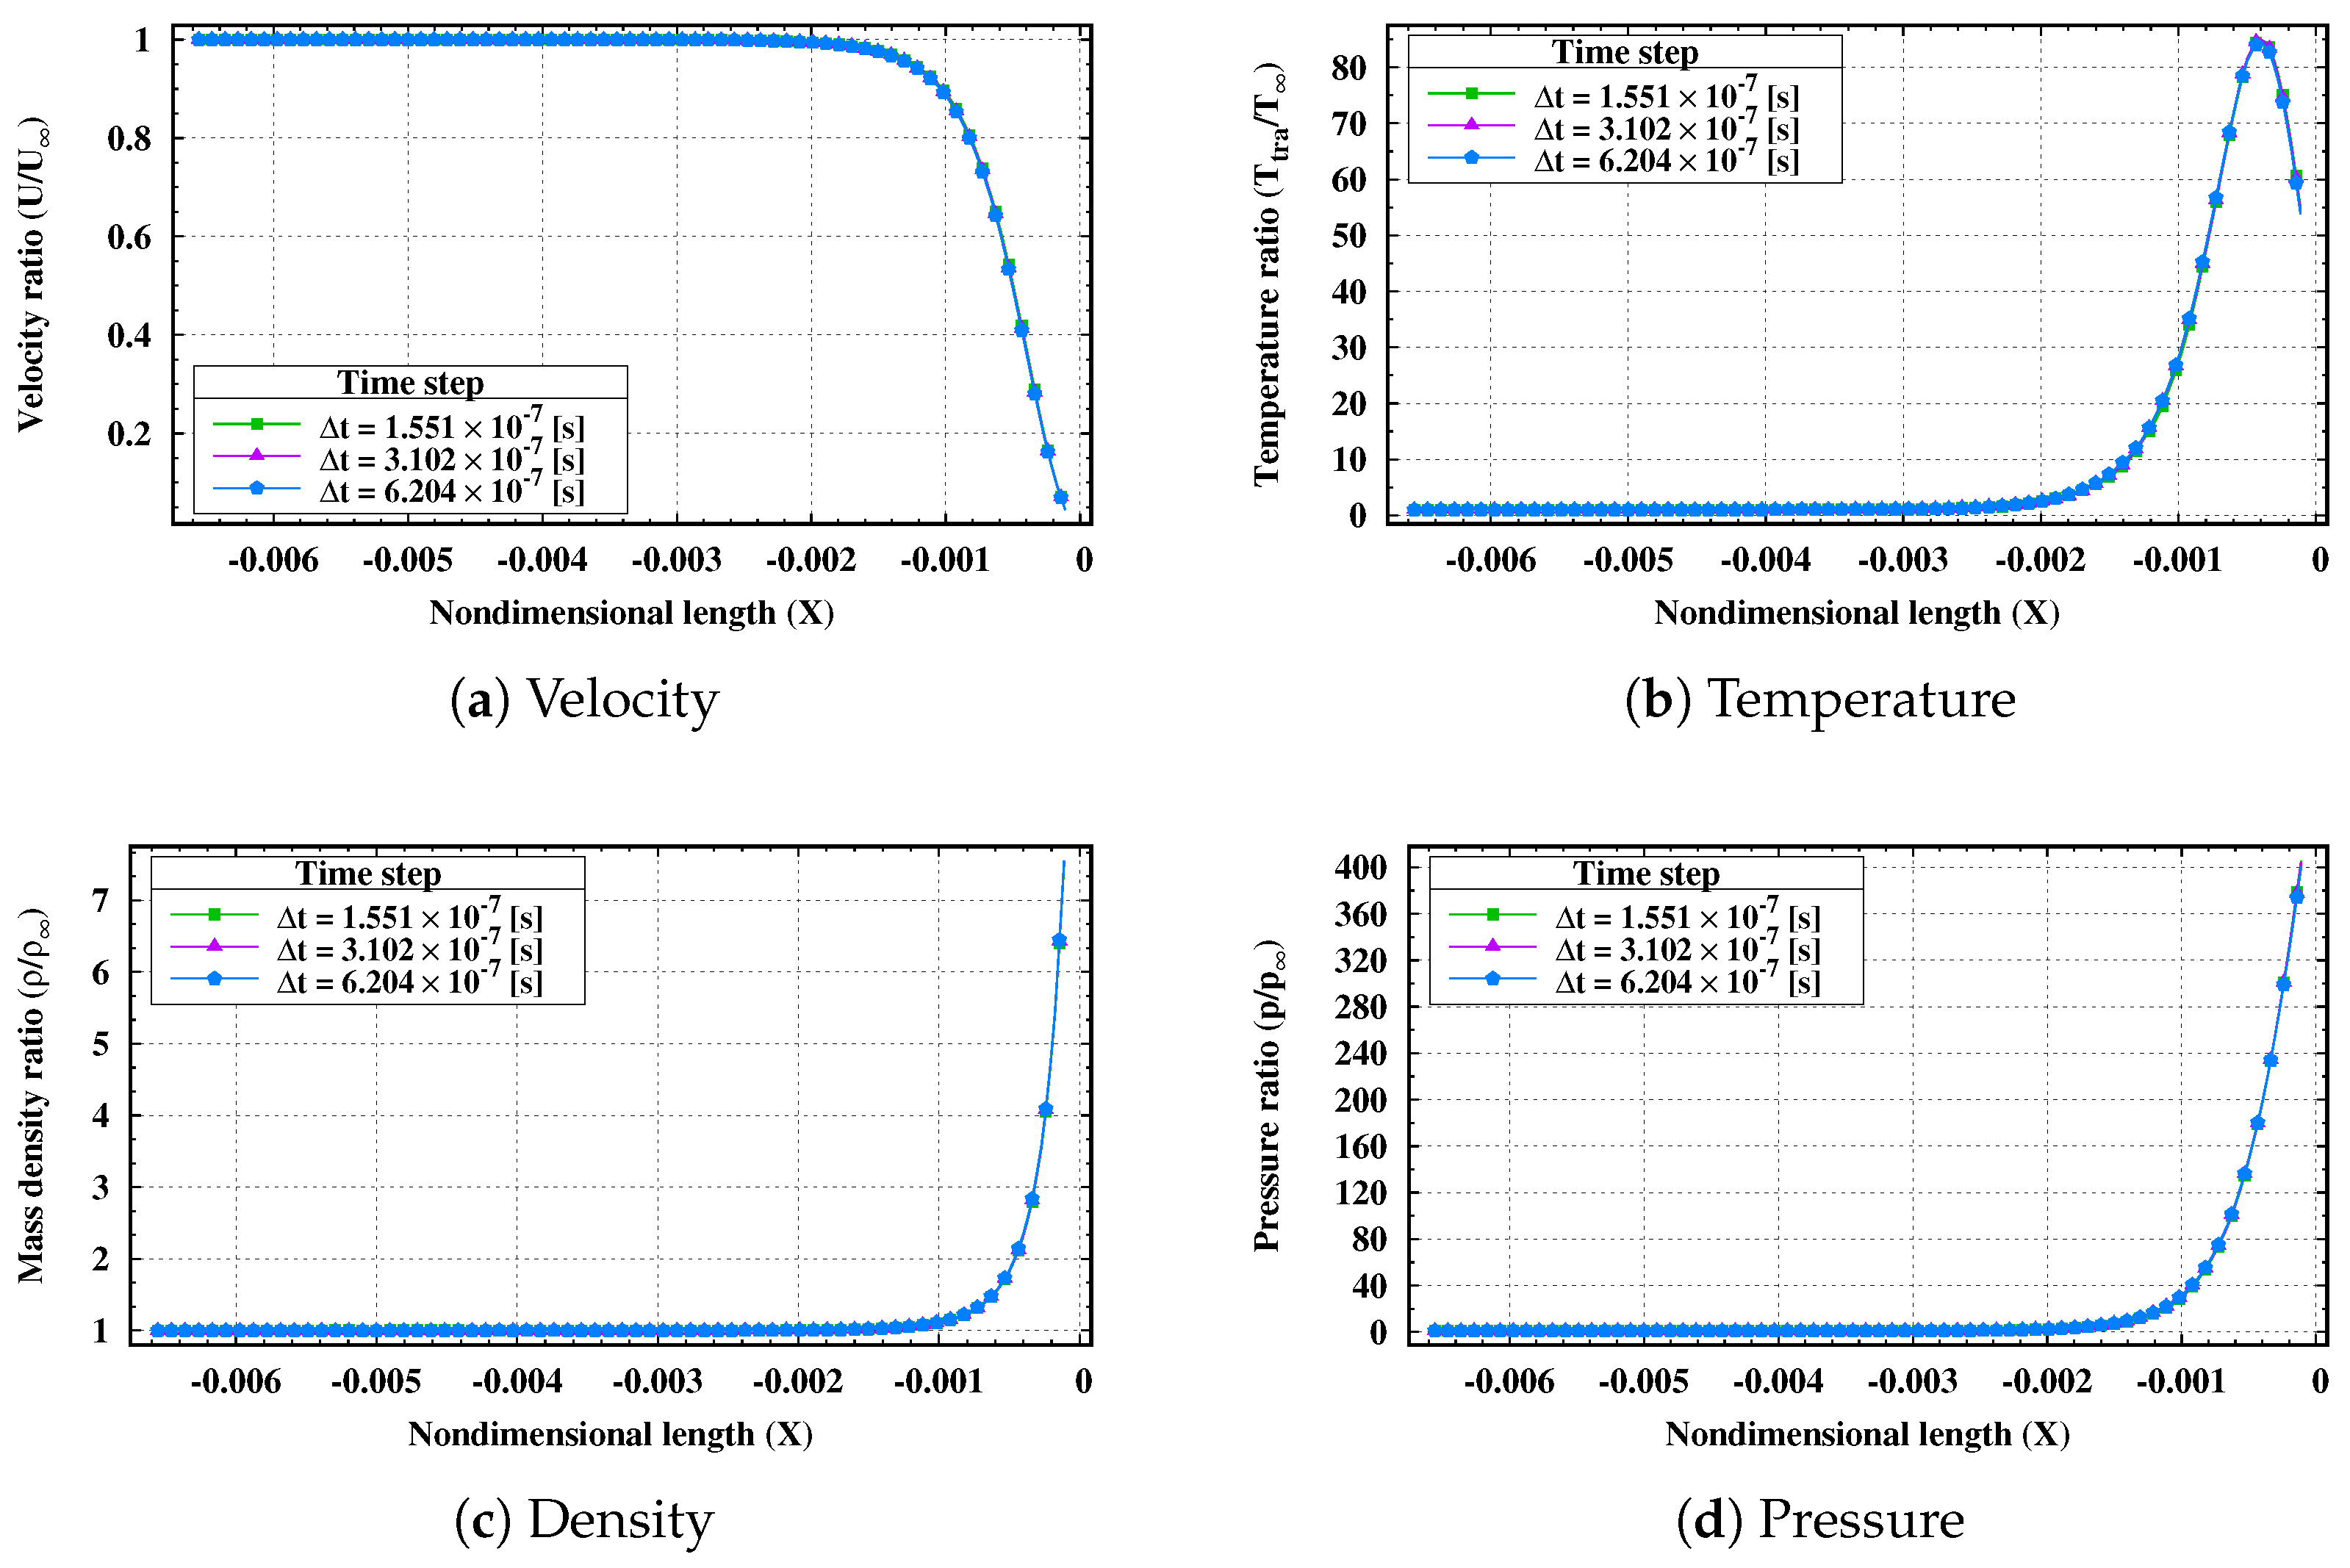
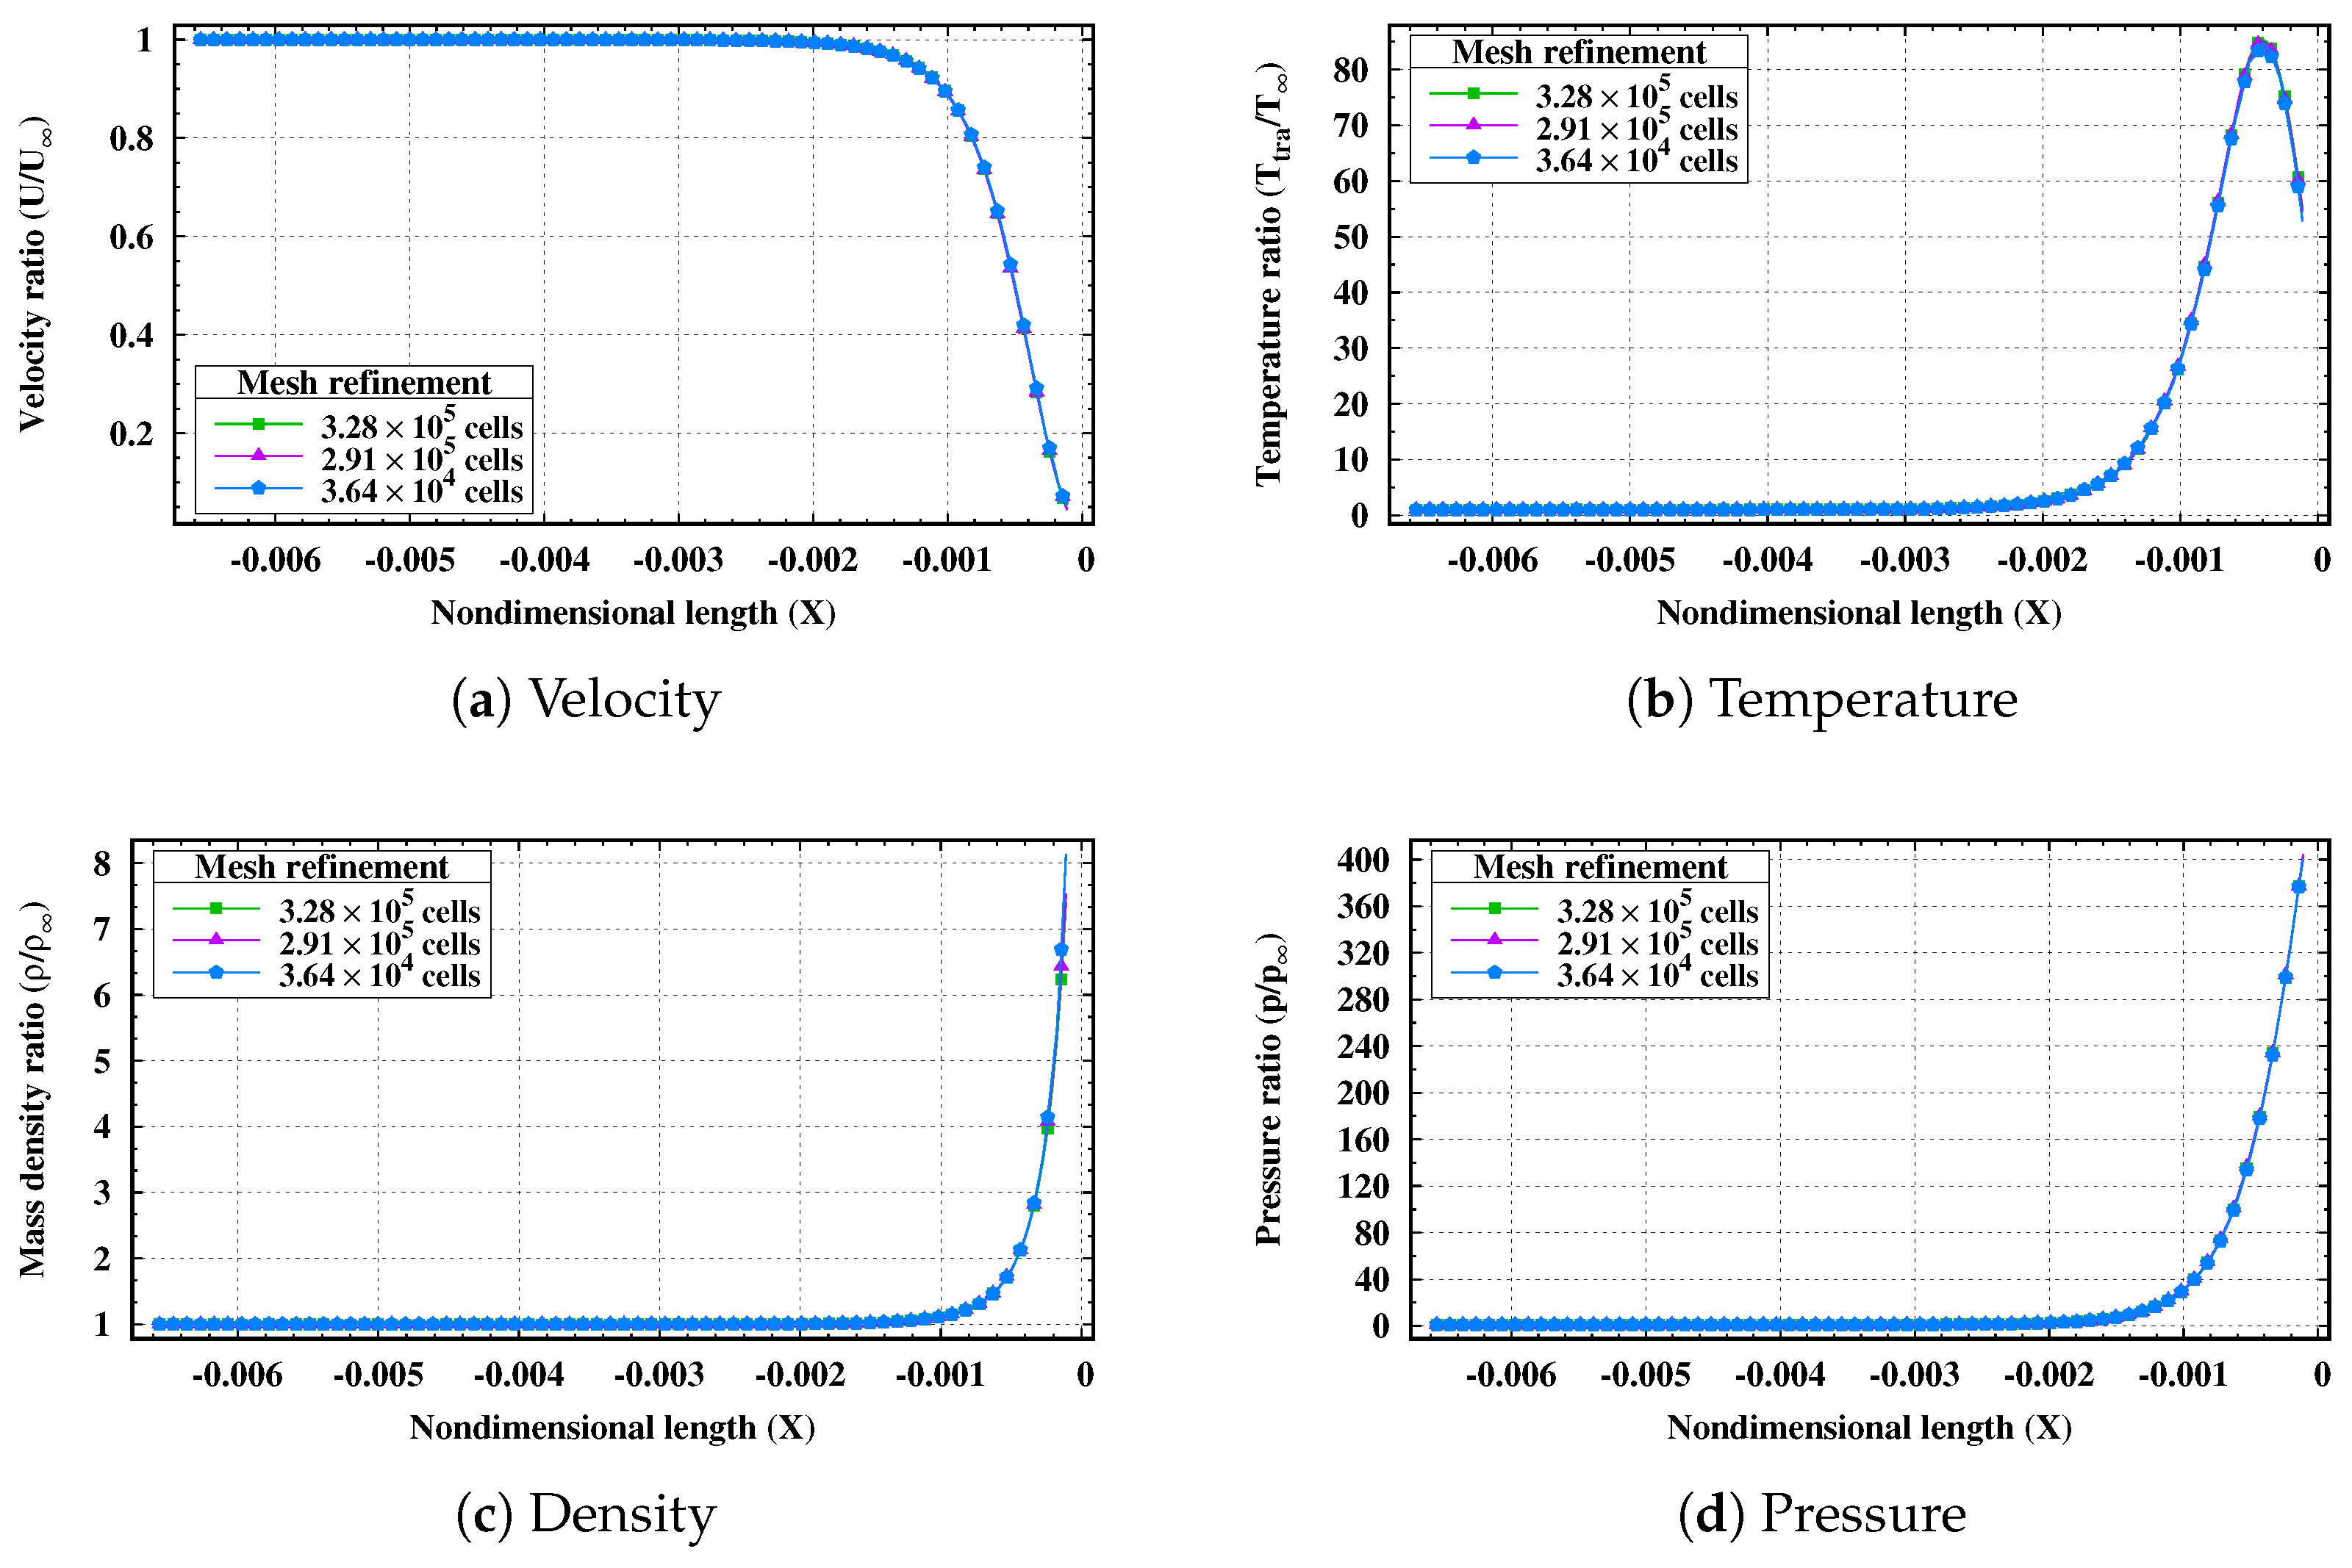
In DSMC, the time step () must be smaller than the local mean collision time () to effectively decouple particle motion from intermolecular collisions. The baseline simulation utilized s. To verify temporal independence, simulations were conducted by doubling and halving this value.
According to
Figure 3, the macroscopic profiles overlap almost perfectly, indicating that the baseline time step is sufficiently small to capture the collision physics without introducing temporal discretization errors.
The spatial resolution in DSMC must be sufficient to resolve macroscopic gradients, requiring the local cell size to be smaller than the gas mean free path (). In this study, the Standard mesh was constructed to satisfy the criterion in the flow direction, yielding a total of computational cells.
To verify grid independence, this configuration was compared with two alternative unstructured grids: a Coarse mesh with cells and a Fine mesh with cells.
Due to the unstructured mesh and local surface refinement, the number of cells is different for each case considered in the present investigation. As shown in
Figure 4, the macroscopic profiles are identical for all meshes, which validates that the flow structure is independent of the computational mesh.
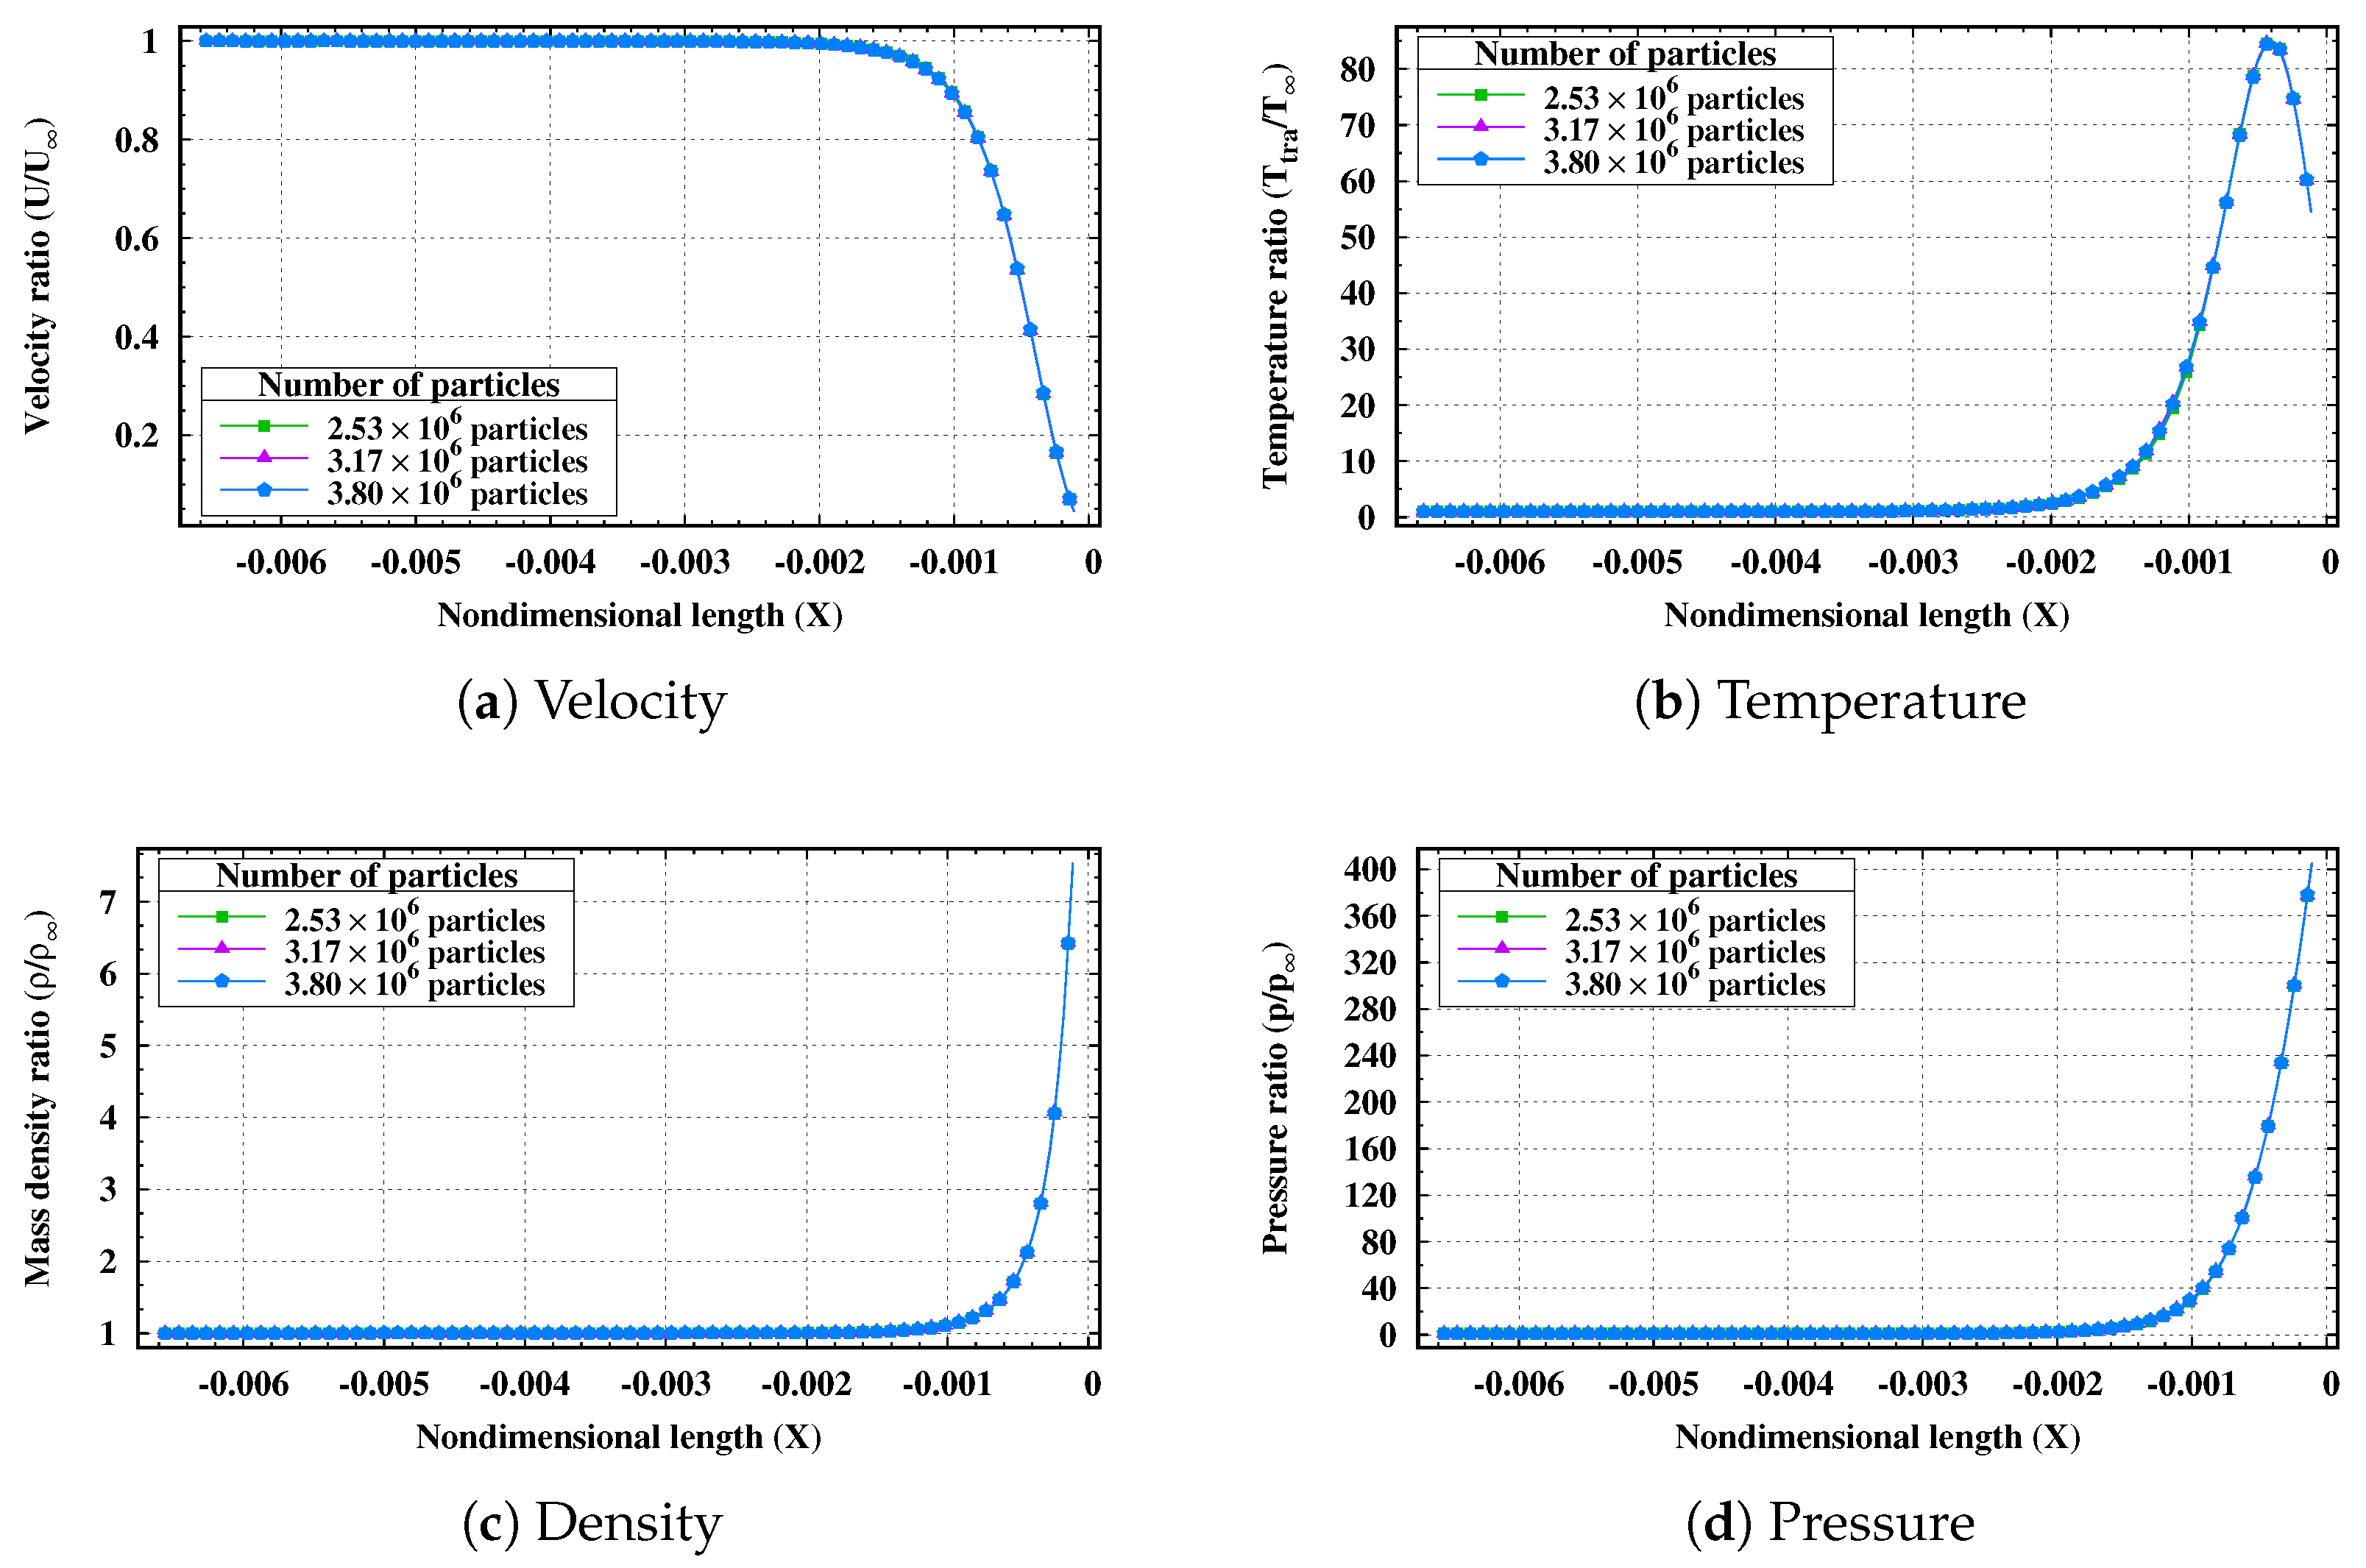
To assess the impact of statistical noise, the number of simulated particles was varied. The standard case maintained approximately 10 particles per cell (PPC), resulting in a total population of particles.
Results were compared with simulations using 8 and 12 PPC, corresponding to
and
total particles, respectively.
Figure 5 demonstrates that the time-averaged macroscopic properties are independent of the PPC count within this range, confirming that 10 PPC is sufficient to suppress statistical scatter for steady-state sampling.
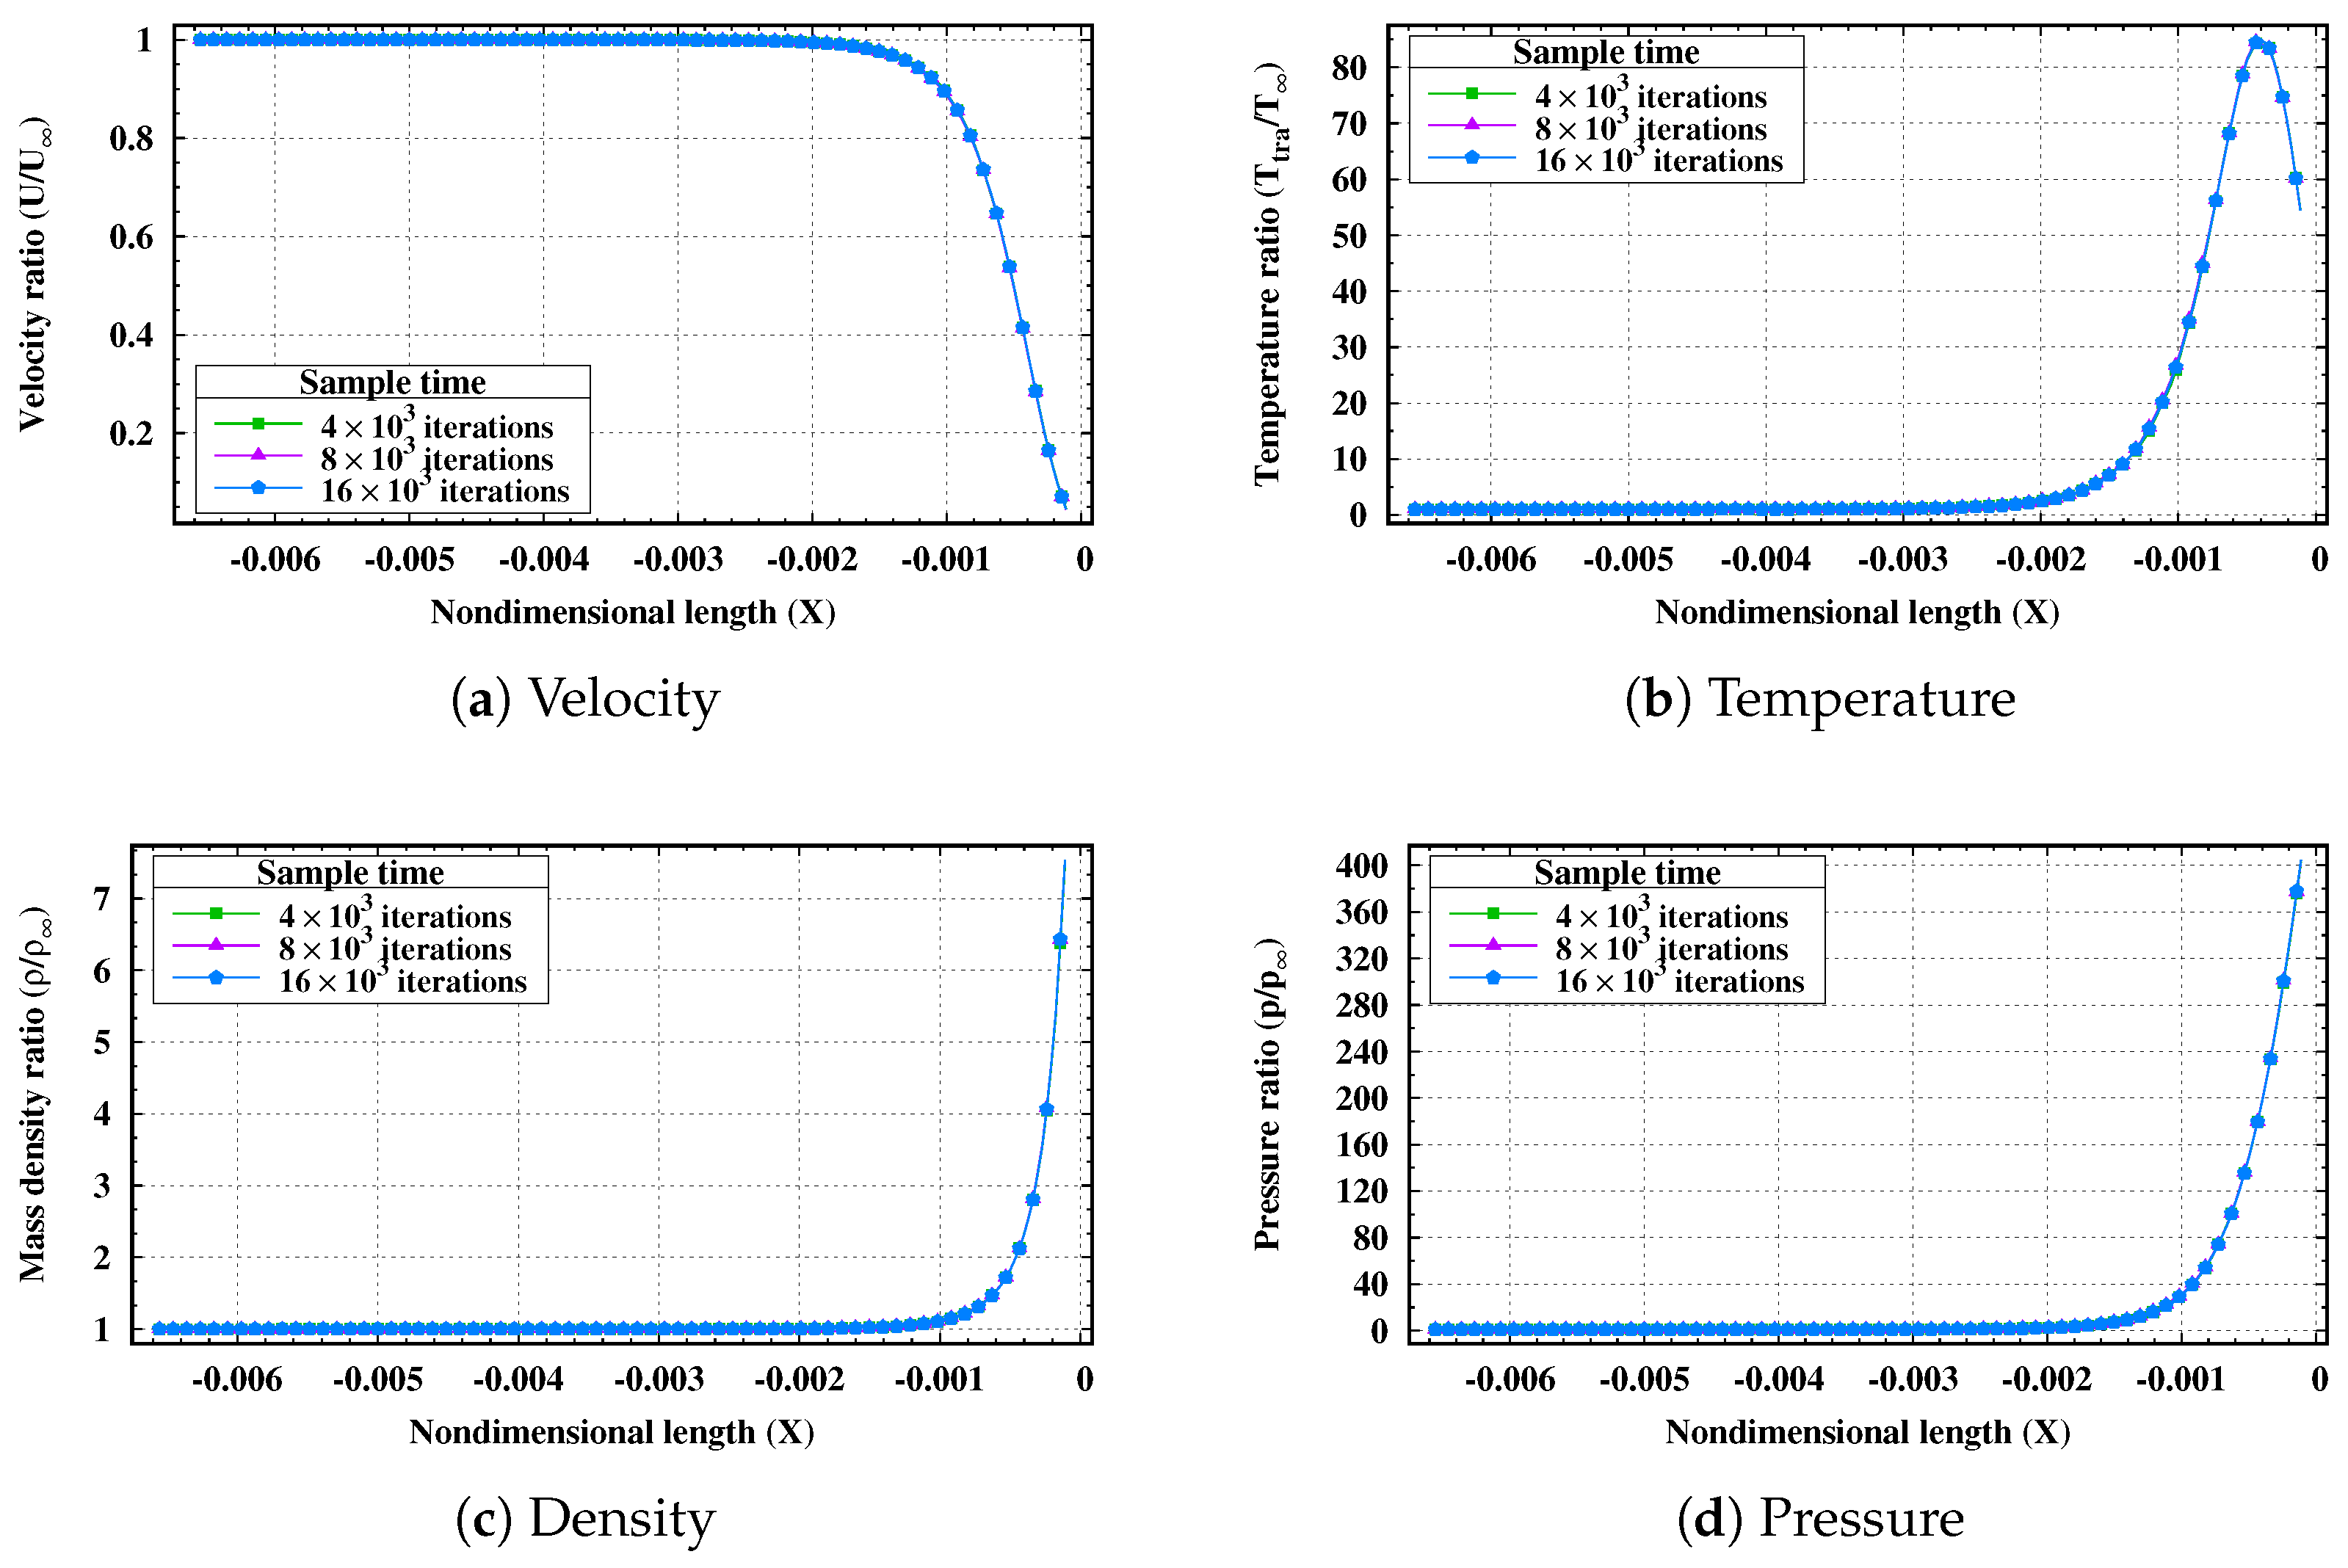
Finally, the convergence of the time-averaging process was examined. The standard simulation averaged properties over iterations. This was compared against shorter () and longer () sampling windows.
As shown in
Figure 6, all sampling intervals produced identical mean flow profiles. This confirms that the standard number of samples is sufficient to obtain statistically stationary results.
4. Simulation Description
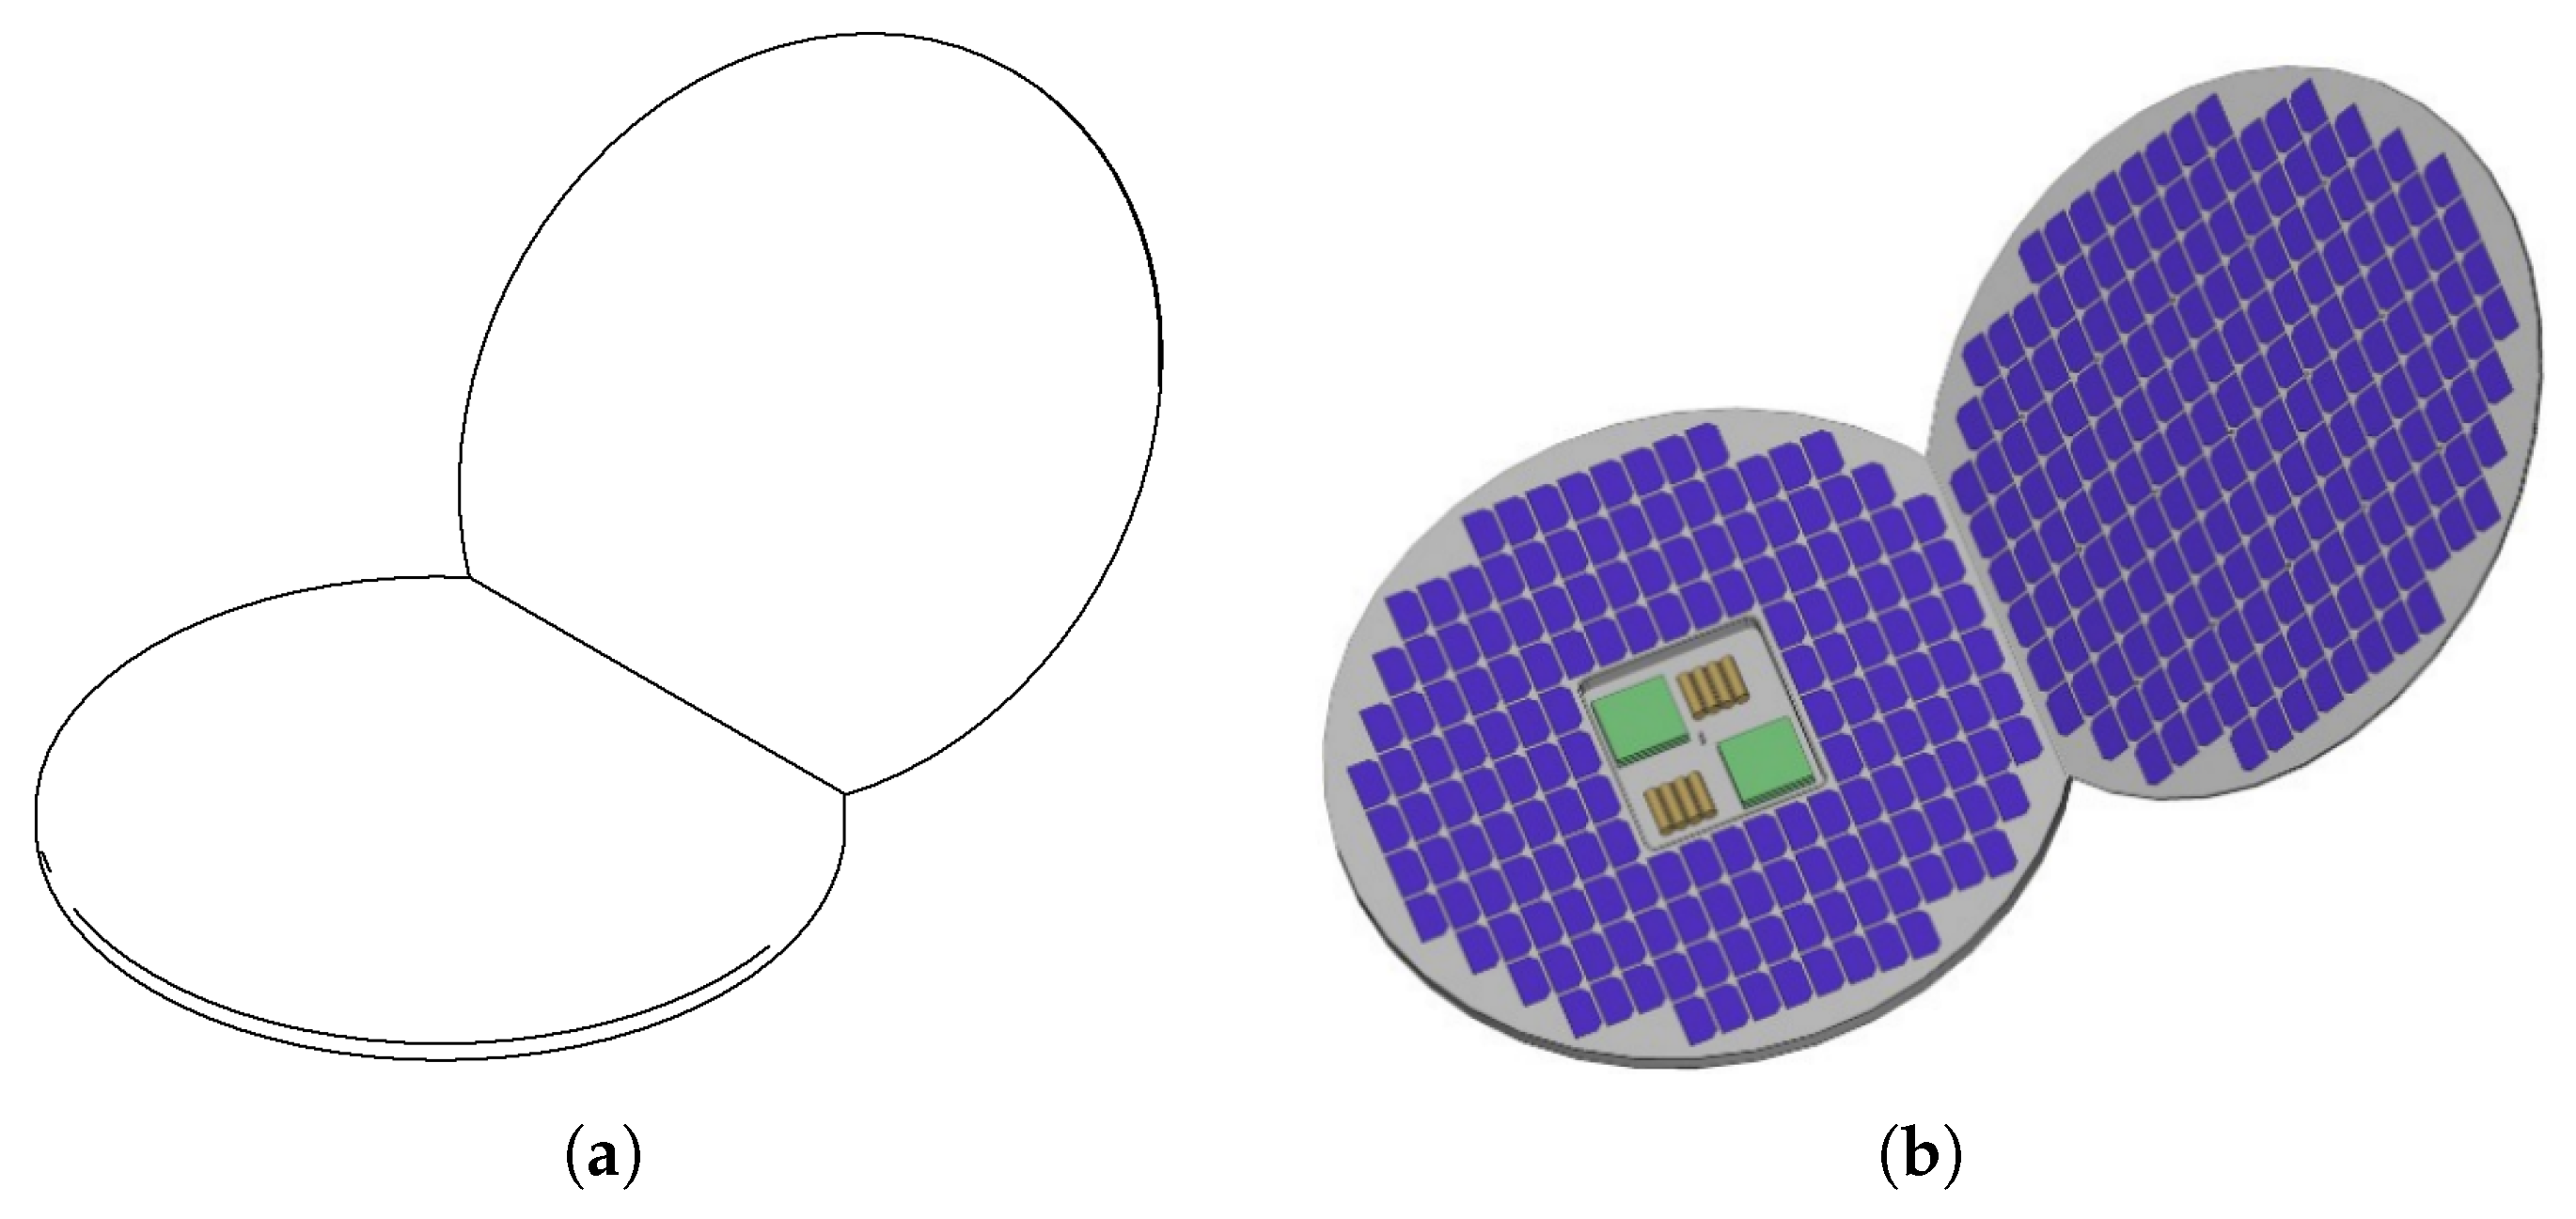
This section details the numerical and physical configuration of the DiskSat cases. The geometry consists of a partially opened 3D DiskSat platform, derived from the baseline concept introduced by Welle et al. [
7], with a diameter of 1 m and a mass of 11 kg, as illustrated in
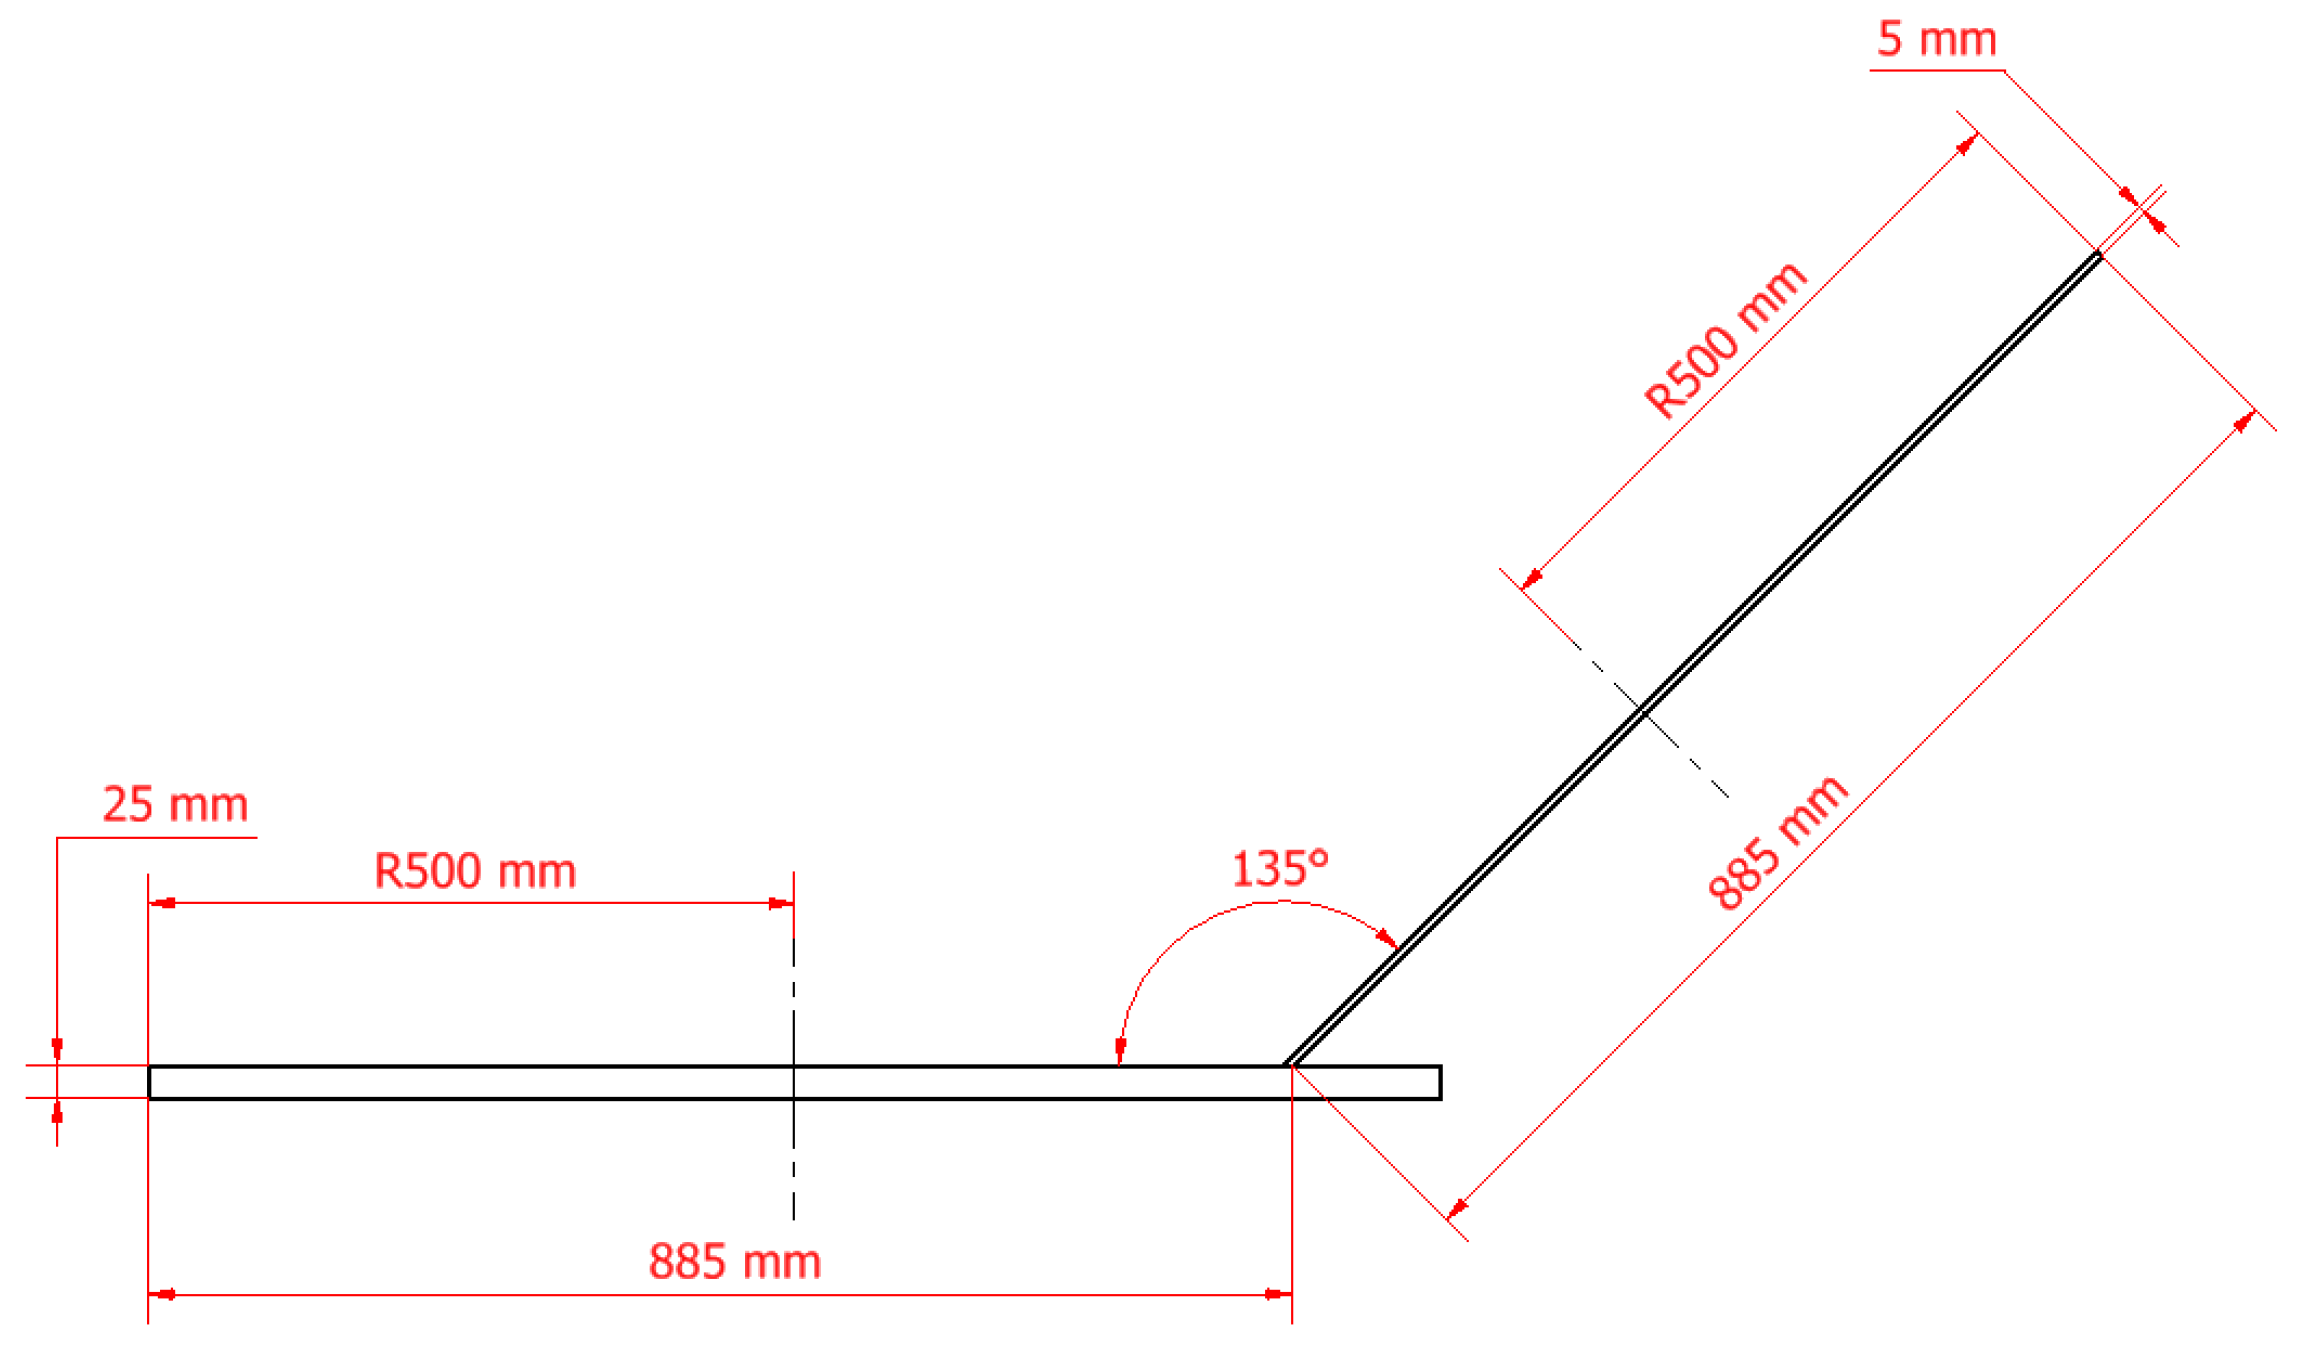
Figure 7a,b. This specific deployable configuration features a hinged mechanism designed to increase the surface area for solar energy collection, and it was studied at an angle of attack of 0° and considering a deployment angle of 135°. The detailed dimensional layout of this configuration is provided in
Figure 8. To optimize computational efficiency, the 3D domain takes advantage of the system’s symmetry by simulating only half of the body.
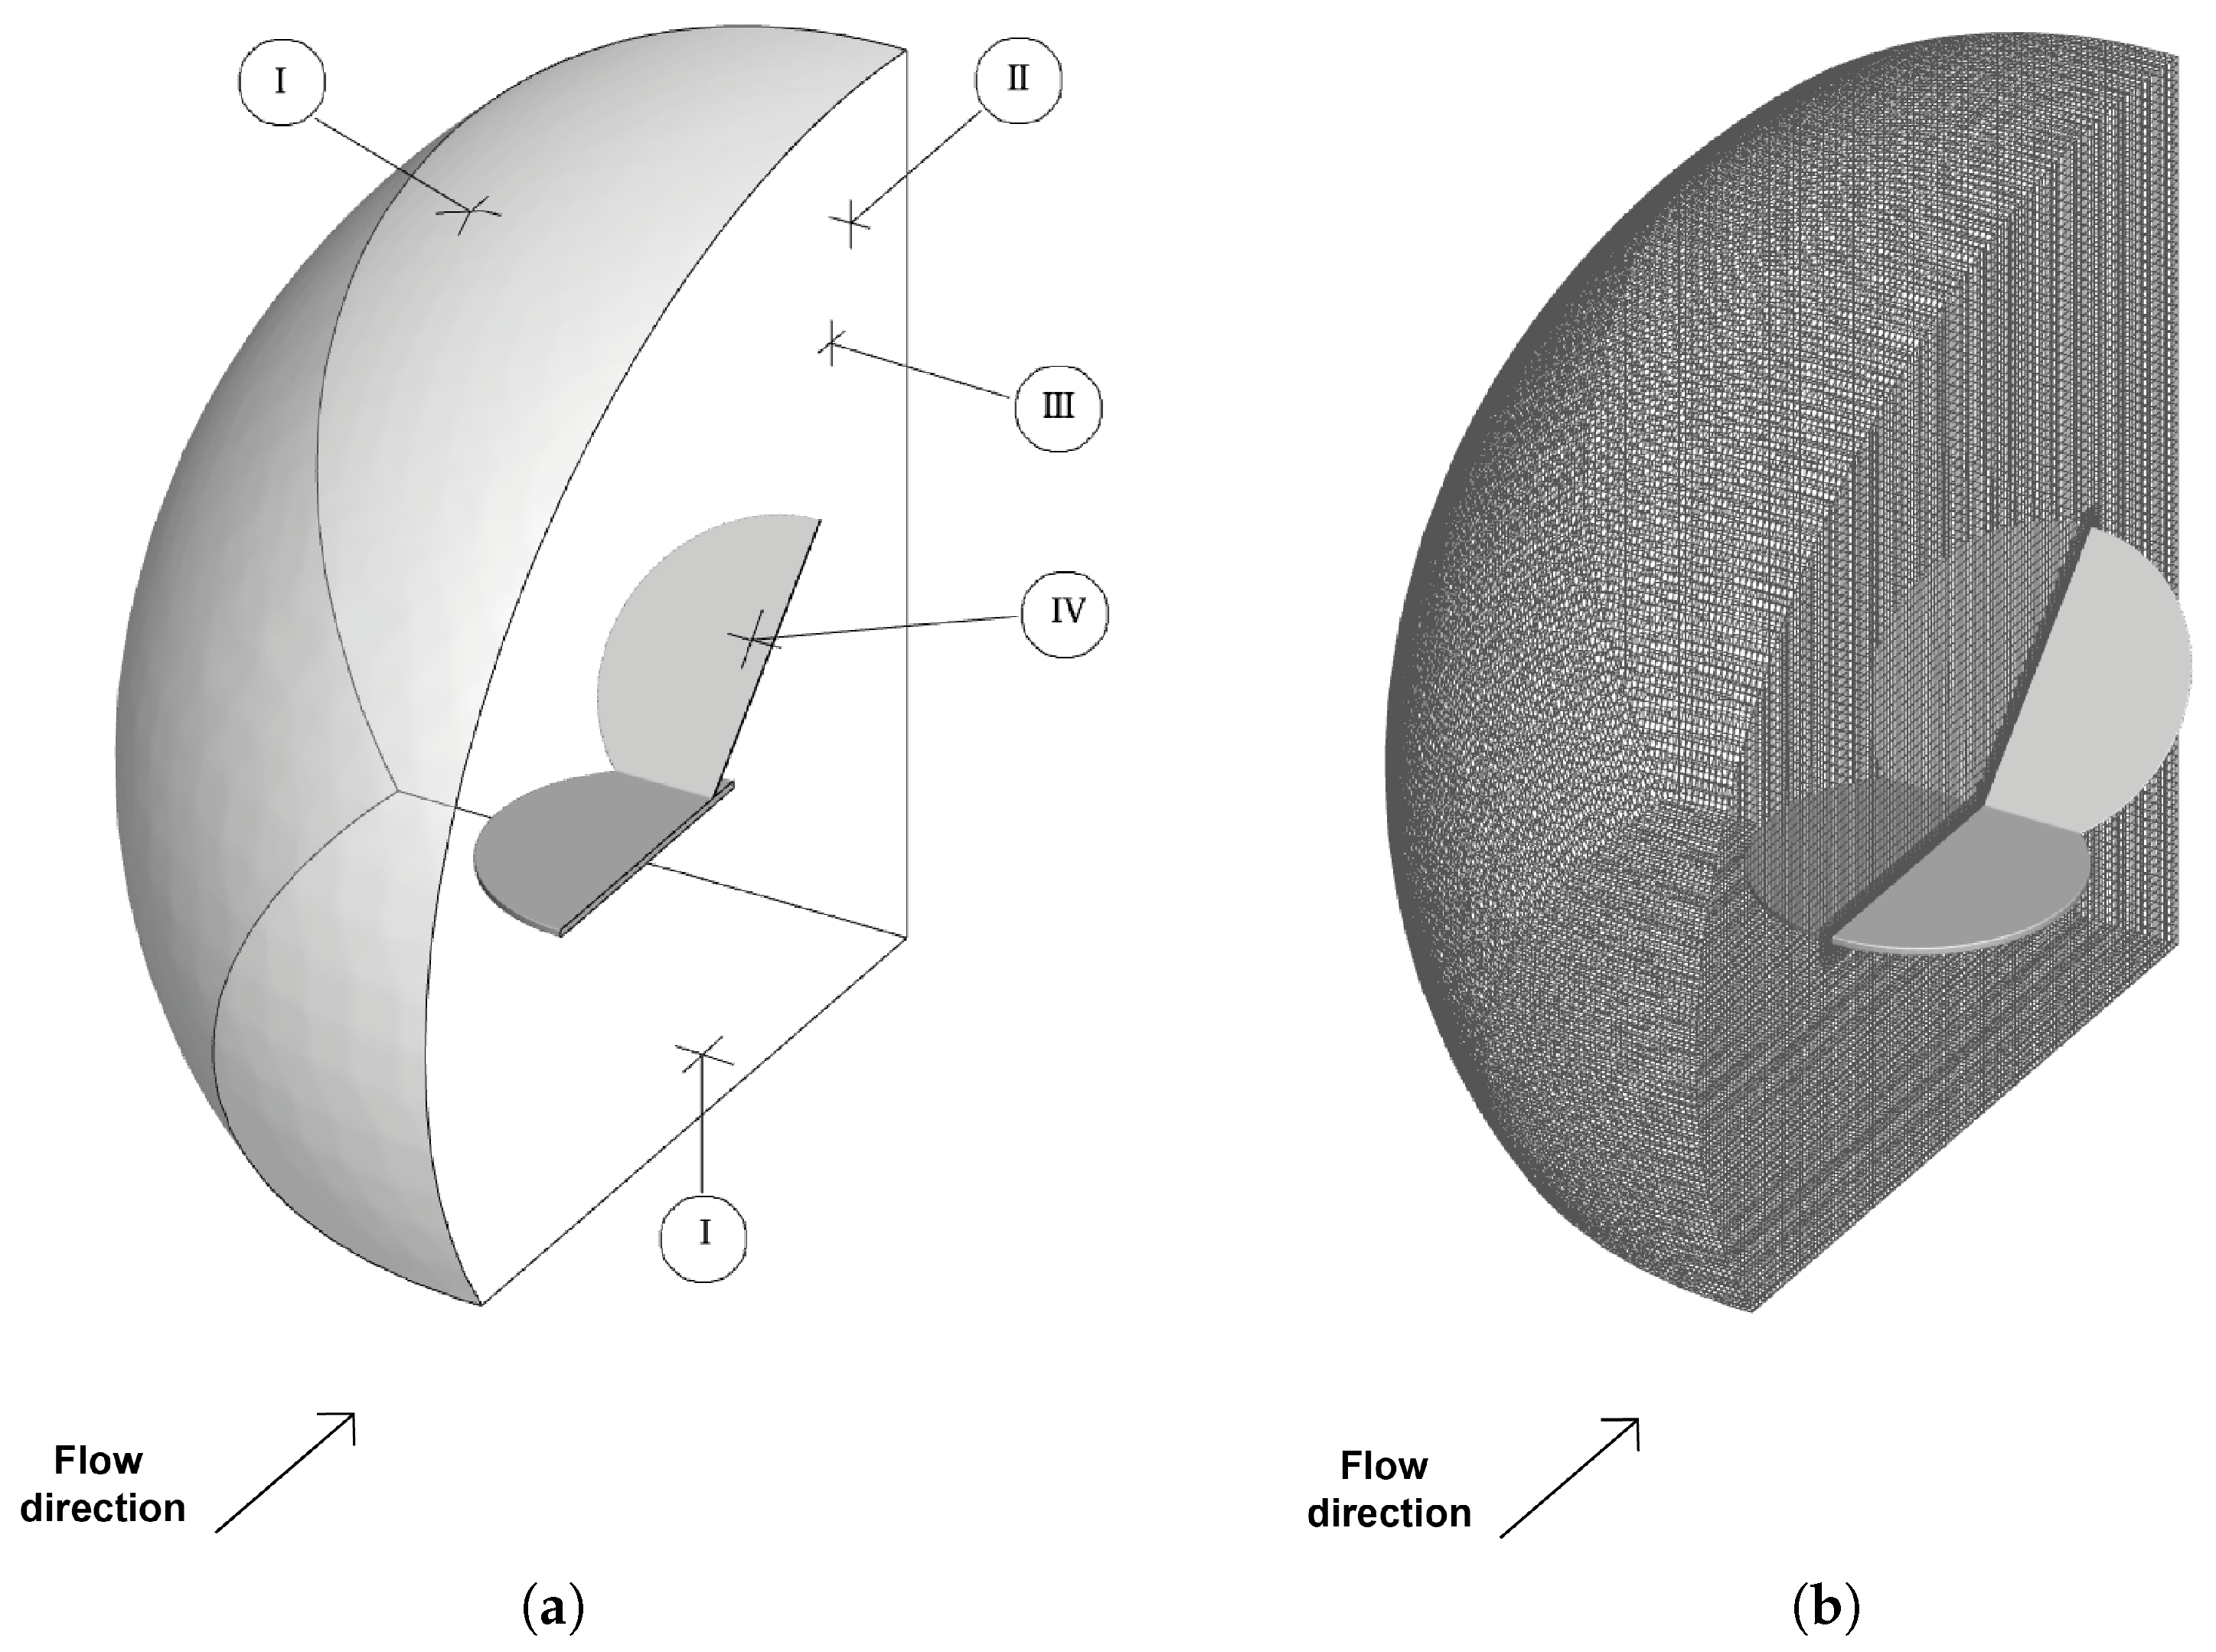
The computational domain, boundary conditions, and the unstructured 3D mesh are presented in
Figure 9. The boundaries are defined as follows: (I) a freestream inlet, (II) a vacuum outlet, (III) a symmetry plane, and (IV) the satellite surface modeled with Maxwellian diffuse reflection and full thermal accommodation at a fixed wall temperature (
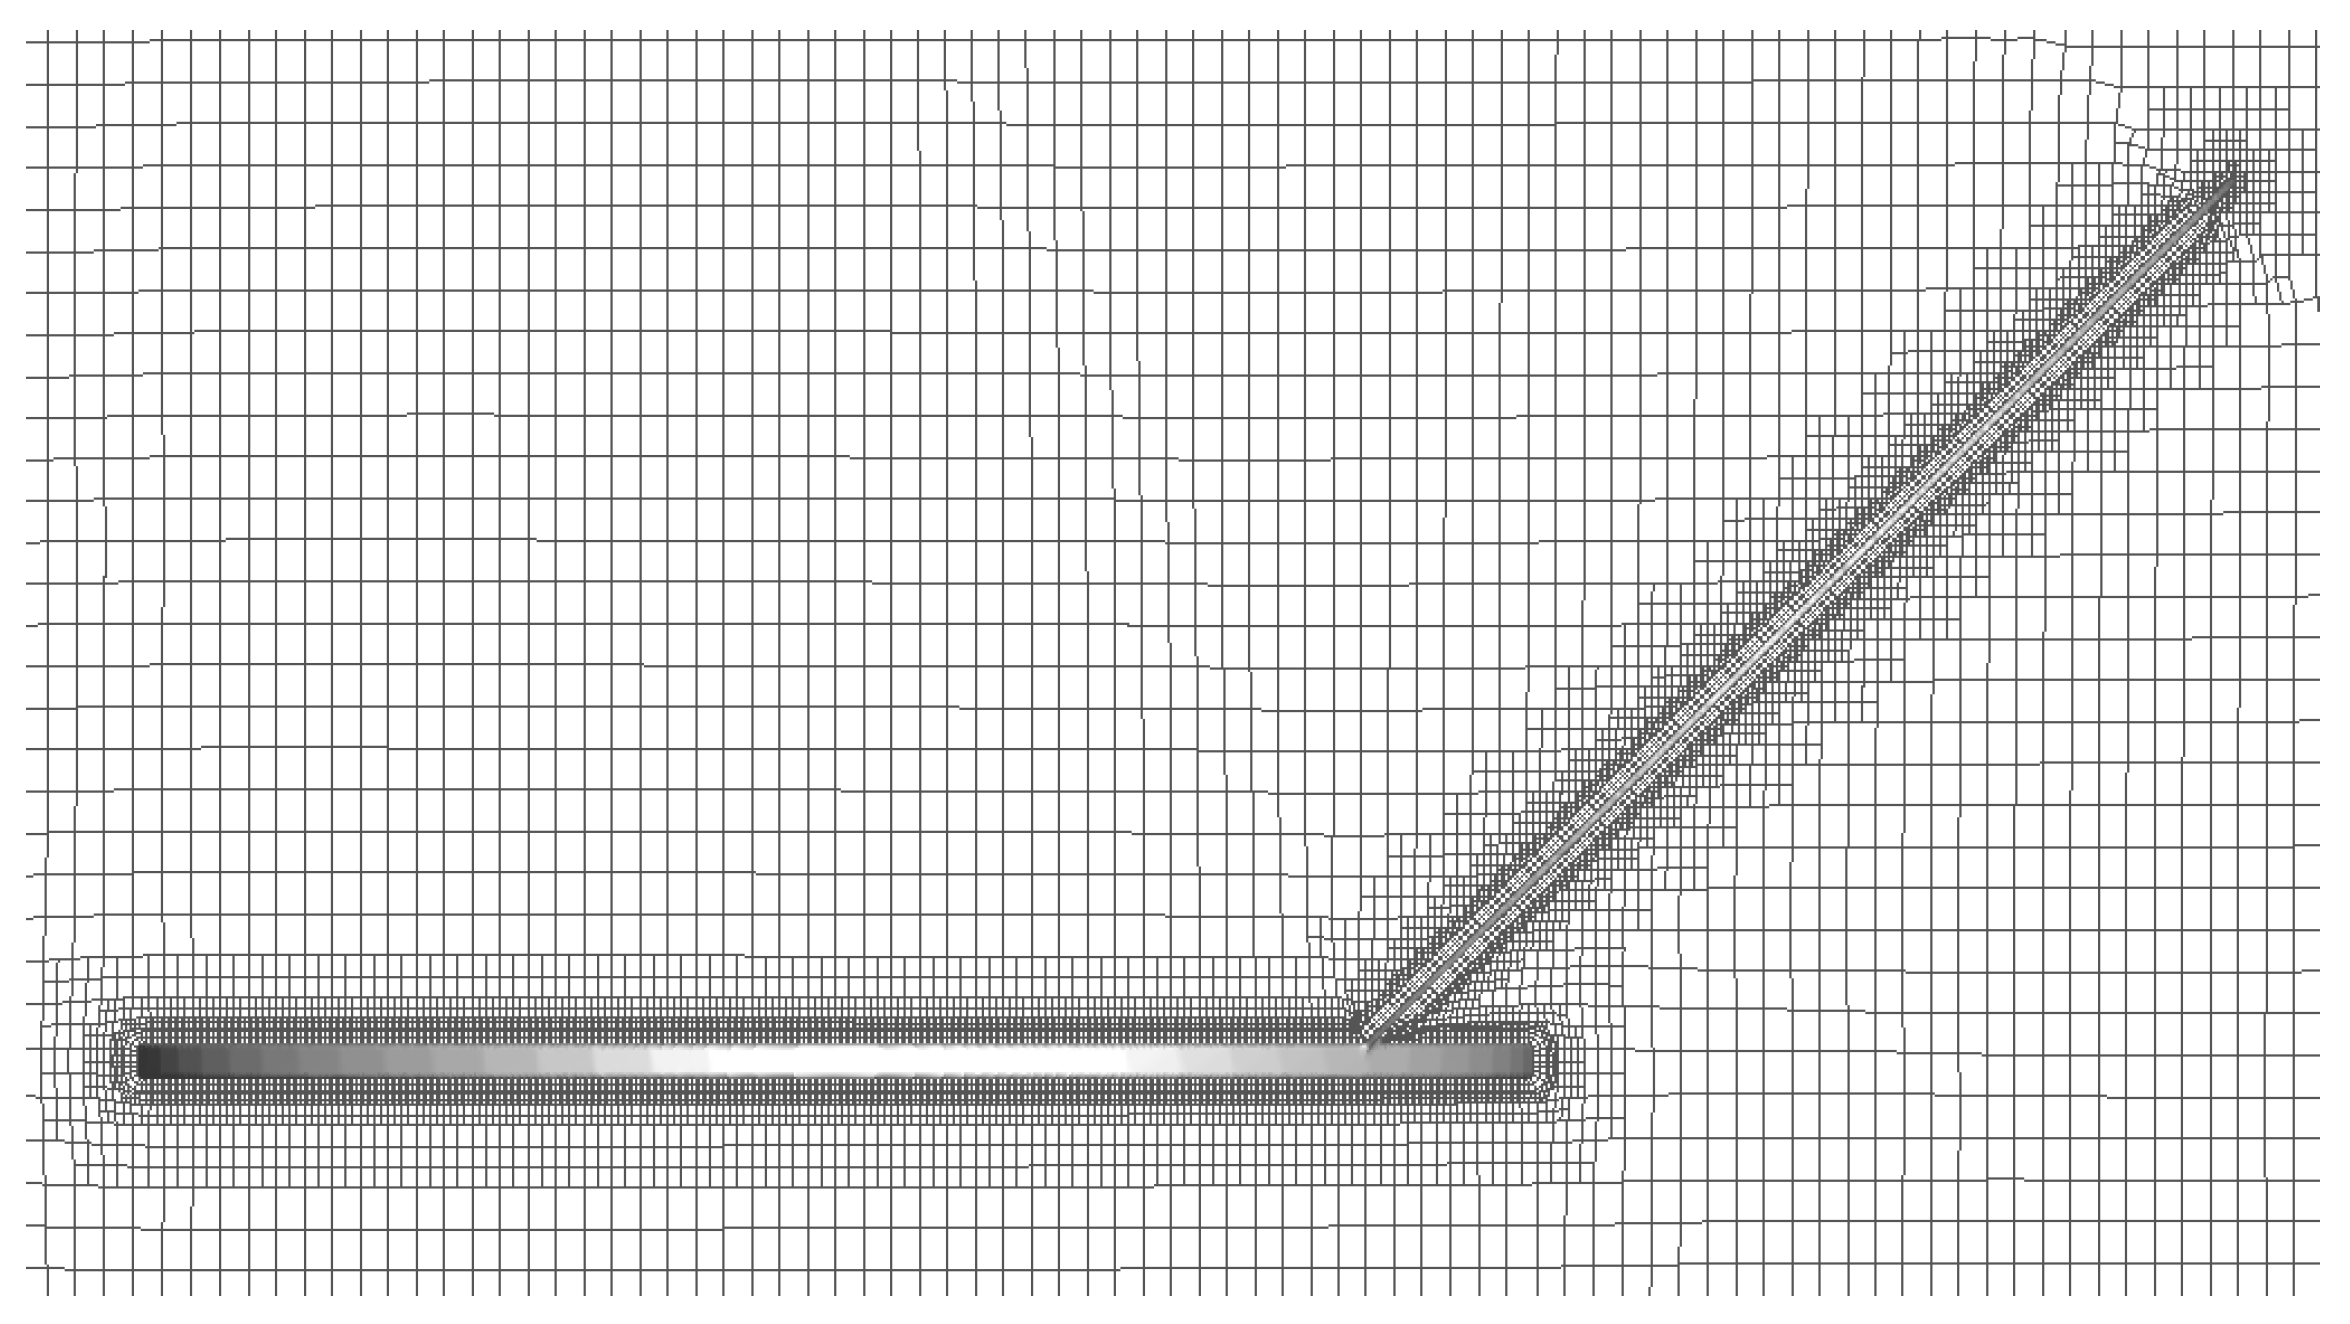
). Additionally, a detailed view of the localized mesh refinement near the solid boundaries for the 100 km altitude case is shown in
Figure 10, ensuring the proper resolution of the denser primary compression zones.
This specific gas–surface interaction model was selected to establish a conservative baseline. As demonstrated by Jiang et al. [
28], assuming fully diffuse reflection with complete thermal accommodation represents a worst-case scenario for momentum transfer, maximizing the resulting aerodynamic drag. Therefore, employing this assumption provides a robust upper bound for evaluating the overall aerodynamic footprint of the DiskSat platform in the VLEO environment.
The flowfield structure was analyzed at altitudes of 100 km, 150 km, and 200 km, covering the transition from the transition regime () to the free-molecular regime (). The simulations were performed, setting the freestream velocity to the local circular orbital speed at each altitude.
The gas is modeled as a non-reactive mixture composed of
,
, and O. This frozen-chemistry assumption establishes a conservative upper bound for VLEO aerothermodynamic loads. By retaining the flow’s kinetic energy entirely within the translational and rotational modes, this approach intentionally overestimates peak temperatures, surface heat fluxes, and local pressures. Since the impact of chemistry on global momentum transfer is negligible [
13], this non-reactive baseline provides robust, worst-case predictions for both aerodynamic drag and extreme thermal conditions.
The freestream atmospheric properties for each altitude were extracted from the USSA 1976 model [
29] and are detailed in
Table 4, while the specific molar compositions and number densities are presented in
Table 5.
Numerical parameters for the DSMC simulations are summarized in
Table 6. Cell size and domain volume were adjusted at each altitude according to the local mean free path (
) to capture the wake structure, while balancing spatial resolution and computational cost. In addition, 10 particles per cell were used to minimize statistical noise and optimize computational efficiency.
5. Results and Discussion
Once the computational code is verified and validated, this section discusses the flowfield characterization of a rarefied flow over a DiskSat at altitudes of 100, 150, and 200 km. The analysis focuses on the distribution of velocity, density, pressure, and translational temperature to characterize the aerodynamic rarefied environment.
The results are presented as contour plots generated on a longitudinal plane at m from the symmetry plane, providing a representative cross-section of the 3D flowfield. These global visualizations are complemented by detailed views of the near-body region to highlight the gradients and the shock-layer structure. Furthermore, the flow behavior is examined by measuring the distribution of macroscopic properties along five profiles.
Before discussing these macroscopic fields, a brief note on terminology is required regarding the highly rarefied cases (150 km and 200 km). It is acknowledged that at these altitudes (), intermolecular collisions are sufficiently scarce that a classical continuum shock wave, characterized by a sharp mathematical discontinuity, does not form. However, for consistency in describing the flowfield evolution across the studied regimes, terms such as “shock” or “shock layer” are used in this manuscript to denote the macroscopic compression zone and thermal disturbance. In this highly rarefied context, these terms refer strictly to the diffuse accumulation of reflected molecules in the near-body region, representing the free-molecular limit of a shock structure.
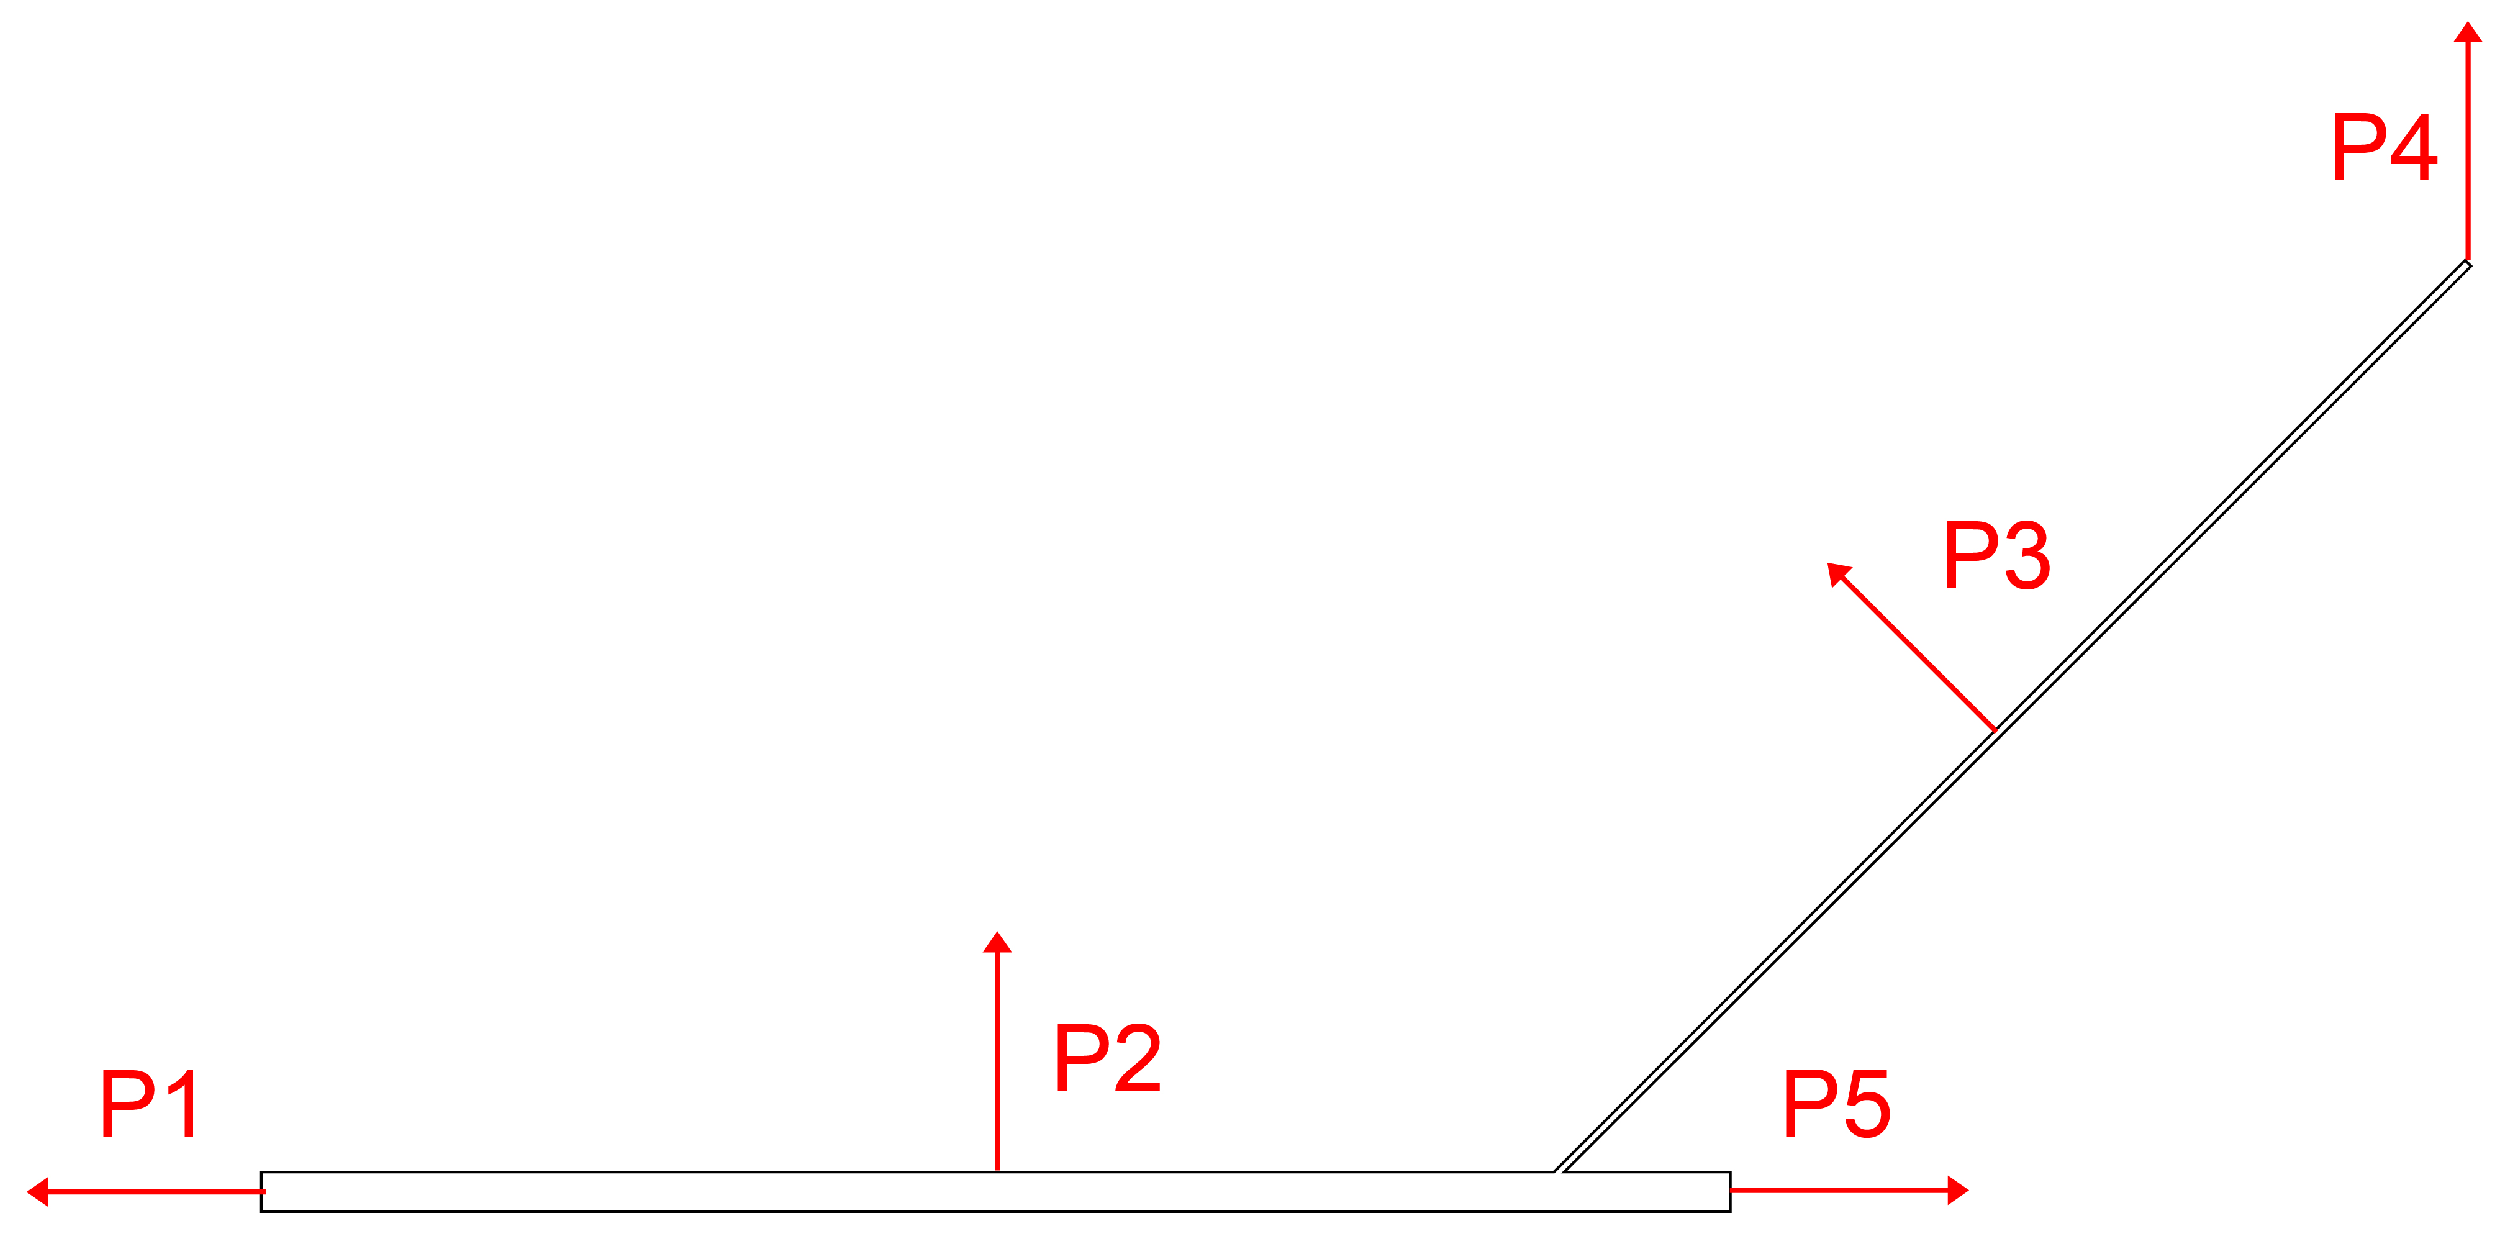
Macroscopic flow properties were sampled along five specific profiles, from
to
, as shown in
Figure 11.
represents the stagnation line ahead of the body, while
and
are oriented normal to the horizontal, inclined, and top surfaces, respectively. Finally,
tracks the wake recovery downstream. All the measurements were performed from the DiskSat wall up to the computational domain boundary condition.
5.1. Velocity Field Analysis
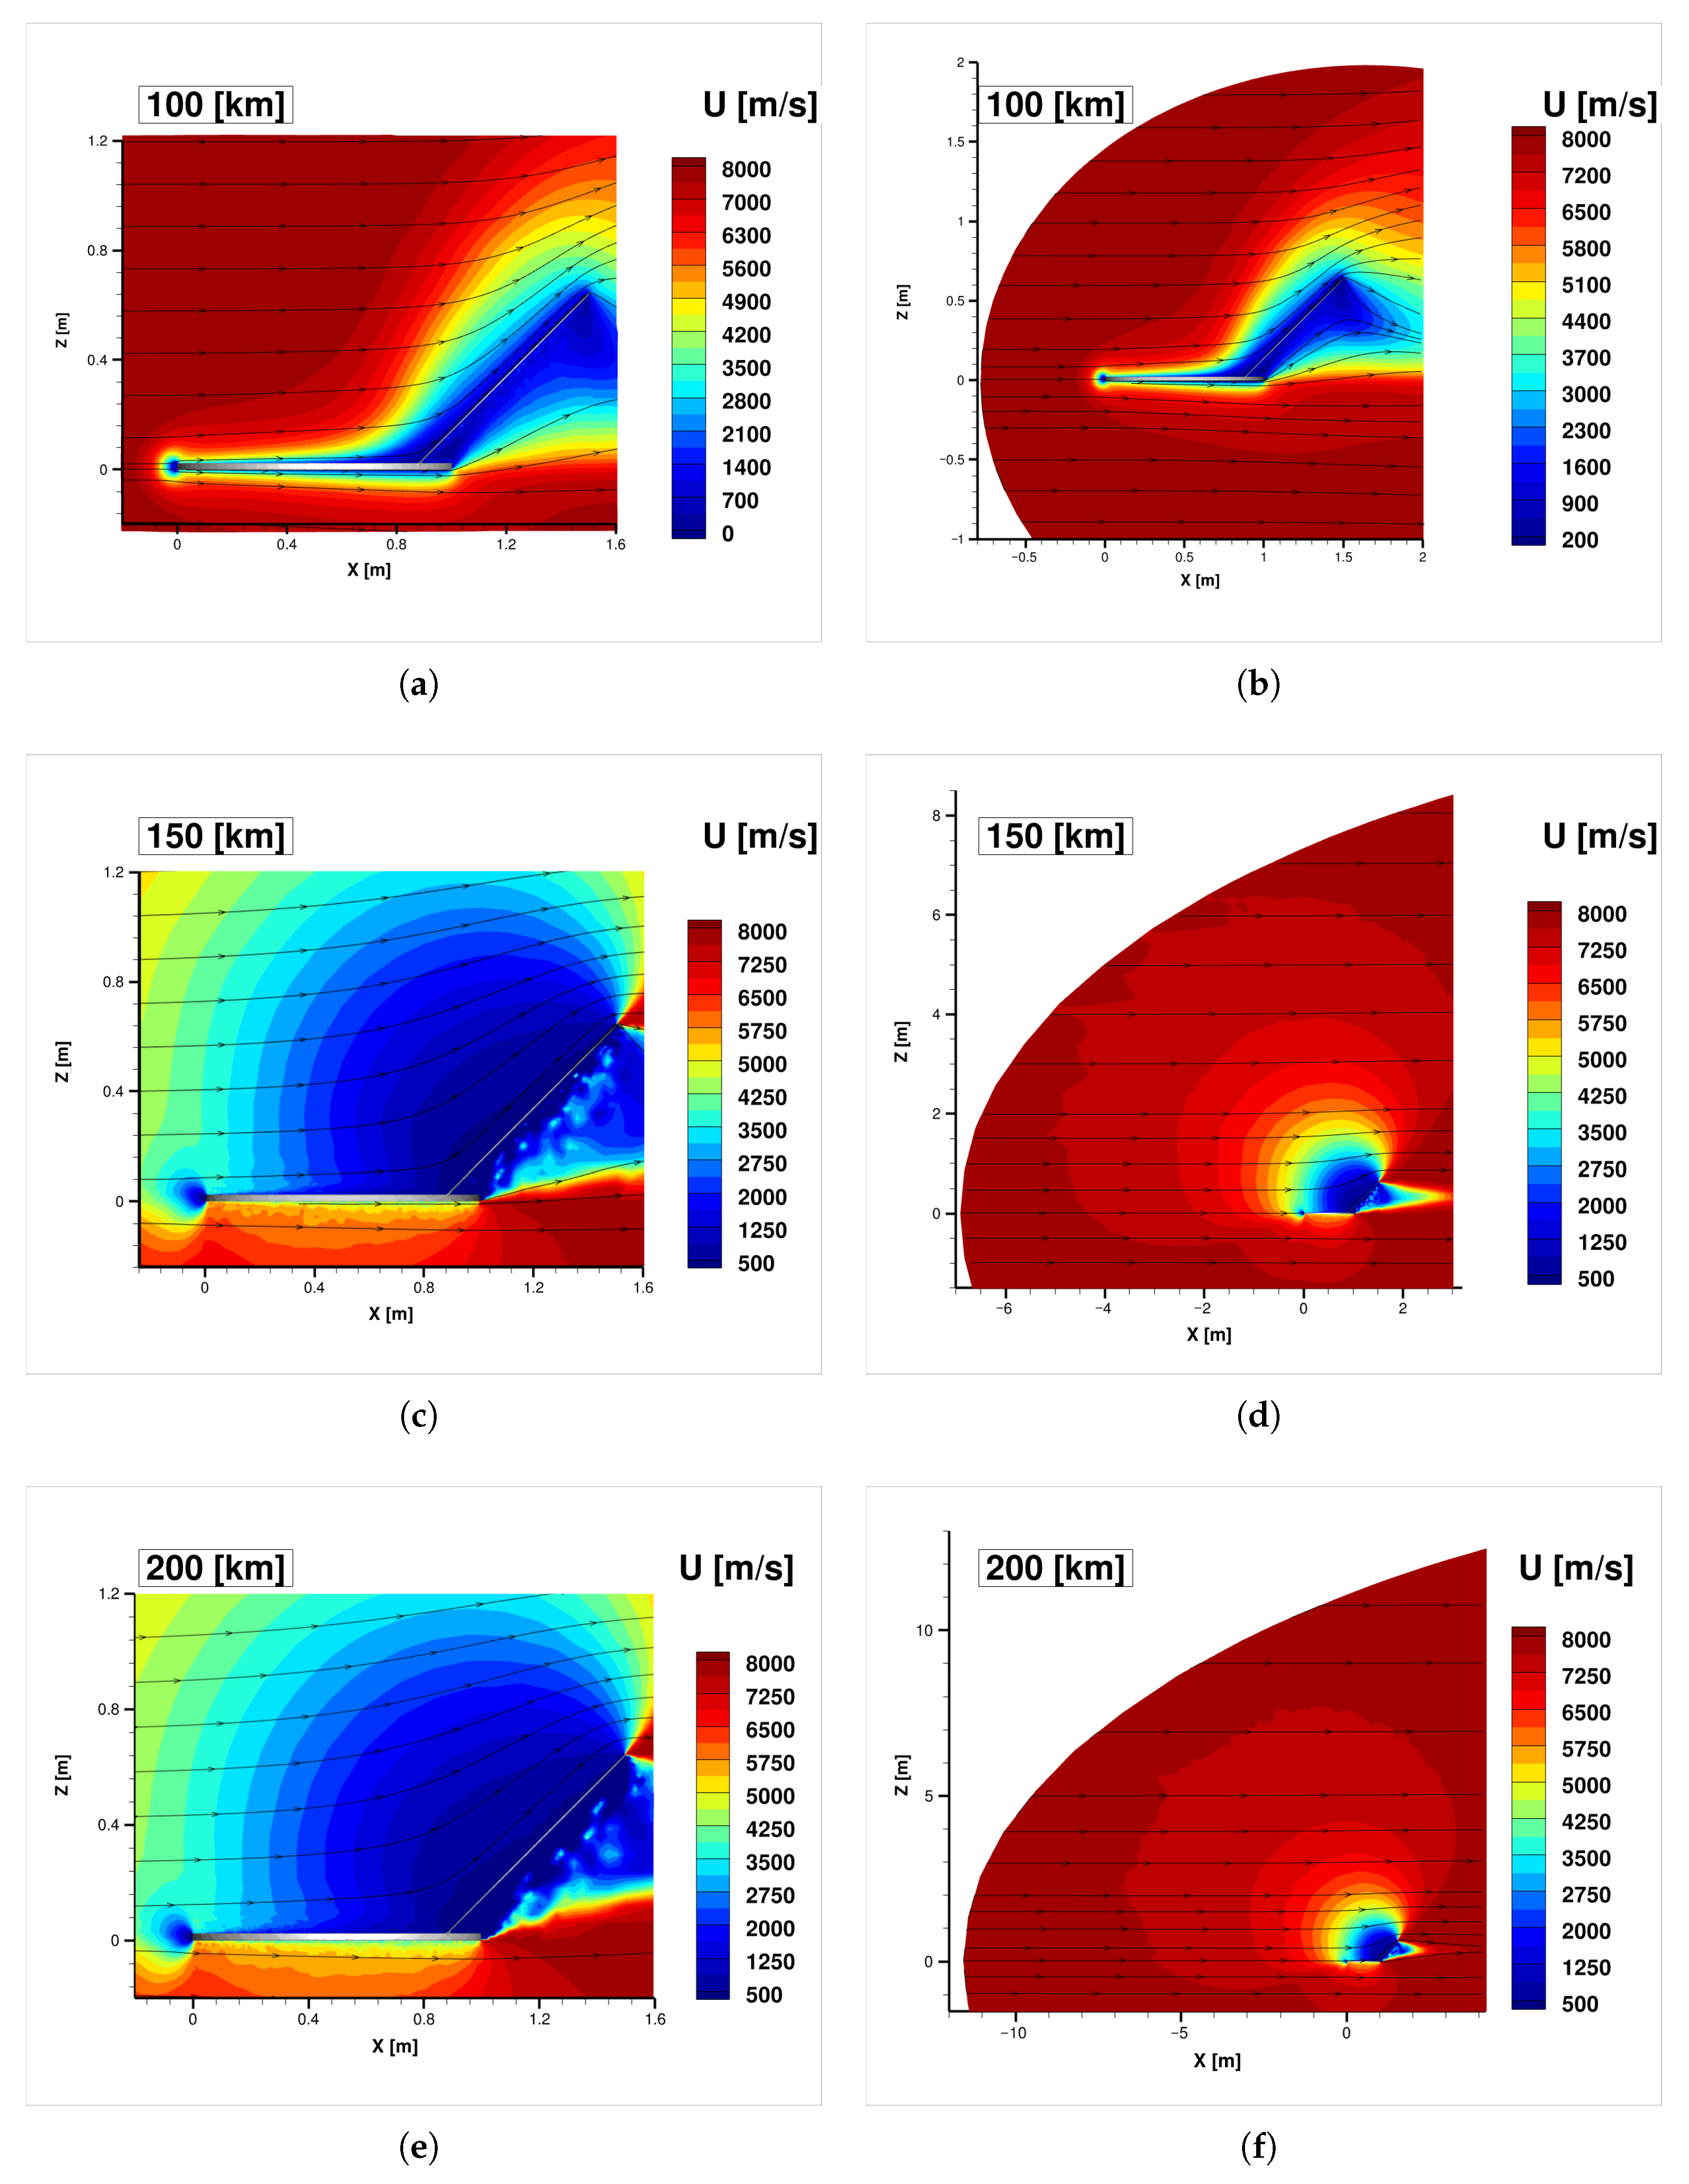
The velocity distribution around the DiskSat is presented in
Figure 12. The contours show the complex interaction between the hypersonic freestream and the satellite geometry, highlighting the significant influence of the rarefaction level on the flow structure. The difference in the computational domain sizes required for each case is noticed; at 150 km and 200 km, the domain must be substantially larger to fully capture the diffuse shock wave and the extended wake. This is consistent with the transition from the slip-flow regime at 100 km (
) to the near-free-molecular regime at 200 km (
).
Figure 12a,b show a well-defined shock and a wake for the 100 km altitude case. In this figure, the freestream velocity decreases abruptly upon interaction with the walls. A closeup view reveals that the 100 km case exhibits much steeper velocity gradients compared to higher altitudes. In all cases, a clear stagnation zone forms in front of the horizontal plate, accompanied by a low-velocity region immediately above the structure.
A critical phenomenon occurs at the satellite’s uppermost edge: a sharp flow expansion is triggered. At this point, particles no longer encounter molecules reflected from the surface, leading to a rapid acceleration that restores freestream conditions almost immediately. Conversely, in the lower region, the geometry’s shielding effect creates a persistent low-momentum zone with adverse velocity gradients, particularly in the most rarefied cases.
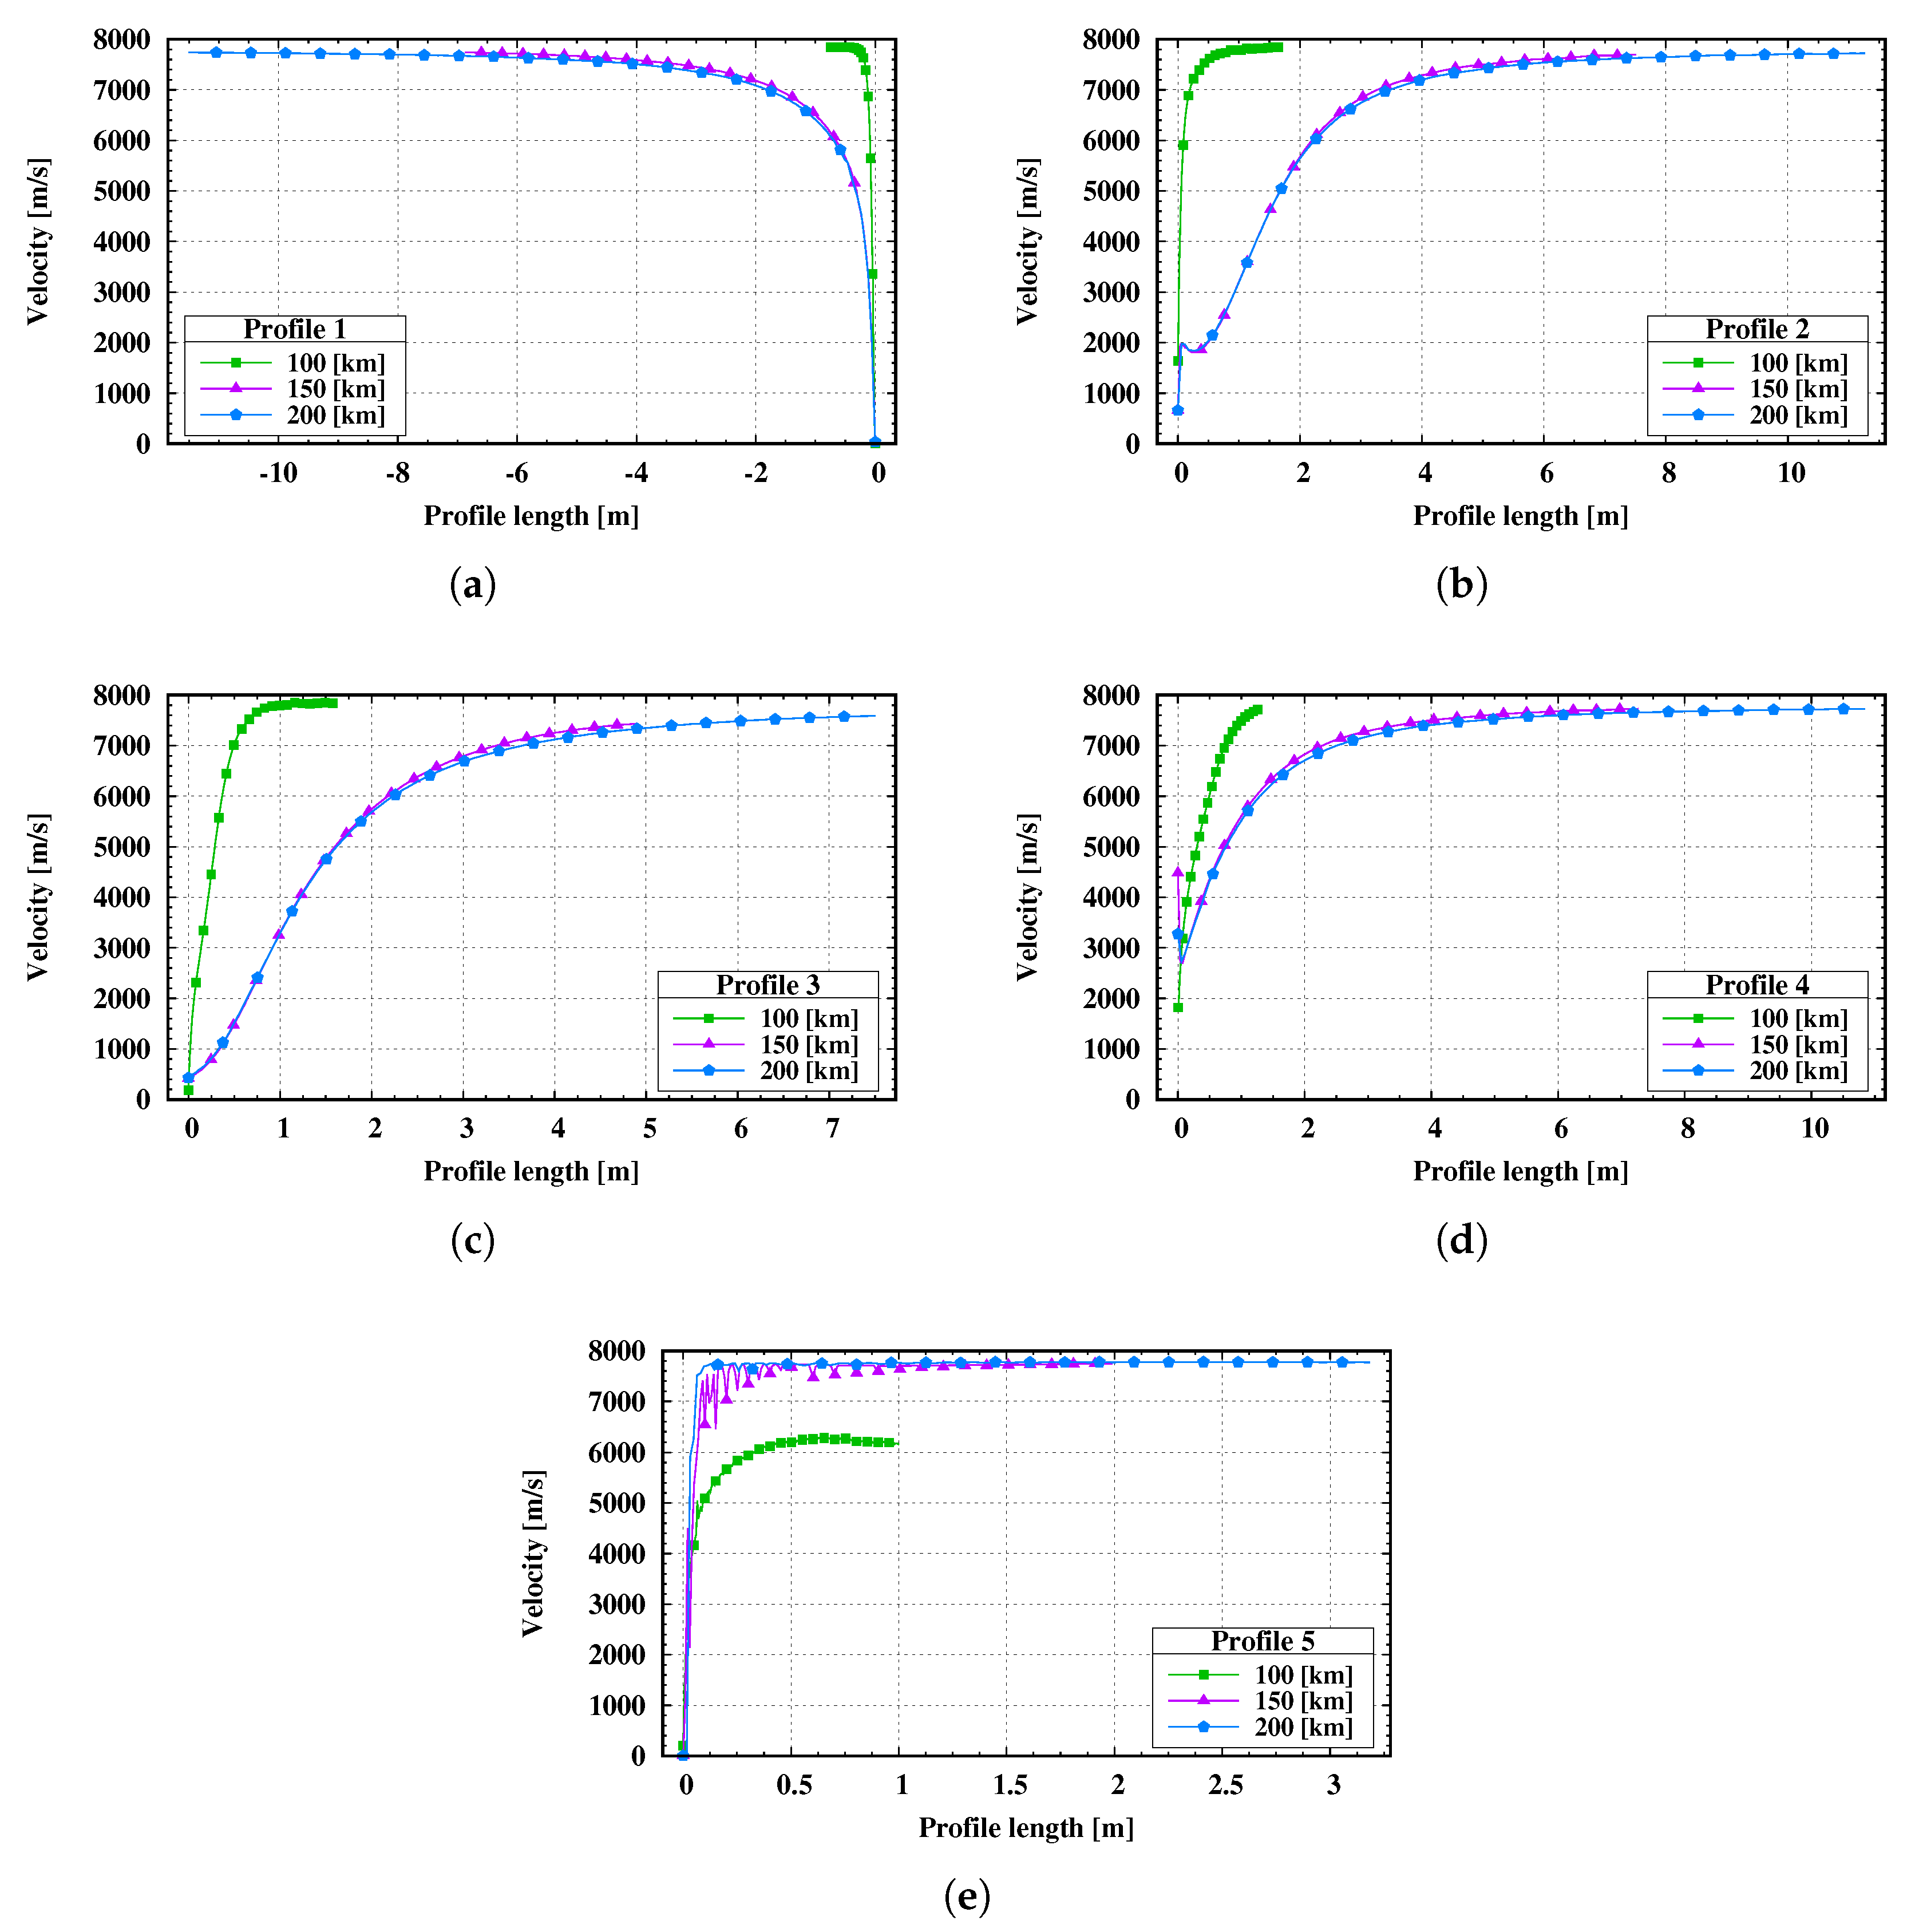
The velocity distribution along the profiles is shown in
Figure 13. Profiles
and
confirm that deceleration is more abrupt at lower altitudes due to the higher collision frequency, which effectively dissipates the kinetic energy of the incoming flow. Specifically, Profiles
and
show high velocity values directly at the gas–surface interface, indicating a significant slip velocity This jump is a hallmark of non-equilibrium flows where the traditional continuum no-slip boundary condition is no longer valid.
Still analyzing
Figure 13, Profile
shows an intense molecular scattering due to the lack of molecular collisions in the wake region. In the 150 km and 200 km cases, the velocity field is dominated by nearly collisionless transport. The absence of intermolecular collisions leads to a very slow, near-ballistic recovery of the freestream velocity, as the molecules require multiple collisions to refill the region behind the satellite.
This persistent velocity deficit arises from the high orbital velocity, in which the flow significantly exceeds the thermal velocity of the gas molecules. Consequently, the molecules cannot move into the space behind the satellite fast enough to close the wake immediately. This creates a well-defined vacuum-like region behind the structure, which contributes significantly to the overall pressure imbalance and, therefore, to the aerodynamic drag of the satellite.
5.2. Temperature Field Analysis
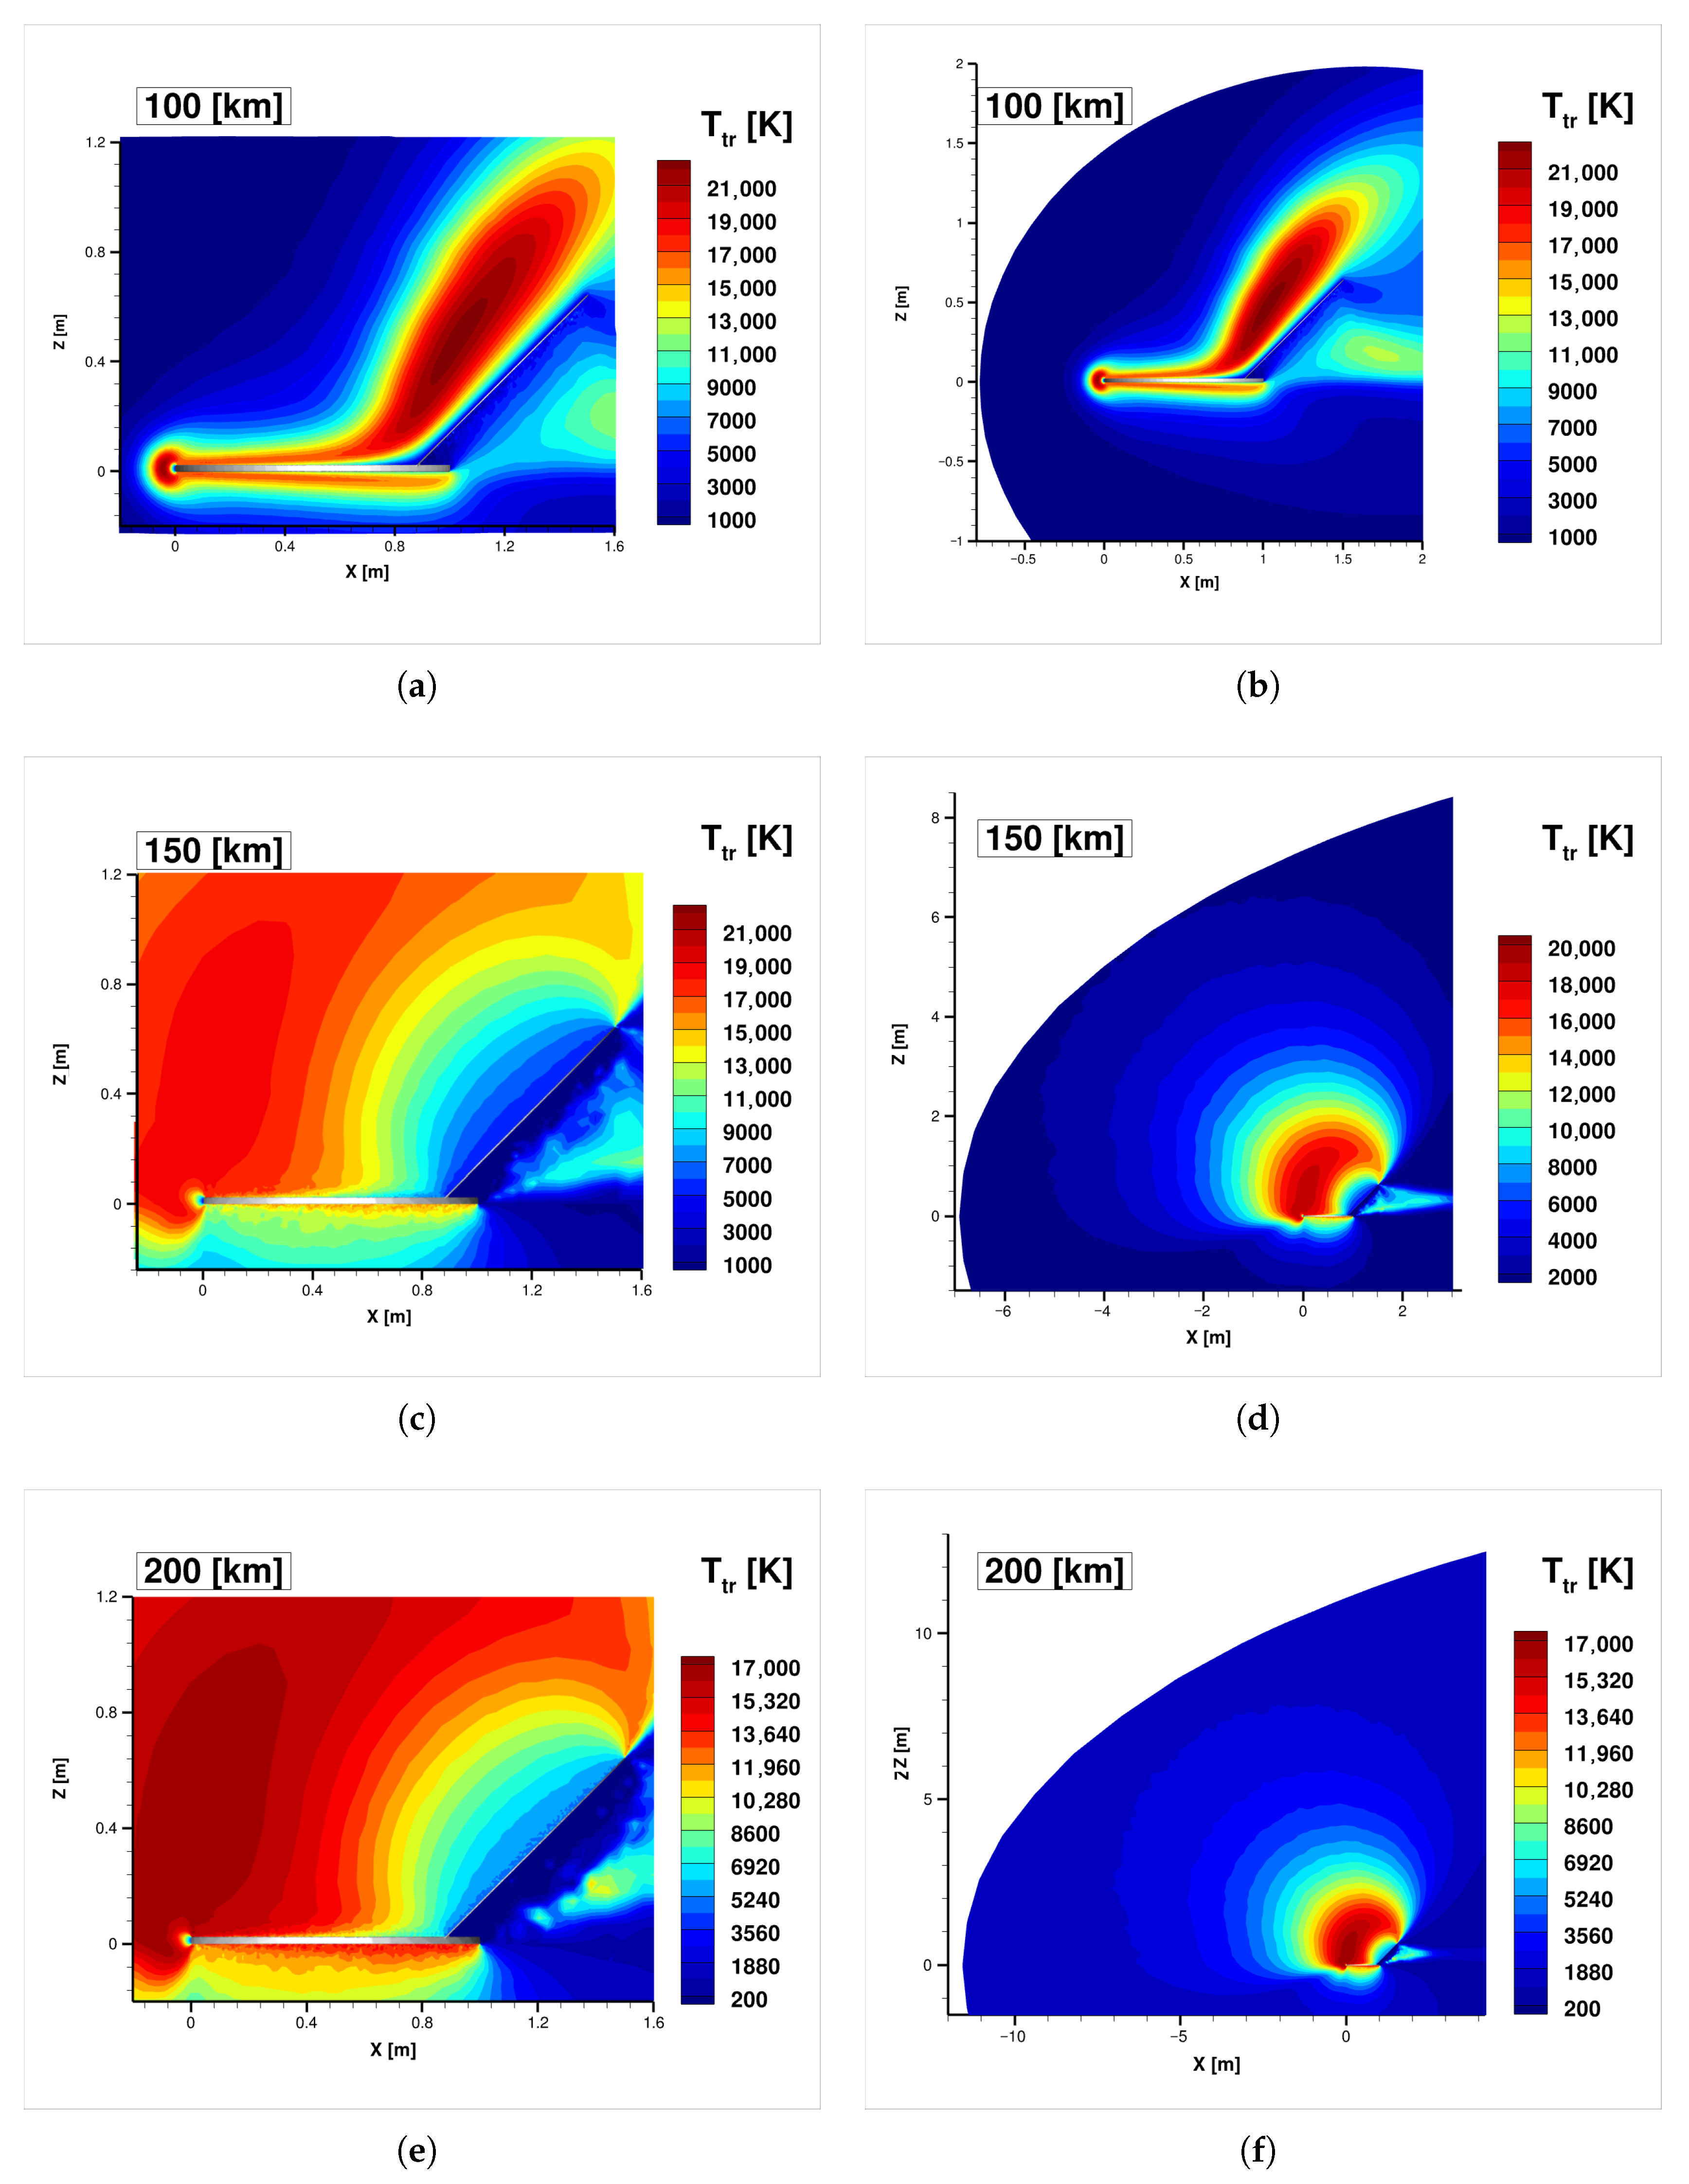
The translational temperature contours are shown in
Figure 14. According to this figure, the thermal footprint of the high-speed flow interaction with the DiskSat and the transition between the transitional and free-molecular regimes are observed in the 100, 150, and 200 km altitude cases.
At 100 km, the flow develops a complex shock structure with two distinct high-temperature zones ahead of the horizontal and inclined plates. In this regime (), peak temperatures reach approximately 22,000 K within an elliptical compression zone. This extreme heating results from a high collision frequency that effectively converts the directed kinetic energy of the freestream into localized thermal agitation. A remarkable feature at 100 km is the presence of a relatively cold layer immediately adjacent to the satellite surface, followed by a steep gradient in which temperatures rise only a few centimeters away. In contrast, the wake region at this altitude shows considerably lower temperatures, with absolute minima occurring specifically behind the inclined plate.
As the altitude increases to 150 km and 200 km, the shock wave undergoes a fundamental transition. The shock layer thickens significantly, evolving into a diffuse shock in which gradients are less steep, and the maximum-temperature region shifts towards the leading edges, adopting a crescent-shaped morphology.
Notably, peak temperatures decrease to 19,000 K and 17,000 K for 150 and 200 km, respectively. This reduction is a direct consequence of increased rarefaction: with fewer intermolecular collisions in the shock layer, the conversion of energy between translational and internal degrees of freedom is less efficient. This results in a state of high thermal non-equilibrium in which the gas molecules retain much of their directed kinetic energy, preventing the temperature from reaching the levels observed at lower altitudes. While a large high-temperature zone develops further from the body, a localized hot zone appears immediately beneath the horizontal plate, highlighting how the thermal shock waves vary substantially between these two altitudes compared to the 100 km case.
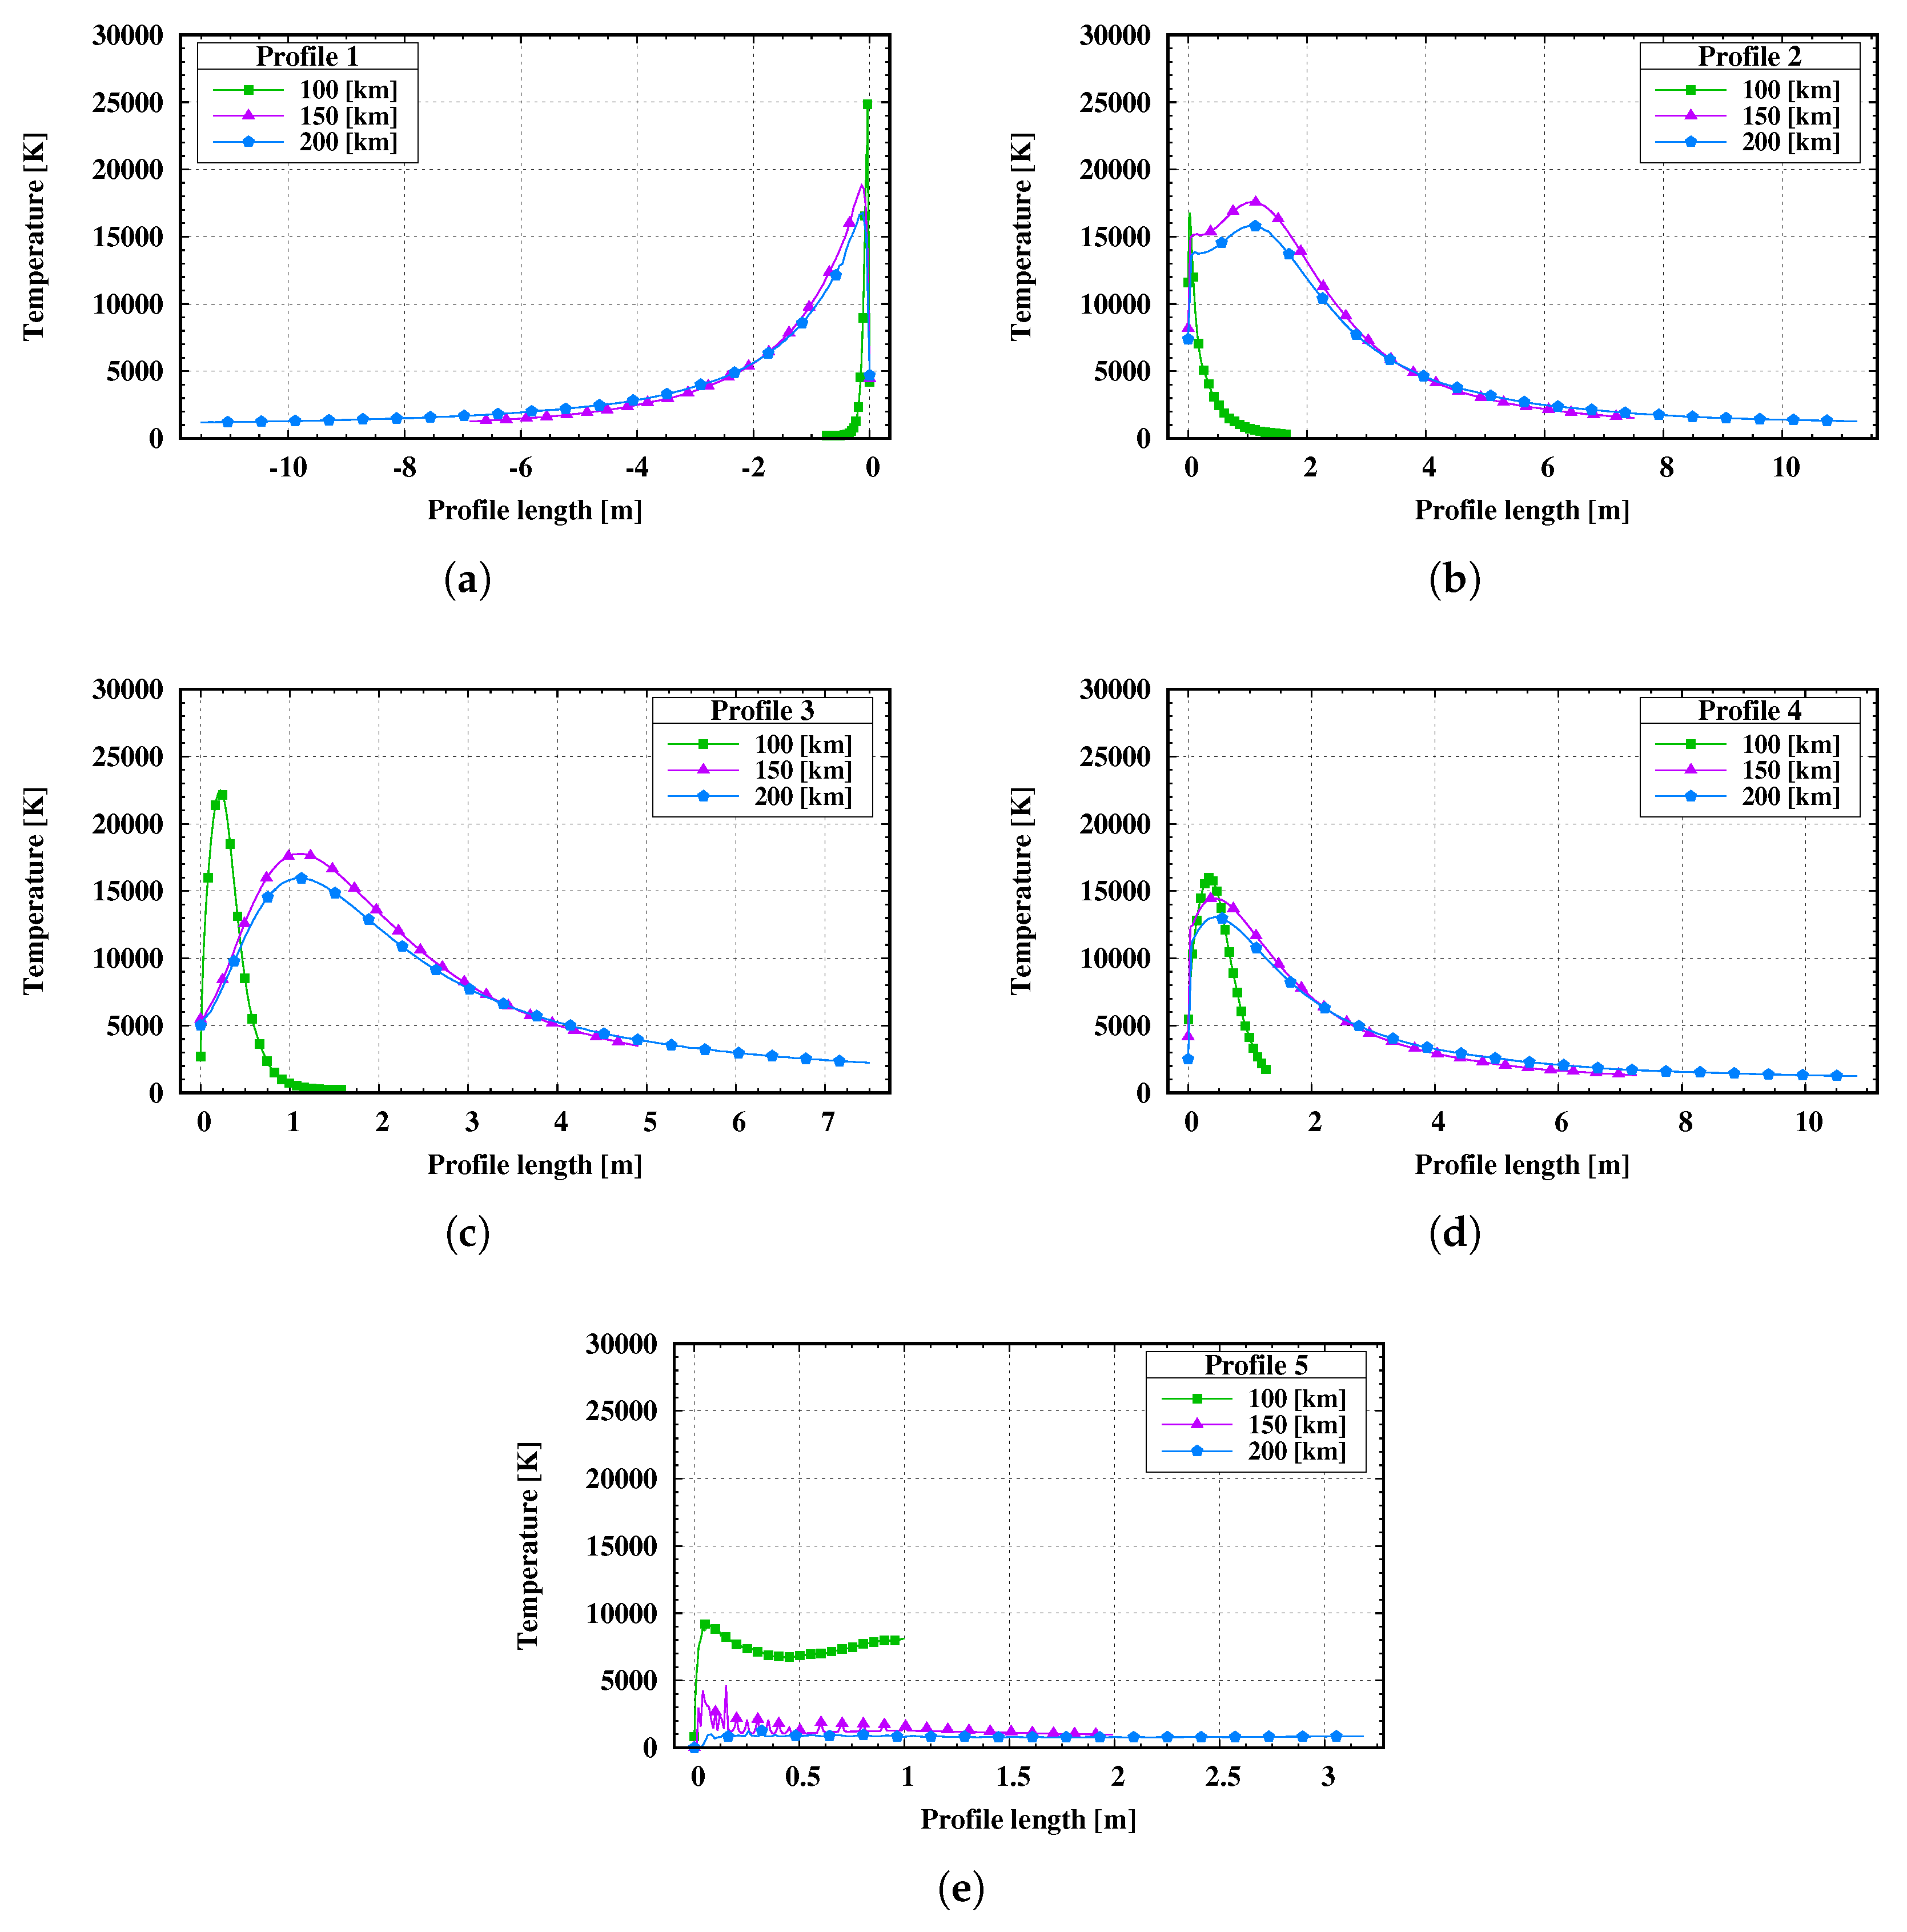
Figure 15 further characterizes these phenomena. The profiles confirm that the 100 km case consistently attains the highest peak temperatures across all sampled regions, with an abrupt rise near the surface.
A fundamental observation in Profiles through is the shift in the temperature peaks; in the more rarefied cases, the maximum temperature is reached farther from the satellite walls. This demonstrates how the “thermal disturbance” extends much further upstream as the molecular mean free path increases. Under these conditions, the flow becomes “thermally frozen” over longer distances, as collisions are insufficient to relax the gas toward an equilibrium state. In Profile , the flow cooling occurs much closer to the top surface at 100 km, indicating that physical phenomena are spatially confined more in lower altitudes.
Finally, Profile highlights the thermal relaxation and recovery in the wake. In all cases, the wake exhibits very low temperatures, consistent with flow stagnation and rapid expansion into the leeward region. This expansion leads to a near-vacuum state in which the few remaining particles have minimal internal energy, with temperatures as low as 200 K.
While the 100 km case maintains higher temperatures behind the body, the 150 km and 200 km cases show evidence of intense molecular scattering. Combined with low particle density, this scattering prevents the recovery of freestream temperatures, thereby maintaining the wake in a state of high thermal non-equilibrium, in which the translational energy remains decoupled from the internal modes of the gas.
5.3. Pressure Field Analysis
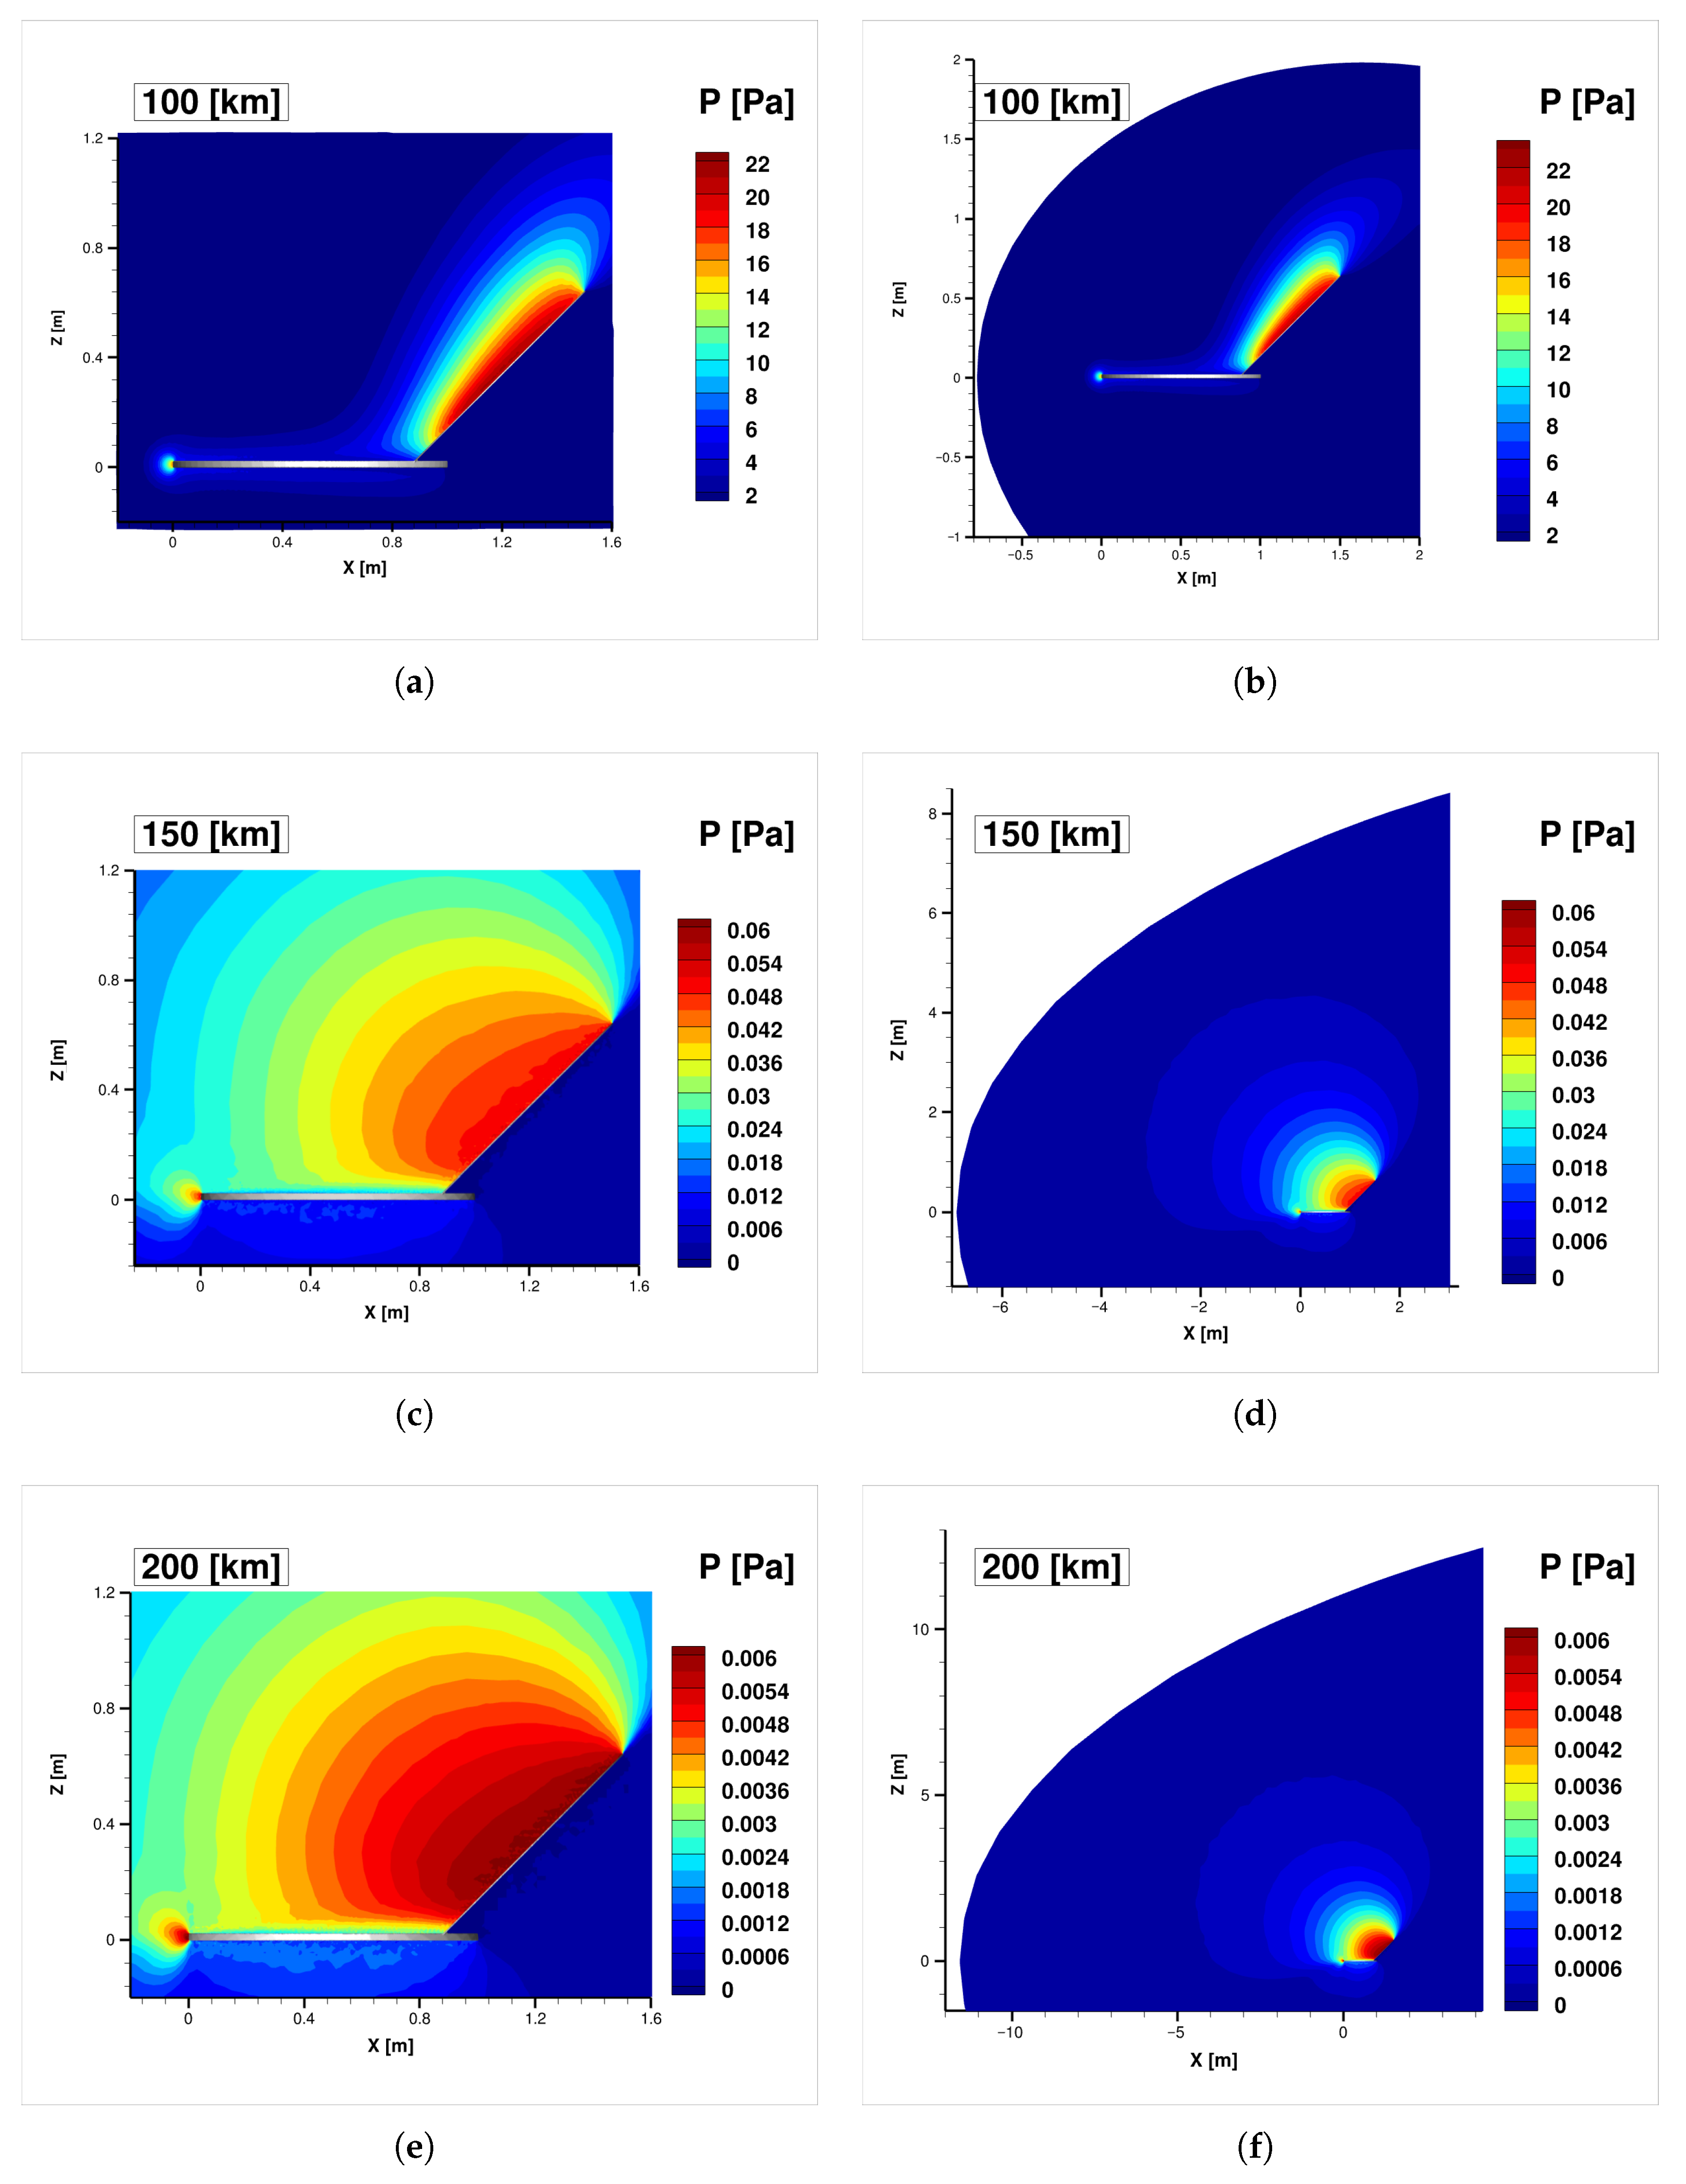
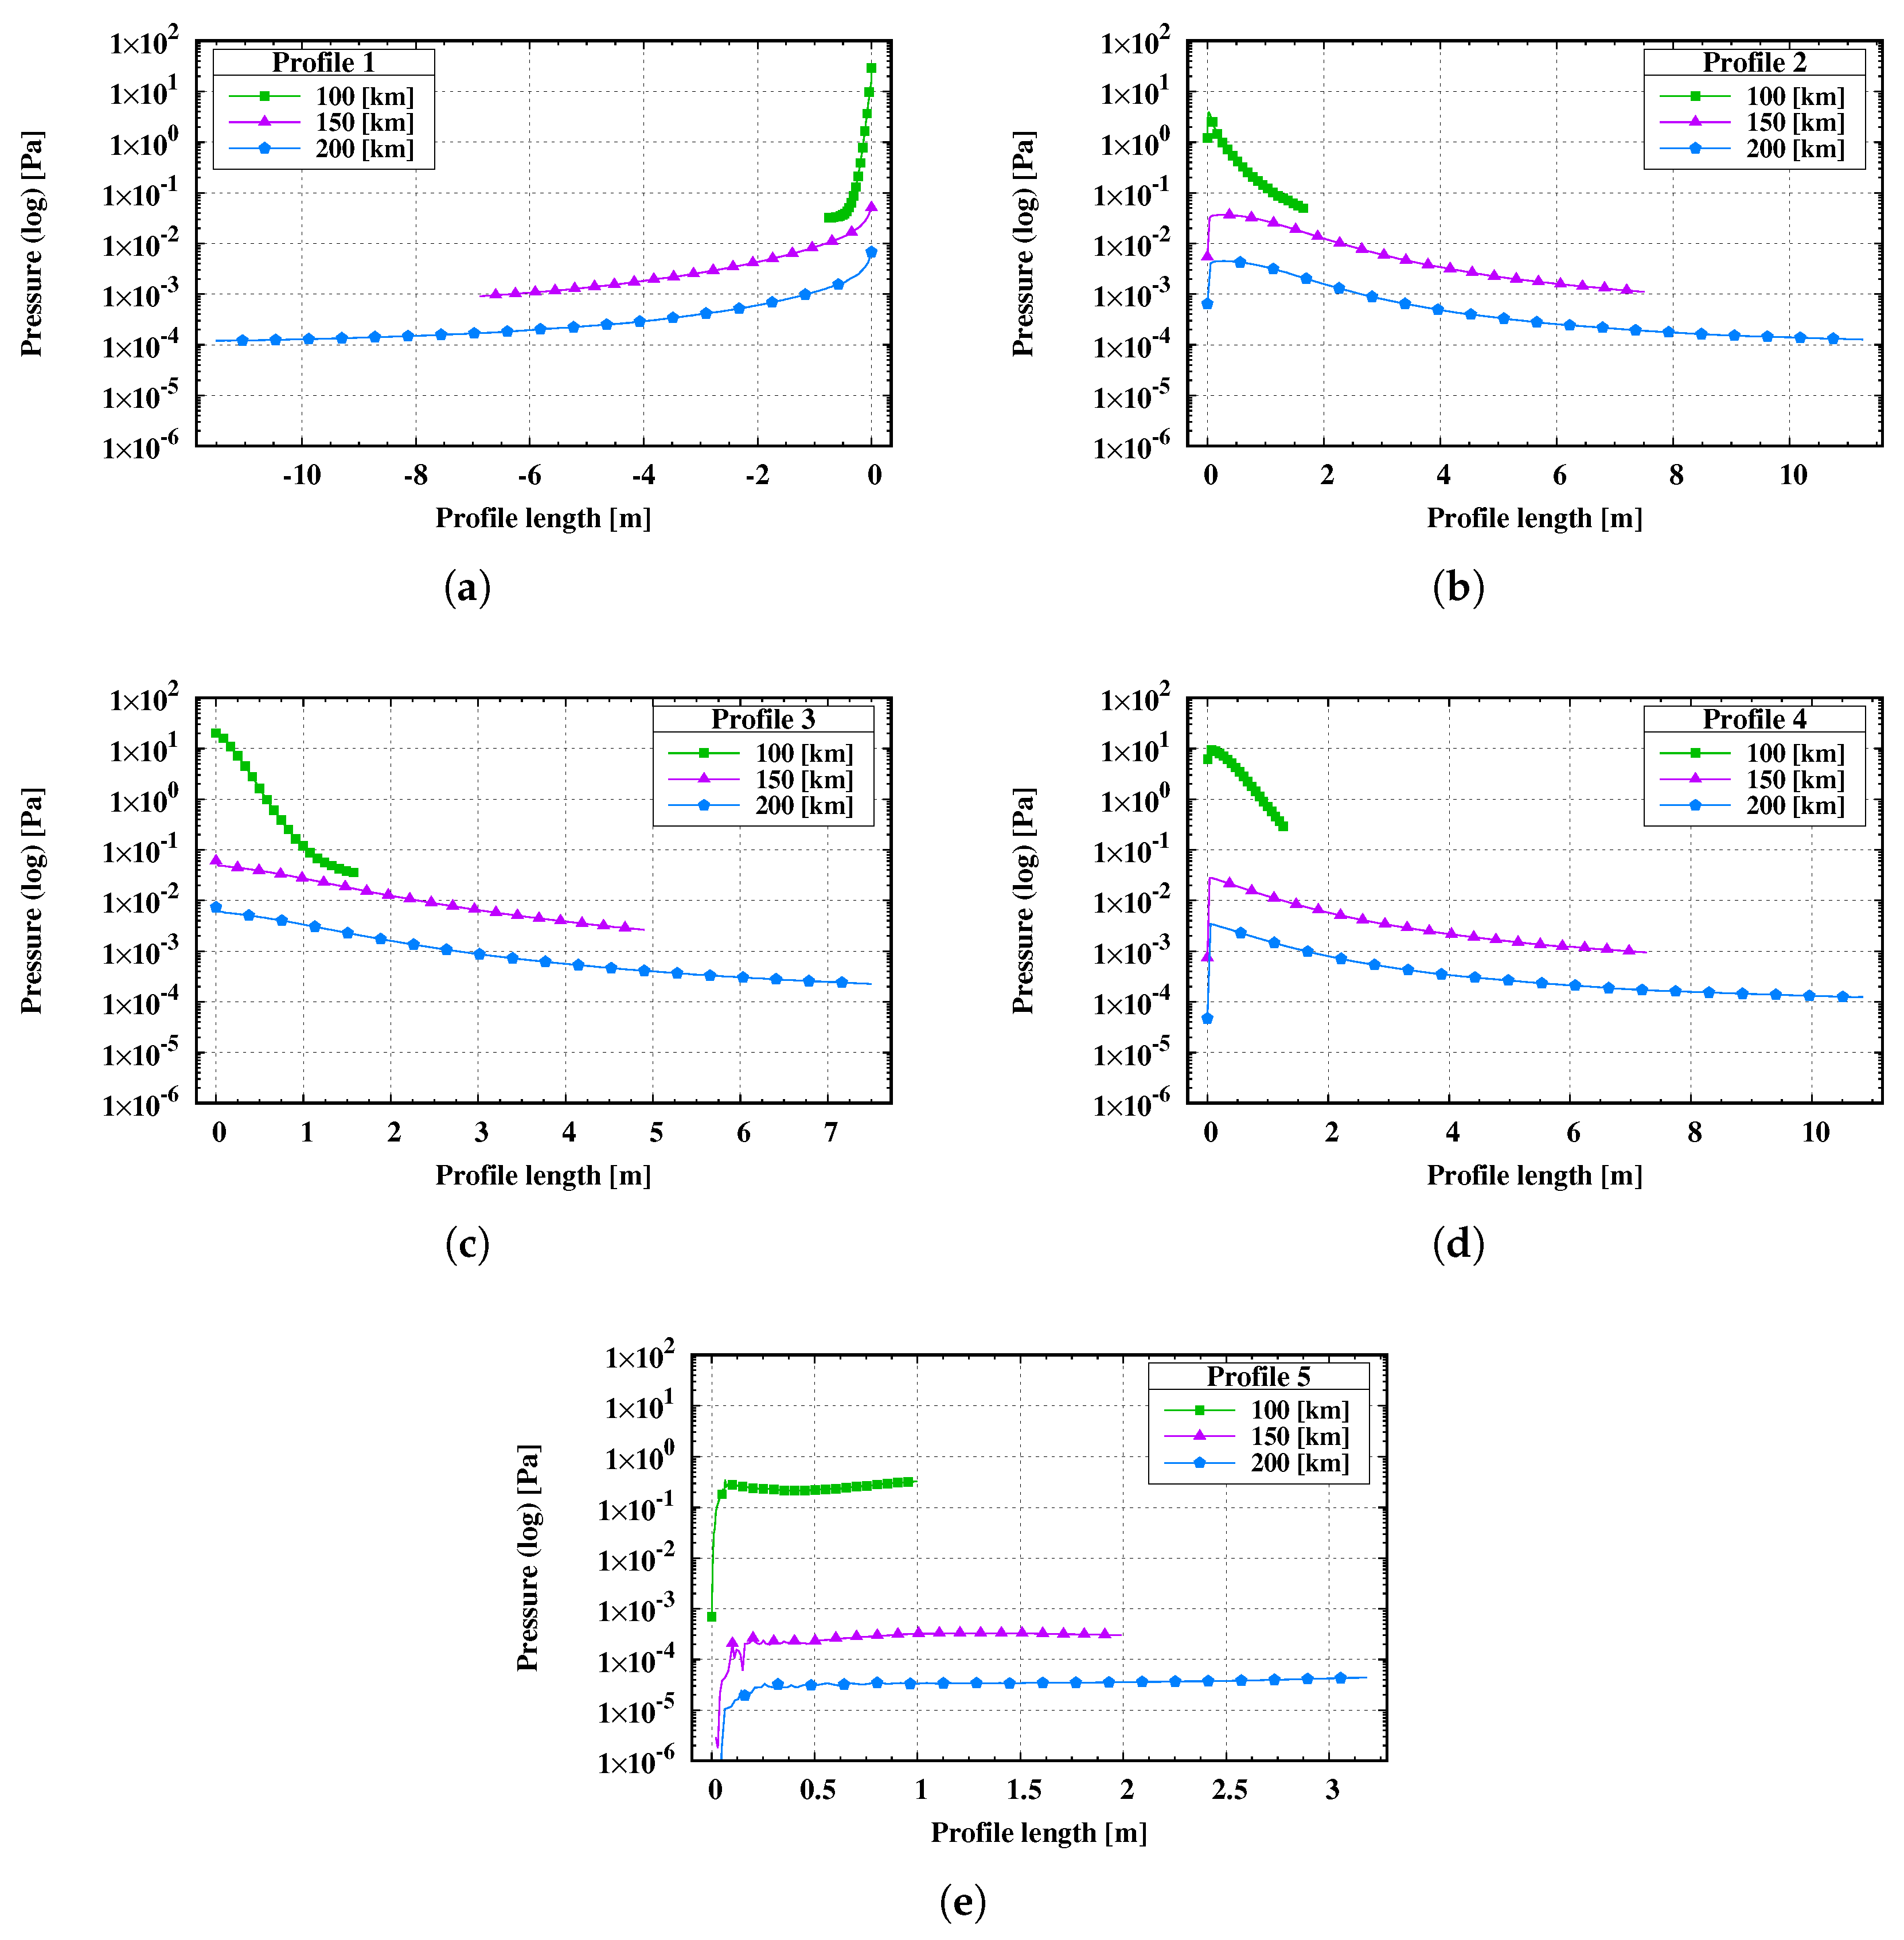
The pressure distribution across the studied altitudes is presented in
Figure 16. In all cases, the maximum pressure values are localized on the windward surfaces directly exposed to high-speed flow, specifically on the horizontal and inclined plates. At 100 km, a high-pressure region is observed at the stagnation point of the horizontal plate, reaching 15 Pa, while the inclined surface experiences a higher maximum compression of 21 Pa. This behavior is attributed to the higher momentum transfer occurring on the inclined surface. Unlike the horizontal plate, which is parallel to the freestream, the inclined surface presents a direct obstruction to the flow. This results in a greater change in the normal component of the molecular velocity during collisions, leading to a higher macroscopic pressure rise compared to the skin-friction-dominated compression over the horizontal surfaces. As the distance from the satellite increases, these aerodynamic effects diminish rapidly, and the pressure values return to freestream conditions.
As the altitude increases to 150 km and 200 km, the pressure magnitudes decrease by three and four orders of magnitude, respectively, reflecting the extreme rarefaction of the environment. At 200 km, maximum values near the plates reach only 0.006 Pa. A key observation is the increased diffusivity of the pressure field at these altitudes; the satellite’s influence on the flow extends to a significantly broader range, resulting in more diffuse contours than in the 100 km case. Behind the structure, the pressure drops to levels near freestream conditions—at least one order of magnitude lower than the maxima—approaching absolute vacuum as the probability of particle interaction becomes minimal.
Figure 17 highlights the significant differences in pressure scales across the studied cases. Profiles
and
illustrate the compression ahead of the body, where the pressure decreases monotonically with distance from the surface. This behavior is most pronounced at 100 km, where the high collision frequency confines the disturbance, whereas the 150 km and 200 km cases exhibit much lower gradients and a more extended disturbance upstream.
In contrast, Profiles and exhibit a different structure, characterized by a rapid pressure increase from the surface until reaching a maximum just a few millimeters away, followed by a sharp decrease toward freestream values. This localized peak defines the thin compression layer formed over the top and parallel surfaces. The upstream pressure propagation is a hallmark of high flows, where the large mean free path allows reflected molecules to travel further into the freestream before colliding with incoming particles.
Finally, Profile describes the pressure behavior along the wake, where the recovery is remarkably slow. An initial increase in pressure is observed within the first few centimeters from the surface, after which the values remain practically constant. Particularly in the free-molecular regime (200 km), the absence of intermolecular collisions prevents rapid pressure equalization behind the DiskSat. Consequently, this pressure deficit remains constant over a significant distance downstream, as the particles are unable to effectively refill the vacuum-like region created by the geometry’s shadowing effect.
5.4. Density Field Analysis
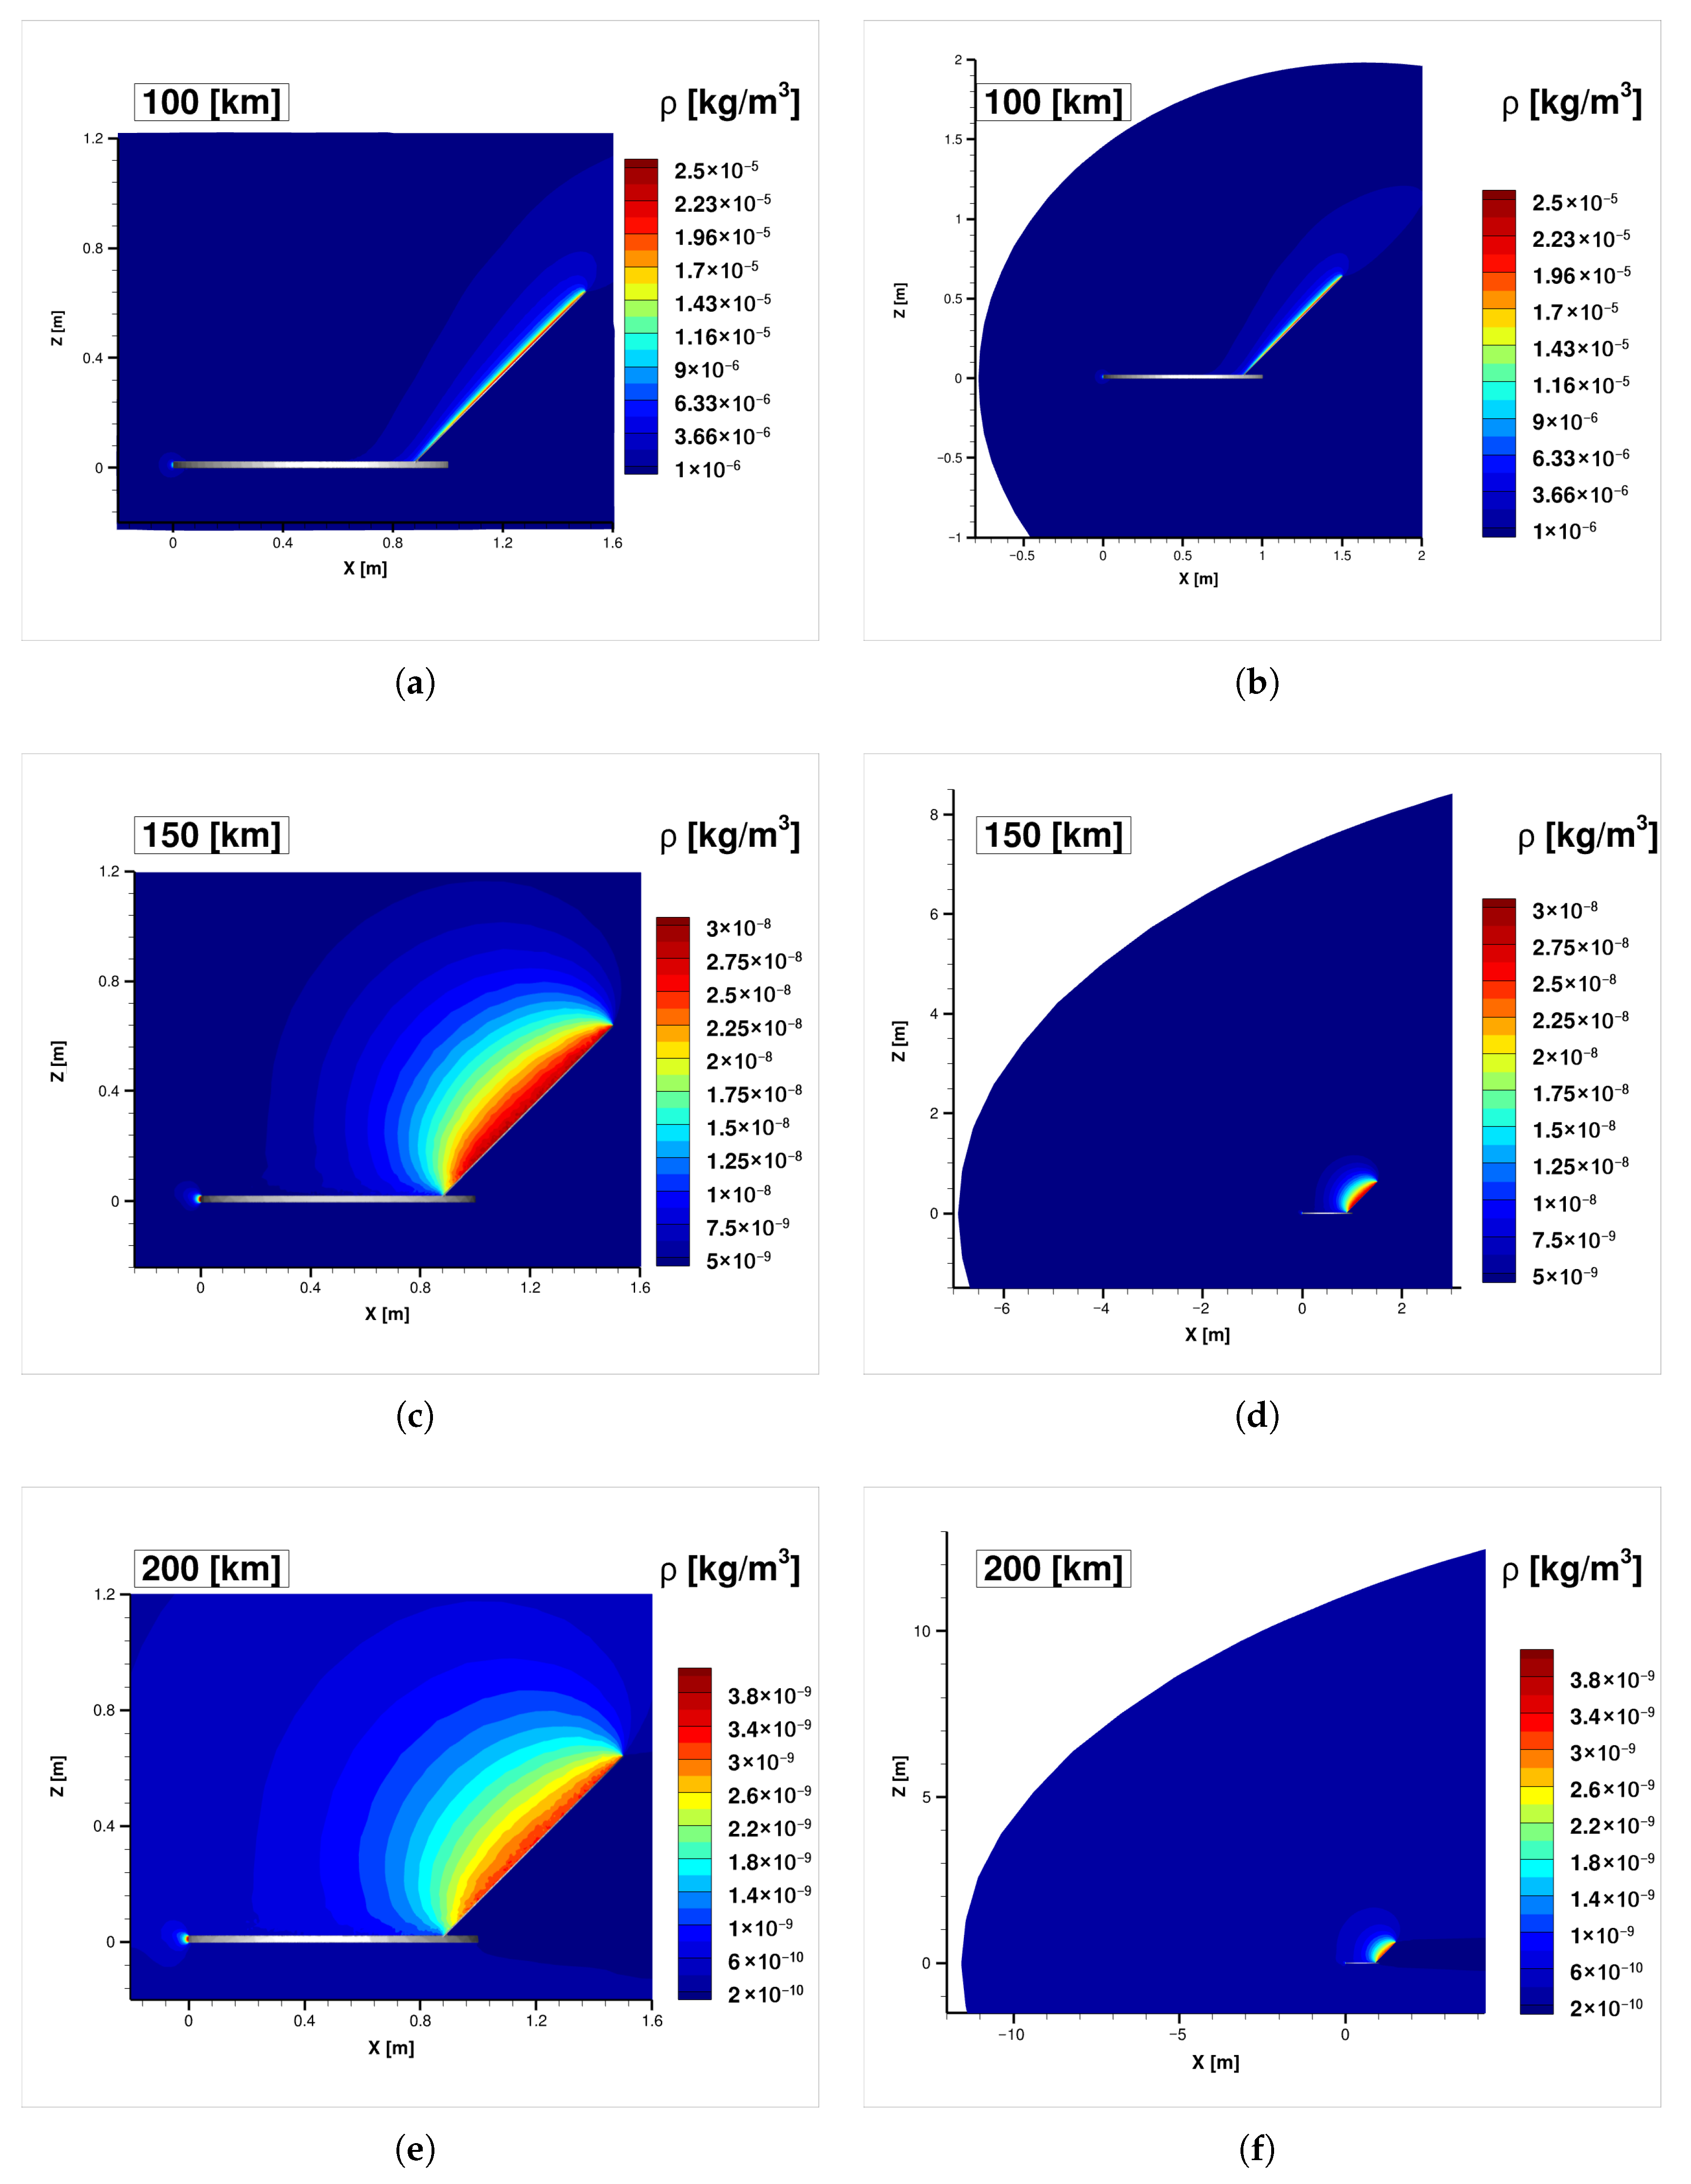
The mass density distribution around the DiskSat is presented in
Figure 18. At all studied altitudes, the density field is characterized by two primary compression regions: a high-density layer along the stagnation line of the horizontal plate and a more extensive compression zone across the inclined surface, with the maximum values in each case localized.
At 100 km, the local mass density reaches peak values of approximately kg/m3 near these surfaces. In this regime, the interaction is highly localized with very steep gradients; the aerodynamic effects on the flow become almost imperceptible just a few centimeters away from the structure. This significant increase relative to the freestream density is caused by the intense piling up of incoming molecules as they collide with those reflected from the satellite’s windward faces.
As the altitude increases to 150 km and 200 km, the absolute density decreases by several orders of magnitude, reflecting the lower atmospheric density. A key observation is that the density gradients become smoother and the disturbance region expands spatially as the flow transitions into the near-free-molecular regime. In these rarefied conditions, the “shock” is no longer a thin discontinuity but a diffuse layer in which the satellite’s presence is felt further upstream due to the large mean free path of the reflected particles.
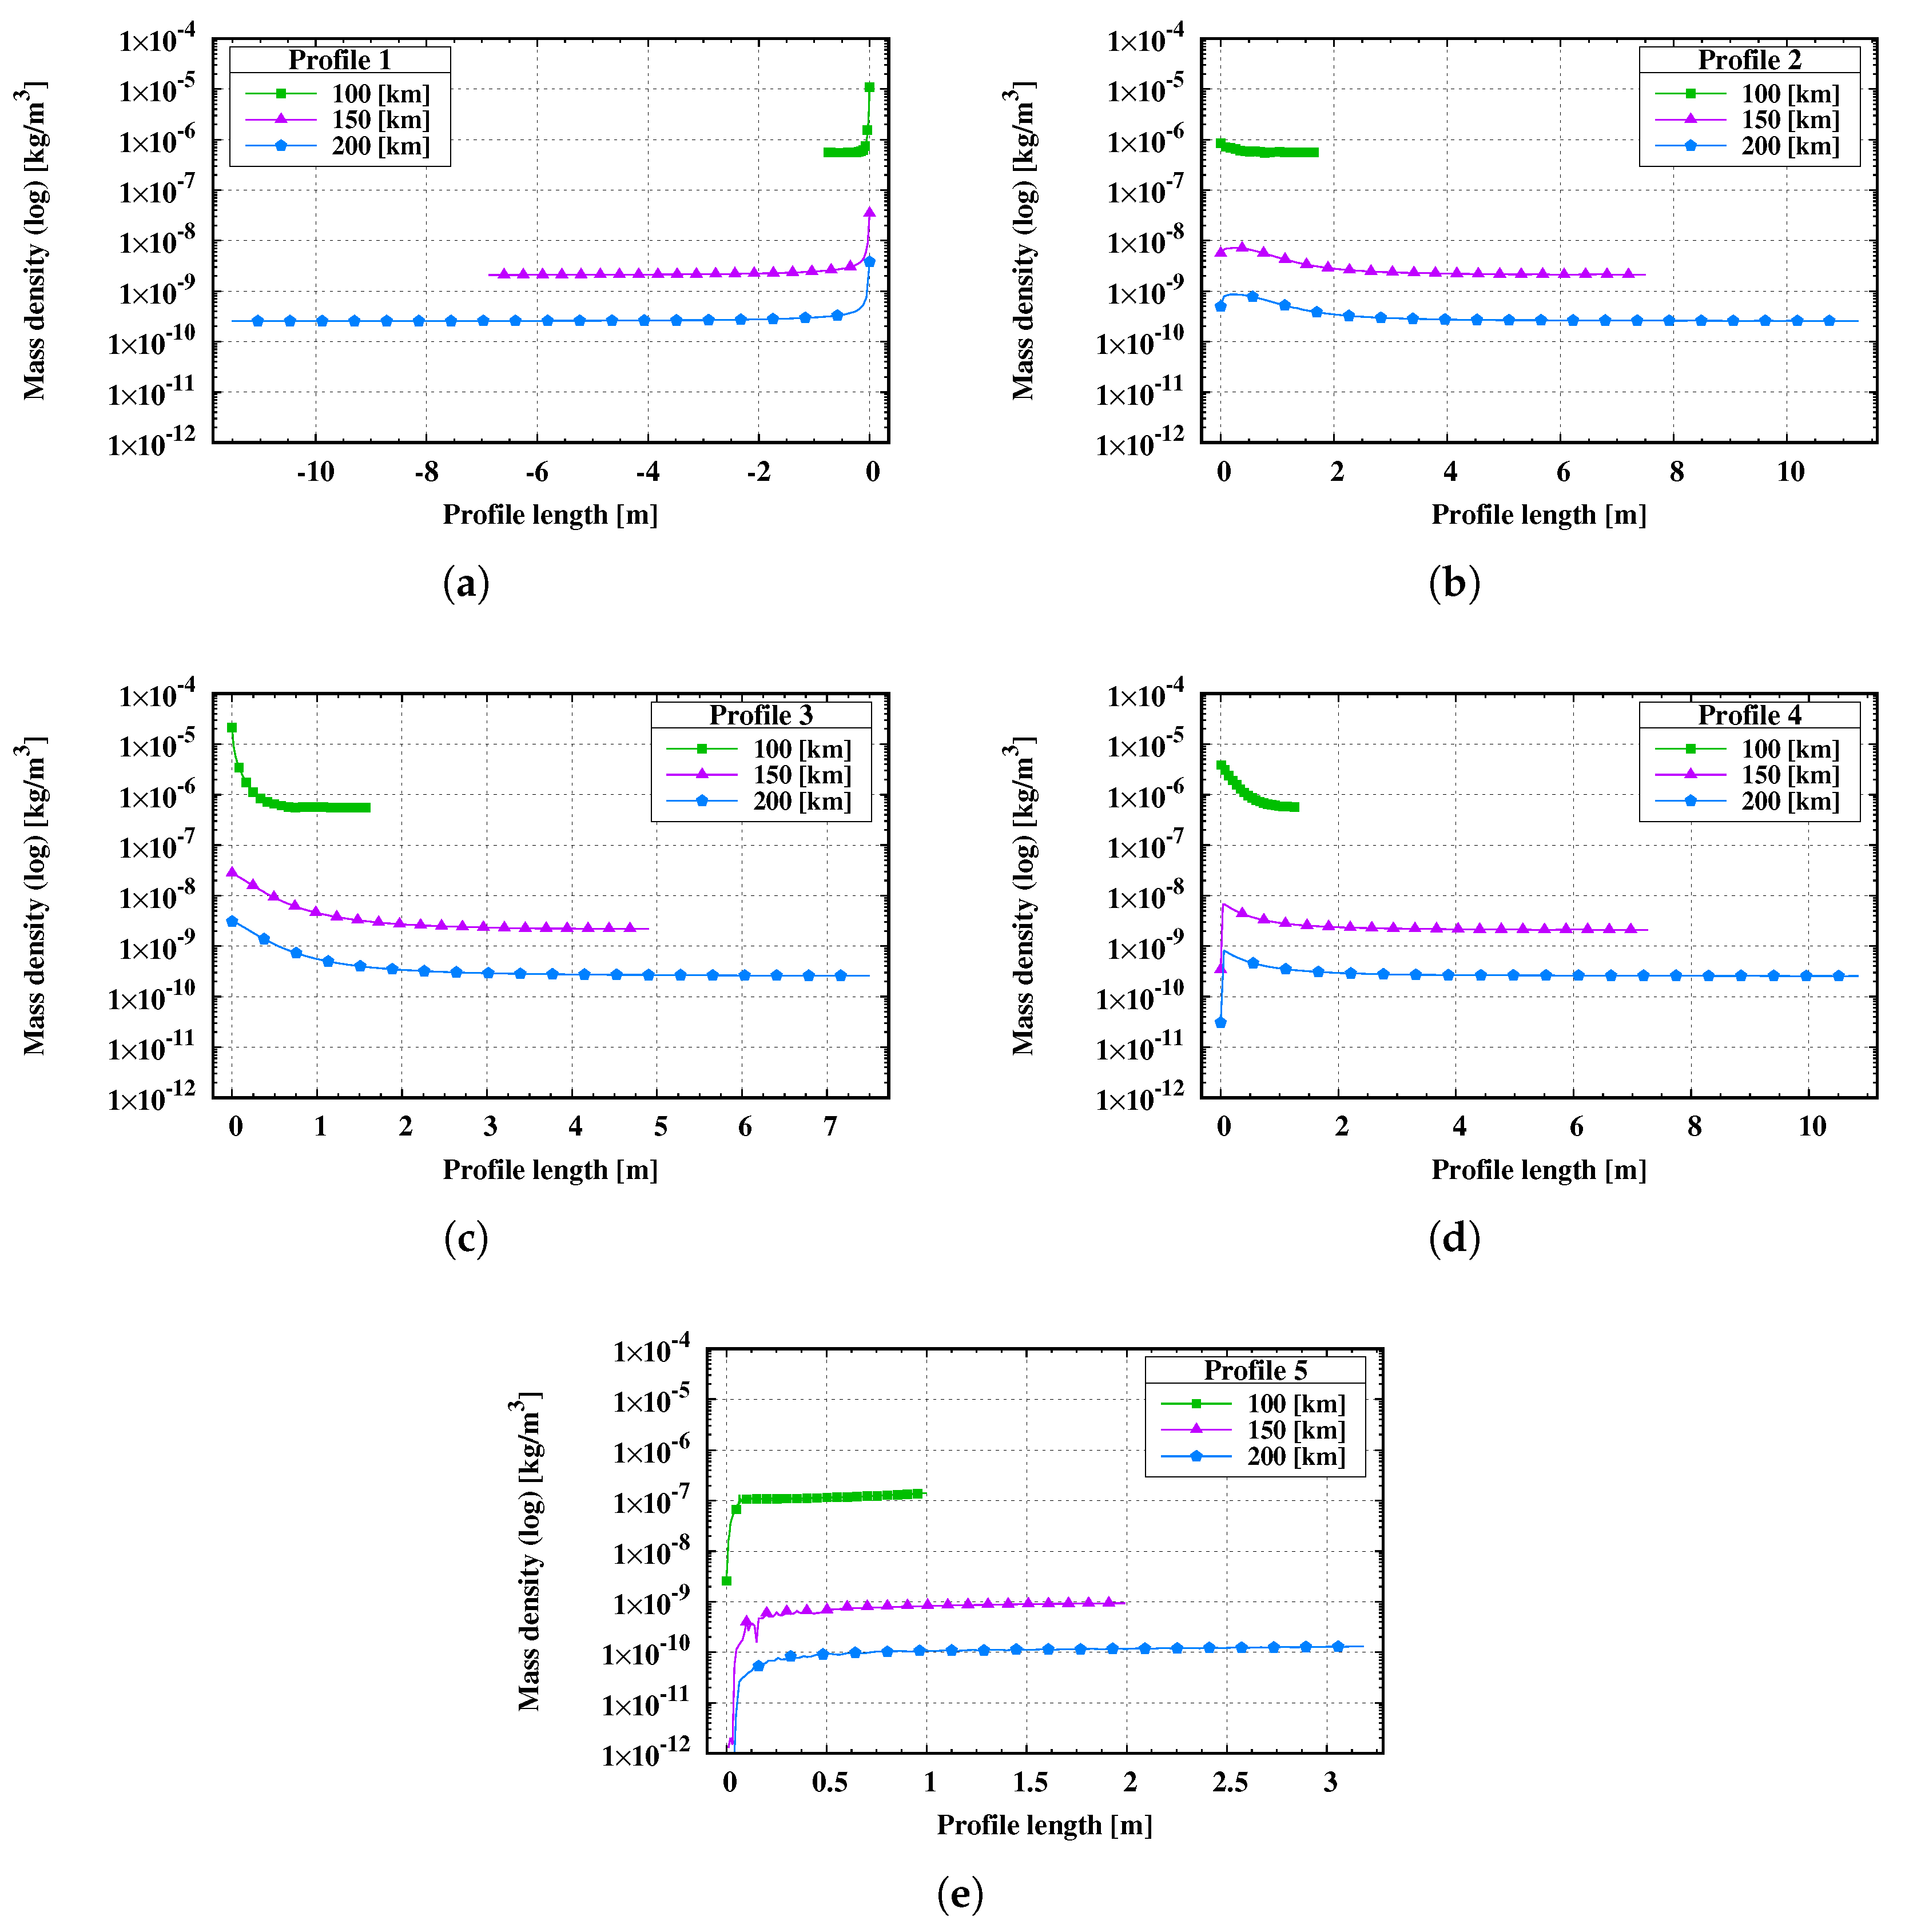
Figure 19 further characterizes the flow structure by measuring the mass density along profiles located at different positions of the DiskSat. Profiles
and
exhibit consistent decreases in density with increasing distance from the satellite. In contrast, Profiles
and
exhibit an initial increase from the surface before beginning a more gradual decrease. This behavior is consistent with the fact that the absolute maxima are located on the faces directly facing the flow, while the parallel surfaces experience a localized buildup as particles are deflected.
Finally, Profile confirms the existence of a persistent mass deficit in the wake region behind the satellite. The density starts from a near-vacuum state at the surface and then increases abruptly within the first few centimeters. Subsequently, it remains nearly constant, remaining lower than the freestream density. This behavior is a direct result of the high orbital velocity relative to the gas’s thermal motion, which prevents molecules from quickly refilling the volume behind the structure. For the 200 km case, recovery is extremely slow due to the near-absence of molecular collisions, resulting in a near-vacuum bubble that extends several body lengths downstream.
6. Conclusions
This study presented a numerical analysis of the rarefied flow over a DiskSat at altitudes of 100, 150, and 200 km using the Direct Simulation Monte Carlo (DSMC) method. The computational framework was successfully verified and validated against benchmark data for a flow over a flat plate, demonstrating the solver’s capability to accurately capture non-equilibrium phenomena across the transition and free-molecular regimes. The results confirm that the aerodynamic environment of the DiskSat undergoes a fundamental transformation driven by the drastic increase in the Knudsen number, which ranges from approximately 0.14 at 100 km to 240 at 200 km.
The analysis of the macroscopic fields reveals a clear evolution in the shock wave structure. At 100 km, the flow exhibits a distinct, thin shock layer characterized by steep gradients and high localized compression on the windward surfaces, consistent with the formation of a continuum-like bow shock. In contrast, at 150 km and 200 km, this structure becomes increasingly diffuse and extends significantly upstream. In these highly rarefied conditions, the thermal disturbance is not spatially confined near the wall but forms a broad cloud of energetic particles, confirming that the concept of a distinct shock wave is no longer applicable as the flow approaches the free-molecular regime.
Regarding thermal and wake dynamics, the simulations indicate a decrease in peak temperatures with altitude, despite a constant high velocity. This phenomenon is attributed to the low collision frequency in the rarefied regime, which inhibits the efficient conversion of directed kinetic energy into thermal agitation. Furthermore, a persistent aerodynamic shadow is observed behind the satellite, where density and pressure drop to near-vacuum levels. This wake region remains thermally frozen and recovers extremely slowly at 200 km due to the lack of molecular scattering, effectively isolating the leeward side from the freestream conditions.
Finally, the extreme diffusivity observed in the density and pressure fields at 200 km suggests a shift in the dominant aerodynamic force mechanisms. While the 100 km case exhibits strong pressure peaks indicative of pressure-dominated drag, the diffuse interaction observed at higher altitudes suggests that momentum exchange is governed by individual molecular impingement. This suggests that as the satellite enters the VLEO range, the total aerodynamic drag will increasingly be dominated by skin friction rather than by the pressure distribution.
The flowfield characterization and the identified compression zones in this study provide a fundamental aerodynamic baseline for the DiskSat platform. These findings serve as a technical guide for critical design decisions, such as the strategic placement of sensitive external components and the integration of electric propulsion systems to avoid backflow contamination. Based on these macroscopic findings, future work will focus on the quantitative analysis of gas–surface interactions, including the calculation of integral aerodynamic coefficients (, , and ) and surface properties to evaluate orbital lifetime and stability. Furthermore, to address the challenge of VLEO orbital decay, subsequent studies will explore active drag reduction strategies by optimizing the panel deployment configuration and analyzing aerodynamic sensitivity to various angles of attack.