1. Introduction
The development of novel technologies and innovative aircraft and propulsion concepts is strongly fueled by the need to make aviation more climate-friendly. Improvements in this regard are envisioned by enhancing propulsive and aerodynamic effectiveness as well as reducing emissions by using alternative energy sources, ultimately resulting in a reduction in the environmental impact of future aircraft designs. This emphasizes the need for new and potentially disruptive technological solutions as well as supporting certification regulations in all fields of aviation, from general aviation aircraft up to large-scale commercial transport aircraft. When it comes to the realization and certification of any aircraft design project involving novel technologies or disruptive design concepts, it becomes apparent that, besides optimizing the aircraft design for the intended mission and nominal operating conditions, safety considerations and safe behavior as well as performance in the presence of likely failure conditions are of equal importance. Profound safety considerations are hampered by the fact that for many disruptive technological solutions like fuel cells, hydrogen-fueled powertrains, or distributed propulsion, hardly any in-service experience is available. Furthermore, increasing complexity may be induced by elevating the number of involved system components, like an increased number of propulsors in distributed propulsion systems. Lastly, more integrated solutions tend to dissolve the clear assignment of top-level aircraft functions to subsystems. This is, for example, the case whenever the propulsion system is used purposefully to increase the high lift generating capability of the wing. The above facts encourage thorough and systematic accompaniment of any disruptive aircraft design or design optimization project by suitable means to not only account for nominal system behavior but also for any safety-relevant failure conditions.
Several research projects have already examined specific aspects of propulsion system failure effects on aircraft safety for disruptive propulsion concepts. In [
1], Hoogreef and Soikkeli present an in-depth analysis of a specific engine-inoperative scenario for the NASA X-57 distributed propulsion aircraft design, namely failure of the three leftmost propulsors, regarding the dynamic aircraft response and the recovery using differential thrust. Xie et al. take it one step further by evaluating failure rates and dynamic aircraft response to all possible propulsion failure combinations of the NASA PEGASUS aircraft design and comparing them to the one-engine-inoperative scenario of the ATR 42-500 [
2]. A systematic approach of a model-based reliability analysis for modular hybrid electric powertrains is introduced as part of the MAHEPA project (“Modular Architecture for Hybrid Electric Propulsion of Aircraft”) [
3]. The study shows how model-based reliability assessment can be used to optimize the architectural design of a hybrid electric powertrain regarding its reliability targets. When it comes to certifiability aspects of distributed electric propulsion in the CS-23 regulatory framework, Ref. [
4] provides a profound assessment of regulatory gaps and safety assessment-related challenges that need to be overcome to allow certification of such propulsion concepts. It emphasizes the highly integrated nature of DEP propulsion systems and the resulting interactions of the propulsion system with multiple top-level aircraft functions, substantiating the need to incorporate safety considerations already in early aircraft design phases. Ref. [
5] follows this notion and demonstrates the integration of a formalized safety assessment approach into preliminary aircraft design iterations. Many more research projects examine certain aspects of safety and controllability of disruptive propulsion systems [
6,
7].
Building on all the efforts mentioned above, the authors have developed a systematic automated safety assessment approach in a proof-of-concept stage in earlier studies [
8]. The novelty of this method is that it provides a modular approach for automatic and systematic collection of relevant failure case scenarios, including single and multiple component failures, based on an architectural powertrain system representation, simulating their effects on the availability of propulsors and energy supply paths, and predicting their effects on top-level aircraft metrics. The vast majority of research efforts mentioned above are related to theoretical aircraft designs that have not reached the maturity to be tested in real flight conditions yet. Therefore, from the author’s perspective, application of a model-based safety assessment to an existing flight platform and validating the related model predictions against flight test data can be seen as an important next step in maturing these methods and proving their usefulness.
The contribution of this paper to the field of research on certifiability and safety assessment of future aircraft design and supporting technologies is threefold:
Firstly, the maturity level of the in-house developed automated safety assessment shall be enhanced by application of the method to an existing scaled flight demonstrator aircraft, and to enable future validation with real flight test data.
Secondly, the value of combining flight tests with a simplified model-based safety assessment and the resulting synergies shall be demonstrated.
Thirdly, to examine a possible method to generalize assessment results to obtain more universally applicable and less configuration-specific conclusions.
1.1. VELAN Project
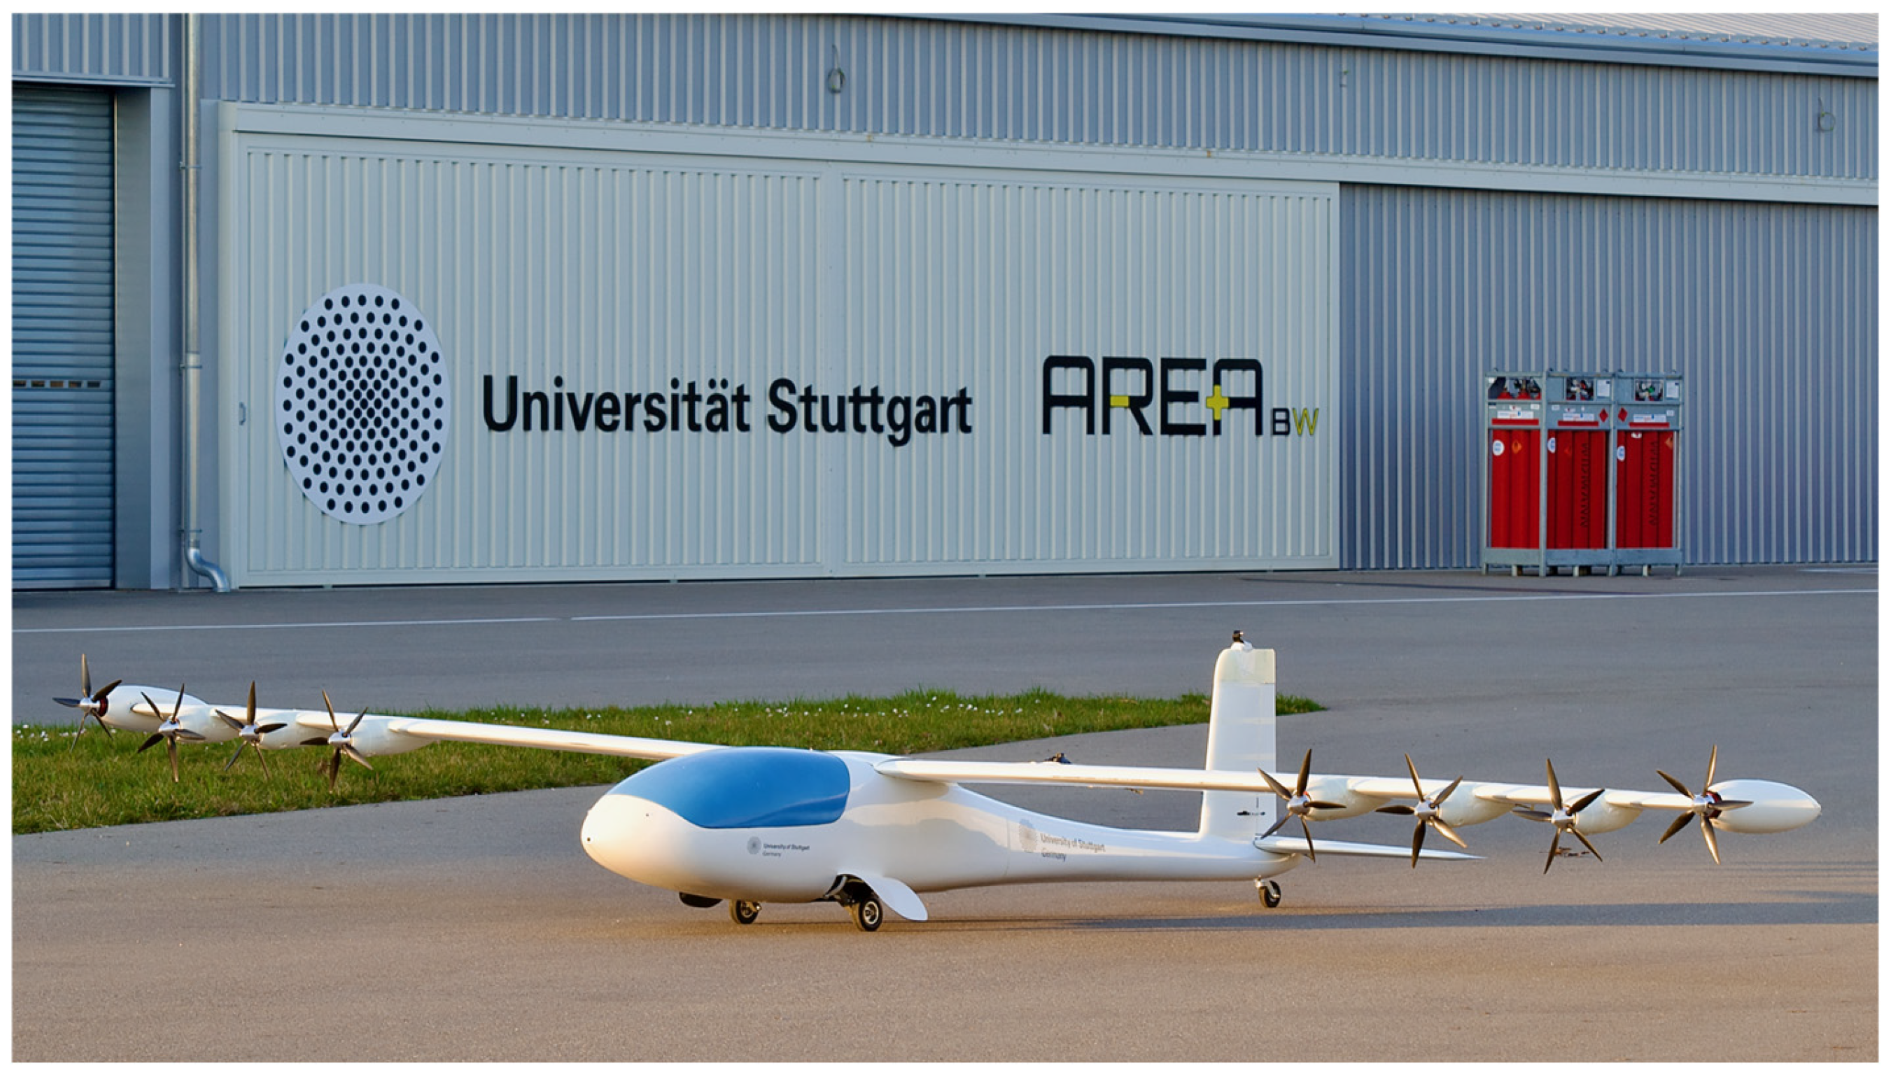
The VELAN project is an interdisciplinary project conducted by multiple institutes at the University of Stuttgart, funded by the German Federal Ministry for Economic Affairs and Energy (BMWE) as part of the LuFo program. The main objective of the project is to study the impact of distributed electric propulsion (DEP) on aircraft design, through both simulations and scaled flight tests in real environmental conditions, using a modified version of the scaled flight demonstrator (SFD) e-Genius-Mod (see
Figure 1).
As distributing small, efficient electric motors across the wing offers a range of potential benefits, such as an increase in lift through the blowing effects of the propulsion system, the project is divided into the following four disciplines:
Aerodynamics
Aeroacoustics
Flight mechanics
Aircraft Design
Through the results of each engineering discipline, the principles and mechanisms of flying with DEP are understood better, and allow for making predictions about whether the configuration could be utilised for passenger aircraft. One important aspect of a possible implementation of DEP is certification, which ultimately is a crucial point often overlooked in scientific studies. Since DEP is a new, unconventional configuration, even aircraft behavior and thus controllability during nominal and off-nominal flight conditions are of interest, as there is presently a lack of experience.
In addition to this, the VELAN project offers an additional unique aspect: As DEP can be used to induce yaw and roll moments, the possibility of reducing or even removing the vertical tailplane (VTP) is part of the investigation. Therefore, the VTP of the VELAN SFD consists of five segments, which enable a gradual reduction. Aside from a flight mechanic and aerodynamic perspective, the effects on aircraft safety, especially when considering relevant failure scenarios, are of particular interest as well. What makes VELAN unique compared to most other studies is the possibility to test these scenarios in relevant conditions.
1.2. CONCERTO Project
The CONCERTO project is an EU-funded project belonging to the CLEAN AVIATION joint undertaking, a European partnership with the aim of supporting and originating innovation to enable future climate-neutral, decarbonised aviation. The acronym CONCERTO stands for “Construction Of Novel Certification Methods and means of compliance for disruptive technologies”. One of the primary goals of the project is the development of draft regulatory material, including preliminary methods of compliance to support certifiability of future innovation, disruptive aircraft designs and propulsion architectures. Furthermore, the feasibility of a digital certification framework including model-based certification approaches shall be examined. Results are expected to be transposable and scalable, thus delivering valuable insights regarding certification of future aircraft concepts in various sectors, including general aviation, rotorcraft, business jets, as well as medium-long range commercial aircraft. Thereby, three technological areas of specific interest based on the three “core thrusts” of the CLEAN AVIATION initiative have been identified:
Ultra-Efficient Regional Aircraft → High Voltage Distribution
Ultra-Efficient Short and Medium Range Aircraft → Active Wing
Hydrogen-Powered Aircraft → Hydrogen Propulsion
Within the project, generic “Proof of Concepts” (PoCs) have been developed as a baseline for further investigations and certifiability considerations. In the following, the High Voltage Distribution (HVD) PoC shall serve as an example to demonstrate the difficulty of accomplishing the goal of drawing transferable and universally valid conclusions concerning safety and certifiability, based on the Proof of Concept alone, without being restricted to a very specific aircraft configuration and size.
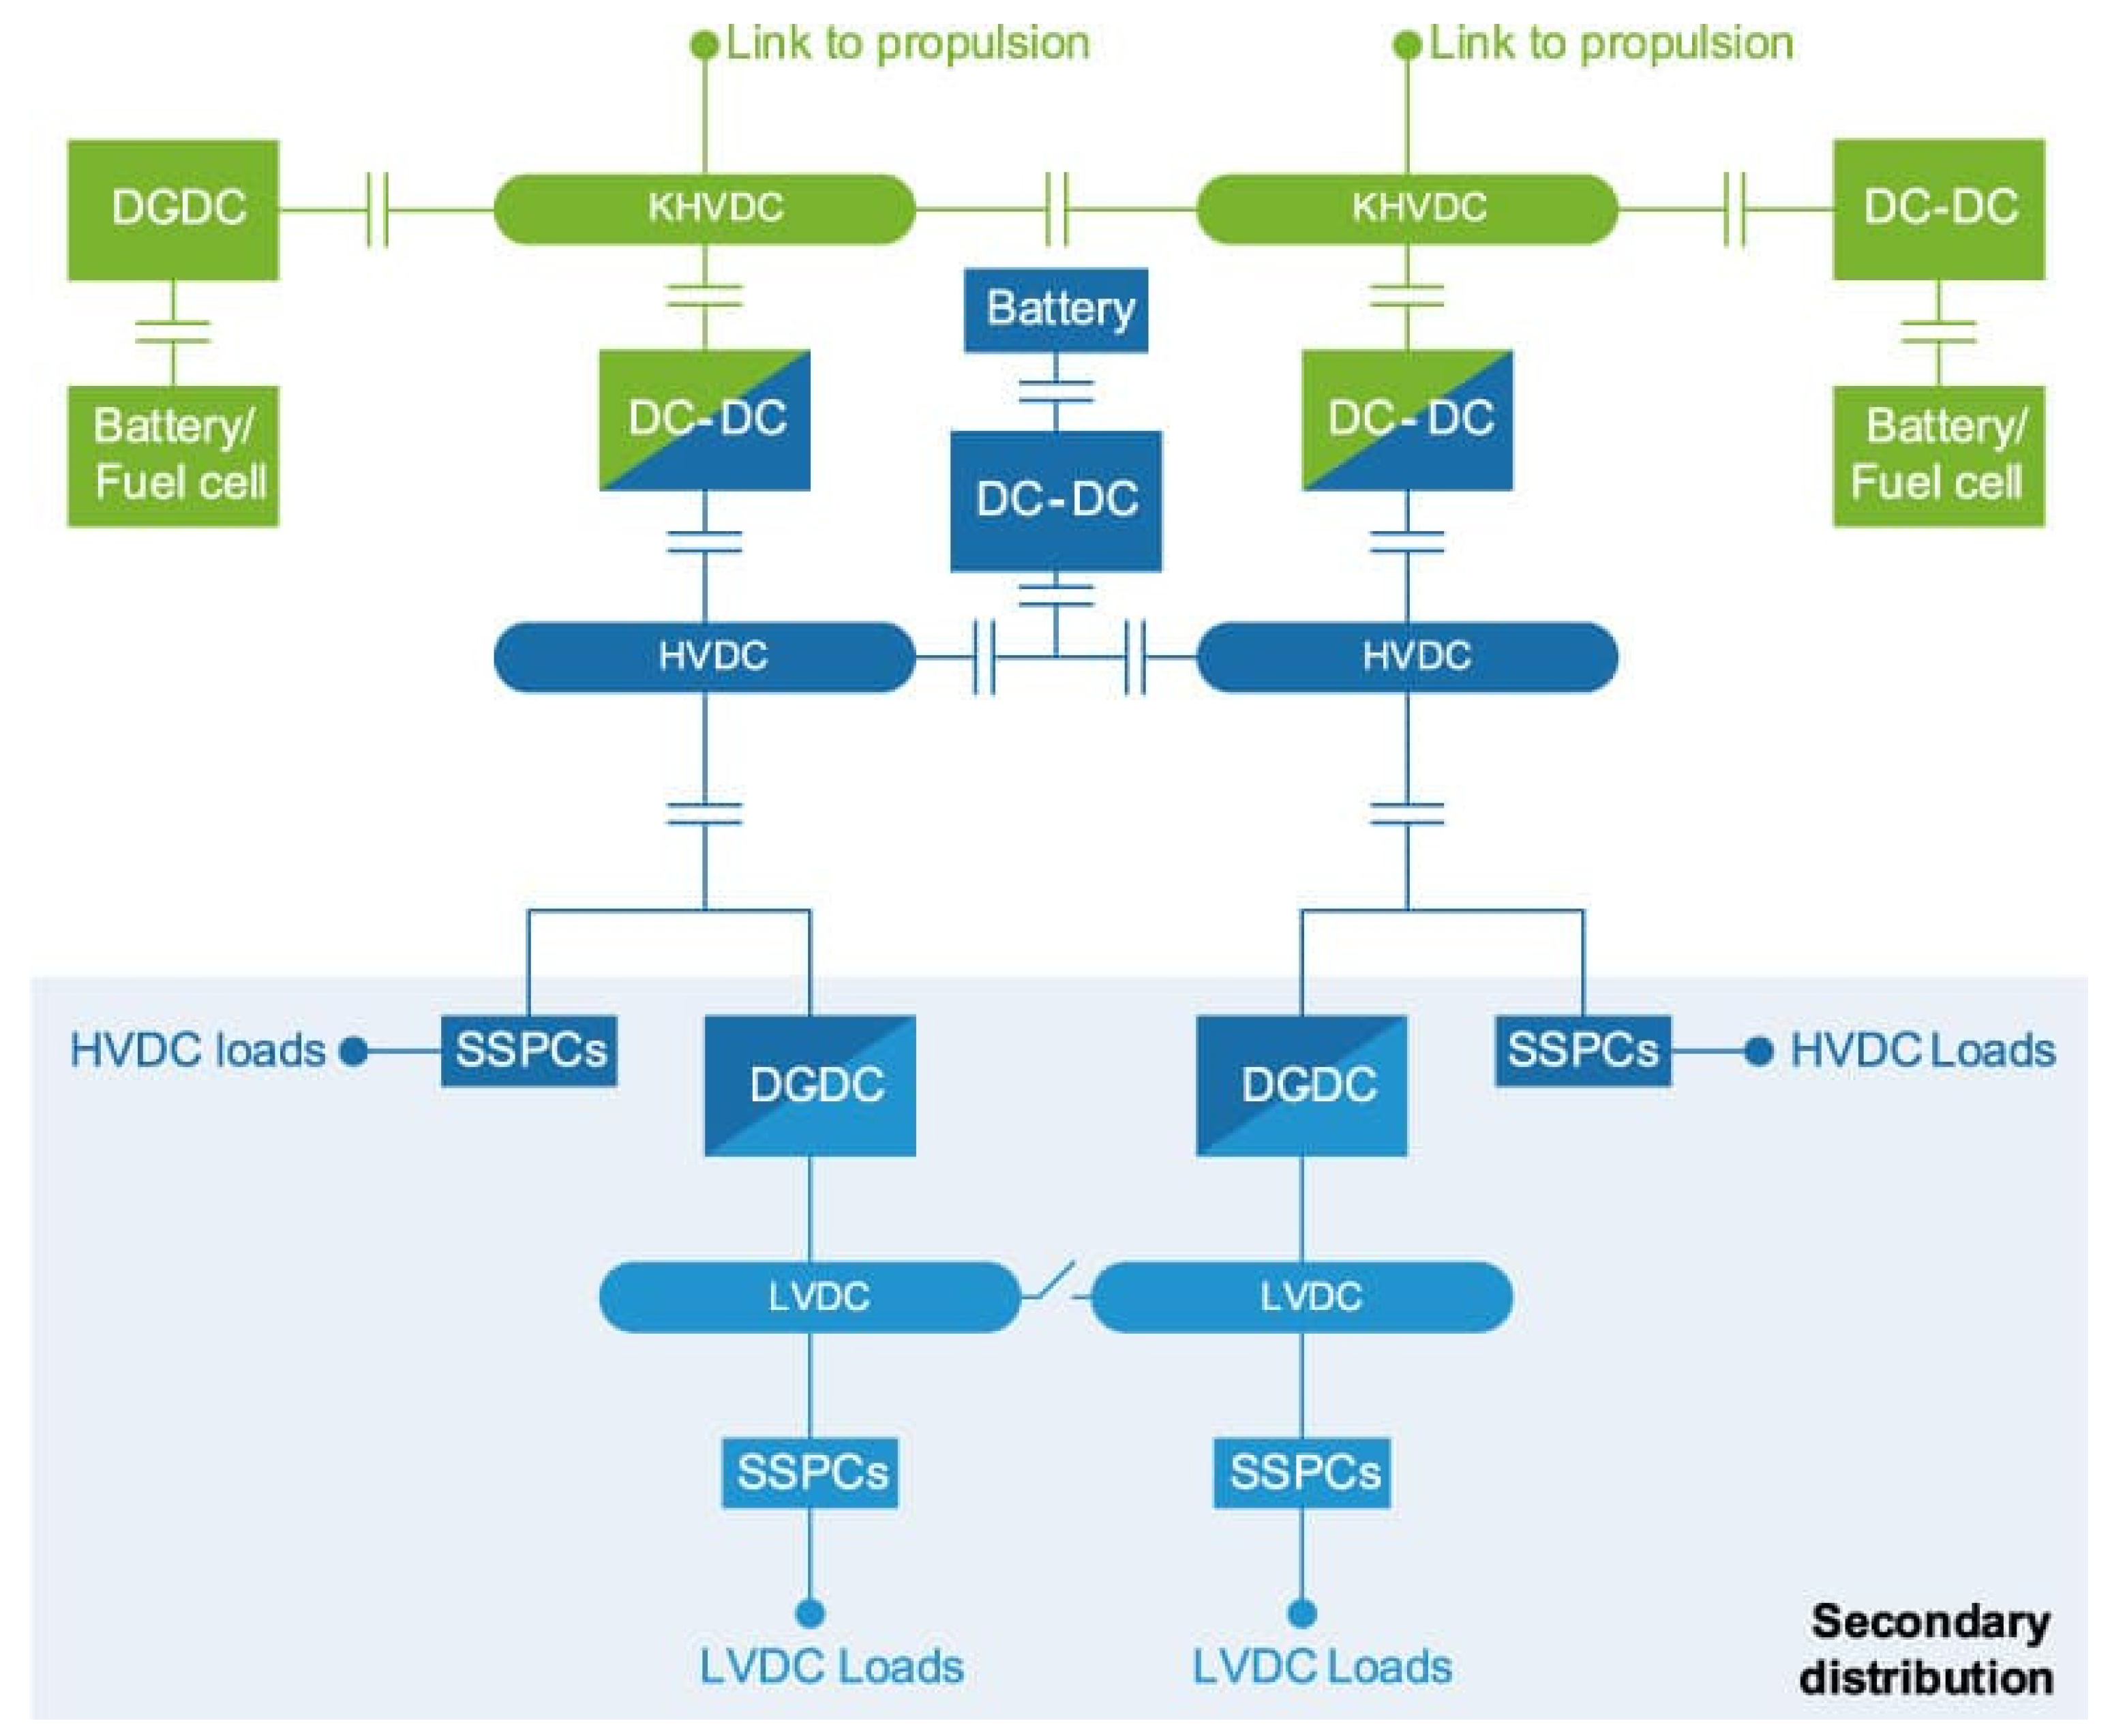
The HVD PoC, as examined within the CONCERTO project, originally evolved within the HECATE project [
9] and is illustrated in
Figure 2. It features the redundant distribution of very high voltage (KHVDC), high voltage (HVDC), as well as low voltage (LVDC) to the aircraft propulsion systems, as well as to non-propulsive loads. The concept is generic in the sense that neither the linked propulsion system design nor the allocation of non-propulsive electrical consumers is specified. Furthermore, it accounts for the possibilities that electrical power is provided by either fuel cells, battery packs, or any combination of both.
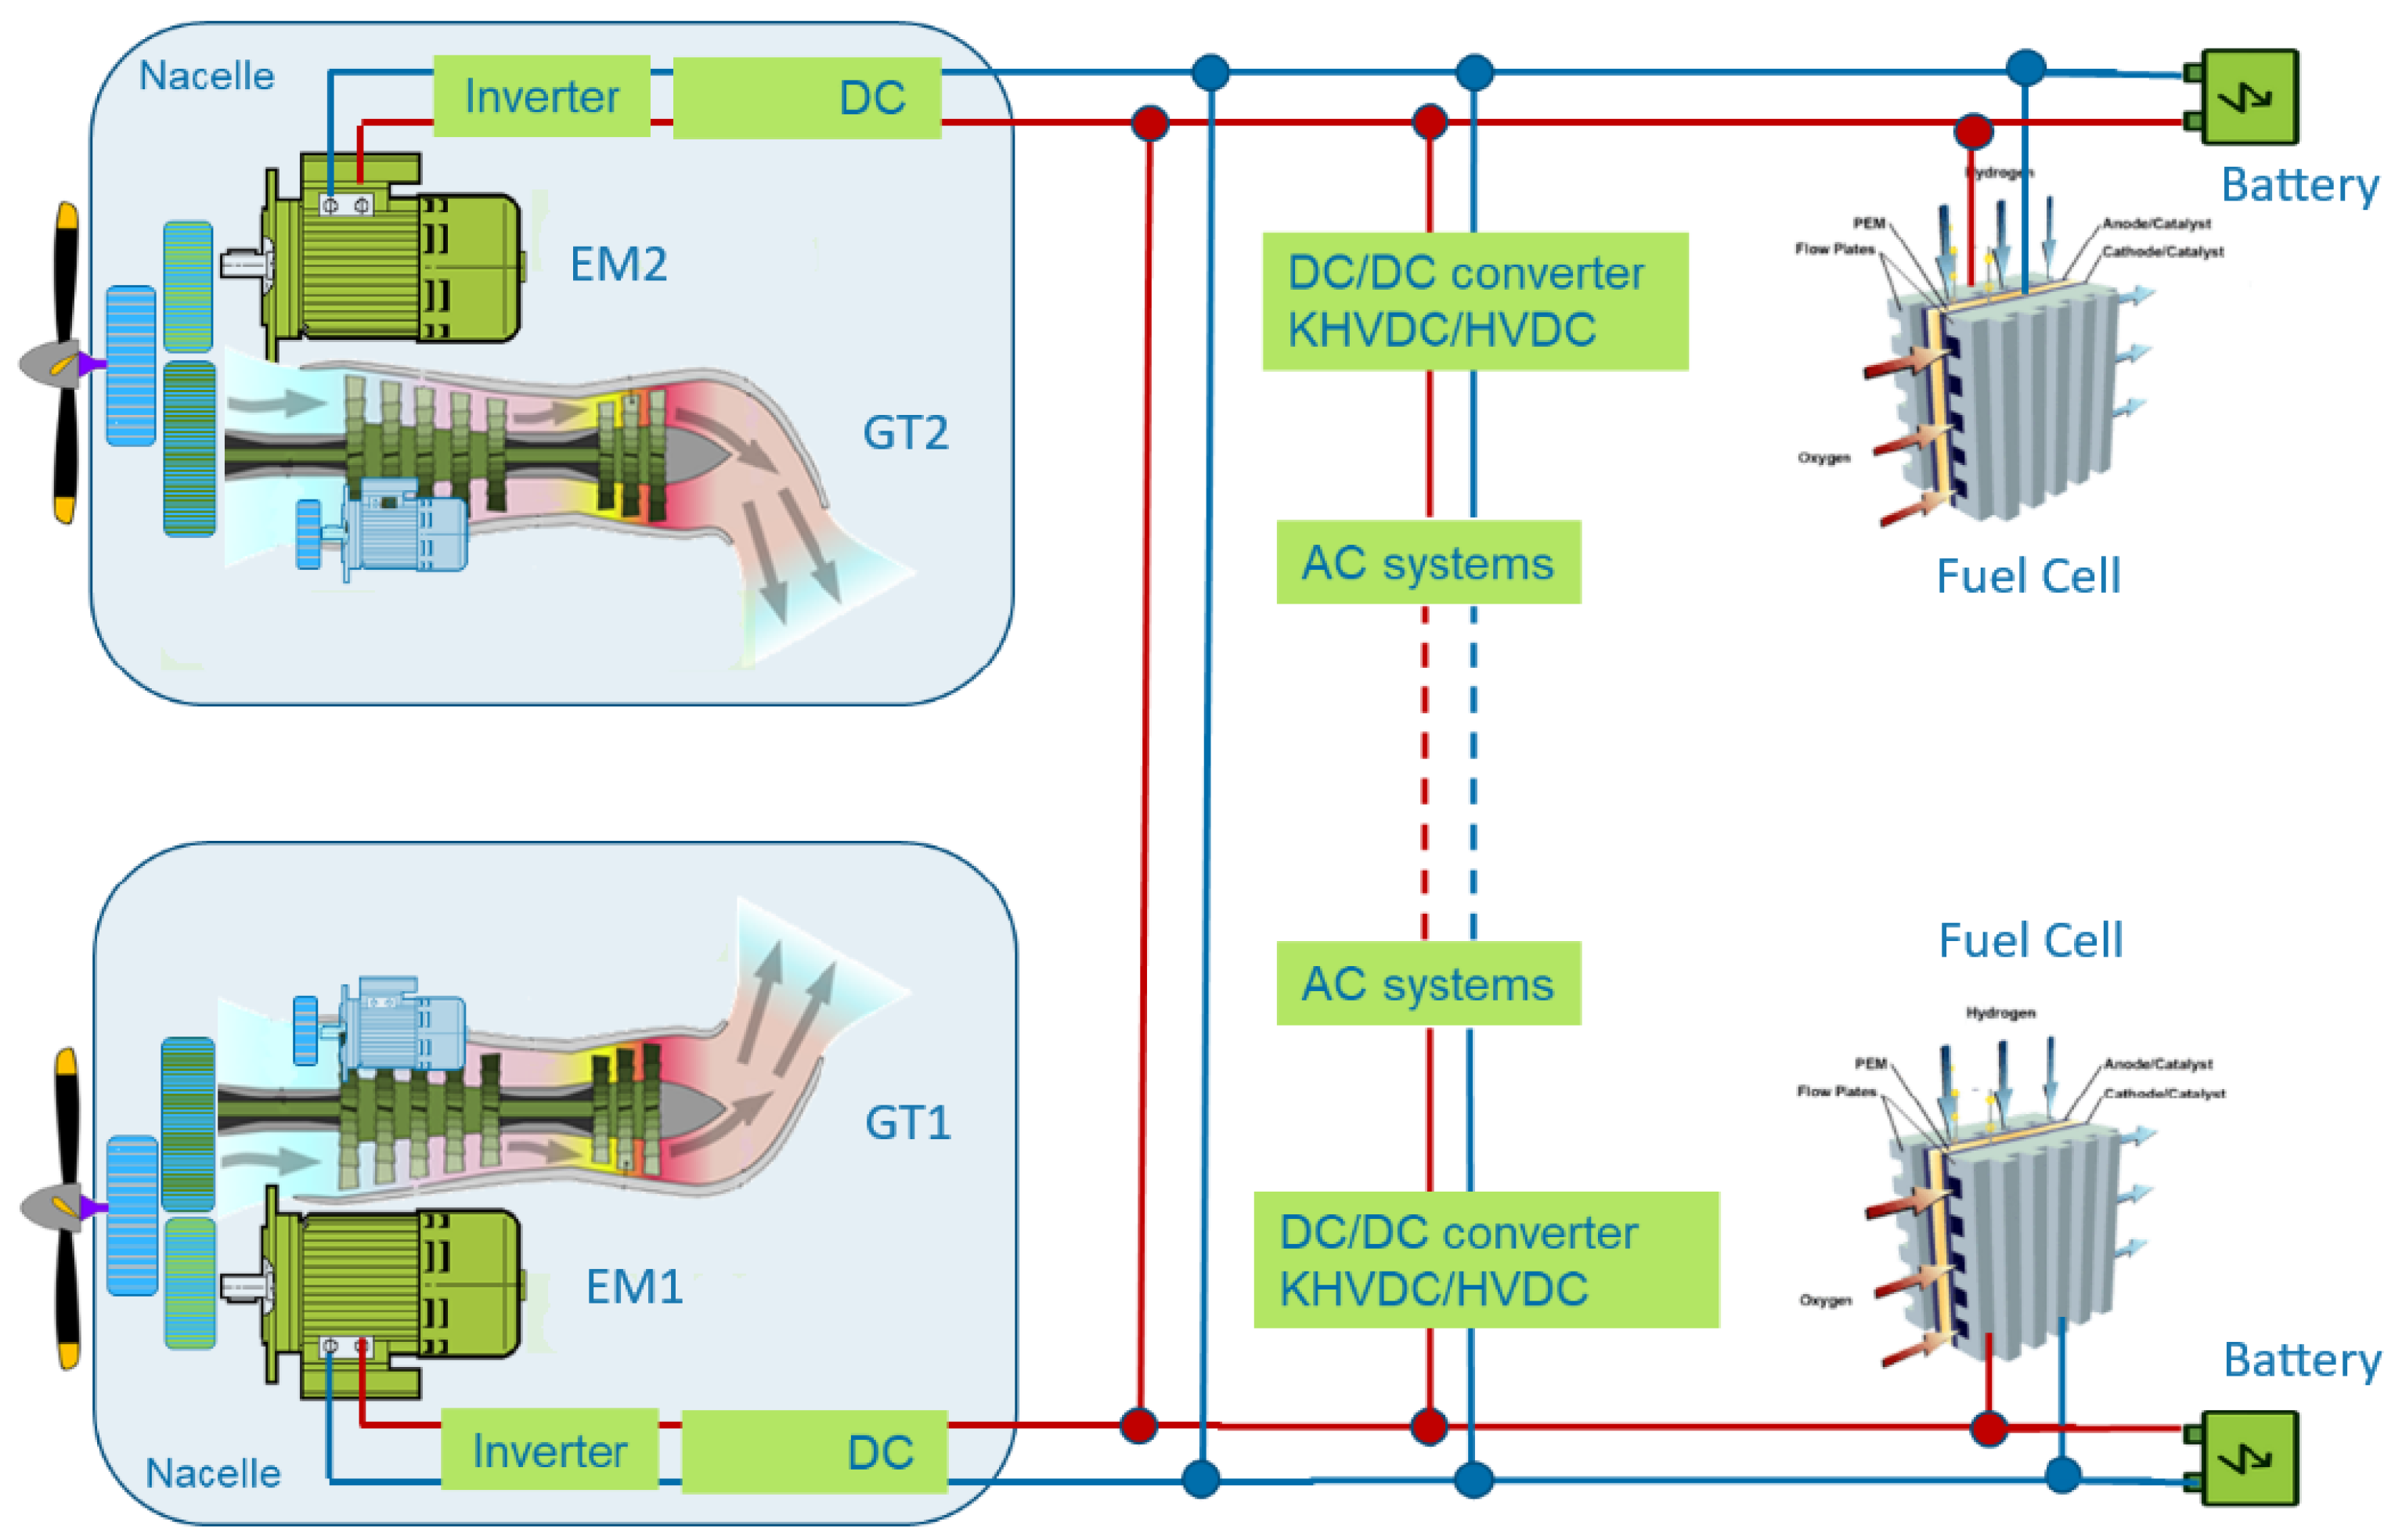
Implications of HVD system design on top-level aircraft safety are difficult to predict without making specific assumptions on the connected propulsion system and the overall aircraft design. One powertrain architecture that is envisioned to be used together with the CONCERTO/HECATE HVD system design originates from the Clean Aviation Project HERA (“Hybrid-Electric Regional Architecture”). The Use Case A of the HERA project features one electric motor combined with one electric gas turbine on each wing that drives a propeller via a gear connecting the two motors on each side.
Apart from this specific configuration, due to its generic nature, the HVD system architecture is considered to be universally suitable to provide an electrical power supply for other possible power train architectures as well. This complicates drawing conclusions about the impact of HVD system design and sizing on the overall aircraft safety, since the propagation of failure conditions in the HVD system level to top-level aircraft performance effects may strongly depend on the design of the connected propulsion system.
Thus, this paper shall examine the feasibility of following the strategy of applying existing safety assessment methods to a very specific aircraft configuration, in this case, the e-Genius-Mod in its VELAN project configuration. Thereafter, quantitative and configuration-specific results shall be used and transformed into more universally applicable and less specific conclusions by simplification and conversion into non-dimensional metrics describing the top-level effect of failures. Ultimately, this proceeding shall serve the purpose of thoroughly examining the implications of an integration of the HVD PoC into a range of conceivable aircraft designs and powertrain architectures. Application of the resulting non-dimensionalised depiction of propulsor failure effects will be demonstrated for the HERA Use Case A architecture as given in
Figure 3. Furthermore, the effects of using a distributed propulsion variant similar to the e-Genius-Mod in combination with the HERA envisioned airframe will be shown, which is considered comparable to the HERA Use Case B, depending on the ultimate decision regarding the number of propulsors.
2. Safety Assessment Framework
To assess possible failure scenarios for the e-Genius-Mod powertrain architecture, an automated model-based safety assessment method is used, which has been previously developed by the authors [
8]. The following sections provide a summary of the method and the steps that have been taken to provide adequate simplified aerodynamic and propulsion models for the e-Genius-Mod and to extend the method to incorporate aero-propulsive effects that are caused by the interaction of propeller slipstream with the aircraft wing.
2.1. Existing Model-Based Safety Assessment Framework
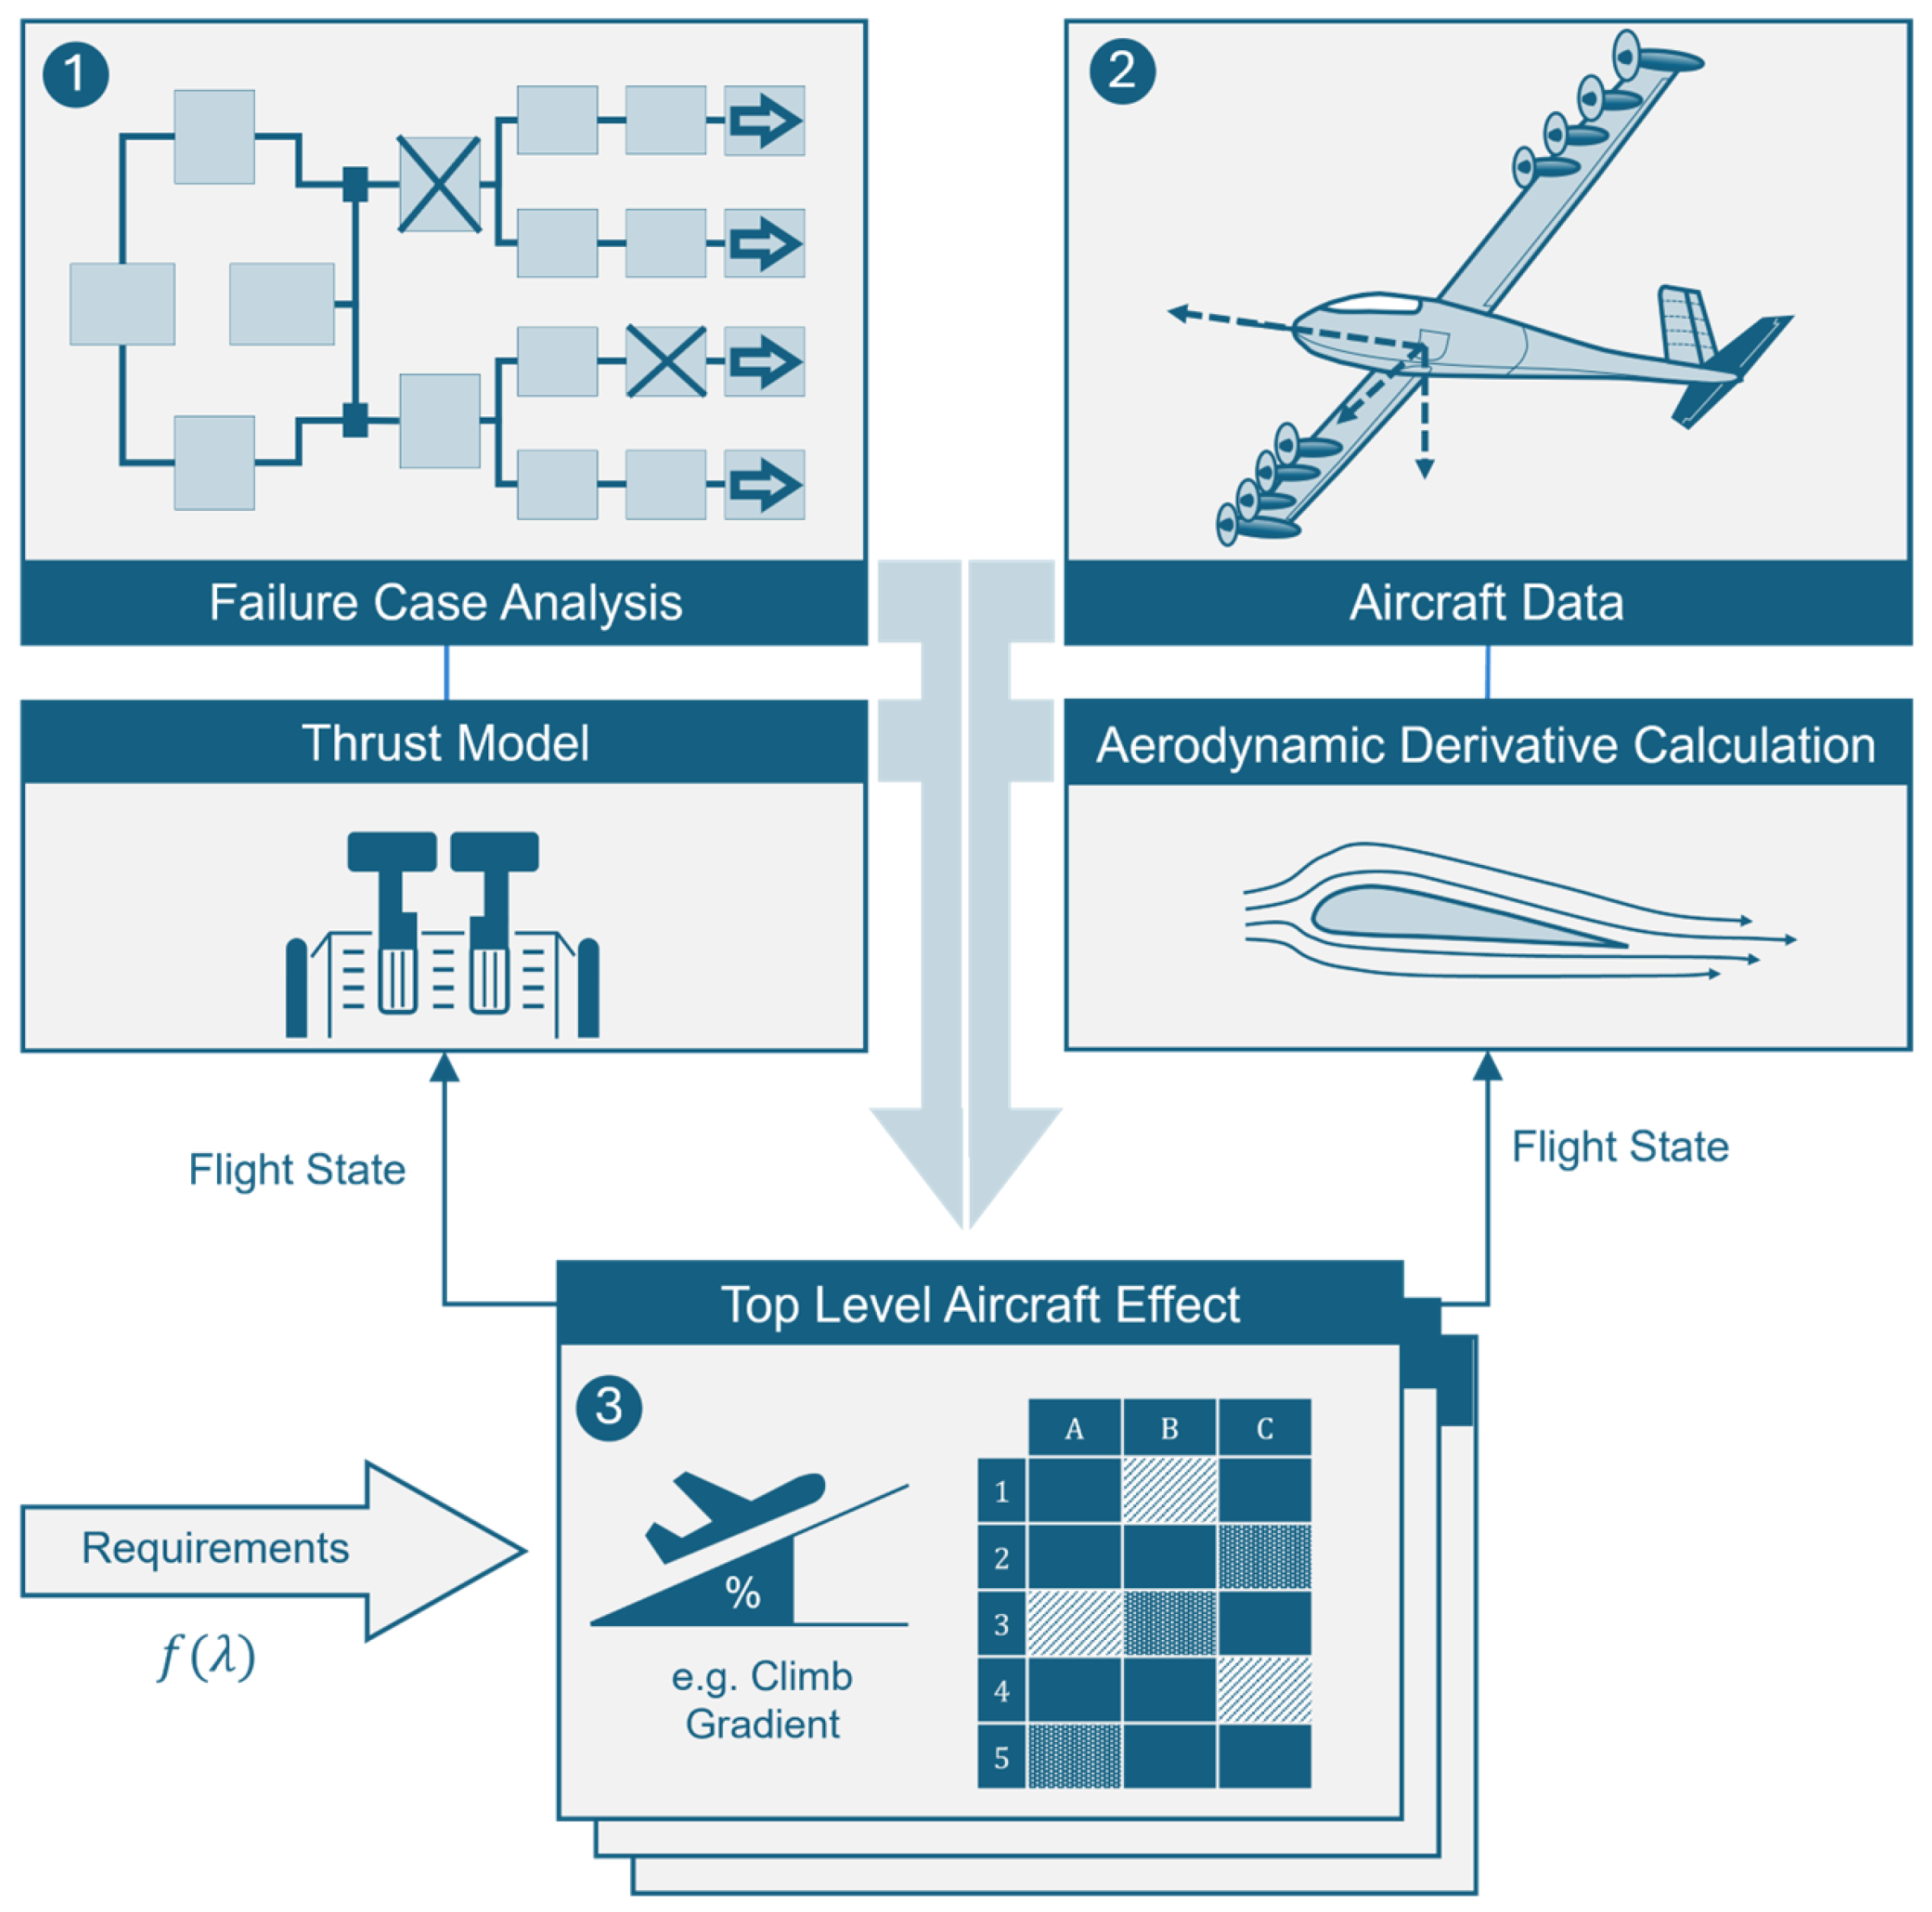
Figure 4 provides an overview of the main steps constituting the automated safety assessment framework. For a more detailed description of the method and its underlying assumptions, the interested reader is asked to refer to [
8].
The safety assessment method, as it is currently implemented, is based on input data that is typically available in early aircraft design phases. A prerequisite for the application of automated safety assessment is the availability of the powertrain architecture description, which must be transferred into a block diagram format based on readily available basic components like battery, converter, motor, and thrust output. For each component, its respective failure rate must be specified. To account for possible uncertainty of the failure rate, a range of failure rates may be specified for each component in terms of a best case, nominal case, and worst-case scenario [
8]. Furthermore, basic aircraft geometric data must be available, as well as a suitable model for maximum available thrust in relation to density and flight velocity. Lastly, the aircraft lift and drag coefficients in relation to the angle of attack must be known. Once this data has been collected, the remainder of the method is executed automatically and thus can be easily repeated multiple times, e.g., for different input parameters or powertrain architecture variants.
Figure 4 illustrates the three basic modules that constitute the automated safety assessment process: In the “Failure Case Analysis” part, all relevant failure case scenarios in terms of single and multiple component failures are systematically collected and examined regarding their functional implications. Therefore, a recursive algorithm is used to compile all possible combinations of component failures with a combined failure rate above a predefined threshold. Thereafter, the block diagram model of the powertrain architecture is used to model energy flow for each failure case scenario, thus providing information about which energy sources are accessible for a certain failure case, which thrust outputs are functional and possible energy supply paths, together with their overall efficiency. By combining this information with the thrust model, maximum available thrust per propulsor can be inferred for each failure case in conjunction with a defined flight state. The second modular part of the method is responsible for providing basic aircraft aerodynamic data in terms of lift and drag polar, as well as required aerodynamic derivatives. Basic aircraft geometric data is used to generate estimates of nine aerodynamic derivatives that are later required to determine the lateral trim state. In the current state of implementation, well-known empirically based handbook methods, as provided in [
11,
12,
13], are used for this step. Computation of the aerodynamic derivatives involves the determination of several empirical parameters based on graphs presented in the above-stated references. For all graphs that rely solely on geometric, thus static, input parameters, this step is performed once before application of the algorithm, and the resulting values are treated as input parameters to the overall method. For all flight-state dependent parameters, the corresponding graphs have been digitized and are dynamically evaluated based on cubic spline interpolation. The third module determines the “Top Level Aircraft Effect” for all relevant failure cases in terms of selected top-level aircraft performance and controllability metrics. Physics-based models of aircraft performance and equations of motion are used to calculate maximum achievable climb gradient, maximum range, as well as lateral controllability margin, characterizing the margin to maximum available control surface deflections in the presence of failure-induced thrust asymmetry. In a final step, the safety assessment framework allows comparing the resulting top-level aircraft effects metrics against any requirements posed on the aircraft design, either derived from certification specifications or prescribed by the aircraft designer.
To make the existing framework suitable to be used in conjunction with the e-Genius-Mod and the VELAN flight test campaign, some important steps had to be taken. Firstly, the propulsion system architecture of the e-Genius-Mod had to be translated into the block diagram model format as used by the safety assessment framework. Secondly, adequate input models for thrust as well as lift and drag coefficient data had to be established. Thirdly, due to the relevance of aero-propulsive effects in the design and evaluation of the VELAN configuration of the e-Genius-Mod, a first basic model has been established to estimate spanwise lift distribution and aerodynamic effects of aero-propulsive interactions within the existing safety assessment method. All the above steps will be presented in detail in the following.
2.2. Architectural Model of Propulsion System
As for previously examined aircraft architectures, the automation of the failure case analysis of the safety assessment framework requires the availability of a Matlab
® R2023a Simulink block diagram representation of the powertrain architecture.
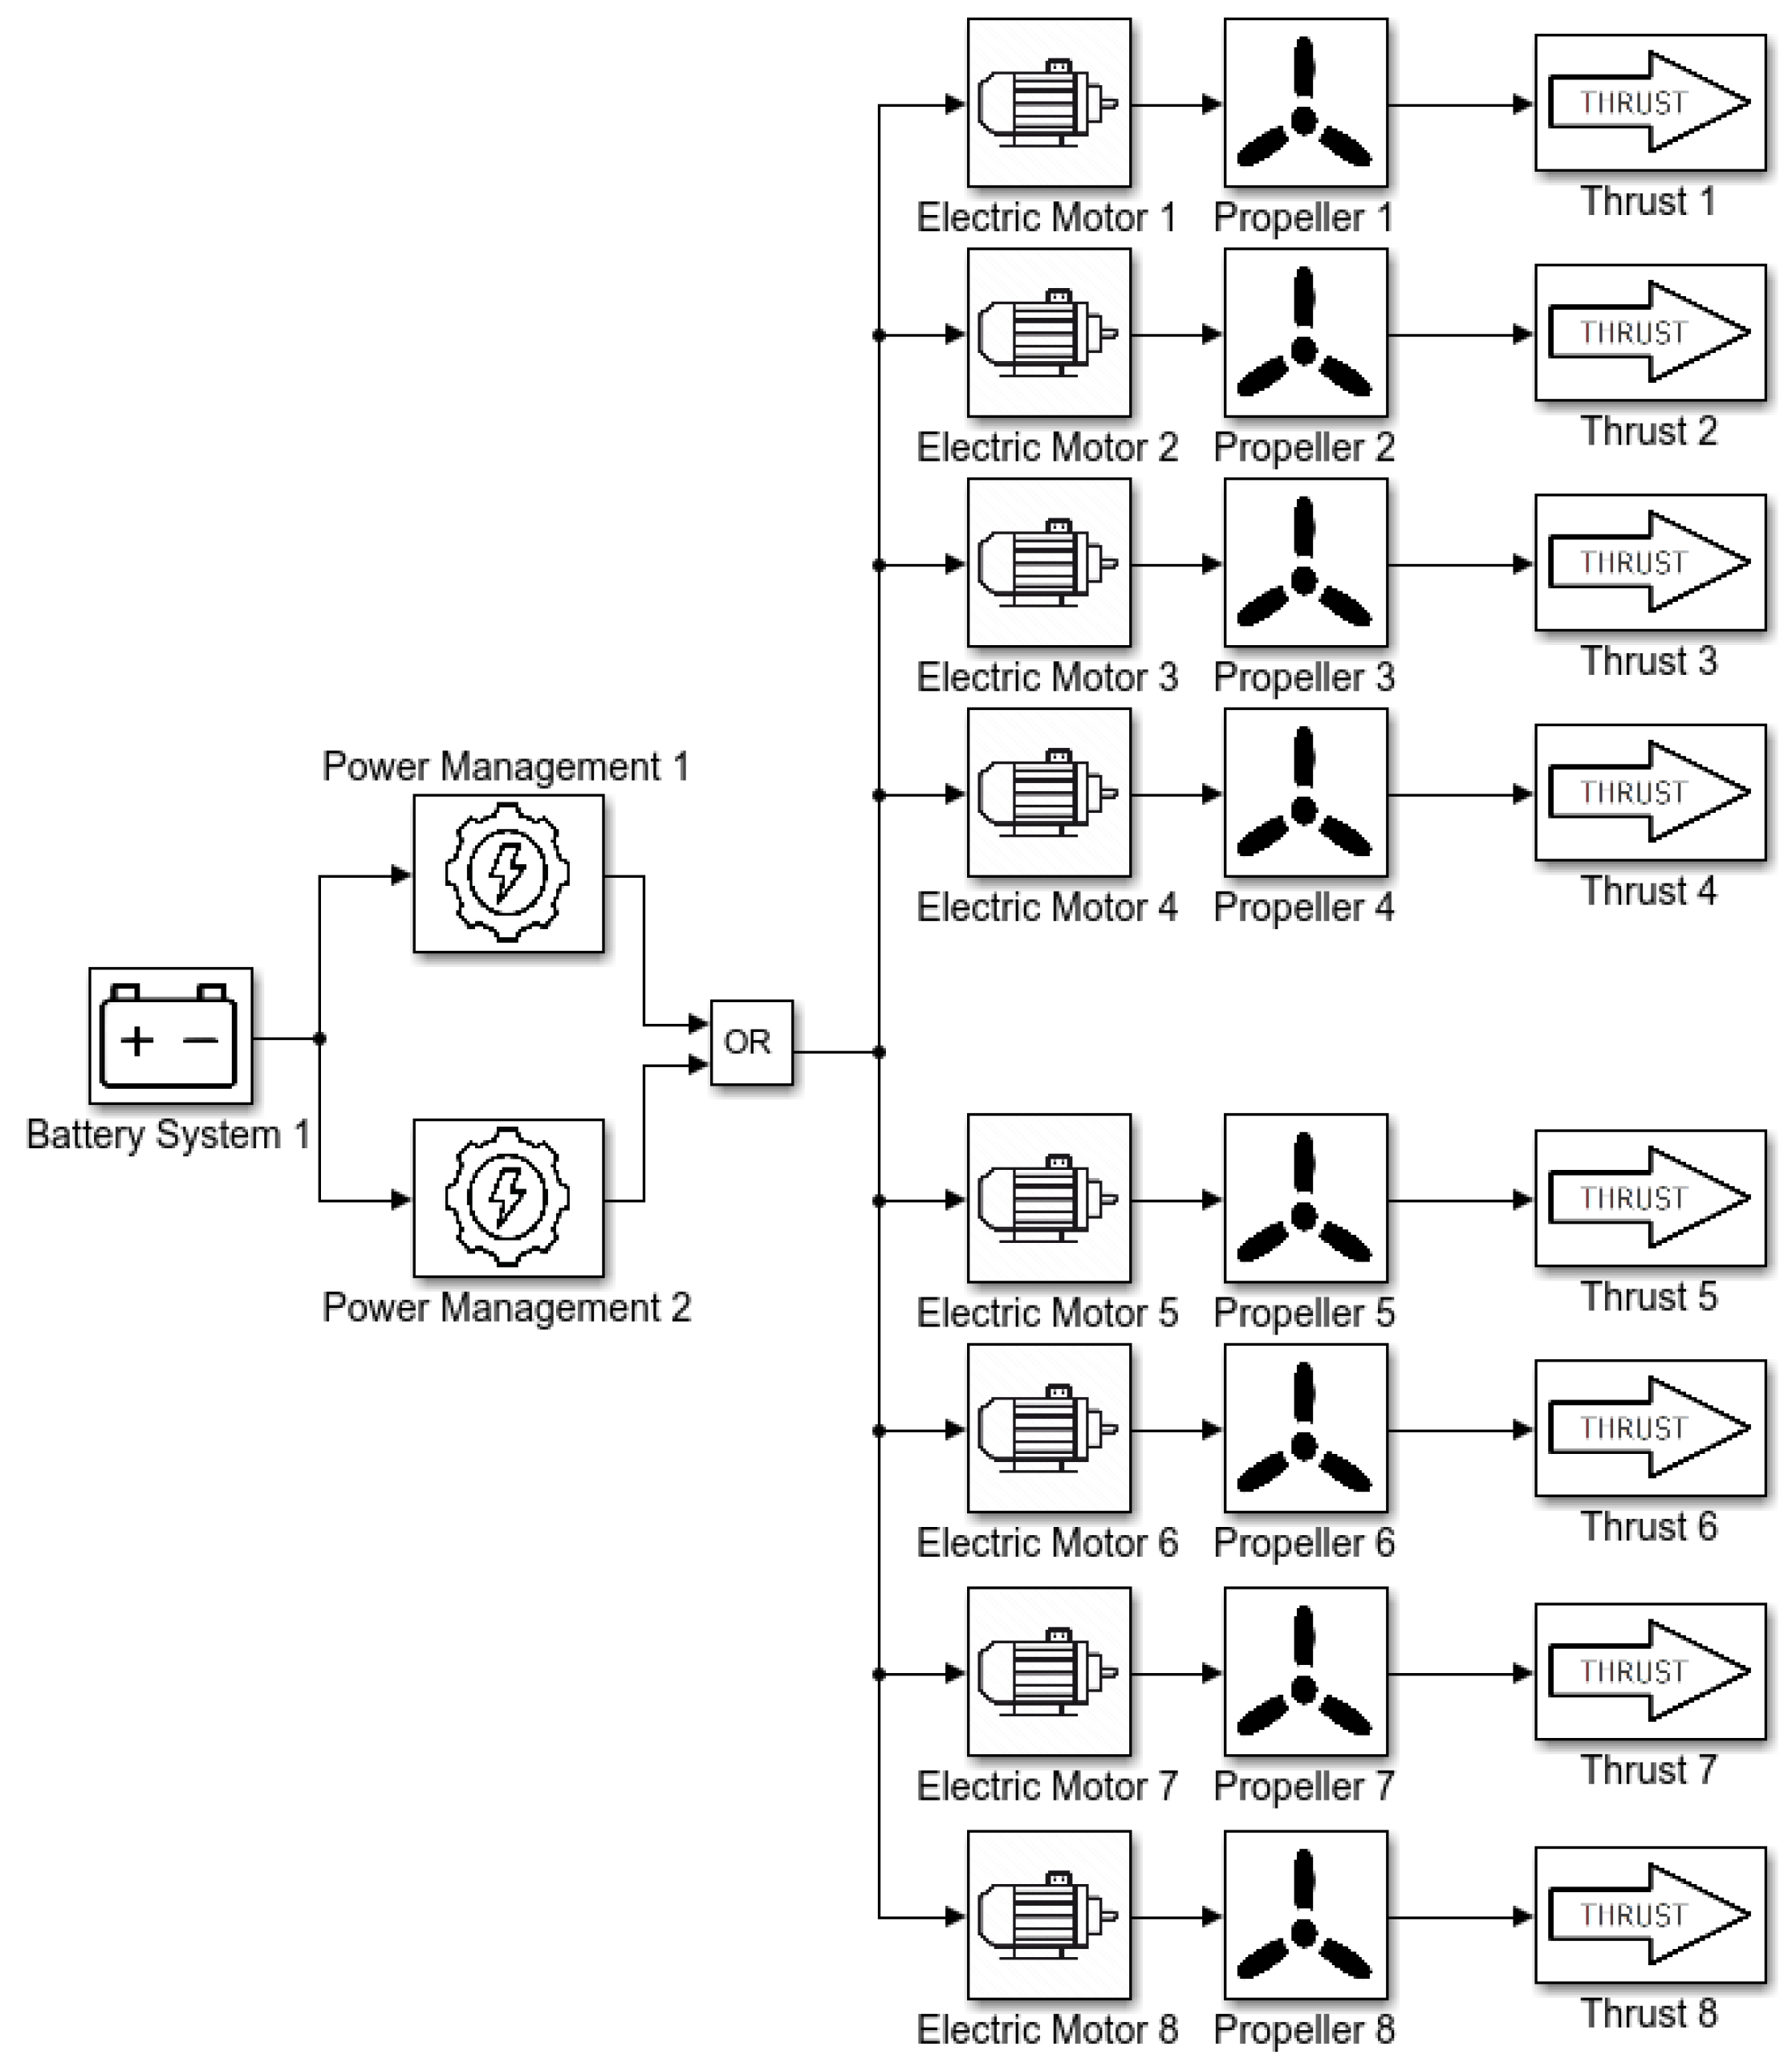
Figure 5 shows the result of representing the electric powertrain assembly of the e-Genius-Mod by using the already available standardized powertrain component blocks.
2.3. Spanwise Lift Distribution Model
Generally, to determine the top-level aircraft performance metrics as used within the safety assessment framework, it is sufficient to compute the total lift force acting on the aircraft in a certain flight state. However, to allow quantitative estimation of the effects of local aero-propulsive interactions between propeller and wing and their effect on the generated lift, knowledge of the total lift force is no longer sufficient. Therefore, to prepare the model-based assessment of aero-propulsive effects as presented in the next section, a suitable way to represent the spanwise lift distribution had to be found. For simplicity, it is assumed that the complete aircraft lift is generated by the wing exclusively. This simplification affects the aero-propulsive effect estimation solely and can be justified by the need for an initial proof of concept that is computationally tractable, while accounting for the fact that the model used for representing propeller slipstream effect is only able to partially capture the most prominent physical effects.
A convenient way to approximate the spanwise lift distribution for a given aircraft wing geometry has been introduced in [
14] and further elaborated in [
15,
16]. The above-mentioned references suggest determining the lift distribution by superposition of the “basic lift distribution” and the “additional lift distribution”. The “additional lift distribution” thereby represents the normalized lift distribution for an untwisted wing with
, whereas the “basic lift distribution” accounts for the contribution of wing twist with
. As the e-Genius-Mod wing is untwisted and unswept, the basic lift distribution equals zero, and the resulting equation for normalized spanwise lift can be given as
In Equation (1)
designates the wing chord length dependent on spanwise position
and
the mean geometric chord of the wing. The coefficients
,
and
can be determined from [
15] or [
14] based on wing aspect ratio, wing sweep, and lift curve slope. The attained values are documented in
Table 1.
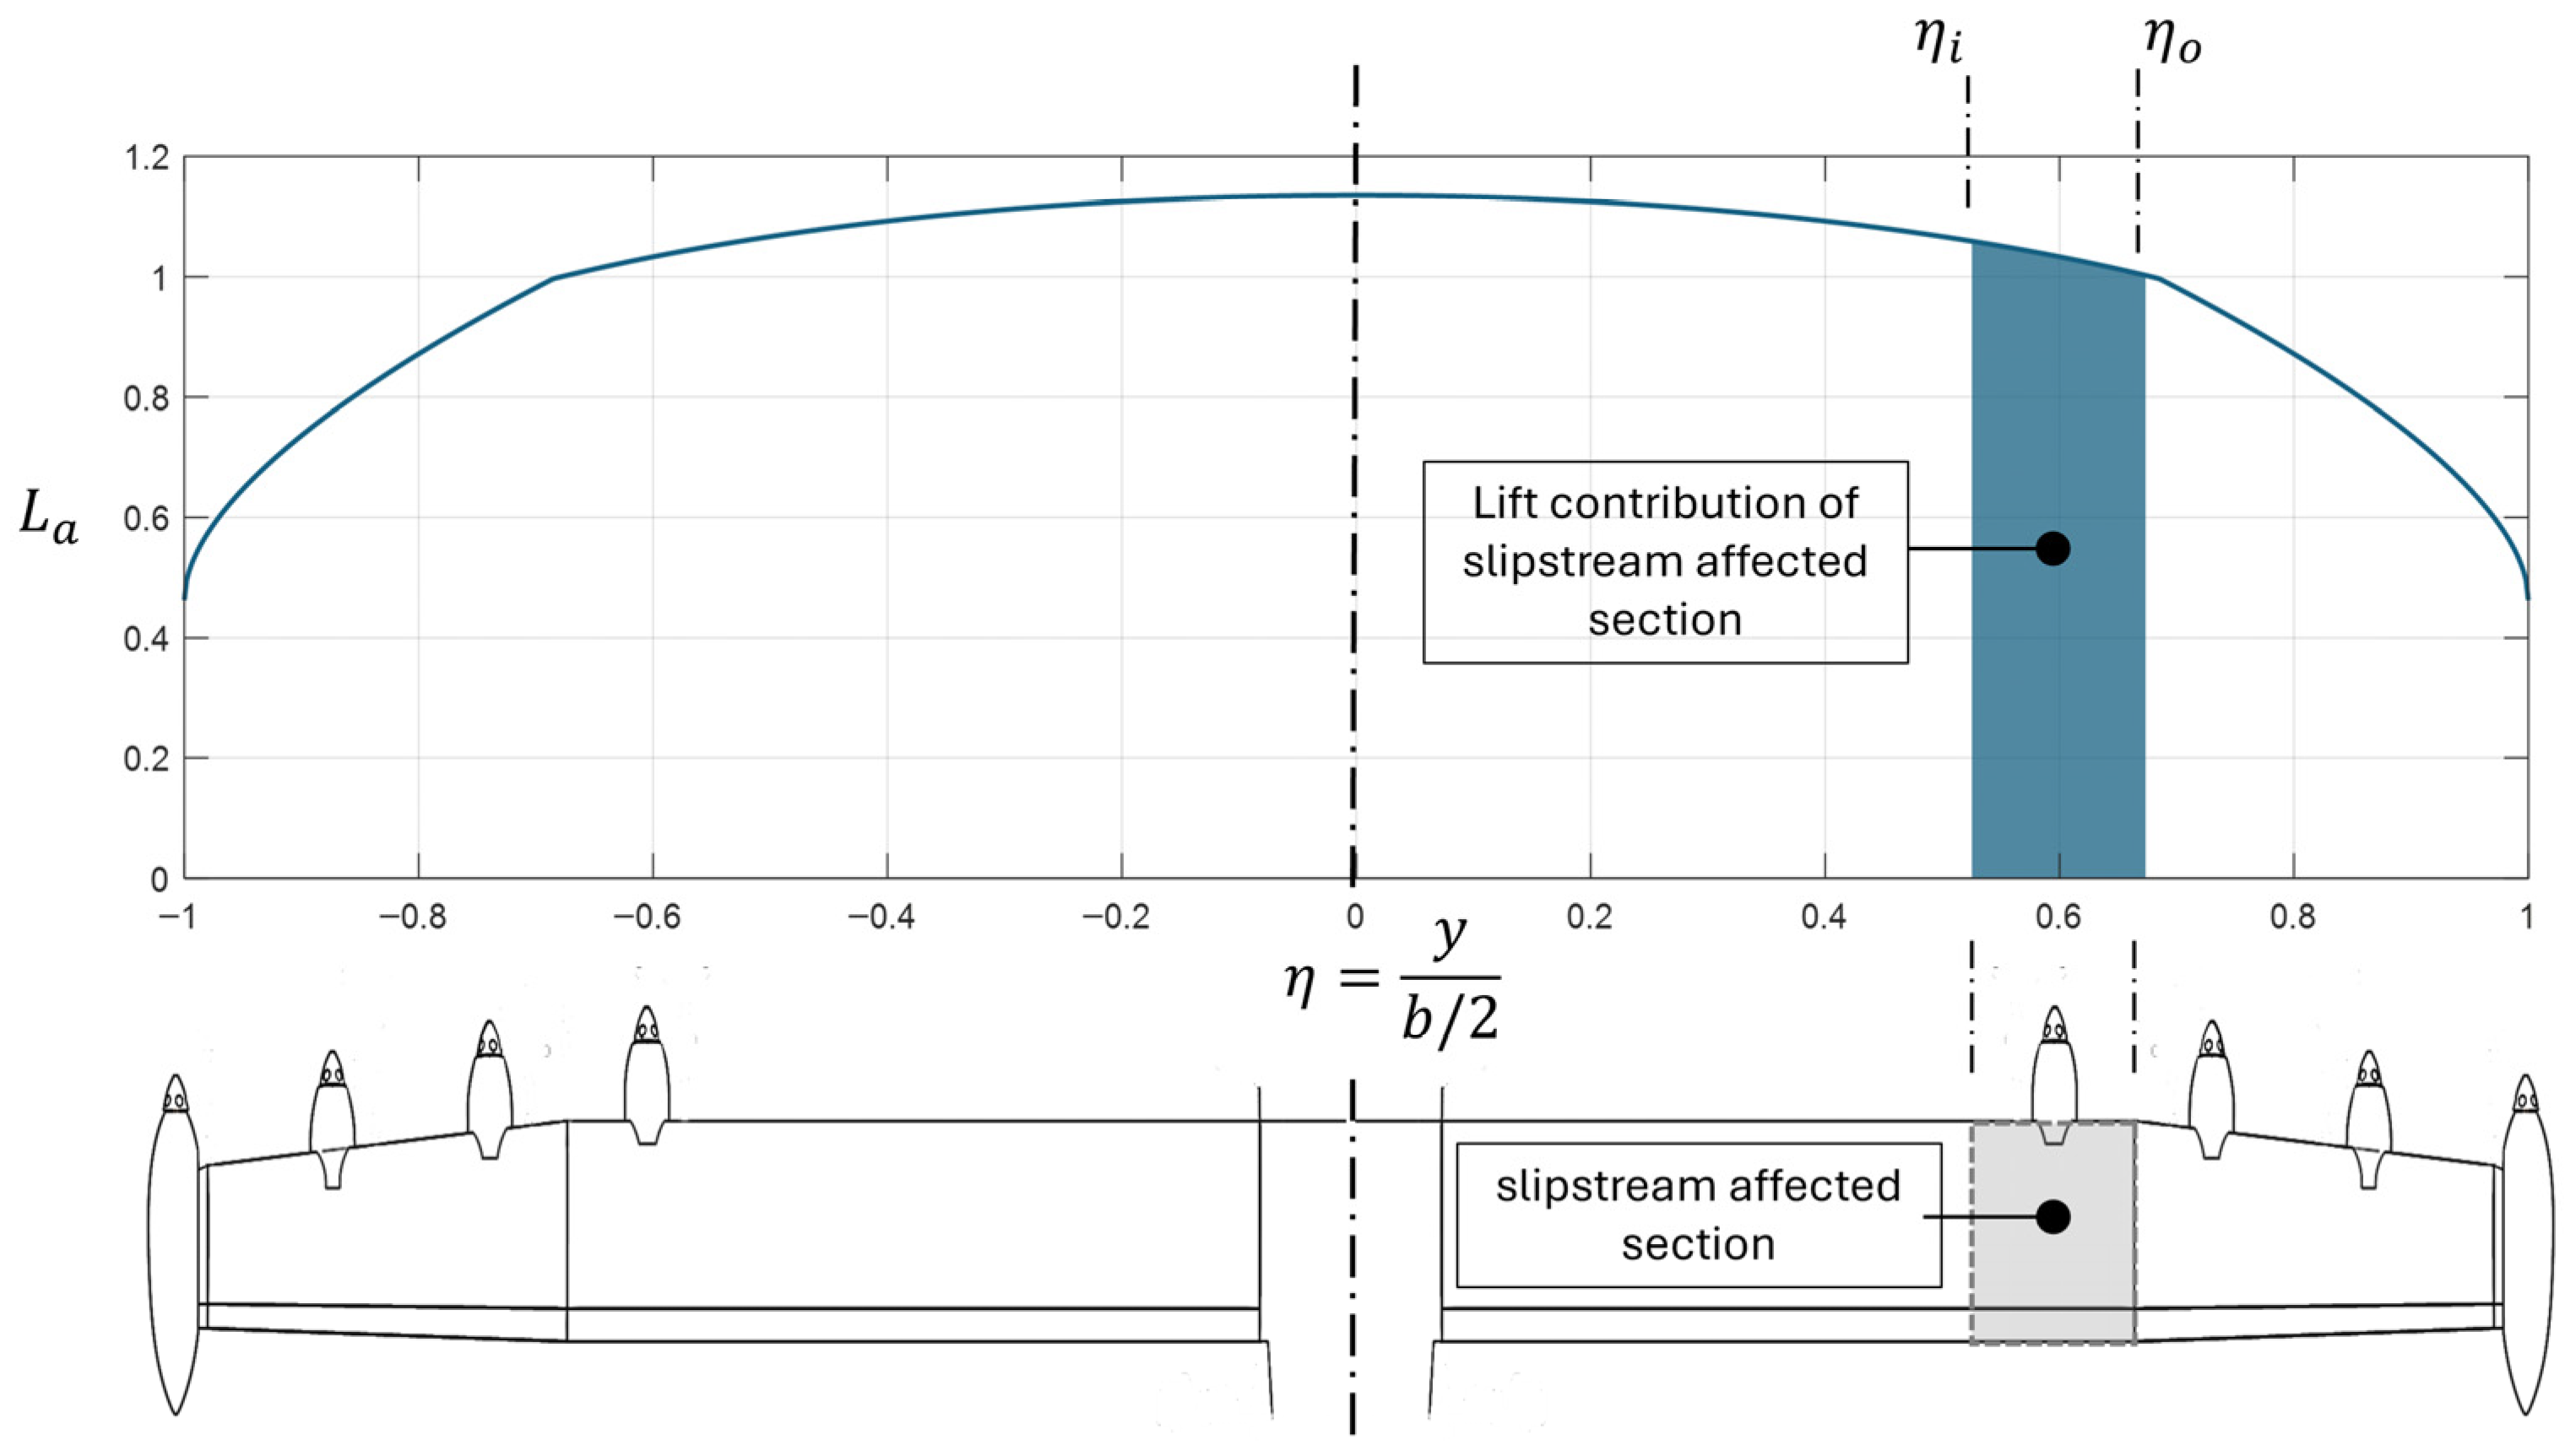
The resulting lift distribution for the e-Genius-Mod wing is given in
Figure 6. By evaluating the area underneath the lift distribution curve, the contribution of any defined span section from
to
can be quantified and subsequently manipulated to reflect modified airflow due to propeller slipstream effects.
2.4. Modeling Aero-Propulsive Effects
In previous applications of the presented safety assessment method, aero-propulsive effects have been partially neglected. Although the influence of propeller slipstream on aircraft lift and drag in certain reference conditions, e.g., takeoff and cruise, has been included in the previously utilized aircraft polar data, implications of thrust settings and flight conditions outside these reference conditions could not be predicted. The same reasoning applies to flight situations in the presence of propulsion system failures leading to loss of propulsors and asymmetric flight conditions. Modern propulsion concepts, especially those relying on distributed propulsion (DP), oftentimes exhibit significant interaction effects between propulsion and wing lift generation and often intentionally exploit these effects to enhance aircraft performance. This emphasizes the necessity to capture the consequences of the interrelation between propulsion and lift generation with relevant side effects in the presence of component failures and asymmetric thrust distribution. As a first step, this paper introduces a simple model to incorporate aero-propulsive effects in the automated safety analyses to explore their impact on the safety-related top-level aircraft metrics.
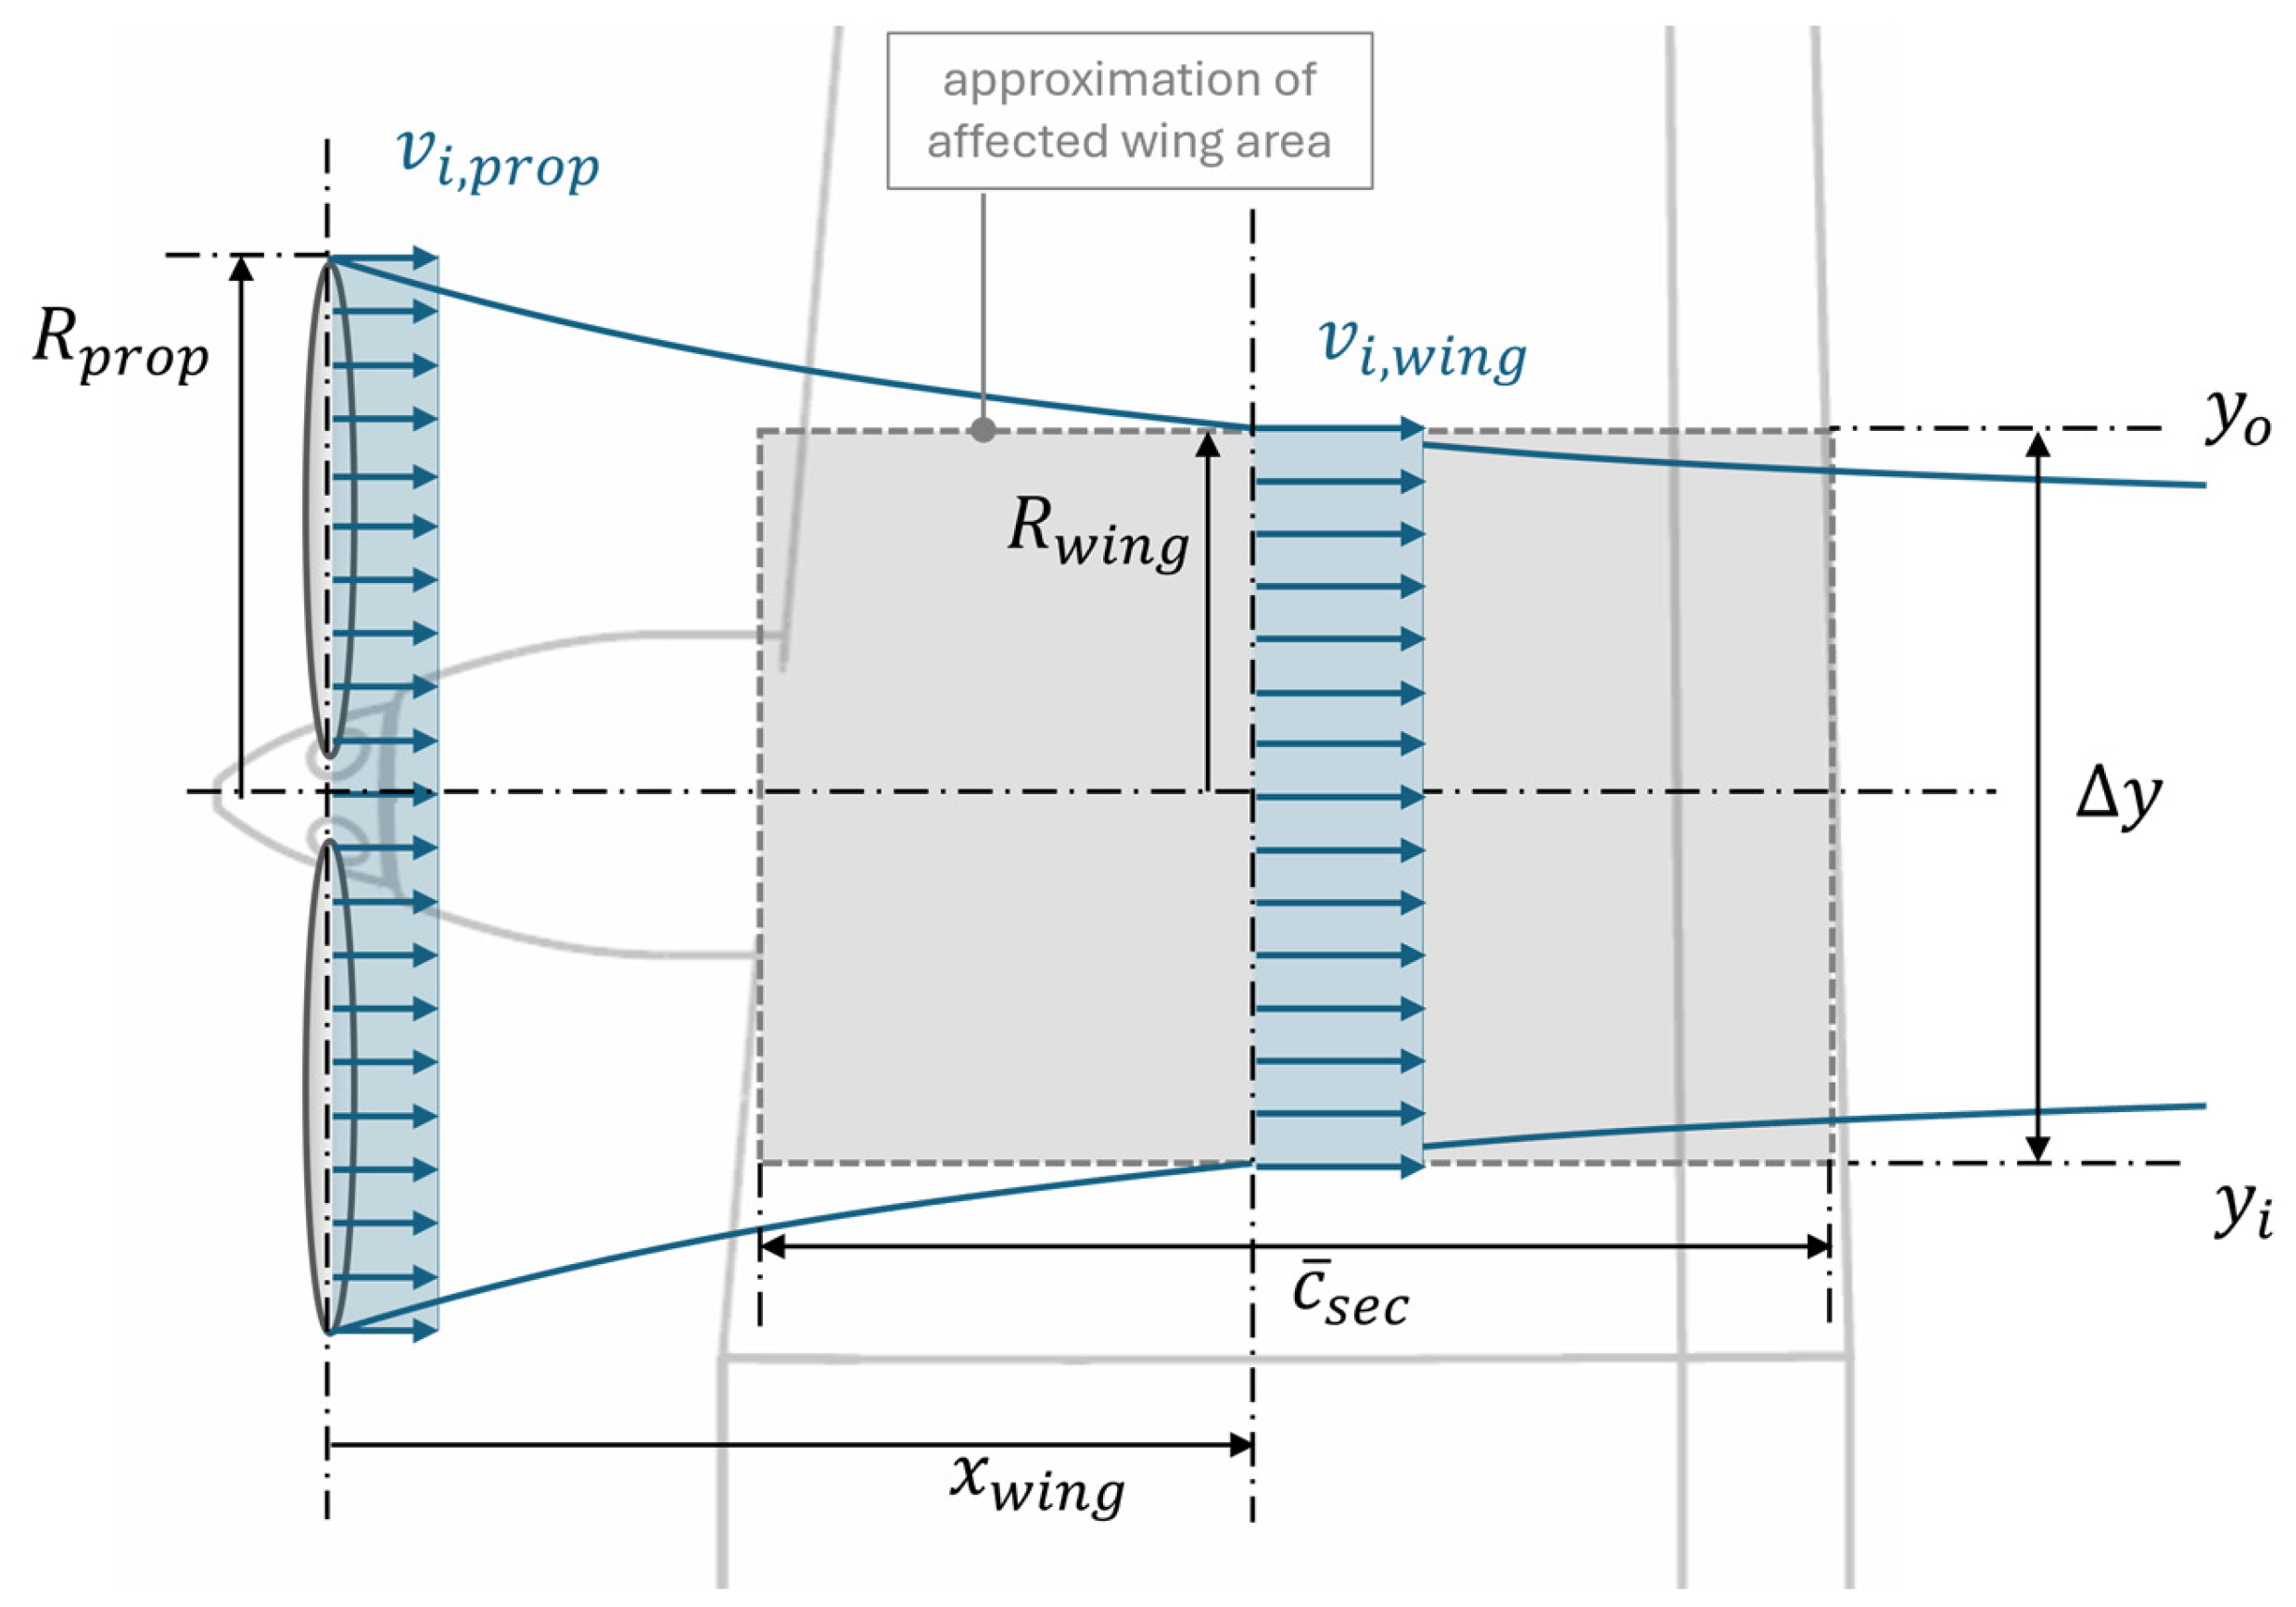
Figure 7 shows the modeling approach that has been used to model the propeller slipstream effects onto the flow as experienced by the associated wing section. A simple actuator disk model is adopted from [
17] to represent the manipulation of free stream velocity by the thrust-producing propeller. Based on momentum theory, the propeller is modeled as an actuator disk with the averaged induced axial velocity component
in the propeller plane. The near field region behind the propeller is dominated by the effect of flow acceleration and slipstream contraction [
17]. Application of momentum theory leads to the following equations for the slipstream radius
and induced axial velocity component
and the distance from the propeller to the associated wing section mid-chord position
[
18]:
The resulting slipstream model is a simplified representation of a complex interaction between propeller slipstream and wing aerodynamics. It is not capable of capturing the effects of non-uniform velocity component distributions in propeller plane or 3D-swirl effects and thus will only yield an approximation of local flow conditions within the propeller-affected region [
17]. It can be noted that according to Equations (2) and (3), the width of the slipstream
is a fixed value that solely depends on propeller geometry and relative position of the propeller in relation to wing mid-section and thus can be computed once for the given geometry of each propulsor. Similarly, the induced velocity component at wing mid-section
can be computed by multiplying
with a constant factor summarizing the influence of the fixed geometry. The only flight state-dependent parameter in Equations (2) and (3) is the induced velocity component in the propeller plane. This inherent computational simplicity of the approach makes it very suitable for incorporation into the existing safety assessment framework. Using the momentum theory as presented in [
19],
can be directly linked to the thrust force
produced by the individual propulsor:
In Equation (4) represents the free flow velocity component perpendicular to the rotational plane of the propeller.
2.5. Integration of Aero-Propulsive Effect Model into Safety Assessment Framework
The model presented in the previous section forms the baseline for integration of aero-propulsive effect estimation into the existing safety assessment framework. Aero-propulsive interactions are local effects that modify airflow for certain regions of the wing. Consequently, the aero-propulsive effect model aims at quantifying the local change in lift and drag for each slipstream-affected wing section. As illustrated in
Figure 7, affected wing areas are approximated as a rectangular shape with a chord
and a span of
. For each slipstream-affected section, its contributions
and
to overall aircraft lift and drag, as well as local flow conditions, are calculated. The calculations are based on the spanwise lift distribution as introduced in
Section 2.3, and therefore do not include any slipstream effect. Thereafter, the slipstream model as given in
Section 2.4 is applied to obtain local flow conditions individually for each slipstream-affected wing section. Lastly, airfoil polar data is used to infer modified section lift
and drag
based on the locally modified flow conditions. Since the utilized spanwise lift distribution model assumes an untwisted wing, this restriction also holds for the aero-propulsive effect approximation. As the quantification of aero-propulsive effects depends on several flight state and failure case dependent parameters like free stream velocity and thrust values of the individual propulsors, the changes in lift as well as drag due to slipstream effect cannot be simply integrated into the lift and drag polars of the aircraft. Instead, these effects must be calculated dynamically for each scenario and flight state to be evaluated. Therefore, whenever lift or drag is calculated during any iteration of the Top-Level Aircraft Function (TLAF) metric assessment, according to [
4], the following steps are undertaken separately for each propulsor to account for the influence of propeller slipstream effects:
Determine the section lift and section lift coefficient of the slipstream-affected wing area without aero-propulsive effects:
Section lift
without aero-propulsive effects can be determined by evaluating the area below the lift distribution curve
for the slipstream-affected section defined by
and
as given in
Figure 7. As the lift distribution is normalized to
, it must be multiplied by the aircraft lift that is given by the current flight state.
Based on the section lift, an average section lift coefficient
can be inferred as follows:
With being the mean chord length of the wing in the section defined by and , and being the spanwise difference between and .
Based on local angle of attack is determined based on wing airfoil polar data. The local section angle of attack may differ considerably from the free-stream angle of attack due to the downwash effect of three-dimensional lift generation.
Determine the section drag coefficient and the section drag of the slipstream-affected wing area without aero-propulsive effects:
In a second step, wing airfoil polar data is used to determine the average section drag coefficient
based on
. For the section drag, it follows:
Calculate locally modified flow conditions:
The calculation of flow conditions in the wing section that is affected by the slipstream effects follows the reasoning in [
20]. The study offers a simple 2-dimensional model to account for the propeller-induced velocity with consideration of the section angle of attack
and free stream velocity
as well as the angle
between the rotational axis of the propeller and the local section chord line.
Locally modified velocity
and angle of attack
valid for the slipstream-affected wing section are calculated as
Calculate new section lift and drag based on modified flow conditions:
For each slipstream-affected section, lift and drag values are calculated based on the modified flow conditions: For this, the modified section lift coefficient
and the modified section drag coefficient
are determined, based on the modified section angle of attack
together with wing profile polar data. For the updated section, lift and drag follow:
Aggregate local effects to obtain overall changes in lift and drag:
Finally, changes in lift and drag due to aero-propulsive effects for all individual propulsors are summed to obtain the overall change in aircraft lift and drag:
Similarly, yaw and roll moment
and
contribution of aero-propulsive effects for a certain flight state and failure condition can be computed as
Establish new modified flight state:
Depending on the boundary conditions for the TLAF metric to be evaluated, the new flight state is composed as follows:
(a) “Maximum Lift” (e.g., for maximum climb gradient determination)
Aircraft angle of attack remains unchanged, and
will be added to aircraft lift and drag without aero-propulsive effects
(b) “Constant Lift” (e.g., for maximum range determination, i.e., level flight)
The aircraft angle of attack will be changed such that overall aircraft lift and drag will remain constant. E.g., positive is compensated by a reduction in aircraft angle of attack.
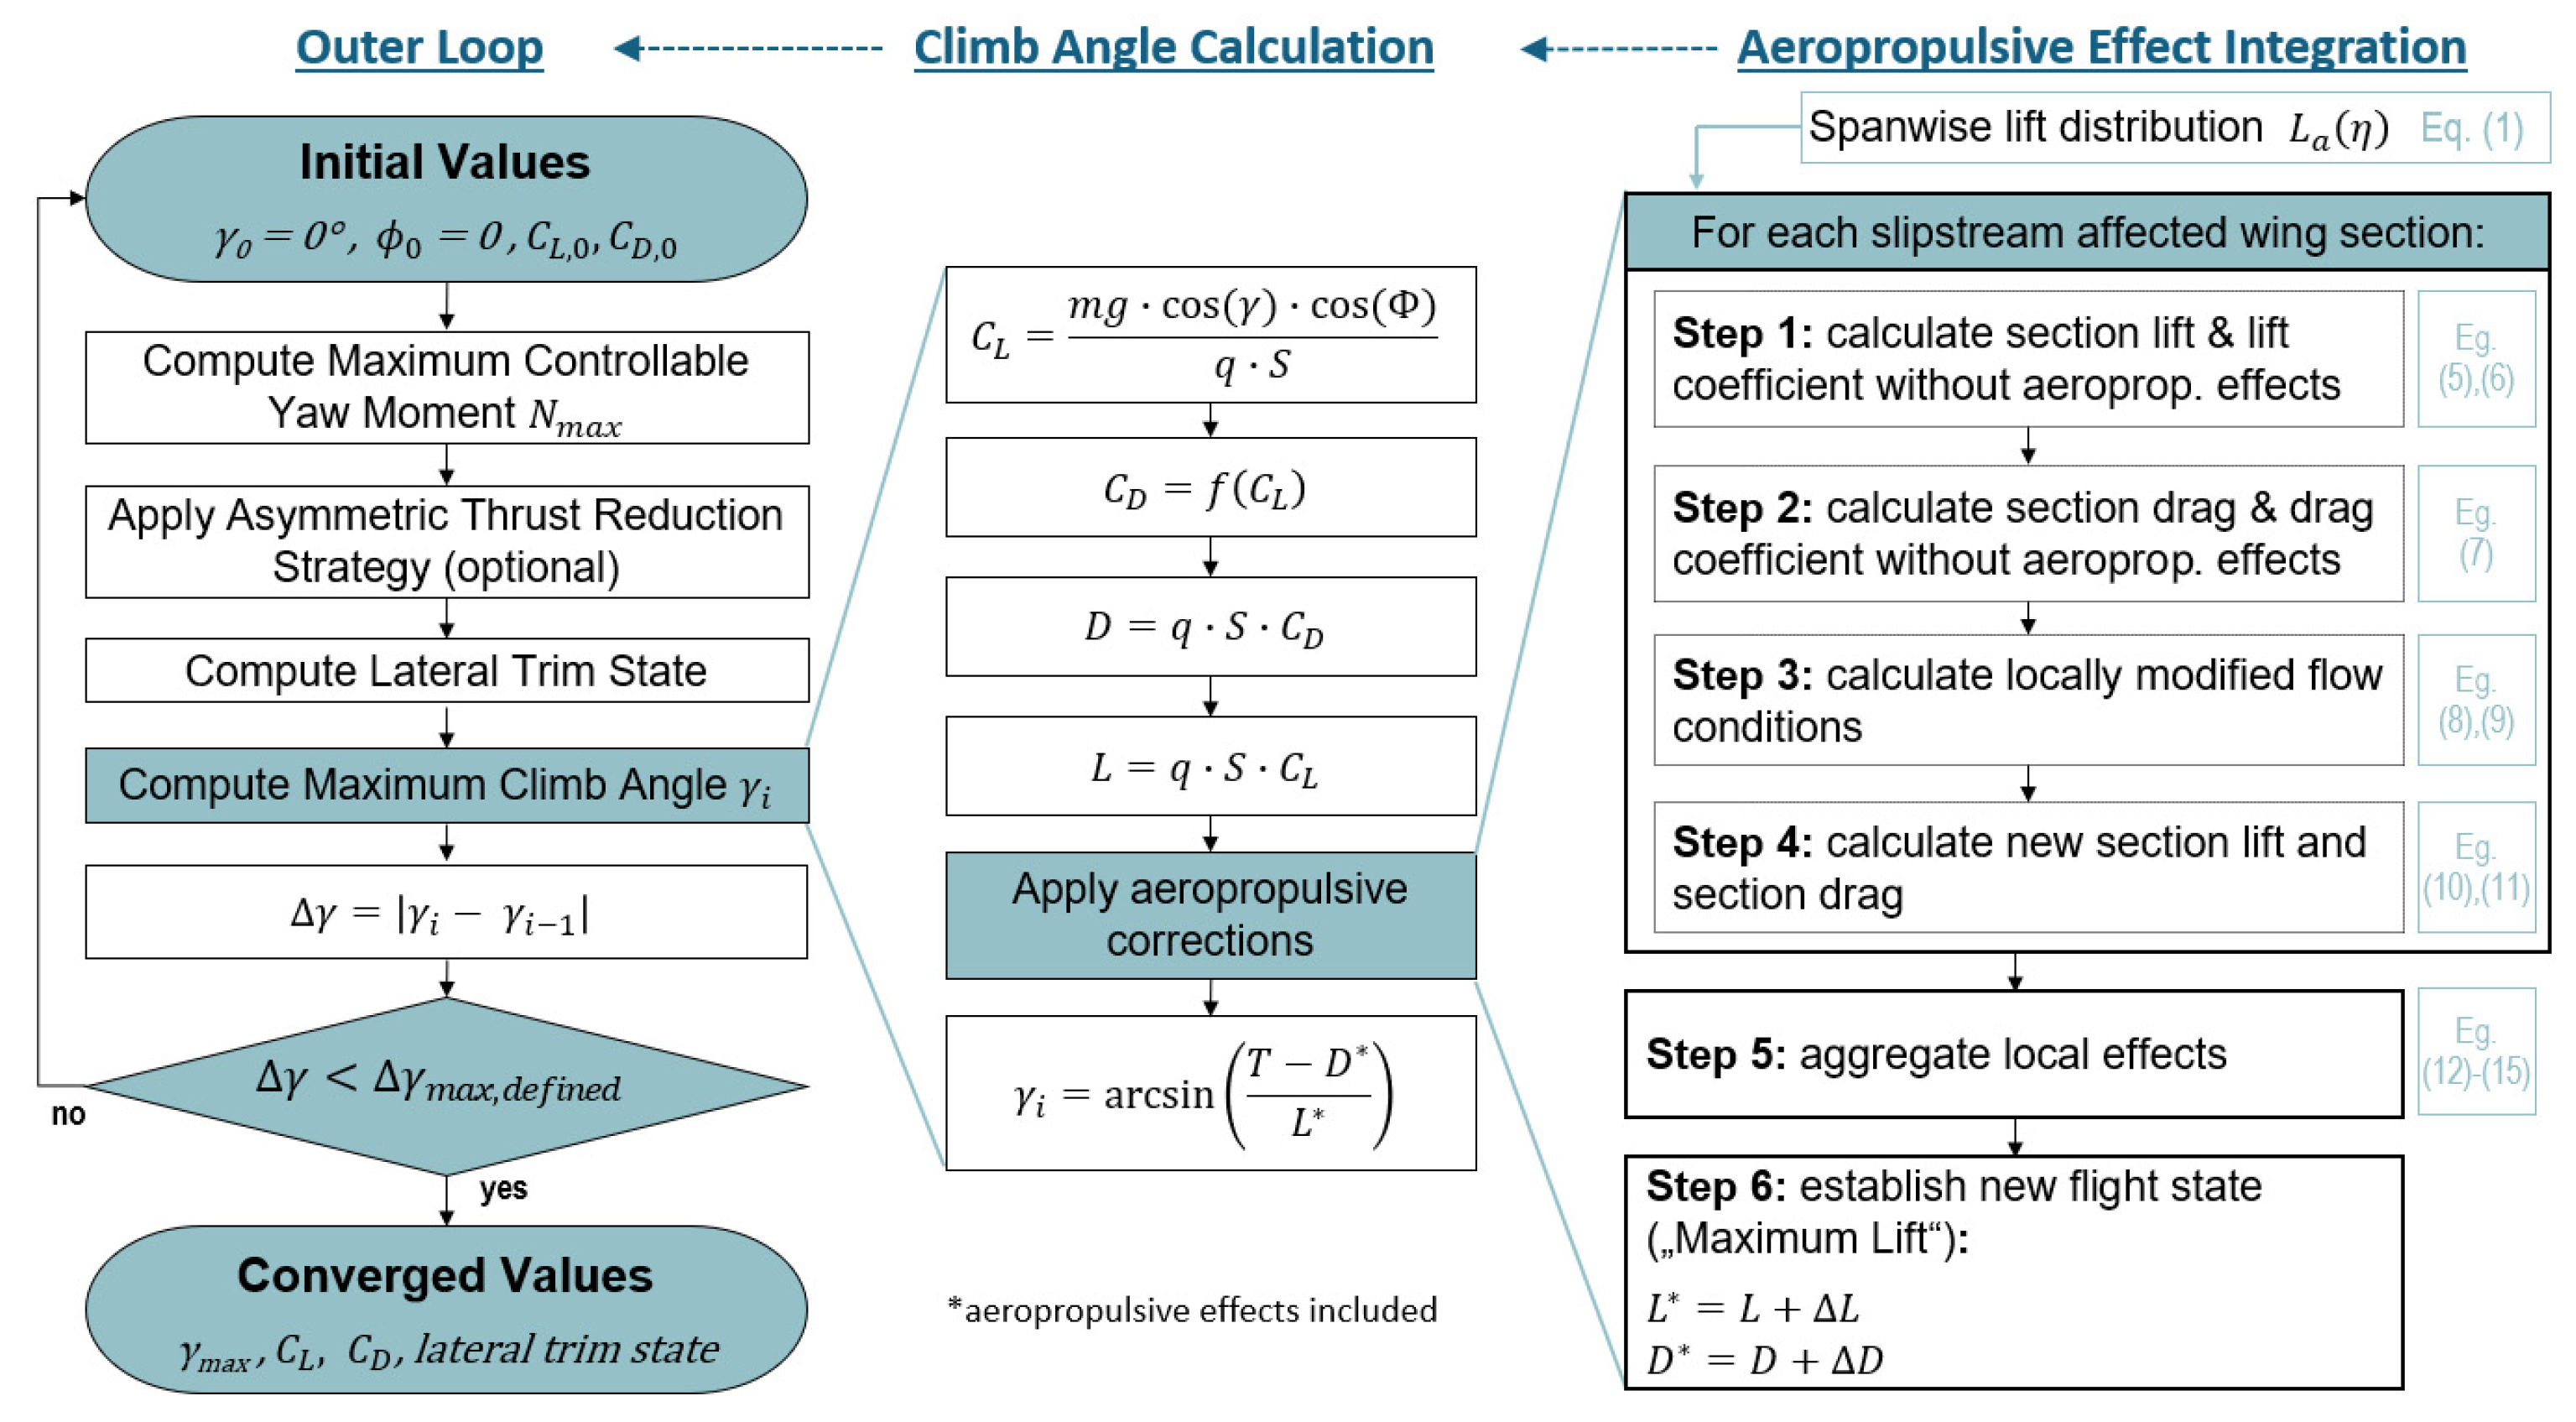
To ease the understanding of the above-described computational steps,
Figure 8 illustrates the integration of aero-propulsive effects exemplarily for the calculation of the maximum climb gradient.
2.6. Aerodynamic Model and Thrust Model Parameter Identification
The validity of the results attained by application of the model-based safety assessment framework greatly relies on physically meaningful input data. This especially applies for aircraft lift-drag polar data as well as the propulsor thrust model. For the e-Genius-Mod, limited data have been available so far in the form of theoretical wing profile polar data, lift and drag coefficient estimates for a confined range of angles of attack, as well as theoretically derived maximum thrust values. So far, these values have not been validated, either by wind tunnel test or by flight test evaluation. Furthermore, due to the installation of additional equipment, e.g., three cameras mounted on the e-Genius-Mod while conducting the flight tests, it seems questionable whether the theoretical CFD result adequately reflect the achievable performance during real flight conditions. For the above reasons, and to demonstrate the potential of combining flight testing with the model-based safety assessment, it has been decided to determine aircraft lift and drag coefficient data, as well as a thrust model based on already available flight test data. The following sections describe the necessary steps, namely, the formulation of adequate parametrised models and the identification of the introduced model parameters via basic system identification methods.
2.6.1. Aerodynamic and Thrust Force Models
Generally, the thrust force of a propeller can be given as a function of its thrust coefficient
, air density
rotational speed
and propeller diameter
[
19]:
The thrust coefficient
depends on the operating conditions of the propeller, especially on the advance ratio
as defined in Equation (17) in terms of flight velocity
and the rotational velocity
[
21].
For the present study, a simple linear approach for the thrust coefficient as a function of advance ratio has been chosen. Incorporating higher-order models or introducing an additional dependency on rotational velocity
Neither resulted in better predictive capability of the identified model nor in physically meaningful parameter estimates. This finding fits well with experimental results of other research projects, e.g., in [
22], where a good agreement between measured thrust coefficient and a linear approximation based on advance ratio has been demonstrated. Thus, the formulation for the thrust coefficient and the resulting parametrised thrust model have been chosen as follows:
Models for lift and drag coefficients have been deliberately chosen as simple as possible to represent the most dominating effects on the lift and drag coefficient:
Based on these models for aerodynamic coefficients, lift and drag for any given flight state can be obtained by adding the aero-propulsive corrections and .
2.6.2. Model Parameter Identification Based on Least Squares
Model parameters are identified using acceleration and air data measurements from one test flight. Thereby, acceleration measurements are provided by the installed Pixhawk px4 autopilot system. The data is already preprocessed based on an onboard filtering algorithm, so that the accelerations are corrected for the distance between the center of gravity and sensor installation, as well as scale factor and bias error. Air data measurements are provided by a Vectoflow 5-hole probe mounted on the aircraft nose. In a preprocessing step, they are corrected for probe location based on the measured angular rates.
By transforming the measured accelerations from body axes to aerodynamic axes, the following relations can be established to relate the thrust and aerodynamic model parameters to the measured accelerations:
Equation (20) constitutes the equilibrium of forces along the aerodynamic x-axis, and Equation (21) the equilibrium of forces along the aerodynamic z-axis. The formulation above contains the implicit assumption that thrust forces predominantly act in the longitudinal direction of the aerodynamic axes and their influence in the vertical direction is negligibly small. Accelerations in the aerodynamic frame are obtained by transformation of measured accelerations by the onboard IRU from the body frame to the aerodynamic axes:
Except for the aero-propulsive correction terms
and
Equations (20) and (21) are strictly linear with respect to the unknown model parameters
,
,
,
,
,
,
,
. A slightly modified variant of the ordinary least squares method has been shown to be a stable and efficient way for the determination of the unknown parameters. The parameter estimates are computed iteratively, starting without any aero-propulsive correction and thereafter by calculating the correction terms separately before each new application of the least squares method. Due to the iterative procedure, the aero-propulsive correction is updated for each iteration, based on the newest available model parameter estimates. The process is repeated until convergence of all model parameters is reached. The final estimates obtained for the model parameters are given in
Table 2.
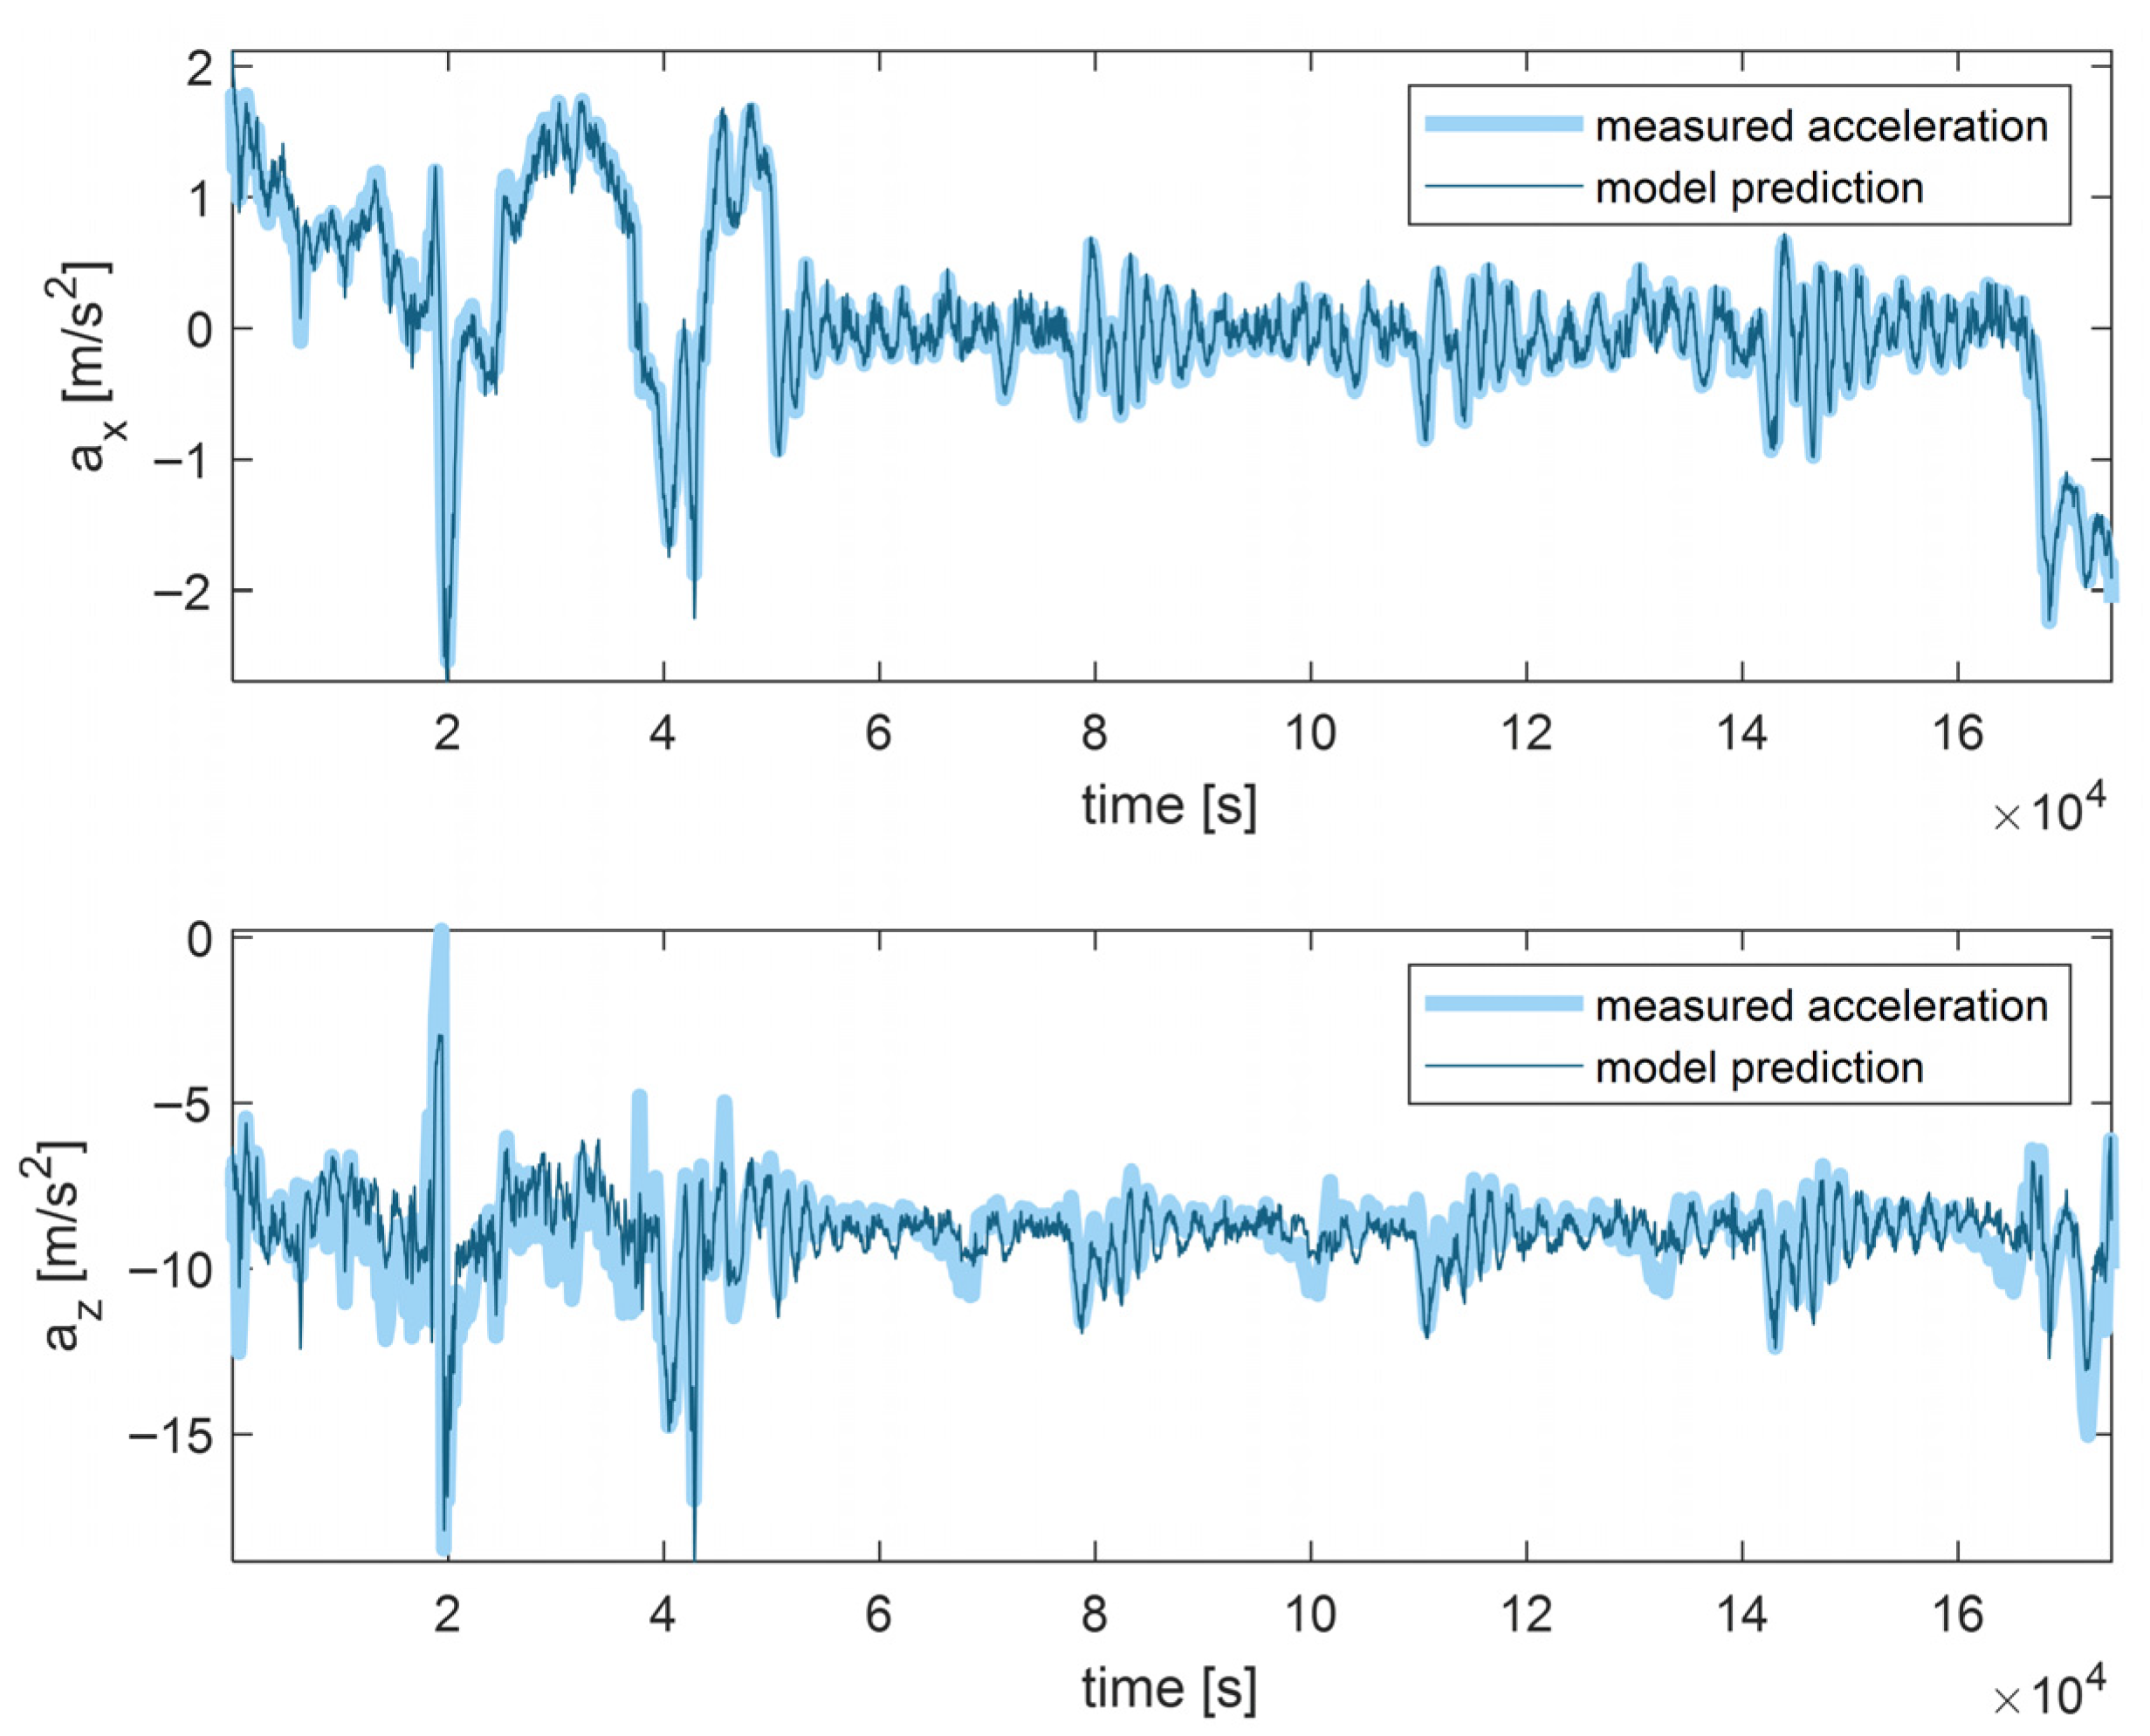
Figure 9 shows the accelerations in aerodynamic axes that have been measured during the flight test, together with the resulting model prediction based on the identified parameters. Generally, model prediction follows the measured accelerations quite well, especially concerning the longitudinal axis, with a resulting coefficient of determination of 0.99. In the vertical direction, some larger deviations can be observed, resulting in a significantly lower coefficient of determination of 0.57. Further examination of these deviations revealed that they strongly correlate with the measured aerodynamic sideslip angle. Possible explanations for this observation could be inconsistencies in the air data measurements or unintended asymmetries in the installations of the e-Genius-Mod or its propulsor arrangement. However, since so far, no unambiguous physically valid interpretation has been achieved, it has been decided to accept the deviations rather than to further improve the model fit by introducing physically questionable relations into the lift coefficient model.
To verify the predictive capability of the attained parametric model,
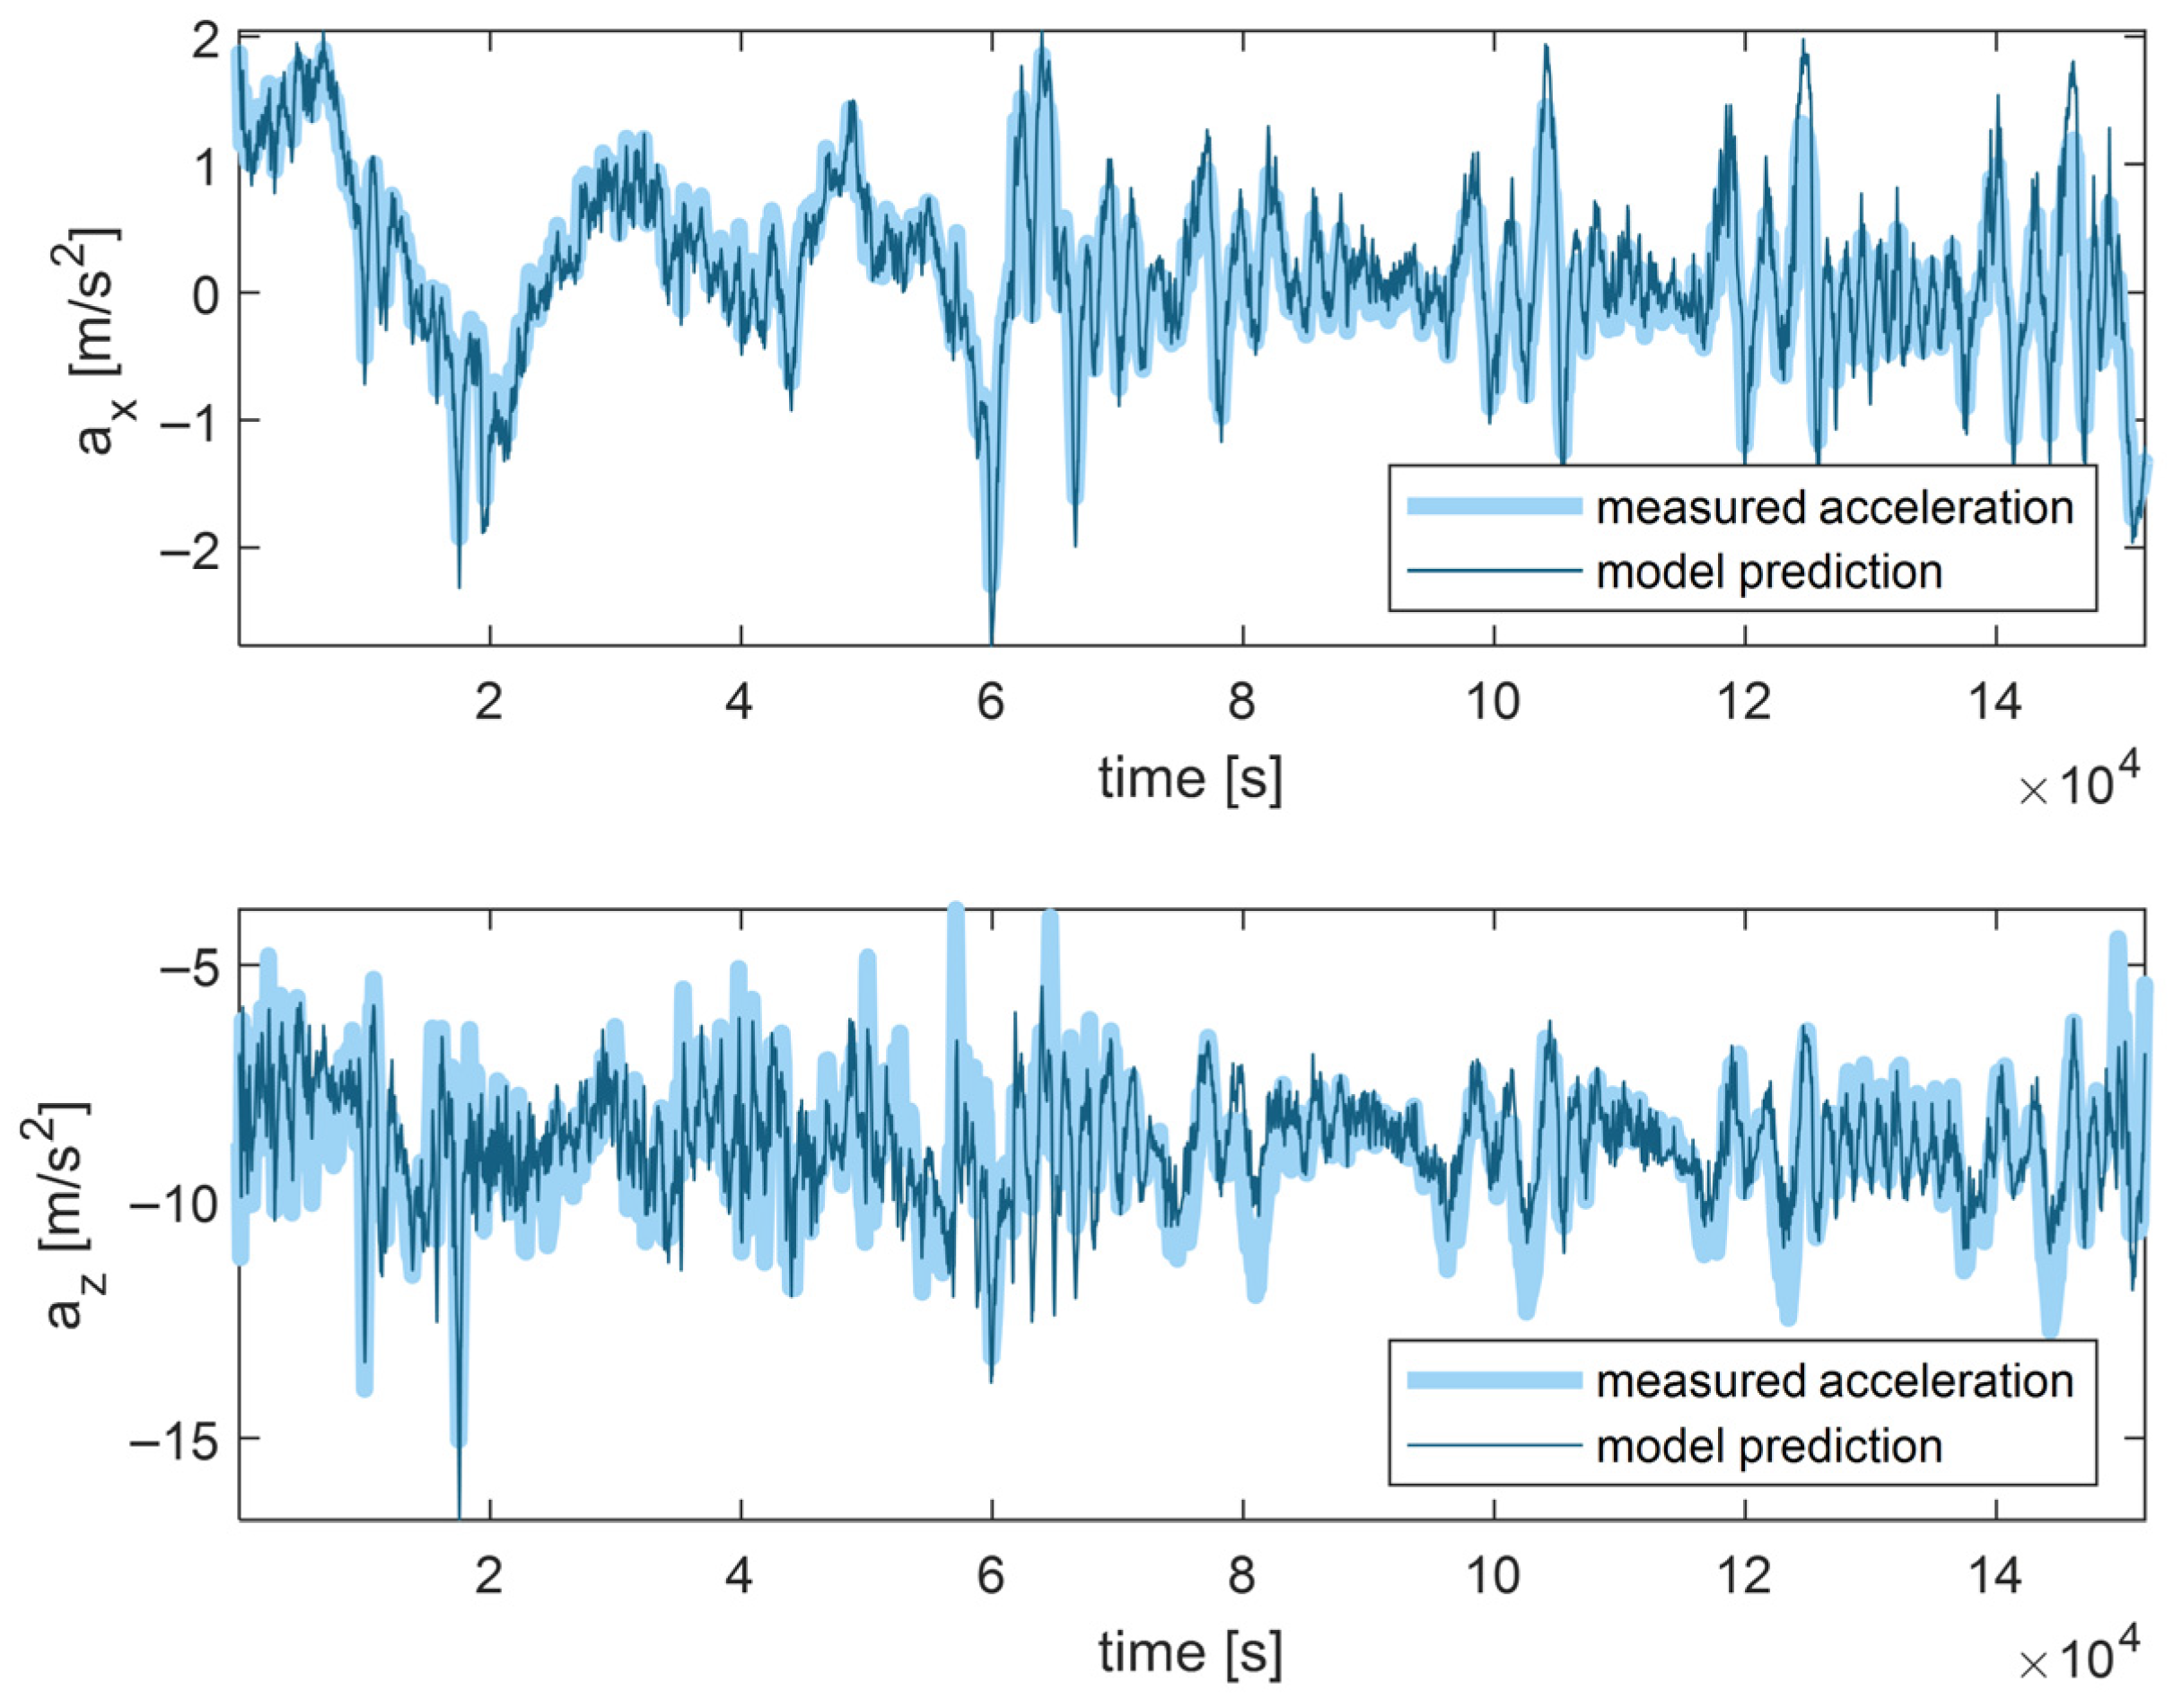
Figure 10 shows model-predicted accelerations versus measured accelerations for a second flight, which has not been used for parameter identification.
The agreement between model prediction and measurements is of similar quality compared to the flight that has been used for parameter identification, thus substantiating the adequacy of model formulation and identified parameters.
3. Scaled Flight Testing Using the e-Genius-Mod
The e-Genius-Mod is an unmanned scaled-down version of the full-electric motor glider e-Genius, which serves as a research aircraft at the Institute of Aircraft Design (IFB) at the University of Stuttgart. The e-Genius-Mod is scaled demonstratively 1:3 according to the Froude-number [
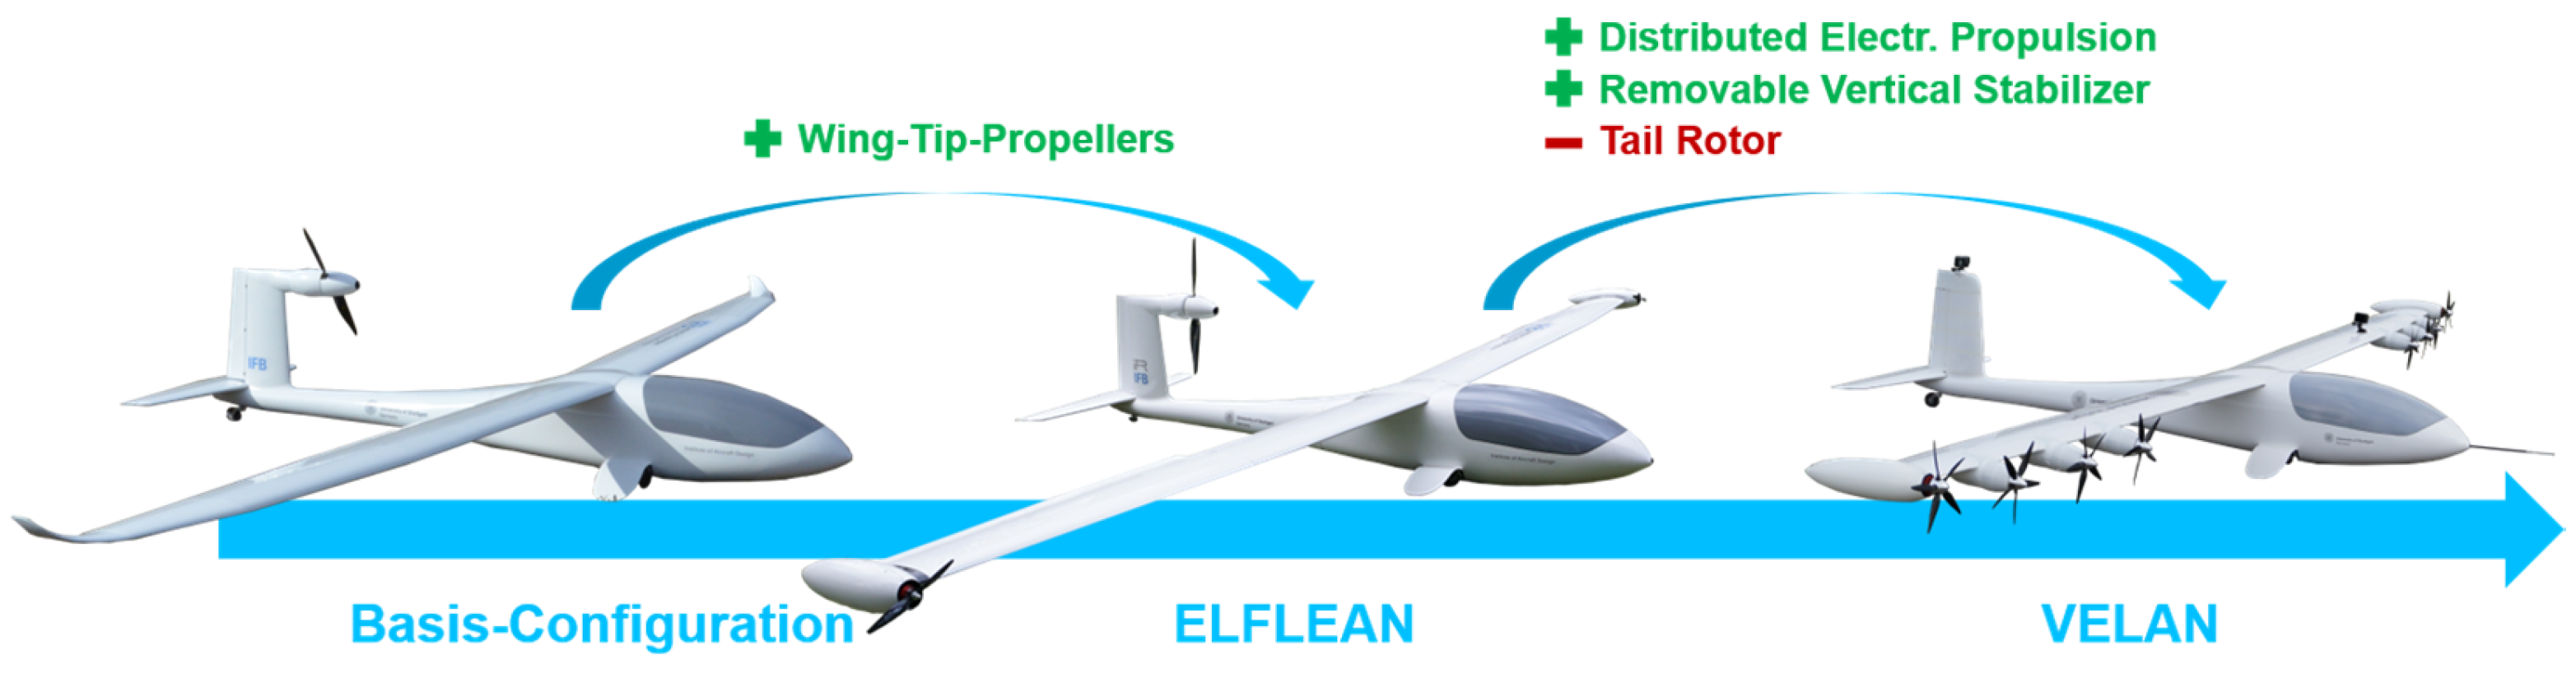
23] with a modular design. This enables the e-Genius-Mod to be modified both time and cost-effectively, e.g., to change the aircraft configuration (see
Figure 11).
After analyzing the flight performance of the base configuration [
25], two major modifications took place, the latest one being VELAN. Prior to being fitted with DEPs, the winglets of the base configuration were replaced with wing-tip propulsions (WTPs) to investigate their effect on the wingtip vortexes [
26].
For the VELAN project, the e-Genius-Mod was modified further by removing the VTP and adding more motors over the wing, along with the WTPs. An overview of the parameters is listed in
Table 3.
Flight tests were conducted during the VELAN project to gather data for the individual disciplines involved. Two airfields were used for flying, the first being Hahnweide Airfield near Kirchheim unter Teck and the second being Mengen Airfield at the town with the corresponding name.
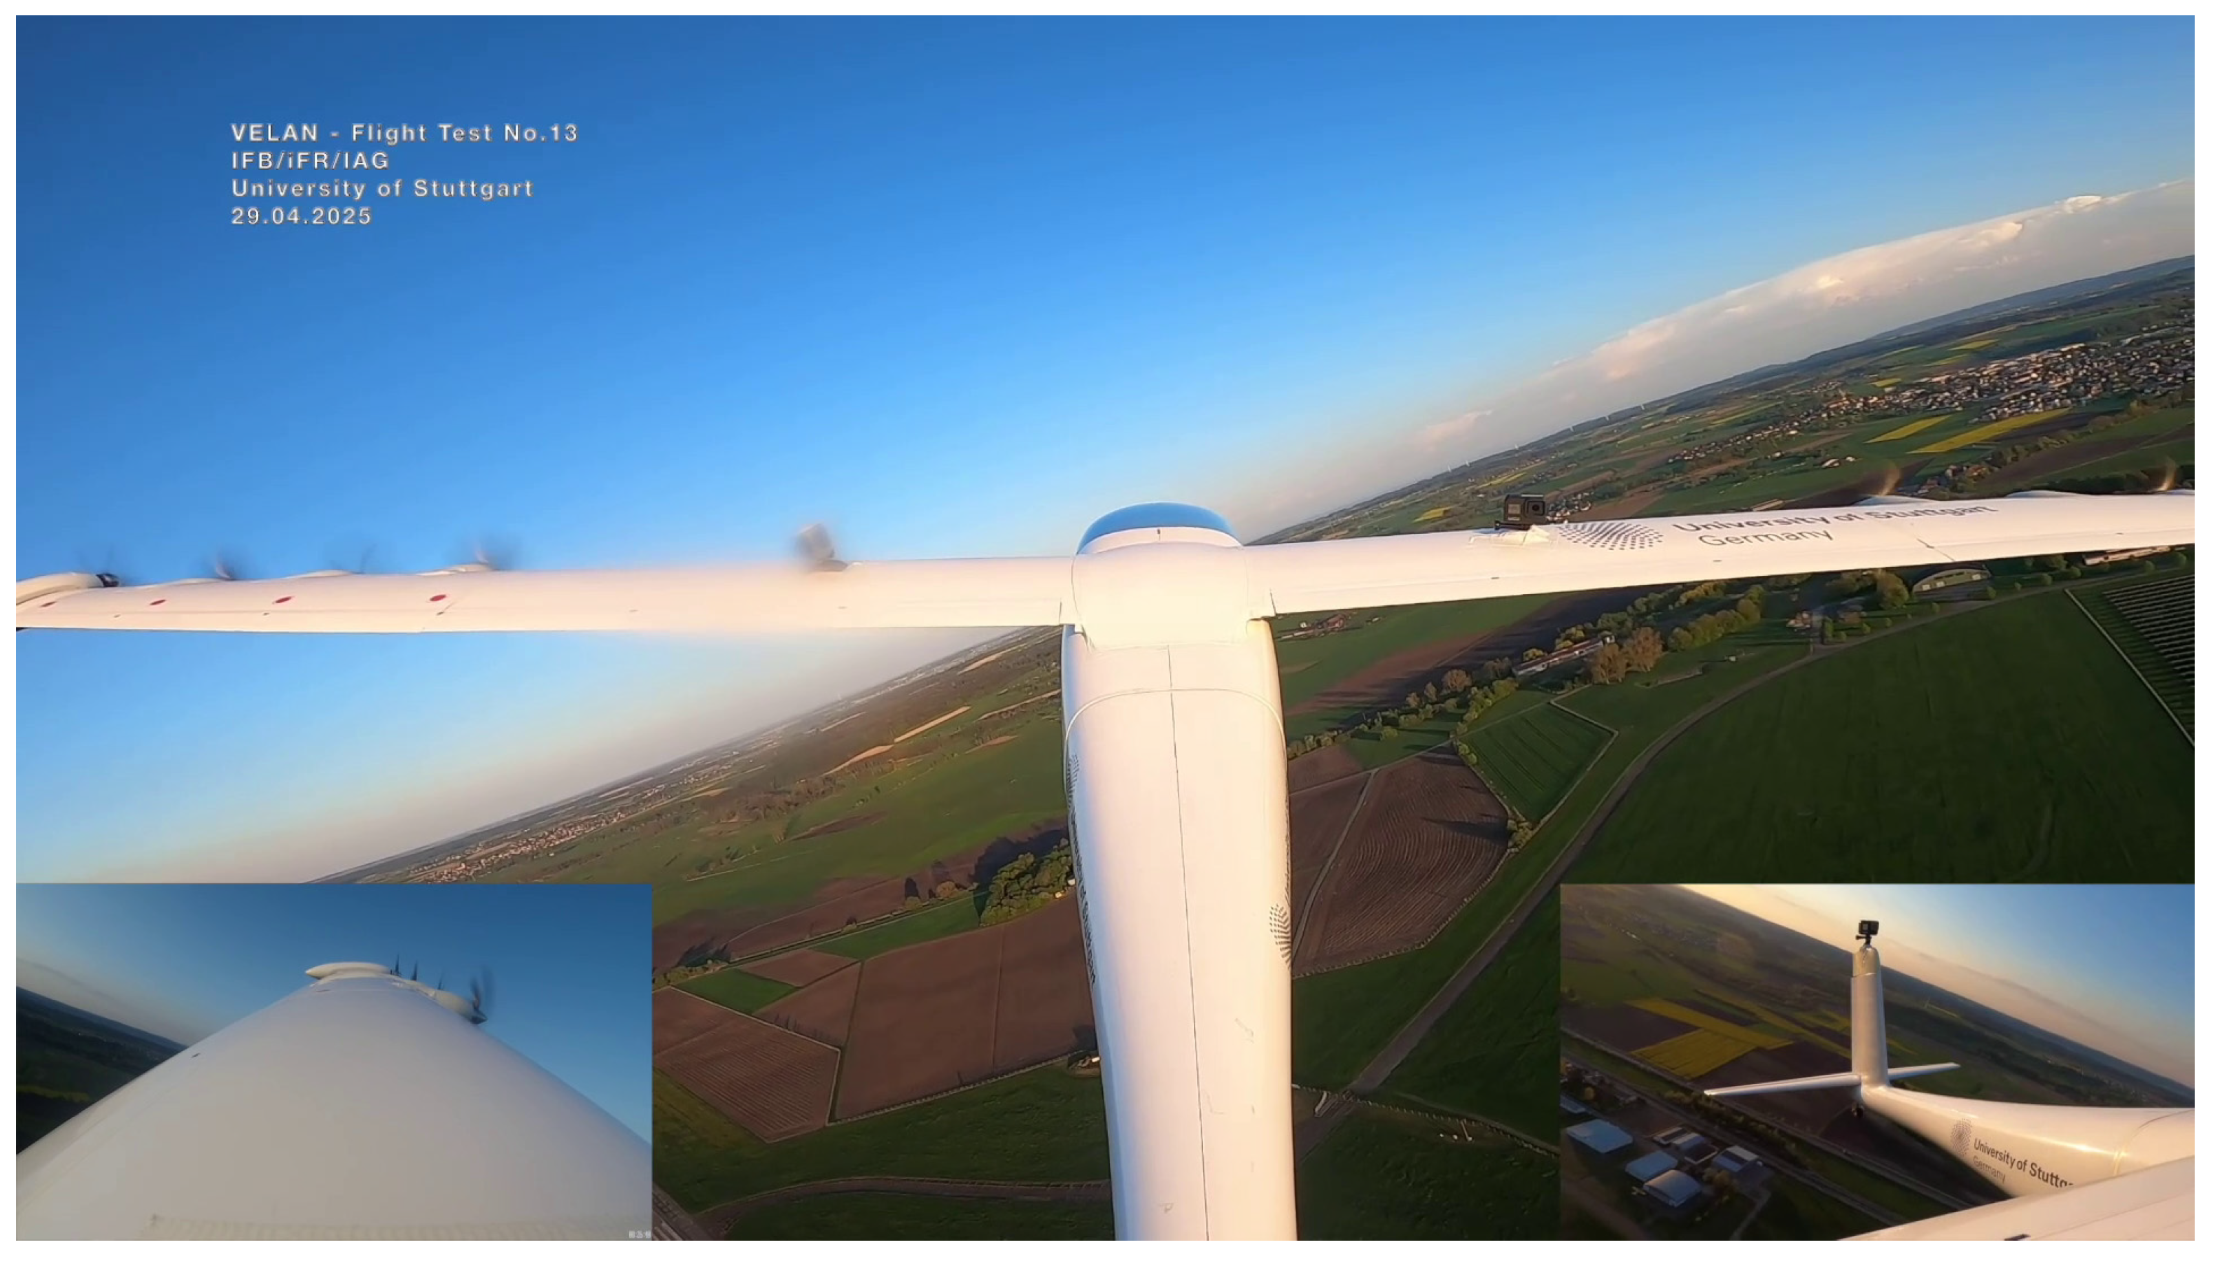
In general, flight tests are conducted during the morning, while the atmospheric conditions are calm and air traffic is low. All flights are performed within the visual line of sight (VLOS) of the pilot and last between 10 and 15 min, depending on the flight objective and battery capacity. To acquire flight data under as reproducible conditions as possible, a flight control algorithm was developed, guiding the e-Genius-Mod along a predefined flight path at an altitude of 300 m above ground level (AGL). An in-flight view of the e-Genius-Mod during a test flight is provided in
Figure 12.
In total, 24 test flights have been completed at the time of the publication of this paper. Despite minor technical setbacks and valuable lessons learned, the overall test campaign is considered successful. Due to the increased risk associated with the gradual reduction in the VTP, the respective flight tests have been placed at the end of the test plan, including the flight test representations of off-nominal operating conditions by switching off electric motors. Presently, test flights with 80% and 60% of the original VTP size with all engines running have been conducted successfully. The remaining flights are to be completed after publication of this manuscript. The so far obtained flight test results have been used within this paper to obtain aerodynamic and propulsion models (
Section 2.6) and to aid the definition of the not yet accomplished flight test scenarios to be used for overall method validation (
Section 5.1).
4. Deduction of a Universal Approach for the Assessment of Failure Effect Criticality and Mitigation Strategies
Application of the automated safety assessment framework, as introduced in
Section 2, yields detailed, quantitative results for all likely failure case scenarios regarding their effects on top-level aircraft performance and controllability metrics. However, the results are very specific and bound to the specific aircraft configuration, its dimensions, powertrain architecture, and propulsor placement. In general, but also as specifically demanded by the overarching objectives of the CONCERTO project, it is desirable to find an abstract depiction and interpretation of the results to ease the transferal of conclusions to other configurations and aircraft sizes, as well as to find a methodical approach for a quick preliminary assessment of possible propulsion system failures, their aircraft level effects, and hence their criticality. Even when accounting for aero-propulsive effects, the most dominating effects of propulsion system failures on aircraft top-level functionality have been shown to be the loss of thrust for one or more propulsors and the corresponding failure-induced yaw moment. Consequently, these two effects will serve as an example in the following on how to derive a more general assessment of failure cases for an arbitrary aircraft geometry and propulsion system design that can be useful in various aspects. In line with current certification regulations for conventional configurations, model-predicted climb performance as well as failure-induced yaw asymmetry during takeoff climb with maximum thrust for all operational propulsors will be regarded as most critical and therefore be taken as baseline for the following considerations.
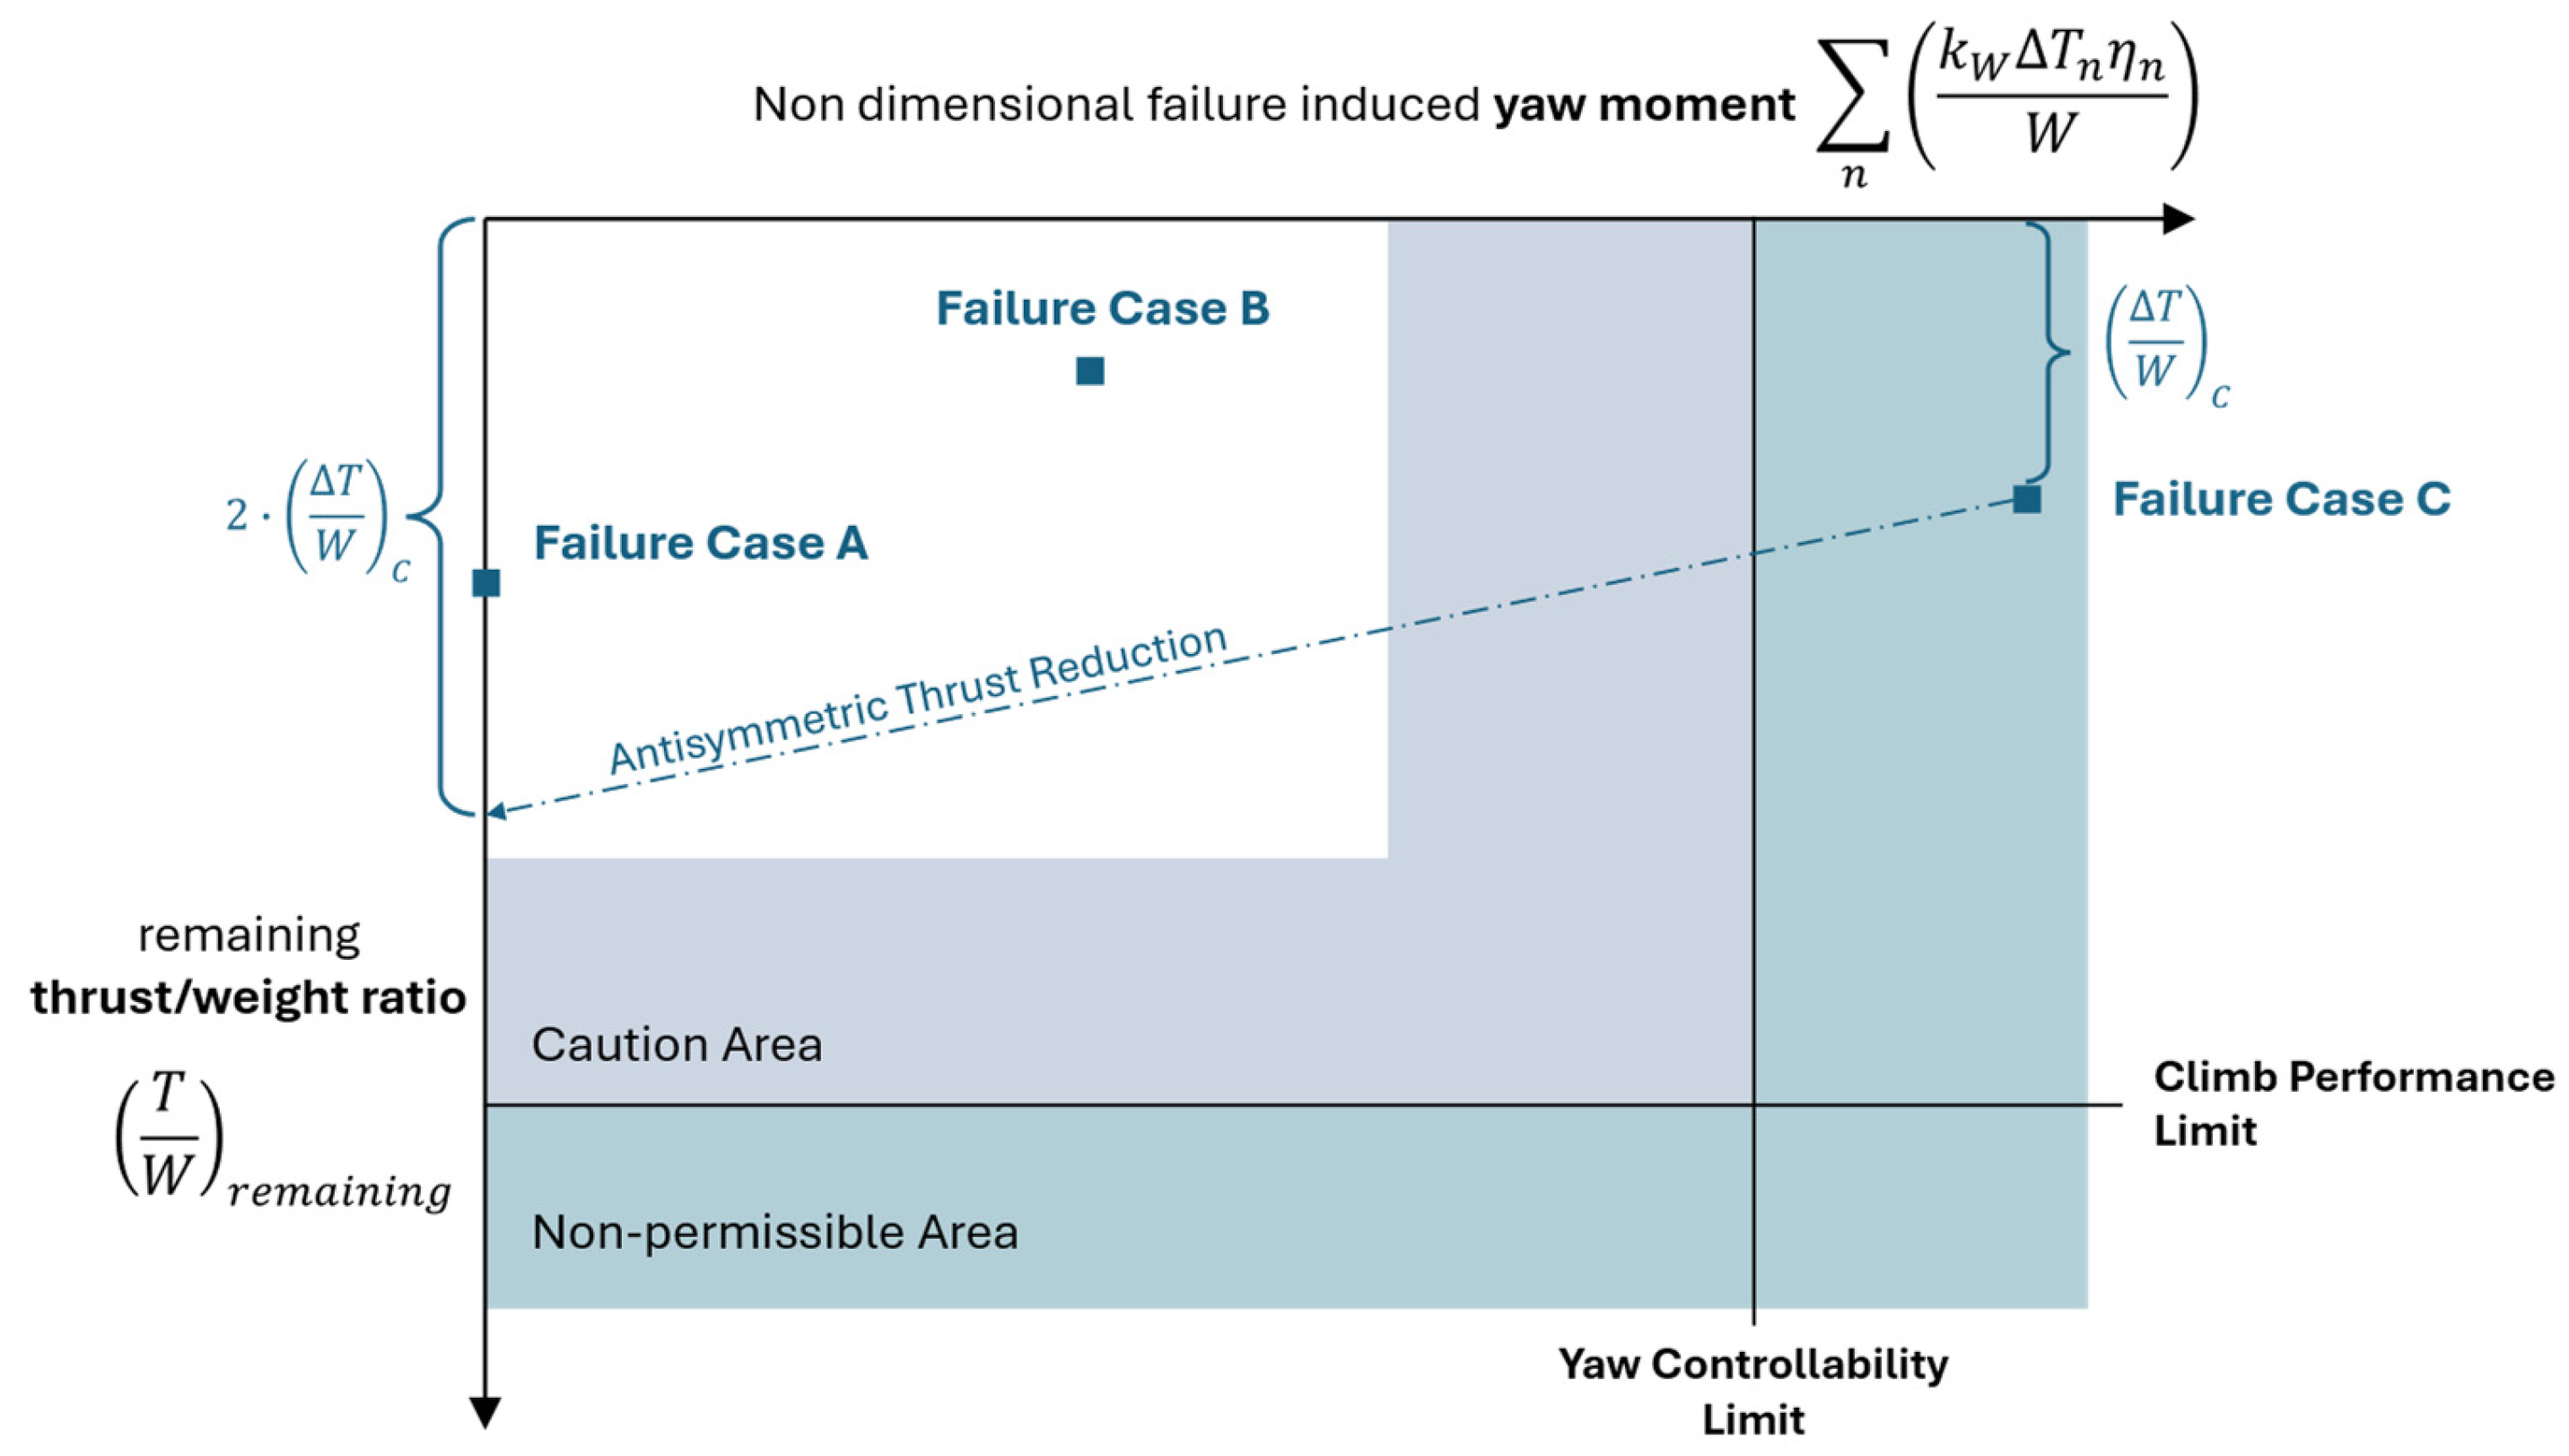
The basic idea that has been followed to establish the diagram, as depicted in
Figure 13, is to find nondimensional equivalents to quantify any failure case-induced yaw moment as well as the associated thrust loss for all relevant failure scenarios during takeoff climb. Therefore, the following definitions have been established:
The remaining thrust-to-weight ratio for each specific failure case can be calculated by the subtraction of nondimensionalized thrust loss for all affected propulsors
from the nominal thrust to weight ratio with all motors operating:
Similarly, the nondimensionalized failure-induced yaw moment
can be derived by multiplying the nondimensionalized thrust loss for each affected propulsor
with its spanwise position
In both equations, (24) and (25), an empirical factor
is used to account for the effect of windmilling propellers on the inoperative motors. This way, the effects of asymmetric drag increase due to the windmilling propellers are accounted for in both the determination of failure-related thrust-weight ratio and the failure-induced yaw moment. Based on the considerations in [
12], a value of 1.25 has been chosen for
in the following.
Using the approach described above offers the decisive advantage that it relies only on basic aircraft parameters, namely maximum thrust and spanwise position of each propulsor and aircraft weight. Therefore, it should be readily available already at any preliminary aircraft design stage. The resulting diagram resembles graphs typically used for the preliminary aircraft design phase, with the fundamental difference that it not only accounts for nominal operation but also includes all relevant propulsion system failure cases.
The attained non-dimensionalised values can then be plotted in the diagram and assessed for criticality regarding climb performance and yaw controllability. By providing estimates for the maximum yaw moment that can be counteracted by rudder deflection (yaw controllability limit) and minimum remaining thrust to weight ratio as dictated by climb performance requirements (climb performance limit). These limits define the boundary of the critical area in the sense that failure cases within this area can be expected to violate either the climb performance or lateral controllability requirements. Due to the simplifications involved in the compilation of the diagram, as well as possible uncertainty in the estimation of the climb performance and yaw controllability limits, a caution area is used close to the boundary. Failure cases in this area deserve close attention, since slight alterations in design parameters or more accurate computational methods could shift them into the non-permissible area. In contrast, failure cases within the white area can be regarded as uncritical. In this sense, the diagram allows a quick assessment of the criticality of each failure scenario. Furthermore, the consequences of changing any input parameter, like motor position, maximum thrust, or aircraft weight, can be directly evaluated. Lastly, the most obvious mitigation strategy for exceeding yaw control authority, namely antisymmetric thrust reduction, can be incorporated directly into the diagram. Reducing the thrust of the equivalent of any failed motor on the opposite side of the aircraft from 100% to 0% will ultimately result in reducing the failure-induced yaw moment to zero, while simultaneously doubling the loss in thrust-to-weight ratio. Any intermediate reduction can be found by following a straight line between the two points of either no or 100% antisymmetric thrust reduction. This line is depicted in
Figure 13 for “Failure Case C”. Whenever any point on this line can be found that lies outside the critical area, the corresponding failure case can be made manageable by reducing the thrust on the opposite motors correspondingly.
This non-dimensionalised, simplified approach eases the transfer of results and comparability significantly. The most important benefits can be seen in the following aspects:
- 1.
Grouping the results according to the failed propulsors, regardless of the underlying failure within the powertrain architecture, can help to infer conclusions that hold independently of the exact powertrain design. E.g., the diagram can be used to determine which single motors or combinations of motors are not allowed to fail to fulfill climb performance and yaw controllability requirements. If necessary, the diagram can be constructed without knowing or having determined the technology or system architecture used for propulsive power supply.
- 2.
Due to the non-dimensionalised depiction, results of a specific configuration can be expected to be a good approximation for similar configurations on a larger scale.
- 3.
Fundamentally different aircraft designs may, of course, still result indifferent effects of the associated failure cases. However, reducing complexity by relying on a handful of very basic preliminary design parameters allows for a quick estimation of failure case effects, even for different aircraft designs. Thereafter, the non-dimensionalised depiction can be used to compare different configurations.
5. Results
The existing safety assessment framework is designed to predict climb performance and controllability metrics in initial takeoff climb configuration close to the ground, similar to the requirements on takeoff climb gradients in certification regulations, e.g., in CS23 [
27] and CS25 [
28]. However, to limit the overall risk for the flight test campaign, it has been decided not to plan flight tests in off-nominal configurations close to the ground, especially due to the possibility that some scenarios may not be steadily controllable. To allow adequate preparation and validation of feasible flight test scenarios, new TLAF metrics with slightly different constraints and flight state definitions have been defined to adequately represent envisioned low and high-speed scenarios in level flight. Based on e-Genius-Mod aircraft geometric data and the block diagram representation of the powertrain architecture, the method automatically evaluates all top-level metrics, namely maximum range, climb gradient, and controllability metrics in takeoff climb, as well as controllability metrics in low-speed and high-speed level flight. The powertrain architecture model is used to simulate energy flow and propulsor availability in nominal operating conditions, together with a total of 55 failure case scenarios. The following table presents the results of predicting the selected flight test scenarios according to the reasoning in
Section 5.1:
Table 4 provides the calculated trim state for the selected scenarios, together with the yaw-controllability margin
in percent. For clarity, the roll-controllability
margin was omitted, as results of this study indicate that yaw controllability
remains the dominant failure case, even when considering aero-propulsive effects. A full overview, including the roll-controllability margin
, is provided in
Table A1, within the Appendix A. The definitions of the respective controllability margins follow the idea in [
8] by relating the failure induced yaw and roll moments
and
to the maximum yaw and roll moments
and
that can be trimmed statically by use of full control surface deflections and maximum allowed bank angle if required:
Values above zero for the respective controllability margins indicate that there is still control authority in terms of either bank angle or control surface deflection to compensate for higher yaw or roll moments. When the controllability margin reaches zero, the aircraft-specific controllability limit is reached, requiring maximum bank and control surface deflections to compensate for failure-induced moments. Values below zero are reached whenever the flight state is no longer controllable, even with maximum bank and full control surface deflections.
In terms of controllability, the high-speed flight test scenarios can be seen as less critical since the higher speed results in higher control effectiveness and the lower thrust setting to lower absolute values of the failure-induced roll and yaw moments. In all cases, yaw control authority shows to be more restrictive than roll control authority, meaning that the yaw moments caused by failure-induced thrust asymmetry have a significantly larger impact on controllability than roll moments resulting from aero-propulsive effects on lift distribution. Based on the model predictions, controlled and stable level flight can be reached for all single motor failures without exceeding maximum bank angle or maximum control surface deflections. For all single motor failures, the maximum allowed rudder deflection is used, since the trim state is calculated based on the assumption that maximum use of available control surface deflection is made to minimize the required bank angle. By increasing the bank angle up to its maximum allowed value of 10°, higher yaw moments can be compensated. In case of failure of the outboard motor (Motor 1), the lowest yaw controllability margin of 39.5% is predicted.
In contrast, with low speed and maximum thrust on the remaining motors, the yaw controllability margins are considerably lower. With failure of the outboard motor (Motor 1) and the remaining motors running at full thrust, controlled level flight cannot be maintained, since even at the maximum allowed bank angle of 10°, the required rudder deflection exceeds its physical maximum of 25°. Consequently, the yaw controllability margin is negative.
Based on the results in
Table 4, it can be concluded that the highest risk associated with the simulated flight test scenarios lies in the inability to maintain straight and level flight due to the required rudder deflection exceeding the maximum physically possible value. This risk has an even higher relevance when it comes to feasibility considerations on reducing the vertical tail plane size. Besides effects on nominal system behavior, effects on controllability in the presence of relevant system failures need to be assessed as well. For the low-speed flight test scenarios, the controllability limit is already reached with full vertical tail size when assuming a failure of the outboard motor.
Table 5 shows how the reduction in vertical tail size impacts the controllability of the high-speed flight test scenarios. Results are provided for 100% vertical tail area (“100% VTP”), a 20% vertical tail area reduction (“80% VTP”), and a 40% vertical tail area reduction (“60% VTP”), respectively.
When reducing the vertical tail size to 80% of its original value, failure of the outboard motor becomes critical regarding lateral controllability. Further reduction to 60% of the original vertical tail size already implies that rudder control authority is not sufficient to counter any single propulsor failure. This emphasizes the need for suitable mitigation strategies to maintain aircraft safety in the presence of propulsion system failures when envisioning reducing aircraft vertical tail size. One possible mitigation to make the scenarios manageable can be seen in reducing thrust on the non-affected side to reduce or eliminate the failure-induced yaw asymmetry. However, this comes at the cost of further reducing the available thrust.
5.1. Flight Test Representation of Failure Scenarios
One of the most important goals of the current efforts that is ultimately expected to contribute valuable insights for both the VELAN project as well as the CONCERTO project is to be seen in the validation of the predictions of the failure effect on top-level aircraft functions, including the consideration of aero-propulsive effects, from the application of the automated safety assessment method. Two main objectives shall be achieved by combining the model-based safety assessment with flight tests. Firstly, insights from flight tests shall be used to validate and potentially improve the aerodynamic and performance models that form the baseline of top-level aircraft metric calculations. Secondly, demonstrating the effects of certain failure cases during flight tests shall serve the purpose to substantiate the meaningfulness of the attained results and thus prove the credibility of results for failure case scenarios that are either difficult to represent through flight tests or pose a high risk of damage or loss of the model aircraft. Predictions of the model-based safety assessment framework provide great support in the step of designing suitable flight test scenarios, since they can give a first impression of the resulting flight state and associated risk for the complete set of relevant failure scenarios. Based on the results of the automated safety assessment process and the lessons learned during the VELAN flight test campaign, the following flight test scenarios have been agreed upon:
The following considerations have led to the definition of the flight test sequence according to
Table 6:
Safety considerations: Generally, to limit overall risk, all flight tests concerning off-nominal operations are planned to be conducted at a safe height in level flight and are planned for single-propulsor failures only. For both series, the sequence starts with the inboard motor switched off, as this results in the smallest asymmetric yaw and roll moments. Thereby, propulsive asymmetry and associated risk of controllability-related problems are gradually increased, permitting adjustments to the flight test setup whenever deemed necessary for a successful outcome. Additionally, as the implementation of the failure scenarios in the VELAN flight control system is foreseen via the flight control computer, a bypass logic on the remote control is available to disable the flight control computer and enable direct control of the aircraft, restoring normal operating conditions whenever necessary.
Model prediction results: First evaluations of model predictions with full thrust and low speed, together with propulsion system failures, have indicated that even with a full vertical tail plane, failure of the outboard motors is not controllable steadily without further measures, like antisymmetric thrust reduction (see
Table 4). The situation aggravates when considering the possible reduction in the vertical tail plane. Already with 60% size of the vertical tail plane, all single-propulsor failures become critical regarding controllability (
Table 5) according to the model predictions. This has led to the decision to establish a series of high-speed flight tests with lower thrust before progressing to the low-speed full thrust scenarios. The expected benefit is twofold: Firstly, the overall risk is reduced by creating the opportunity to gather insights and experience with less critical flight scenarios, which are expected to be well controllable with a nominal vertical tail size, regardless of the position of the switched-off motor. Secondly, it is expected to achieve a more profound basis for validation of the safety assessment method for reduced vertical tail configurations. The reasoning is that the model predictions suggest that stable flight states allowing comparison with the predicted control surface deflections can only be achieved when conducting flight tests at high speed with lower thrust settings.
Model predictions have also been used to determine suitable speeds for the low-speed and high-speed scenarios in order to allow a sufficient margin (>20%) to stall speed and to ensure that high-speed level flight without speed loss can be performed with only 7 out of 8 propulsors available.
Compatibility with VELAN flight test campaign: Due to limited availability of resources and opportunities for additional flight test conduction, flight test scenarios had to be designed such that they are compatible with the flight profile and autopilot design used within the VELAN project.
Table 6.
Flight test scenarios.
Table 6.
Flight test scenarios.
| Unaccelerated Level Flight at High Speed (27 m/s) | Motor 4 out (inboard) |
| Motor 3 out |
| Motor 2 out |
| Motor 1 out (outboard) |
| Full Thrust Level Flight at Low Speed (20 m/s) | Motor 4 out (inboard) |
| Motor 3 out |
| Motor 2 out |
| Motor 1 out (outboard) |
5.2. Non-Dimensionalized Failure Case Depiction for VELAN Configuration
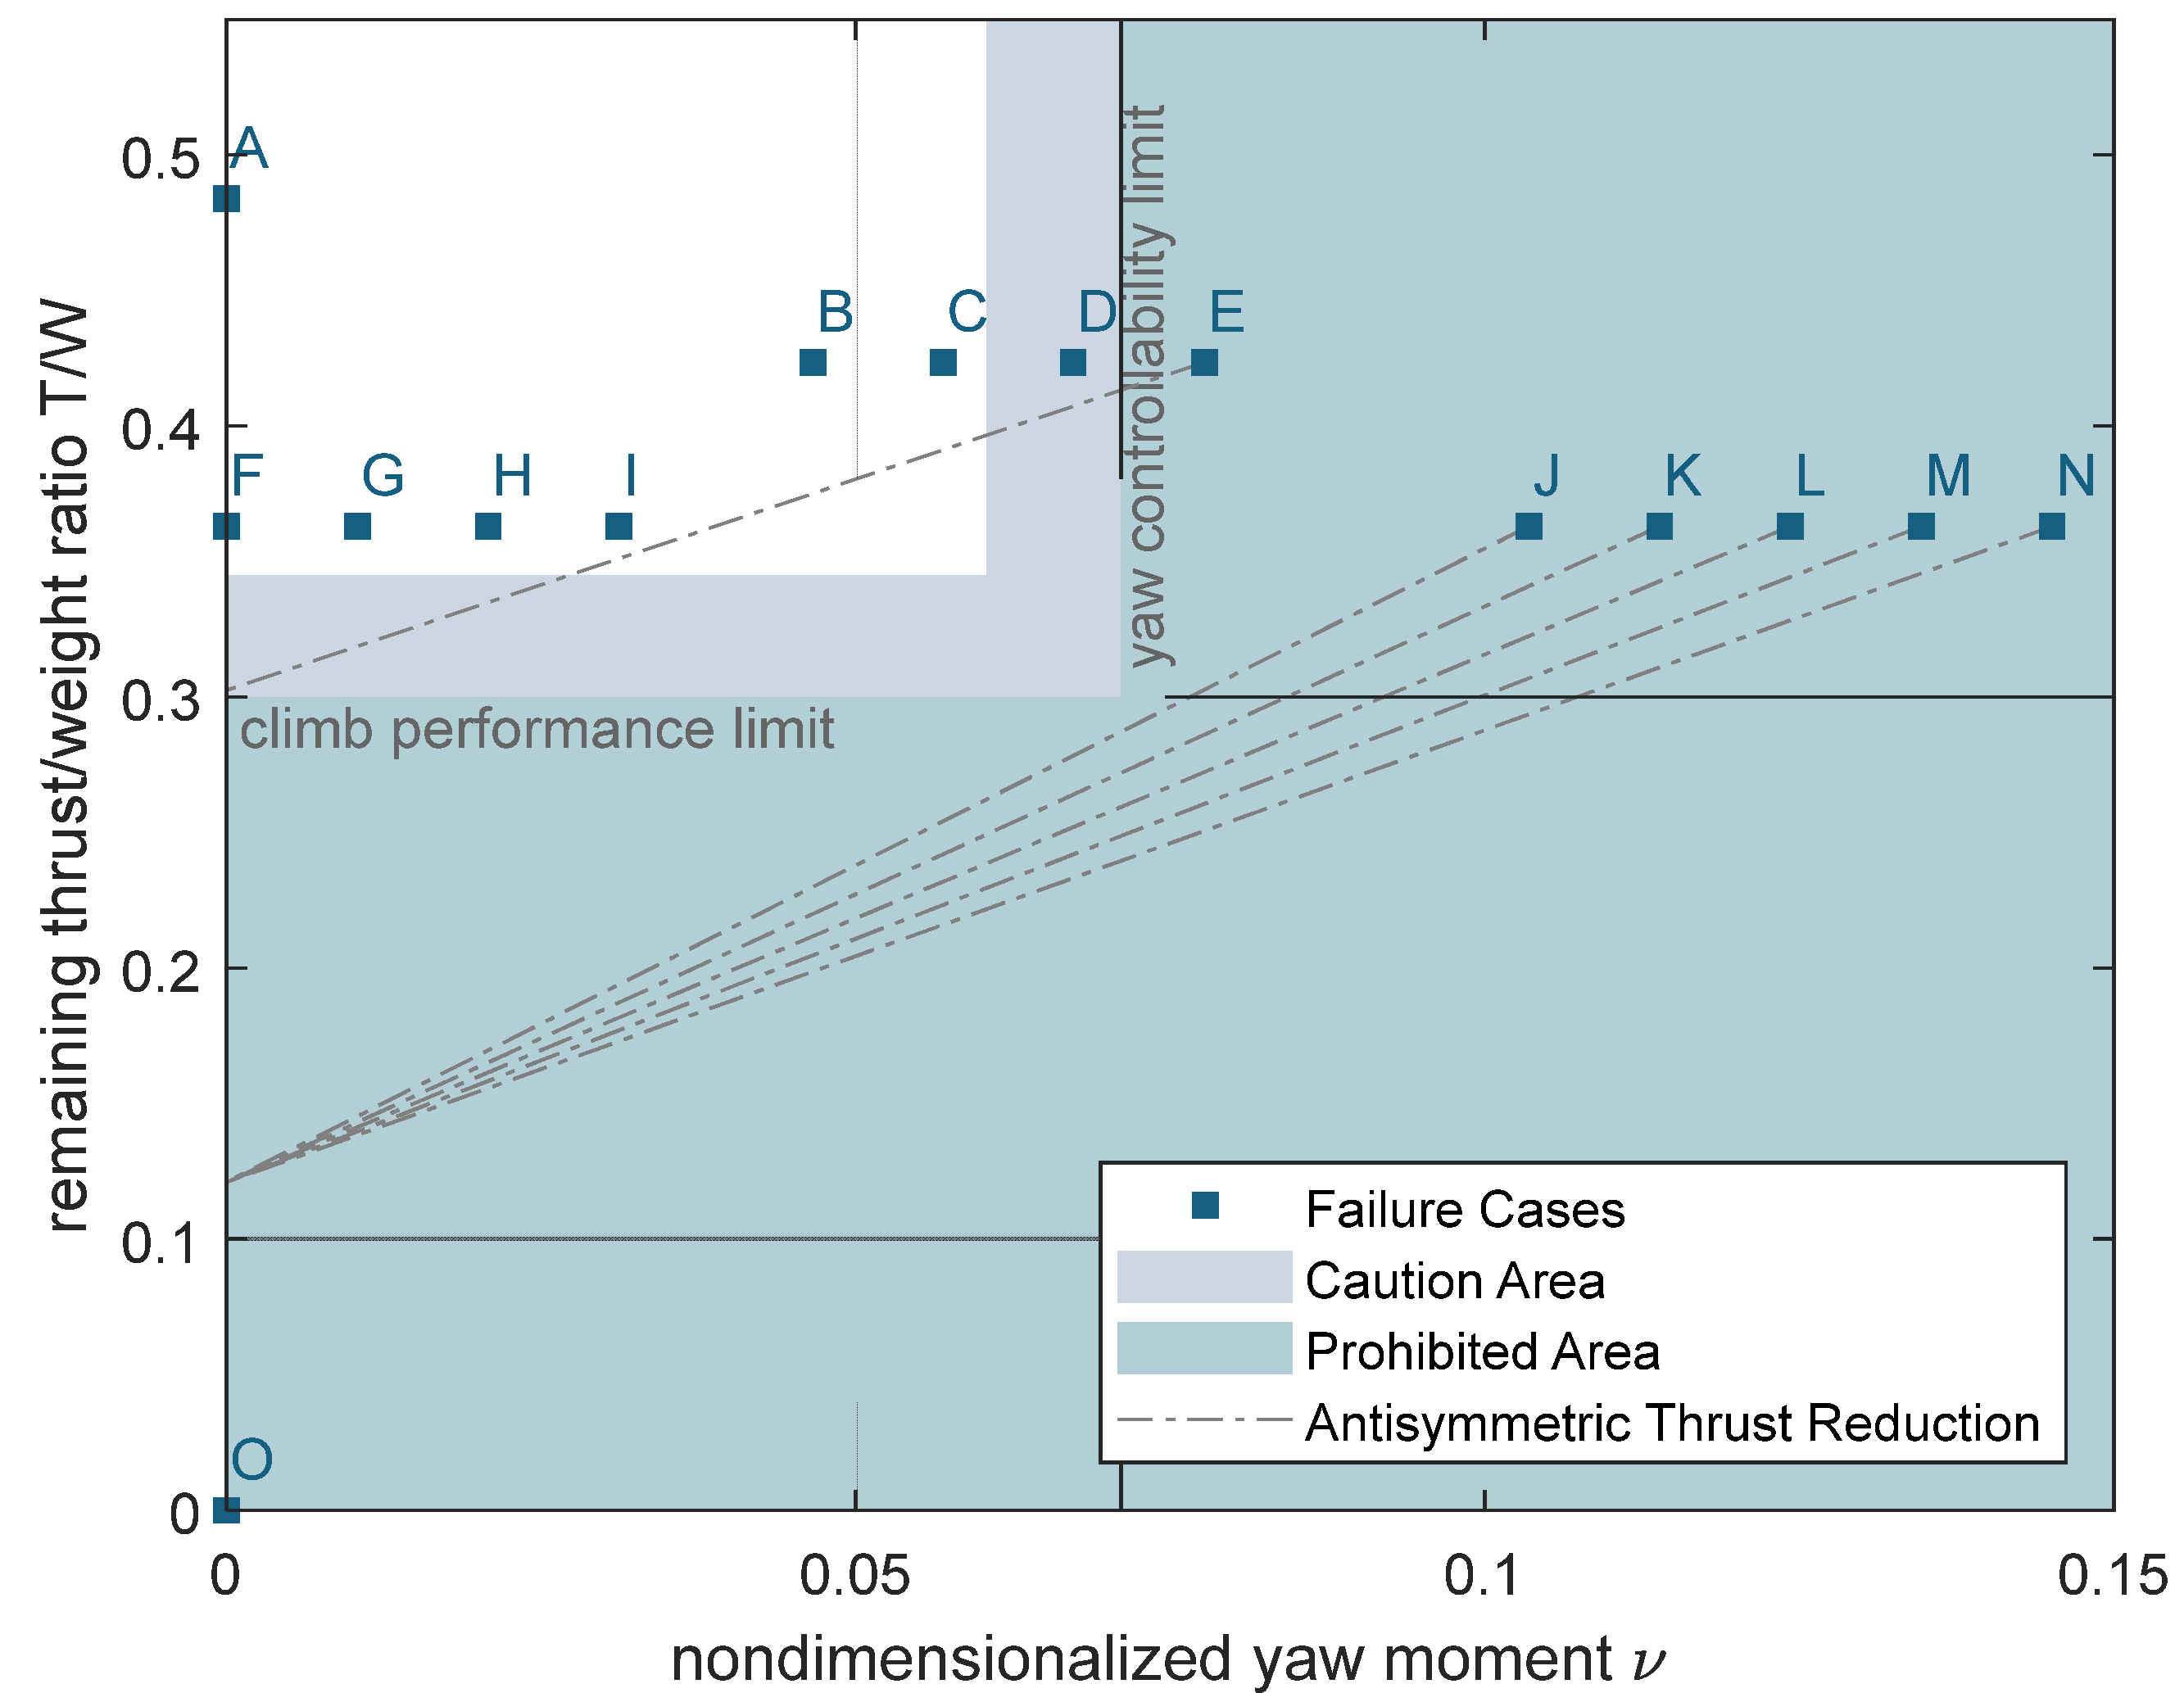
Supplementary to the e-Genius-Mod flight test scenario predictions, the non-dimensionalized failure case predictions for the take-off climb are given in
Figure 14.
To establish suitable limits for yaw controllability and climb performance, the following approach has been chosen: running the complete safety assessment framework results in a maximum controllable yaw moment that is slightly different for each simulated failure case, as it accounts for the complete trim state, including bank angle and aileron deflection. To be conservative, the yaw controllability limit as depicted in
Figure 14 corresponds to the lowest value of maximum controllable yaw moment
values for all failure cases. Based on this value, the yaw controllability limit
can be derived as follows:
The climb performance limit has been computed such that a minimum climb gradient of 3.0% is guaranteed by the remaining thrust-to-weight ratio, corresponding to the respective CS-25 requirement for four-engined airplanes [
28], which can be considered closest to the e-Genius-Mod configuration with eight electric motors. Imposing such a limit for the e-Genius-Mod platform may seem a bit arbitrary at first sight, however shall serve the purpose to demonstrate the usefulness of the method and to obtain insights that may be relevant for the original size e-Genius aircraft. The following reasoning has been used to transform the limiting climb gradient into a limiting thrust-to-weight ratio:
For small climb angles, the flight path angle
can be approximated as a function of thrust to weight ratio and lift to drag ratio [
29].
Consequently, the limiting thrust-to-weight ratio can be calculated as
In Equation (30), is the climb angle corresponding to the gradient limit, the lift-to-drag ratio belongs to the defined takeoff climb speed.
The caution area has been established by adding a margin of 15% to both climb performance and yaw controllability limits.
Table 7 provides details on the grouped failure case scenarios, the failure rates of the underlying powertrain failure scenarios, and the resulting categorization. The conclusion, that all single motor failures are shown to be controllable with rudder only, except failure of the outboard motors 1 or 8 (Label E), is congruent to the results in
Table 4. However, due to the opportunity to include the effects of antisymmetric thrust reduction into the diagram, it can be inferred that even in the case of failures of a single outboard propulsor, controllability can be regained without exceeding the climb performance limit by an adequate amount of distributed thrust reduction. This corresponds to the fact that the dashed line from Label E, in
Figure 14, runs through the white area. Failure of either motor 2 or 7 (Label D) results in a placement within the caution area, meaning that a slight change in input parameter, as well as inaccuracies in the computational method, may imply the possibility that this failure scenario may or may not be critical in a real flight environment, thus requiring close attention. However, antisymmetric thrust reduction can be used in this case as well to relocate this failure case well within the uncritical white area.
As an overall conclusion, it can be stated that all single motor failures can be expected to be manageable for the e-Genius-Mod, with the restriction that antisymmetric thrust reduction is likely to be necessary in case of failure of the outer motors. All dual motor failures grouped into the Labels J–N exhibit failure-induced yaw moments that exceed lateral yaw control authority by far. As can be inferred from
Figure 14, asymmetric thrust reduction in these cases does not resolve the problem, since the remaining thrust-to-weight ratio is already low, and antisymmetric reduction would lead to exceeding the climb performance boundary before reaching the area of lateral controllability. However, since the e-Genius-Mod is designed as a scaled flight test unmanned aircraft, an acceptable mitigation for all cases with yaw moments not controllable with full rudder deflection can be seen in cutting power to all motors and gliding to a suitable landing spot. The same strategy can be applied for a failure of the complete propulsion battery pack, where servo batteries can be used to provide safe remote control down to the ground. The establishment of a climb performance limit still provides valuable insights, especially when considering the transfer of the results to larger-scale projects, like the full-scale e-Genius, or even CS25 configurations.
5.3. Non-Dimensionalized Failure Case Depiction for CONCERTO Configuration
To enable thorough assessment of safety-related implications of the CONCERTO HVD system design, it is crucial to examine the consequences of different powertrain architecture designs on HVD system failure effects on top-level aircraft performance. Generally, any HVD system inherent failure that crosses the system boundary in the sense that it leads to a loss of a connected electric propulsor must be regarded as relevant. The propagation from HVD system failures to loss of electric motors depends on the routing from HVD power outputs to electric motor inputs. However, the failure effects on top-level aircraft performance resulting from the failure of one or more propulsors strongly depend on the powertrain architecture, e.g., number of propulsors and placement. Since the HVD architecture is deemed suitable for any kind of future propulsion system involving high-power electrical supply, it seems desirable to examine different propulsion concepts regarding their top-level effects of propulsor failures and the safety-related implications on the interface to the HVD system. The non-dimensionalized propulsor failure case depiction as introduced in
Section 4 offers a convenient way for quick assessment of these top-level failure effects.
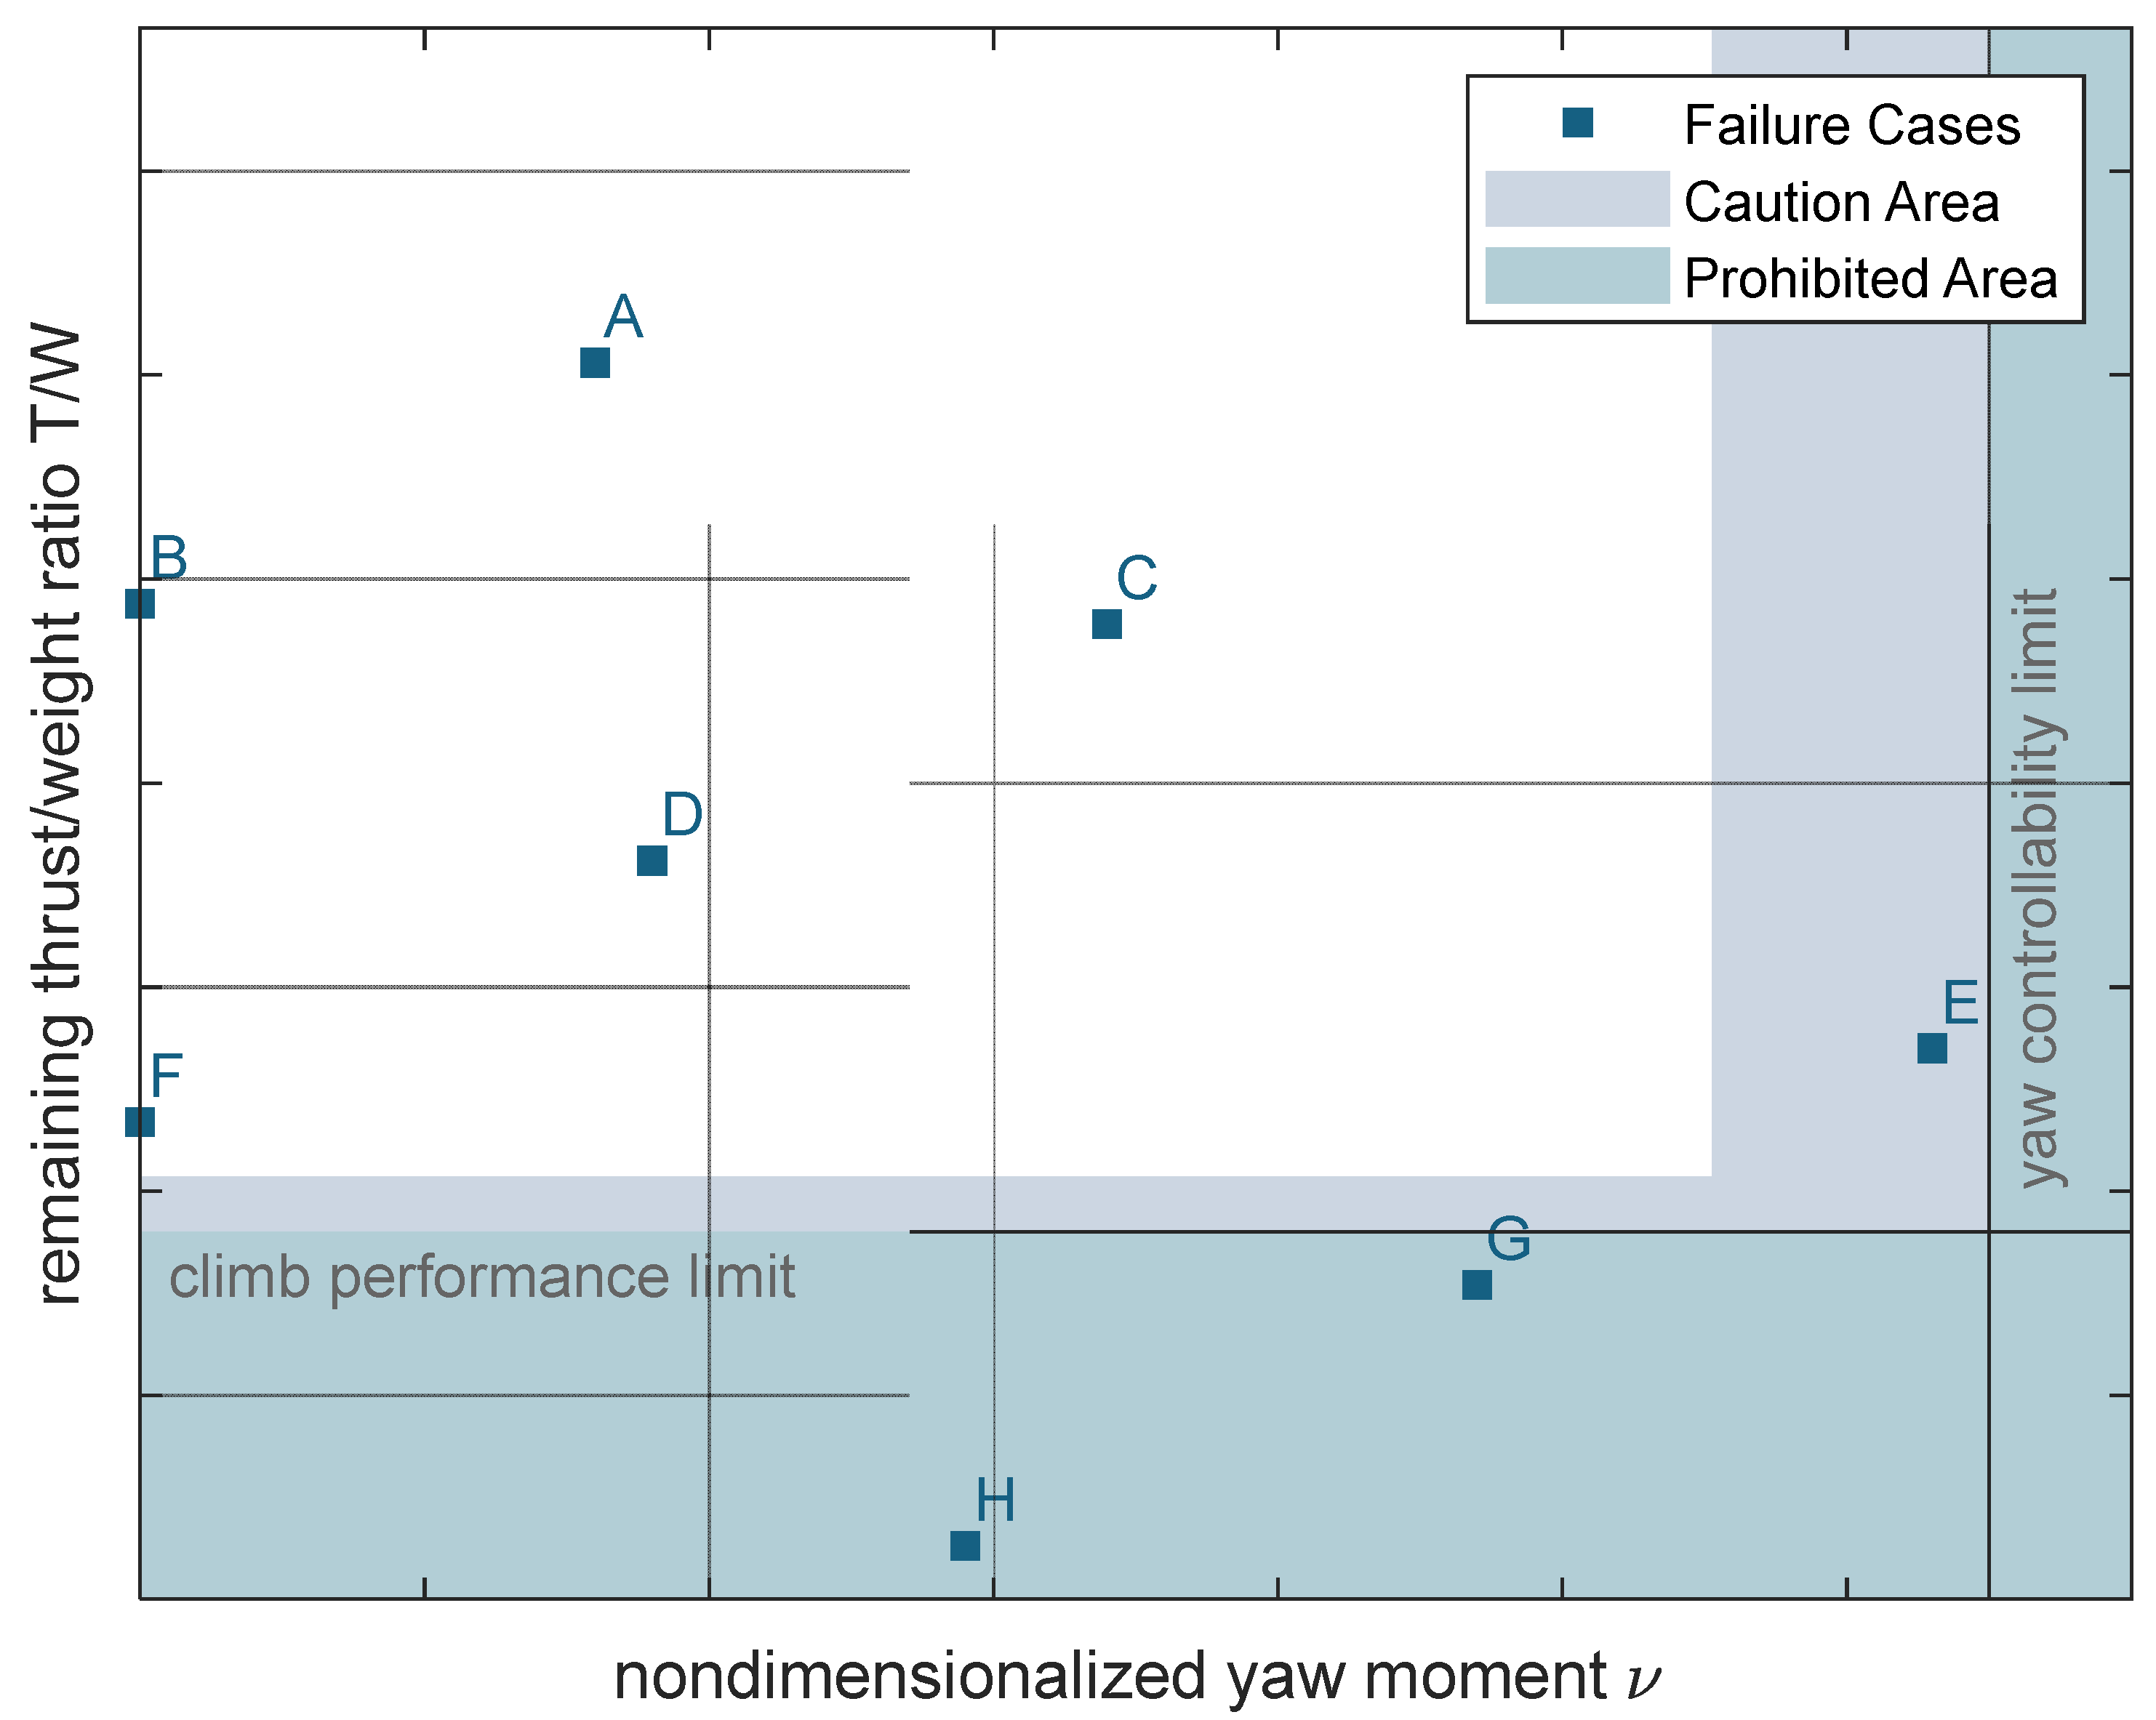
Figure 15 shows the non-dimensionalized failure case depiction based on the HERA Use Case A powertrain architecture as presented in
Figure 3.
Table 8 provides the associated failure case groups together with their categorization according to the estimated safety impact.
The remaining thrust-to-weight ratio and non-dimensionalized yaw moment have been computed for each failure case according to Equations (24) and (25). For the climb gradient limit, a minimum climb gradient of 2.4% corresponding to the respective CS-25 requirement for two-engined airplanes [
28] has been converted into a limiting thrust-to-weight ratio using Equation (30).
Similarly to the e-Genius-Mod in
Section 5.2, the yaw controllability limit has been established based on the maximum allowable yaw moment
using Equation (28). However, to allow compilation of the diagram without the need to prepare and run the complete safety assessment framework, the value of
has been estimated based on well-known empirical handbook methods:
is approximated by the maximum aerodynamic yaw moment that can be achieved with full rudder deflection
:
with
being the yaw-moment-due-to-rudder-derivative calculated as suggested by Roskam [
13]:
In Equation (32),
is the lift curve slope of the vertical tail,
the vertical tail area and
the distance between the aircraft’s center of gravity and the aerodynamic center of the vertical tail.
is an empirical factor accounting for three-dimensional effects and the rudder chord factor, whereas
and
represent the influence of rudder span and correction for nonlinearity effects in the case of high rudder deflections. All empirical factors have been determined using the instructions and graphs provided in [
13] based on the aircraft geometry.
It can be concluded that for the envisioned architecture, the only failure case that comes close to the yaw controllability limit is the combined failure of the gas turbine and electric motor on one side. This seems plausible as it corresponds to the one-engine-inoperative case for conventional configurations and can be seen as the dimensioning case for vertical tail design. Failure of both electric motors is uncritical for both climb performance and yaw controllability. Therefore, even a complete loss of electrical propulsive power is not regarded as safety-critical and thus does not yield any specific requirements for the HVD system. The only safety-critical failure cases are either the simultaneous failure of both electric motors with one gas turbine or one electric motor with both gas turbines. This implies that the combined reliability of gas turbines and the HVD system must limit the probability of these cases such that a catastrophic outcome can be tolerated.
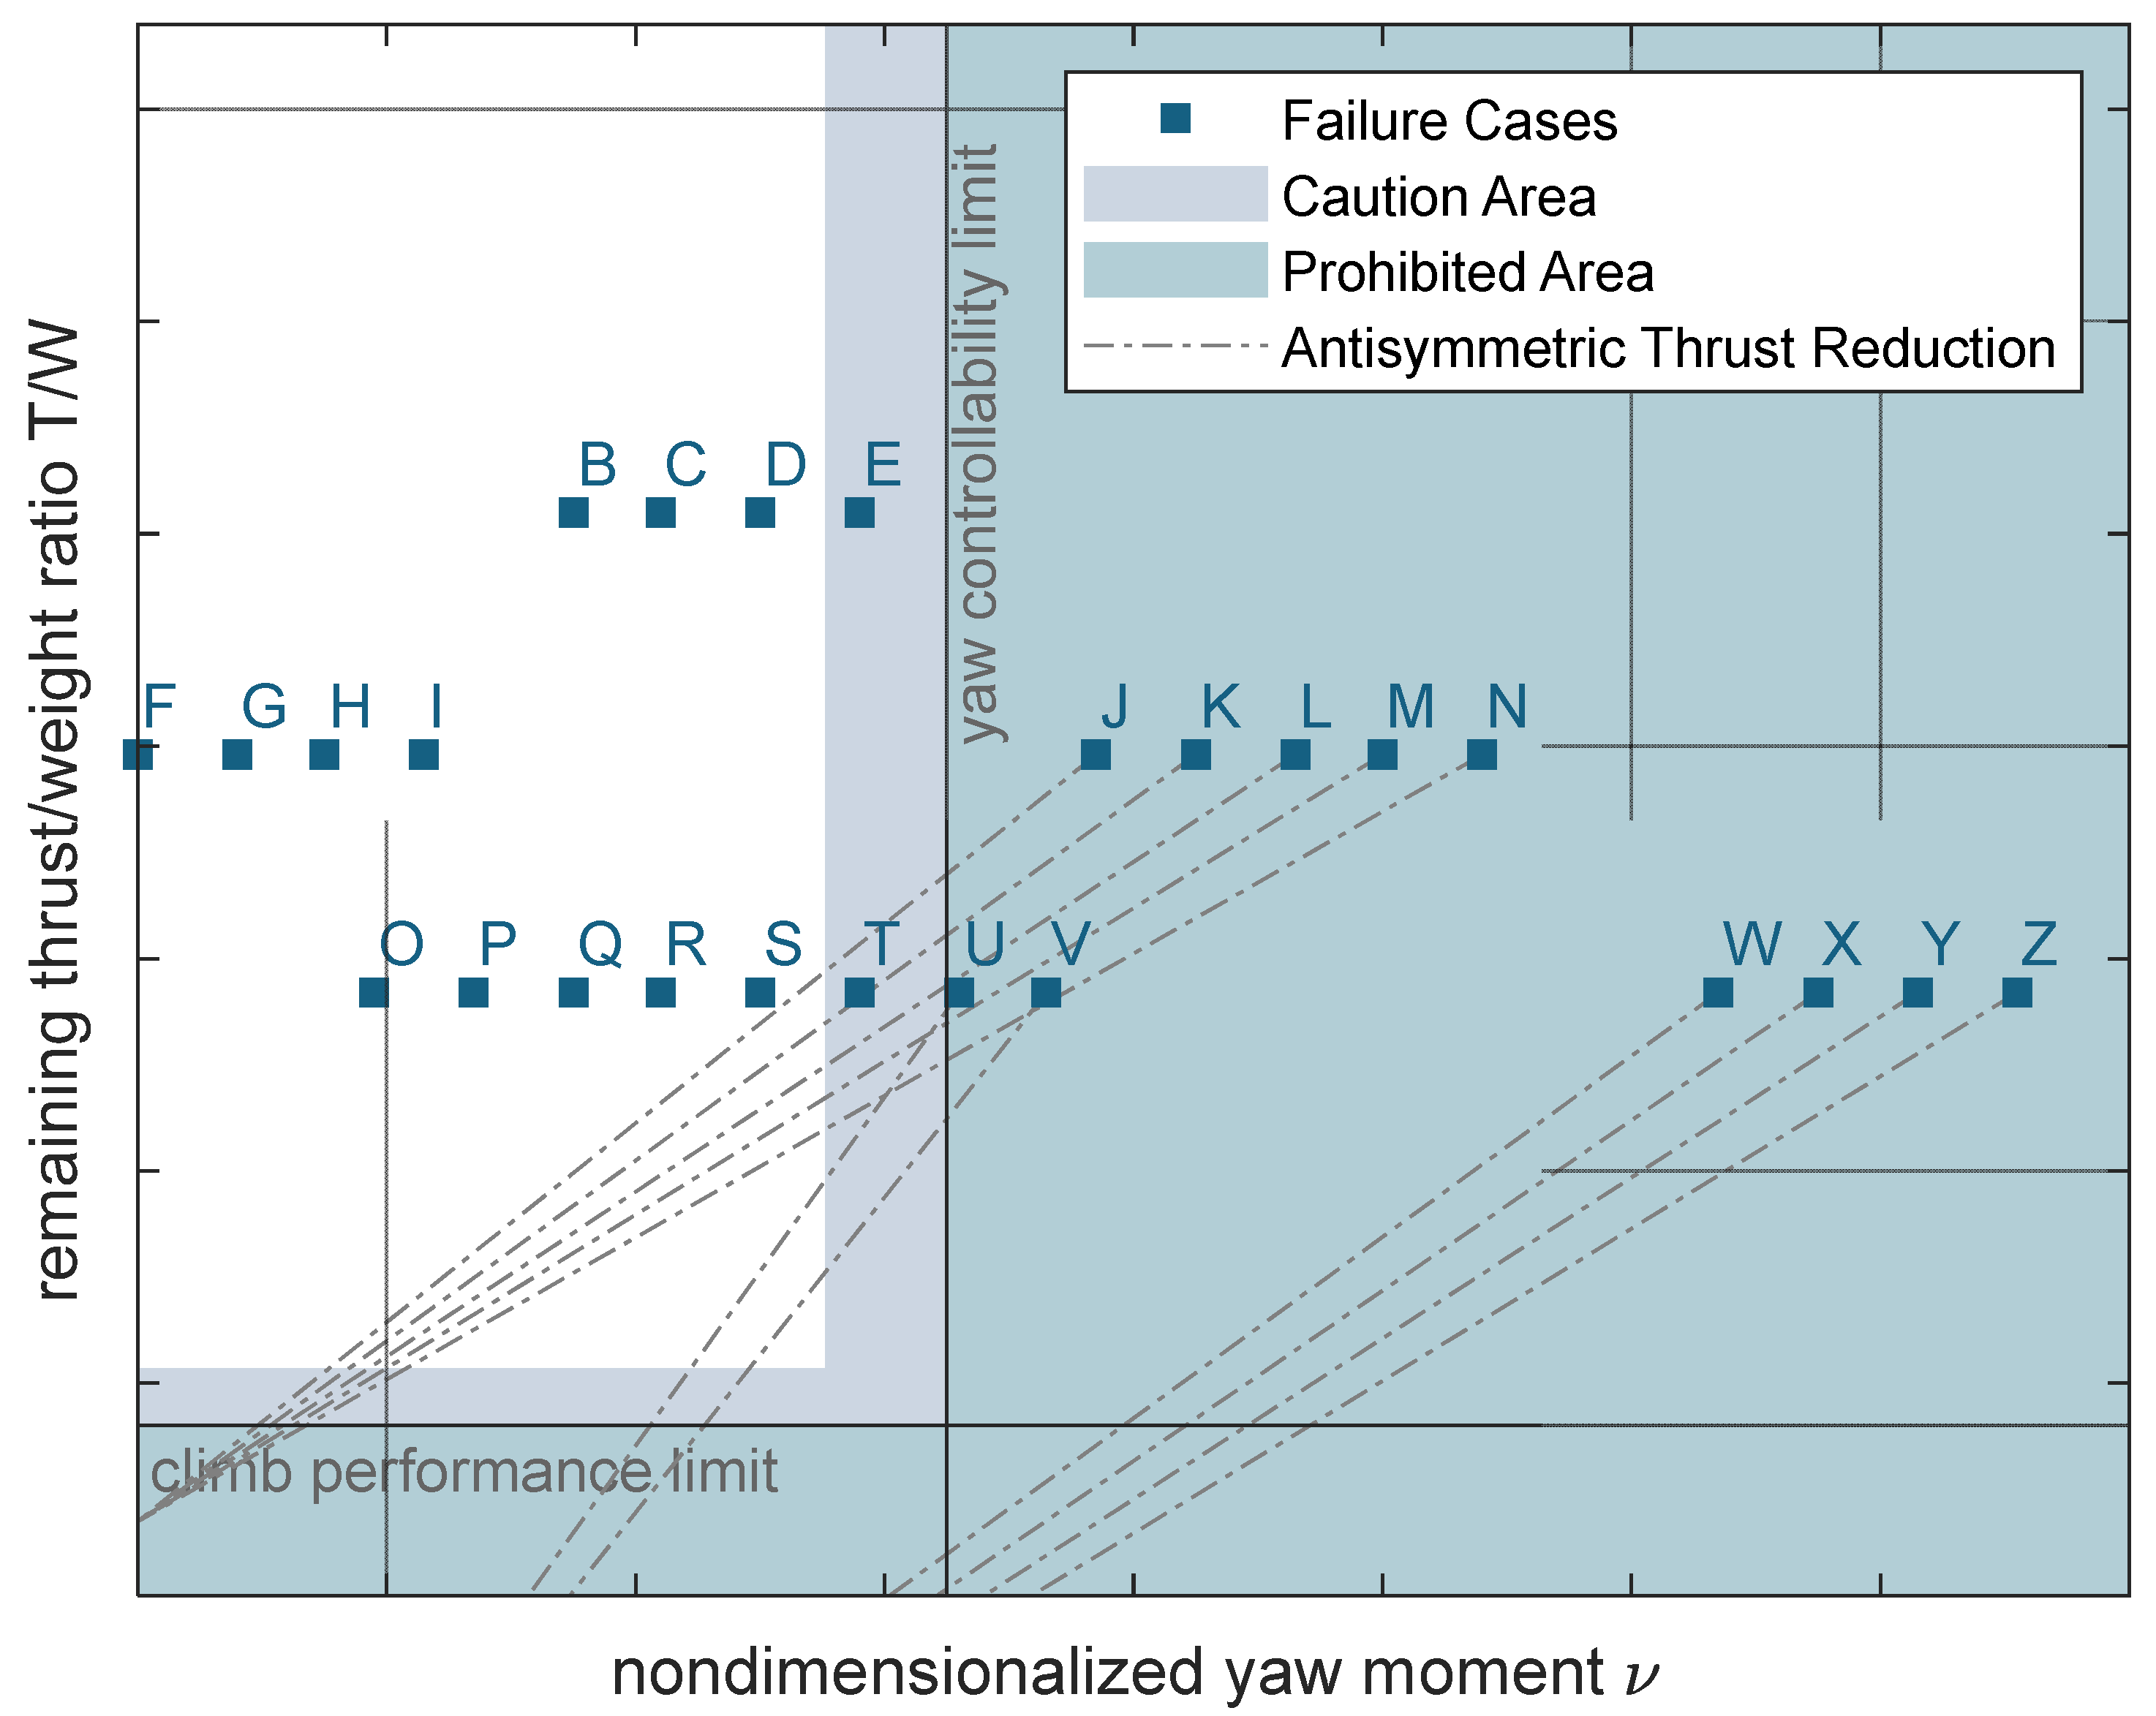
When it comes to distributed propulsion systems, the number of possible failure cases grows significantly, and failure effects may be less obvious and foreseeable. For demonstration purposes, a distributed propulsion system with a propulsor placement equivalent to the e-Genius-Mod, combined with thrust, mass, and aerodynamic properties from the HERA airframe, is evaluated in the following. This theoretical combination may be seen as the first assessment of an architecture, similar to the HERA Use Case B.
Figure 16 depicts the non-dimensionalised diagram for all failure combinations from single up to triple propulsor failures. Letters B to O are equivalent to the e-Genius-Mod failure cases and account for double propulsor failures, as listed in
Table 7. Letters O–Z represent the simultaneous failure of three electric motors at the same time. Following the depiction in the diagram, it can be concluded that some dual electric motor failures are uncritical (Letters F–I) per design, whereas the ones that exhibit strong lateral asymmetry (Letters J–N) can be made controllable via antisymmetric thrust reduction. When it comes to triple electric motor failures, some combinations are uncritical (Letters O–T), some can be made controllable with antisymmetric thrust reduction (Letters U–V), and the most critical ones regarding yaw controllability (Letters W–Z) cannot be made controllable without exceeding the climb performance limit. These critical groups of failure cases, W–Z, correspond to the possible failure combinations of three motors on one wing.
This allows the conclusion that, to guarantee overall aircraft safety for this configuration, the HVD system design and electric motor wiring must be such that a failure of three or more motors on the same wing must be associated with a probability low enough to tolerate a catastrophic outcome in these cases. Furthermore, antisymmetric thrust reduction is required to make some other dual or triple electric motor failures manageable.
6. Conclusions
So far, the successful application of the earlier developed automated safety assessment framework has been demonstrated for the e-Genius-Mod scaled flight test aircraft. Already at this stage of the study, it has become apparent that the combination of flight tests with model-based failure case predictions offers promising synergies. On the one hand, flight test data can be used to infer or improve aerodynamic and physical modeling that is used by the safety assessment framework. This has been demonstrated by incorporating flight test data-derived thrust and aerodynamic models into the safety assessment process. On the other hand, model predictions of the safety assessment framework have been shown to provide great support for planning, preparation, and risk assessment of suitable flight test scenarios. This substantiates the idea to combine flight tests with a model-based safety assessment to allow a holistic and valid safety assessment, while minimizing the cost and risk of the associated flight tests, at the same time. One suitable combination could be the conduct of real flight tests for the most safety-relevant scenarios with acceptable risk and expense of resources, for example. Once these flight test scenarios have been used to validate the modeling results of the model-based safety assessment and to refine modeling where necessary, the model could then be used to predict performance and top-level effects of all other failure cases. This approach can be seen as especially valuable for disruptive aircraft design projects operating on a smaller scale, with limited resources, but at the same time, novel and complex powertrain concepts.
Application of the non-dimensionalised failure case depiction has been demonstrated for the e-Genius-Mod as well as the larger scale HERA/CONCERTO aircraft configuration, assuming both the HERA use case, a hybrid electric twin engine propulsion architecture, and a distributed propulsion configuration similar to the e-Genius-Mod. The method has proven to provide quick and meaningful classification of failure case scenarios into those that are controllable using control surface deflections alone and those that can be made controllable by using antisymmetric thrust reduction. Furthermore, failure case scenarios are identified that violate either yaw controllability requirements or minimum climb performance requirements even when considering antisymmetric thrust reduction, thus requiring additional mitigation means to ensure an equivalent level of overall aircraft safety.
7. Outlook and Demarcation
In the current stage of implementation, the automated safety assessment method is based on greatly simplified modeling assumptions, like using empirical handbook methods for the determination of aerodynamic derivatives or relying on a simplified propeller slipstream approximation. This discrepancy between simplified modeling and complex reality inevitably induces uncertainties in the final results, which are difficult to quantify. This must be kept in mind when interpreting the obtained results. Currently, this is accounted for by providing the caution area, as established in the non-dimensionalised failure case depiction, as presented in
Section 4. It adopts this notion by pointing out failure cases that are predicted as controllable by the safety assessment method but may be critical in reality when accounting for the uncertainties in the modeling assumptions. For better assessment of the induced uncertainties, an important next step will be the validation of the safety assessment predictions of top-level aircraft metrics against the flight test measurements prepared within this work.
At the same time, replacing simplified models with higher fidelity methods, e.g., based on computational fluid dynamics, will be examined regarding their potential for improving the obtained results and further reducing the induced uncertainties, together with a more detailed description of the powertrain modules used within the safety assessment. In parallel, a mid-fidelity framework for aero-propulsive effect prediction was established, which can be used to validate, or ultimately replace, the presented simplified method, as introduced within this work. The safety assessment method has generally proven its usability on theoretical designs already [
8] and might therefore be applied to any use cases. However, these theoretical studies have been beneficial, as a post-processing of results from overall aircraft design tools, with good data availability. A holistic validation of the tool itself using preliminary aircraft data only is challenging. Therefore, the results of this study will be used to conduct the flight test campaign, which will then be used to validate the handbook and mid-fidelity calculations methods themselves.