DDA-SIM-ATT: A Synergistic Multi-Module Fusion Model for High-Precision Prediction of Departure Flight Taxi-Out Time


Abstract
1. Introduction
2. Influencing Factors of Departure Flight Taxi-Out Time and Their Correlation Analysis
2.1. Definition of Taxi-Out Time
2.2. Influencing Factors of Taxi-Out Time
- (1)
- Number of aircraft pushing back in the same period x1 (flights): Its expression is shown in Equation (2):
- (2)
- Number of aircraft taking off in the same period x2 (flights): Its expression is shown in Equation (3):
- (3)
- Departure queue x3: Its expression is shown in Equation (4):
- (4)
- Arrival queue x4: Its expression is shown in Equation (5):
- (5)
- Thirty min average taxi-out time x5: Its expression is shown in Equation (6):
- (6)
- Average taxi-out time 30/60 min before off-block x6/x7: Refers to the average taxi-out time of all departure flights at the airport within 30/60 min before the target flight’s off-block time. This metric reflects the congestion level and overall operational efficiency of the surface just before the target flight’s departure, serving as a characteristic variable describing real-time surface traffic conditions.
- (7)
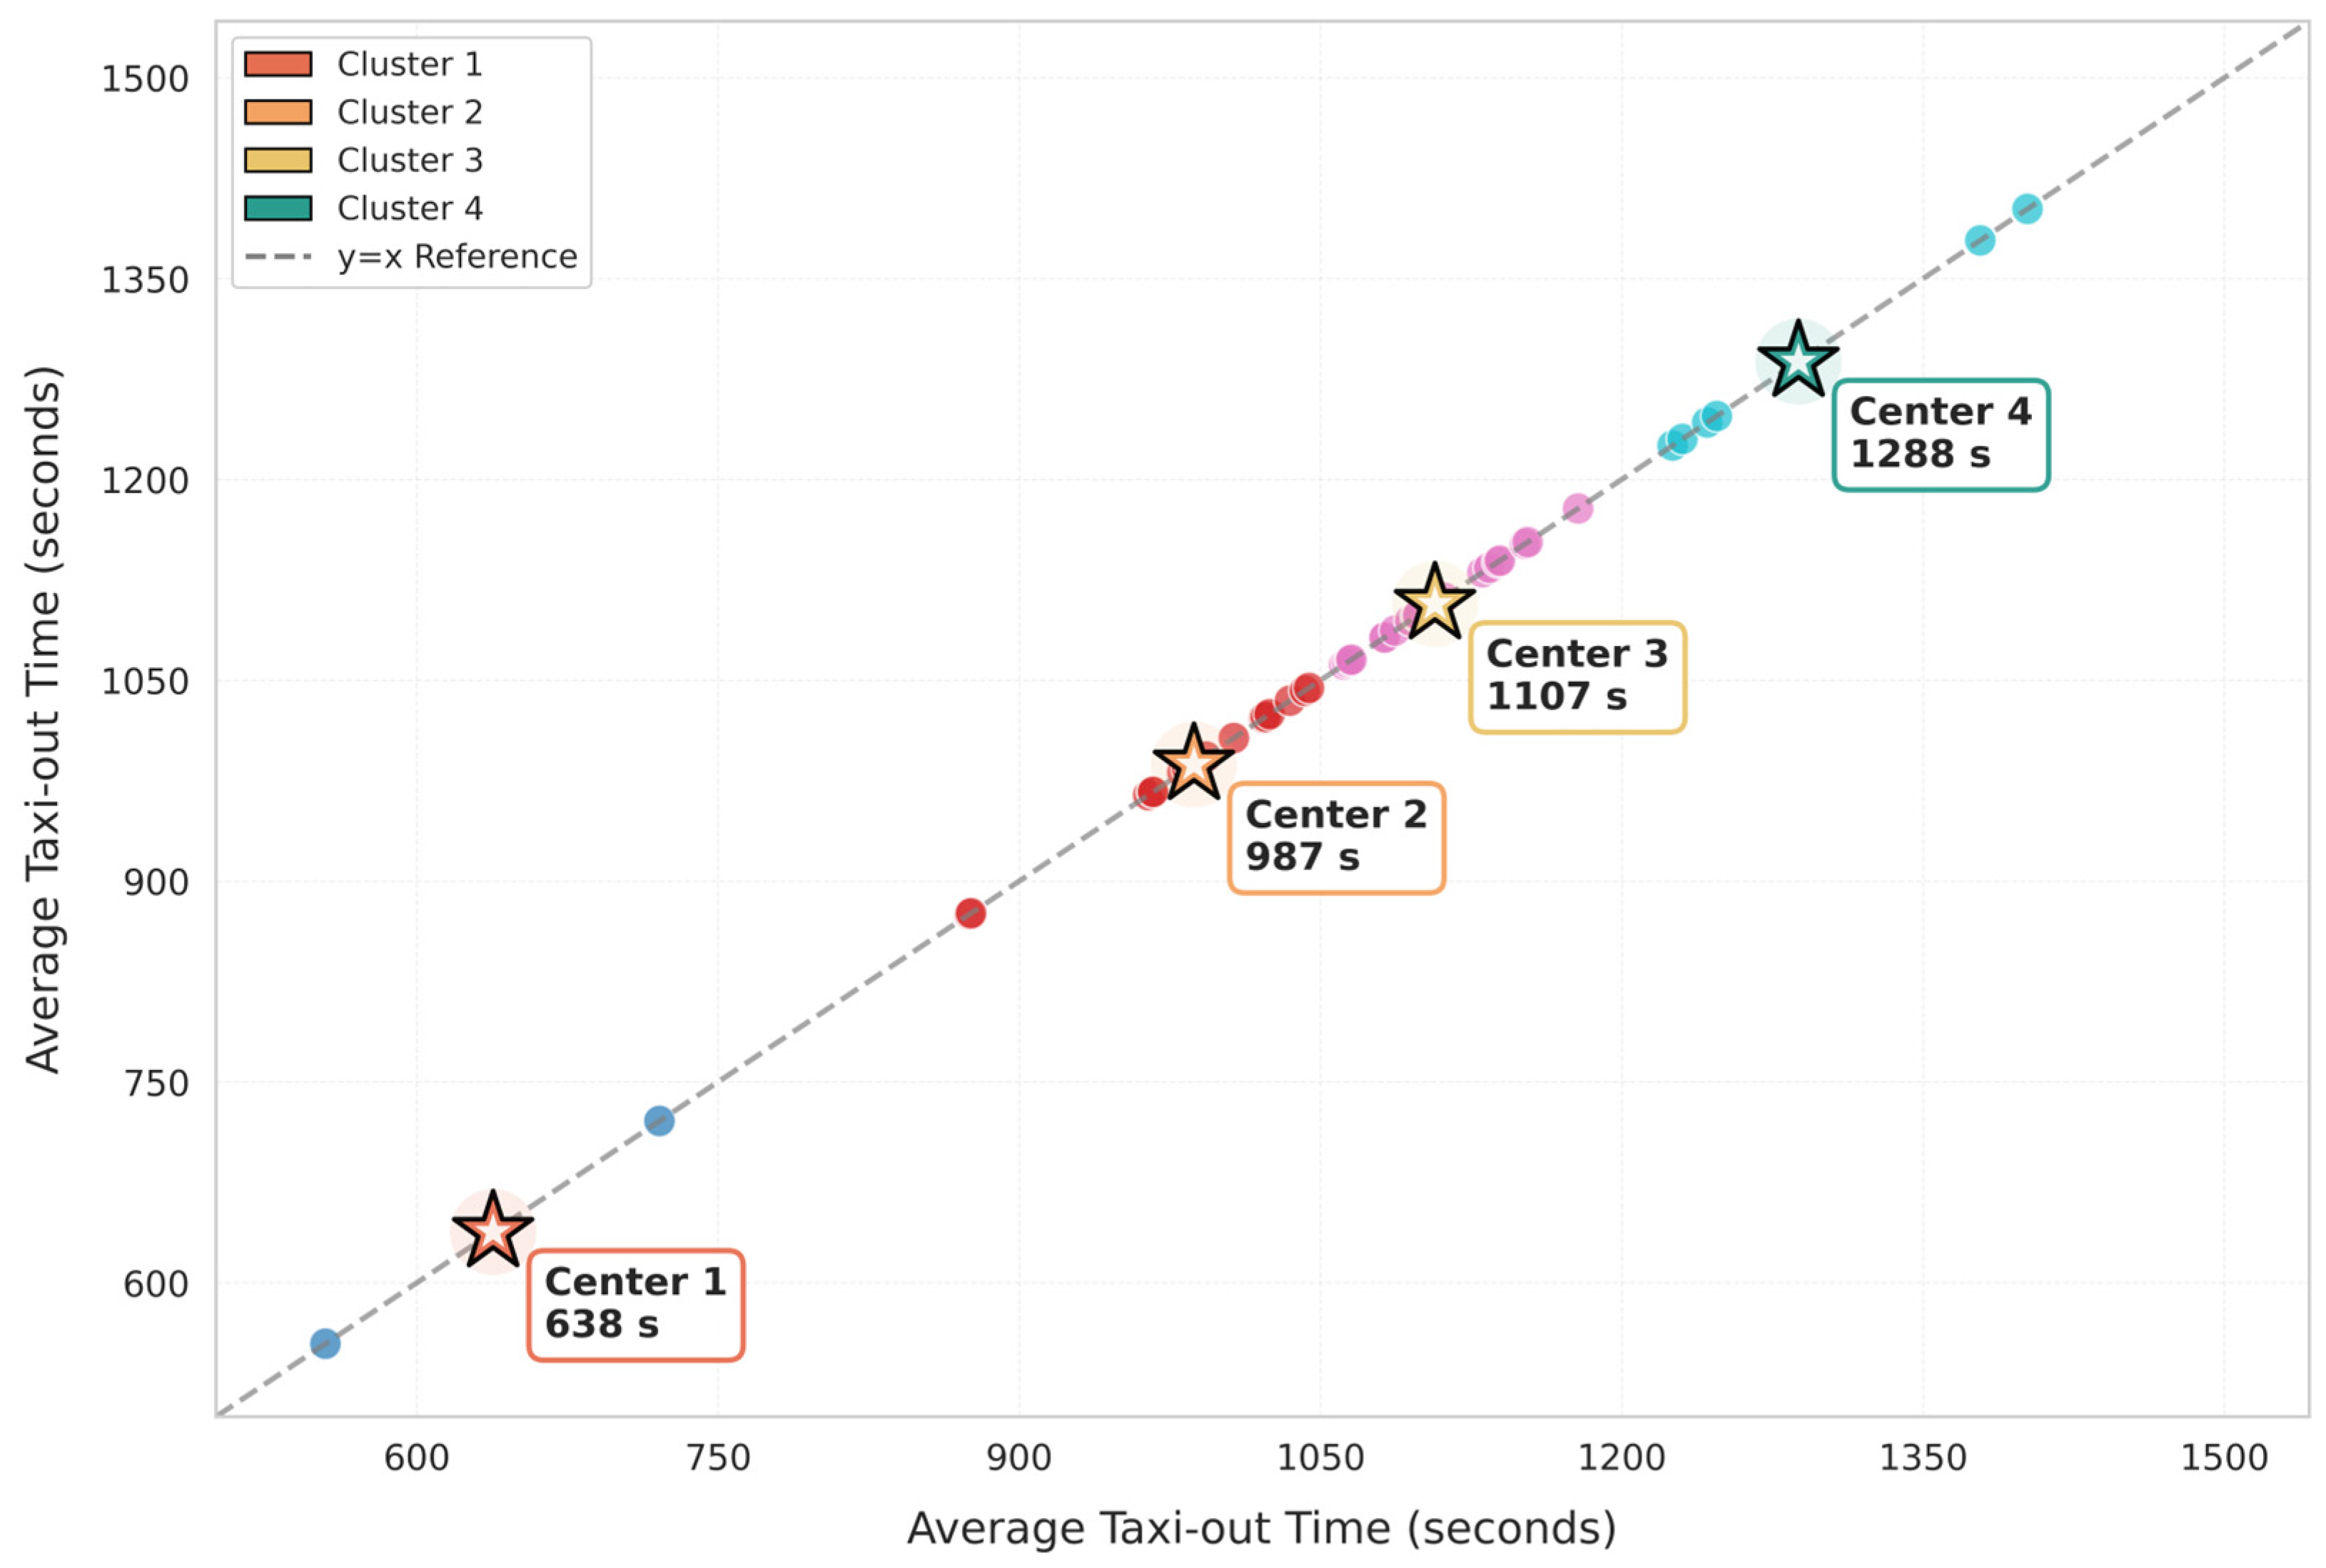
- Airline x8: Differences in apron distribution, operational characteristics, and flight organization methods among airlines may lead to systematic differences in taxi-out time. First, the average taxi-out time for each airline is calculated. Then, the K-means clustering method is used to group the airlines into four categories: A, B, C, and D. The classification results are shown in Figure 1. Category A ≤ 875 s, cluster center 638 s; 875 s < Category B ≤ 1062 s, cluster center 987 s; 1062 s < Category C ≤ 1225 s, cluster center 1107 s; Category D > 1225 s, cluster center 1288 s.

- (8)
- Taxiing distance x9: Based on published stand locations, taxiway layouts, and standard taxi routes, the taxiing distance x9 is measured using a proportional scaling method, unit: meters (m). Its expression is shown in Equation (9):
- (9)
- Aircraft type x10: Different aircraft types have different taxiing performances and wake turbulence separation requirements, leading to differences in taxi-out time. According to ICAO Doc 8643, aircraft are classified based on Maximum Take-Off Weight (MTOW) and Wake Turbulence Category (WTC): medium and below aircraft are coded as 0, heavy aircraft are coded as 1.
- (10)
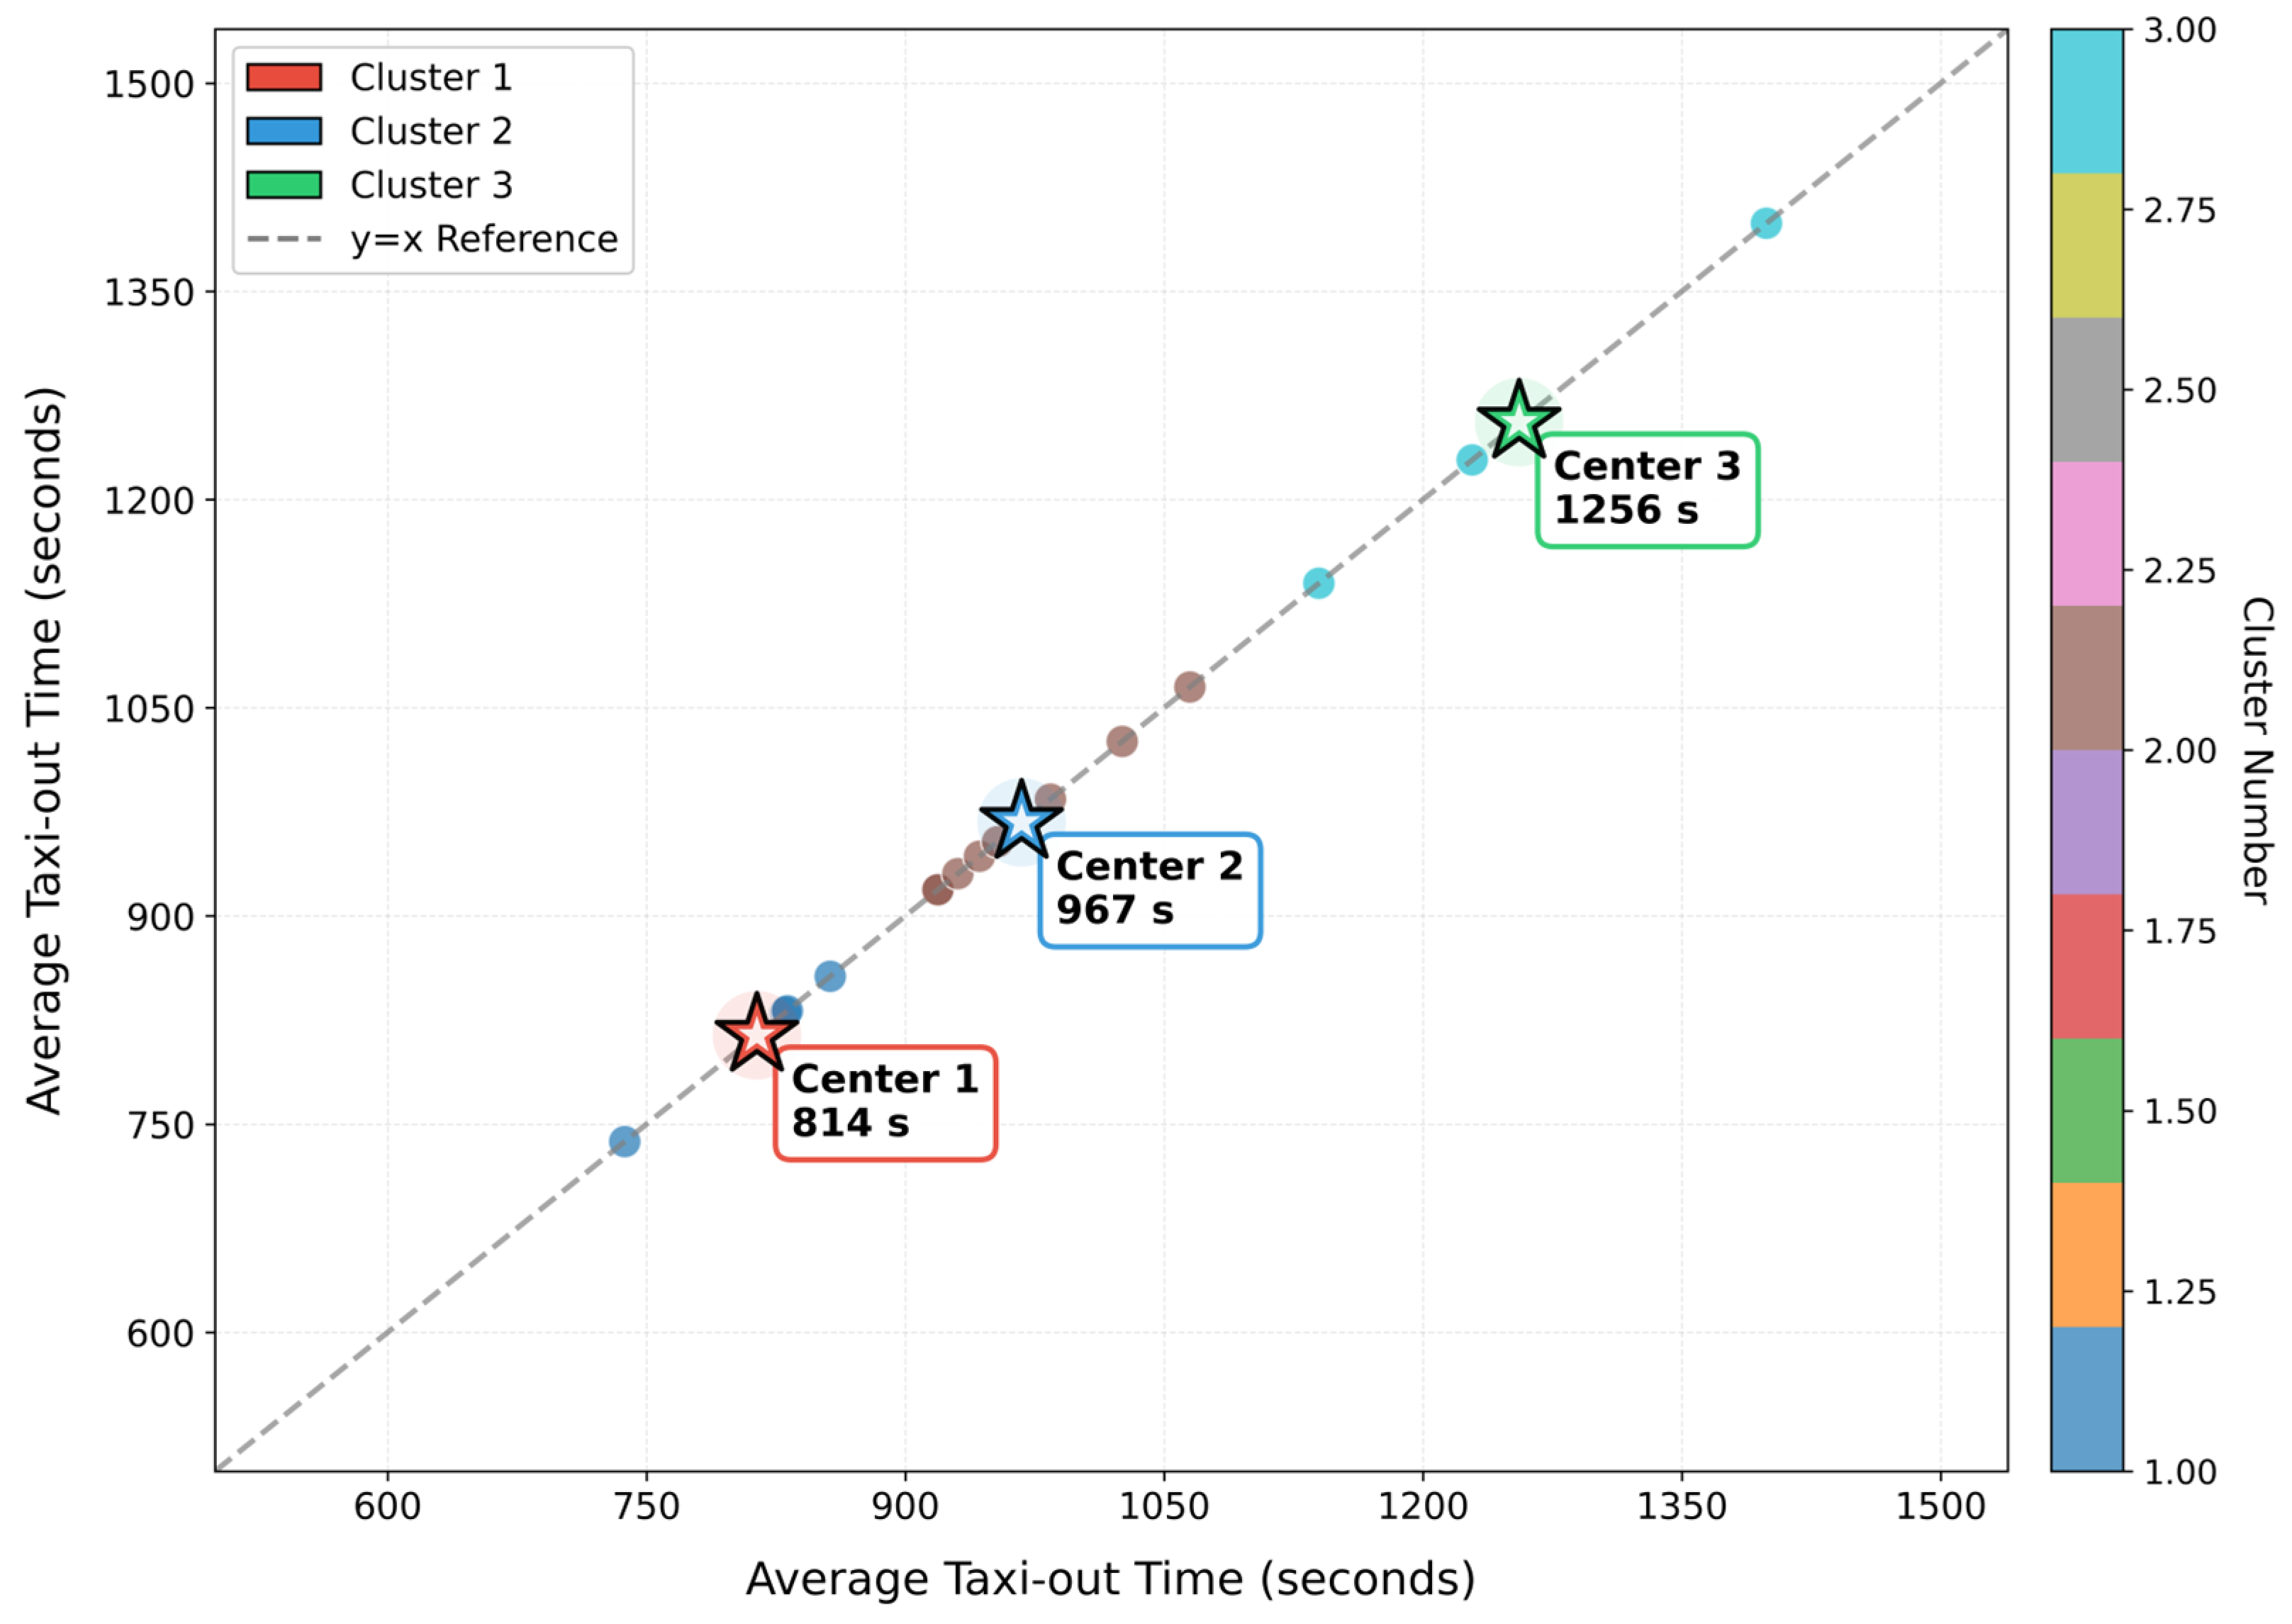
- Apron x11: The location of different aprons affects the taxiing distance and taxi-out time of flights. Generally, the farther the apron location and the more complex the taxi path, the longer the taxi-out time may be. First, the average taxi-out time for each apron is calculated. Then, the K-means clustering method is used to group the aprons into three categories: A, B, C. Category A ≤ 919 s, cluster center (814, 814); 919 s < Category B ≤ 1140 s, cluster center (967, 967); Category C > 1140 s, cluster center (1256, 1256). As shown in Figure 2.
- (11)
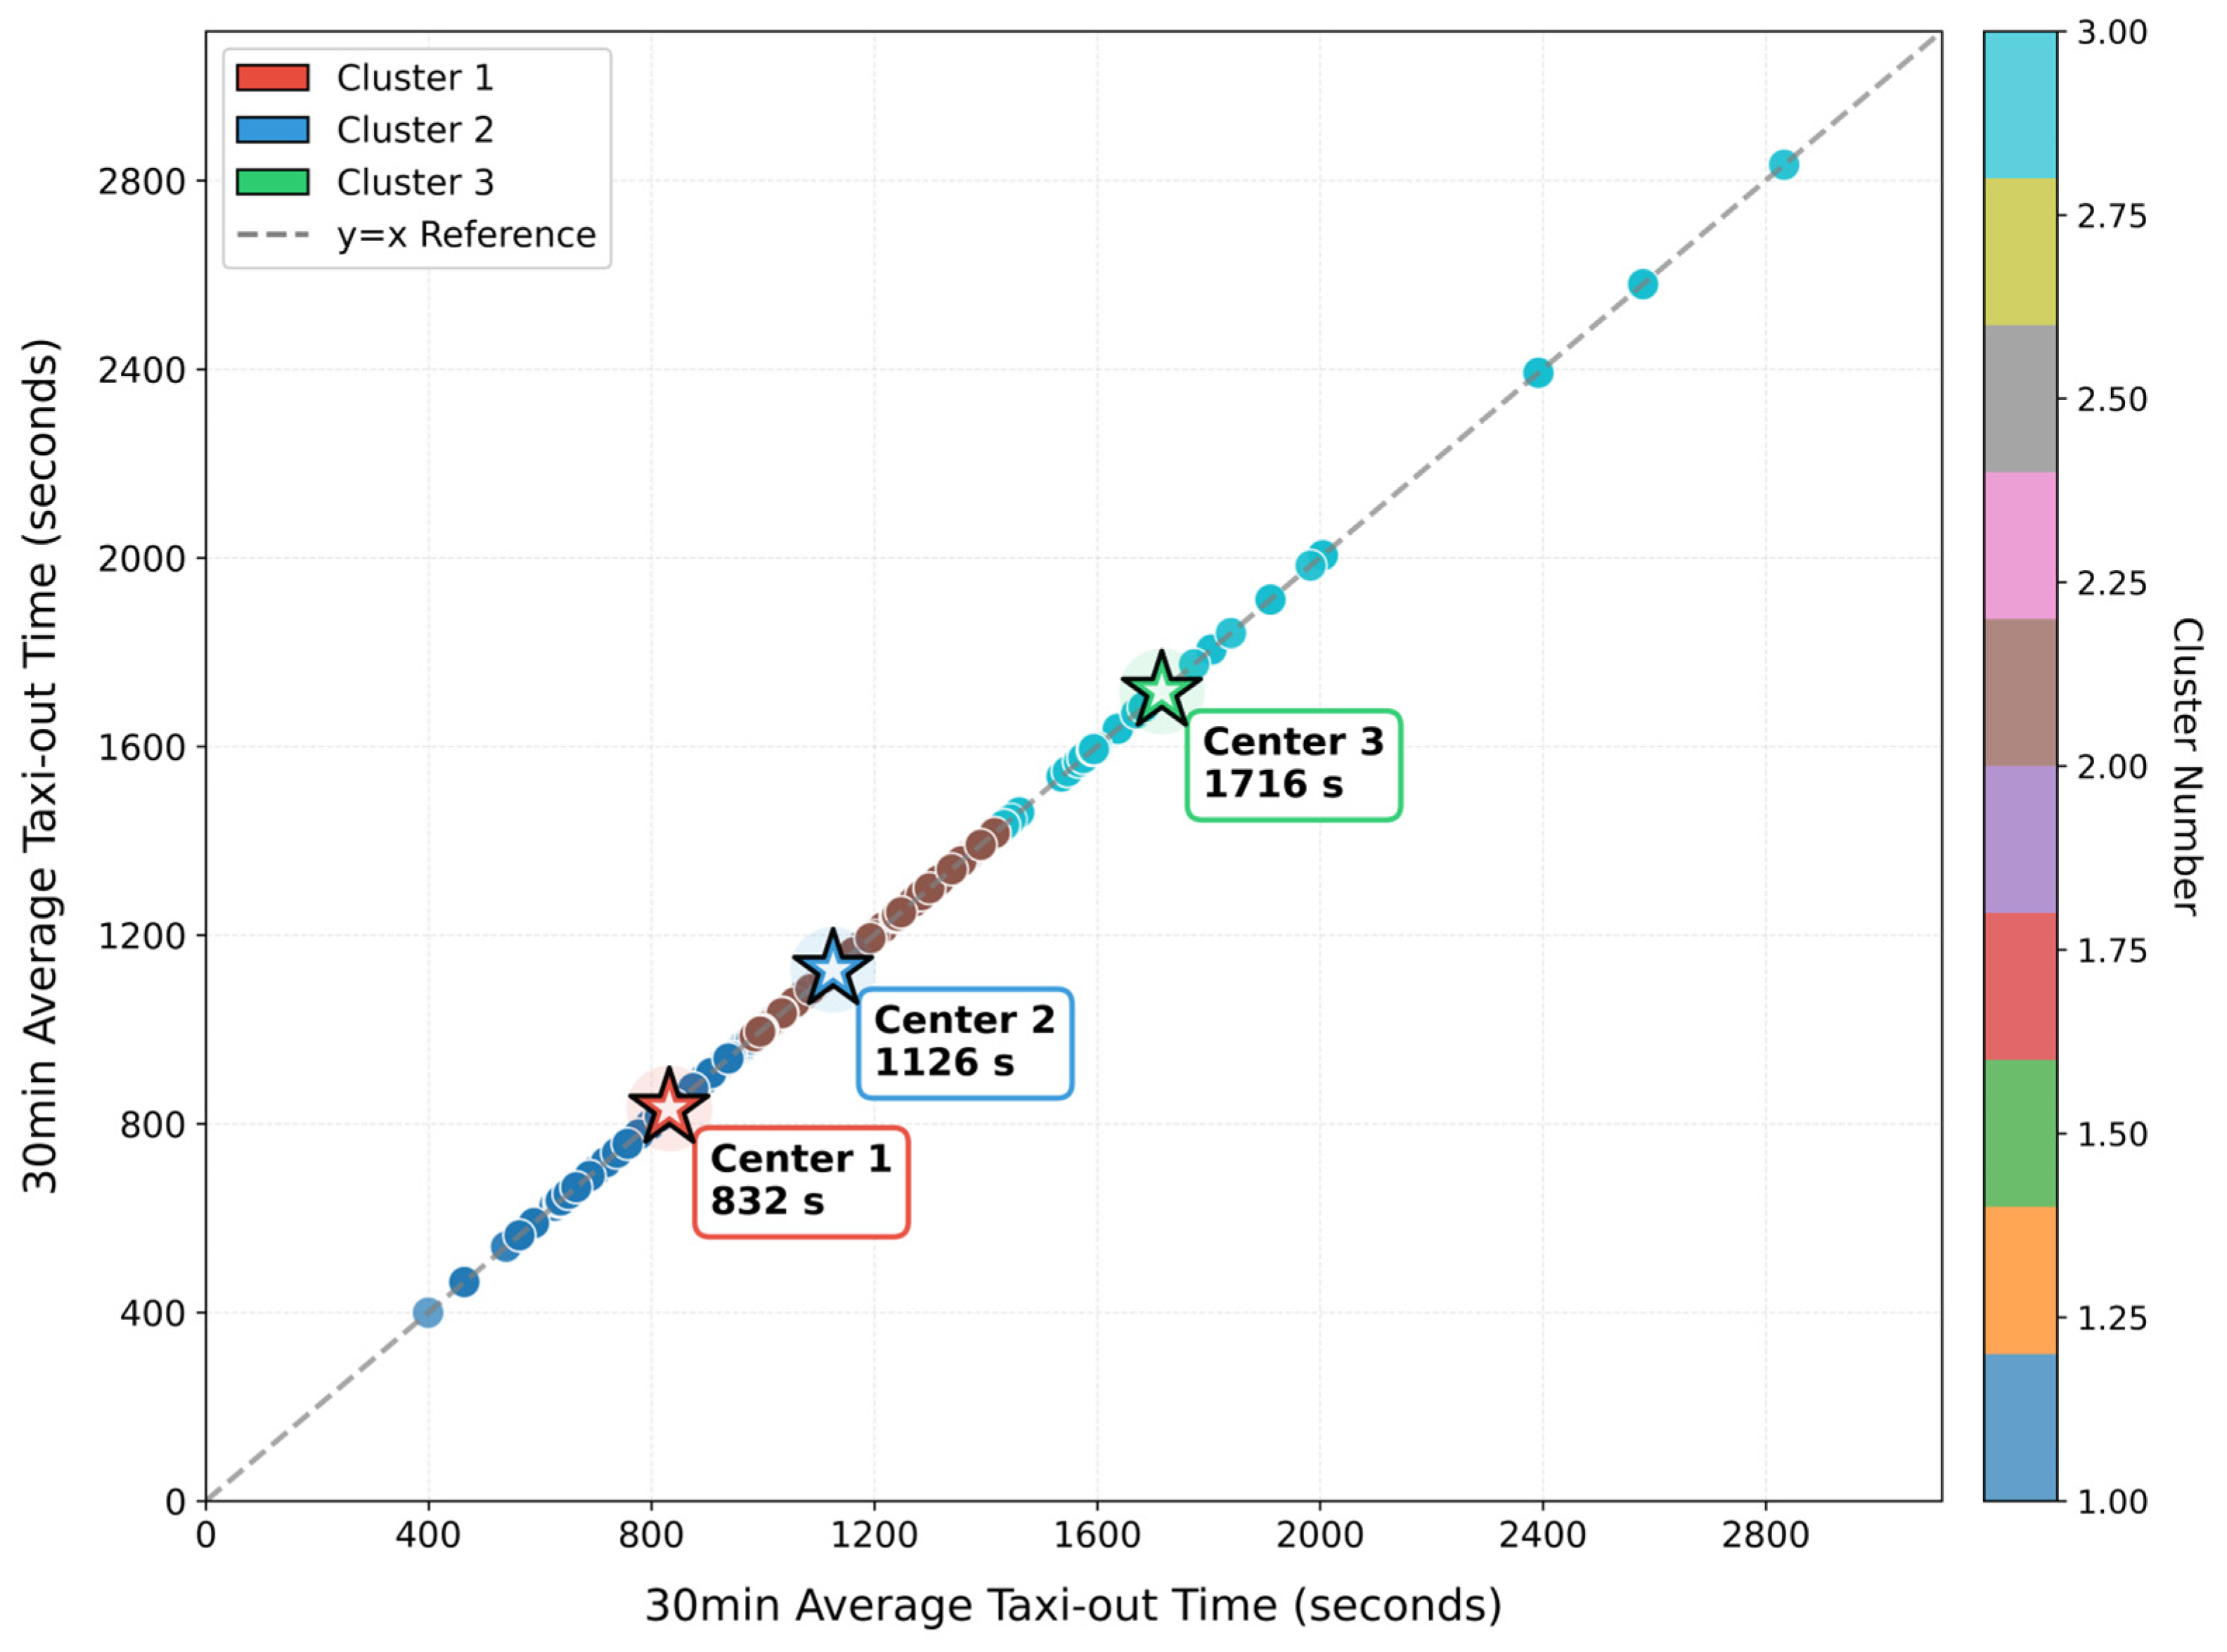
- Weather x12: From METAR reports, eight weather features are screened and retained: light rain (y1), rain (y2), light rain and light fog (y3), rain and light fog (y4), weak thunderstorm and rain (y5), thunderstorm and rain (y6), severe thunderstorm and rain (y7), and no impact (y8). These weather features are mapped to the 30 min average taxi-out time to construct a weather feature classification scheme. The 30 min average taxi-out time is clustered using the K-means method into three categories: A, B, C. Category A ≤ 979 s, cluster center 832 s; Category B is 979–1416 s, cluster center 1126 s; Category C > 1416 s, cluster center 1716 s. Flights with average taxi-out time ≤ 979 s and unaffected by weather are assigned a value of 1; flights with average taxi-out time between 979 and 1416 s and affected by y1–y6 are assigned a value of 2; flights with average taxi-out time > 1416 s and affected by y7 are assigned a value of 3. Screening revealed no cases of significant changes in taxi-out time due to low visibility takeoffs or temporary runway changes. Therefore, a weather factor quantification scheme is constructed based on METAR reports: Category A (no impact y8) assigned value 1, Category B (y1–y6) assigned value 2, Category C (severe thunderstorm and rain y7) assigned value 3. Finally, the quantified weather factor indicator x12 corresponding to 5442 flights is obtained, as shown in Figure 3.
- (12)
- Number of turns x13: The number of turn angles is determined by the aircraft’s taxi path. Based on the standard taxi route map of Shenzhen Airport, the number of turn angles is counted. The number of turn angles for each taxi path is counted separately and matched with flights one by one, ultimately obtaining the number of turns variable x13.
- (1)
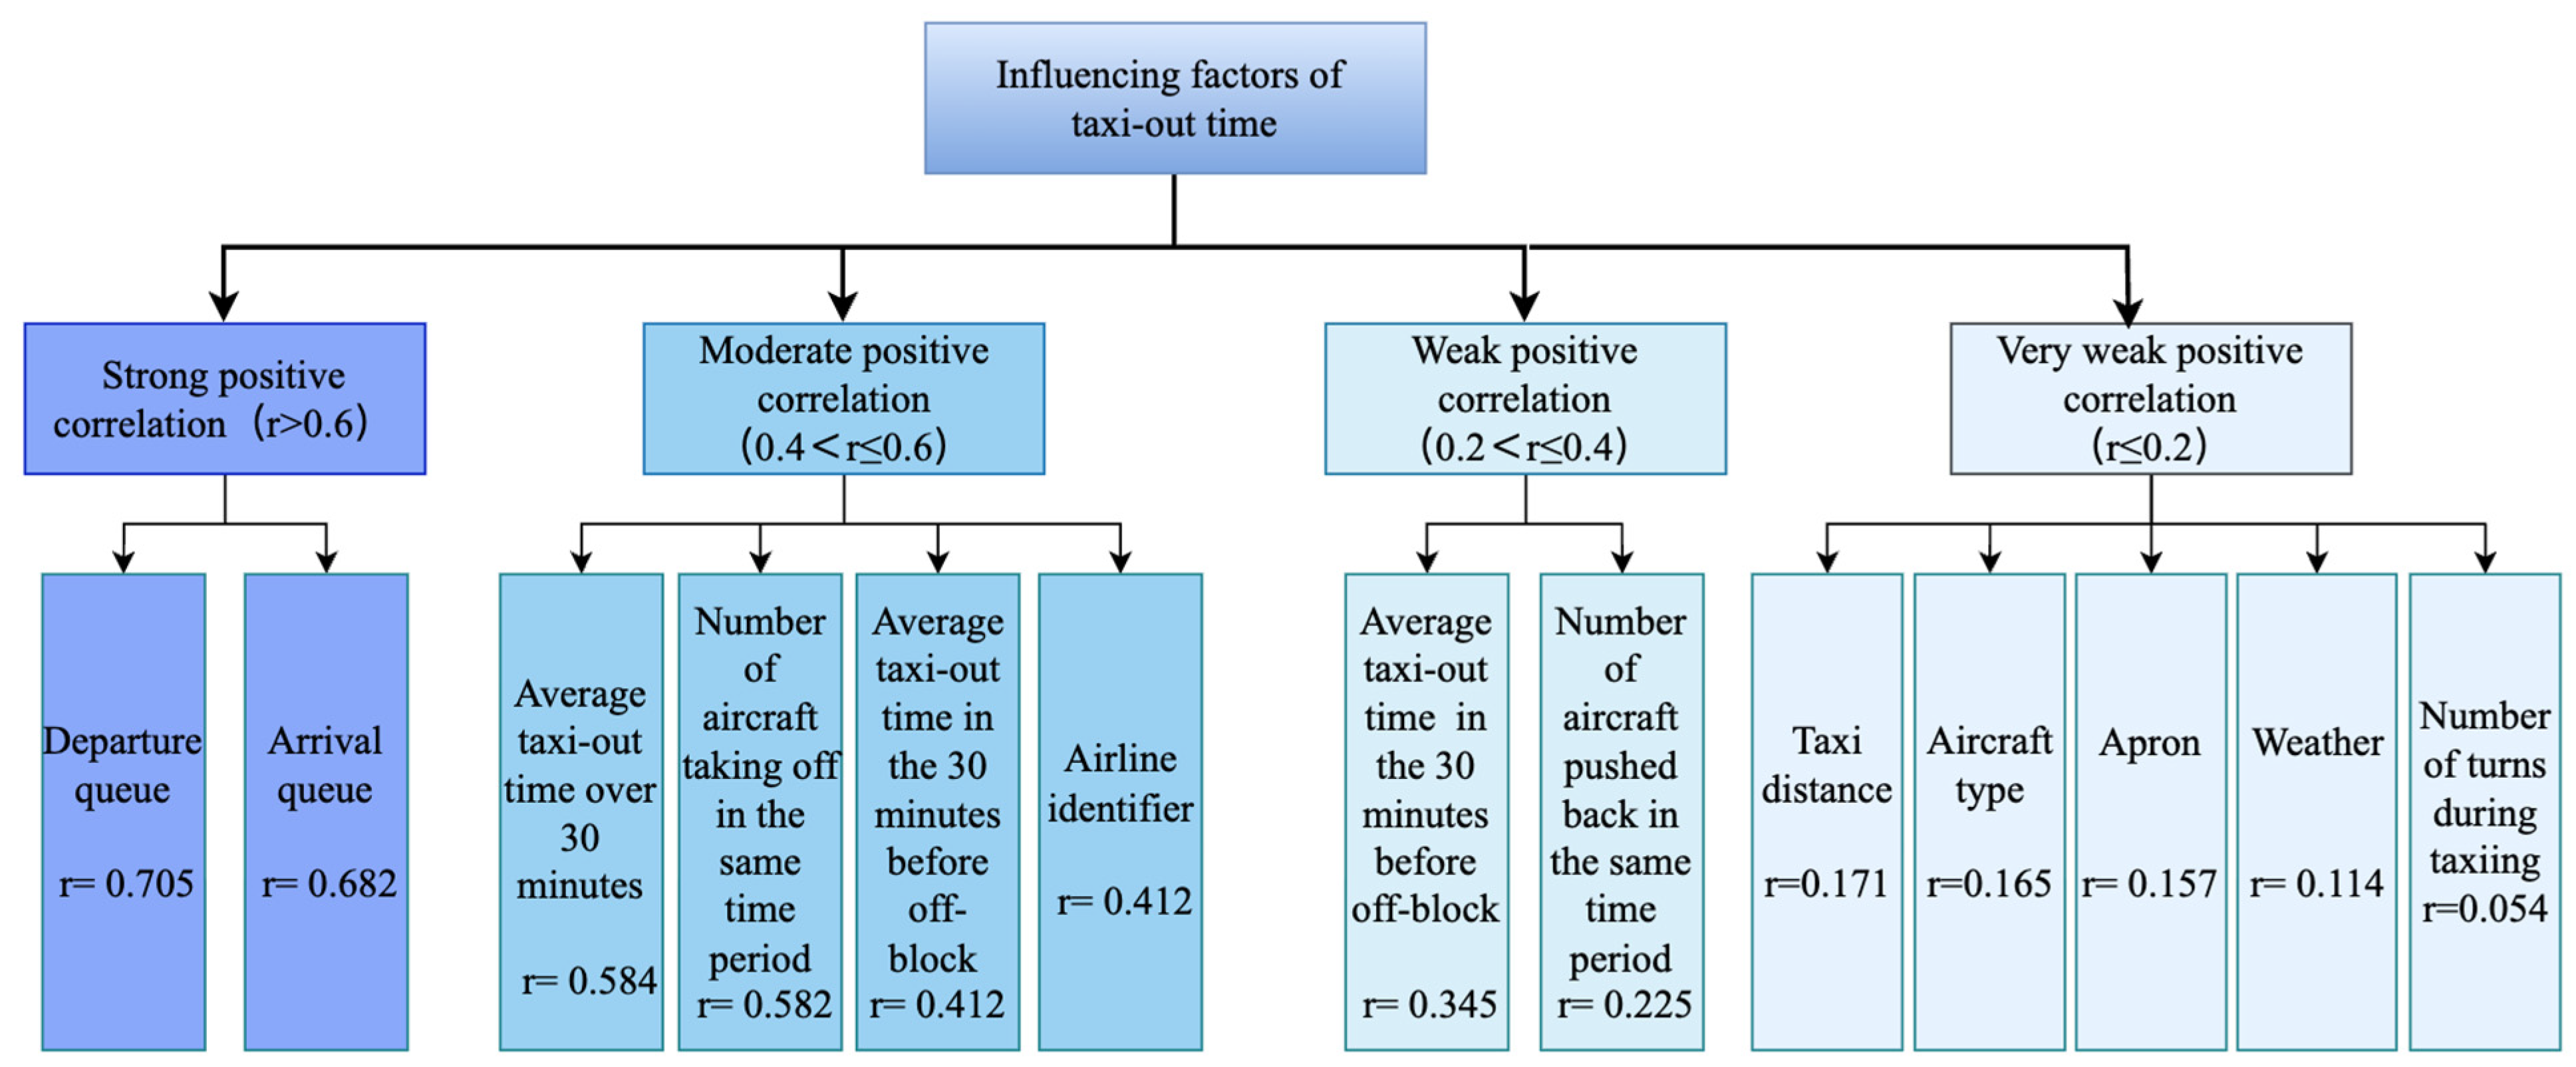
- Airport Surface Traffic Flow: Reflects the operational load and flow status of the airport operational area, embodying the impact of surface congestion on taxi-out time. Mainly includes: number of aircraft taking off in the same period, departure queue, arrival queue, 30 min average taxi-out time, average taxi-out time 30 min and 60 min before off-block, number of aircraft pushing back in the same period. When surface traffic flow is relatively sparse, aircraft can usually complete taxiing, queuing, and take-off clearance smoothly after push-back. Conversely, it leads to prolonged taxi-out time.
- (2)
- Flight Intrinsic Attributes: Characterize the operational performance and basic features of individual flights, mainly including airline code and aircraft type. Different airlines have varying scheduling processes, corporate cultures, and taxiing strategies, which may lead to systematic differences in taxi-out time; aircraft type determines performance parameters such as thrust level, taxiing speed, and turning radius.
- (3)
- Flight Operational Environment: Describes the indirect impact of external meteorological and operational conditions on the taxiing process, mainly including taxiing distance, apron, weather, and number of turns. Among them, taxiing distance determines the physical path length from the gate to the runway; apron location reflects the complexity of the flight’s area and taxiing path; weather conditions reduce taxiing speed and increase safety intervals; the number of turns reflects the complexity of the taxiing path and the number of potential conflict points. Overall, the operational environment also influences taxi-out time through meteorological constraint effects and path complexity effects.
2.3. Correlation Analysis of Influencing Factors on Taxi-Out Time
3. Construction of the Departure Flight Taxi-Out Time Prediction Model
3.1. Dynamic Data Augmentation Module
3.2. Tuple Data Similarity Module
3.3. Attention Mechanism Module
3.4. CatBoost Algorithm
4. Experimental Results and Analysis
4.1. Experimental Procedure
- (1)
- Research object and data preprocessing: The taxi-out time of departing flights from Runway 15 at Shenzhen Bao’an International Airport is taken as the research object. There are initially 5986 departing flight records. After removing incomplete, duplicate, and abnormal data, 5442 valid departing flight records are obtained, as shown in Table 2.
- (2)
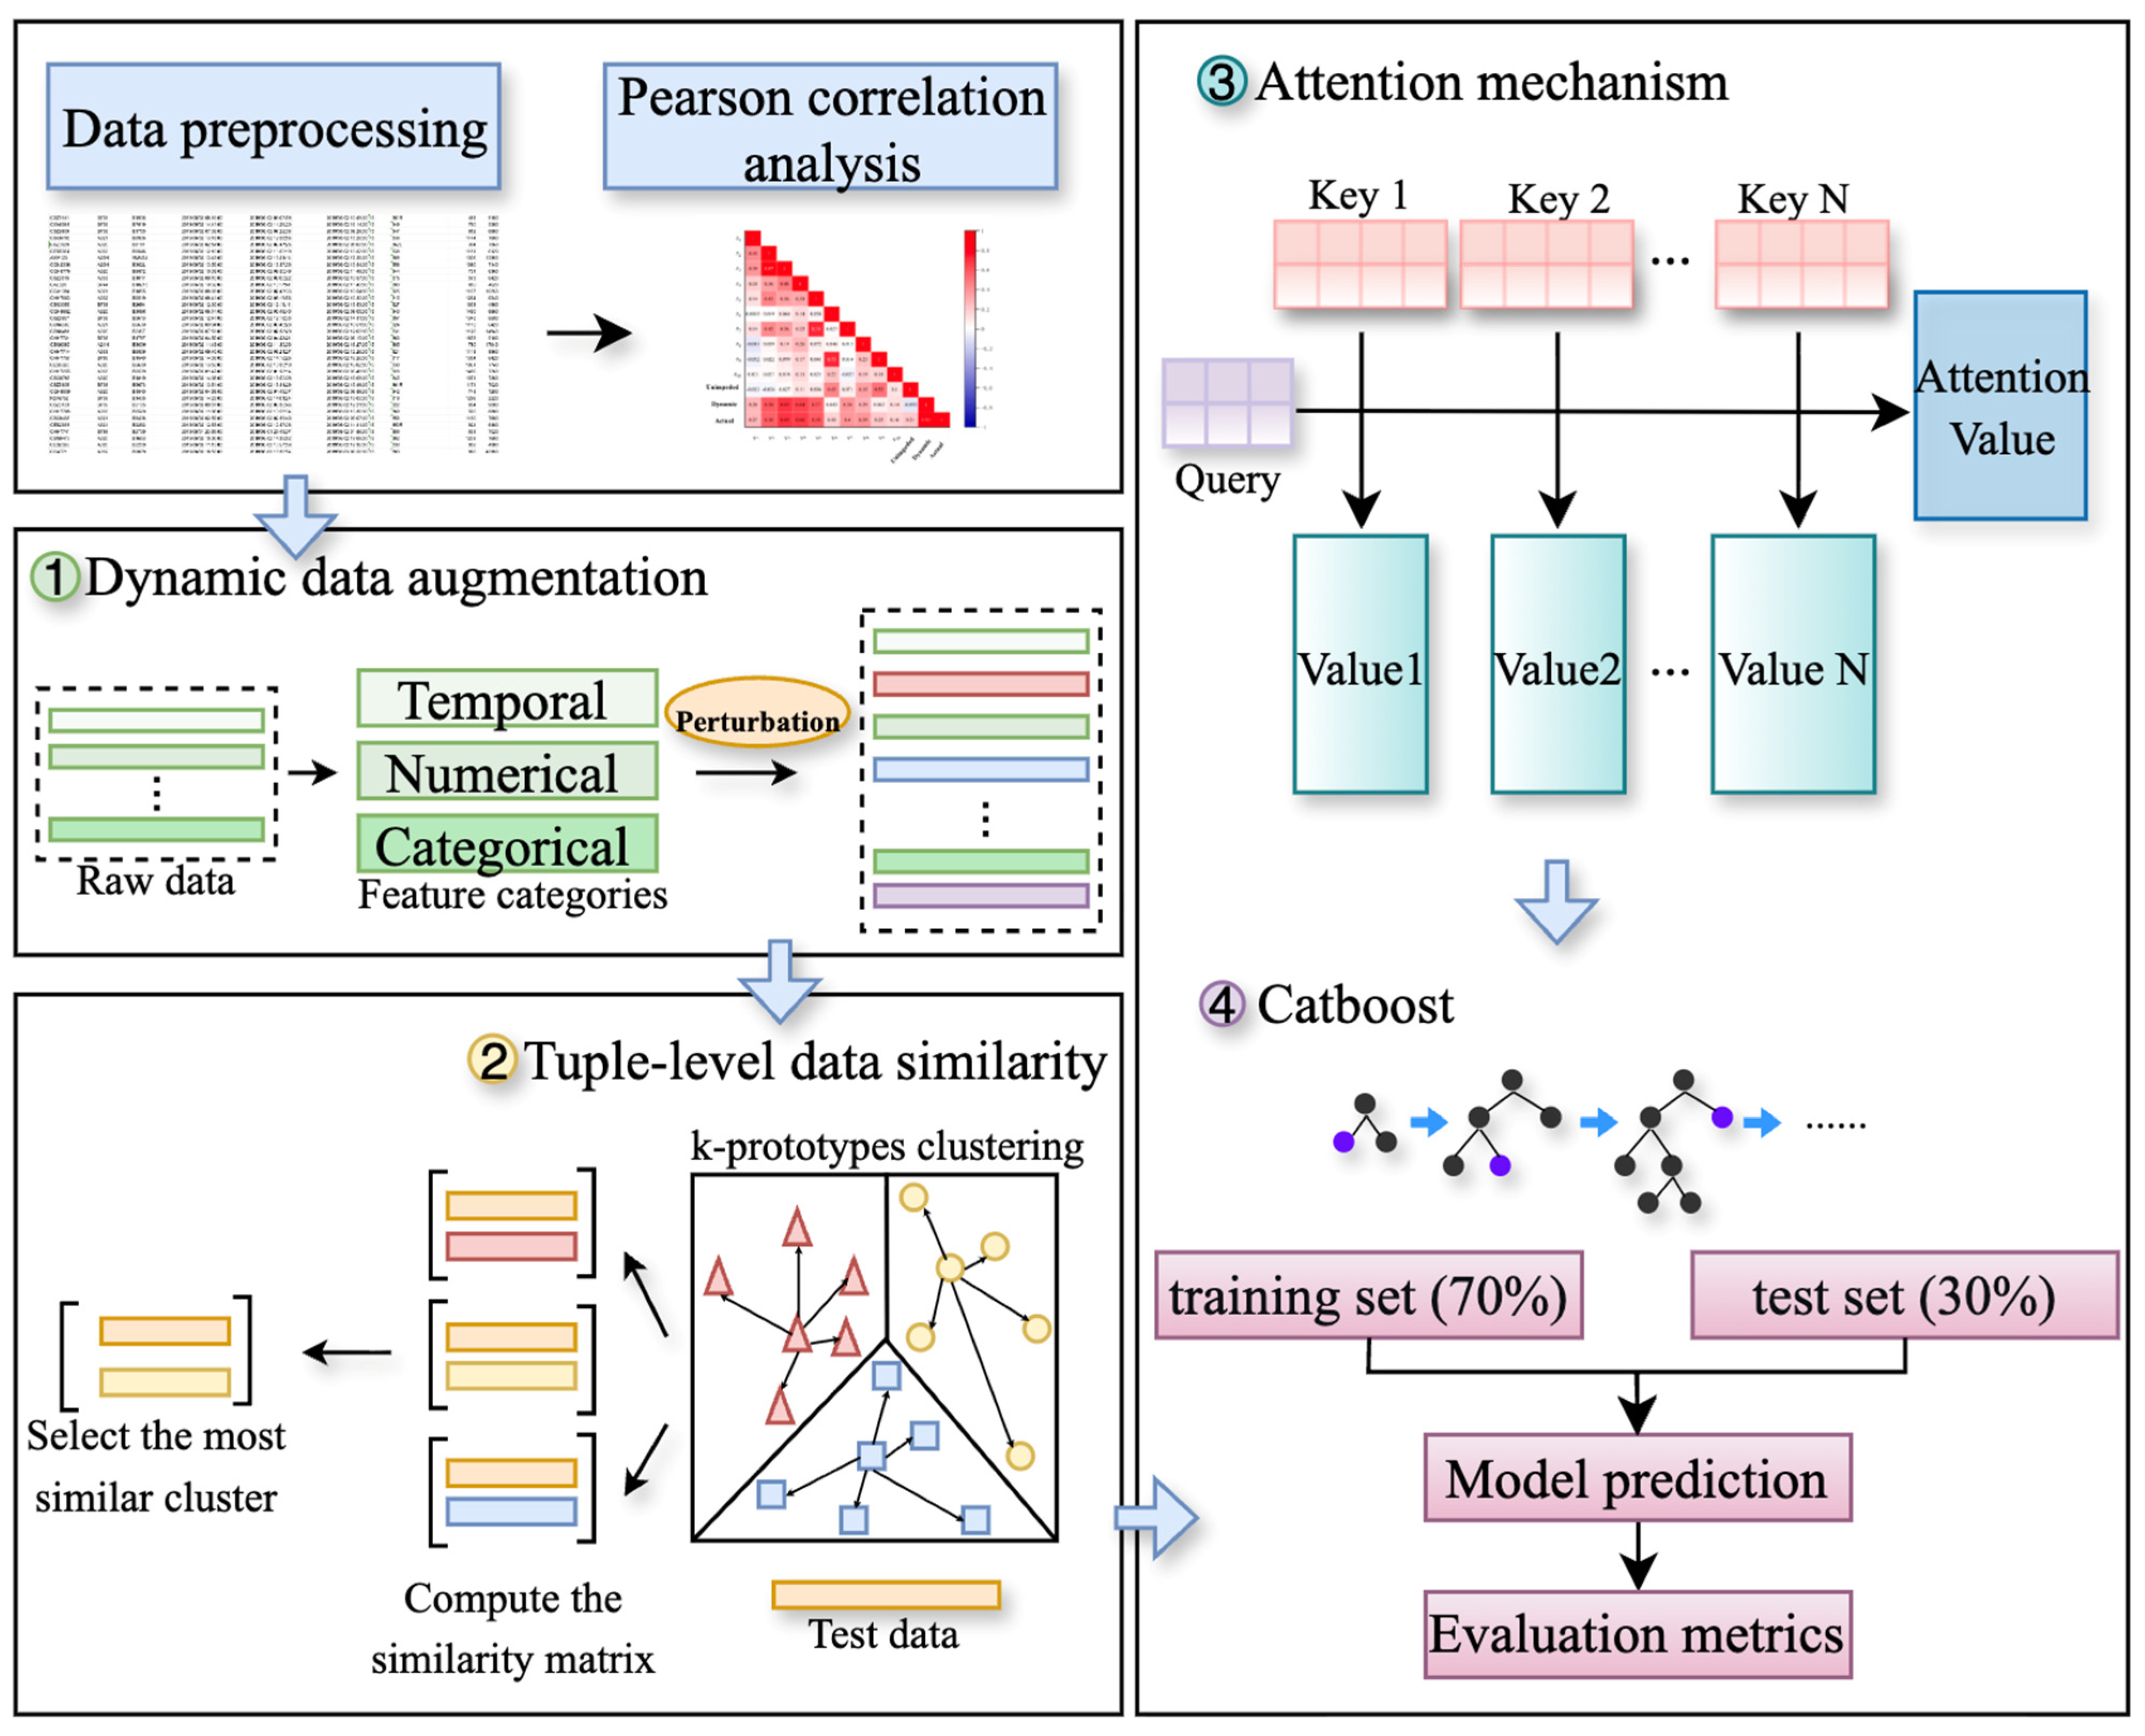
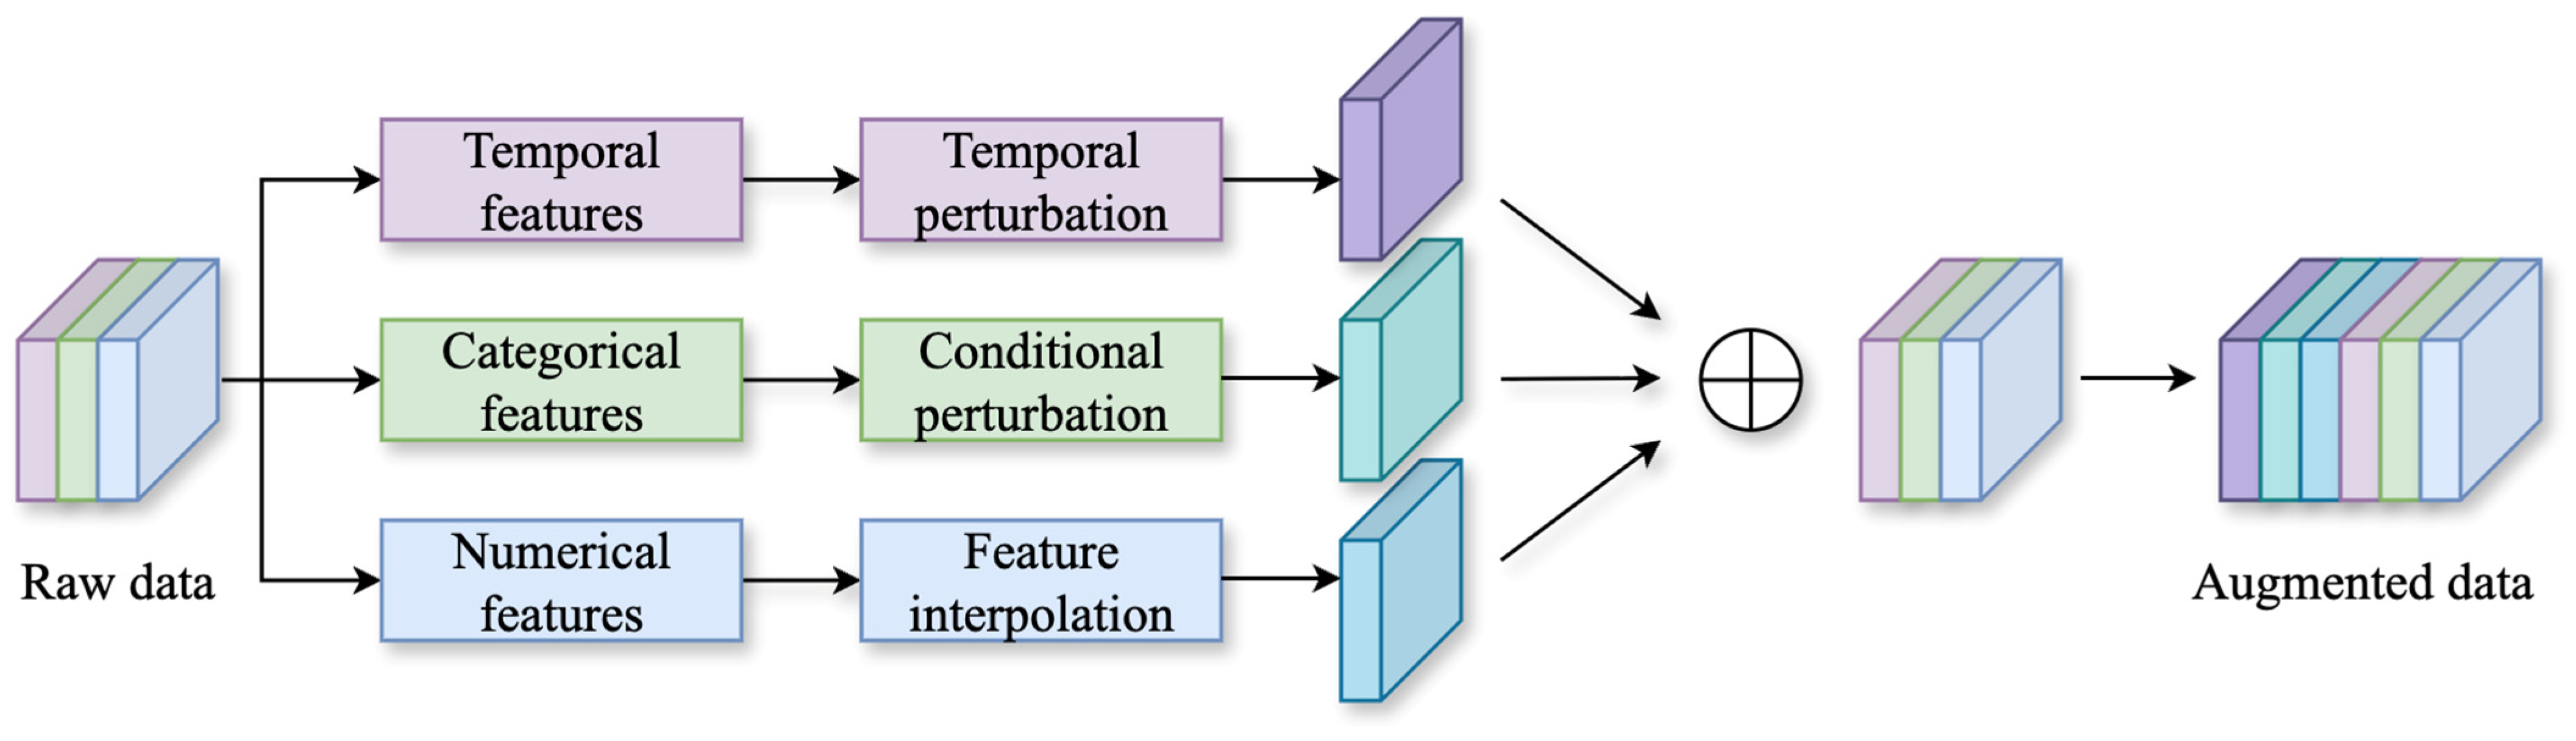
- Dynamic data augmentation: First, time windows are divided at 30 min intervals, using the taxi-out time and the average taxi-out time within 30 and 60 min before off-block as constraints to ensure temporal consistency of the augmented data. Based on this, Gaussian noise with a standard deviation of 5% is introduced to numerical features to enhance model robustness. Simultaneously, for categorical features (including airline, aircraft type, and apron), they are randomly replaced with other values from the same time window with probabilities of 20%, 15%, and 10%, respectively, to increase feature distribution diversity. Finally, a random perturbation of ±5 min is applied to the target variable (taxi-out time), and the time window and its average taxi-out time are recalculated accordingly to ensure that deviations between augmented samples and the overall statistical characteristics of the window remain within a reasonable range.
- (3)
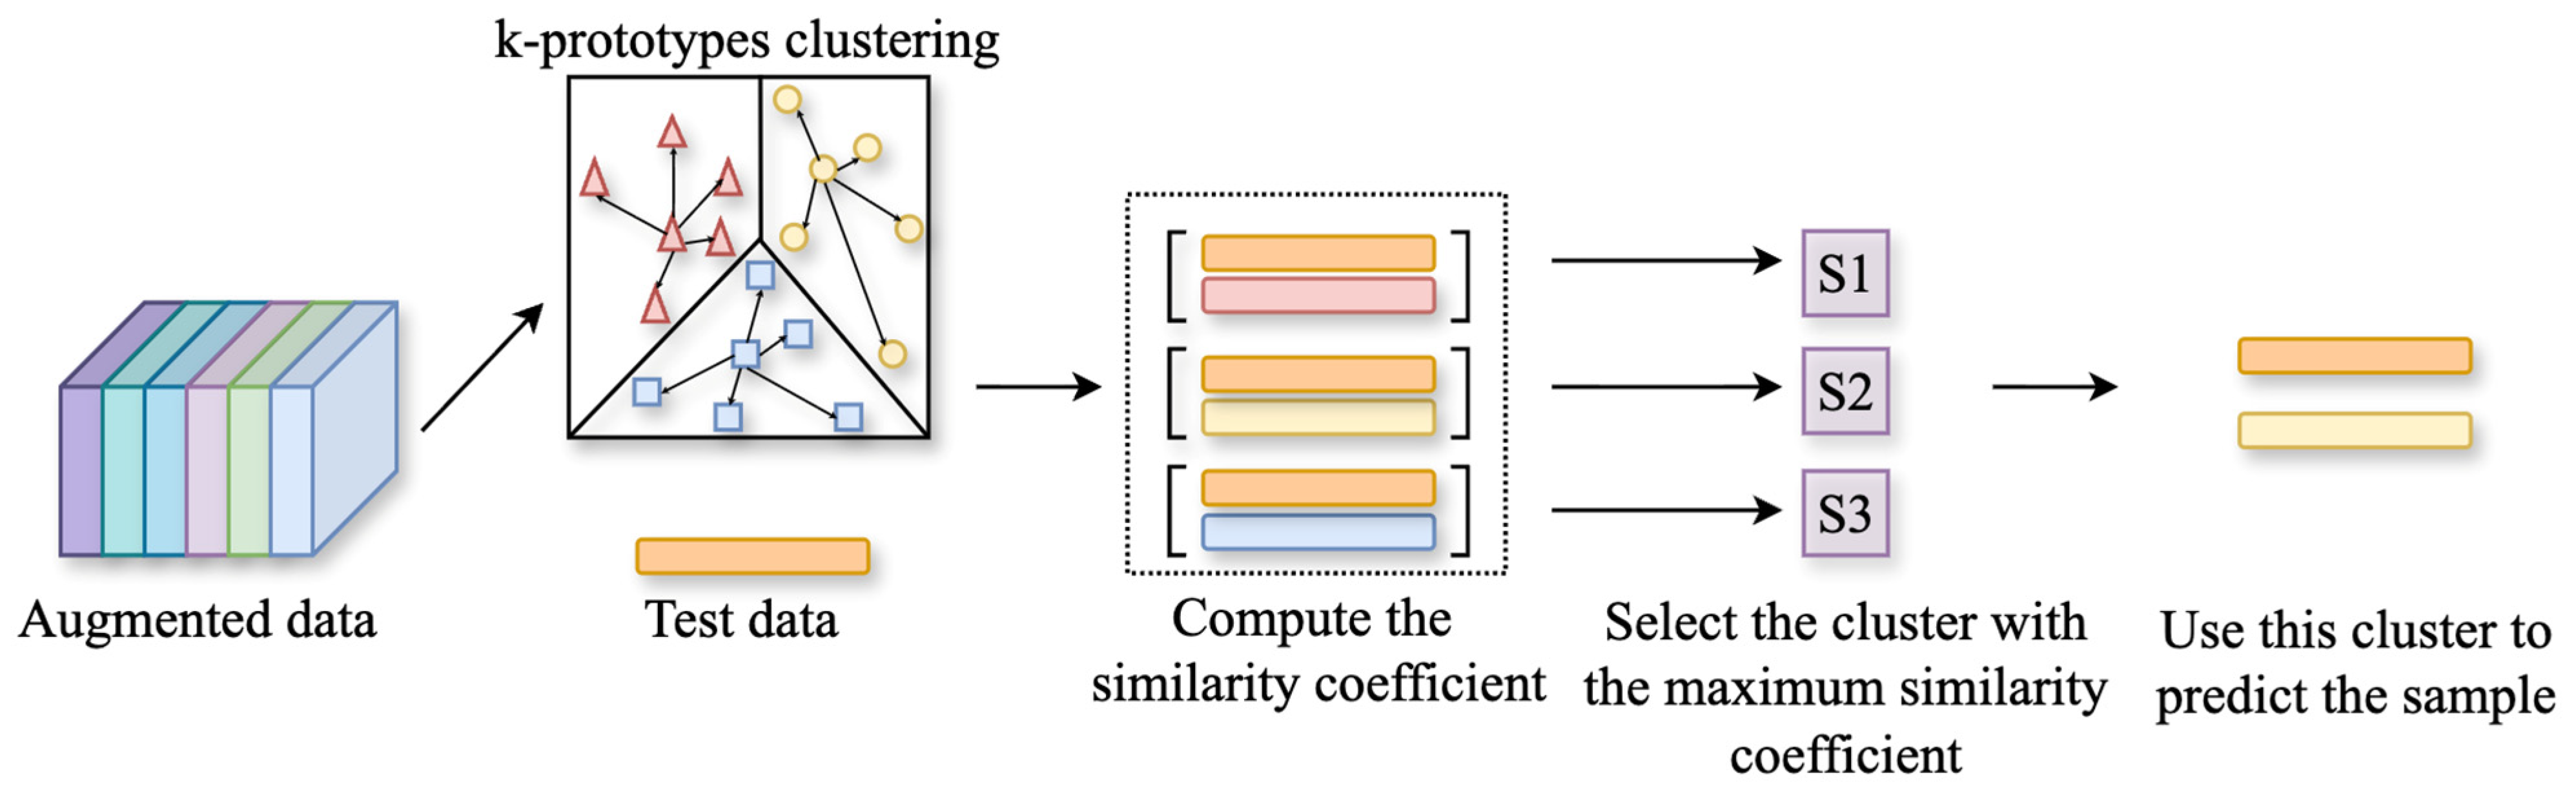
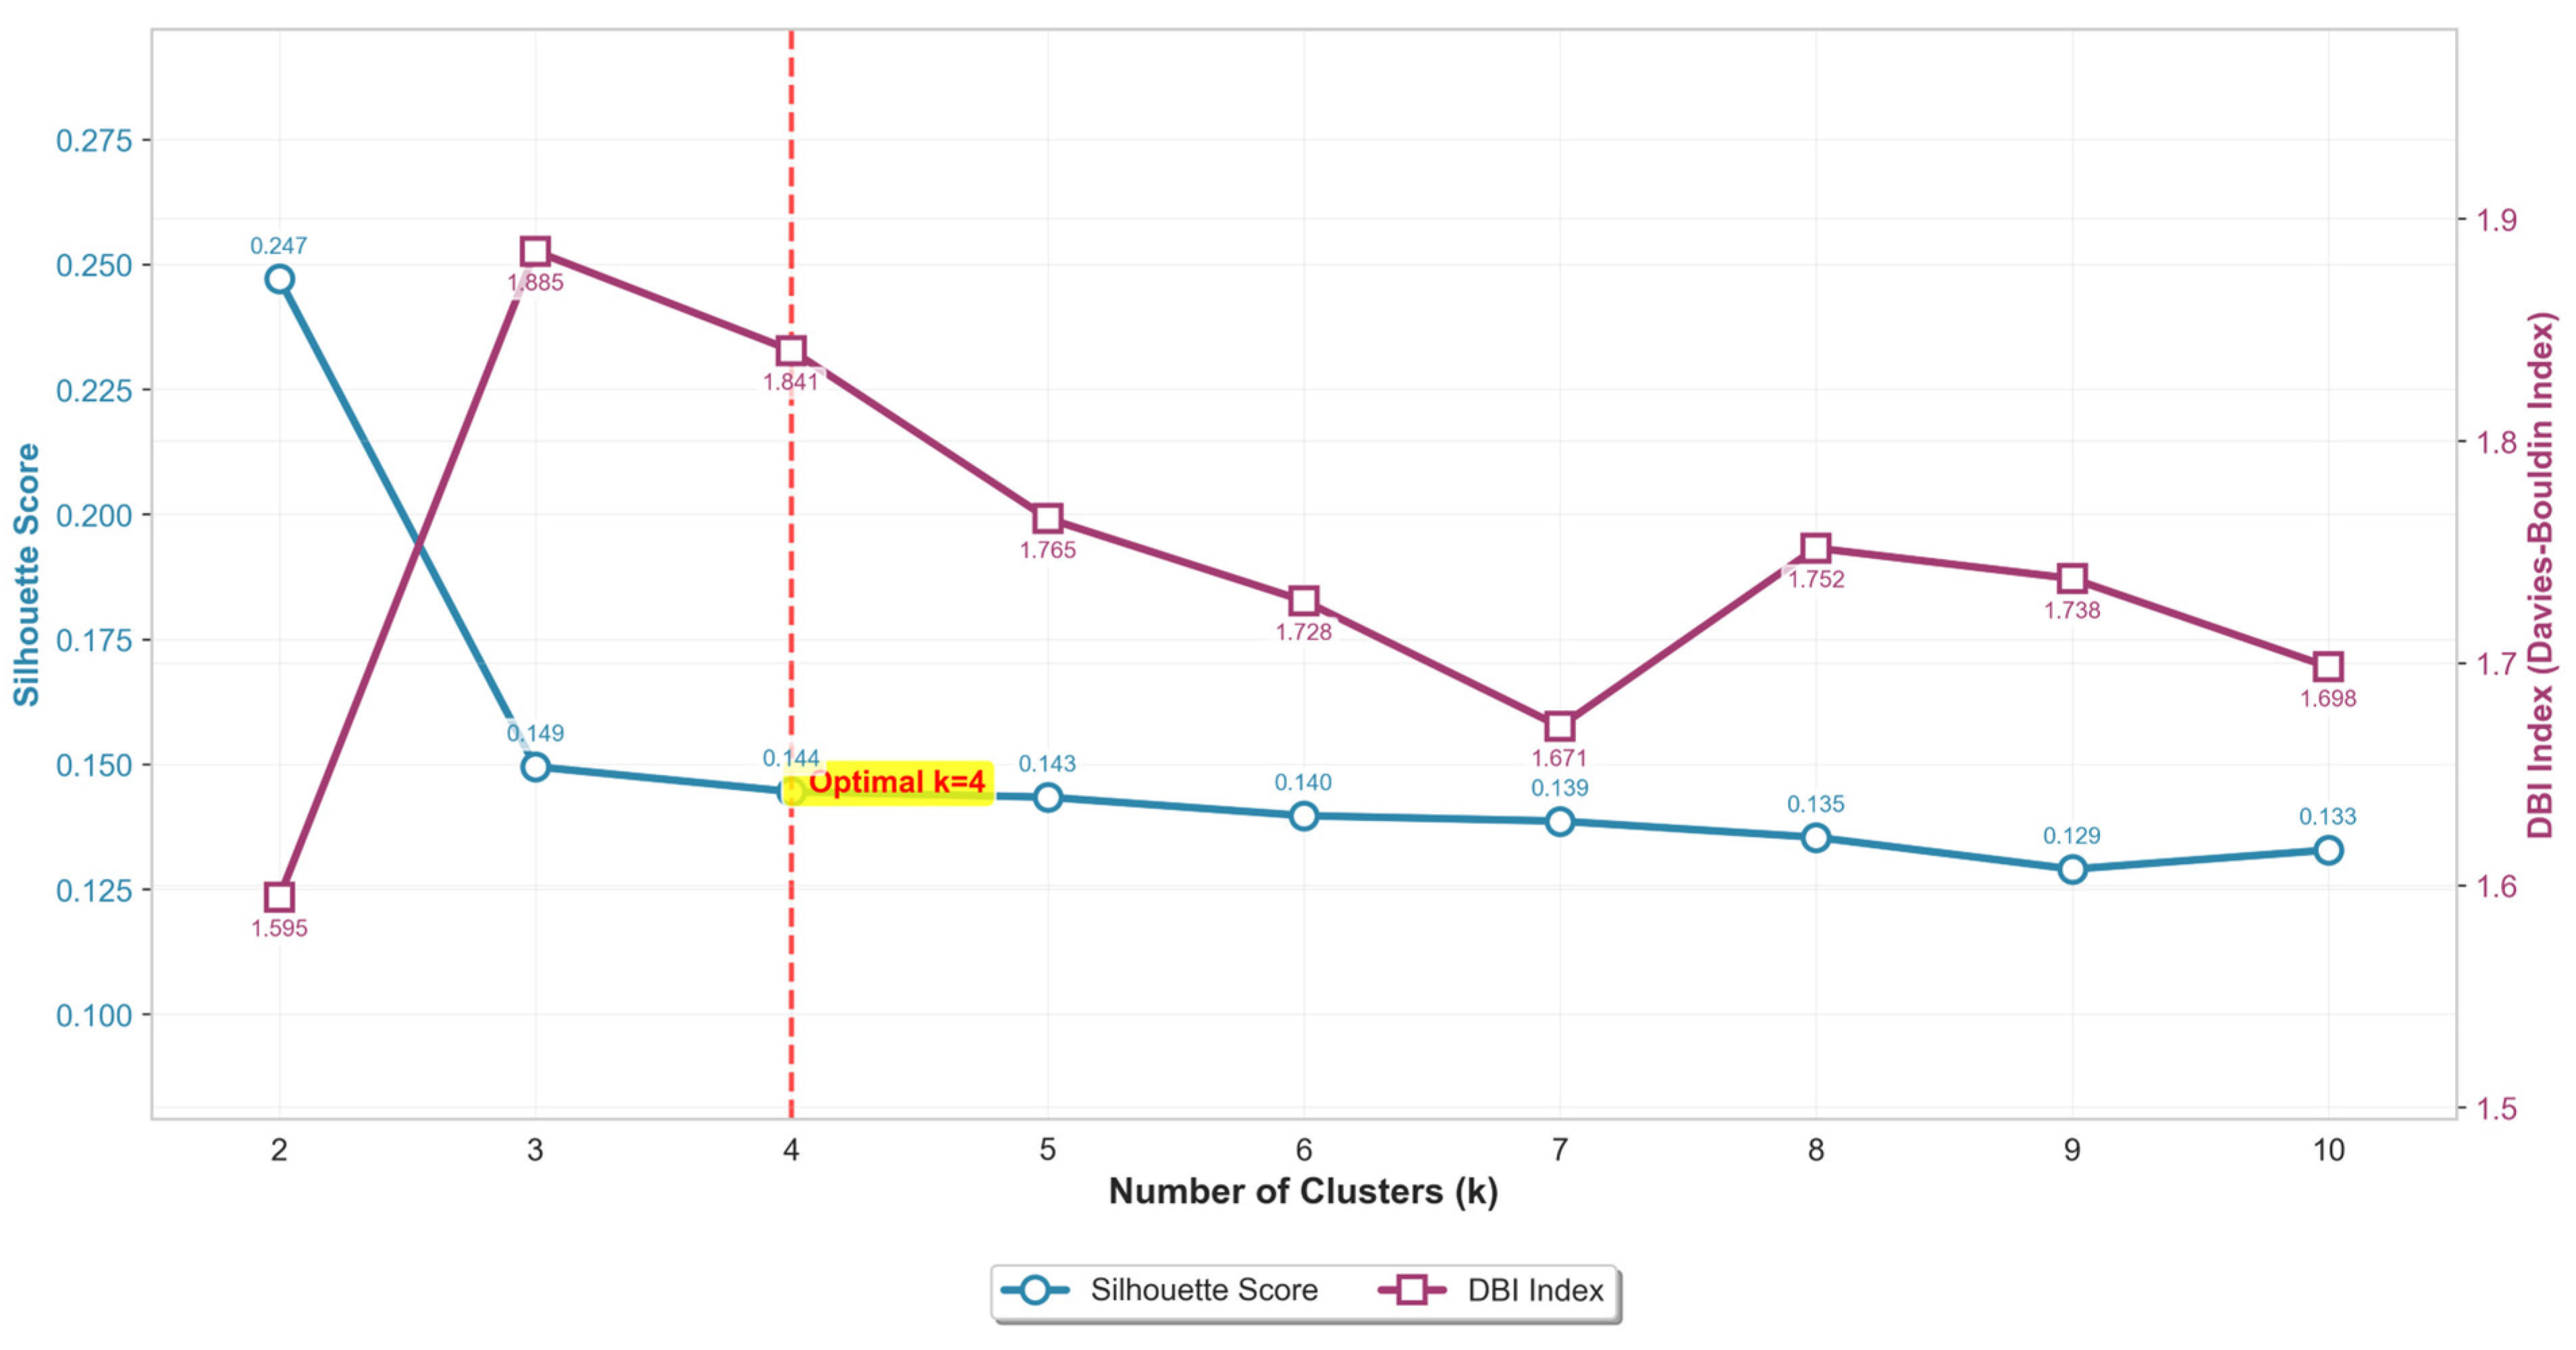
- Tuple similarity data determination: This paper performs K-Prototypes clustering on the 10,884 departing flight records obtained after data augmentation. Based on the evaluation results of the silhouette coefficient and Davies-Bouldin Index (DBI), the optimal number of clusters is determined to be 4 (Figure 9). A silhouette coefficient closer to 1 indicates better clustering; a smaller DBI indicates tighter clusters and better separation between clusters. At k = 4, the two metrics achieve the best balance. Subsequently, within each cluster, the K-Nearest Neighbors (KNN) algorithm combined with Euclidean distance is used to select the 5 historical data records most similar to the sample to be predicted. Further, the covariance matrix is calculated using Mahalanobis distance to derive the average similarity coefficient. Finally, the cluster with the highest average similarity coefficient is selected as the basis for prediction.
- (4)
- The key hyperparameters of the CatBoost regressor are presented in Table 3. These parameters are adapted according to the sample size of each cluster and include early stopping to prevent overfitting.
4.2. Feature Selection
4.3. Ablation Experiment
- (1)
- CatBoost model: Serves as the baseline model for performance comparison with subsequent improved models incorporating different modules.
- (2)
- CatBoost + SIM model: Introduces the Similarity module (SIM) on top of the baseline model to assess the impact of similarity information on taxi-out time prediction.
- (3)
- CatBoost + ATT model: Integrates the Attention Mechanism module (ATT) into CatBoost to examine the role of the attention mechanism in improving prediction accuracy.
- (4)
- CatBoost + DDA model: Adds the Data Augmentation module (DDA) to explore the improvement effect of data augmentation strategy on model prediction performance.
- (5)
- CatBoost + DDA + SIM model: Further introduces the Similarity module based on CatBoost + DDA to evaluate the additional contribution of the Similarity module under data augmentation conditions.
- (6)
- CatBoost + DDA + ATT model: Integrates the Attention Mechanism module into the CatBoost + DDA model to analyze the performance gain when data augmentation and attention mechanism work together.
- (7)
- CatBoost + DDA + SIM + ATT model: Integrates all three components—data augmentation, the Similarity module, and the attention mechanism—to comprehensively evaluate the improvement in taxi-out time prediction accuracy through multi-module combination.
4.4. Comparative Experiment
5. Discussions
5.1. Interpretation of Major Findings and Underlying Mechanisms
5.2. Comparison with Existing Studies and Contribution of This Work
- (1)
- Holistic Integration for Data Challenges: While data augmentation is widely used in fields such as computer vision, its application in aviation time series prediction—particularly in a dynamic and operationally aware manner (DDA)—remains novel. Likewise, the explicit use of Similarity Theory (SIM) for pattern matching enables more direct modeling of spatio-temporal dependencies than conventional sequence models like LSTM. This integrated framework systematically tackles key data challenges including sparsity, imbalance, and missing values, thereby improving model robustness in real-world operational settings.
- (2)
- Superior Performance in Operationally Critical Intervals: Many existing models report high accuracy within broader tolerances (e.g., ±5 min) [17]. In contrast, our model achieves a marked improvement in the more operationally stringent ±2 min (±120 s) interval, with an accuracy of 74.57%. This level of precision is essential for tactical decision-making tasks such as push-back scheduling, runway sequencing, and conflict prediction, directly supporting airport surface management under dynamic conditions.
- (3)
- Synergistic Module Validation: Through systematic ablation experiments, we quantitatively demonstrate not only the individual contributions of DDA, SIM, and ATT but also their synergistic effect. The CatBoost + DDA + SIM + ATT configuration consistently delivers optimal performance, confirming that the modules complement one another: DDA enriches the training data with plausible variability, SIM ensures contextual relevance through pattern matching, and ATT focuses the model on the most salient temporal signals. This synergy results in a more reliable and generalizable prediction framework.
5.3. Limitations and Future Research Directions
6. Conclusions
- (1)
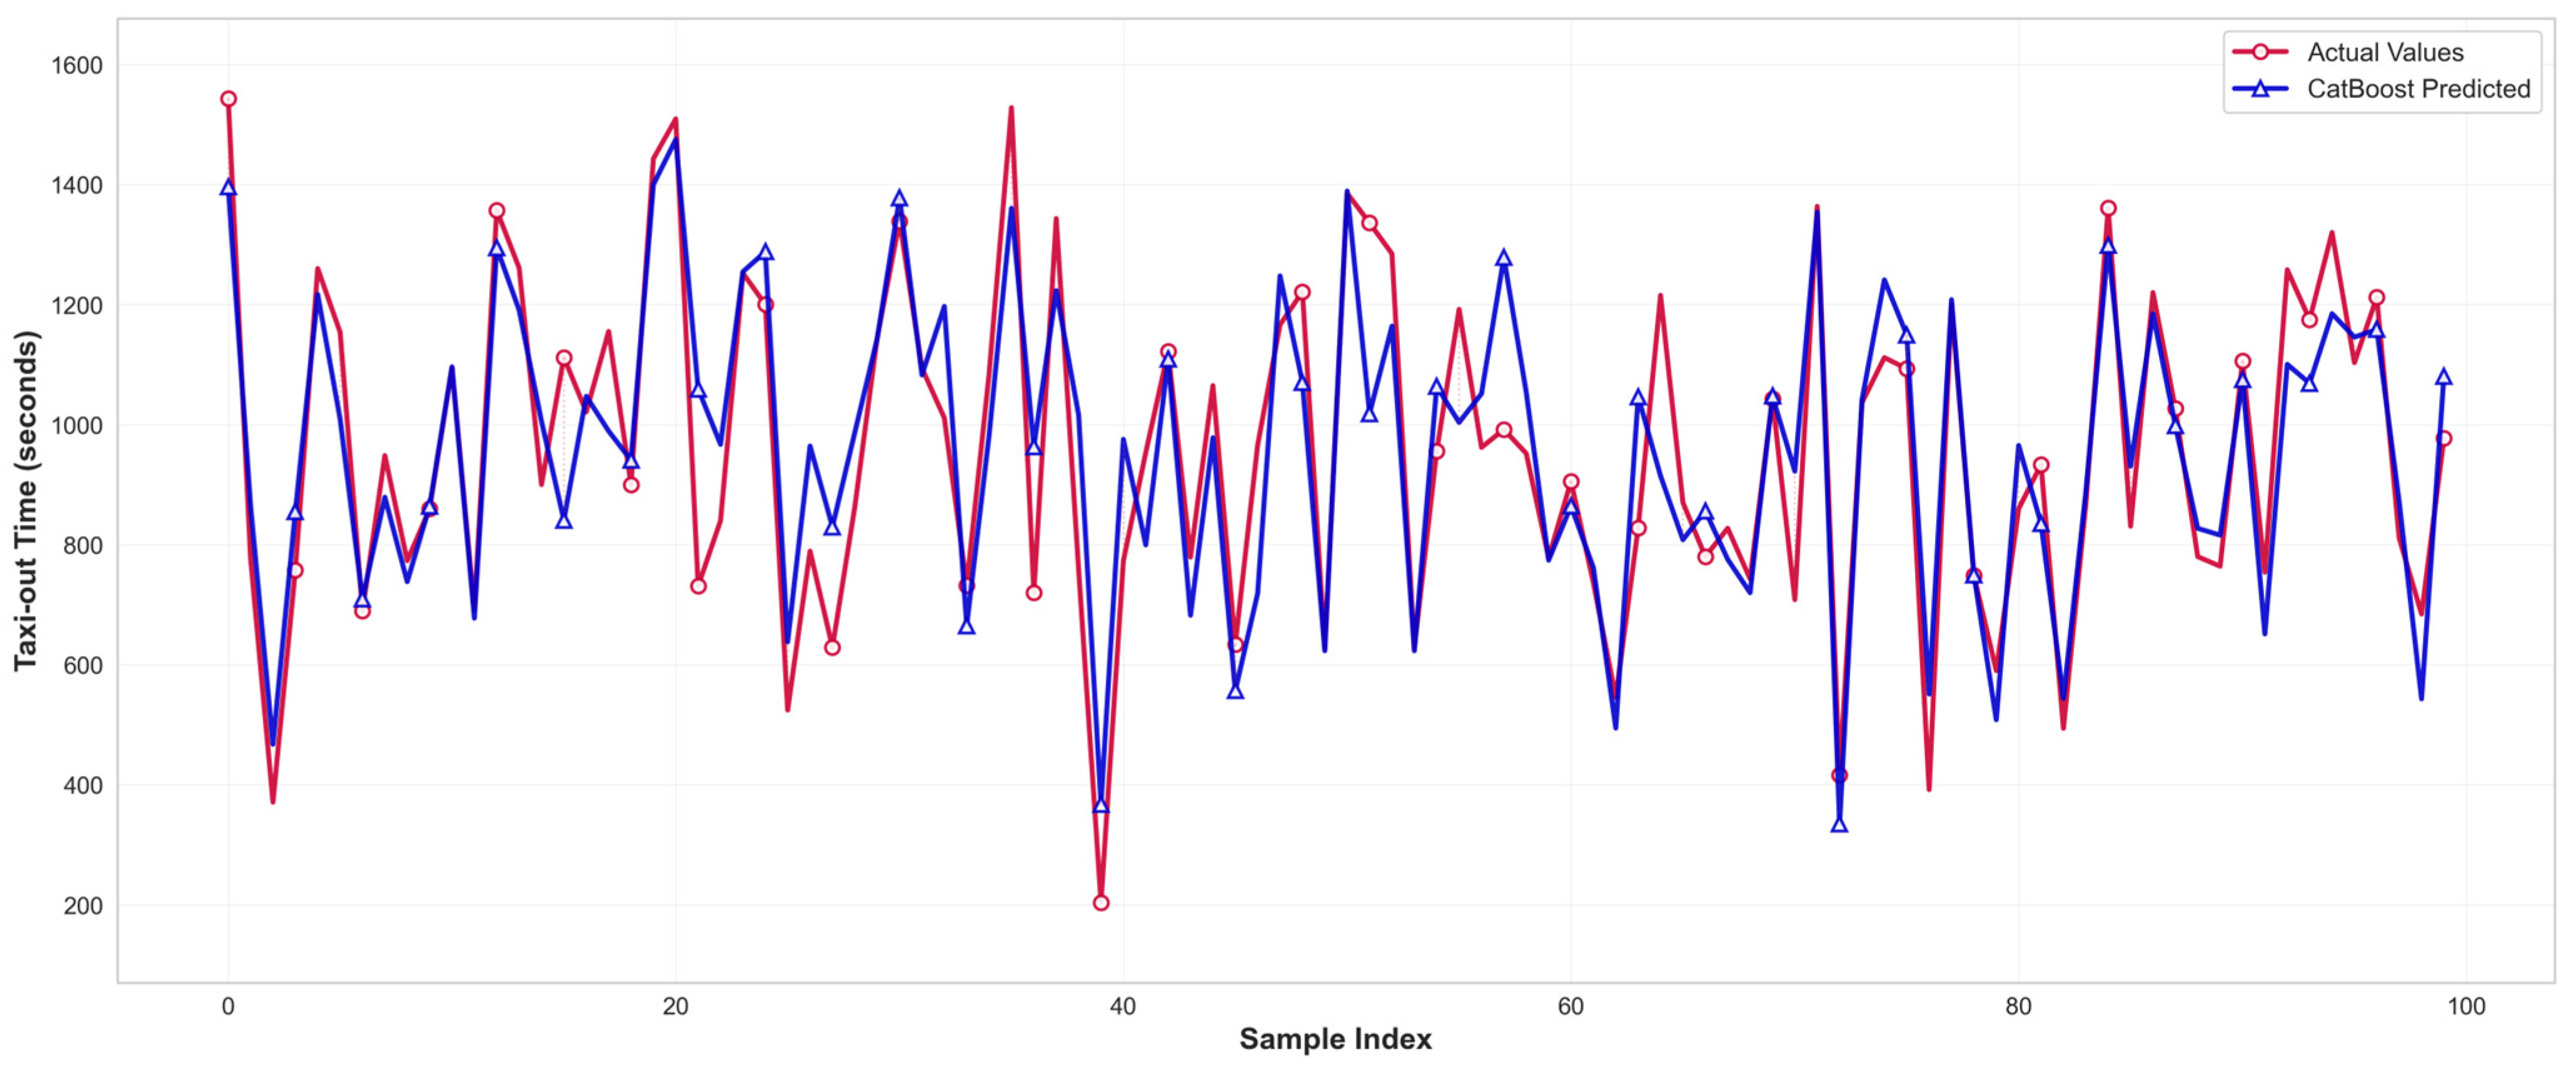
- The proposed DDA-SIM-ATT-CatBoost model, which synergistically integrates dynamic data augmentation, Similarity Theory, and an attention mechanism, achieves prediction accuracies of 74.57%, 89.12%, and 97.76% within error margins of ±120 s, ±180 s, and ±300 s, respectively. Most notably, the substantial improvement within the critical 2–3 min window—a range directly relevant to tactical decision-making in airport surface operations—significantly enhances the model’s engineering practicality and operational applicability.
- (2)
- Ablation studies confirm that each constituent module contributes positively to overall performance. The attention mechanism exerts the most significant influence through adaptive feature weighting; dynamic data augmentation effectively alleviates sample imbalance; and Similarity Theory improves pattern matching accuracy. The synergistic integration of these three modules reduces MAPE, MAE, and RMSE to 10.34%, 87.55 s, and 125.61 s, respectively, surpassing those of all baseline configurations.
- (3)
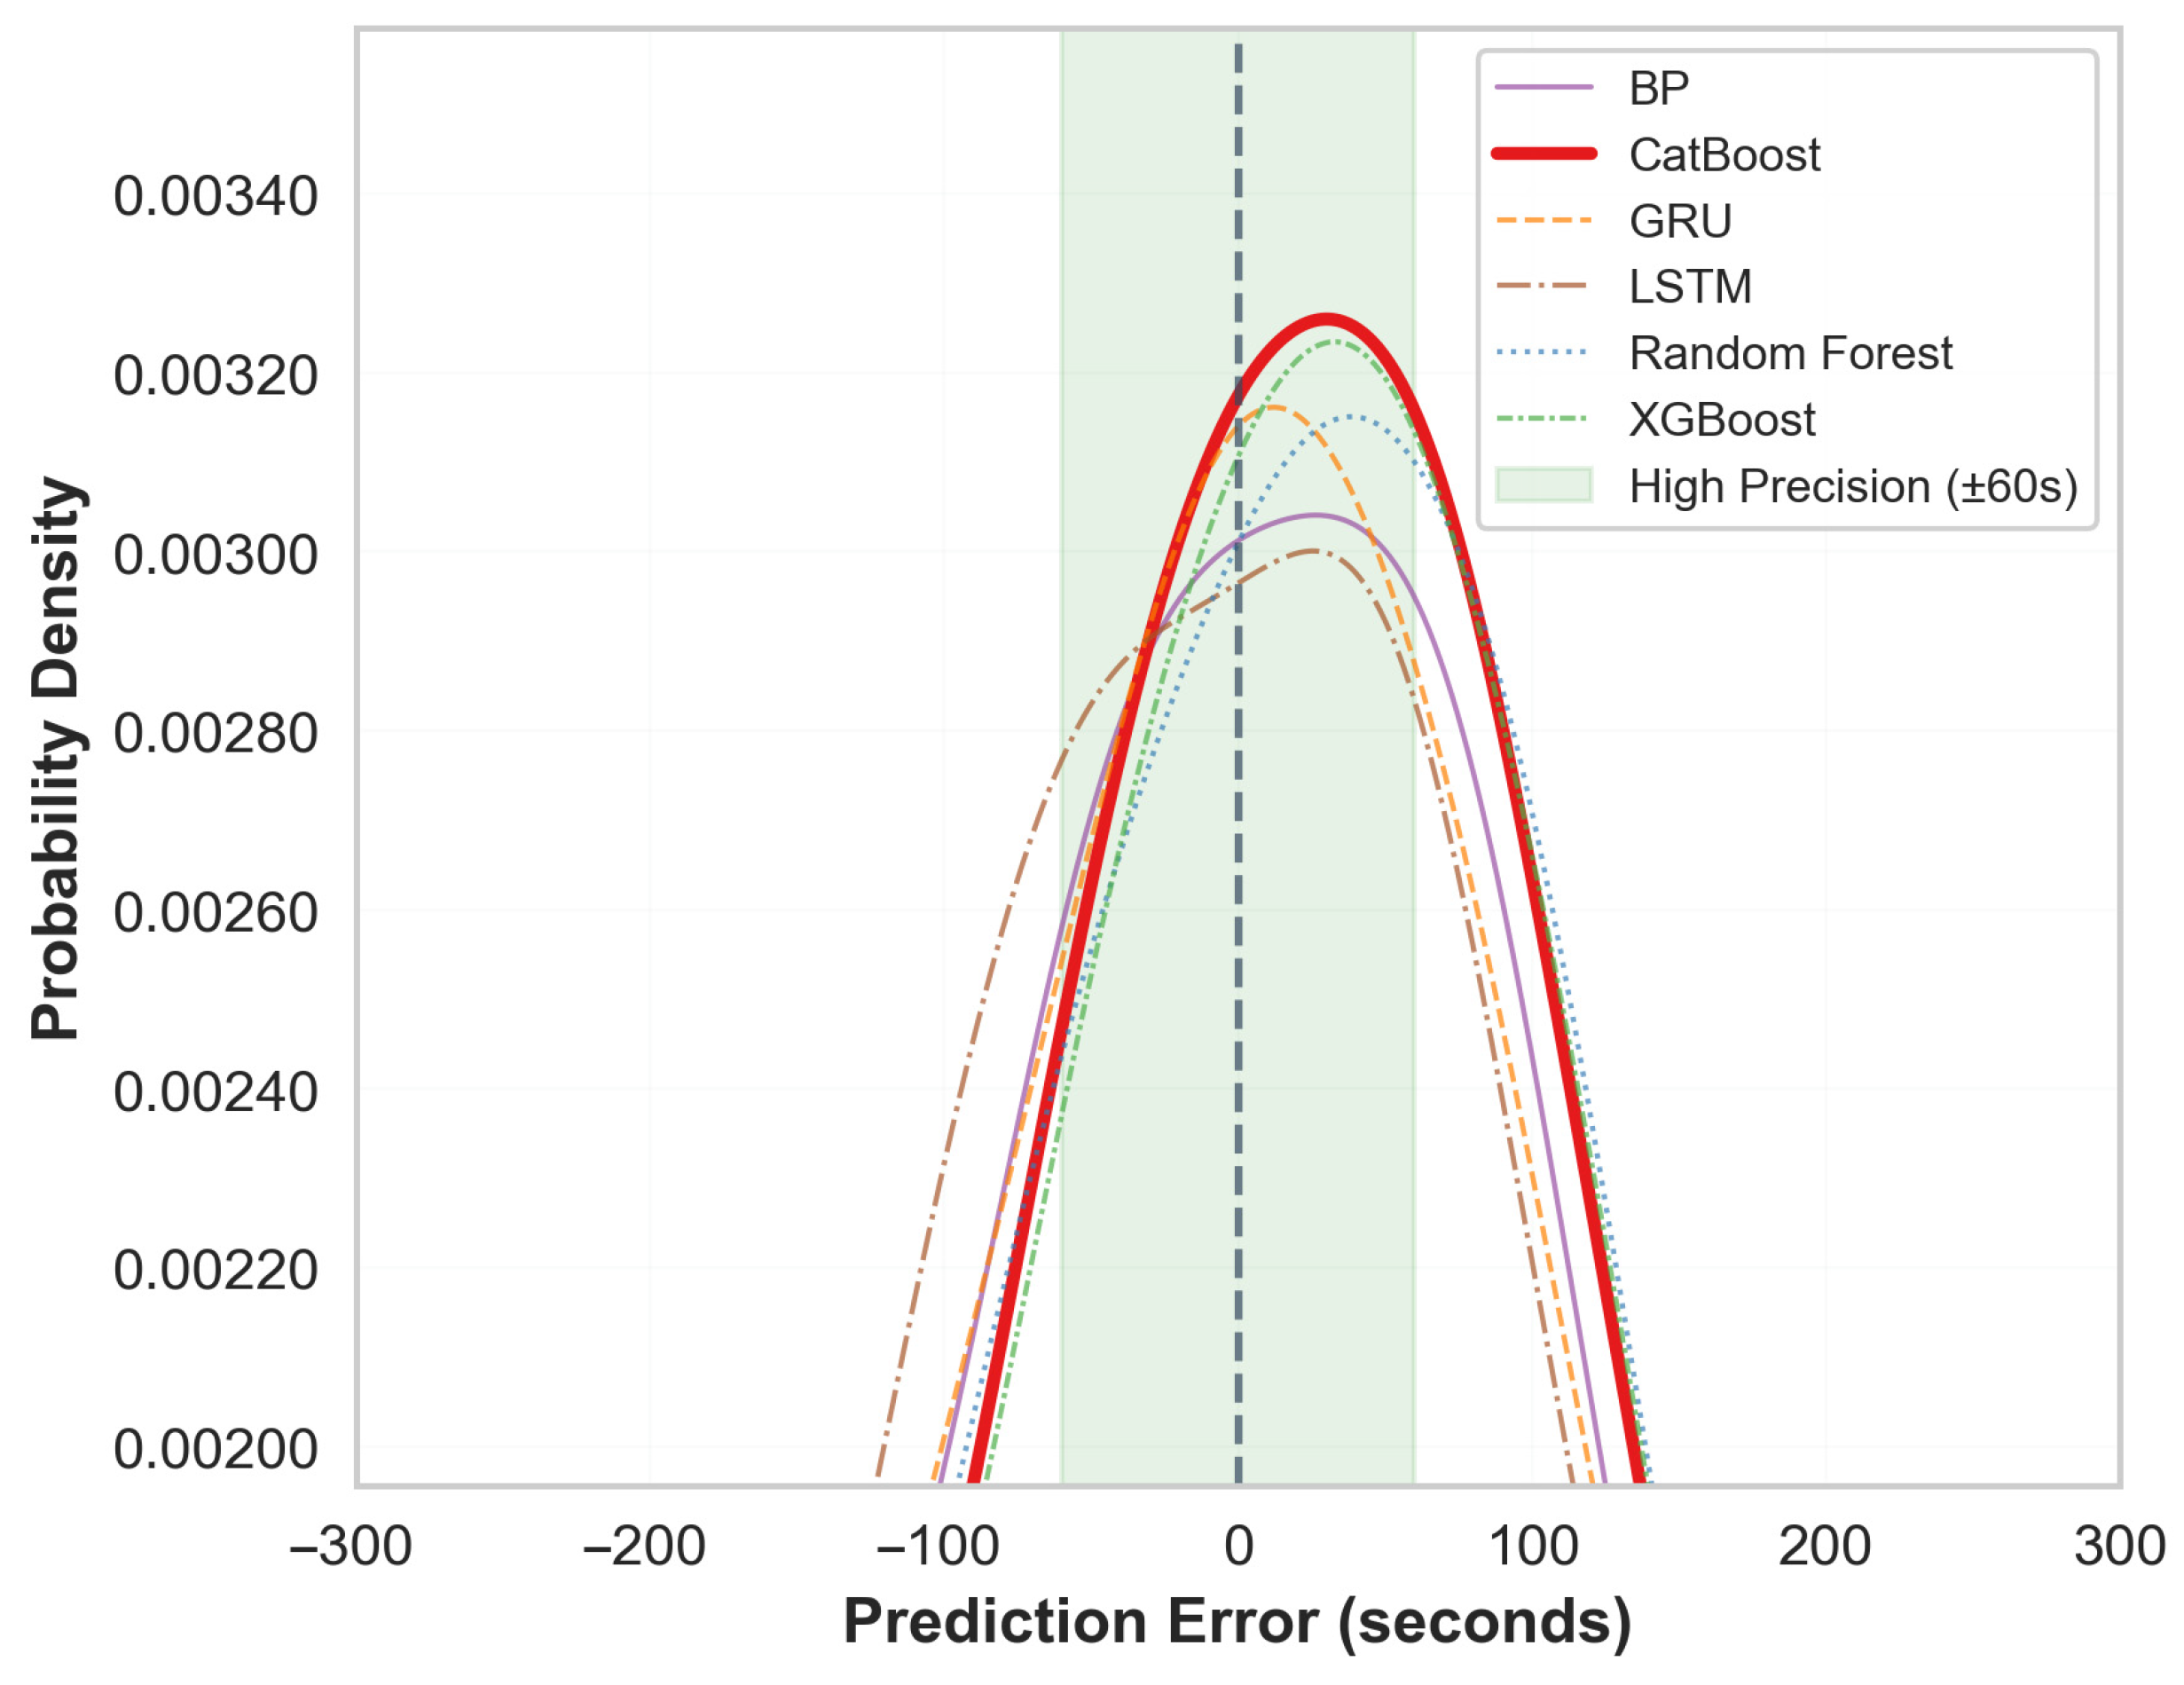
- Compared with conventional models such as XGBoost and Random Forest, the proposed model demonstrates superior performance in both prediction accuracy and stability. Relative to the second-best CatBoost model, it achieves reductions in MAE and RMSE of 17.4% and 13.2%, respectively, highlighting its enhanced nonlinear fitting capability and robustness. These results underscore its effectiveness in capturing complex operational patterns and support its potential for deployment in real-world traffic management systems.
Author Contributions
Funding
Data Availability Statement
Conflicts of Interest
References
- Gulding, J.; Knorr, D.; Rose, M.; Chen, X.; Enaud, P.; Hegendoerfer, H. US/Europe comparison of ATM-related operational performance. Air Traffic Control Q. 2010, 18, 5–27. [Google Scholar] [CrossRef] [Scilit]
- Idris, H.; Clarke, J.P.; Bhuva, R.; Kang, L. Queuing model for taxi-out time estimation. Air Traffic Control Q. 2001, 10, 1–22. [Google Scholar] [CrossRef] [Scilit]
- Simaiakis, I.; Pyrgiotis, N. An analytical queuing model of airport departure processes for taxi out time prediction. In Proceedings of the 10th AIAA Aviation Technology, Integration, and Operations (ATIO) Conference, Fort Worth, TX, USA, 13–15 September 2010; p. 9148. [Google Scholar] [CrossRef] [Scilit]
- Clewlow, R.; Simaiakis, I.; Balakrishnan, H. Impact of arrivals on departure taxi operations at airports. In AIAA Guidance, Navigation, and Control Conference; AIAA: Reston, VA, USA, 2010; p. 7698. [Google Scholar] [CrossRef] [Scilit]
- Ravizza, S.; Chen, J.; Atkin, J.A.; Stewart, P.; Burke, E.K. Aircraft taxi time prediction: Comparisons and insights. Appl. Soft Comput. 2014, 14, 397–406. [Google Scholar] [CrossRef] [Scilit]
- Yin, J.; Hu, M.; Ma, Y.; Han, K.; Chen, D. Airport taxi situation awareness with a macroscopic distribution network analysis. Netw. Spat. Econ. 2019, 19, 669–695. [Google Scholar] [CrossRef] [Scilit]
- Wang, X.; Brownlee, A.E.; Woodward, J.R.; Weiszer, M.; Mahfouf, M.; Chen, J. Aircraft taxi time prediction: Feature importance and their implications. Transp. Res. Part C Emerg. Technol. 2021, 124, 102892. [Google Scholar] [CrossRef] [Scilit]
- Xia, Z.; Wang, C.; Fang, P. Prediction of departure flight taxi-out time considering the influence of weather factors. Sci. Technol. Eng. 2023, 23, 11892–11899. [Google Scholar] [CrossRef]
- Park, D.K.; Kim, J.K. Influential factors to aircraft taxi time in airport. J. Air Transp. Manag. 2023, 106, 102321. [Google Scholar] [CrossRef] [Scilit]
- Tang, X.; Zhang, W.; Zhang, S.; Wu, C.L. A Road-Level Transport Network Model with Microscopic Operational Features for Aircraft Taxi-Out Time Prediction. Aerospace 2025, 12, 721. [Google Scholar] [CrossRef] [Scilit]
- Balakrishna, P.; Ganesan, R.; Sherry, L. Accuracy of reinforcement learning algorithms for predicting aircraft taxi-out times: A case-study of Tampa Bay departures. Transp. Res. Part C Emerg. Technol. 2010, 18, 950–962. [Google Scholar] [CrossRef] [Scilit]
- George, E.; Khan, S.S. Reinforcement learning for taxi-out time prediction: An improved Q-learning approach. In 2015 International Conference on Computing and Network Communications (CoCoNet); IEEE: New York, NY, USA, 2015; pp. 757–764. [Google Scholar] [CrossRef] [Scilit]
- Lee, H.; Malik, W.; Jung, Y.C. Taxi-out time prediction for departures at Charlotte airport using machine learning techniques. In 16th AIAA Aviation Technology, Integration, and Operations Conference; AIAA: Reston, VA, USA, 2016; p. 3910. [Google Scholar] [CrossRef] [Scilit]
- Lian, G.; Zhang, Y.; Desai, J.; Xing, Z.; Luo, X. Predicting Taxi-Out Time at Congested Airports with Optimization-Based Support Vector Regression Methods. Math. Probl. Eng. 2018, 2018, 7509508. [Google Scholar] [CrossRef] [Scilit]
- Herrema, F.; Curran, R.; Visser, H.; Huet, D.; Lacote, R. Taxi-out time prediction model at Charles de Gaulle Airport. J. Aerosp. Inf. Syst. 2018, 15, 120–130. [Google Scholar] [CrossRef] [Scilit]
- Diana, T. Can machines learn how to forecast taxi-out time? A comparison of predictive models applied to the case of Seattle/Tacoma International Airport. Transp. Res. Part E Logist. Transp. Rev. 2018, 119, 149–164. [Google Scholar] [CrossRef] [Scilit]
- Li, N.; Jiao, Q.Y.; Zhang, L.; Wang, S.C. Using deep learning method to predict taxi time of aircraft: A case of Hong Kong airport. J. Aeronaut. Astronaut. Aviat. 2020, 52, 371–386. [Google Scholar] [CrossRef]
- Gu, M.; Lu, C.; Dai, M.; Qian, J.J. Departure aircraft taxi time prediction based on gradient boosting regression tree. In Proceedings of the 2020 the 10th International Workshop on Computer Science and Engineering (WCSE 2020), Shanghai, China, 19–21 June 2020; pp. 76–80. [Google Scholar] [CrossRef] [Scilit]
- Yuan, L.; Liu, J.; Chen, H. Additional Taxi-Out Time Prediction for Flights at Busy Airports by Fusing Flow Control Information. Appl. Sci. 2024, 14, 9968. [Google Scholar] [CrossRef] [Scilit]
- Zhang, H.; Liu, Z. 4D aircraft trajectory prediction considering severe weather effects. Aeronaut. J. 2025, 129, 3619–3643. [Google Scholar] [CrossRef] [Scilit]
- Yoon, S.; Lee, K. Aircraft Trajectory Dataset Augmentation in Latent Space. Int. J. Aeronaut. Space Sci. 2025, 27, 1960–1971. [Google Scholar] [CrossRef] [Scilit]
- Naser, A.Z.; Naser, M.Z. SPINEX-TimeSeries: Similarity-based predictions with explainable neighbors exploration for time series and forecasting problems. Comput. Ind. Eng. 2025, 200, 110812. [Google Scholar] [CrossRef] [Scilit]
- Yang, P.; Wang, H.; Yang, J.; Qian, Z.; Zhang, Y.; Lin, X. Deep learning approaches for similarity computation: A survey. IEEE Trans. Knowl. Data Eng. 2024, 36, 7893–7912. [Google Scholar] [CrossRef] [Scilit]
- Pati, V.; Kim, Y.; Pham, V.; Twitty, J.; Yang, S.; Lu, J. CAPS: Unifying Attention, Recurrence, and Alignment in Transformer-based Time Series Forecasting. arXiv 2026, arXiv:2602.02729. [Google Scholar] [CrossRef] [Scilit]
- Yang, X.; Yang, H.; Mao, Y.; Wang, Q.; Yin, S. Multi-Task Dynamic Spatio-Temporal Graph Attention Network: A Variable Taxi Time Prediction Model for Airport Surface Operation. Aerospace 2024, 11, 371. [Google Scholar] [CrossRef] [Scilit]



| Flight Category | Operational Constraints |
|---|---|
| d1 | {AOBT (j) < AOBT (i), AOBT (i) < ATOT (j) < ATOT(i)} |
| d2 | {AOBT (j) < AOBT (i), ATOT(j) > ATOT(i)} |
| d3 | {AOBT (i) < AOBT (j) < ATOT (i), AOBT (j) < ATOT (j) < ATOT (i)} |
| d4 | {AOBT (i) < AOBT (j) < ATOT (i), ATOT (j) > ATOT (i)} |
| a1 | {ALDT(j) < AOBT (i), AOBT (i) < AIBT(j) < ATOT(i)} |
| a2 | {ALDT(j) < AOBT (i), AIBT(j) > ATOT(i)} |
| a3 | {AOBT (i) < ALDT(j) < ATOT(i), AOBT (i) < AIBT(j) < ATOT(i)} |
| a4 | {AOBT (i) < ALDT(j) < ATOT(i), AIBT(j) > ATOT(i)} |
| Taxi-Out Time | x1 | x2 | x3 | x4 | x5 | x6 | x7 | x8 | x9 | x10 | x11 | x12 | x13 |
|---|---|---|---|---|---|---|---|---|---|---|---|---|---|
| 1482 | 0 | 4 | 0 | 0 | 1432.8 | 0 | 0 | 0 | 4137 | 2 | 2 | 1 | 2 |
| 1230 | 0 | 4 | 1 | 0 | 1432.8 | 1482 | 1482 | 0 | 2615 | 1 | 2 | 1 | 3 |
| 1320 | 1 | 5 | 3 | 1 | 1432.8 | 1356 | 1356 | 1 | 2843 | 1 | 2 | 1 | 5 |
| 2077 | 1 | 8 | 4 | 0 | 1432.8 | 1344 | 1344 | 1 | 3728 | 2 | 2 | 1 | 4 |
| 1055 | 2 | 4 | 2 | 1 | 1432.8 | 1527.3 | 1527.3 | 2 | 2279 | 1 | 2 | 1 | 3 |
| 1068 | 0 | 6 | 2 | 0 | 1133.1 | 1432.8 | 1432.8 | 0 | 2160 | 1 | 2 | 1 | 4 |
| ... | ... | ... | ... | ... | ... | ... | ... | ... | ... | ... | ... | ... | ... |
| Parameter | Value |
|---|---|
| Iterations (based on sample size) | <100:500; 100–500:800; ≥500:1000 |
| Tree depth (based on sample size) | <100:4; 100–500:6; ≥500:8 |
| Early stopping rounds | 50 |
| Learning rate | 0.05 |
| Gradient clipping | max_norm = 1.0 |
| Feature Selection | ±120 s/(%) | ±180 s/(%) | ±300 s/(%) | MAPE/(%) | MAE/(s) | RMSE/(s) |
|---|---|---|---|---|---|---|
| x1~x13 | 72.58 | 86.27 | 96.78 | 10.94 | 93.38 | 132.74 |
| x1~x12 | 73.36 | 88.1 | 97.49 | 10.65 | 89.99 | 129.19 |
| x1~x11 | 74.57 | 89.12 | 97.76 | 10.34 | 87.55 | 125.61 |
| x1~x10 | 73.76 | 88.08 | 96.13 | 10.39 | 89.94 | 127.51 |
| x1~x9 | 73.5 | 87.12 | 97.26 | 10.65 | 90.77 | 131.55 |
| x1~x8 | 72.77 | 87.3 | 96.99 | 10.75 | 91.95 | 130.35 |
| Module | ±120 s/(%) | ±180 (s)/(%) | ±300 (s)/(%) | MAPE/(%) | MAE/(s) | RMSE/(s) |
|---|---|---|---|---|---|---|
| CatBoost (Baseline) | 66.42 | 84.44 | 95.51 | 11.91 | 106.02 | 144.82 |
| CatBoost + SIM | 69.63 | 86.72 | 97.29 | 11.64 | 99.4 | 134.1 |
| CatBoost + ATT | 73.32 | 88.66 | 97.59 | 10.83 | 91.41 | 126.71 |
| CatBoost + DDA | 70.73 | 85.7 | 96.62 | 10.75 | 100.12 | 146.11 |
| CatBoost + DDA + ATT | 73.05 | 87.96 | 97.13 | 10.74 | 93.26 | 133.15 |
| CatBoost + DDA + SIM | 73.24 | 89.77 | 97.67 | 10.6 | 92.2 | 127.5 |
| CatBoost + DDA + SIM + ATT | 74.57 | 89.12 | 97.76 | 10.34 | 87.55 | 125.61 |
| Base Model | ±120 s/(%) | ±180 (s)/(%) | ±300 (s)/(%) | MAPE/(%) | MAE/(s) | RMSE/(s) | p-Value |
|---|---|---|---|---|---|---|---|
| BP | 65.22 | 82.41 | 94.59 | 12.59 | 113.16 | 159.91 | p < 0.001 |
| LSTM | 63.93 | 81.39 | 94.73 | 12.84 | 114.47 | 158.27 | p < 0.001 |
| RF | 65.99 | 83.58 | 95.63 | 12.22 | 108.86 | 149.63 | p < 0.001 |
| GRU | 64.8 | 82.13 | 94.56 | 12.55 | 113.32 | 157.69 | p < 0.001 |
| XGBoost | 65.62 | 84.07 | 95.45 | 12.33 | 109.12 | 150.4 | p < 0.001 |
| CatBoost | 66.42 | 84.44 | 95.51 | 11.91 | 106.02 | 144.82 | p < 0.001 |
| OURS | 74.57 | 89.12 | 97.76 | 10.34 | 87.546 | 125.61 | p < 0.001 |
Disclaimer/Publisher’s Note: The statements, opinions and data contained in all publications are solely those of the individual author(s) and contributor(s) and not of MDPI and/or the editor(s). MDPI and/or the editor(s) disclaim responsibility for any injury to people or property resulting from any ideas, methods, instructions or products referred to in the content. |
© 2026 by the authors. Licensee MDPI, Basel, Switzerland. This article is an open access article distributed under the terms and conditions of the Creative Commons Attribution (CC BY) license.
Share and Cite
Lu, Y.; Li, Y.; Zhong, Q.; Zhong, J.; Yu, Y.; Zhang, Y. DDA-SIM-ATT: A Synergistic Multi-Module Fusion Model for High-Precision Prediction of Departure Flight Taxi-Out Time. Aerospace 2026, 13, 314. https://doi.org/10.3390/aerospace13040314
Lu Y, Li Y, Zhong Q, Zhong J, Yu Y, Zhang Y. DDA-SIM-ATT: A Synergistic Multi-Module Fusion Model for High-Precision Prediction of Departure Flight Taxi-Out Time. Aerospace. 2026; 13(4):314. https://doi.org/10.3390/aerospace13040314
Chicago/Turabian StyleLu, Yue, Yanzhi Li, Qingwei Zhong, Jifei Zhong, Yingxue Yu, and Yuxin Zhang. 2026. "DDA-SIM-ATT: A Synergistic Multi-Module Fusion Model for High-Precision Prediction of Departure Flight Taxi-Out Time" Aerospace 13, no. 4: 314. https://doi.org/10.3390/aerospace13040314
APA StyleLu, Y., Li, Y., Zhong, Q., Zhong, J., Yu, Y., & Zhang, Y. (2026). DDA-SIM-ATT: A Synergistic Multi-Module Fusion Model for High-Precision Prediction of Departure Flight Taxi-Out Time. Aerospace, 13(4), 314. https://doi.org/10.3390/aerospace13040314