1. Introduction
All-electric and hybrid-electric aircraft are being investigated as potential pathways toward carbon-neutral aviation, particularly for short and medium-range missions. However, aircraft electrification faces challenges related to the energy and power density of both batteries and fuel cells. Batteries have relatively high power densities, making them well-suited for meeting peak demands during take-off. However, their low energy density limits their use in achieving long ranges. Fuel cells provide comparatively high energy density but lower power density, making them suitable for extending an aircraft’s range but insufficient for supplying peak power demands on their own. To address this gap, hybrid fuel cell–battery architectures have been proposed. These systems combine the high energy density of fuel cells, particularly when using liquified hydrogen, with the ability of batteries to meet peak power demands and provide fast response times to loads. However, using multiple energy sources onboard an aircraft introduces increased complexity, particularly regarding when and how each source should be employed. Effective energy management is crucial for controlling and coordinating the distribution of energy and power among these sources in accordance with the defined objectives, such as efficiency, safety, and performance.
EMSs for hybrid electric aircraft can be grouped into four main categories: rule-based methods, instantaneous optimisation, global optimisation, and learning-based approaches. This paper considers and applies the first three categories for hybrid electric applications, with a primary focus on minimising hydrogen consumption and ensuring feasibility for real-time implementation, while considering battery ageing effects as a secondary concern.
Among the various EMSs investigated in the literature, DP is widely adopted as a benchmark strategy because it can provide a globally optimal solution when the full mission is known in advance [
1,
2]. However, the high computational cost of DP and its reliance on complete prior knowledge of the mission limit its applicability to offline analysis. Consequently, real-time but sub-optimal strategies, such as rule-based methods and instantaneous optimisation, are commonly investigated to evaluate the trade-offs between global optimality and practical implementation. Furthermore, DP is typically used as a benchmark for achievable system efficiency, providing a reference against which the performance of real-time EMSs can be assessed.
Rule-based EMSs, including the state-machine, rely on predefined decision logic to split power between the fuel cell (FC) and the battery, based on power demand and battery state-of-charge (SOC). Their simplicity and robustness make them attractive for real-time implementation; however, the constrained decision-making can result in sub-optimal performance, particularly under varying mission conditions. Instantaneous optimisation approaches, such as the ECMS, aim to minimise hydrogen consumption by balancing FC usage against the battery’s equivalent consumption. As the ECMS optimises based solely on the current system state without future prediction, its performance is highly sensitive to the mission profile and to the selection of equivalence factors, which are typically predefined and fixed.
Despite continued development of individual EMSs, each approach has limitations, motivating recent research into combined EMSs that seek to balance optimality and real-time feasibility. Examples include the use of DP to inform real-time rule-based strategies [
1,
2], the integration of ECMS with frequency decoupling to reduce hydrogen consumption and component ageing [
3], and the combination of fuzzy logic control with instantaneous optimisation to improve battery SOC regulation [
4,
5]. In addition, offline optimisation techniques, such as reinforcement learning and DP, have been used to determine optimal ECMS equivalence factors over entire mission profiles [
6,
7]. Nevertheless, a systematic comparison of EMSs that considers hydrogen consumption, real-time implementation, and battery ageing within a battery-FC aircraft framework remains to be explored.
The work in [
8] introduces a comparison of three EMSs, including a hybrid approach, evaluating hydrogen consumption and battery ageing. This work builds upon the research presented in [
8]. This includes SIL for validating the real-time applicability of the control code. It considers and evaluates EMSs over complete mission profiles to verify trends in hydrogen consumption and battery SOC, within a mission profile where weight and system efficiency are more critical. Further, this work provides a more thorough explanation of the EMSs, including the key equations and strategies, such as the hybrid strategy combining two EMSs. Additional analyses are also conducted, including calculations of energy expenditure to demonstrate efficiency improvements and an evaluation of the number of flights achievable before battery replacement. Overall, this work provides a more detailed comparison of EMSs, highlighting system efficiency improvements across a range of operating scenarios for a battery-FC aircraft.
This paper is organised into seven main sections, beginning with the introduction.
Section 2 outlines the aircraft case study and mission profile, followed by
Section 3, which covers the methodology used to develop the EMSs.
Section 4 details the SIL implementation used to validate the EMS in real time.
Section 5 then presents the comparative results of the selected EMS.
Section 6 provides an in-depth analysis of these results, converting hydrogen consumption and battery ageing into associated costs and examining overall system efficiency. Finally,
Section 7 concludes the study.
2. Aircraft Case Study
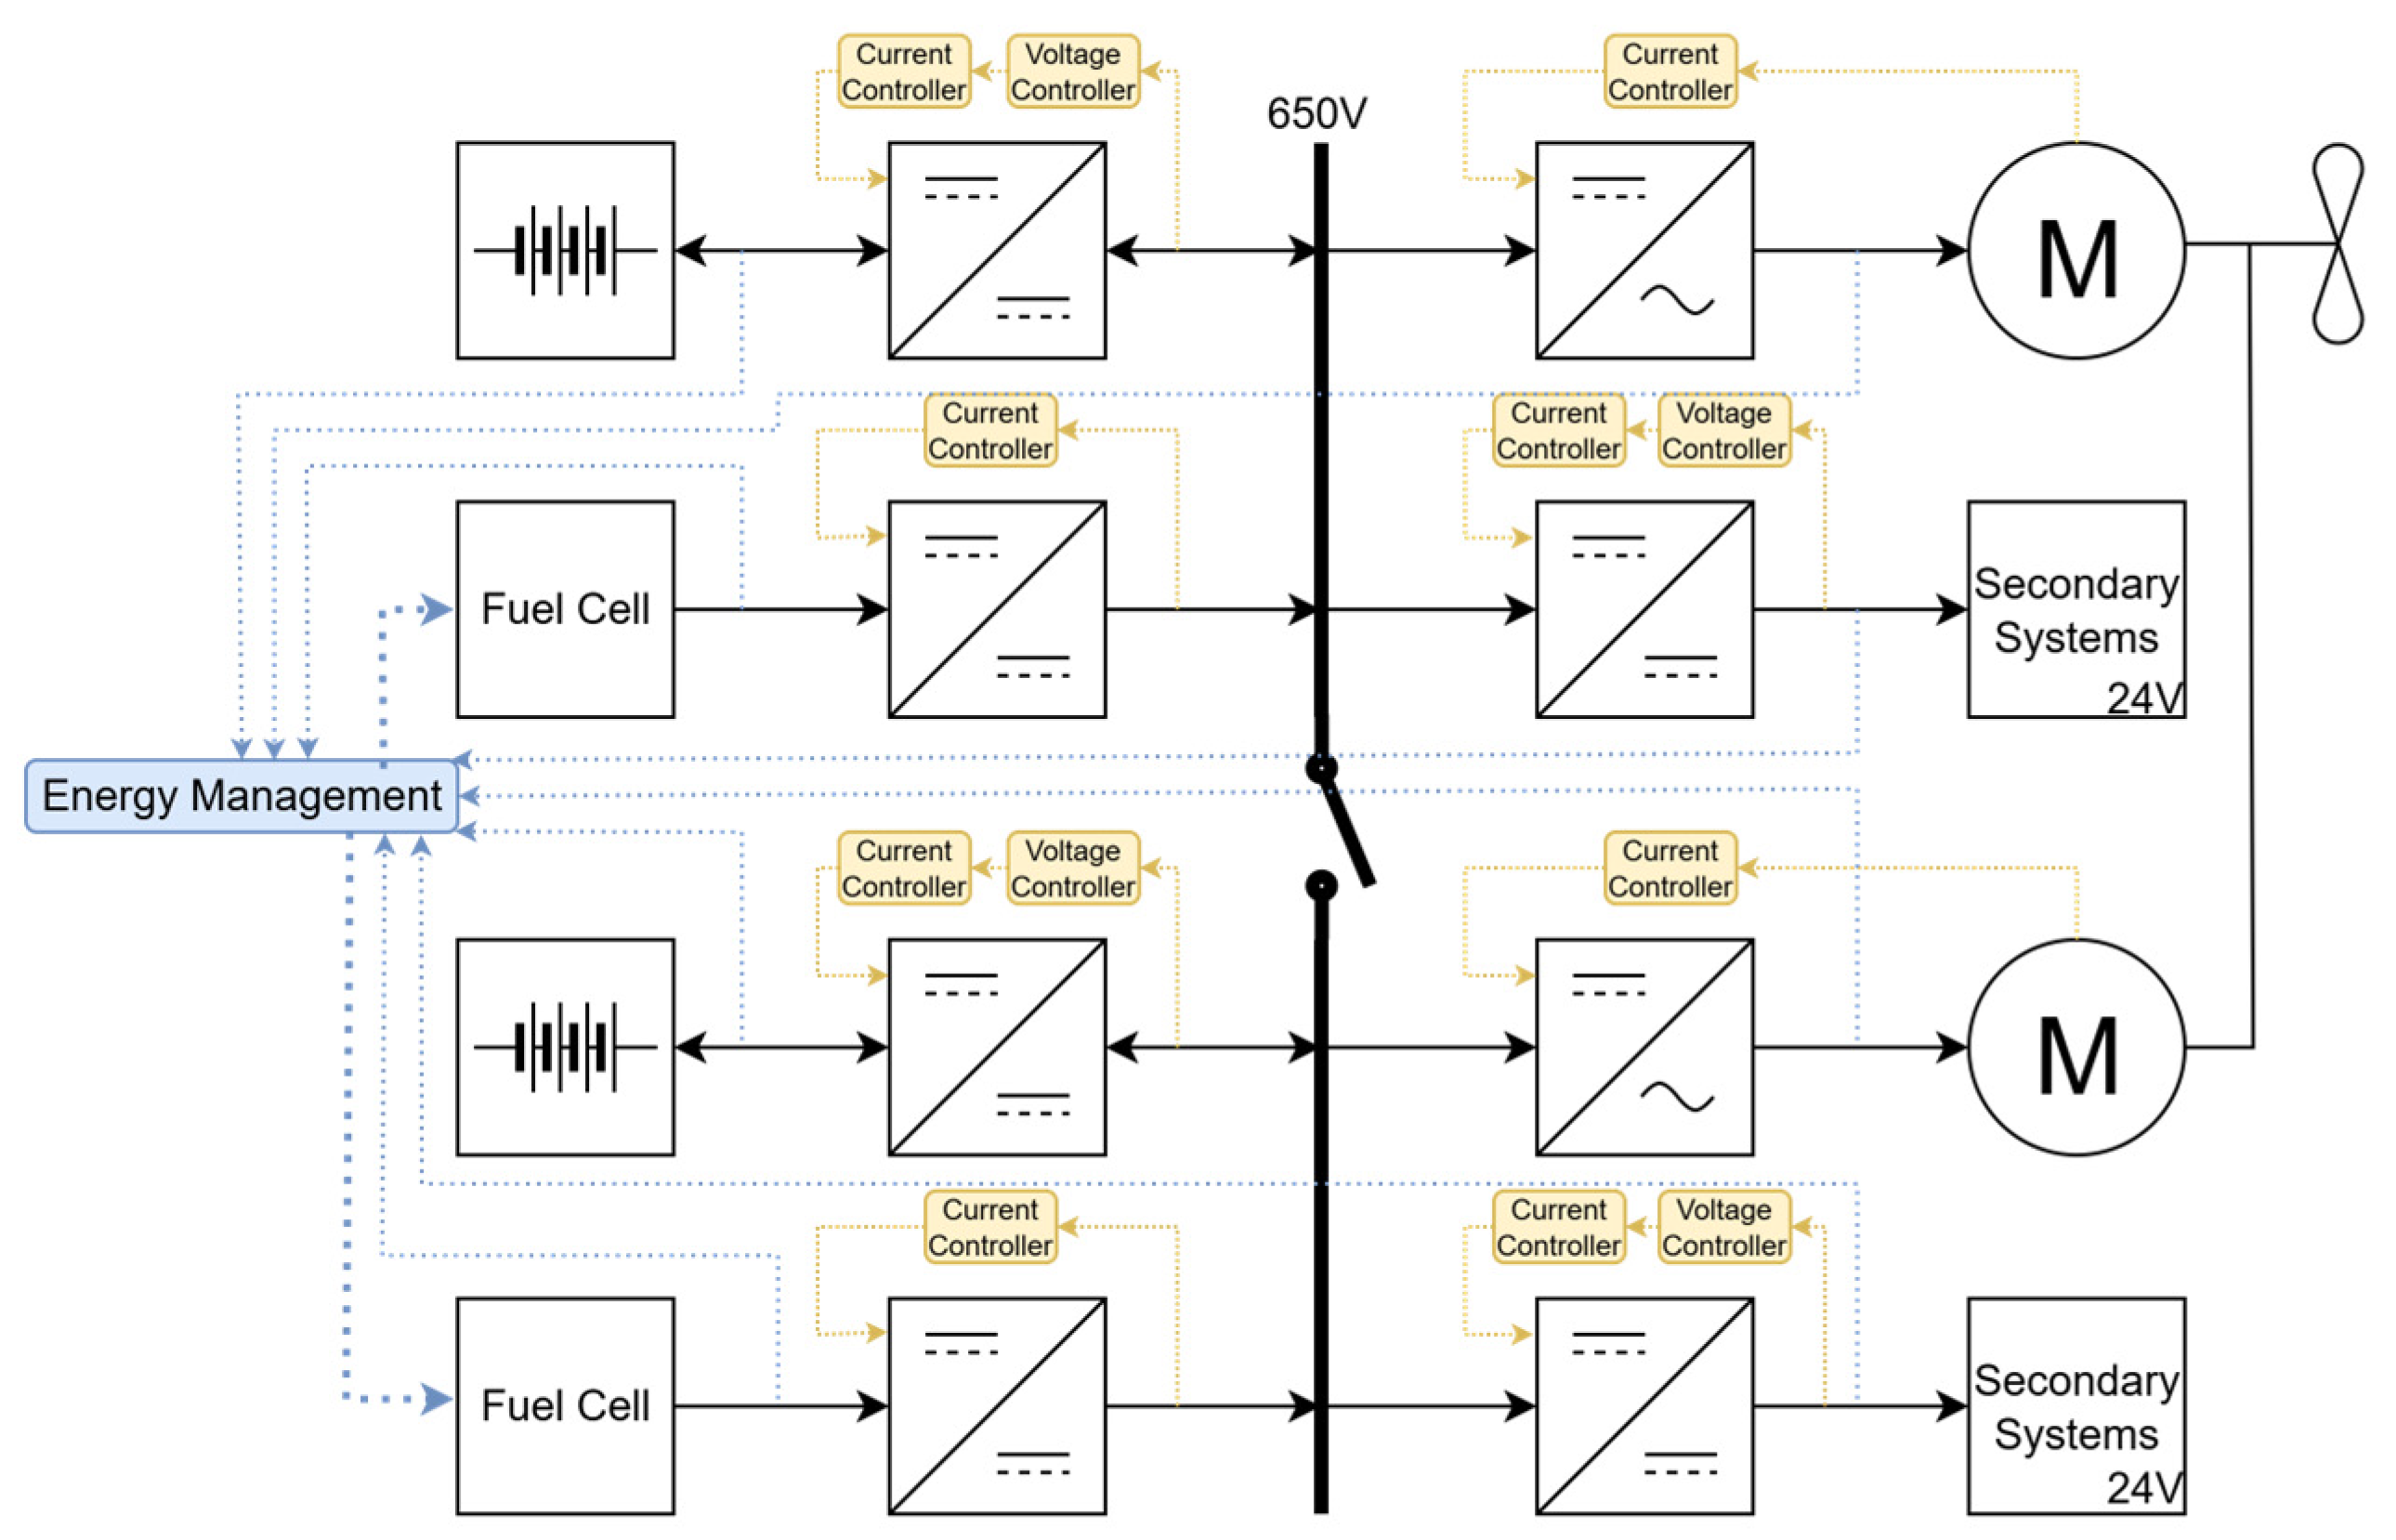
The aircraft architecture considered for this study is a small general aviation, four-seater aircraft with two independent electrical channels. This allows for the exploration of EMSs for multiple energy sources, with equal power supplied through each electrical channel. Hence, this topology is considered, while not being too complex. Each electrical channel includes one battery rated for 125 kW and one FC rated for 100 kW, both connected to a 650 V bus through their respective power electronic converters (PECs). The bus supplies power to an electric machine used for propulsion as well as secondary low-voltage loads through PECS, as shown in
Figure 1. These channels are interconnected at two points: electrically, through a switch that remains open during normal operation and closes only during failure-modes when reconfiguration occurs; and mechanically, with the two electric machines, which operate on a common shaft. The secondary power systems require 5 kW each. To control the energy split between the energy sources, an energy management system is applied, as shown in
Figure 1. Furthermore,
Figure 1 also shows the local controls applied for each PEC.
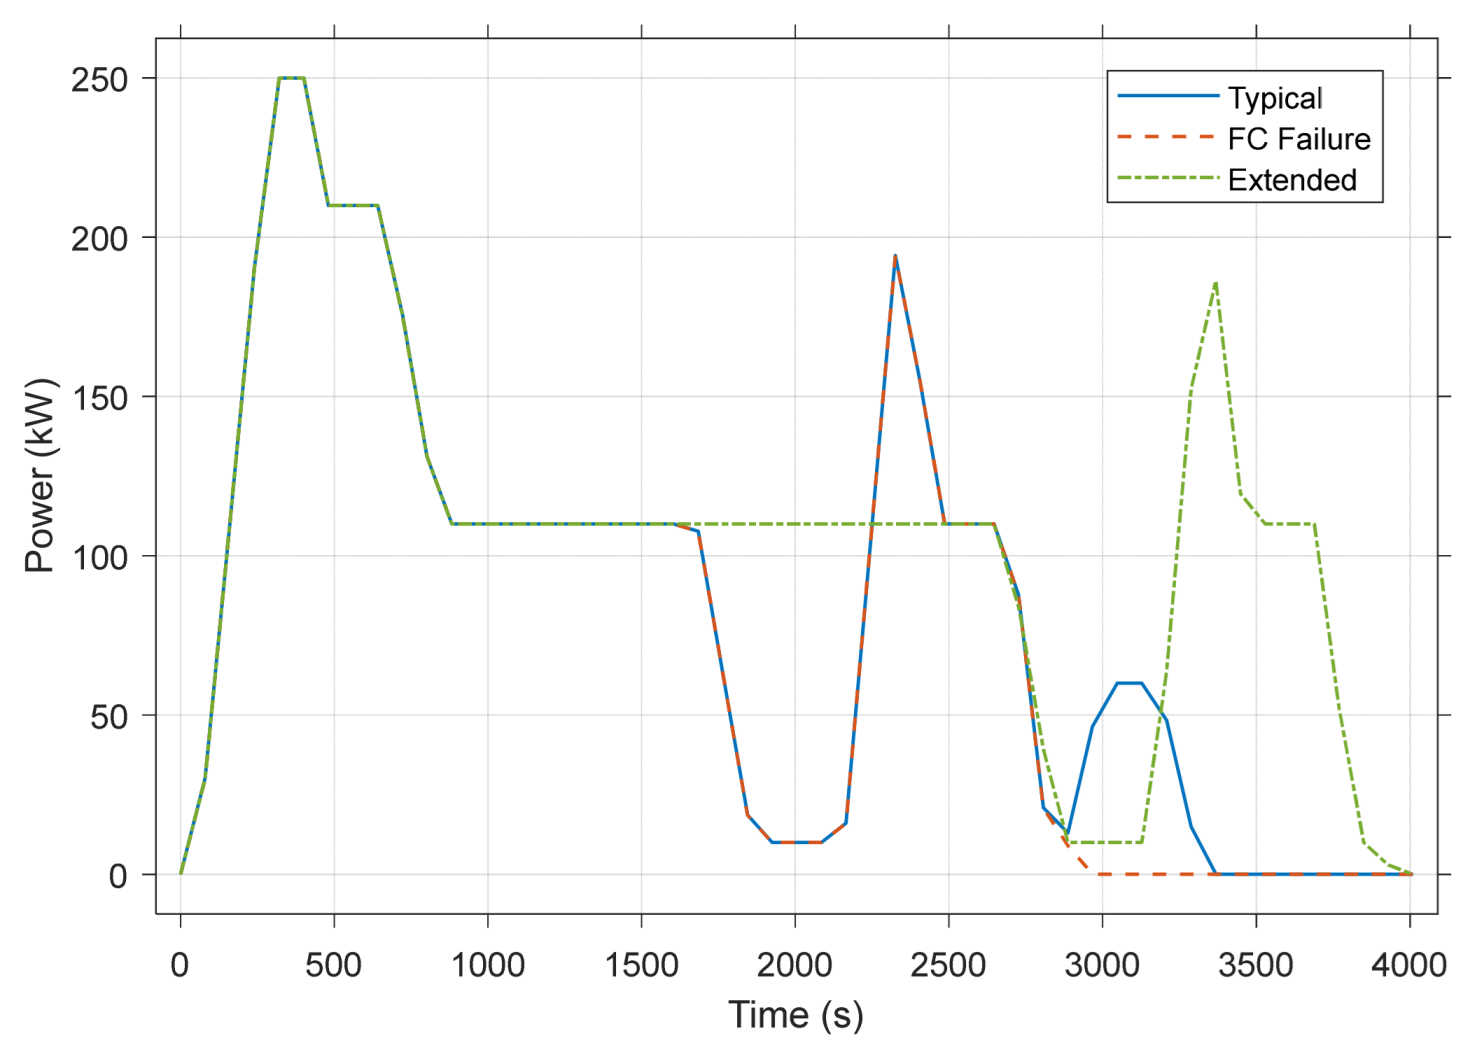
Within this study, to assess the effectiveness and robustness of the EMS under different operating conditions, the aircraft is investigated across three mission profiles: a typical mission, an extended-cruise mission, and a fuel-cell failure scenario. A typical mission is considered a baseline case, allowing the assessment of the EMS performance during standard phases of flight with nominal power availability. An extended cruise mission is included to explore the ability of the EMS to optimise power allocation and fuel usage during prolonged operation, where efficient energy utilisation and battery SOC management are critical. Finally, an FC failure scenario allows for the EMS capability to explore the reallocation of power with the system reconfiguration and maintain safe operation.
Figure 2 shows the aforementioned three mission profiles and is based on the mission profile presented in [
9] but scaled down to be applicable to a general aviation aircraft. The mission profile follows the same shape until 1680 s, with maximum power during take-off and climb, which is reduced to around half of the maximum power for cruise from 840 s to 1680 s.
For the typical mission profile, after cruise, the aircraft descends for a first attempt at landing at 2700 s. However, a successful landing is only achieved on the second attempt at 3360 s.
The extended-cruise mission profile keeps the aircraft in cruise for a further 1000 s compared to the typical mission, until 2680 s. This allows for the exploration of further hydrogen usage and how the different EMSs react to additional energy usage throughout the entire mission profile. It provides a different scenario for comparison, allowing assessment of whether mission characteristics influence the EMS performance. Unlike the typical mission, the extended cruise mission profile does not include two attempts at landing.
For the fuel-cell failure scenario, one of the FCs is electrically isolated for 1000 s by opening the circuit breaker between its DC/DC converter and the associated DC bus. The breaker status change is immediately communicated to the EMS and responded to by the subsequent EMS control interval. The EPS architecture is reconfigured by closing the bus-tie switch shown in
Figure 1, allowing power exchange between the two busbars. From this point onwards, the two batteries and the one remaining healthy FC supply the electrical loads required to successfully complete the mission profile, with landing achieved at 2820 s. Both electric machines request equal power, and the batteries provide nearly equal power. The small difference arises because one battery transitions from voltage control to current control to allow for stable operation during the reconfiguration. Therefore, during fault recovery, the EMS updates power references to ensure the healthy FC and batteries operate at the new optimum conditions consistent with the updated operational constraints, which are detailed in the subsequent section.
3. Energy Management Strategies
The EMSs determine the energy split between multiple energy sources, including FCs and batteries, shown in
Figure 1. Three EMSs are compared within this study for an all-electric aircraft: state machine, equivalent consumption minimisation strategy (ECMS), and dynamic programming (DP), though hybrid approaches are implemented using a combination of these strategies for increased benefits, as will be explained later in this section. All EMSs assume the same electrical power system model; therefore, the same operating constraints apply across the EMS, with each variable required to remain within specified minimum and maximum limits:
where
is the battery state-of-charge, %,
is the battery power, kW,
is the Fuel cell power, kW, and
is the fuel cell slew rate, s/kW.
For the case under study, the battery SOC is allowed to vary between 50% and 95% during normal operation, with the minimum SOC dropping to 15% in failure operational mode. The battery and FC maximum powers are set at 250 kW, and minimum powers -30 kW and 1 kW, respectively. The FC slew rate is set at 5 s/kW.
3.1. State Machine
The rule-based strategy, implemented as a state machine using a state flow chart, is the simplest energy management.
Table 1 shows the 9 rules considered for the state machine, and the discrete transitions between states, determining the optimum FC power. This table follows the rules set out in studies [
10,
11]. The FC power requested by the EMS,
, is calculated using the battery SOC and load power demand,
; the resulting power request is set to a range from minimum to maximum power. It also considers optimum FC power,
, with the highest efficiency, along with the potential for battery charging in some states.
3.2. Equivalent Consumption Minimisation Strategy
The ECMS follows the methodology in [
12,
13], and aims to minimise the instantaneous hydrogen consumption and equivalent consumption of the battery energy, given by:
where
is the FC hydrogen consumption, kg/s, k is the equivalence factor of the battery, and
is the battery energy equivalent consumption, kg/s [
12,
13].
The equivalence factor is the ratio between electrical energy and its fuel equivalent. If the value of the equivalence factor is below one, it favours the battery energy usage. If the value is above one, it favours FC energy usage. This equivalence factor is set depending on whether battery or FC usage is favoured and ensuring the operating constraints of the battery SOC are respected. This equivalence factor is calculated as a SOC-dependent linear function to balance battery utilisation by [
12]:
where
is a weighting factor that correlates how strongly the battery SOC affects the equivalence factor.
SOC constraints are enforced independently at the supervisory EMS level as hard bounds. When SOC or power limits are reached, the EMS saturates the corresponding power commands and redistributes power among remaining sources at the subsequent control interval. This implementation ensures reproducibility, real-time applicability, and compliance with operational constraints.
The FC hydrogen consumption equation is usually determined from the consumption curve from the FC data sheet, and can then be represented by [
14]:
where
,
, and
are fitting coefficients from the fuel consumption curve.
The battery equivalent consumption can be approximated as a function of battery efficiency and power, given by:
where
is the average fuel consumption of the FC, g/s,
is the efficiency of the battery during charging and discharging, and
is the corresponding average power of the FC, kW.
Using Equations (4) and (5), the optimum battery power,
, can be determined:
This optimum battery power (
) equation shown previously in (6) can be simplified when assuming that the FC power is as follows:
From these equations, the ECMS can continuously recalculate the FC optimum power, changing the power demand with respect to the FC slew rate selected and remaining within the constraints for maximum and minimum power.
For a failed operation, the ECMS must adapt to allow for changes in SOC constraints and the equivalence factor. This follows the work in [
13], where the minimum SOC is changed using an iterative approach, by progressively reducing its value in steps, based on a function of the change in requested SOC and the EMS sampling time interval.
3.3. Dynamic Programming
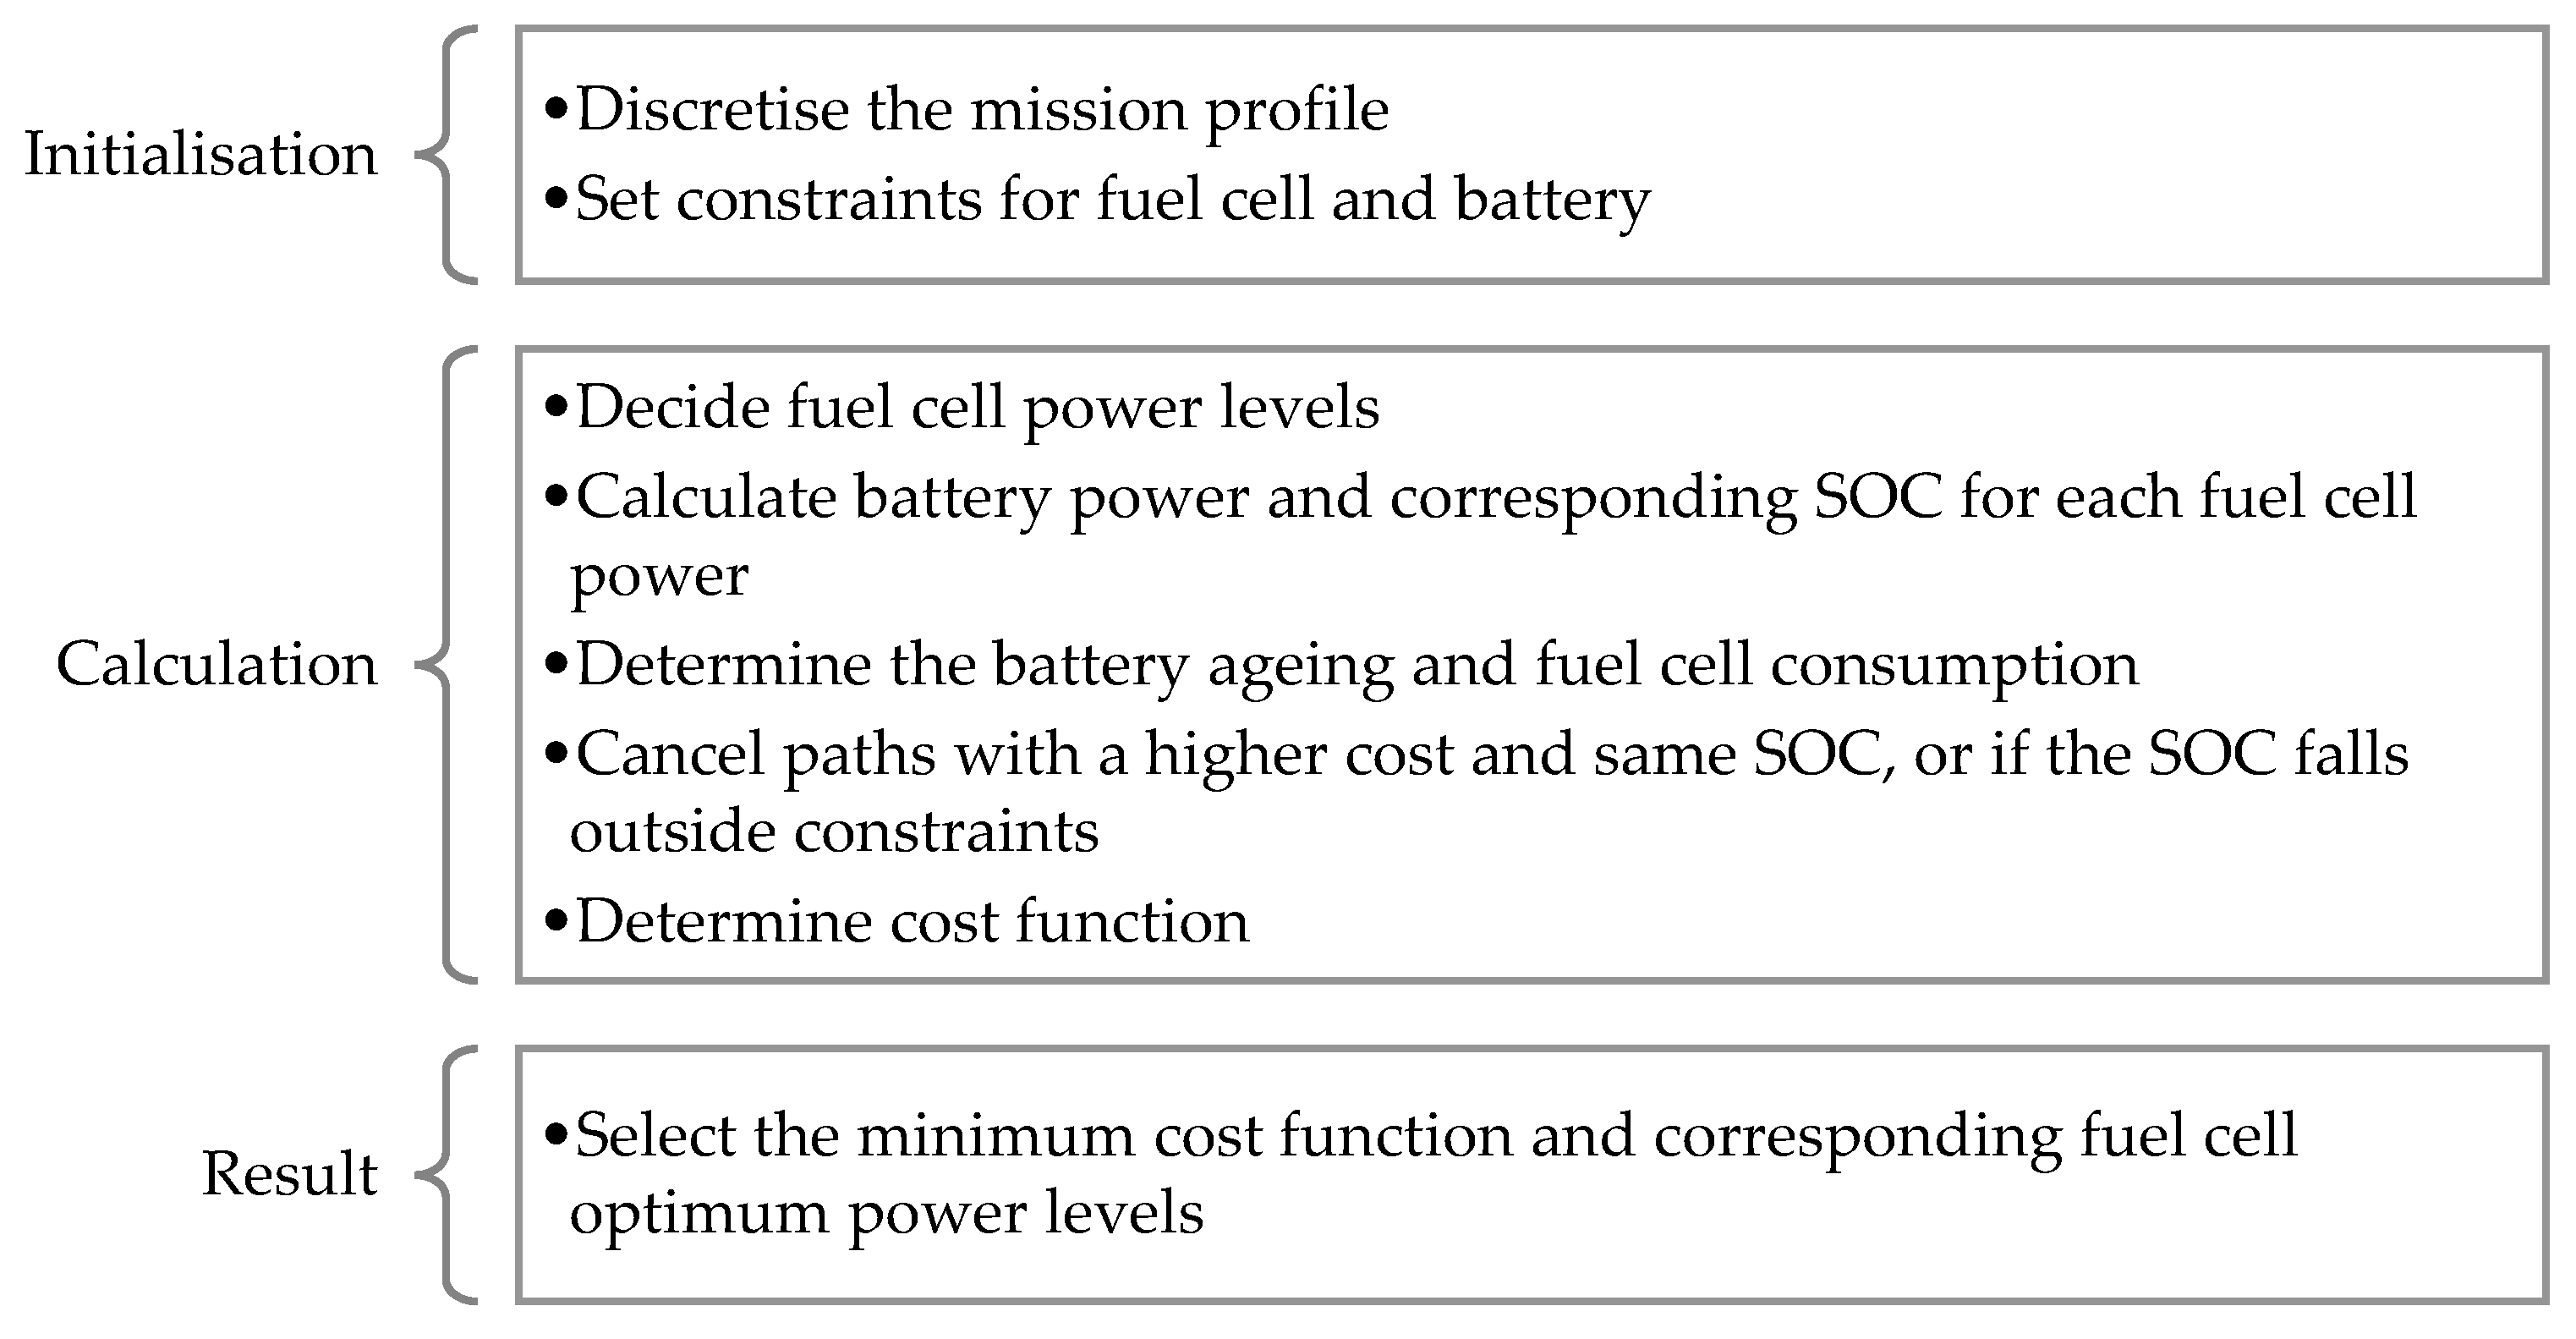
DP aims to find the optimum solution for the FC power, considering the battery ageing and SOC.
Figure 3 shows how the equations are applied within DP and the steps to finding the solution [
15].
The DP is implemented with the battery SOC discretised to 0.01% resolution and the FC power in 1 kW steps. The time horizon uses a 10 s sampling interval over the full mission profile. These discretisation levels were selected to balance computational efficiency with solution accuracy. The cost function is rounded to two decimal places at each stage. Only feasible DP states are evaluated: combinations where the total power deviates from the required load by more than 0.01 kW or where SOC falls below the minimum limit are skipped. This implementation ensures the DP solution respects load requirements, SOC constraints, and power limits throughout the mission.
From the discretisation of the FC power levels explored, the battery power can be calculated:
where
is the load requirement from the propulsion and low voltage system, taking into consideration losses, kW,
is the efficiency of the fuel cell PEC, %, and
is the efficiency of the battery PEC, %.
From this, the corresponding battery SOC is calculated by:
where
is the current value,
is the previous value,
is the time step, s, and
is the battery capacity, Ah.
Then, the cost function for DP is established by calculating the cost of hydrogen consumption and battery ageing.
For the total hydrogen consumption over time:
where
is the low heating value of hydrogen, kWh/kg, and
is the FC efficiency for the given power value
, %.
To calculate the battery cost (
), the equations found in [
16], which are based on experimental data, are used to determine the ageing equations:
where
is the battery power considered at the given time step, kW,
is the rated life cycle of the battery,
is the unit price of the battery, £/kg, and
is the weight price of hydrogen, £/kg.
Therefore, the overall cost function for DP is calculated using the cost at the previous time step plus the battery and FC consumption costs. This is given by:
where
is the cost at the previous step,
is the FC hydrogen consumption cost, and
is the battery ageing cost.
The minimum cost function overall after the final time step, which follows the constraints set, gives the optimum solution for DP. Hence, this solution requires prior knowledge of the mission profile to be applied as the EMS.
Dynamic Programming—ECSM
DP provides the optimal energy management solution under a known mission profile but is unsuitable for real-time operation as it cannot handle unexpected deviations or failures. To address this, in the proposed hybrid strategy, DP governs nominal operation to achieve optimal performance. When a failure or deviation from the planned mission is detected, the system simultaneously reconfigures and switches to the ECMS, which provides real-time adaptability and ensures continued operation under abnormal conditions. This approach combines offline optimality during normal operation with online implementation during failures through a clearly defined switching procedure.
4. Software-in-the-Loop Setup
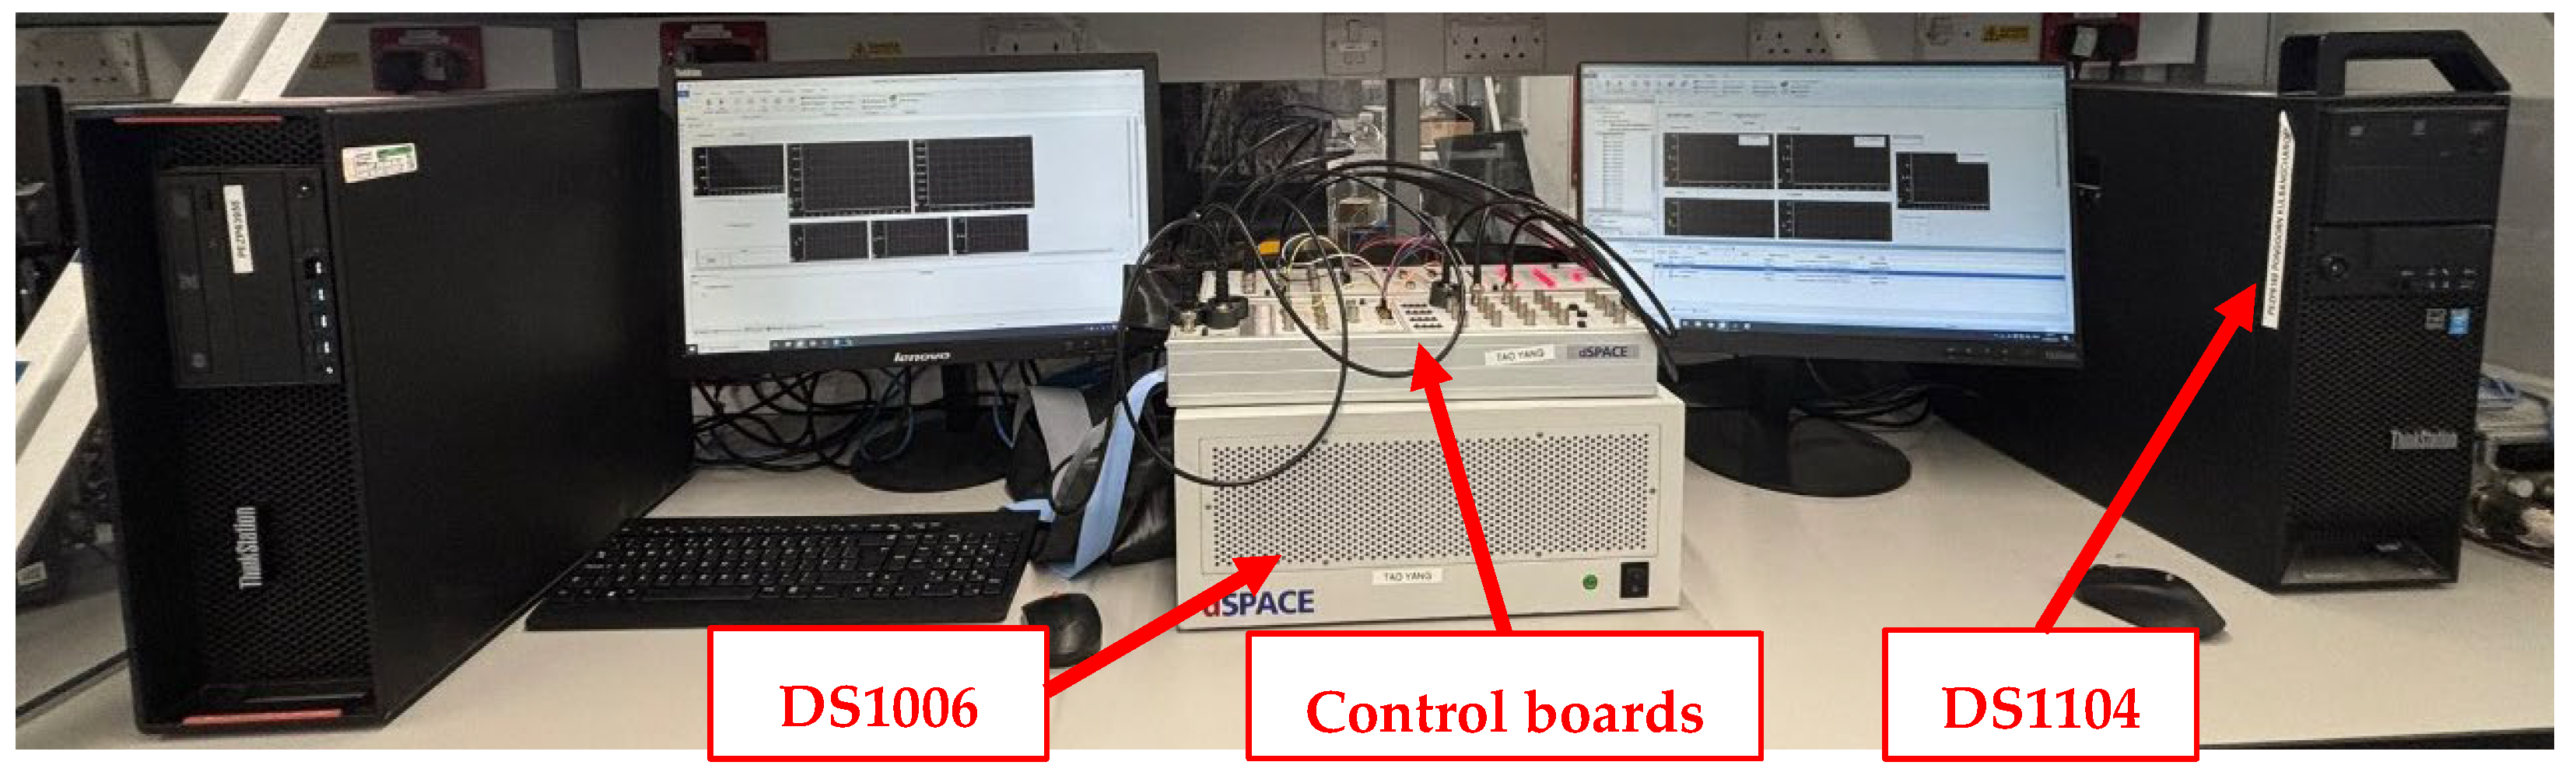
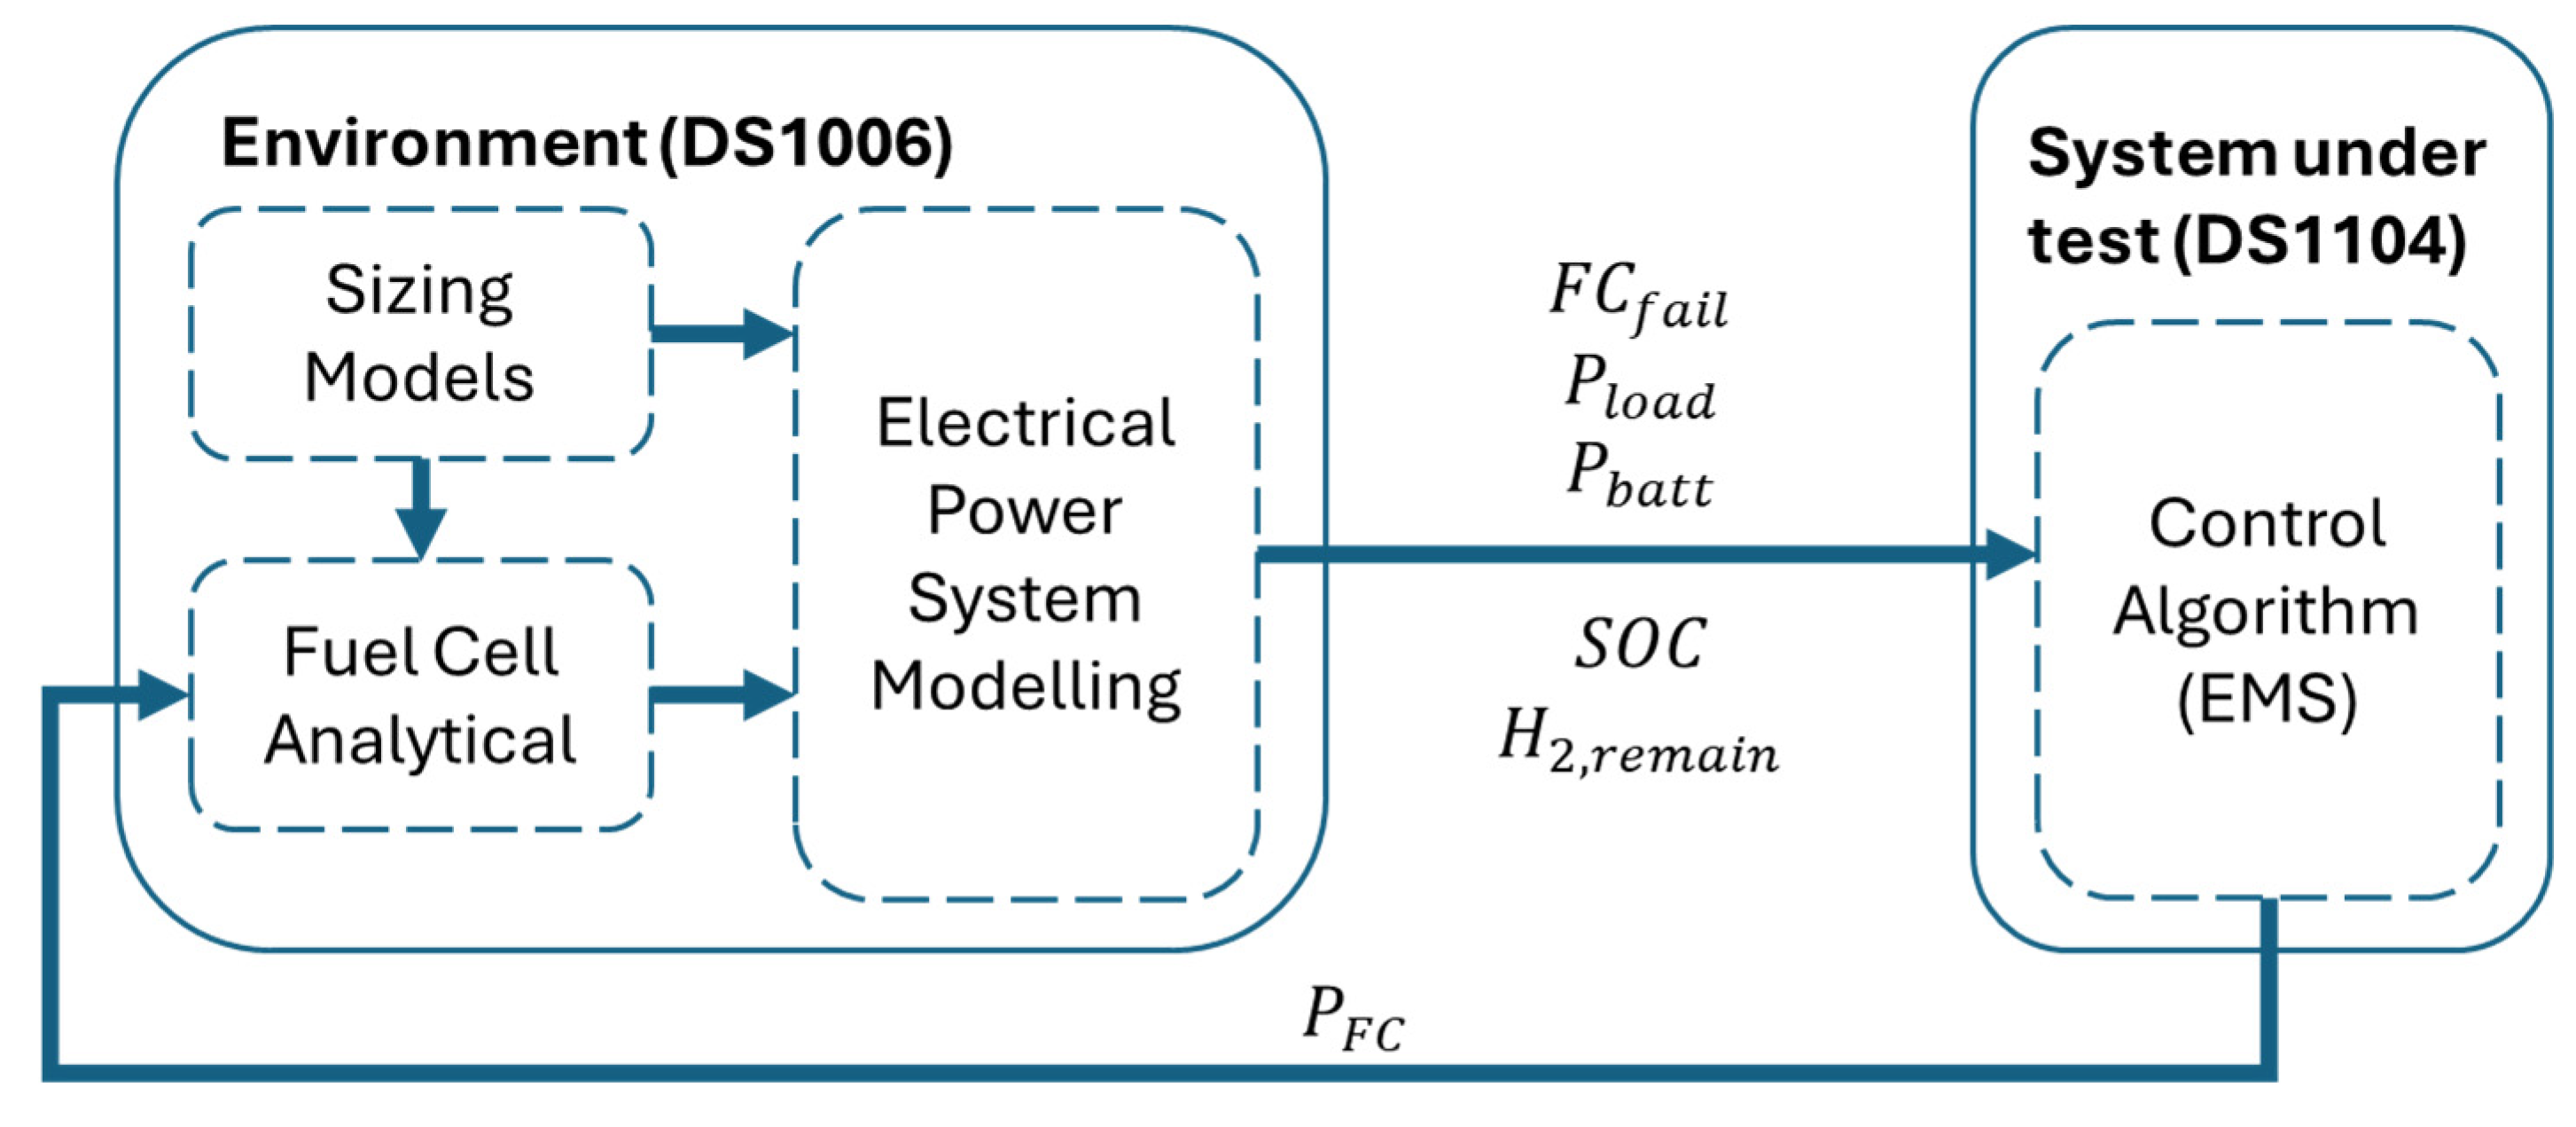
The EMSs have been validated using a SIL setup in dSPACE ControlDesk 2022-B, which takes it beyond a purely simulated system in one computer. This ensures that the control code can operate in real-time. This setup used one dSPACE system (DS1006) for the electrical propulsion system and a separate dSPACE system (DS1104) for the EMS, with the two interlinked only through digital and analogue signals, as illustrated in
Figure 4.
SIL for validation ensures that the supervisory control performs as intended, following the same patterns as simulation results, but adjusted to act in real-time. For this, the control code is compiled into C to replicate the target environment for implementation, and the compilation ensures consistent behaviour across different solvers. The simulation step size of 0.02 s and EMS step time of 0.5 s are selected to balance numerical accuracy and computational speed, thereby ensuring compatibility with real-time simulation on the dSPACE platform. Execution time measurements and jitter analysis were not performed; real-time feasibility is inferred from EMS step time and SIL execution rather than verified through timing analysis.
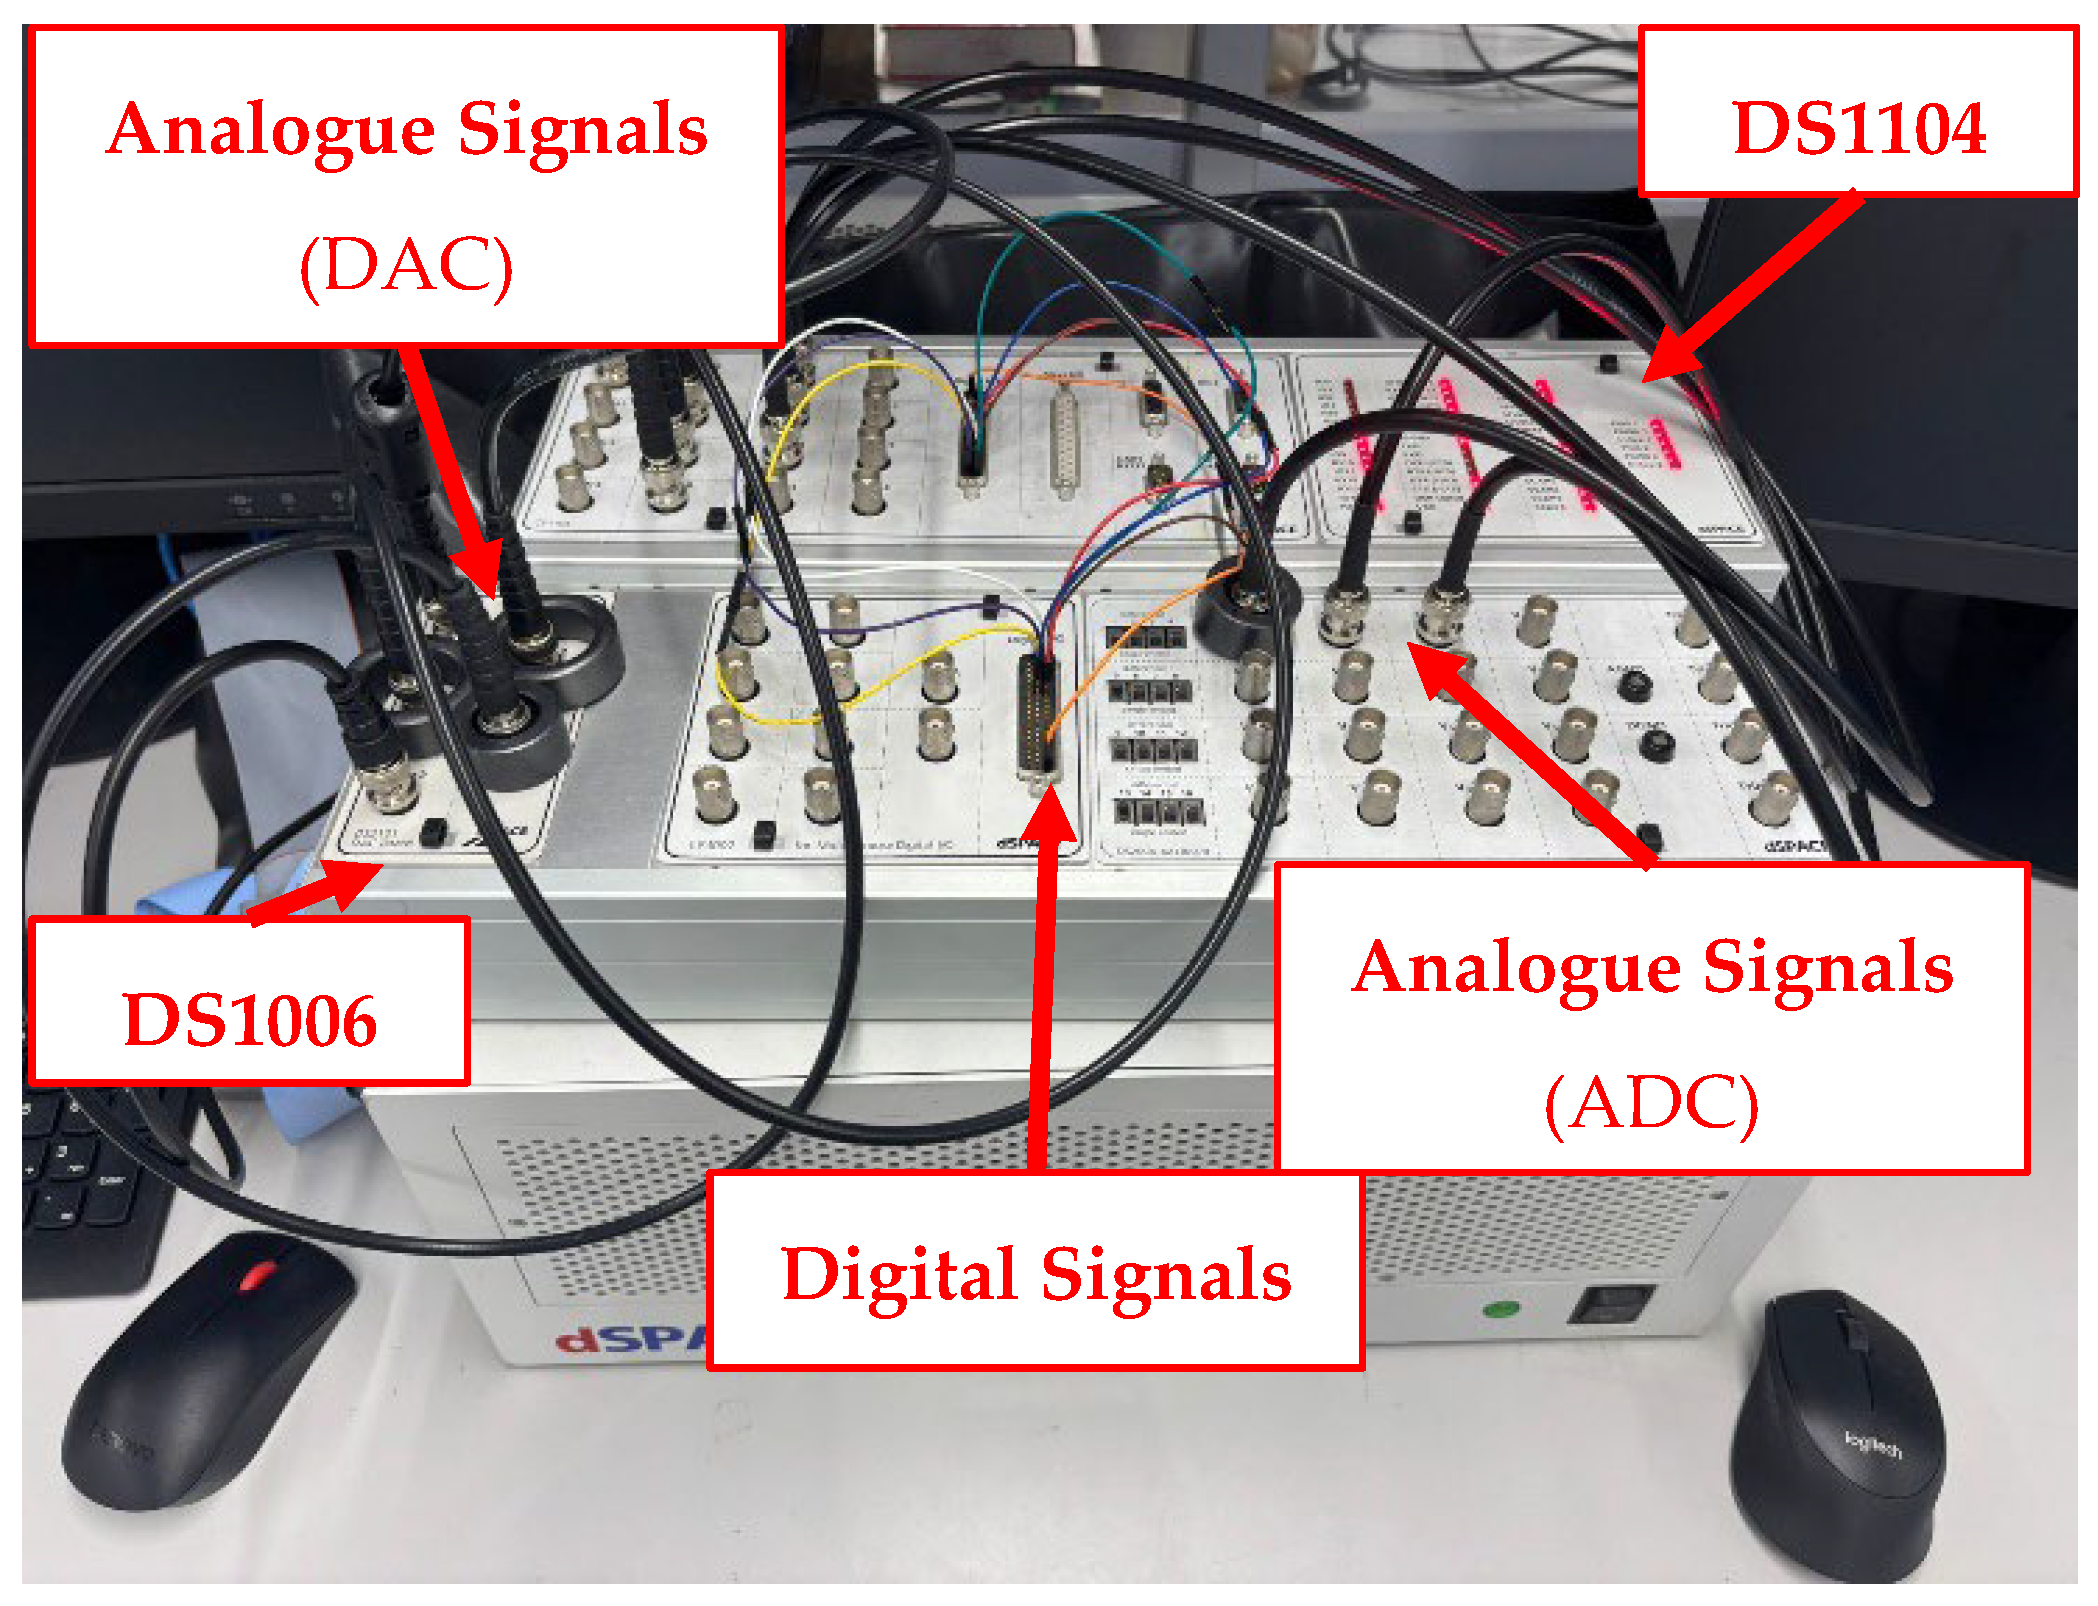
Figure 5 shows the dSPACE setup, with the DS1106 in the middle of the figure connected to the computer on the left-hand-side which runs the electrical power system. On the right-hand side, the DS1104 is implemented into the computer for the EMS. The control boards are located on top of the DS1106.
These control boards, shown in
Figure 6, connect the two DSPACE via digital and analogue signals.
This dSPACE-based SIL setup is used to validate the functional implementation of the EMS by comparing its behaviour against MATLAB/Simulink R2023b simulation results. The SIL environment enables execution of the compiled control code at a fixed real-time step, allowing verification of correct logic execution and transient response under representative operating conditions. Across all evaluated scenarios, the SIL results show close agreement with the corresponding MATLAB/Simulink simulations, indicating consistent functional behaviour between offline and real-time execution. As no significant discrepancies were observed, only the MATLAB/Simulink simulation results are reported in the following sections for conciseness.
5. Results
The three EMSs explored in
Section 3 (state machine, ECMS, and DP) are validated using the SIL implementation explained in
Section 4. Then, the three EMSs are compared across different mission profiles displayed in
Figure 2. This comparison involves the FC power output, battery SOC, hydrogen consumption, and battery ageing. These outputs are shown on the graph, which represents half-wing values unless stated otherwise. For example, the hydrogen consumed represents one FC, and due to symmetry, can be doubled to get the overall fuel consumption.
Within this section, the SOC constraints are enforced differently across the EMSs. The DP and ECMS strictly always enforce hard SOC limits, ensuring that the battery SOC remains within operational constraints. The state machine, however, slightly exceeds SOC limits in some cases. Therefore, comparative results are reported with this distinction in mind, as apparent advantages for the state machine may partially reflect minor SOC violations rather than improvements in energy management. Furthermore, the EMSs require different parameters for modelling, which are highlighted in
Table 2, with parameters such as the ECMS weighting factor using a preset value. These parameters are required for reproducible results and are consistent across all mission profiles. Where multiple values are available, the lower value is the adaptation for failure modes. The parameters for the battery ageing model across all EMS follow the approach in [
16] using constant preset values from experimental data used a comparison of EMS performance.
5.1. Typical Mission
The typical mission follows the profile shown in
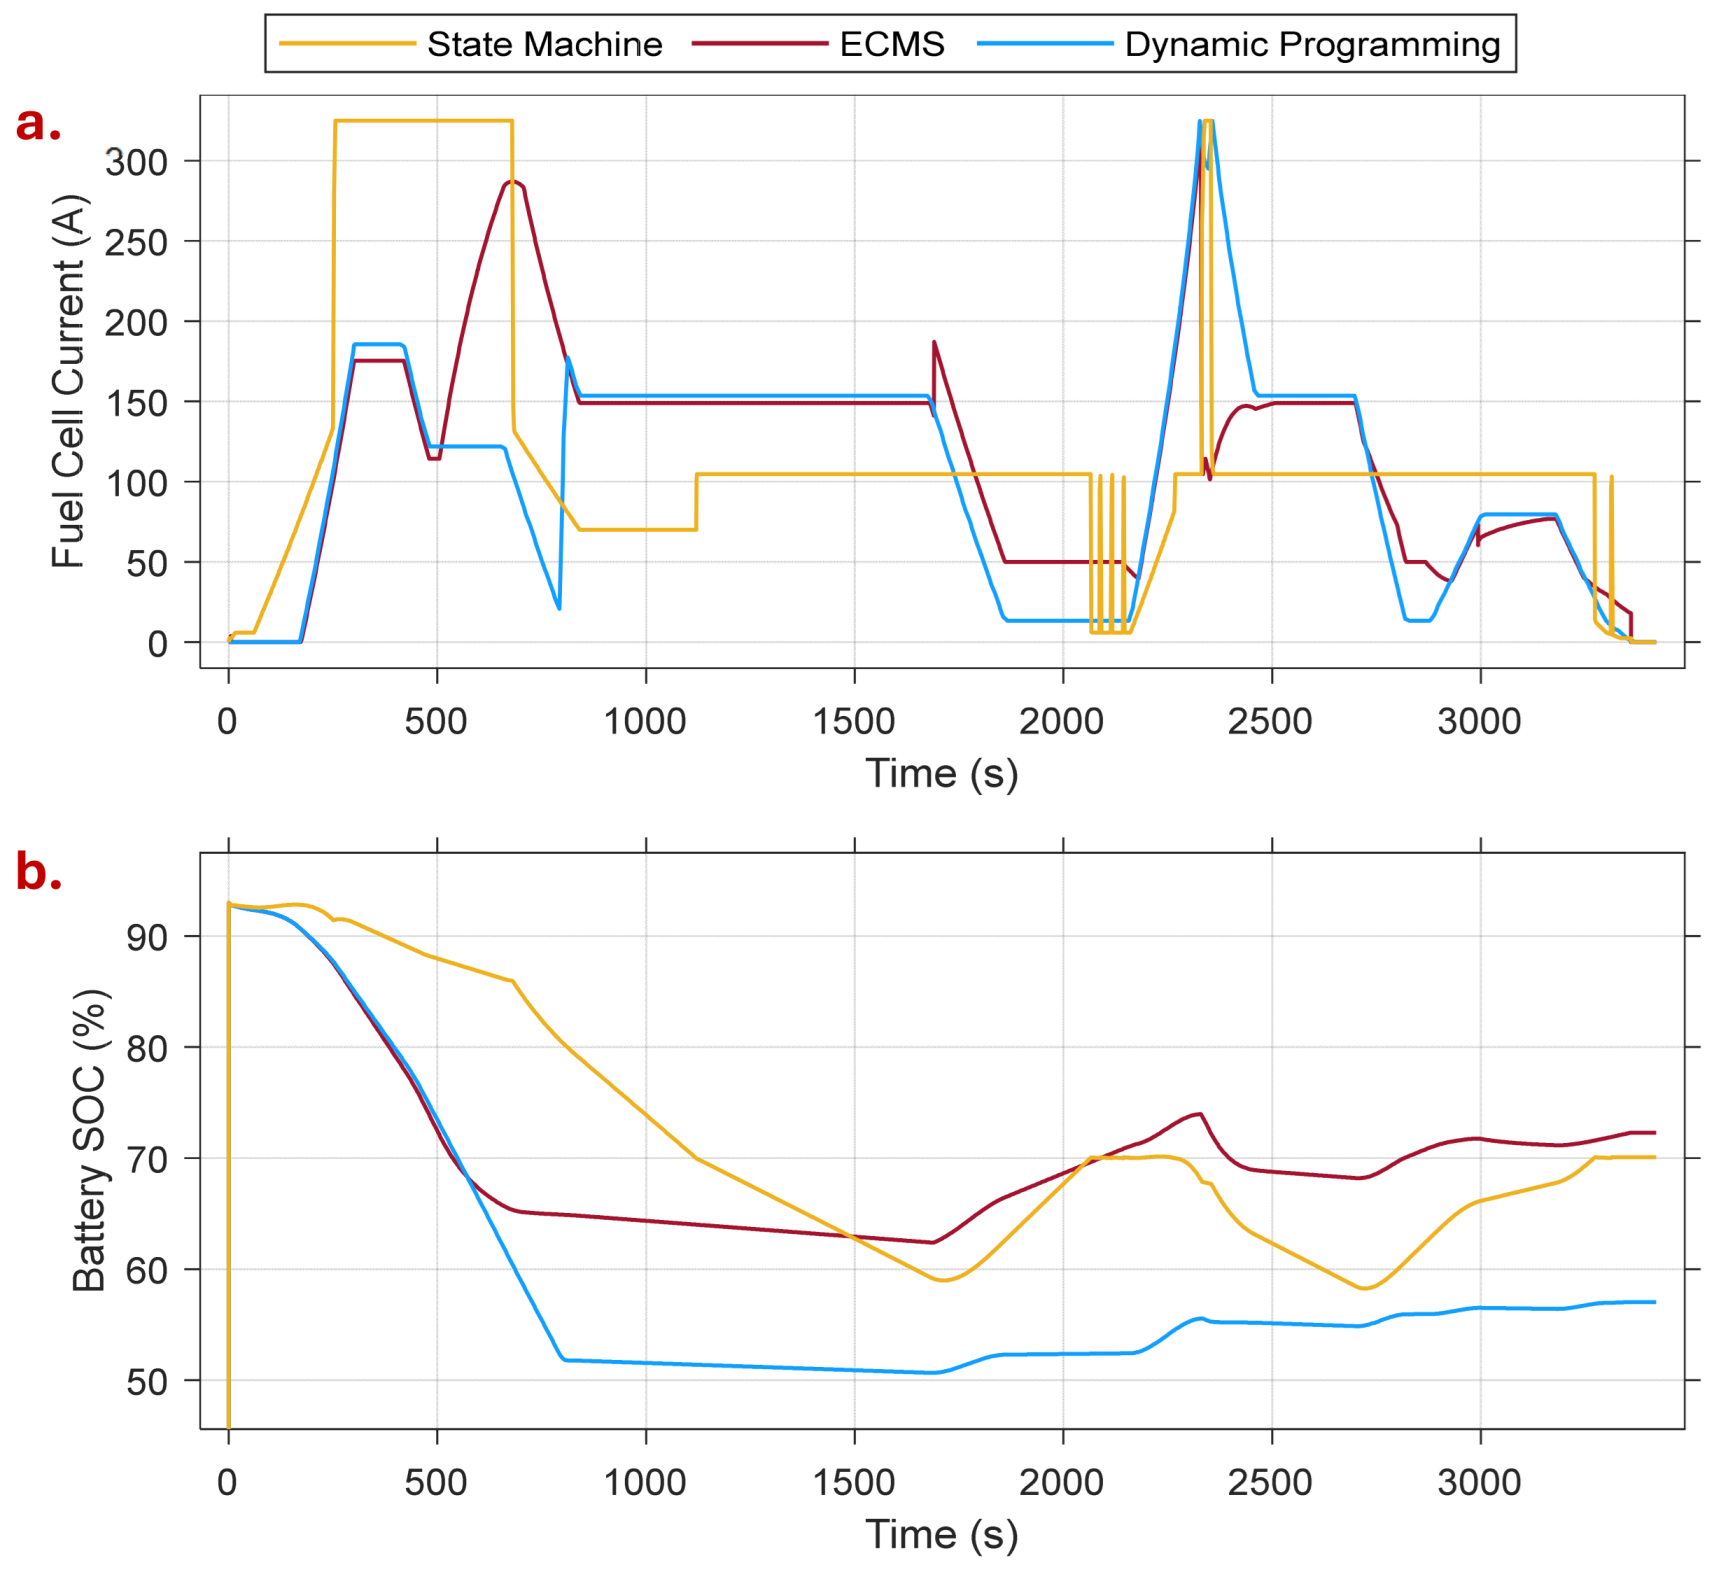
Figure 7, comparing how each EMS responds to power demands and battery energy decline. The battery and FC work together to power the propulsion and secondary systems.
Figure 7a compares the FC currents for the three EMSs, showing how each strategy results in different behaviours throughout the mission. Initially, the state machine draws higher FC current and power than the other strategies. Therefore, the battery SOC in
Figure 7b reflects this, with the energy declining from the battery at a slower rate. At 650 s, DP draws less current from the FC and relies on battery energy more than the state machine or ECMS. Also, at 2100 s in
Figure 7a, the state machine controller exhibits chattering in the FC current, characterised by rapid switching between discrete states. This behaviour occurs because the optimised FC power level draws energy from the battery, leading to a decline in SOC and triggering a transition to a higher FC power state. The increased FC power then raises the SOC, causing the controller to switch back to a lower-power state. This feedback loop results in frequent state transitions, causing the chattering seen within the figure. This is a known drawback of state-machine control and is highly dependent on the mission profile. Overall, these figures show that the greater the FC current, the higher the battery SOC remains. As DP has the lowest levels of FC current overall, the battery SOC declines to the lowest value, meaning that this strategy uses the battery energy.
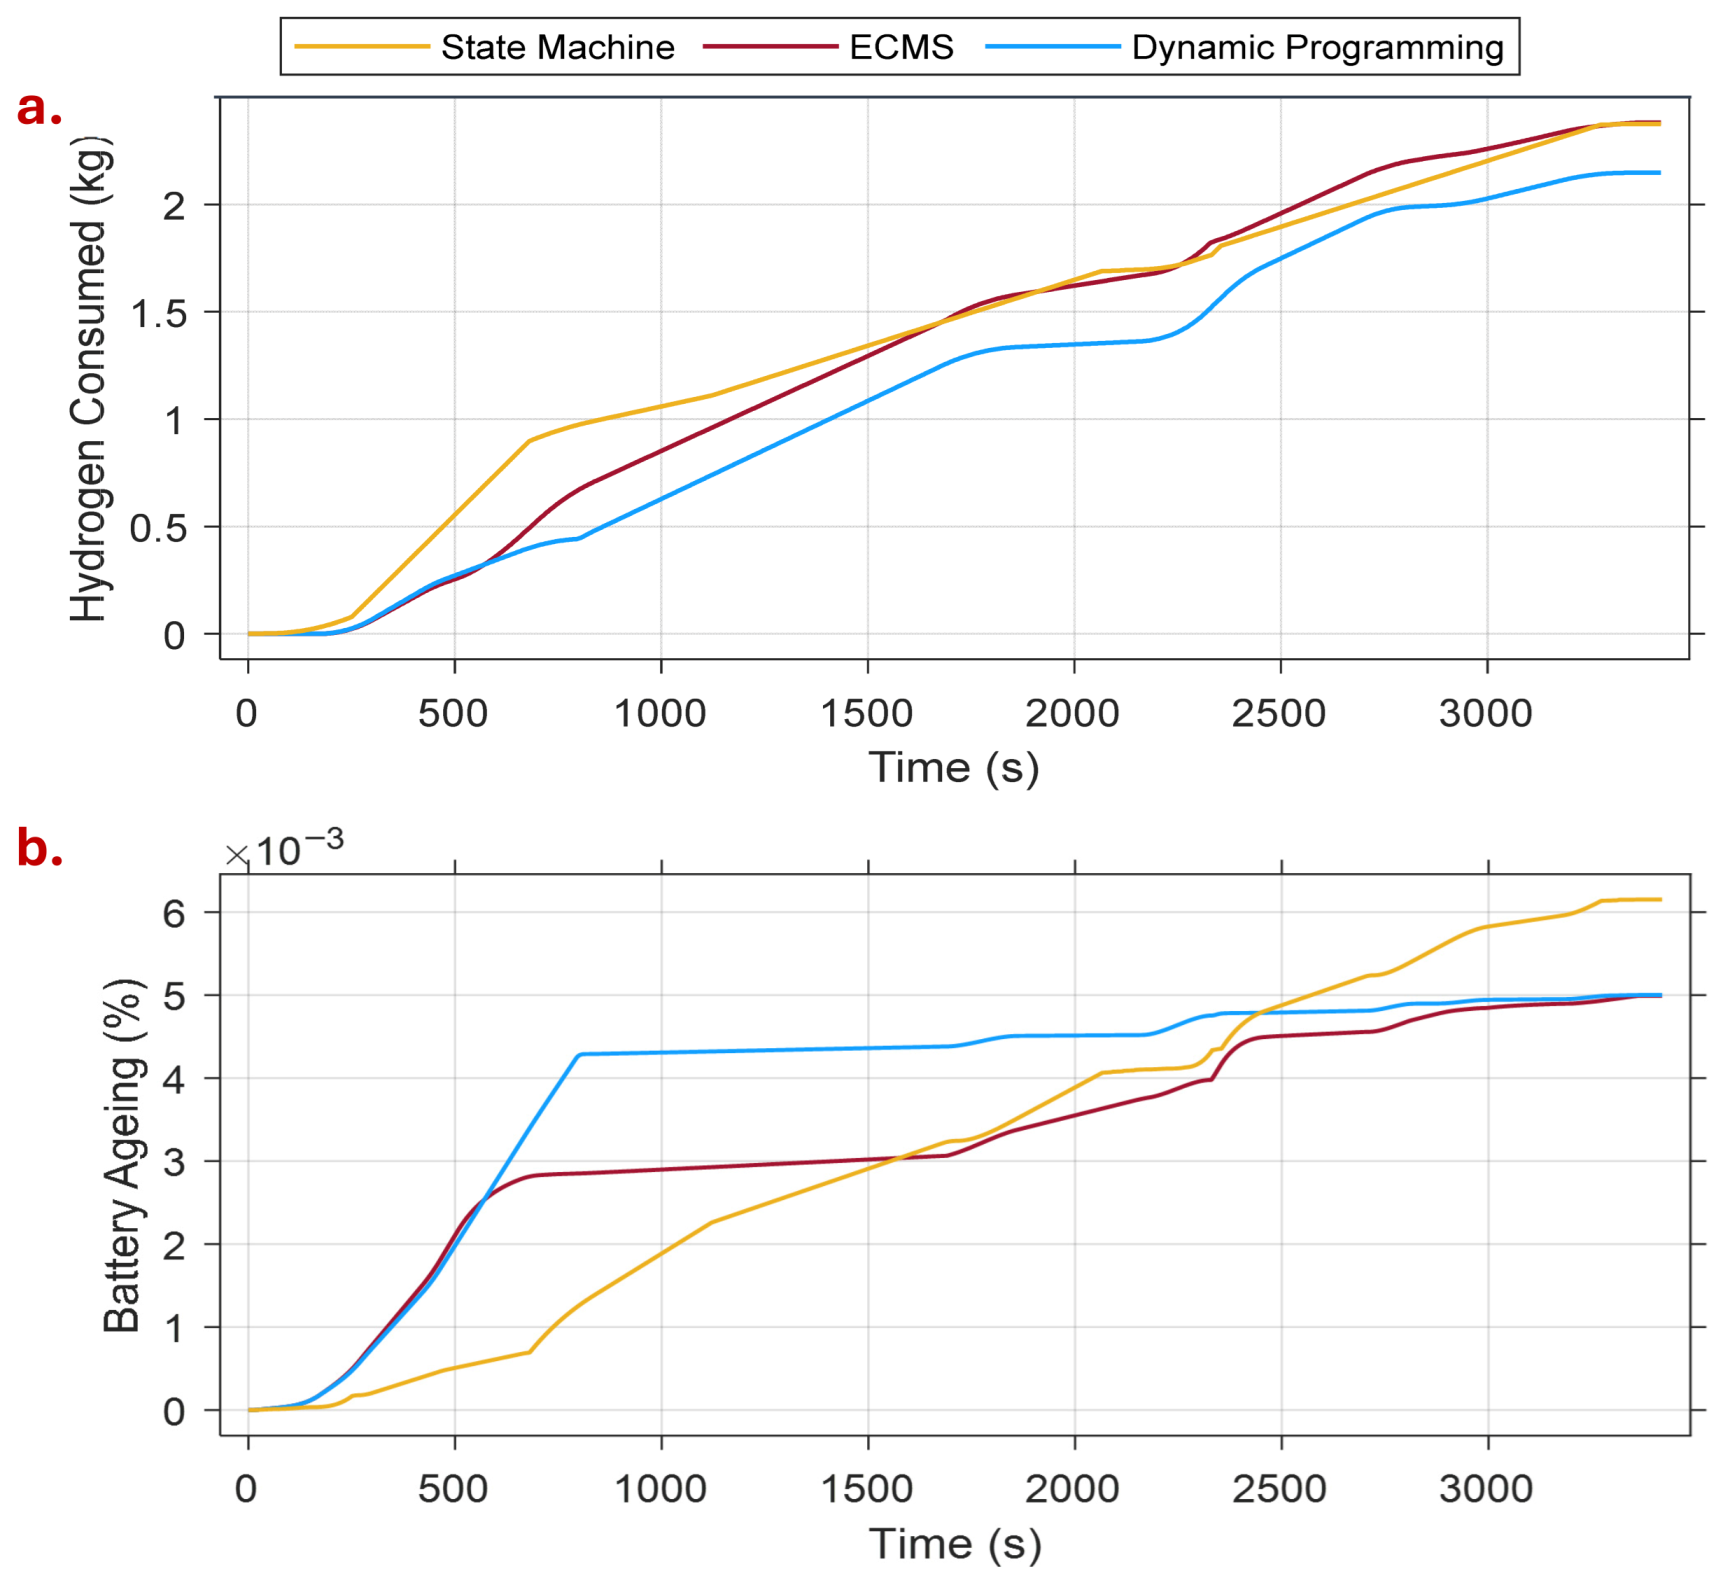
Figure 8 compares the hydrogen consumption and battery ageing for the typical mission profile.
Figure 8a shows that the DP strategy achieves the lowest hydrogen consumption, which corresponds to the deeper battery depletion observed in
Figure 7b. The ECMS and the state machine consume similar amounts of hydrogen; however, due to the lower FC current at 2400 s, the state machine leads to increased battery ageing, as shown in
Figure 8b. Also, for the state machine, the chattering of the FC current around 2100 s in
Figure 7a, increases the battery ageing because of constantly changing power demands. Hence, the frequent switching between discrete states often makes the state machine seem suboptimal compared to ECMS and DP.
The final states are highlighted in
Table 3. It shows that the more battery energy used, shown via the lowest battery SOC, the less hydrogen consumed. The state machine outperforms the ECMS, has a lower battery SOC, and lowers the hydrogen consumed but has higher battery ageing. DP has the lowest battery SOC, the lowest hydrogen consumed, and low battery ageing.
5.2. Prolonged Cruise Mission
The prolonged cruise mission follows the profile shown in
Figure 2. This allows for exploration of scenarios where the overall energy requirement is higher.
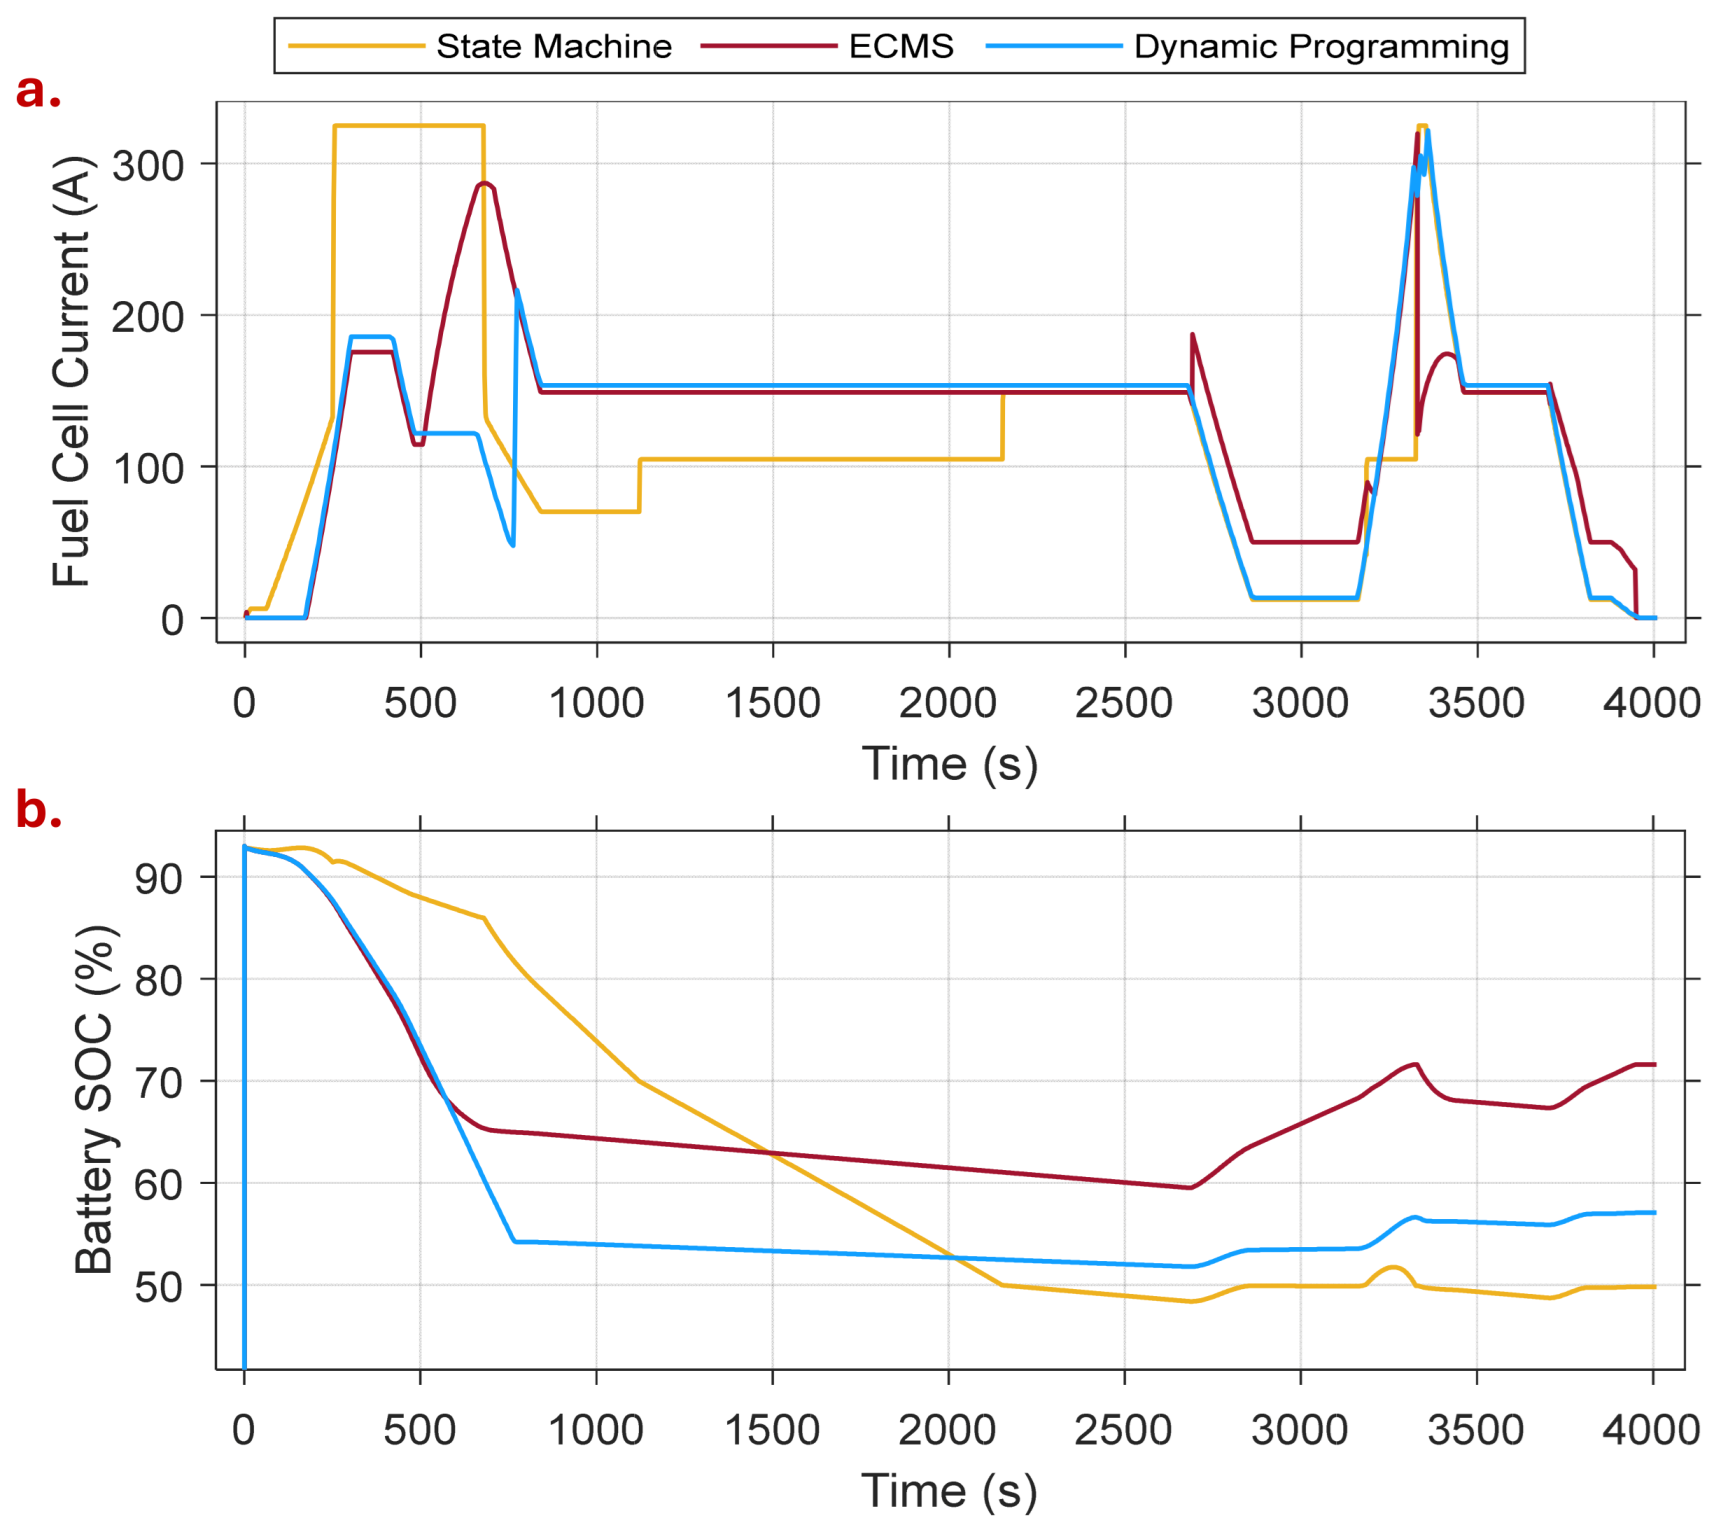
Figure 9a shows the FC current, and
Figure 9b shows the battery SOC for the prolonged cruise mission for the three EMSs. DP and ECMS initially rely on battery power, so the FC current is low, whereas the state machine relies on the FC, so the current is high. Therefore, the battery SOC declines initially for DP and ECMS, while the SOC for the state machine remains higher.
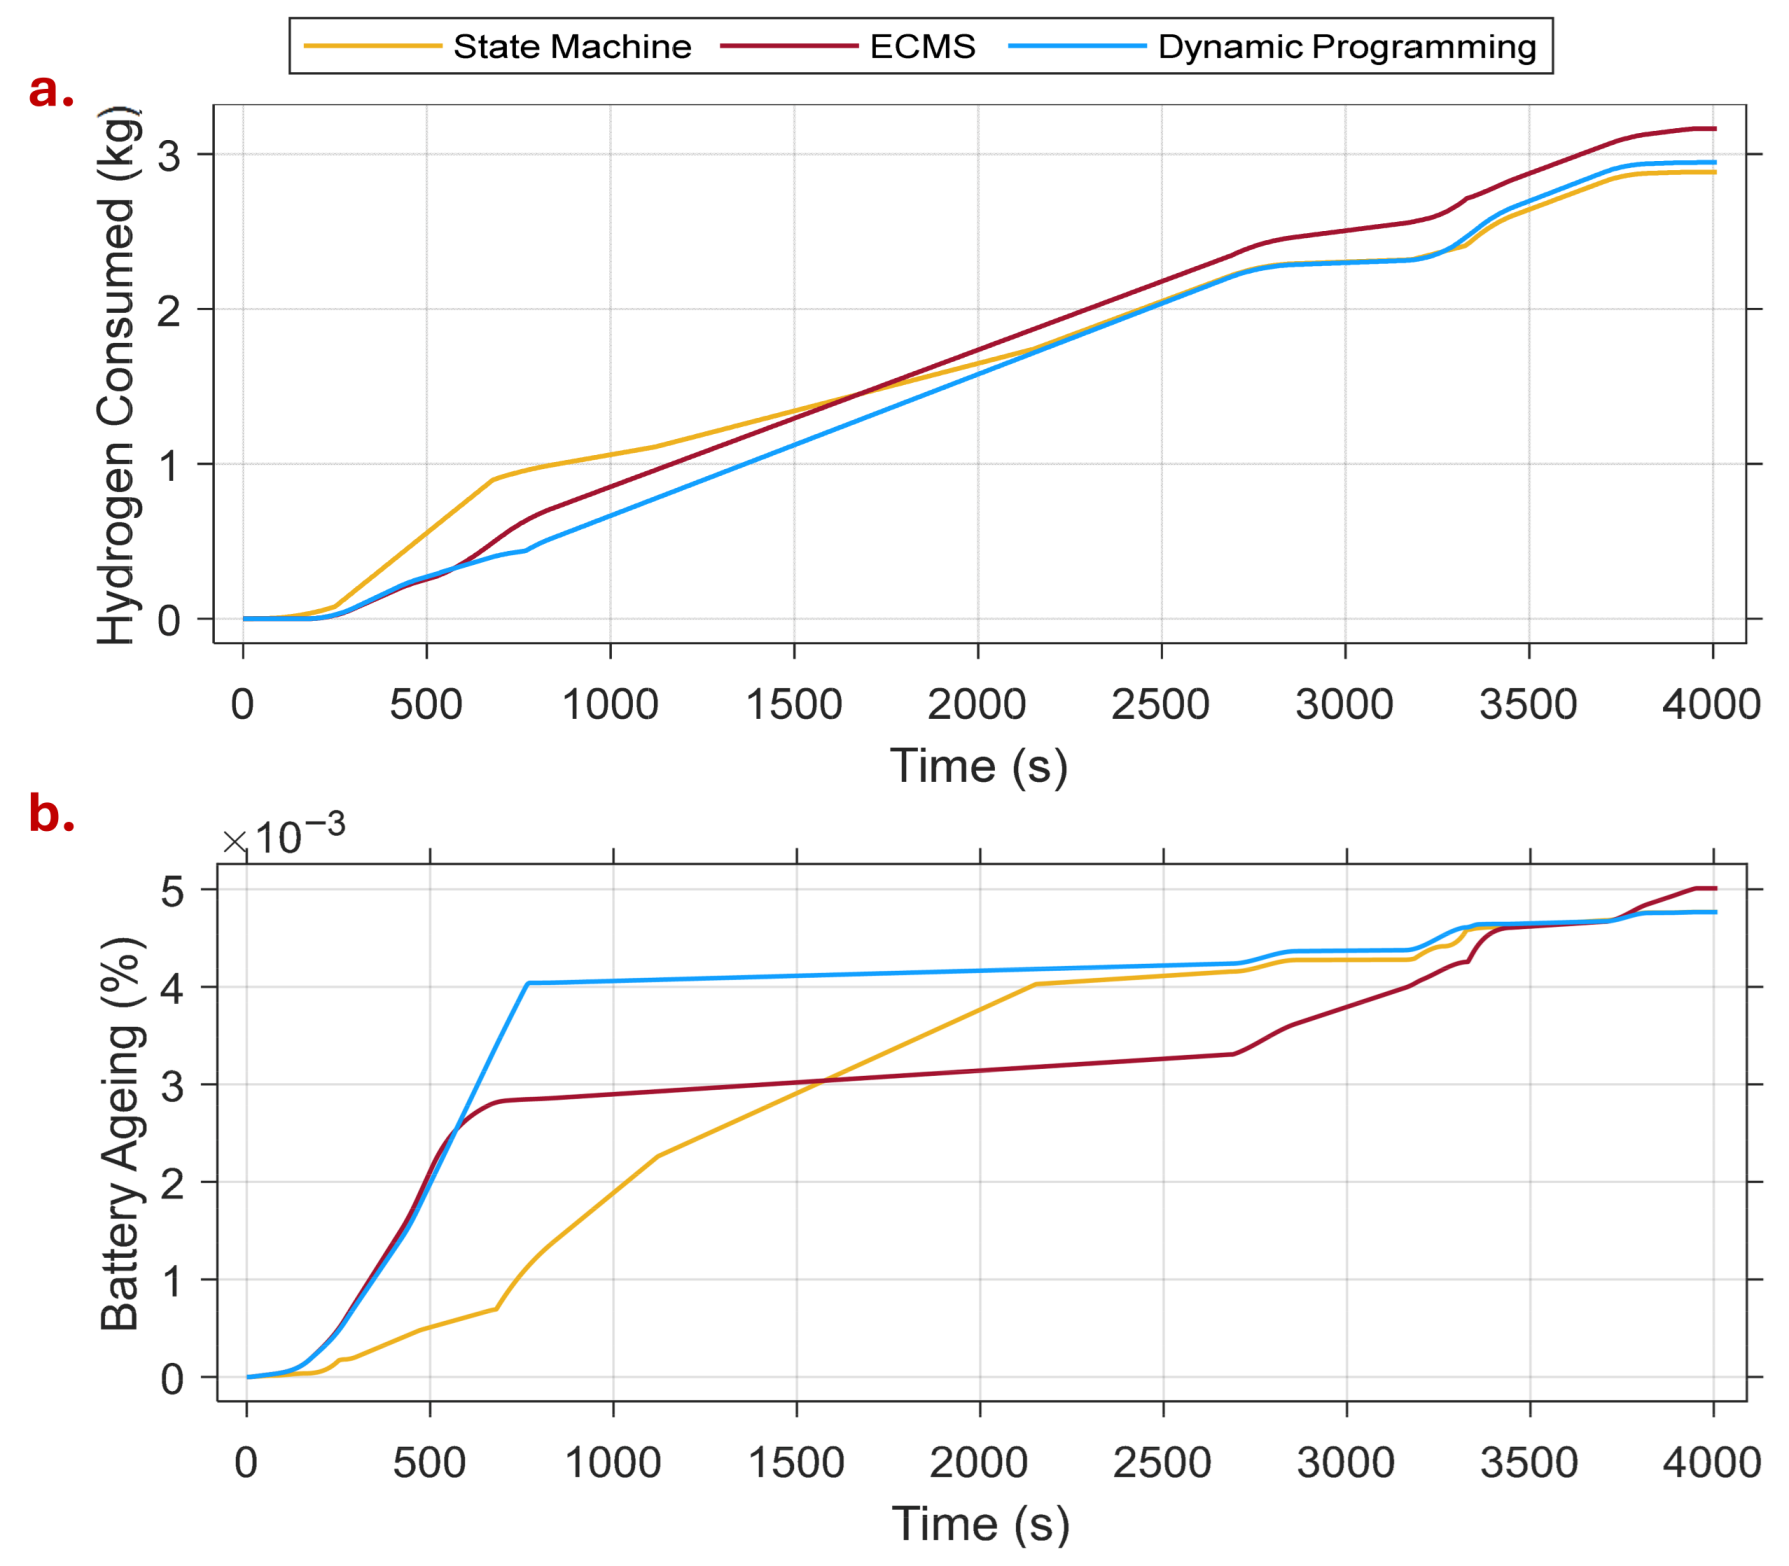
Figure 10a shows the hydrogen consumption, and
Figure 10b shows battery ageing for the prolonged cruise mission. Within
Figure 10a, DP shows reduced hydrogen consumption in comparison to the state machine and ECMS. This corresponds to the decreased battery SOC usage in
Figure 9b. Therefore, at 600 s, the battery SOC declines for the DP, while the ECMS remains more constant. This causes increased battery ageing for DP, as shown in
Figure 10b. However, for the overall battery ageing, the ECMS degrades the battery more than the DP due to constantly changing the battery power demands from 2650 s onwards, with DP having smoother transitions.
The final states for this mission profile are displayed in
Table 4. The state machine performs best with hydrogen consumption, but overspends battery energy, declining below the minimum SOC of 50%. The DP and ECMS respect the constraints. Therefore, the DP performs best with low hydrogen consumption, battery SOC, and battery ageing.
5.3. Failure Mode
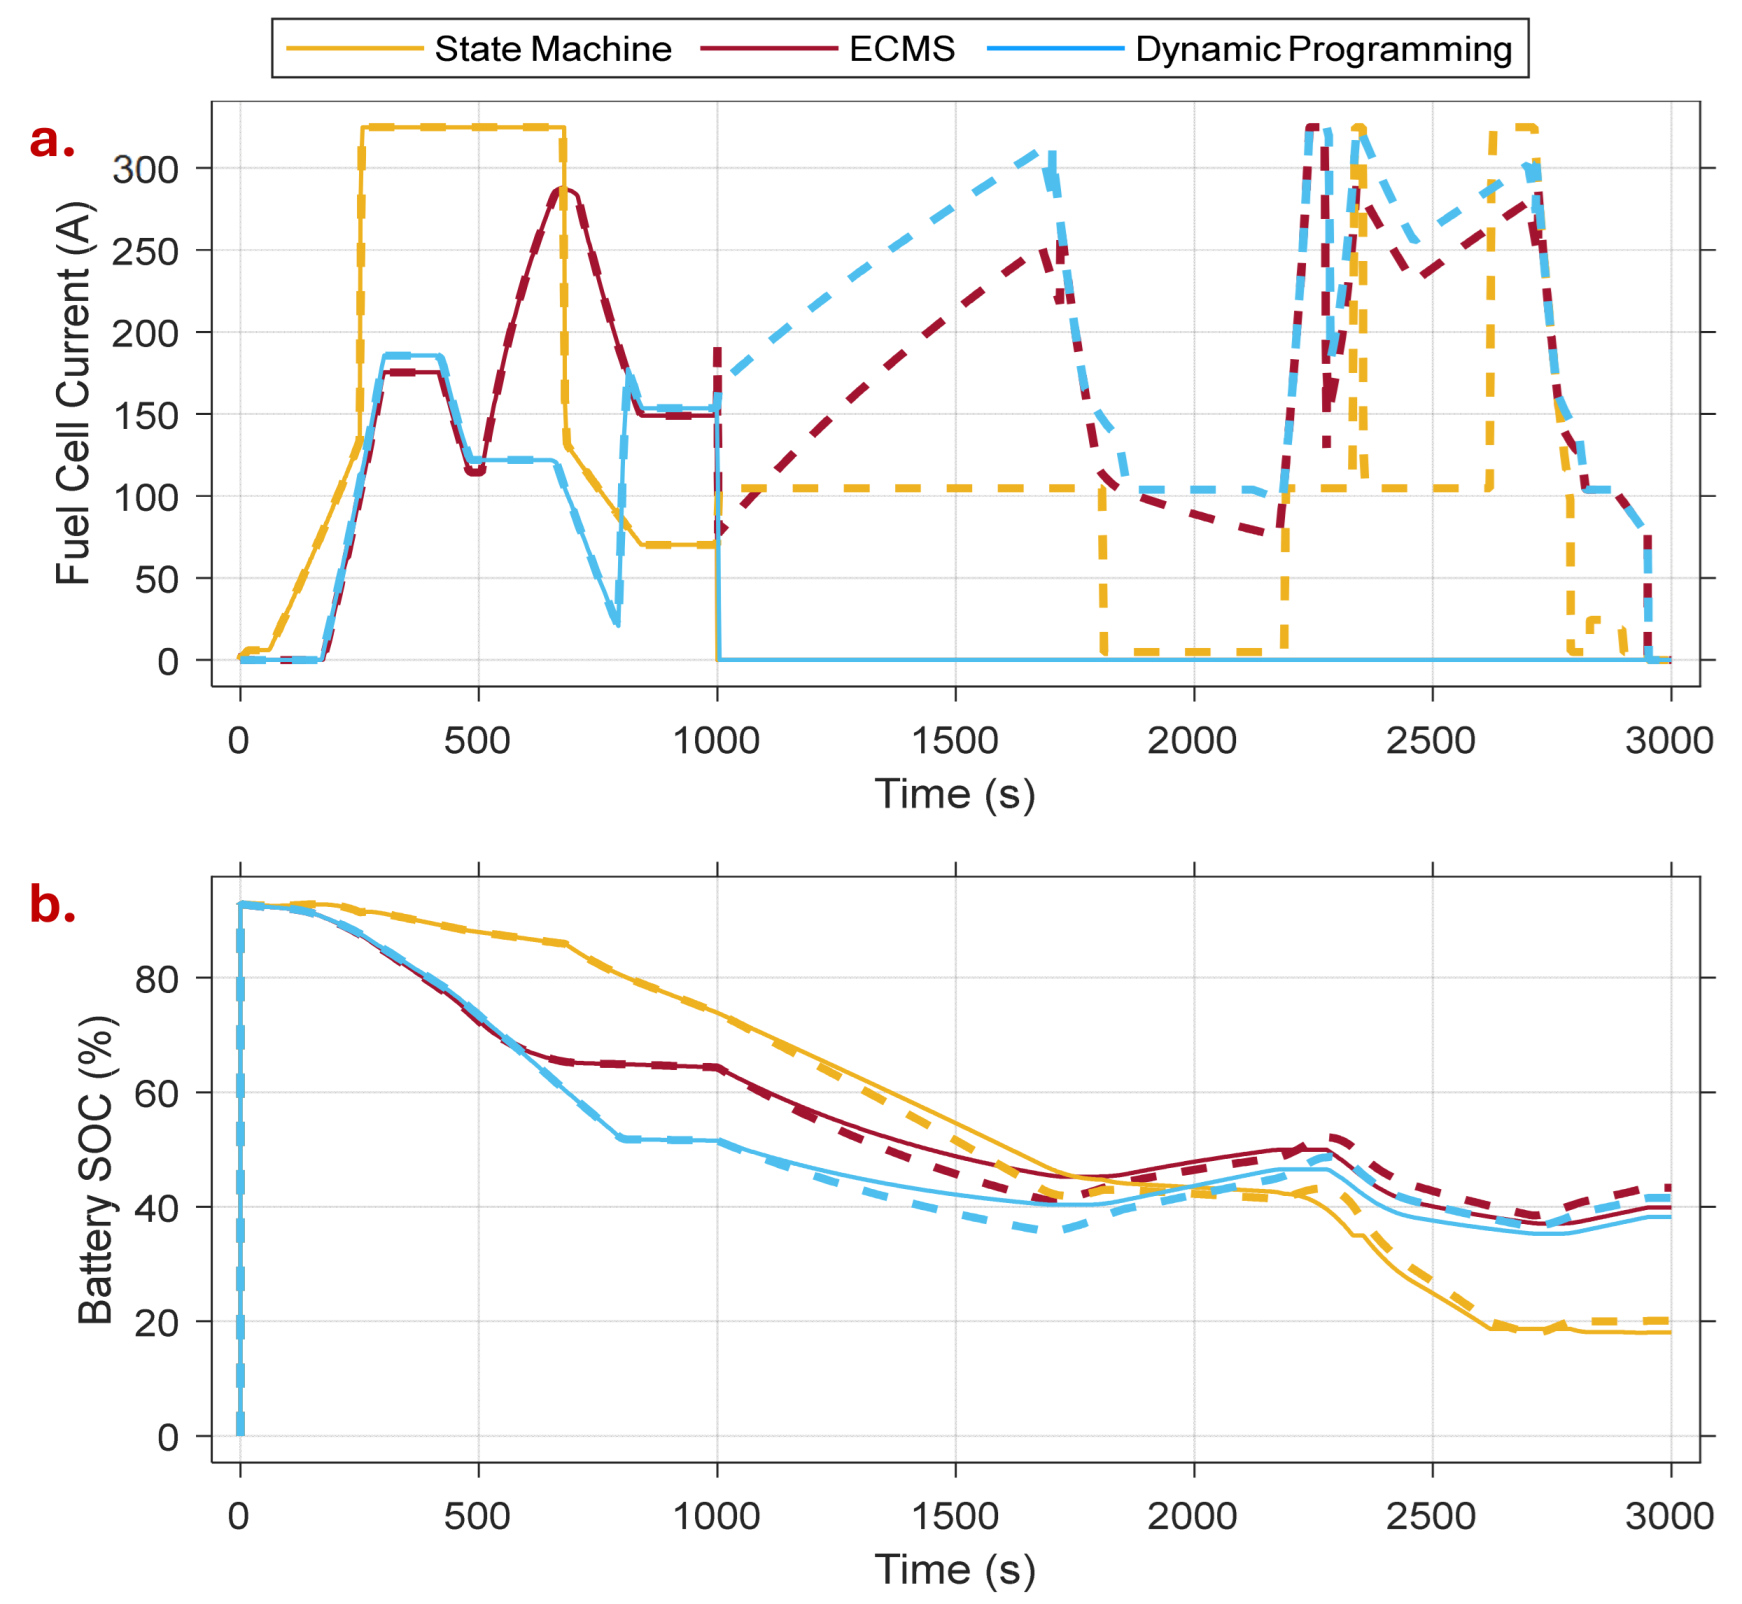
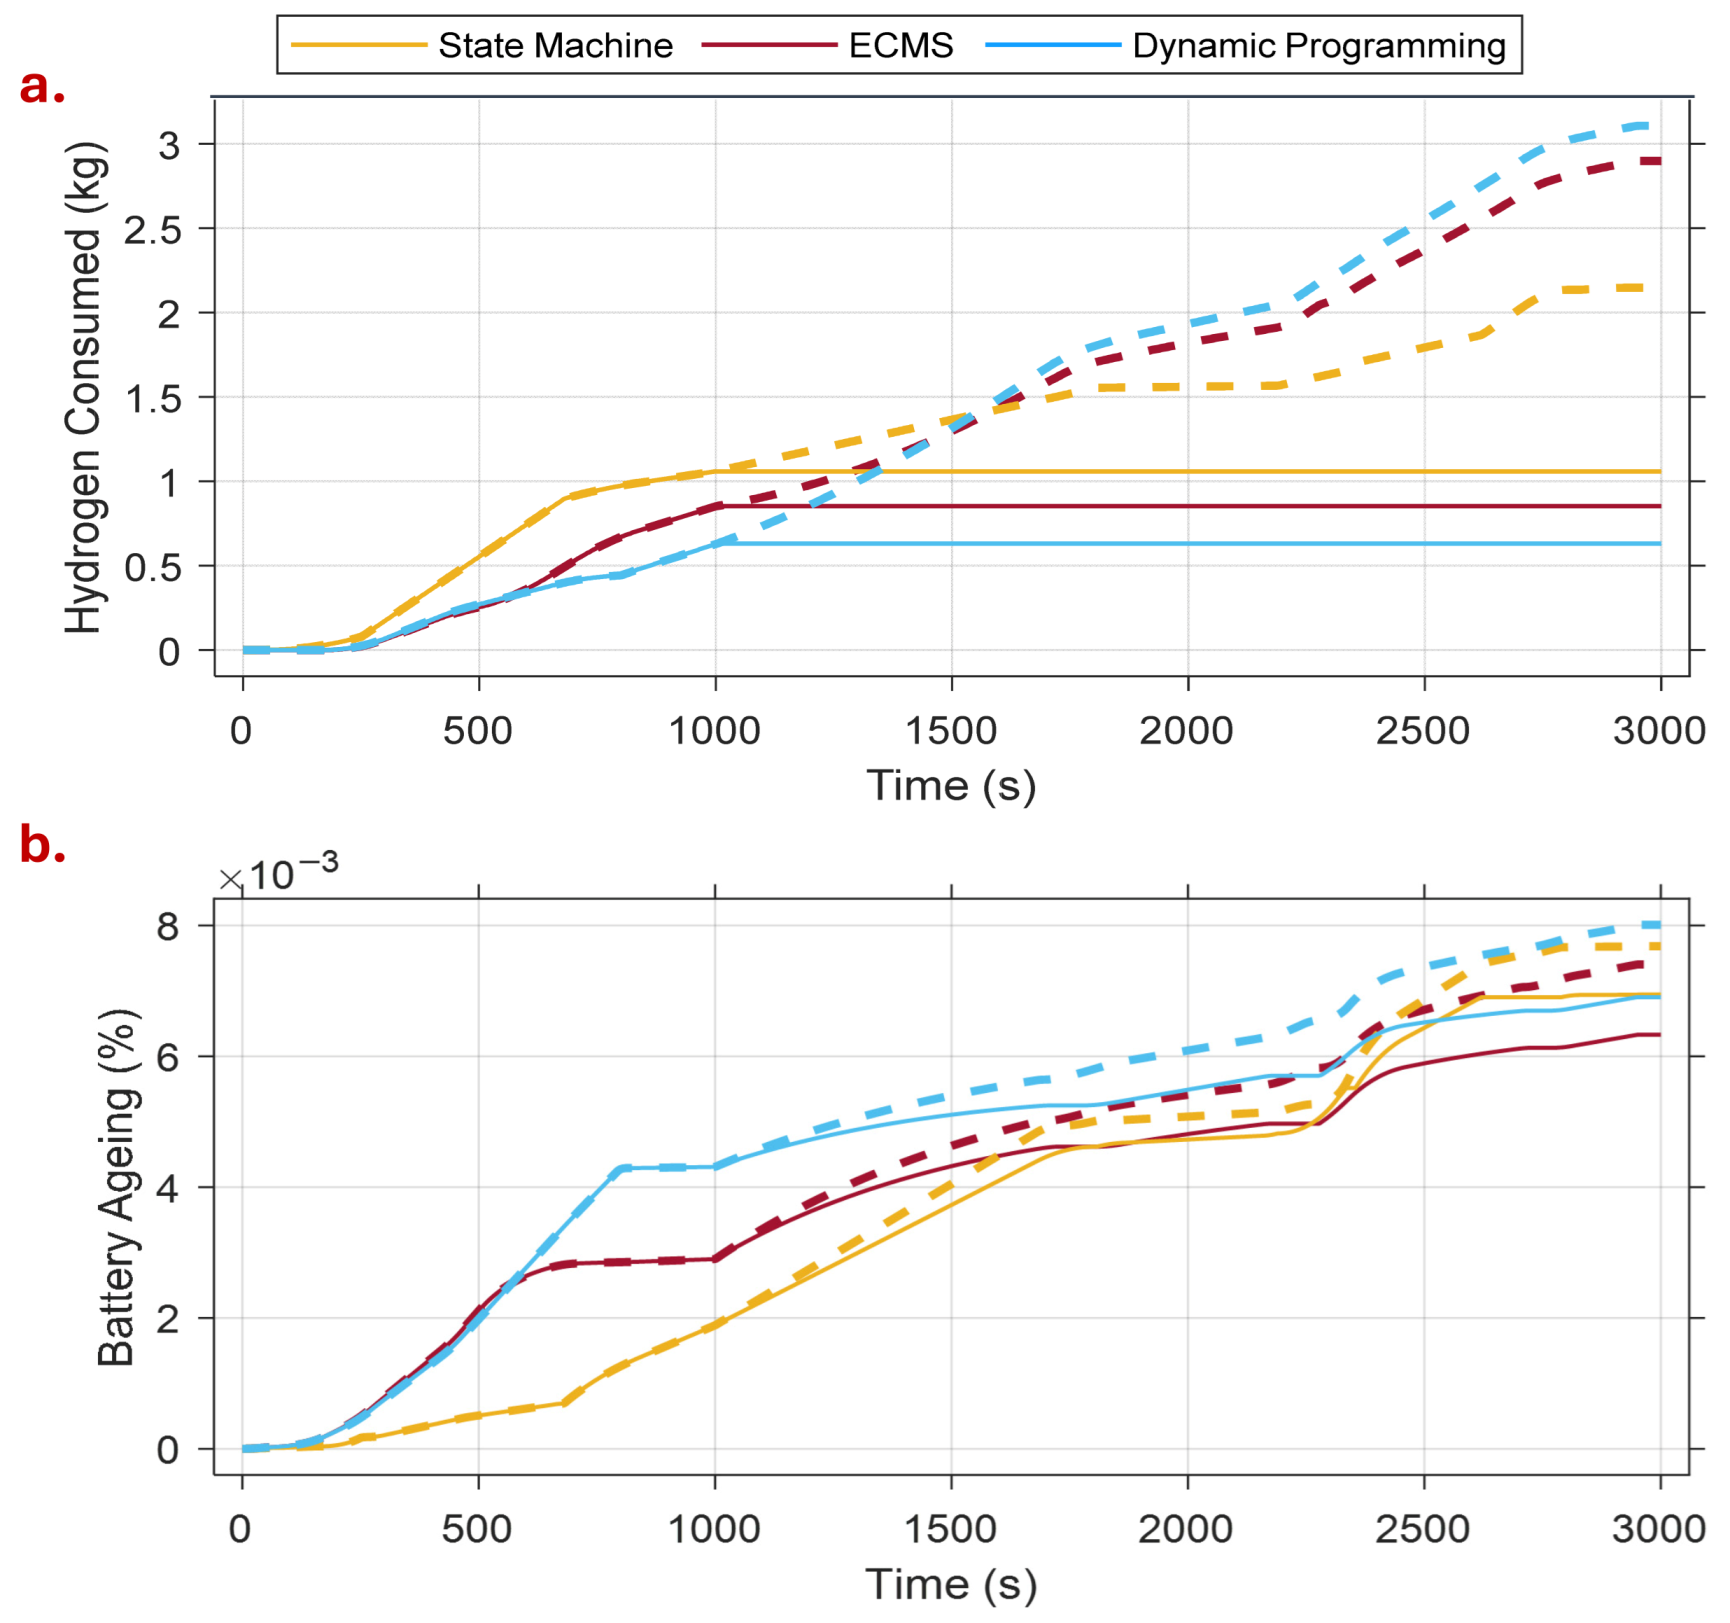
Within this section, the two electrical systems are represented on the graphs. The solid lines represent system one, where the failure occurs, whereas the dashed lines represent the second electrical system without a failure.
This subsection evaluated the performance of the three EMSs for the mission profile with a failure mode as shown in
Figure 2. As discussed in
Section 2, system reconfiguration occurs following an FC system failure at 1000 s. During reconfiguration, one battery controller transitions from voltage to current control, leading to small differences in battery power. These differences result in deviations in the state of charge (SOC) and battery ageing between the two batteries.
To enable real-time implementation for all EMSs under this scenario, the DP-based strategy switched to ECMS following the failure event. This is necessary because DP requires a predefined mission profile and cannot adapt to unforeseen circumstances. Consequently, a hybrid DP-ECMS approach is employed, combining the optimality of DP with the real-time adaptability of ECMS. As a result, the DP-ECMS and ECMS approaches follow a similar trend in
Figure 11, with differences primarily due to the variation in SOC at the time of failure. In contrast, the state machine results in the largest reduction in battery SOC, characterised by distinct step changes in FC current to promote increased battery usage.
The hydrogen consumption and battery ageing in
Figure 12 correlate with the results in
Figure 11, with the state machine using the least hydrogen overall in this mission. As shown in
Table 5, the state machine uses a total of 3.207 kg, while the ECMS and DP use 3.750 kg and 3.737 kg, respectively. The DP-ECMS, labelled as DP in
Figure 12, uses the most hydrogen in this scenario after the FC failure, which corresponds to the high levels of battery SOC still available after the failure, as shown in
Figure 11b. This behaviour arises from switching from DP to ECMS, meaning the EMS no longer follows the global optimum solution, and instead produces suboptimal performance under unforeseen circumstances. Although ECMS increases hydrogen consumption later in the mission, the hydrogen savings achieved during the initial phase when DP is applied result in a lower overall hydrogen expenditure. However, the strong reliance on the battery throughout the mission is reflected in increased battery ageing. This hybrid approach enables DP-based optimisation to be retained while still allowing the EMS to adapt to unforeseen circumstances, such as component failure modes.
The final states for the FC failure in
Table 5 show both electrical power systems. This highlights the difference between SOC for each battery, which is the result of changing the control during reconfiguration.
Overall, across the three EMSs, the state machine pushes the battery energy furthest. Though this can fall outside the constraints in some scenarios. Therefore, DP performs best while respecting constraints and continuously delivers low hydrogen usage. Thus, proving the optimum solution.
6. Results Analysis
This section compares the results presented in the preceding figures, with particular emphasis on the cost per flight associated with different EMSs. The analysis assumes that the weighted price of hydrogen is £3.70/kg [
17], and the electricity cost for recharging the battery is £0.25/kWh [
18], and applies them to the results in
Table 2,
Table 3 and
Table 4.
This section is split into three subsections: energy expenditure, hydrogen consumption, and battery lifecycle assessment. The energy expenditure is calculated using the battery SOC and hydrogen consumed to determine the most efficient EMS in terms of total energy usage. This is followed by the hydrogen consumption calculated as a cost per flight, comparing the EMSs performance across the three mission profiles. Finally, the lifecycle assessment uses the battery ageing proxy to estimate replacement intervals. It should be noted that this proxy does not account for nonlinear degradation, temperature effects, or calendar ageing; therefore, associated lifetime and cost estimates are indicative rather than precise predictions.
6.1. Energy Expenditure
Within this section, system efficiency refers to energy usage from the FCs and batteries. This is because the more efficient a system, the less energy is used overall.
Table 6 presents the energy spent per flight for each EMS, which is calculated using the overall decline in battery SOC and hydrogen consumption. Lower energy expenditure per flight implies higher overall system efficiency and overall lower power losses. Equally, higher energy spent indicates reduced system efficiency and increased losses. The losses from individual components, such as power electronic converters, are not included within this energy expenditure comparison.
For a typical mission, DP achieves the highest efficiency with an energy expenditure of 81.495 kWh, while the state machine is the least efficient with an energy expenditure of 85.470 kWh. This trend is reversed under FC failure conditions, where the state-machine strategy becomes the most efficient with an energy expenditure of 127.102 kWh and DP the least efficient with an energy expenditure of 139.178 kWh. During the extended cruise mission, the state-machine performs similarly to DP with energy expenditure of 108.012 kWh and 108.084 kWh, respectively, whereas ECMS has the highest energy consumption with energy expenditure of 111.354 kWh.
According to the literature, FC-powered aircraft have lower efficiency than battery-powered aircraft due to losses converting hydrogen into electricity, but they offer greater energy density and the potential for longer flights [
19,
20]. Therefore, using both batteries and FCs can achieve longer missions with higher efficiency than either energy source alone. Also, they state that it is advantageous to use FC technology compared to combusting liquid hydrogen to reduce hydrogen fuel consumption [
19]. To combat this inefficiency, EMSs can be used to increase the energy expenditure and reduce hydrogen consumption throughout the mission. Therefore, as shown in
Table 6, for a typical mission, DP helps towards the increased efficiency required for FC implementation on aircraft. In comparison, the ECMS would not help effectively to increase efficiency or reduce hydrogen consumption across any mission profile.
6.2. Hydrogen Consumption
As hydrogen is considered the primary energy source for this aircraft, its usage provides a direct basis for comparing different EMSs. However, cost comparisons based on hydrogen and electricity prices for battery recharging are less robust than energy-based metrics, as market prices fluctuate over time. Consequently, energy expenditure is treated as the more reliable indicator of system performance, while cost-based comparisons are retained to provide a more tangible interpretation.
Table 7 highlights that ECMS is the cheapest per mission (£20.46 for a typical mission), including FC failure (£20.96), with the state-machine approach being the most expensive (£27.28 for an extended cruise mission). The cheapest EMS corresponds to the lowest battery energy usage, with more energy spent on hydrogen than battery recharging. If the current prices of electricity and hydrogen were to change, the cost of each EMS would vary accordingly.
6.3. Battery Lifecycle Assessment
Table 8 shows the flights that the aircraft can complete without a battery replacement for the three EMSs applied. These are calculated assuming the battery requires a replacement once the battery ageing reaches 20%. For a typical mission, the state machine can only achieve 3251 flights before both batteries must be replaced. The ECMS prolongs the battery lifespan to achieve 4007 flights before replacement is required. When the extended cruise mission profile is compared to the typical mission, the DP and state machine perform better with 4197 and 4196 flights, respectively. This corresponds to a 4.95% increase in the number of flights before battery replacement for DP, and the largest improvement of 29.07% for the state machine, whereas the ECMS shows a slight decrease of 0.35%. These results indicate that, for a typical mission, differences in the battery ageing proxy between EMS controllers are modest, and the observed improvements should be interpreted as limited, rather than large extensions of battery lifetime.
As an example, to assess the long-term effects of the EMSs, hydrogen consumption and battery ageing are considered for two flights a day over five years. For this, it is assumed that the unit price of a battery is £85.10/kWh [
21]. It does not consider the degradation within the system modelling and only considers the battery ageing percentage.
Table 9 displays the energy and maintenance costs of the battery-FC aircraft operating over a five-year period. For the typical mission, the battery ageing reaches 22.45% for the state machine, while the ECMS and DP remain at 18.22% and 18.26%, respectively. This is calculated by determining the number of flights within the given five-year period and timings by the battery ageing per flight, such as 0.006152% for the state machine in a typical mission, as shown in
Table 3. Therefore, only a battery replacement is required for the state machine, meaning that it is the most expensive option, costing £80,381.50 overall with a £4680.50 battery replacement, as displayed in
Table 9. The extended cruise requires no battery replacements over the same number of flights. Hence, follows the same trends seen in
Table 7.
6.4. Results Summary
To summarise,
Table 10 displays the overall results assessing hydrogen consumption, operational cost, energy usage, and battery lifespan across the three EMSs. The rankings highlight that the ECMS consistently achieves the lowest operational cost but does not provide the best performance in terms of hydrogen usage or total energy efficiency. The state machine generally exhibits intermediate performance across the considered metrics, while DP performs best when minimising hydrogen consumption, energy expenditure, or long-term battery usage, depending on the mission profile.
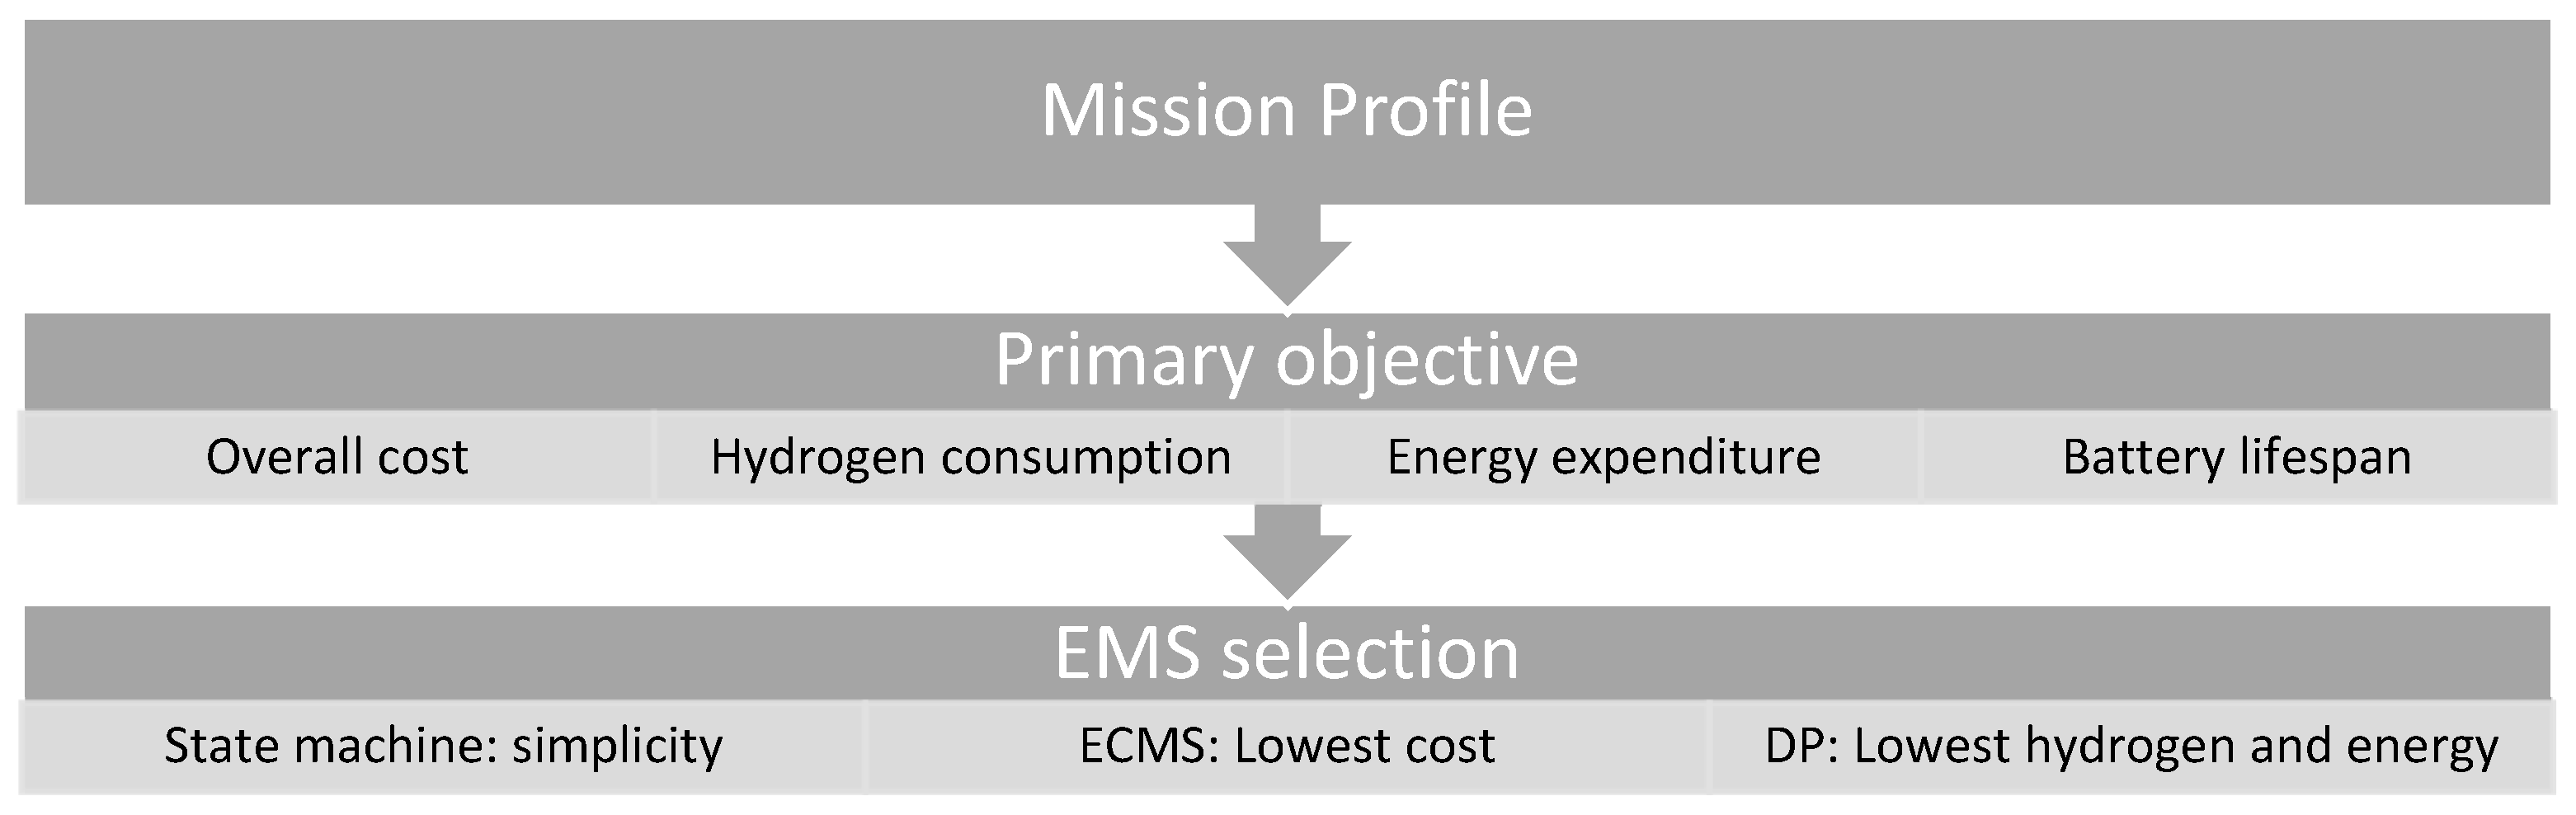
Based on the performance trends identified in
Table 10,
Figure 13 presents an EMS selection process that maps mission profiles and operational priorities to an appropriate control strategy. The flowchart provides a structured decision framework in which ECMS is recommended when minimising operational cost is the primary objective, DP is preferred when minimising hydrogen consumption or maximising battery lifespan, and the state machine offers a low complexity alternative when robustness and simplicity are required, such as for certification purposes. This selection process enables the practical application of the comparative results to different operational scenarios.
7. Conclusions
In conclusion, this work compares multiple EMSs in terms of hydrogen consumption, energy spent, and battery longevity for a hybrid battery-FC aircraft. The results demonstrate that the ECMS offers the lowest cost per mission under the assumed energy prices, while DP and the state-machine strategy reduce overall energy consumption and hydrogen usage. When long-term effects are considered, DP enables a greater number of flights before battery replacement compared to the state machine strategy, indicating superior performance for battery degradation.
Based on these results, EMS selection can be guided by mission objectives: DP is recommended when minimising hydrogen consumption or maximising battery lifetime is the primary objective, ECMS is preferred when minimising operational costs under fixed energy prices, and the state machine provides a lower-complexity alternative with competitive performance.
All EMSs were evaluated for real-time applicability using SIL validation, ensuring that the control code responds correctly to changes in the mission profile and is robust to implementation-related errors. In scenarios where the aircraft deviates from the predefined mission, such as during subsystem failures, the EMS can respond in real time. Consequently, DP is implemented in combination with ECMS, providing globally optimal performance under nominal conditions while maintaining real-time responsiveness under unforeseen circumstances. Other combinations of EMSs may yield better results, although this is an area of future work to be explored.
This study focused on system-level comparison of EMSs based on total energy spent, hydrogen usage, and battery ageing. Future work will extend the analysis to include decomposition of component-level losses. Further investigation will also quantify dynamic response characteristics and constraint satisfaction performance under transient conditions. Also, more advanced adaptive or nonlinear equivalence factor strategies are acknowledged as valuable and are identified as directions of future work for the ECMS. In addition, algorithmic enhancements to the DP-ECMS framework and benchmarking against alternative hybrid EMS in the aviation domain will be pursued to strengthen methodological innovation and comparative positioning.