1. Introduction
Aviation emissions contribute substantially to environmental pollution. In addition to CO
2 and other greenhouse gases, pollutants such as NO
x, CO, HC, and PM, released during airport ground-level operations, particularly during Landing and Take-off (LTO) cycles, can significantly degrade local air quality. Accurate emission estimates are therefore essential for quantifying these pollutants, developing effective environmental policies, and mitigating aviation’s impacts on both air quality and climate change [
1,
2,
3].
Estimating LTO emissions requires detailed information on aircraft operations, including times-in-mode (TIMs) for different flight modes and the corresponding emission factors (EFs). Historical air traffic data have traditionally been used to quantify aviation emissions and identify long-term trends at airports [
4,
5,
6,
7]. While these data provide a valuable basis for emission inventories, they typically reflect aggregated or scheduled operations rather than the actual operational activity at a given point in time. Recent advances in air traffic management systems and the availability of near-real-time flight-tracking data present new opportunities for improving emission inventories. Yet, while such data are valuable for quantifying emissions, they typically lack detailed information on aircraft engine models, which is crucial for selecting appropriate emission factors [
8]. Addressing the uncertainties that arise when activity data are derived from publicly available real-time sources therefore remains a significant challenge. It should be noted that many airports do not provide detailed traffic schedule information, including aircraft type or engine models.
The International Civil Aviation Organization (ICAO) defines the standard LTO cycle as consisting of four flight modes including take-off, climb-out, approach, and taxiing (taxi-in and taxi-out), each with its own characteristics and recommended default values [
9]. While ICAO provides default TIM values for each mode, empirical evidence indicates that taxiing often deviates substantially from these defaults, particularly at congested airports or during peak traffic periods [
10,
11,
12]. Taxiing is highly sensitive to airport layout, surface congestion, and the number of aircraft awaiting take-off, making it the dominant source of TIM-related uncertainty. In contrast, take-off, climb-out, and approach modes show relatively limited variability across airports and generally align with ICAO default TIM values [
13,
14]. Consequently, taxiing represents the primary focus when assessing uncertainties in airport-level LTO emission inventories.
With regard to the above-mentioned findings, quantifying these uncertainties is essential to establish confidence bounds, identify the most influential sources of error, and ensure that inventories are sufficiently robust to support air quality modeling and the design of effective emission control strategies [
1,
3,
7,
15,
16]. Complementary sensitivity analysis evaluates how variations in each input affect model outputs, clarifying the relationship between assumptions and predictions, guiding parameter calibration, highlighting critical input regions, and potentially simplifying models by eliminating negligible parameters [
17].
Uncertainties in emission inventories can be categorized as parametric, model, or observational [
18,
19], with parametric uncertainty arising from variability in activity data, time-in-mode, and emission factors having received particular attention [
1,
7,
20,
21]. One of the approaches recommended for estimation of uncertainties in emission inventories is Monte Carlo simulation, as also acknowledged in the Intergovernmental Panel on Climate Change (IPCC) Guidelines for National Greenhouse Gas Inventories, where probabilistic techniques are suggested to characterize parameter variability and propagate uncertainty [
2]. This method accommodates various probability density functions (PDFs), accounts for correlations between input variables, is well suited to complex models, and addresses large uncertainties effectively [
2,
22,
23]. Previous studies using historical air traffic data have applied Monte Carlo methods to propagate uncertainties in parameters such as emission factors, fuel flow, TIM, and meteorological conditions through airport-level LTO emission inventories, demonstrating the method’s suitability for capturing operational and parametric variability in aircraft emission estimates [
4,
5,
6,
7,
11]. Furthermore, existing research indicates that variability in input parameters contributes unevenly to uncertainty in LTO emission calculations, underscoring the need to identify dominant drivers of emission variability [
10,
20,
24,
25].
Hence, this study aims to address the identified gaps by developing a methodology to create hourly resolved emission inventory estimates derived from publicly available flight-tracking data, and quantifying their total airport-level uncertainties through the combined application of Monte Carlo simulation and Sobol sensitivity analysis, thereby contributing to more reliable aircraft emission inventories for local air quality assessment.
Improving the reliability of airport emission inventories is particularly relevant given their increasing use in air quality and climate impact assessments. Recent studies have shown that airport-scale evaluations depend strongly on the quality and transparency of emission estimates and their associated uncertainties, especially when inventories are used as inputs for modeling frameworks under current and future climate conditions [
26]. This reinforces the need for methodologies that explicitly address uncertainty to ensure that inventory results are suitable for downstream applications.
The methodology in this study accounts for uncertainties arising from missing information on aircraft engine model and airport-specific taxiing variability. A sample of six European airports including Brussels Airport (BRU), Dublin Airport (DUB), Lisbon International Airport (LIS), London Gatwick Airport (LGW), Paris Orly Airport (ORY), and Vienna International Airport (VIE) was selected based on their classification as Level 3 by the International Air Transport Association (IATA) [
27], availability of sufficient operational data for constructing comparable emission inventories, exclusion of major hub airports to avoid atypical operational characteristics, and broadly similar annual levels of aircraft movement. This selection enables a location-specific assessment of emission inventory uncertainty and provides insights into the dominant factors affecting LTO emissions across different operational contexts.
In addition to improving the accuracy of airport-level emission estimates, the quantified uncertainty ranges provided by this study can support atmospheric modeling frameworks, where airport emissions often represent a key but poorly constrained source. The proposed methodology not only enhances inventory reliability but also strengthens their application in air quality modeling, providing valuable information, for example, for data assimilation, sensitivity analysis, and model validation.
2. Methodology
Assessing uncertainty is a crucial component of developing emission inventories in order to comprehend the likely range in which the true value of the emissions fall and provide important information for the emission air pollution modeling chain. The emissions model used in this study was developed based on the EEA/EMEP approach [
28] and previously tested for non-CO
2 emissions [
8]. Thus, hourly emissions are calculated based on Equation (1):
where
= hourly emissions of the pollutant p (kg);
= the number of flights for aircraft type i;
= time-in-mode m (take-off, climb-out, taxiing, and approach) (seconds);
= the emission factor for pollutant p in mode m per engine used on aircraft type i (kg s−1 engine−1);
= the number of engines used on aircraft type i.
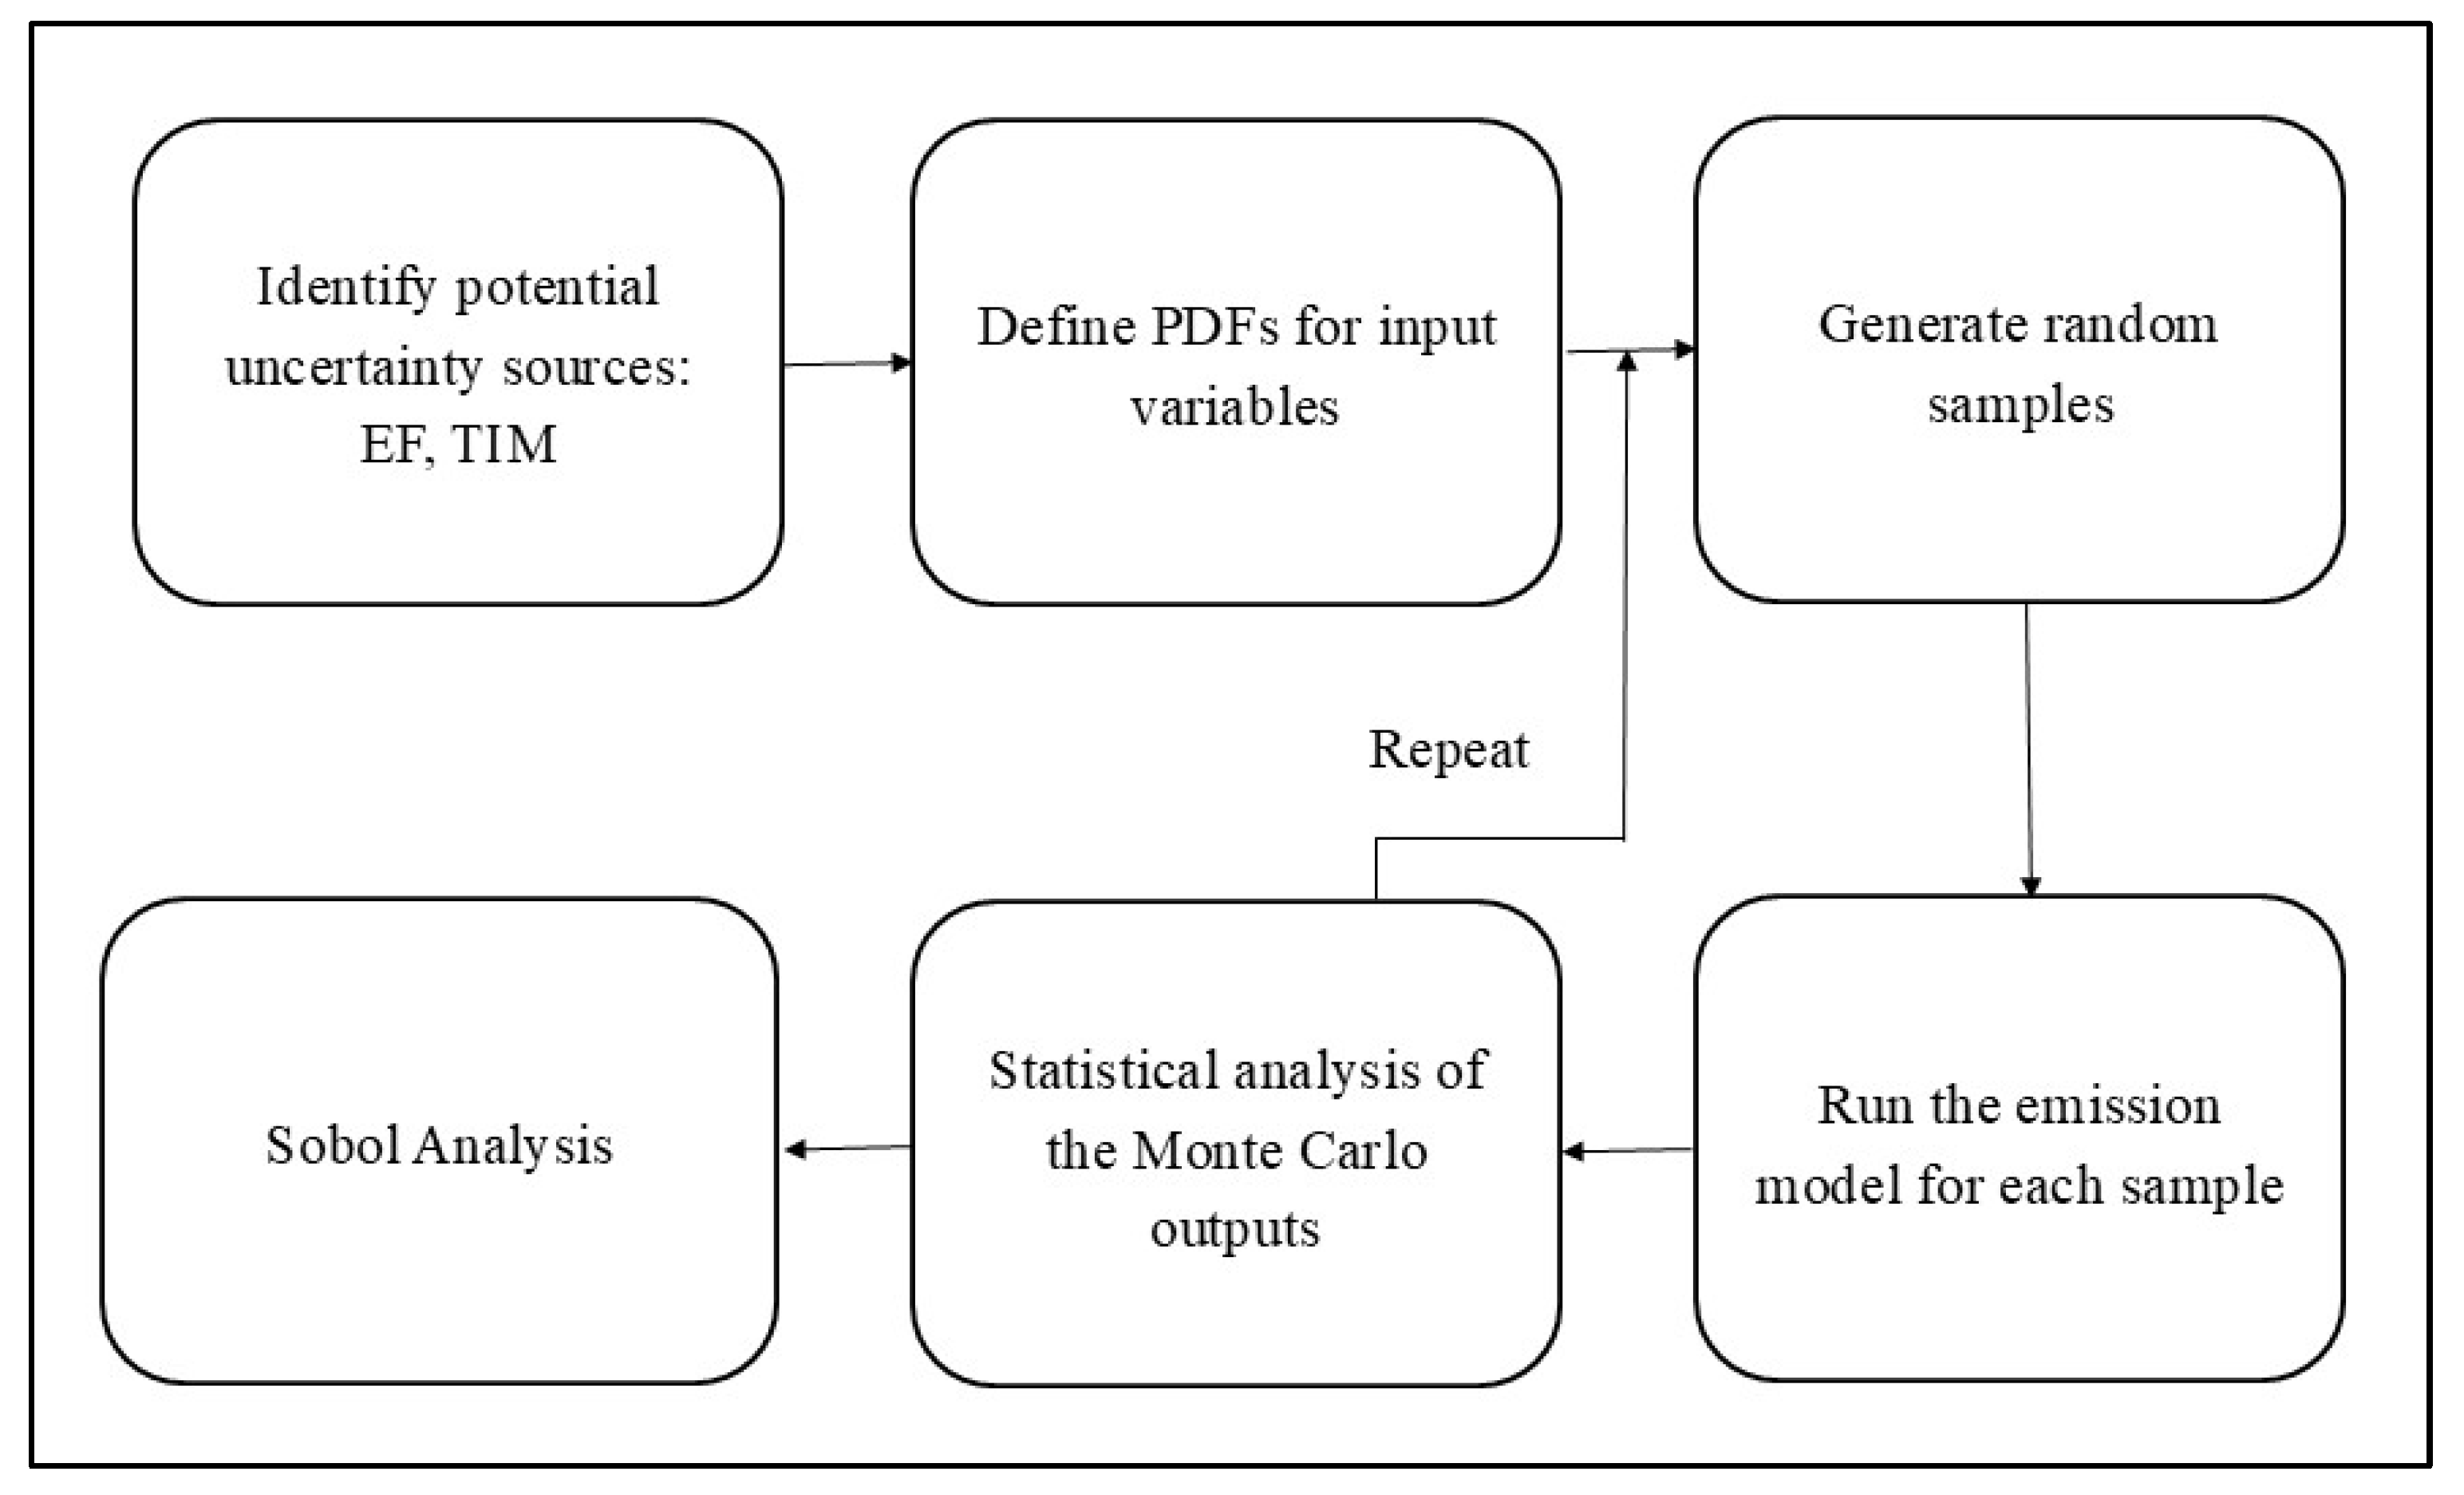
Uncertainties associated with the application of this model were investigated in the current research using Monte Carlo simulation. As a stochastic approach widely recognized for establishing large uncertainties and applicable to complex models, the Monte Carlo simulation method is used to propagate the uncertainty of input variables through the emission model. It achieves this by using random sampling of inputs based on PDFs generated for input variables in the emission model. This simulation performs with a high iteration count chosen specifically to ensure stable, statistically reliable estimates. Additionally, Sobol analysis, which is a variance-based sensitivity analysis method, was used to calculate the contributions of the various factors in the taxiing model to the total output variance in the emission estimates. The methodology applied in this study is schematically presented in
Figure 1.
Thus, the first step of the implemented methodology (
Figure 1) is identification of potential uncertainty parameters in the dataset. As mentioned before, one of the objectives of this study is to determine the uncertainty in the aircraft emission inventory when the publicly available flight-tracking data are used. Particularly, it has to be mentioned that these datasets do not provide information on the engine model of a specific aircraft. Emission factors are strongly influenced by engine type, and different engine variants installed on the same aircraft model can lead to variations in emission factors. For example, aircraft such as the Airbus A320 family can be equipped with different engines, each associated with distinct emission factors [
8]. To account for this variability when engine-specific information is not available, all engine variants associated with a given aircraft type were considered and treated as equally probable within the Monte Carlo simulation.
Hence, as the exact engine models of specific aircraft are missing, the difference between the exact value and theoretical emission factors would affect the emission quantification. This means that one of the uncertainty sources is EFs. Additionally, another uncertain variable in this study is related to the TIM during taxiing, which depends on the traffic pattern and design of the airports.
Defining the PDFs of the input variables is the next step. According to the EFs used in the emission model, for different pollutants, during four distinct LTO modes (take-off, climb-out, approach, taxiing), the EEA/EMEP databank was considered. For a specific aircraft, an equal probability was assumed for all engine models associated with that aircraft type, considering a uniform distribution in the Monte Carlo simulation. This assumption is based on the provided engine models, which are the most commonly associated ones with each aircraft type [
28].
TIM, which represents the duration that an airplane stays at a specific engine thrust level during each LTO mode, is another variable considered in Monte Carlo analysis. According to ICAO recommendations [
9], average values for the engine thrust level (%) and TIM (seconds) could be defined for take-off (100%, 42 s), climb-out (85%, 132 s), approach (35%, 240 s), and taxiing (7%, taxi-in: 420 s, taxi-out: 1140 s). During taxiing, an engine thrust level of 7% is defined, but time in this mode may vary significantly depending on the layout of the airport, predominantly influenced by differences in airport design, conditions, and traffic. In this study, the mean and standard deviation (SD) for taxiing TIM considering data from Eurocontrol [
29] are obtained and a normal distribution is adopted for taxiing within the Monte Carlo simulation.
Based on PDFs, random numbers were generated to provide inputs for emission modeling. To perform the Monte Carlo simulation, some essential combinations for emission estimations during different LTO modes were considered. Thus, the only source of uncertainty considered for take-off, climb-out, and approach is related to EFs, while for taxiing mode, the uncertainty related to both EFs and TIM is investigated. The Monte Carlo simulation is applied considering 10,000 iterations using an algorithm implemented in Python (version 3.10). This high number of sample runs was deliberately chosen to ensure stable, statistically reliable estimates of the means and percentiles for the resulting pollutant emission distributions.
Afterwards, to understand the contribution of uncertainty factors, specifically during taxiing, Sobol analysis was used to determine the contribution of input variables to the output variability in the model. This analysis is a variance-based decomposition method that is widely utilized in complex modeling systems to understand the relative importance of input uncertainty factors on the output variability. This method enables a detailed understanding of the importance of each variable in influencing the model’s output. Specifically, in this study, the application of Sobol analysis allows for quantification of the relative contribution of each identified uncertain parameter—emission factors and TIM—to the total variance in the emission estimate, thereby identifying the dominant driver of uncertainty during taxiing. To quantify the effects of each input variable, first-order sensitivity index (
Si) is calculated [
30,
31,
32,
33,
34].
3. Data Collection
Following the selection of airports in Europe, data on arrival and departure activities at each location were obtained from publicly available datasets provided by the Flightradar24 website:
www.flightradar24.com (accessed on 31 January 2024). This dataset provides valuable insights into the operational dynamics of the selected airports during January 2024, although potential inaccuracy and limitations of using publicly available data have been stressed in some studies [
35]. The choice of this temporal scope stems from a comprehensive analysis of recent data trends, aiming to detect the extent of recovery in air travel patterns as they approach pre-COVID-19 levels [
36]. Since the objective of this study is to develop and demonstrate an uncertainty quantification framework rather than to examine seasonal variability, a single month with consistent, complete data across all airports was selected to avoid introducing seasonal effects into the comparative analysis. The total monthly number of flights at each airport considered in the analysis is given in
Table 1. Accordingly, the number of flights that took place at BRU is less than the others, and DUB Airport is the one with the highest number of flights among the selected airports during the study period. Furthermore, the values of the mean and SD of TIM for selected airports during the study period are provided in
Table 1. Although the selected airports vary in their overall size and operational characteristics, the key aspects relevant to the objectives of this study are the number of LTOs and taxi-time behavior, summarized in
Table 1.
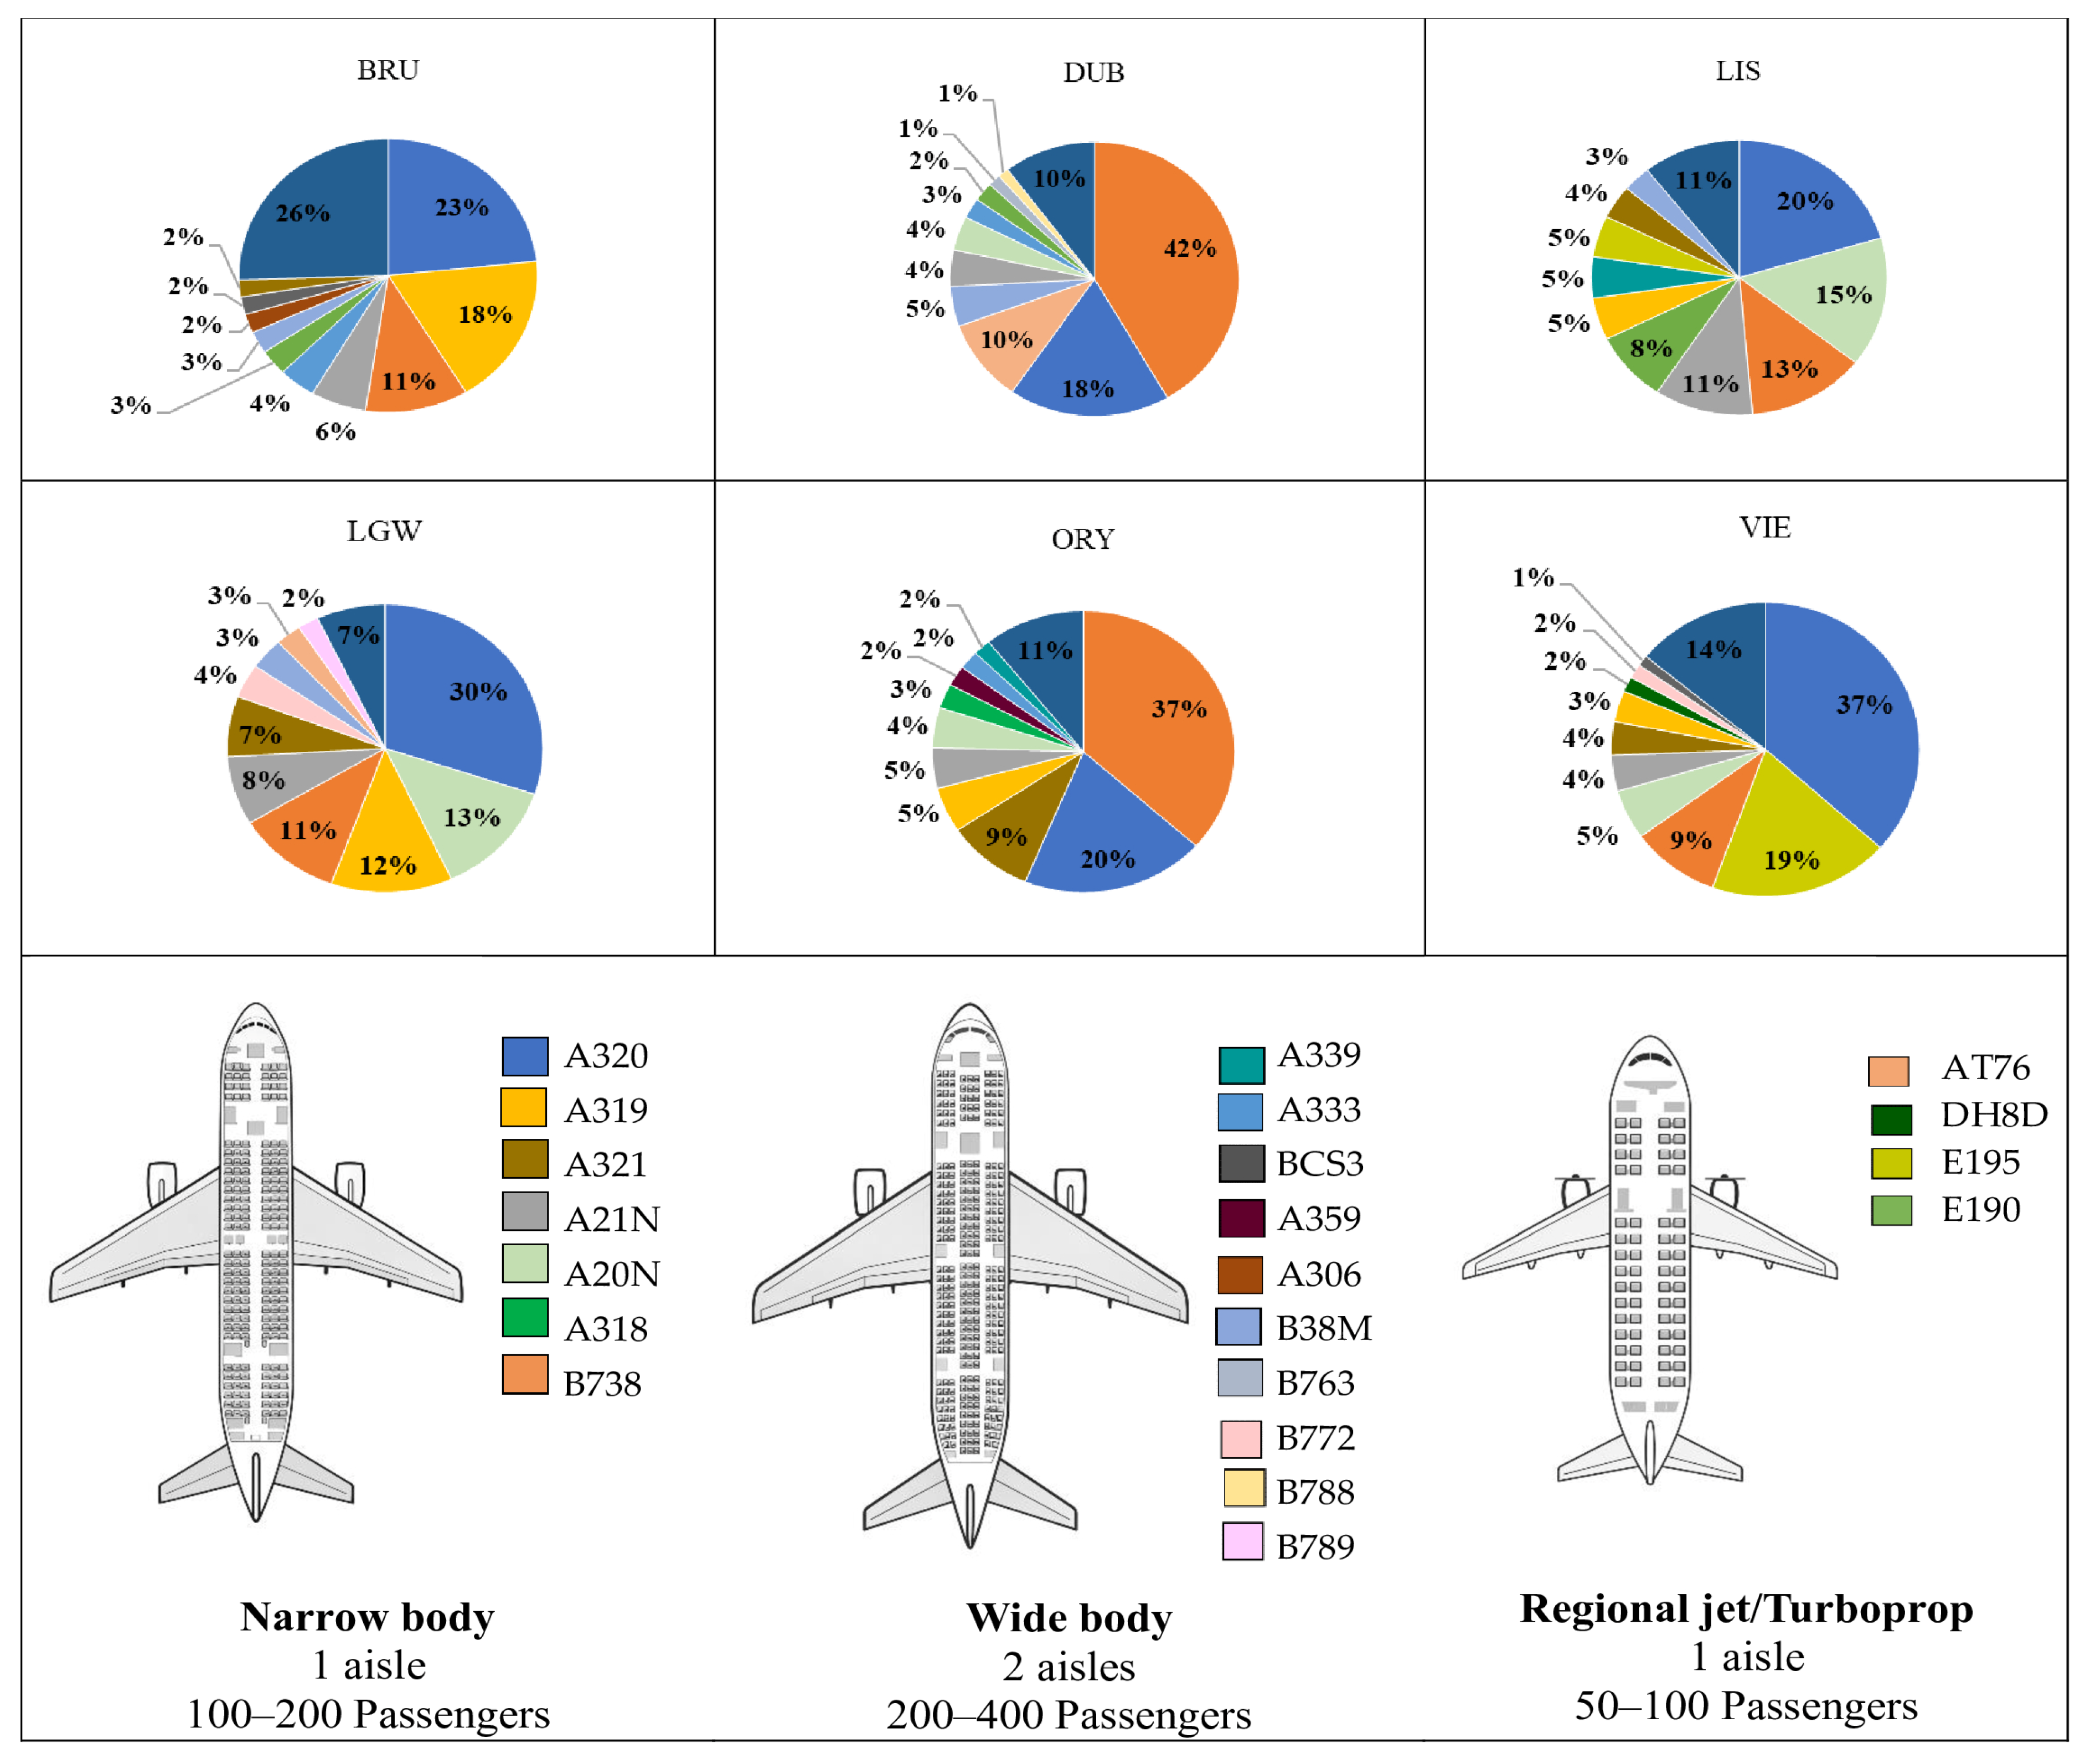
Figure 2 illustrates the diversity of aircraft operating at the designated airports, highlighting the ten most commonly used aircraft types at each site. The remaining aircraft are combined into a single group referred to as “Others”. Although the same aircraft families appear across multiple airports, their relative contributions differ. These differences are relevant for emission estimation, as aircraft type strongly influences engine options, emission factors, and fuel flow characteristics. Consequently, variations in fleet composition contribute to differences in both total emissions and associated uncertainty across airports.
Furthermore, schematic aircraft type categories are provided in
Figure 2. Narrow-body aircraft typically have a single passenger aisle and are commonly used on short- to medium-haul routes, while wide-body aircraft generally have two aisles and are employed on long-haul operations. Regional jets and turboprops are smaller-capacity aircraft primarily serving short-haul and regional routes. These categories are included for illustrative purposes to aid interpretation by non-specialist readers and are not used in the emission calculations or uncertainty analysis.
4. Results and Discussion
4.1. Monte Carlo Outputs
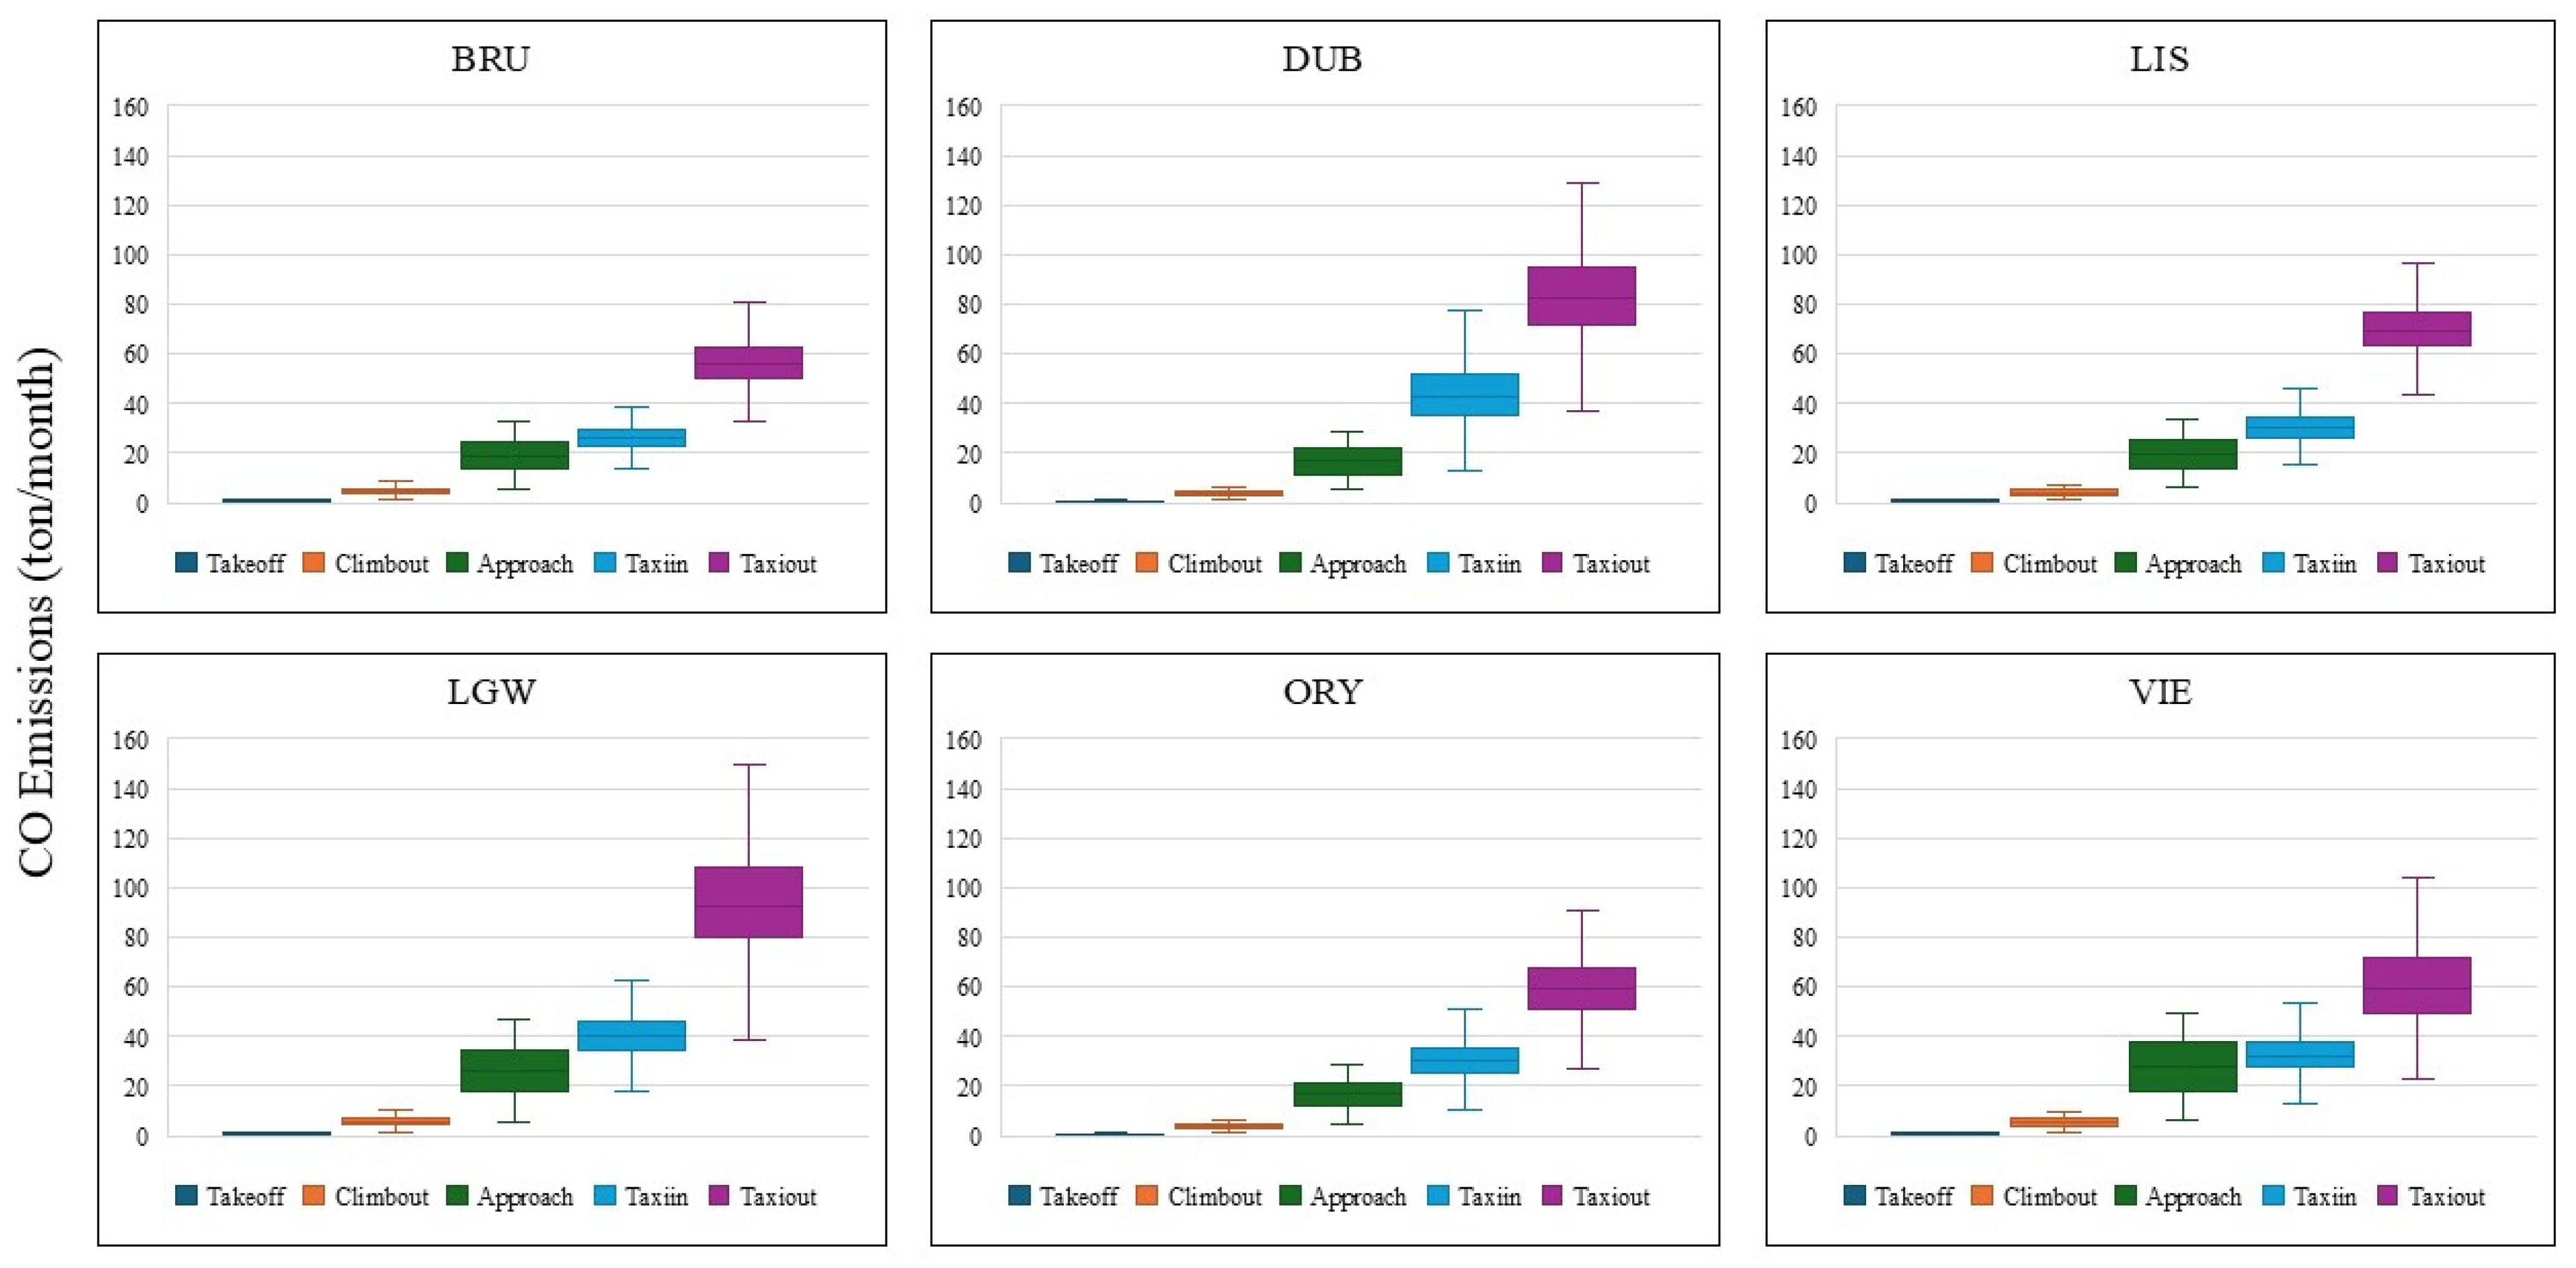
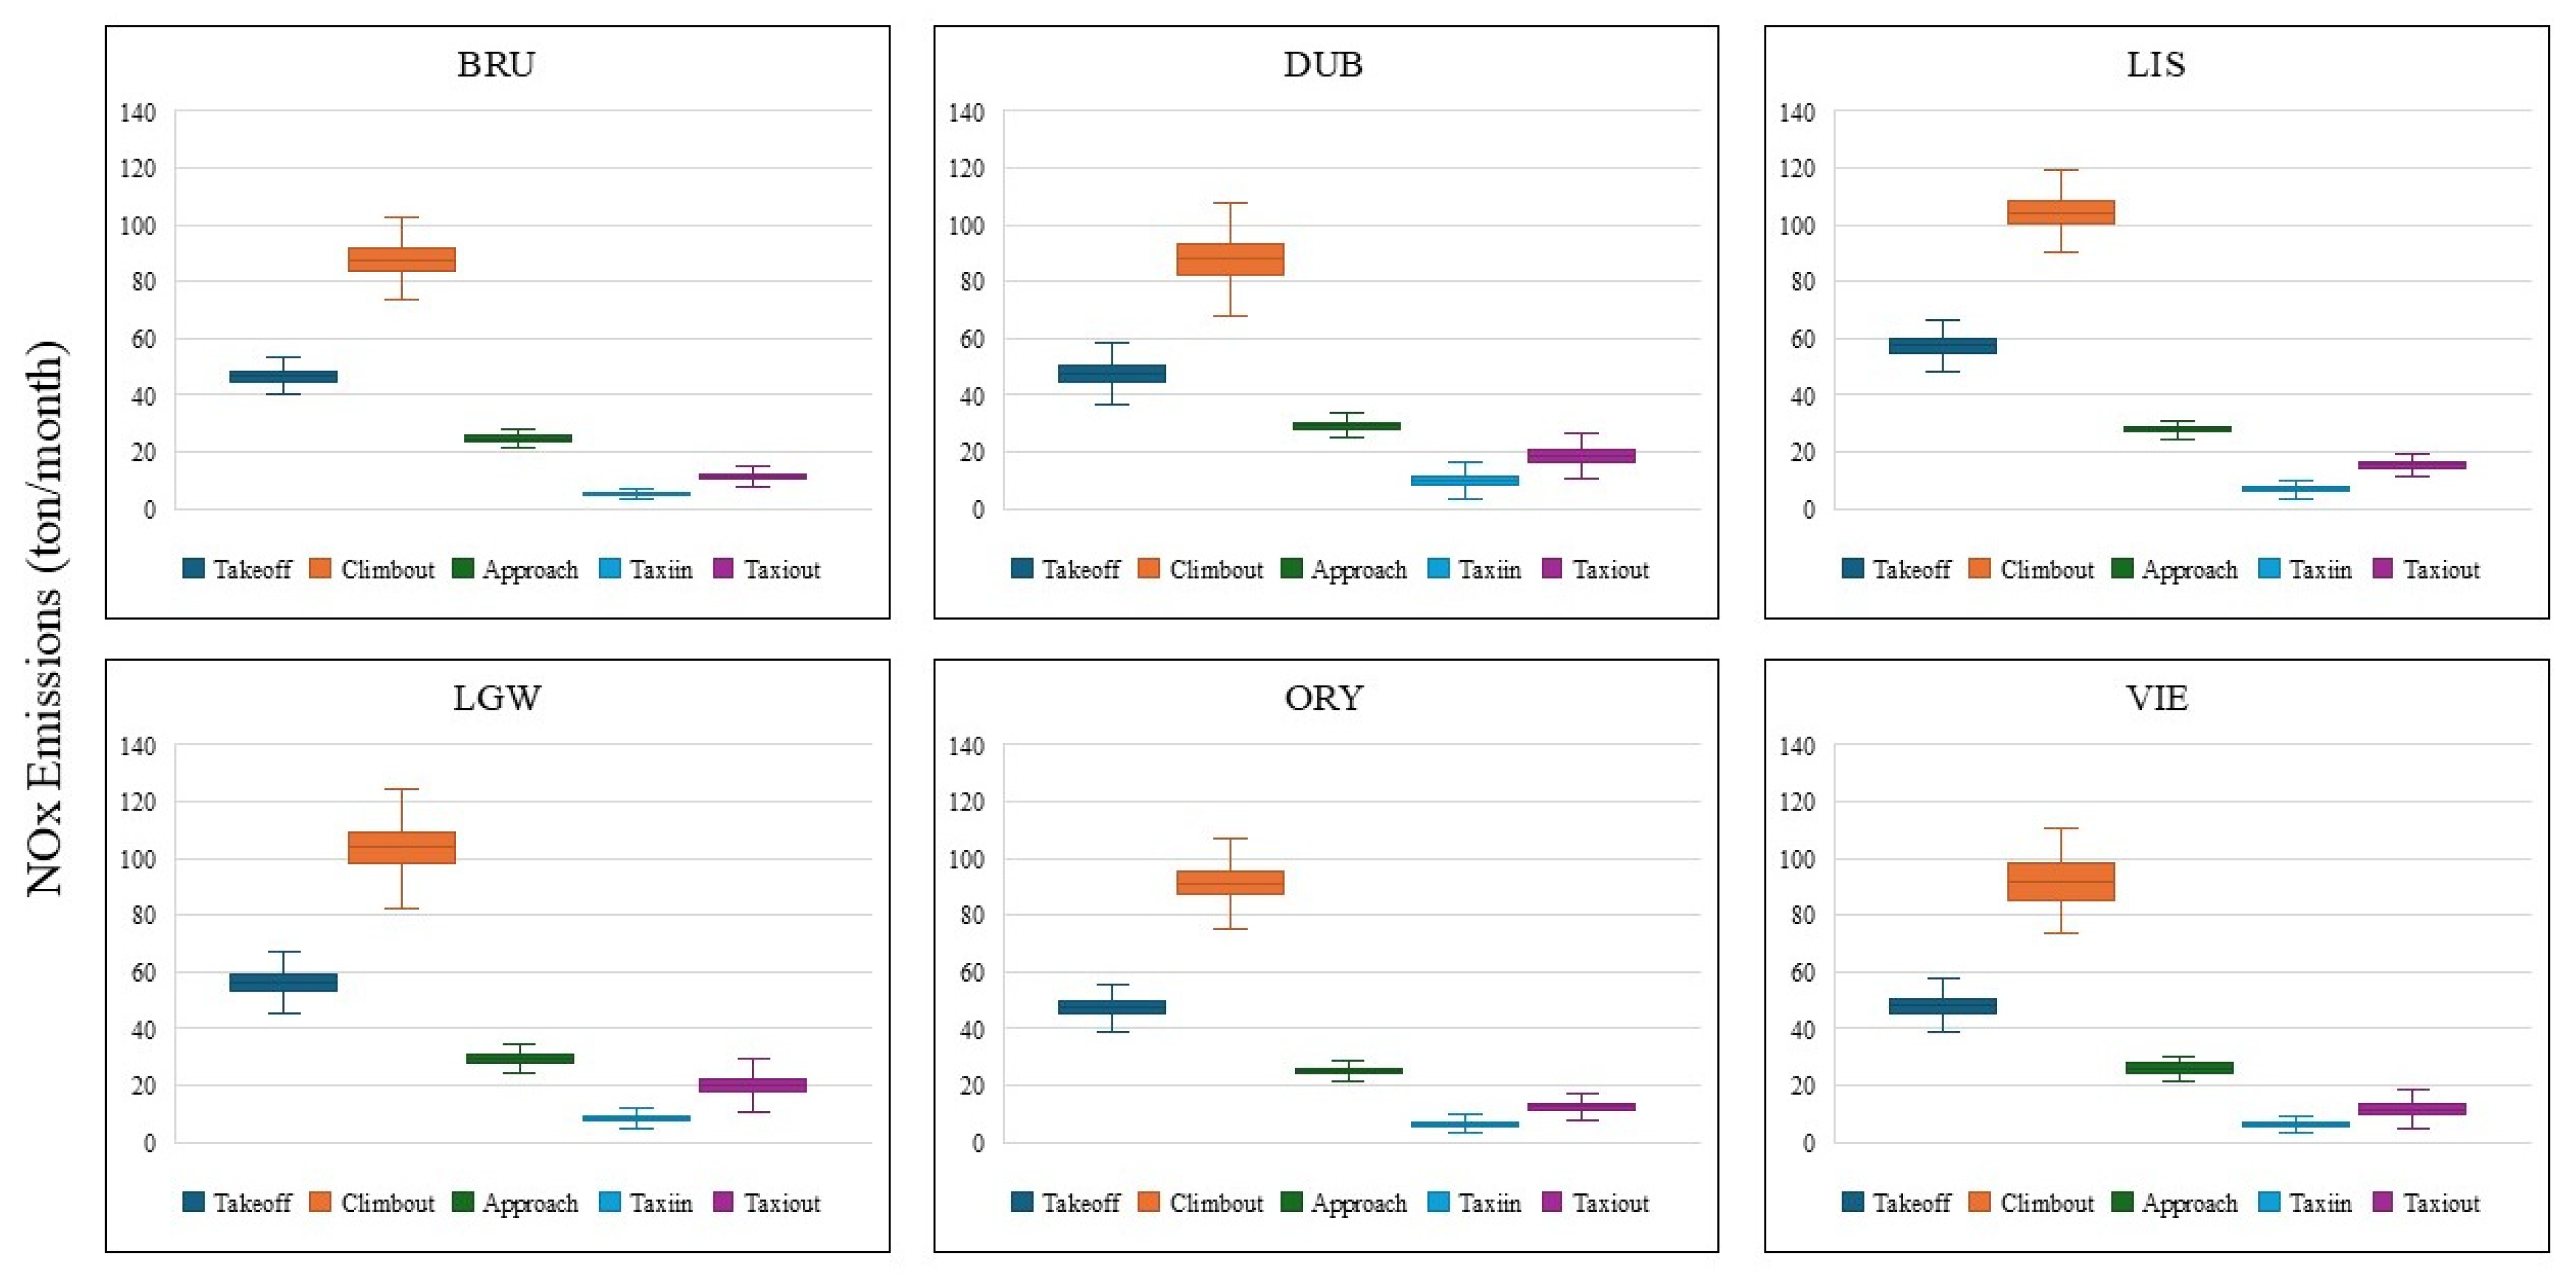
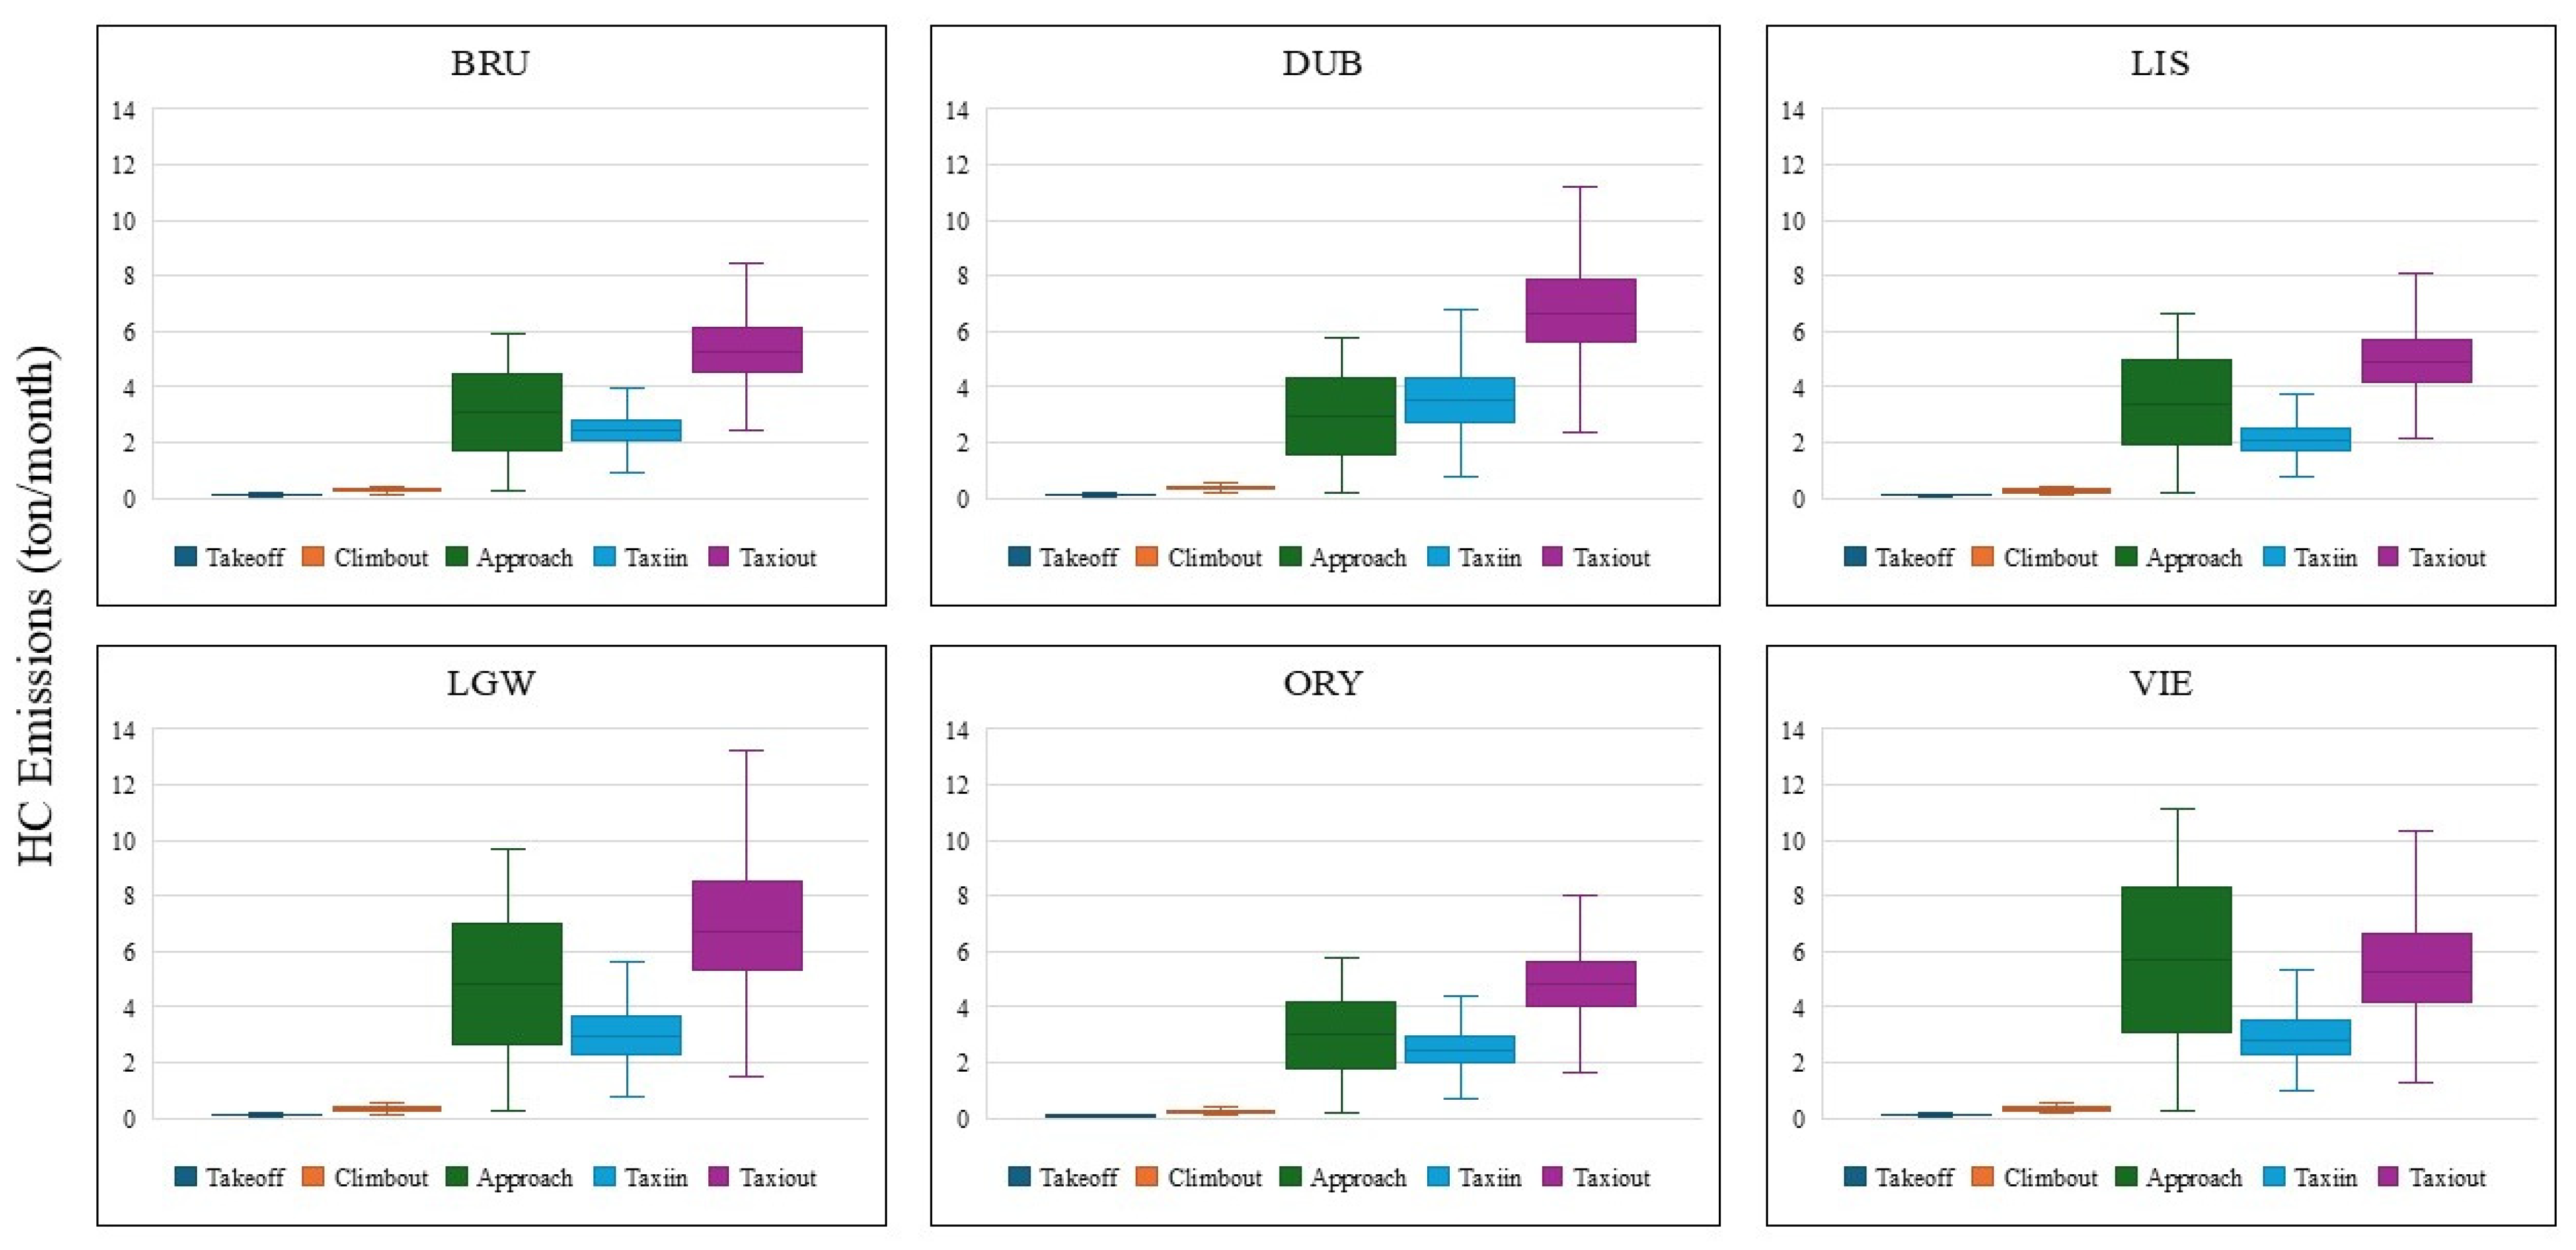
Emission values for different LTO modes obtained from the Monte Carlo simulation for January 2024 at selected European airports are presented in
Figure 3 and
Figure 4 for CO and NO
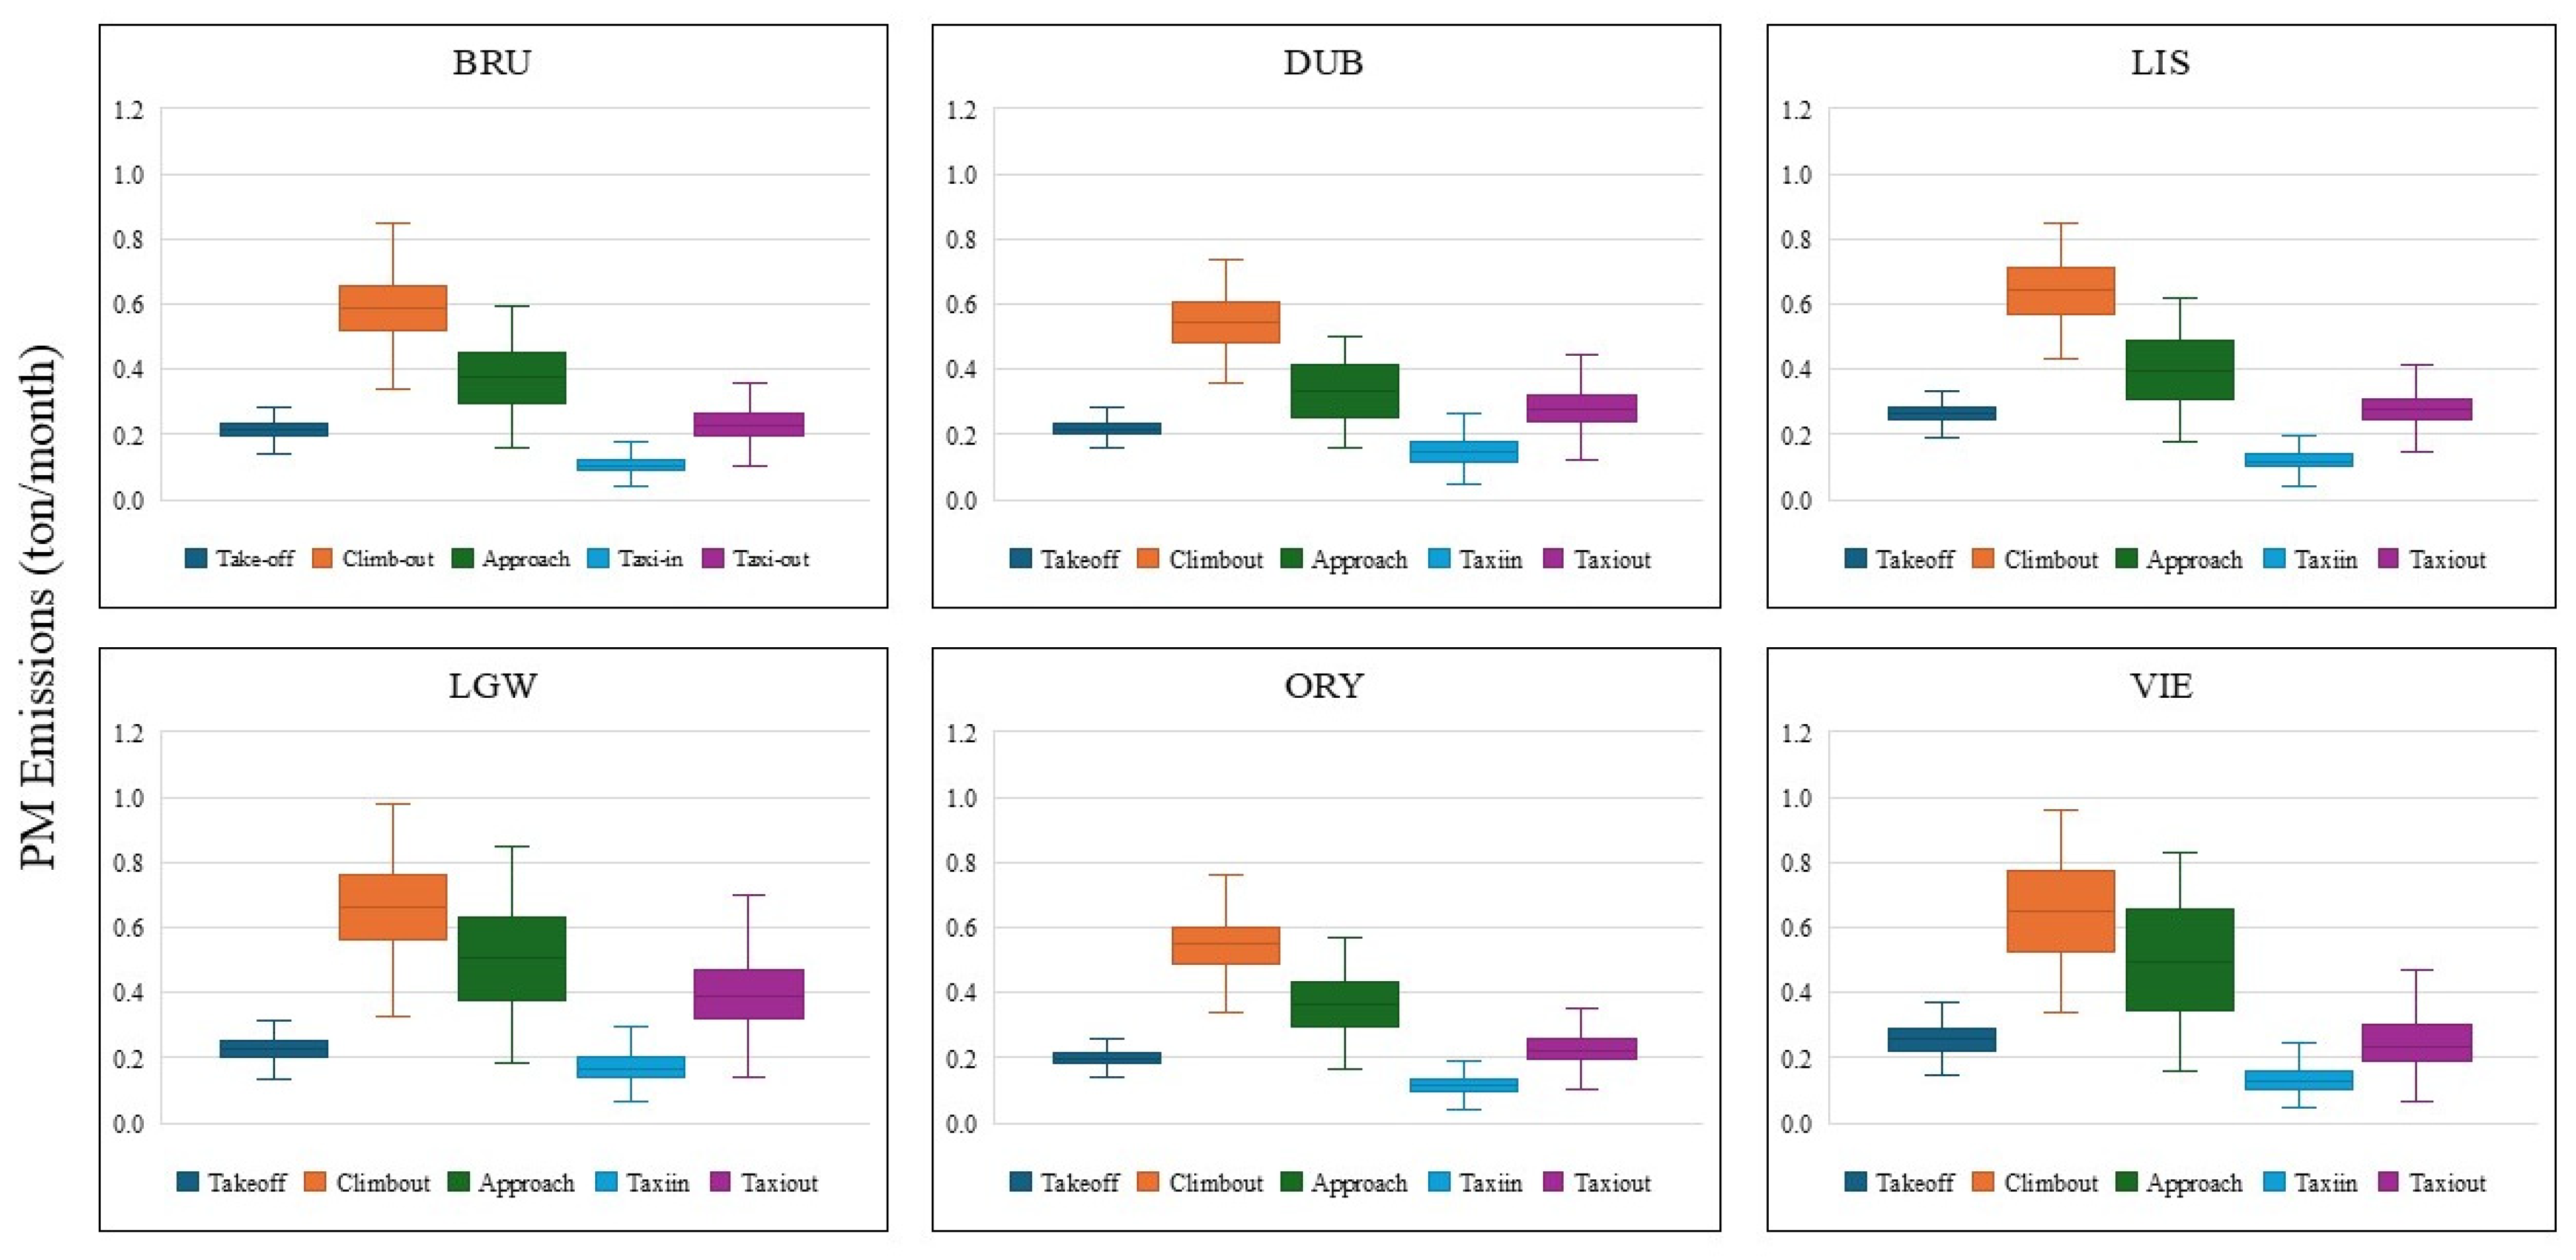
x, respectively. Information about other pollutants can be found in
Appendix A (
Figure A1 and
Figure A2). The range presented in the emissions data obtained from the Monte Carlo simulations for each pollutant during different modes of LTO is due to variations in the inputs related to activity data, EFs, and TIM. Emissions of CO and HC are notably higher during low-power modes of aircraft operation, such as taxi-in and taxi-out, where engines operate at reduced thrust [
37,
38]. In contrast, NO
x emissions tend to increase during high-power modes, such as climb-out [
39]. Our results indicate that PM emissions show considerable variability, especially during the climb-out and approach modes (
Figure A2).
The overall uncertainty in monthly emissions for each pollutant at the airport level is analyzed using the coefficient of variation (CV), defined as the ratio of the standard deviation to the mean and expressed as a percentage. The CV is particularly advantageous for comparing datasets with widely different means, providing a standardized measure of variability. The results of this analysis are presented in
Table 2.
Across the airports analyzed in this study, the uncertainty for HC emissions is always higher in comparison with other pollutants, while for NO
x emissions, it is lower. On average, the results indicate an uncertainty of 23% for CO, 34% for HC, 7% for NO
x, and 21% for PM. However, as illustrated in
Table 2, there is no simple pattern that clearly identifies an airport as having the highest or lowest value for all pollutants. These results are influenced by different contributions of the inputs to the final uncertainty of the emission estimate and provide a benchmark for better understanding the difference in emissions data at the European level.
4.2. Emission Intensity
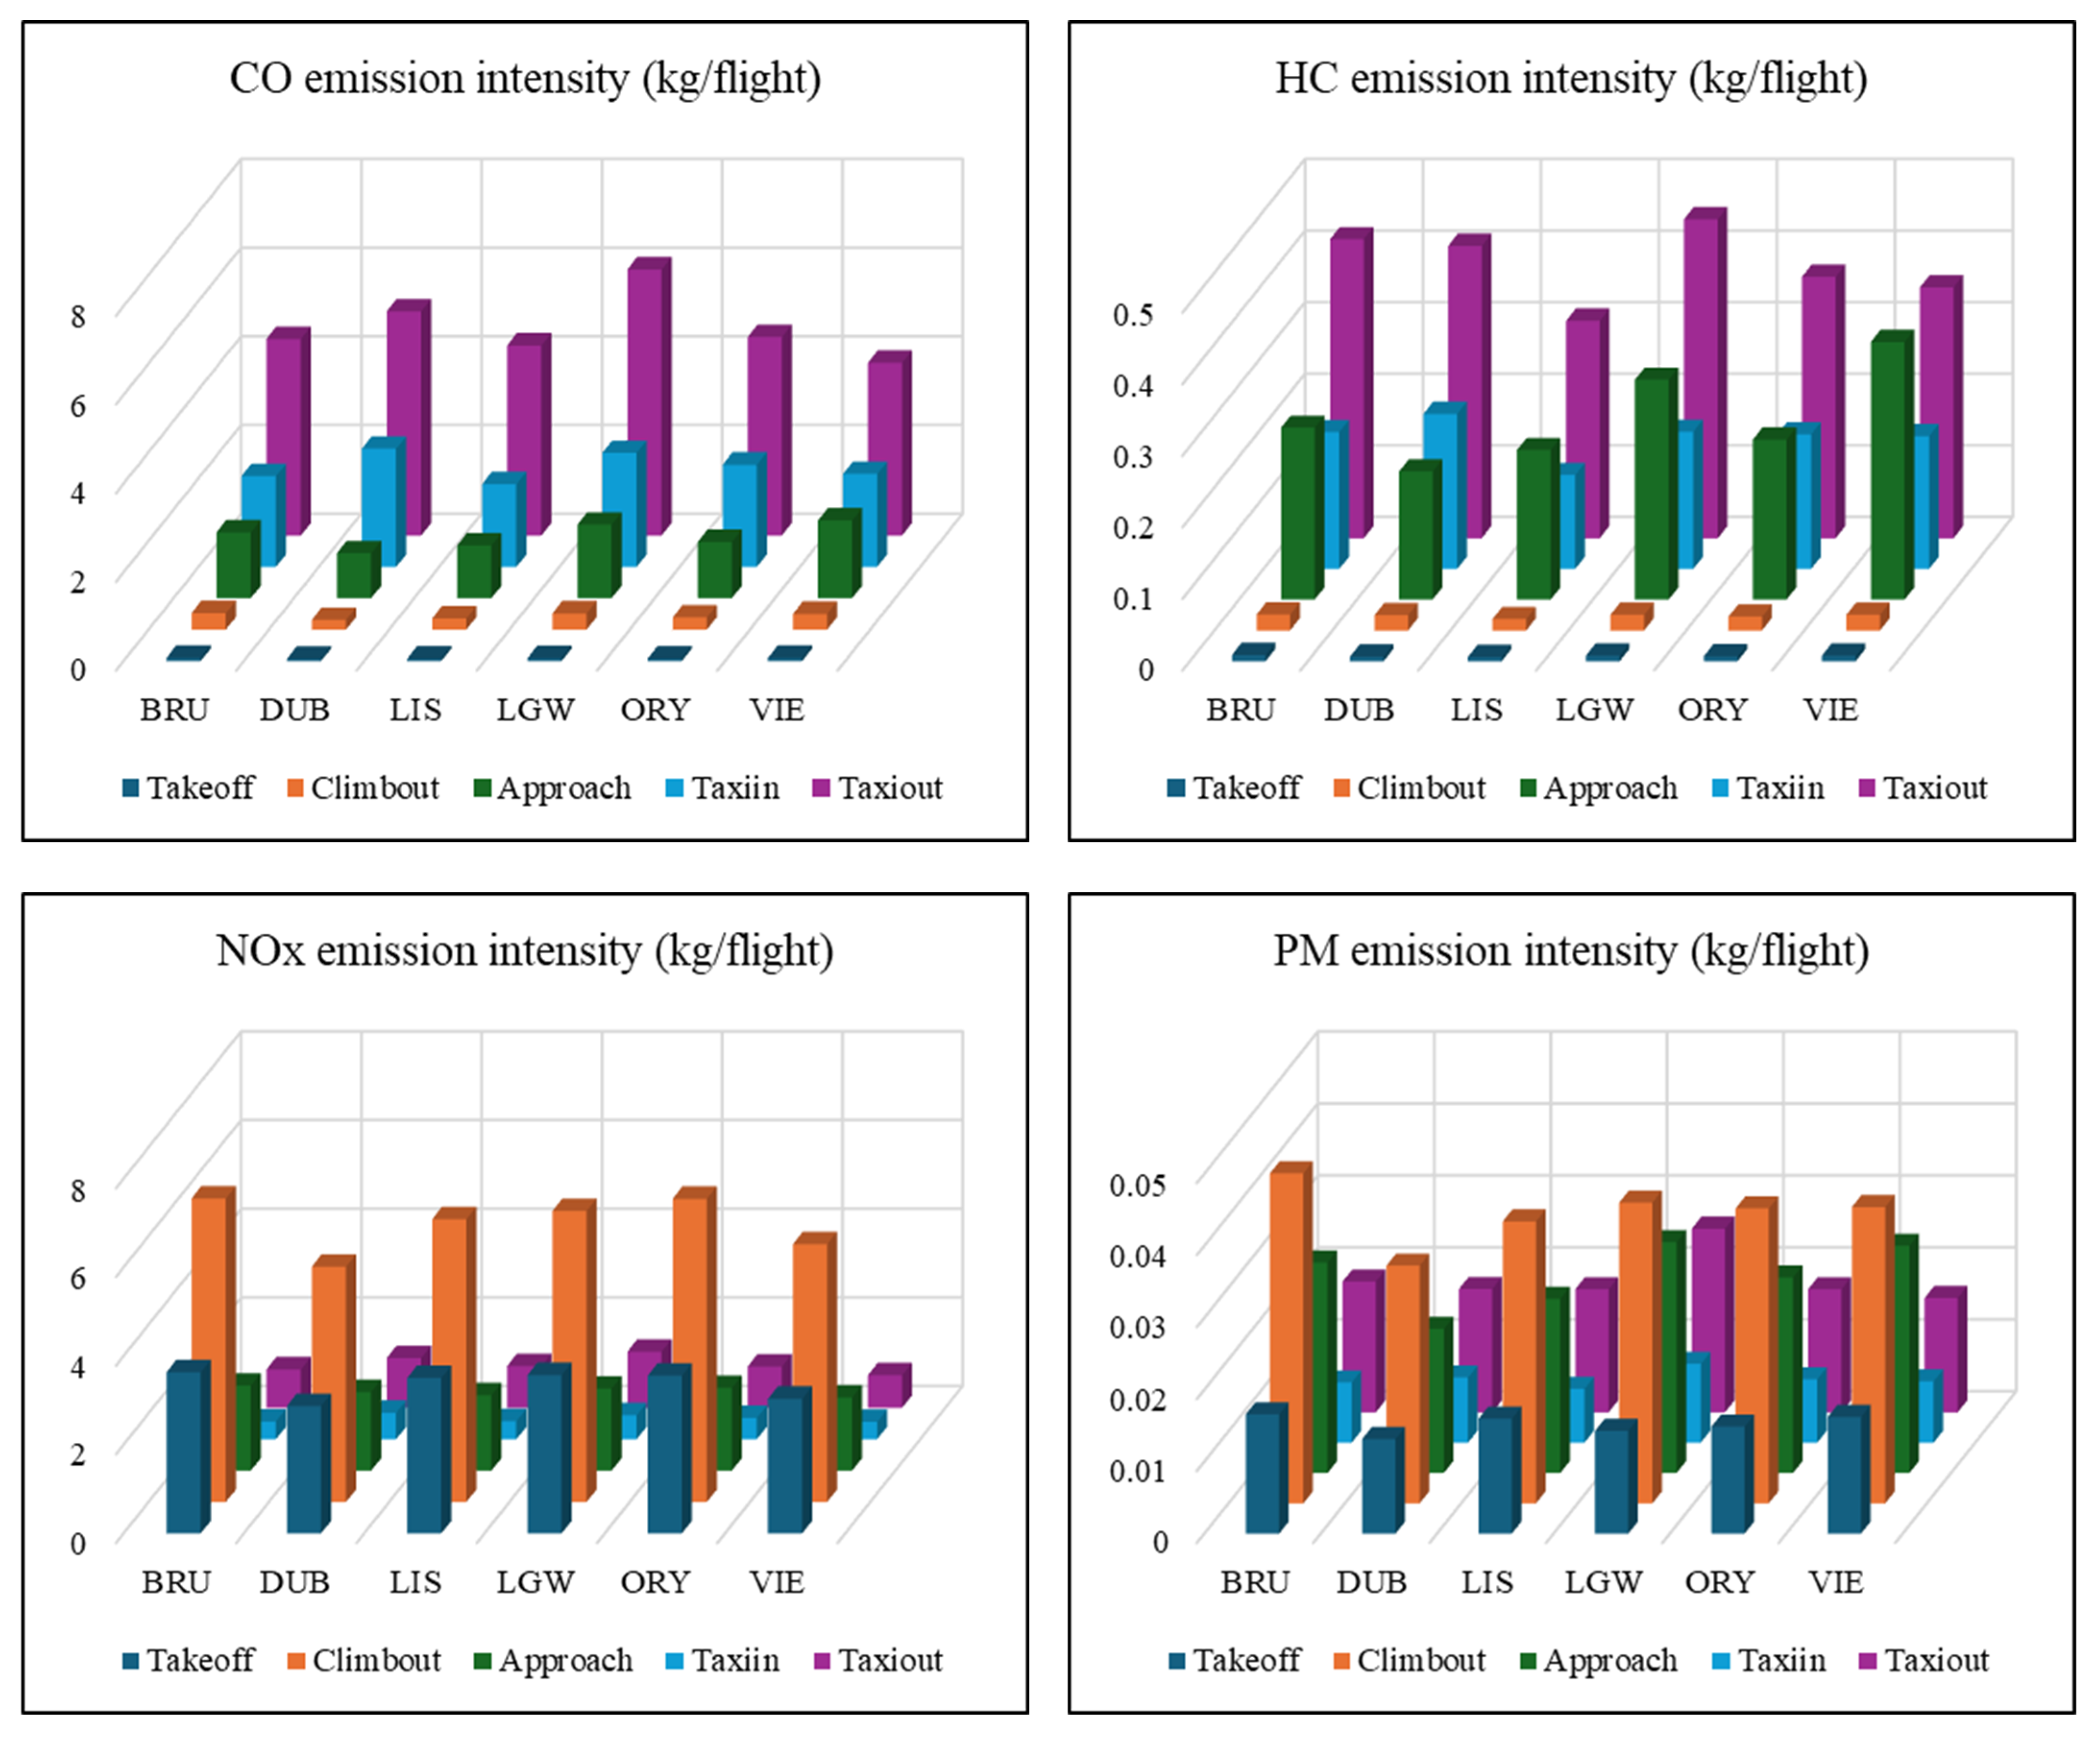
To facilitate data intercomparison across airports with different traffic activity, the emission intensity (EI) per flight was analyzed considering Monte Carlo outputs for all selected airports. Thus, EI quantifies the emissions produced per unit of activity, defined as per flight in this study.
Figure 5 illustrates the mean EI per flight mode for all selected airports during the study period, and the 95% confidence interval for each pollutant is presented in
Table 3.
As can be seen in
Figure 5, the emission intensity differs between airports. These results reflect differences in terms of aircraft fleet and airport operation. It could be observed that LGW has the highest EI rate for the pollutants that are mostly attributed to taxiing mode, namely CO and HC. It is notable that LIS exhibits the lowest values for HC, despite the fact that mean TIM for taxiing is not the lowest in comparison with other airports (
Table 1). With regard to NO
x and PM, which are mainly attributed to flight modes involving high engine thrust levels, DUB exhibits the lowest EI. These findings highlight the complexity of the emission pattern among the airports analyzed.
Data on the 95% confidence interval for the mean emission intensity disaggregated by flight mode at selected European airports are shown in
Table 3 for each pollutant. The taxiing mode of a flight plays a crucial role in emissions, influenced by airport design, conditions, and traffic. Addressing pollutants during this mode also offers a chance to improve airport operations sustainability. Implementing strategies to control or reduce emissions during taxiing can contribute to more environmentally friendly airport practices, supporting broader sustainability goals.
From a societal perspective, these findings have direct relevance to several Sustainable Development Goals (SDGs). For instance, the improved characterization of NOx, CO, and HC during high-uncertainty modes can enhance urban air quality management, contributing to SDG 11.6, which targets reduction in environmental impacts in cities. Similarly, more precise emission inventories enable robust climate impact assessments, supporting SDG 13.2 by informing local climate action and policy development. Furthermore, enhanced exposure assessment based on these inventories can inform public health strategies, aligning with SDG 3.9, which aims to decrease the burden of diseases caused by air pollution.
The results presented in
Table 3 indicate that the narrowest confidence intervals are observed for the take-off mode across all pollutants, except for NO
x. These narrower intervals indicate greater precision in the estimated mean EI. Conversely, wider confidence intervals, such as those observed for CO during the taxi-out mode, indicate more variability in the data and reflect greater uncertainty.
4.3. Sobol Analysis
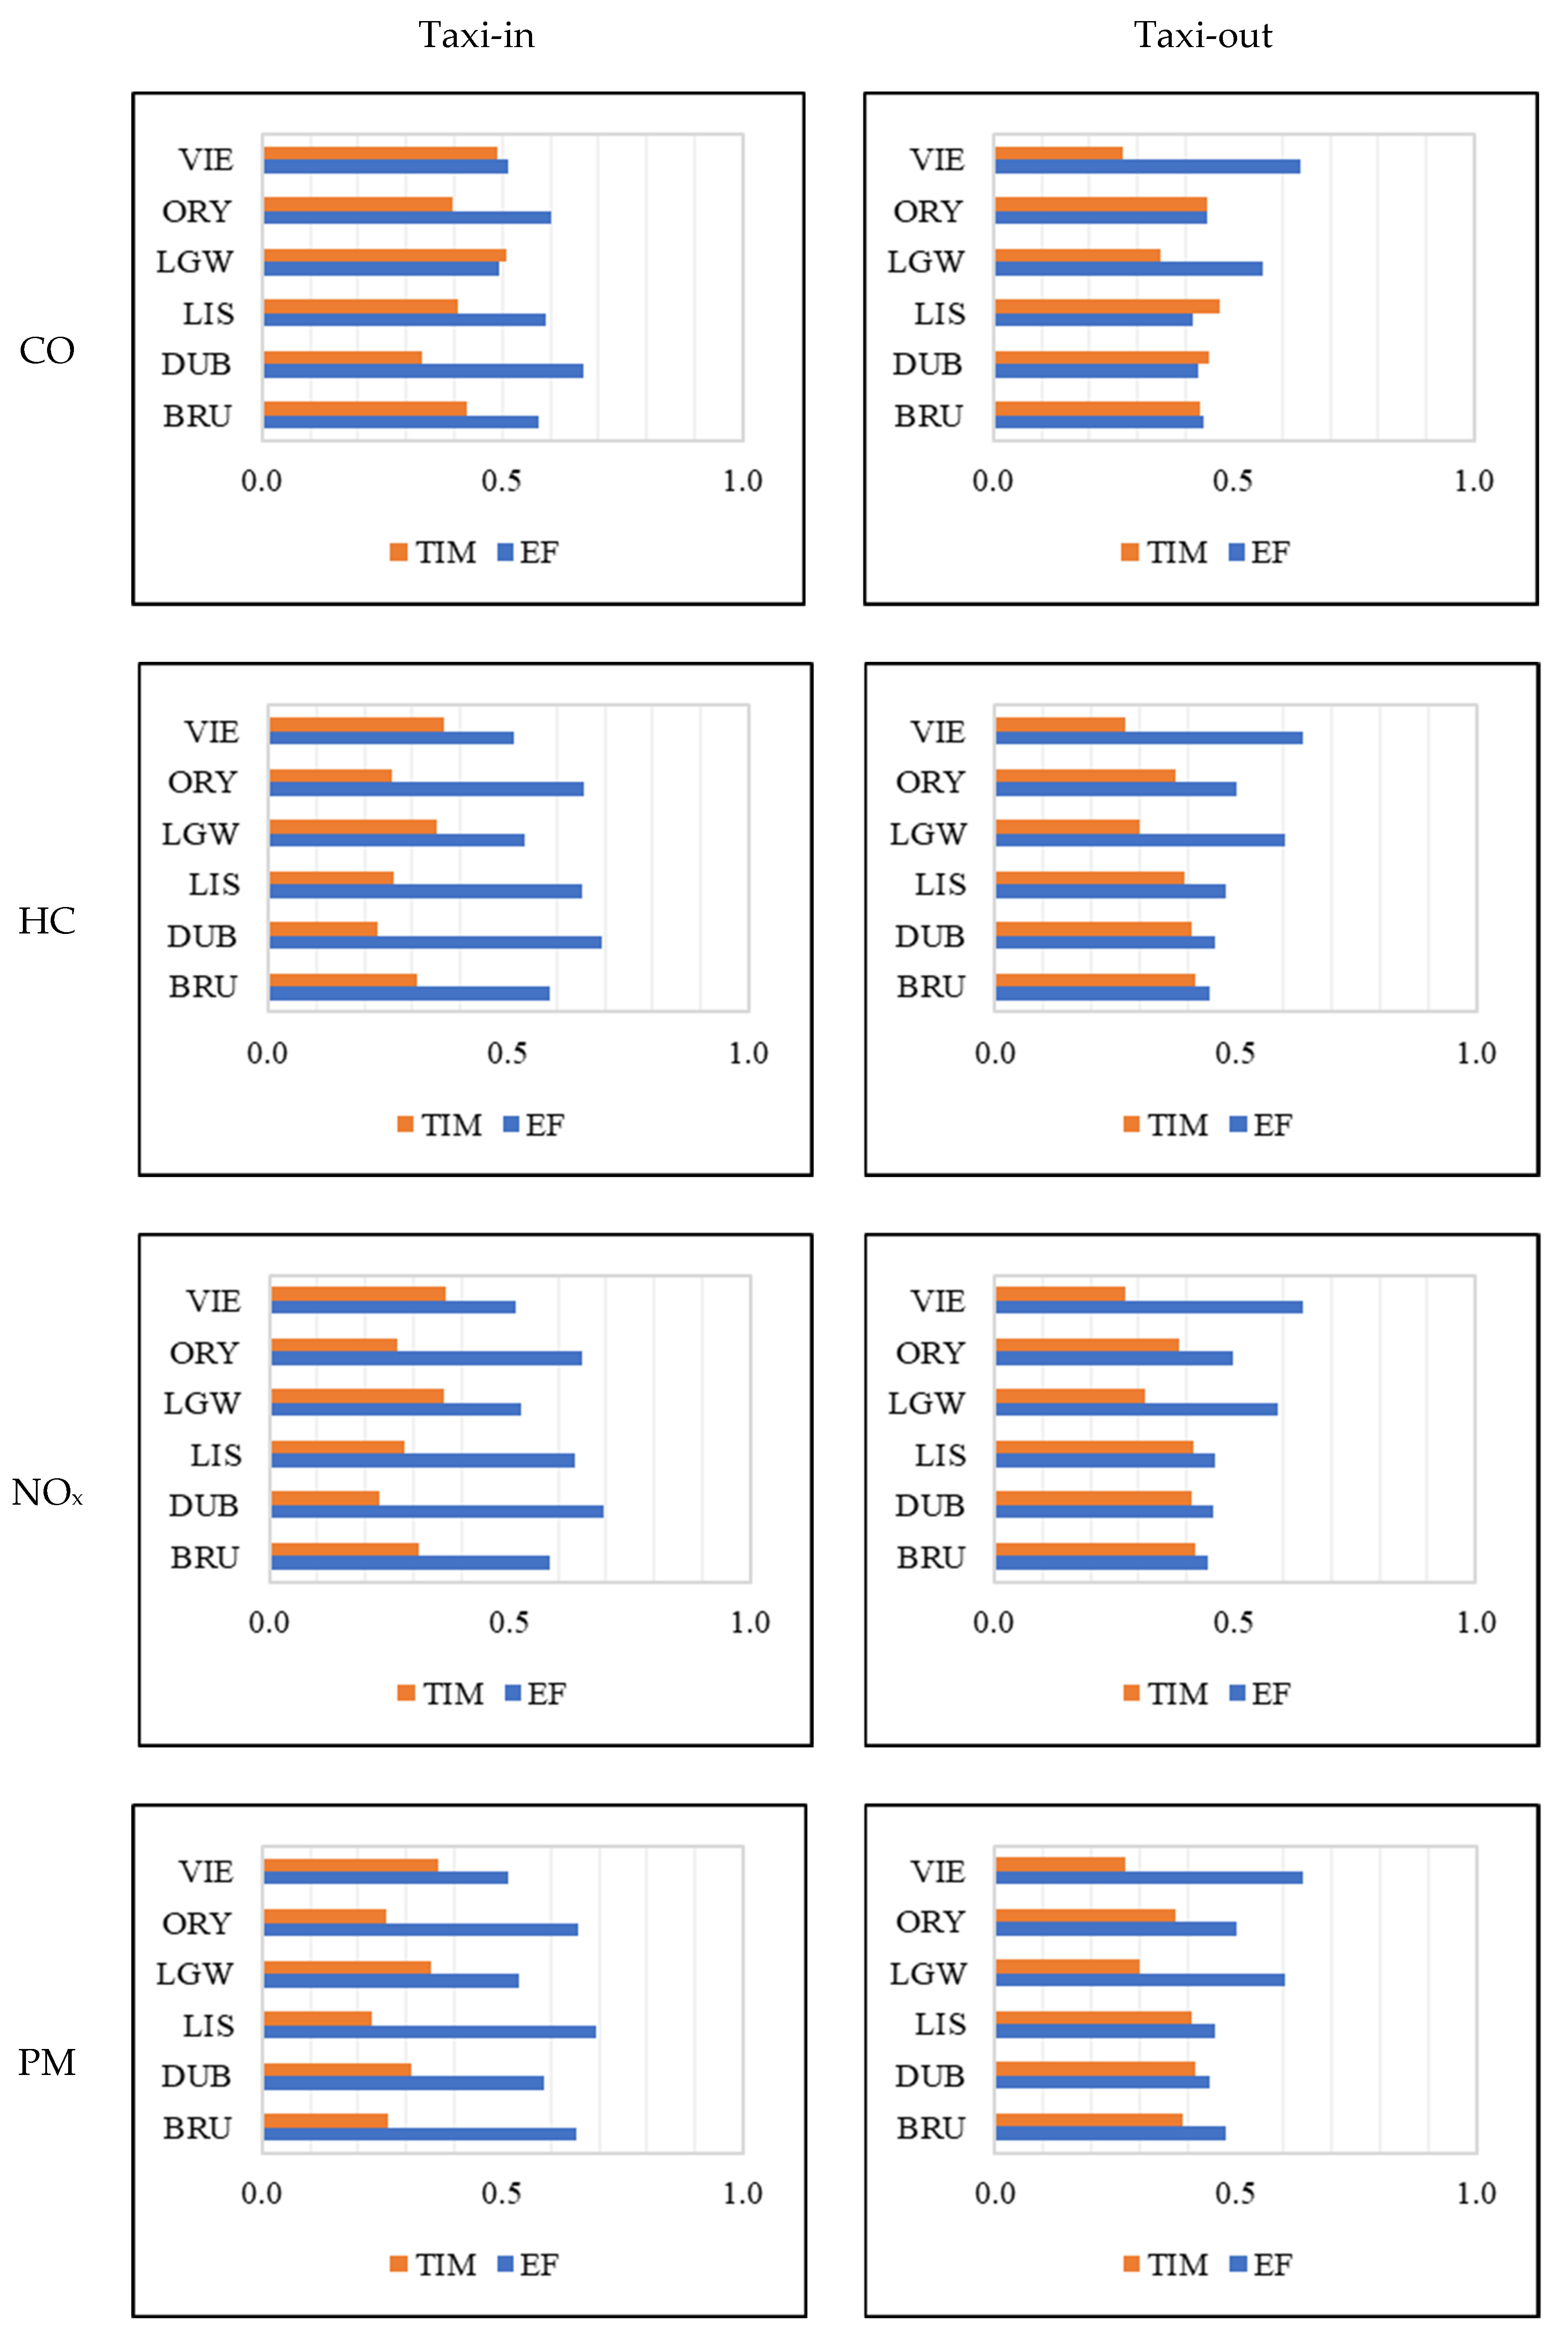
To investigate how various inputs (EFs, TIM) affect the emissions quantified by the model, sensitivity analysis such as Sobol analysis could be applied. This study employed the Sobol method, based on variance decomposition, to quantify the contribution of each parameter. In the present study, the analysis was restricted to the first-order sensitivity indices (S1), which quantify the direct effect of a single input variable on the variance in the output. The Sobol analysis was applied specifically to the taxi-in and taxi-out modes, where two parameters including emission factors and taxi-in and taxi-out TIM were identified as uncertainty sources.
Figure 6 displays the sensitivity index (S1) for each pollutant, which ranges from 0 to 1 with 95% confidence. A parameter is classified as highly sensitive if its first-order sensitivity index, reflecting its contribution to the total output variance, exceeds 0.1 [
7,
10].
In the majority of airports analyzed, the Sobol analysis indicates that EF contributes more significantly than TIM during both taxi-in and taxi-out modes, underscoring the crucial role of aircraft type and fleet composition. However, in some airports like LGW, LIS, and DUB, during taxi-in and taxi-out, correspondingly, the S1 values for TIM surpass those of EF for CO emissions.
Similarly, for HC emissions, the higher sensitivity of EF compared to TIM indicates its greater contribution to uncertainty across most of the presented airports. However, in some cases, particularly during taxi-out phases, EF and TIM are comparable, necessitating a more comprehensive analysis to understand their combined impact on uncertainty. The analysis for PM exhibits a similar pattern, with EF demonstrating greater efficacy than TIM. This consistency underscores the robust influence of EF across various airport contexts. NOx followed a similar pattern, where EF contributions were higher than TIM at most airports, particularly for taxi-in, though in some taxi-out cases, the two inputs contributed almost equally.
Overall, the results highlight that emission factors are the most influential source of uncertainty during taxiing, but the role of TIM should not be overlooked, especially for CO. These findings emphasize the need for improved information on aircraft engine types in publicly available flight-tracking databases and for site-specific taxi-time characterization. Incorporating both elements in future inventories would reduce uncertainty and enhance the reliability of airport-level emission estimates.
5. Conclusions
This study presented a methodology to quantify uncertainties in airport-level hourly resolved aircraft emissions using publicly available flight-tracking data to improve their applicability for local air quality assessment. Monte Carlo simulation and Sobol sensitivity analysis were employed to evaluate two critical aspects: (i) the impact of missing engine model information in publicly available flight-tracking data, which affects the selection of emission factors, and (ii) airport-specific variability in taxiing time-in-mode, which is influenced by traffic patterns and airport infrastructure. Together, these factors were found to significantly influence the overall emission estimates.
In emission quantification, the lack of specific aircraft engine model information introduces uncertainty in the selection of EFs. Furthermore, TIM for take-off, climb-out, and approach was considered based on ICAO values, while for taxi-in and taxi-out modes, the mean and standard deviation taken from Eurocontrol were used. The Monte Carlo simulation showed a distinct pattern in the outcomes for pollutants during different LTO modes: CO and HC exhibited significant fluctuations during taxi-out, whereas NOx demonstrated pronounced differences during modes with high engine power required, such as climb-out. PM emissions showed considerable variation during both climb-out and approach modes.
According to the results of Monte Carlo simulation, emission estimates for NOx were less uncertain across all airports. Similar patterns were observed for CO, HC, and PM at different airports. The average values and the range (indicated in brackets) for the uncertainty estimates by the Monte Carlo approach considering all selected airports were as follows: CO, 23% (18.8–28.9%); HC, 34% (29.7–39.7%); NOx, 7% (4.1–9.4%); and PM, 21% (17.1–27.1%). VIE Airport displayed the highest uncertainty for CO, HC, and PM emissions, while DUB exhibited the highest uncertainty for NOx emissions. Additionally, Sobol analysis revealed that EFs dominate the uncertainty contribution in most cases, confirming the critical role of fleet composition and missing engine-specific data. Taxi times, however, were particularly influential for CO during taxi-out at several airports, highlighting the importance of airport-specific operational data.
Emission intensity was calculated to facilitate the comparison of selected airports. The average values of emission intensity were obtained considering the data at selected European airports and could be used for future studies as an indicator for airport intercomparison and sustainability analysis. The results of emission intensity supported the outcome that CO and HC are mostly produced during taxi-out. NOx has a high range during climb-out. PM emissions showed high EI values during the climb-out and approach modes. However, the 95% confidence interval of emission intensity indicated that the uncertainty for CO emissions is greatest during the taxi-out mode, while HC emissions exhibit higher uncertainty during the approach. In contrast, NOx and PM emissions demonstrate the highest uncertainty during the climb-out mode.
These findings are consistent with previous studies that have identified emission factors and operational parameters as the dominant contributors to uncertainty in airport-level emission inventories [
4,
5,
6,
7,
11]. While earlier work has often focused on individual airports or relied on fixed operational assumptions, this study advances the literature by applying a combined Monte Carlo simulation and Sobol sensitivity analysis framework across multiple airports using publicly available flight-tracking data. By explicitly incorporating airport-specific taxi-time distributions and engine model variation, the proposed approach enables quantification of uncertainty, complementing existing methods and reinforcing the value of uncertainty-explicit emission inventories for airport-scale assessments.
The uncertainty ranges reported in this study can be incorporated directly into atmospheric modeling systems as improved characterizations of airport-related emissions. Such information is particularly useful for chemical transport models and data assimilation methods, which require explicit representation of emission uncertainty to properly constrain model behavior. By identifying the dominant contributing parameters, this framework strengthens the validation of modeling experiments and supports more robust interpretation of airport emissions within broader air quality analyses.
Overall, this study demonstrates that flight-tracking data, despite their limitations, can be used to build reliable emission inventories when coupled with robust uncertainty analysis. The findings underline that emission factors are the dominant uncertainty source, but taxi-time variability cannot be overlooked. Future research should expand the analysis to include additional operational variables, such as aircraft weight, engine aging, and meteorological conditions. Furthermore, the proposed methodology bridges the gap between publicly available flight-tracking data and reliable emission inventories. It provides a solid framework for incorporating uncertainty analysis into local air quality assessment and policy development, which can directly contribute to achieving Sustainable Development Goals, such as reducing the environmental impact of cities (SDG 11.6) and integrating climate action into policies (SDG 13.2). Indirectly, improved exposure assessment enabled by these inventories can help reduce health burdens from air pollution, in line with SDG 3.9.