Article

Numerical Analysis of the Thermal Environment of Rail-Based Hot Launch Systems

by
Yichen Wang
,
Yifei Su
,
Zhongyi Sun
,
Shifan Wu
,
Huaqing Wu
and
Guigao Le
*
School of Mechanical Engineering, Nanjing University of Science and Technology, Nanjing 210094, China
*
Author to whom correspondence should be addressed.
Aerospace 2025, 12(9), 823; https://doi.org/10.3390/aerospace12090823
Submission received: 19 July 2025 / Revised: 10 September 2025 / Accepted: 10 September 2025 / Published: 12 September 2025
(This article belongs to the Section Astronautics & Space Science)

Abstract

This paper investigates the surface thermal environment of a rail-based launch system subjected to missile plume impingement flow during hot launch. This study established a computational model for missile plume impingement on a rail-based launch system based on the three-dimensional Navier–Stokes equations and the realizable k ε turbulence model. CFD simulations were performed for the flow field impacting the launch system with varying deflector heights under different missile flight altitudes. The results demonstrate that when the missile flight altitude H is within 20 m, the launch system experiences a severe thermal environment, the maximum gas temperature on the deflector surface can reach as high as 3200 K, the maximum gas temperature on the surface of the carriage bottom will also exceed 2600 K. Higher deflector heights improve the thermal conditions for facilities beneath the launch vehicle, such as the rail track components and sleepers, it can reduce the maximum surface temperature of the carriage bottom by up to 22.3%, but simultaneously deteriorate the thermal environment on the upper surface of the launch vehicle and the deflector itself. Furthermore, the position where the barrel shock of the engine plume impinges on the deflector alters the gas temperature distribution pattern on the deflector surface. This demonstrates that even a slight variation in the engine’s position relative to the deflector can induce dramatic changes in the gas temperature distribution morphology across the deflector surface. Research demonstrates that during rail-based launch system operations, employing deflectors with optimized heights can significantly improve the thermal environment across critical components. For deflectors of a given height, the current engineering practice of using discrete computational conditions (e.g., H = 0 m, 2 m, and 10 m) requires finer parametric refinement. This is essential to resolve the phenomenon where minor variations in engine-deflector standoff distance induce significant morphological changes in surface gas temperature distribution, thereby enabling further optimization of the launch system’s thermal protection design. The “thermal environment” in this paper only provides the surface gas temperature as a reference.

1. Introduction

1.1. Research Background

Intercontinental Ballistic Missiles (ICBMs) constitute a critical component in strategic competition among major powers. With relentless advancements in military and defense-industrial capabilities, leading nations continuously modernize their ICBM arsenals through iterative capability enhancement cycles [1]. Early-generation Intercontinental Ballistic Missiles (ICBMs) relied on dedicated hardened underground silo complexes for launch. These subterranean installations enabled deployment of heavier payloads, and today, major nuclear powers maintain significant arsenals of modernized silo-based heavy ICBMs—exemplified by Russia’s RS-20 “Satan” (SS-18) and RS-28 “Sarmat” (SS-X-30), the United States’ LGM-30G Minuteman III, and China’s DF-5C. However, their geographically fixed launch positions render them highly vulnerable to prompt counterforce strikes by potential adversaries, resulting in substantially diminished survivability compared to mobile platforms [2,3]. Consequently, since the late 20th century, nations have prioritized the development of road/rail-mobile Intercontinental Ballistic Missile (ICBM) systems. This strategic shift aims to enhance survivability through platform mobility while maintaining rapid-launch readiness—addressing critical vulnerabilities inherent in fixed-silo basing [4], exemplified by systems such as Russia’s RS-12M2 “Topol-M” (NATO: SS-27 Sickle B) and China’s DF-31 (CSS-10). The deployment of sophisticated optical reconnaissance satellite networks by major powers [5]—capable of resolving heavy transporter-erector-launcher (TEL) vehicles carrying ICBMs with sub-meter accuracy—fundamentally compromises the positional security of road-mobile missile systems prior to launch. As a result, a rail-based ICBM launch system carried by trains emerged. Although the optical imaging area of a train compartment on a satellite is similar compared to a heavily loaded vehicle, it is extremely difficult to judge whether it carries an ICBM because the compartment looks almost like an ordinary train, and missile related maintenance, readiness shift personnel living quarters are in the other compartments of the train, this launch system is more stealthy and survivable. Ballistic missiles are powered by rocket engines when in the active phase. The hot, high-speed gas stream ejected by the rocket engine Laval nozzle enters the outside environment and expands rapidly [6], violently impacting the launch system and surrounding equipment, causing the thermal environment of the ground’s launch system equipment to deteriorate, posing a launch safety threat to the entire launch system and even to the ballistic missile [7,8,9]. On 27 September 1991, during a launch exercise of the R-39 “Sturgeon” intercontinental ballistic missile aboard the Russian Typhoon-class strategic nuclear submarine, the missile exploded within its launch tube, causing severe damage to the submarine. On 30 January 2007, the Zenit-3SL carrier rocket exploded immediately after ignition on the launch platform, destroying both the rocket and its payload. On 1 September 2016, a Falcon 9 rocket exploded during a static fire test, damaging the launch platform. On 19 August 2024, a rocket engine detonated on the launch platform at the Augustsburg Rocket Factory. On 19 September 2024, Rocket Lab’s Electron rocket aborted ignition after a ground launch system sensor triggered the flight computer’s abort command. On 21 September 2024, Russia’s RS-28 “Sarmat-2” exploded during a test launch at the Plesetsk Cosmodrome, resulting in the destruction of the launch silo. ICBMs and space launch vehicles share operational similarities but exhibit critical distinctions during launch. As weapon systems, mobile ICBMs prioritize minimal launch preparation time, with personnel and launch equipment typically remaining in proximity during ignition. Conversely, launch vehicles operate without such constraints: umbilical towers facilitating propellant loading and electrical connections are retracted pre-launch, and personnel evacuate to protected facilities [10,11]. Consequently, during rail-based ICBM launches, critical infrastructure—including launch control cars, erection mechanisms, rail tracks, railway sleepers, and flame deflector—are simultaneously subjected to plume impingement. The geometrically complex nature of this region significantly alters the resultant flow field structure [12,13]. Conducting intercontinental ballistic missile tests inherently entails significant international political repercussions and risks of destabilizing regional security dynamics. Moreover, under such complex impingement conditions, sparse instrumentation coverage proves insufficient to comprehensively characterize the impact environment experienced by the launch system. During the ignition and liftoff phase of an intercontinental ballistic missile, the plume exhaust flow from the rocket engine constitutes the primary factor compromising launch system integrity [14,15,16]. Consequently, computational fluid dynamics (CFD) simulations provide critical capabilities to analyze the impingement dynamics of ICBM plumes on rail-based launch systems, inform launch platform design optimization, guide targeted protective measures for specific subsystems, and ensure operational safety for both infrastructure and personnel.

1.2. Research Status

Several researchers have conducted CFD simulation studies on various missiles or rockets. For instance, Yin, J.T. et al. performed CFD simulations to investigate the flight stability of the Air Force Modified Basic Finner Missile (AFBM). Utilizing the Unsteady Reynolds-Averaged Navier–Stokes (URANS) equations, they simulated both the pure spin and spin-deformation coupling motion of the AFBM. The results revealed that the aerodynamic characteristics induced by spin-deformation coupling exceeded those from pure spin by an order of magnitude in terms of lateral force generation [17]. Tahani, M. et al. conducted CFD simulations of a canard-controlled missile, demonstrating through comparative analysis of varying canard taper ratios at different angles of attack that the maximum combined lift-drag efficiency occurs at a 0.7 taper ratio under 4° angle of attack [18]. Li, F. et al. investigated the aerodynamic and flight characteristics of a ground-effect missile through integrated CFD simulations and wind tunnel testing. The results indicate that such missiles exhibit highly complex dynamic responses, rendering existing missile flight control methodologies inadequate to accommodate these behaviors [19]. Rivord, T.A. et al. performed CFD simulations of the water deluge system for noise and overpressure suppression during Space Launch System (SLS) launches. Comparison with flight data measurements from the Artemis I mission demonstrated that the simulation results accurately predicted launch environmental conditions, thereby providing critical design validation for the water-cooling and noise-abatement system [20]. Harris et al. conducted CFD simulations of the flow field for the Space Launch System (SLS) launch infrastructure. They extracted flow field data from the flame deflector surfaces in the simulation results and imported these datasets into an ablation simulation program. This methodology enabled further simulation of high-temperature material ablation, revealing approximately 0.25 inches of surface material erosion at locations subjected to plume impingement [21]. Daniel et al. utilized the Chemical Equilibrium with Applications (CEA) code to compute the nozzle exit conditions of the Ares V launch vehicle’s engines. These boundary conditions were subsequently applied in CFD simulations to calculate the pressure and temperature distributions of the exhaust plume impinging on the flame deflector. The results confirmed agreement between CFD predictions and simplified analytical models, while also demonstrating that larger deflector angles induce exhaust flow back-splash [22]. Zhou, Z.T. et al. performed numerical simulations of a launch vehicle flame deflector with varying deflector angles. The results demonstrate that optimal exhaust efficiency occurs at impingement surface angles near 25°, where appropriately angled deflector exits significantly mitigate exhaust backflow and splash-back effects [23]. Furthermore, they investigated the impact of plume-air afterburning phenomena on the surface temperature and pressure distribution of the flame deflector. Quantitative distribution curves along the exhaust direction show that, compared with the non-reacting flow model, the CFD calculation results indicate that when the afterburning effect is considered, the surface temperature increases by 24.9% and the pressure increases by 7.2% [24]. Zhao, C.G. et al. conducted numerical simulations of exhaust plume impingement on a flame deflector at four distinct altitudes (H = 0 m, 0.2 m, 2 m, and 10 m) during a single-nozzle launch vehicle liftoff. The study further accounted for lateral wind-induced vehicle drift and afterburning effects on the flow field. Results indicate that vehicle drift compromises flow containment stability within the flame deflector, while incorporating afterburning models elevates exhaust plume temperatures significantly [25]. Lu, C.Y. et al. performed two-phase numerical simulations of the alumina (Al2O3) particulate-laden exhaust plume from a hybrid solid–liquid rocket during launch. Results demonstrate that the launch pad experiences severe thermal conditions at altitudes between 3 m and 20 m. Furthermore, vehicle lateral drift causes thermal environment deterioration in previously unexposed regions, elevating surface gas temperatures by approximately 30% at equivalent altitudes [26]. Su, Y.F. et al. simulated the gas-impact-and-seawater-spray-cooling flow field for the CZ-8X launch vehicle’s maritime platform. Results indicate that the optimal spray velocity for the water deluge system is approximately 20 m/s. As the vehicle ascends, exhaust plumes fully impinge on deck surfaces near the launch platform at 30 m altitude, subjecting launch equipment to the most severe thermal conditions [27].
The aforementioned studies demonstrate that CFD simulation methodologies have achieved increasing maturity in applications for missile weapon systems and aerospace engineering. Exhaust plume impingement on launch infrastructure imposes significant thermomechanical loads, with the spatial extent of plume impact expanding as the rocket gains altitude. Even for identical-type rocket engines, modifications to the geometric configuration of the underlying launch infrastructure alter the characteristics of thermal environment deterioration. Existing CFD studies on missiles predominantly focus on in-flight aerodynamic characteristics rather than launch system interactions. This research emphasis arises because such missiles are typically air-launched from carrier aircraft, enabling engine ignition post-release—thereby achieving significant thermomechanical isolation from the launch platform. Compared to such air-launched systems, intercontinental ballistic missiles (ICBMs) and space launch vehicles exhibit analogous launch environments. Their hot launch operations typically utilize relatively static land-based or subsea platforms, inevitably subjecting the entire launch infrastructure to severe thermal loading. During rail-based launches, structural components influencing exhaust plume dynamics—including launch cars, rails, sleepers, and erection mechanisms—remain non-retractable. Crucially, rail infrastructure components require frequent reuse across multiple missions. Current research on CFD simulations of flow fields involving such geometrically complex launch infrastructure remains limited. A primary contributing factor is that increasing geometric complexity necessitates larger-scale and more computationally demanding meshing. However, rapid advancements in computing capabilities have progressively matured the tools and techniques for conducting high-fidelity CFD simulations of intricate structural configurations. Differences in geometry may lead to variations in flow behavior. This paper focuses on elaborating the reasons why minor changes in “flight altitude/deflector height” result in significant differences in surface gas temperature distribution, which distinguishes it from other similar studies. Additionally, due to confidentiality policies, there are relatively few papers on ballistic missile launch devices of this type; research in this area typically focuses on publicly available launch sites for carrier rockets. This study establishes a numerical model simulating the impingement of rocket engine plumes on a rail-based launch system during the hot launch of a ballistic missile. First, computational results were validated against experimental data to confirm the numerical model’s reliability. Subsequently, the model was employed to simulate plume impingement on deflectors of varying dimensions at multiple flight altitudes. Analysis of these computational results revealed characteristic patterns of exhaust plume impact on such launch systems, providing critical references for launch infrastructure design and thermal protection strategies.

2. Computational Model

2.1. Geometric Model

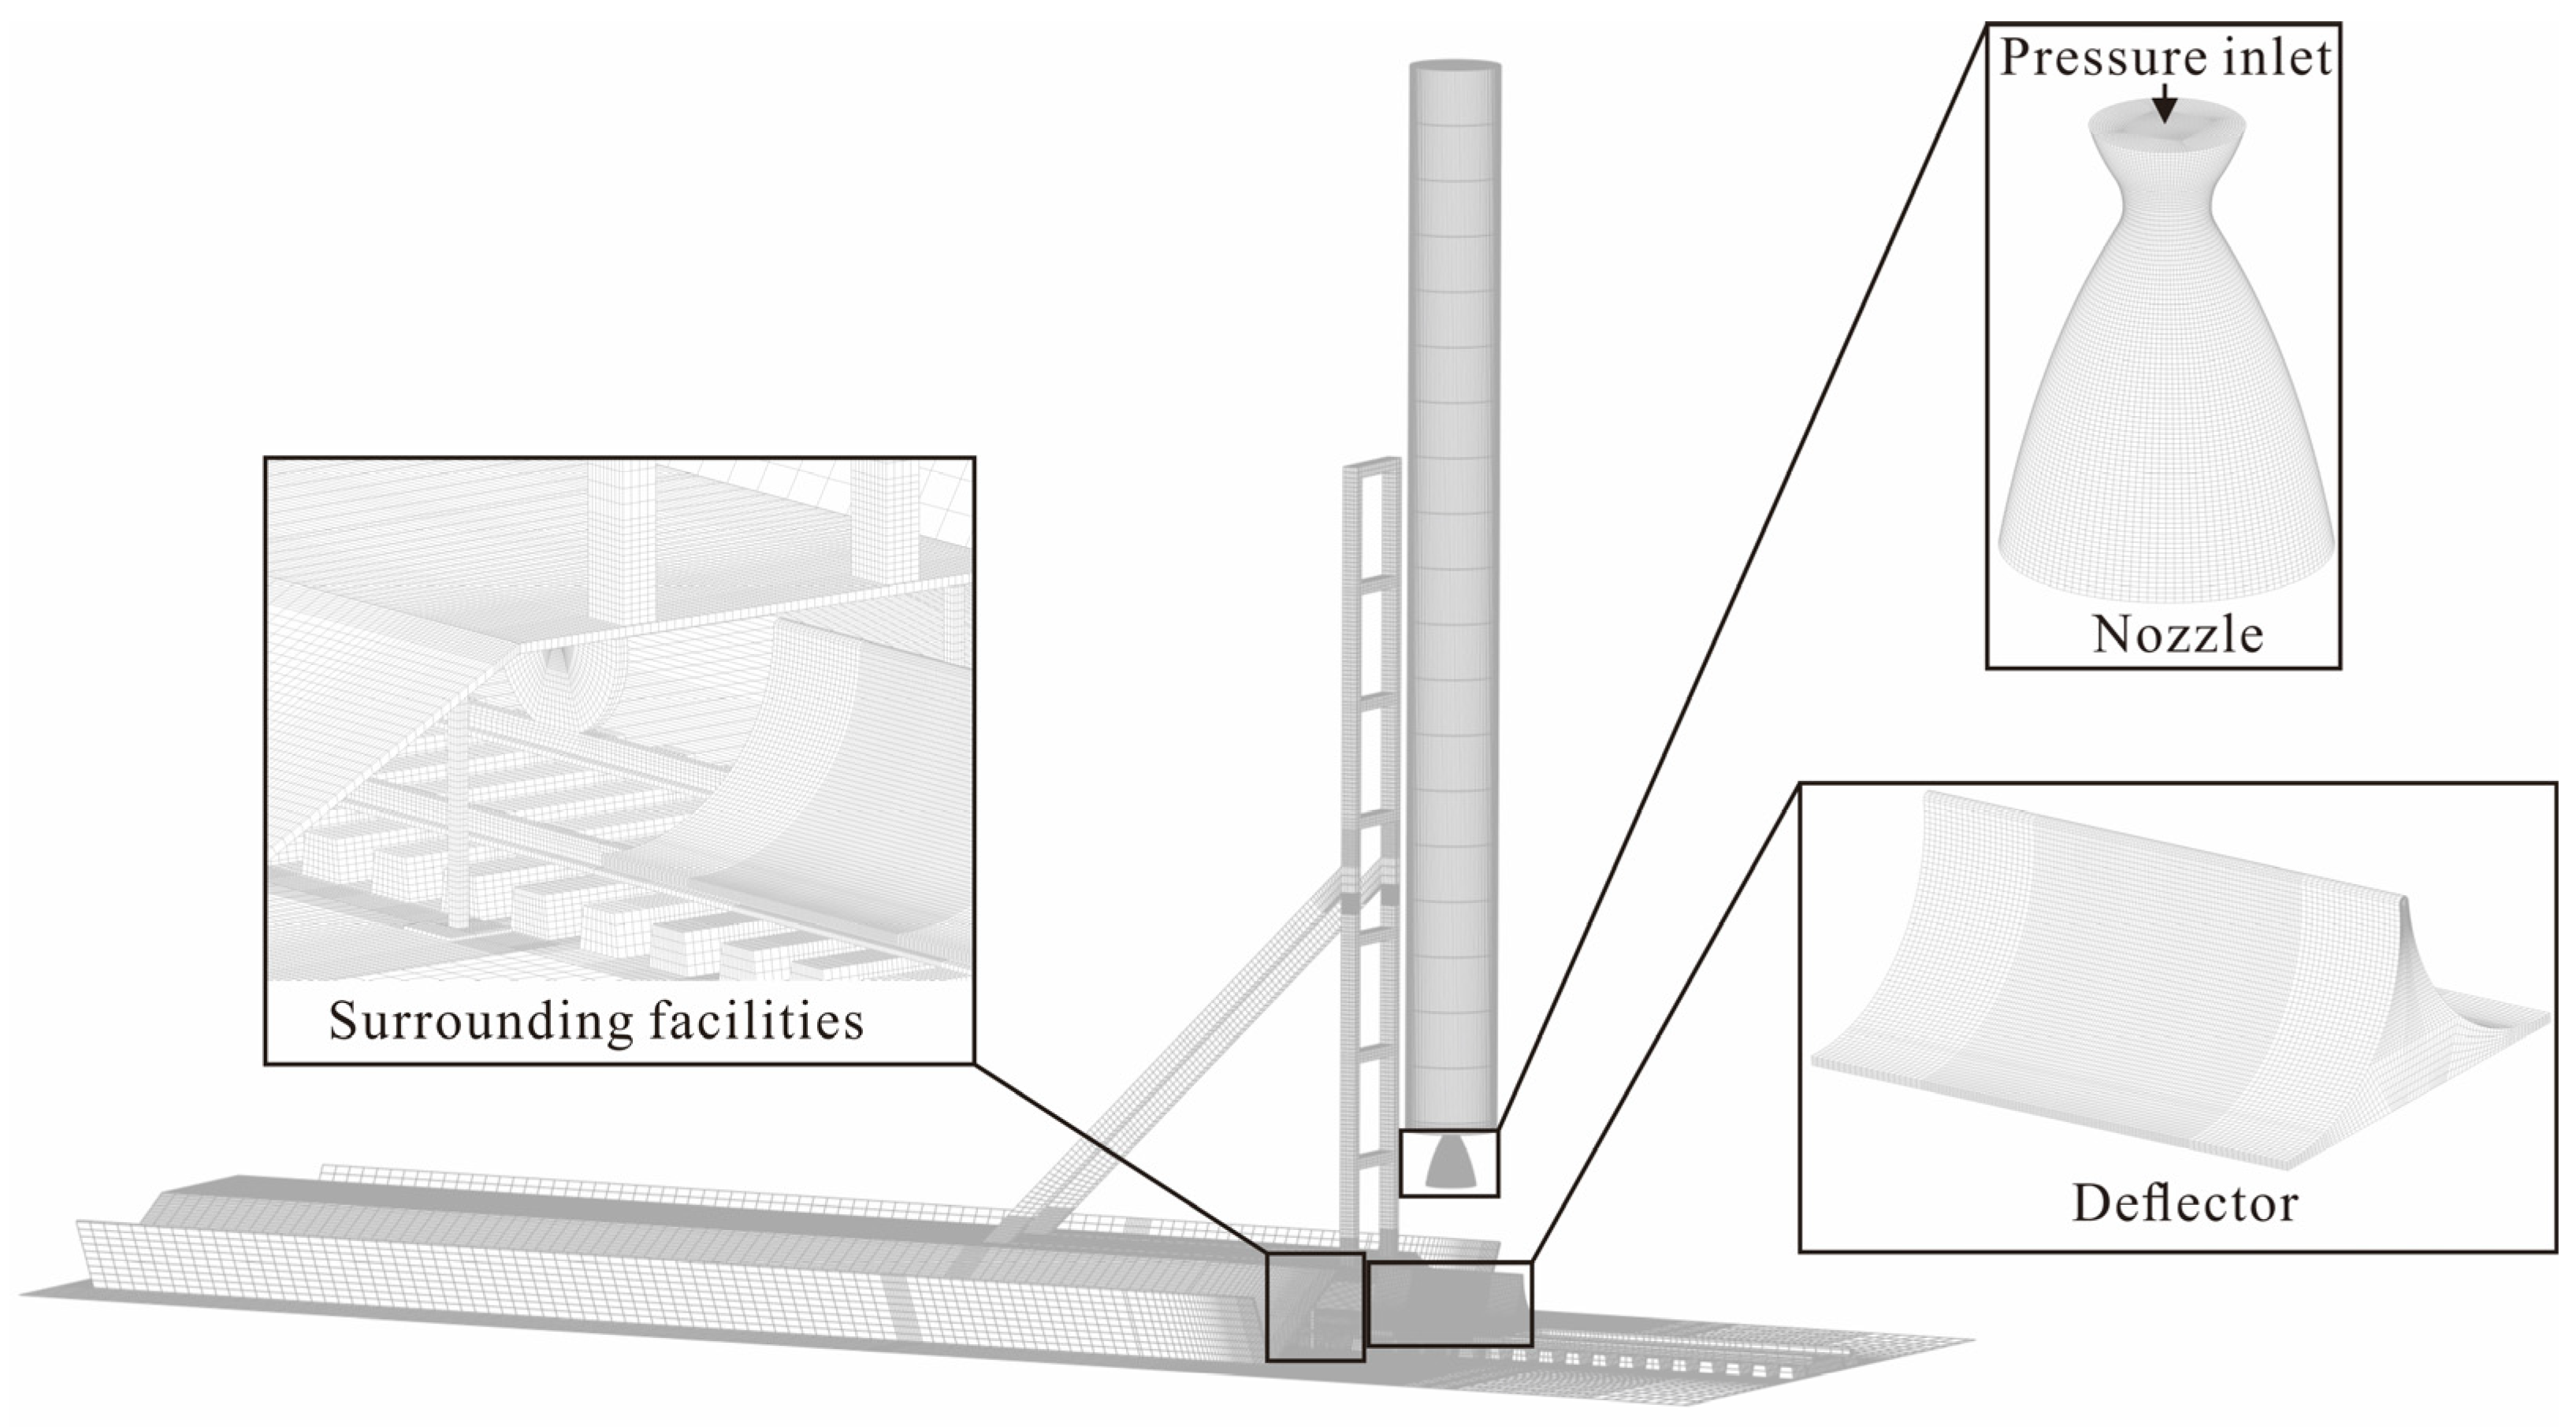
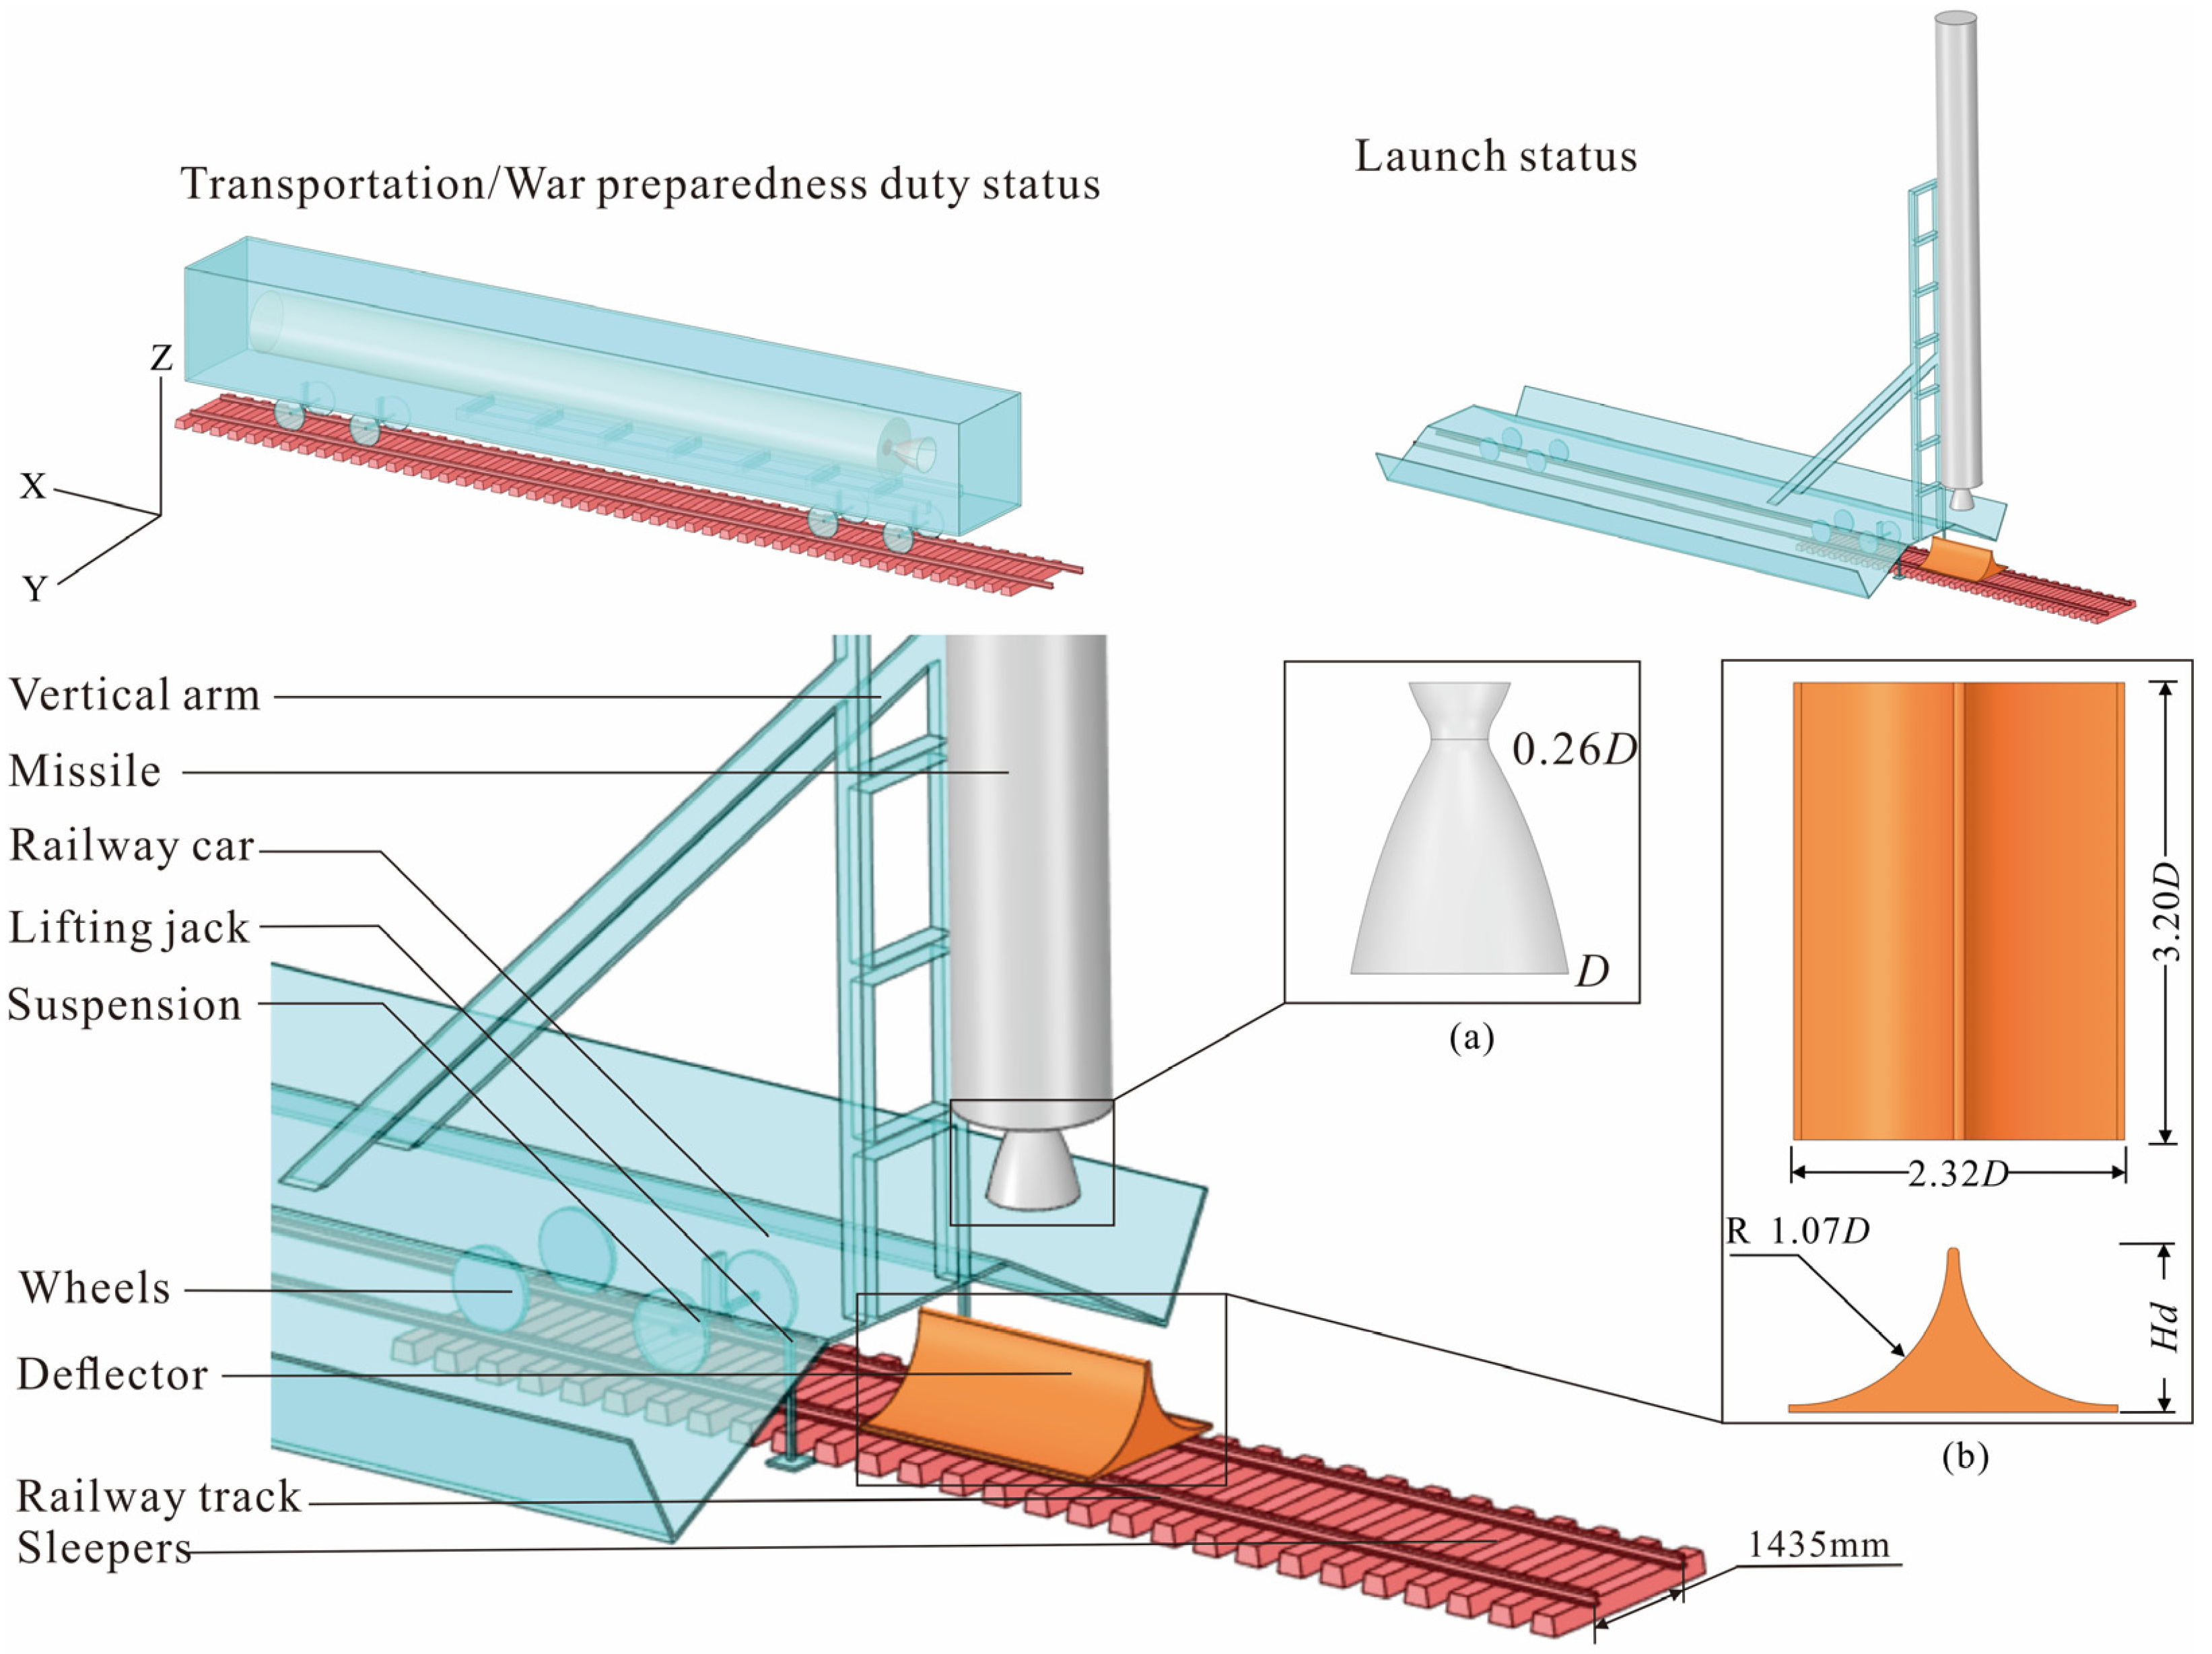
The launch system is geometrically simplified as illustrated in Figure 1. During the transition from transport/combat readiness posture to launch configuration, the train car roofs pivot bilaterally open. Concurrently, the erection mechanism rotates the missile to a vertical launch orientation perpendicular to the ground. To minimize the adverse effects of exhaust plumes on both the launch system and railway infrastructure, a simplified bilateral arc-shaped flame deflector is rigidly mounted to the tracks beneath the missile. The ballistic missile’s propulsion system comprises a single rocket engine with a Laval nozzle. The nozzle’s inlet and throat diameters measure 0.46 D and 0.26 D, respectively, relative to the exit diameter D, as illustrated in Figure 1a. Figure 1b depicts the geometric characteristics of the deflector plate, with dimensions of 3.20 D along the X-axis and 2.32 D along the Y-axis. The deflector plate height is denoted as Hd, with its magnitude varying across computational cases. A simplified suspension assembly is modeled proximal to the wheel position adjacent to the plume core region. The railcar’s rear section incorporates a pair of simplified support struts. The track gauge measures 1435 mm, with railway sleepers arranged at a density of 1760 units per kilometer.

2.2. Mesh and Boundary Conditions

The complex geometry comprising the railcar, support struts, sleepers, rails, erection mechanism, and deflector plate—despite the computational domain’s limited physical scale—generates intricate wave system structures during plume impingement. This necessitates preservation of critical geometric features in the computational mesh. Furthermore, the multiple missile altitude (H) conditions analyzed demand stringent control over total grid cell counts to maintain computational tractability. For the CFD simulation of a ballistic missile hot launch from a rail-based system, a structured grid was employed to enhance mesh orthogonality. The computational domain mesh and key details are illustrated in Figure 2. Local grid refinement was implemented around the rocket engine nozzle and high-gradient flow regions beneath it, achieving improved numerical accuracy while optimizing computational efficiency. 99.99% of grid cells have a Jacobian determination of 2 × 2 × 2 greater than 0.75, and the minimum value of Jacobian determination is 0.50. 99.91% of grid cells have a minimum dihedral angle greater than 58.5°. 98.43% of grid cells have Eriksson skewness greater than 0.9, and the minimum value of Eriksson skewness is 0.691.
Mesh independence verification was conducted for the computational mesh. Using the exemplary case of missile altitude H = 2 m and deflector height Hd = 1.2 D, computations were carried out using 6.94 million, 9.27 million, 11.04 million, and 13.31 million cells of mensh. Temperature distributions along two monitoring lines on the deflector plate were extracted and plotted for comparative analysis.
Figure 3a displays the temperature contour on the upper surface of the deflector. Figure 3b,c present the temperature distribution along monitoring line 1 and monitoring line 2, respectively, derived from the contour data. For monitoring line 1, results from the 9.27 million, 11.04 million, and 13.31 million cells of mesh exhibit minimal divergence, while the 6.94 million cells of mesh achieves reasonable agreement only within peak temperature zones. Conversely, temperature profiles along monitoring line 2 demonstrate excellent data convergence across all mesh resolutions. Therefore, in the CFD simulation calculation of this study, the grid size adopts the same grid scale as H = 2 m, Hd = 1.2 D, 9.27 million cells of mesh. All wall boundaries, such as those of the train, vertical arm, deflector, engine nozzle, and missile wall, are adiabatic walls. The engine adopts non-classified data of launch vehicle engines, with a total inlet temperature of 3800 K, gas components listed in Table 1, and a total pressure of 11 MPa. The data in Table 1 is sourced from a “liquid oxygen-kerosene” liquid rocket engine with partially public data in an actual engineering project, which is the candidate engine for the CZ-12 currently in the design phase. If solid propellants were employed, there might be incompletely burned solid particles (e.g., aluminum trioxide), which would necessitate the addition of a model for addressing the flow behavior of solid particles (such as the EDP model). The average molecular weight of air is taken as 28.85 kg/kmol. The initial air temperature in the computational domain is set to 300 K, and both the air pressure and the pressure at the pressure outlet are set to 101,325 Pa. There are a total of 5 missile flight altitudes H, including H = 0 m, H = 2 m, H = 10 m, H = 20 m, and H = 30 m, as well as 3 deflector heights Hd = 1.2 D, Hd = 1.4 D, and Hd = 1.6 D.

3. Numerical Method

3.1. Governing Equations

Both the multi-component gas flow of the missile engine and the air satisfy the continuity assumption and the ideal gas state equation [28]. The three-dimensional compressible Navier–Stokes equations for multi-components are written as follows [27]:
t Ω U d Ω + Ω ( H c H v ) d S = Ω Q d Ω
where the volume of the control body is Ω and the boundary is of d Ω , and Q is the control body source term. U is the control body conservation variable, H c and H v are the convective and viscous fluxes across the control body boundary, and they are defined as follows [27]:
U = ρ ρ u ρ v ρ w L , H c = ρ V ρ u V + n x p ρ v V + n y p ρ w V + n z p ( L + p ) V , H v = 0 n x τ x x + n y τ x y + n z τ x z n x τ y x + n y τ y y + n z τ y z n x τ z x + n y τ z y + n z τ z z n x Θ x + n y Θ y + n z Θ z
In the above equations, ρ is the fluid density, p is the hydrostatic pressure, and L is the energy density per unit volume. V is the normal velocity of the control body unit, and u , v and w are the velocity components in the x , y and z directions, respectively. The relationship between them can be expressed as follows:
V = u n x + v n y + w n z
Based on the Stokes assumption, the viscous stresses τ and Θ of the fluid are defined as follows [28]:
τ x x = 2 μ u x 2 3 μ ( u x + v y + w z ) τ y y = 2 μ v y 2 3 μ ( u x + v y + w z ) τ z z = 2 μ w z 2 3 μ ( u x + v y + w z )
τ x y = τ y x = μ ( u y + v x ) τ x z = τ z x = μ ( v z + w y ) τ y z = τ z y = μ ( u z + w x )
Θ x = u τ x x + v τ x y + w τ x z + K T x Θ y = u τ y x + v τ y y + w τ y z + K T x Θ z = u τ z x + v τ z y + w τ z z + K T x
In the above equations, μ is the dynamic viscosity coefficient, K is the heat transfer coefficient, T is the fluid temperature.

3.2. Spatial Discretization Schemes

Ballistic missiles and launch vehicles share similar propulsion characteristics: high stagnation temperatures/pressures at engine inlets produce highly underexpanded supersonic exhaust plumes with complex wave systems. The second-order upwind TVD scheme provides high accuracy for highly compressible flows, exceptional shock resolution capabilities, and superior numerical robustness [29,30]. Consequently, this scheme was employed to compute the exhaust plume flow field of the ballistic missile engine.
Using the finite volume method to discretize Equation (1) [30] as follows:
d U d t = 1 Ω m = 1 N F H c H ν m Δ S m Q Ω
In the equations, N F is the number of control volume faces, and Δ S m is the length or area of the boundary, with m being the index of the boundary.
The second-order upwind Total Variation Diminishing (TVD) scheme is used to discretize the convective flux [30]:
1 V i , j , k V i , j , k U d V + H ˜ c i + 1 / 2 , j , k H ˜ c i 1 / 2 , j , k + H ˜ c i , j + 1 / 2 , k H ˜ c i , j 1 / 2 , k + H ˜ c i , j , k + 1 / 2 H ˜ c i , j , k 1 / 2 = 0
In the equations, the numerical circulation quantities are as follows:
H ˜ c i + 1 / 2 , j , k = 1 2 H ˜ c i , j , k + H ˜ c i + 1 , j , k k = 1 m α ˜ k λ ˜ k e ˜ k A ˜ H ˜ c i , j + 1 / 2 , k = 1 2 H ˜ c i , j , k + H ˜ c i , j + 1 , k k = 1 m β ˜ k κ ˜ k e ˜ k B ˜ H ˜ c i , j , k + 1 / 2 = 1 2 H ˜ c i , j , k + H ˜ c i , j , k + 1 k = 1 m γ ˜ k ϑ ˜ k e ˜ k C ˜
In the equation, λ k , κ k and ϑ k are the eigenvalues of the linearized replacement matrix, α k , β k and γ k are the coefficients of the expansion terms of the linearized replacement matrix, e k A , e k B and e k C are the eigenvectors of the linearized replacement matrix, and the viscous flux is dispersed using second-order center difference.

3.3. Turbulence Model

Although the k-ε SST turbulence model can predict flow separation phenomena more accurately and reduce reliance on wall functions, it is mostly used in the aviation field where extremely high accuracy of turbulence solution is required, such as aircraft airfoils and turbine engines (separation in turbine blade passages). For aircraft airfoils or turbine engines, the mesh size in the far-field of the incoming flow can be relatively large, and only finer meshes need to be used on the surfaces of the airfoils, engine blades, and walls. However, in the research scenario of this paper, a considerable number of meshes are required to describe the gas jet inside the nozzle. Subsequently, the gas flow is accelerated through the Laval nozzle to a speed exceeding 5 Mach, so a large area below the engine (the size of this area increases with the increase in the rocket’s flight altitude) also requires a fine mesh. The k-ε SST turbulence model incurs high computational cost and requires finer wall meshes. In contrast, the Realizable two-equation model can also well describe the diffusion of jet impinging on a plane in high-speed strain rate flows [31,32,33,34,35,36] (such as jets and impinging flows) and has low computational cost. Therefore, the latter is selected in this paper.
The turbulence dissipation rate ε in the equation no longer includes the generation term G k in the turbulence kinetic energy equation. The coefficient C μ in the turbulent viscosity Equation μ t is related to the strain rate, which better describes the energy conversion process.
Turbulent kinetic energy equation [31]:
ρ k t + ρ k u i x i = x j μ + μ t σ k k x j + G k ρ ε
In the equations, μ represents the mixture viscosity, G k is the generation term of turbulent kinetic energy k due to the mean velocity gradient, with the constant coefficient σ k = 1.0 .
Turbulent dissipation rate ε equation [31]:
ρ ε t + ρ ε u i x i = x j μ + μ t σ ε ε x j + ρ C 1 E ε ρ C 2 ε 2 k + v ε
In the equation, the constant coefficient σ ε = 1.2 , C 1 = 1.44 , C 2 = 1.9 , E is the average characteristic strain rate.

4. Model Verification

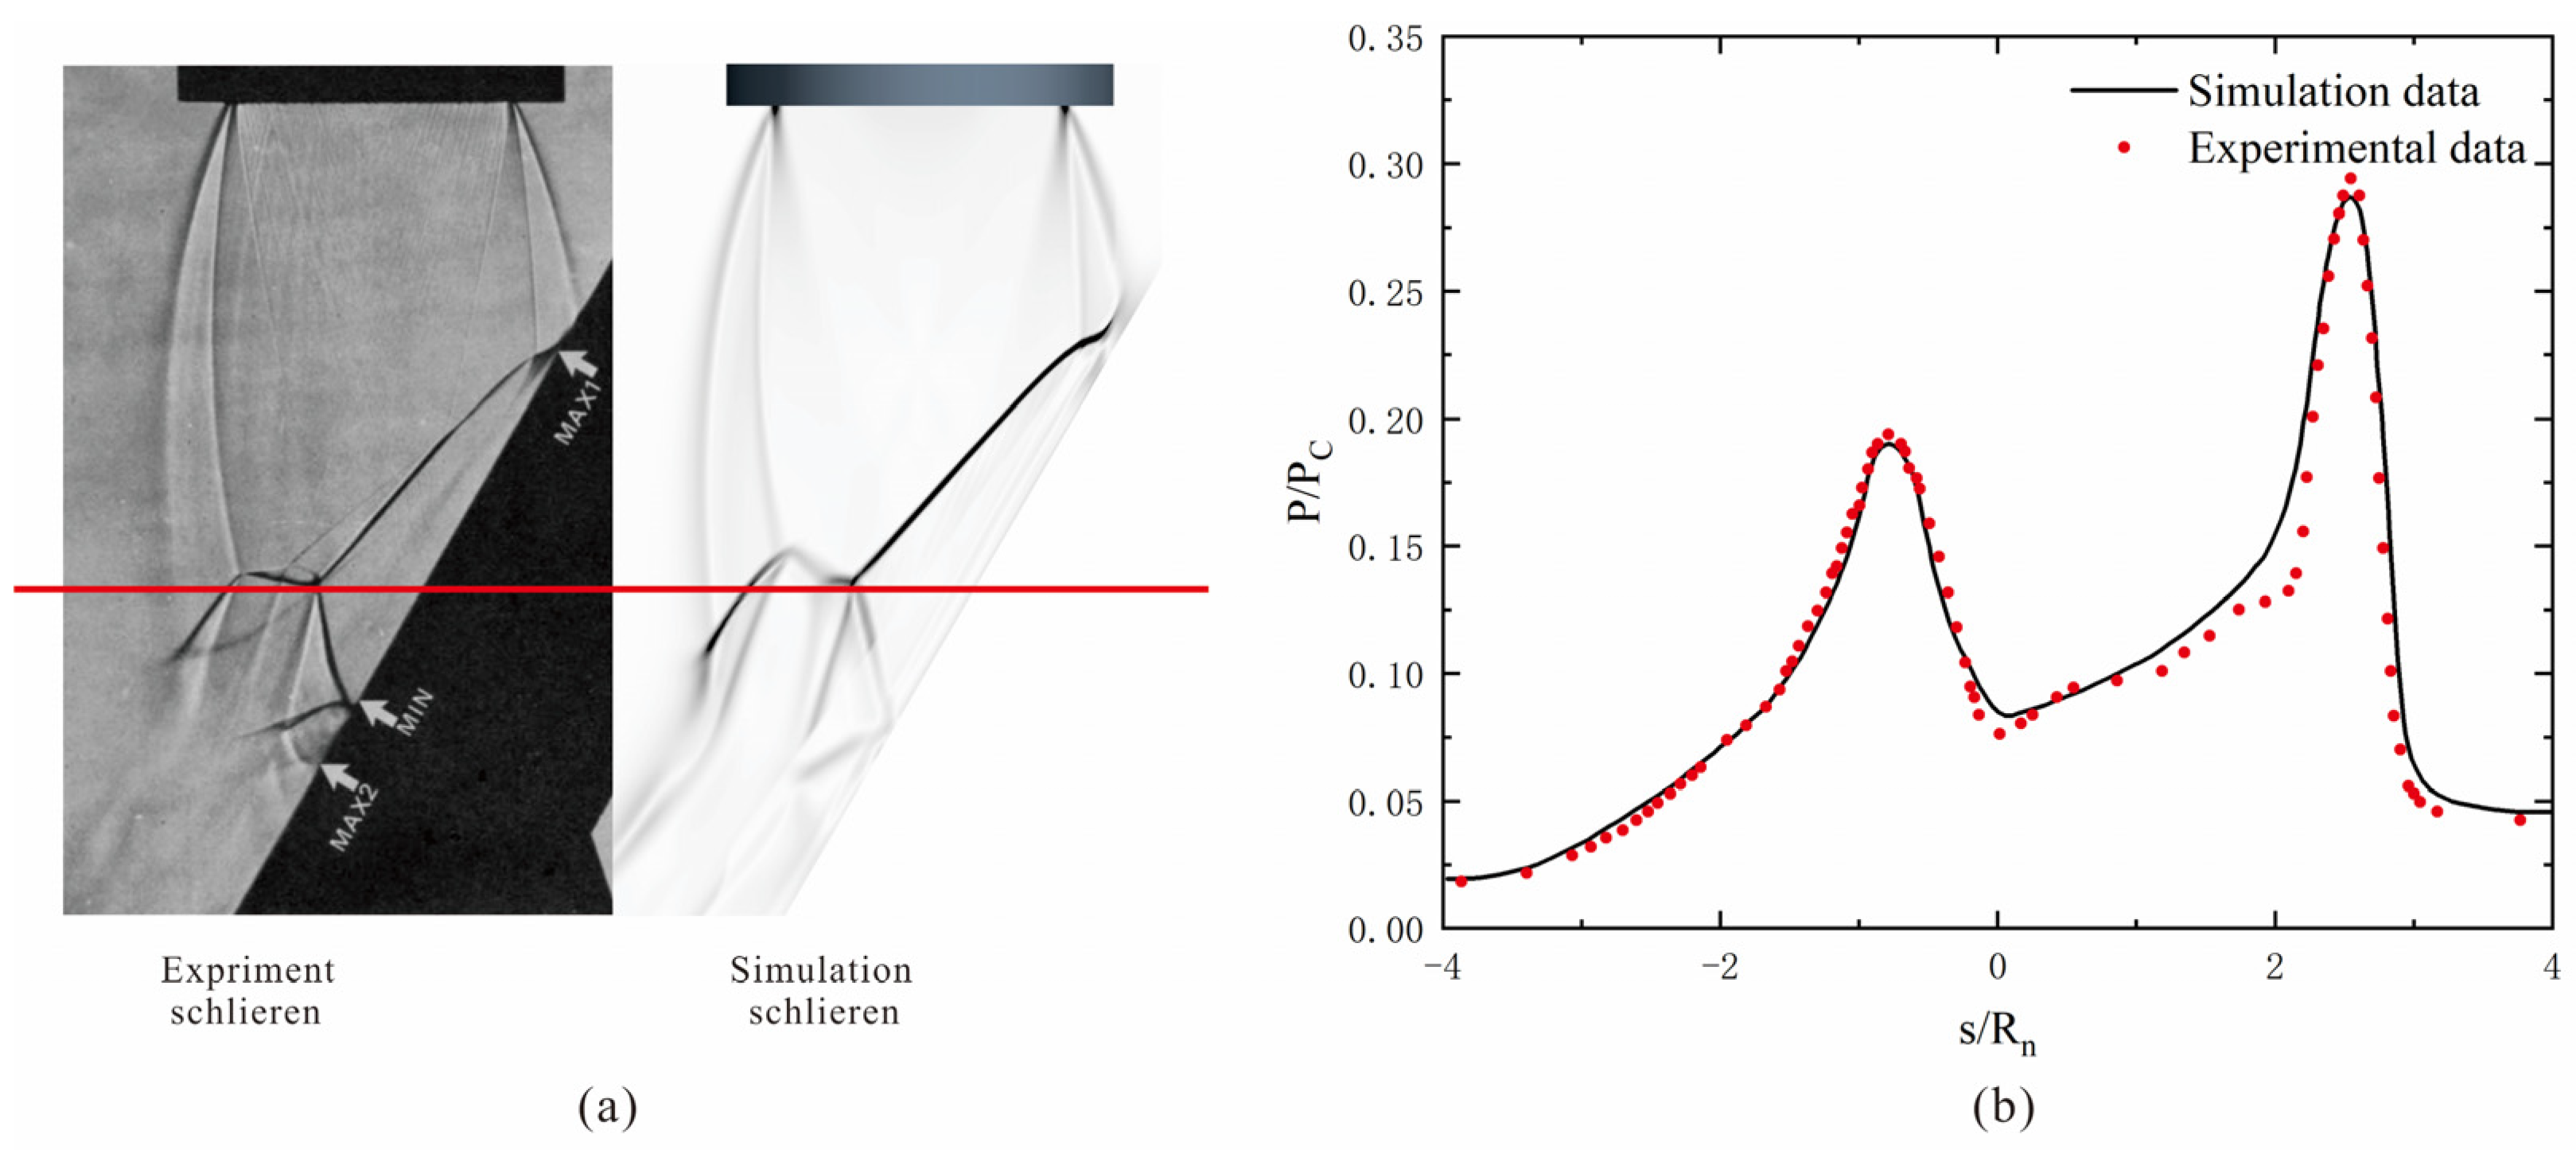
To verify the validity and accuracy of the numerical method and turbulence model in this paper, numerical simulations were performed on the experiments of Lamount and Hunt [37]. The nozzle exit radius Rn = 15 mm, the plate diameter is 300 mm, the throat radius r = 10.7 mm, the distance from the center point of the nozzle exit plane to the plate is 4Rn, the angle between the plane and the nozzle axis θ = 30°, and the ratio of the pressure at the nozzle exit to the nearby ambient pressure PR = 2.0. Figure 4a shows the comparison between the experimental schlieren image and the calculated schlieren image. The results indicate that the wave system structure of the numerically calculated flow field is clear and highly consistent with the experimental schlieren image. Figure 4b presents the comparison between the experimental results and calculated results of the pressure distribution along the midline of the plate surface, where s is the distance from the pressure measuring point to the nozzle axis, and Pc is the total pressure at the nozzle inlet. The results show that the pressure distribution of the calculated results is in good agreement with the experimental results in the literature. In summary, this proves the accuracy of the numerical method used in this paper.

5. Results and Discussion

5.1. Flow Field Isosurface

To accurately understand the flow field characteristics of the railway launch system during operation, the flow field results at different missile flight altitudes (H) under Hd = 1.2 D are first extracted and analyzed. The Mach number is an important dimensionless quantity that can reflect the flow state of the high-speed gas ejected from the missile engine. The isosurface Mach number contours and temperature contours in the YOZ direction and XOZ direction at various flight altitudes of the missile are shown in Figure 5a,b, respectively. Parts such as the train carriage and thevertical arm are made transparent to intuitively show the interaction area between the missile engine wake and the train carriage. The gas flow from the missile engine is discharged through the laval nozzle, generating a series of clear wave system structures and plume boundary waveforms. When H is relatively large, the gas flow expands sufficiently, forming more than 5 distinct shock cells, which impinge on the deflector, stagnate, and diffuse to the surrounding area. The interaction position between the missile gas wake and the launch system changes with the increase in the missile flight altitude. When H = 0 m, the YOZ isosurface of the Mach number contour shows that the high-speed gas flow moves to both sides of the deflector, while the XOZ isosurface is orthogonal to the direction of the deflector, resulting in an insignificant diffusion trend of the high-speed gas flow on this isosurface. Therefore, it is necessary to further analyze in combination with the temperature distribution on the isosurfaces. The YOZ isosurface shows that in the core region of the high-speed gas flow, the temperature contour is basically opposite to the Mach number contour in the core region of the jet: the higher the gas flow velocity, the lower the temperature, this phenomenon is related to the ideal gas law and the conservation of internal energy. The gas flow stagnates and heats up when moving to the deflector. The XOZ isosurface shows that after impacting the deflector, the gas flow passes through the bottom of the train carriage, leading to a sharp increase in the gas temperature at the bottom of the carriage. A comparison of this phenomenon with the Mach number contour indicates that although the bottom of the carriage is not directly impacted by the gas flow and the change in gas velocity here is insignificant, the temperature here is relatively high. The side walls and bottom of the train carriage in the launch state together form a relatively enclosed environment, which hinders the flow of air and exacerbates the deterioration of the thermal environment at the bottom of the carriage. At H = 2 m, the Mach number contour shows that the jet produces a complete shock cell; the YOZ isosurface of the temperature contour indicates that the high-temperature gas, which has not yet contacted the sleeper, tends to spread toward the sleeper, while the XOZ isosurface shows that the gas temperature at the bottom of the train carriage remains relatively high at this time. At H = 10 m, the Mach number contour shows that the jet forms 4 clear and complete shock cells, and the influence range of the tail of the high-speed jet expands slightly; however, the flow velocity near the bottom facilities decreases. The temperature contour indicates that due to the increase in the missile flight altitude, the thermal environment at the bottom of the carriage is only slightly alleviated at this time, without a significant decrease. This is because although the residual energy of the gas flow from the missile engine becomes smaller with the increase in the missile flight altitude, the flow velocity of the gas flow here further decreases, and the kinetic energy of the gas flow is converted into internal energy, so the thermal load is not significantly improved. However, as the missile flight altitude increases, the impact range of the gas flow becomes larger than the size of the deflector, which in turn affects the rails and sleepers not covered by the deflector. Moreover, at this time, the high-temperature gas begins to affect the upper surface of the train and the lower area of the vertical arm. When the missile continues to rise to H = 20 m, the Mach number contour shows that the gas flow expands sufficiently, generating 5 clear shock cells, and the high-speed core region of the jet begins to move away from the deflector. The temperature contour indicates that the affected area of high-temperature gas does not decrease with the departure of the high-speed core region; instead, it increases. Nearly half of the upper surface of the train carriage and the vertical arm are affected by the high-temperature gas, and the temperature of the rails and sleepers far from the train also rises. There is still a phenomenon where the gas flow stagnates and heats up at the deflector, but the gas temperature at the bottom of the train carriage starts to drop. When the missile flies to H = 30 m, the Mach number contour shows that the core region of the gas flow is almost completely separated from the lower deflector and is in full contact with thevertical arm, with the high-speed core region of the jet completely leaving the deflector. The temperature contour indicates that there are no longer high-temperature areas (marked in red) on the deflector and surrounding facilities, and the heating area at the bottom of the train carriage also becomes smaller. However, the affected area on the upper surface of the train carriage, the vertical arm, and the surrounding rails and sleepers further expands. The above analysis indicates that although the deflector will withstand enormous impact and the temperature of the airflow on its surface is extremely high, for the train launch system, the thermal loads on the train roof, train bottom, nearby rails, and sleepers will all be relatively large. Therefore, further analysis of these facilities is required.

5.2. Gas Temperature Distribution on the Deflector Surface

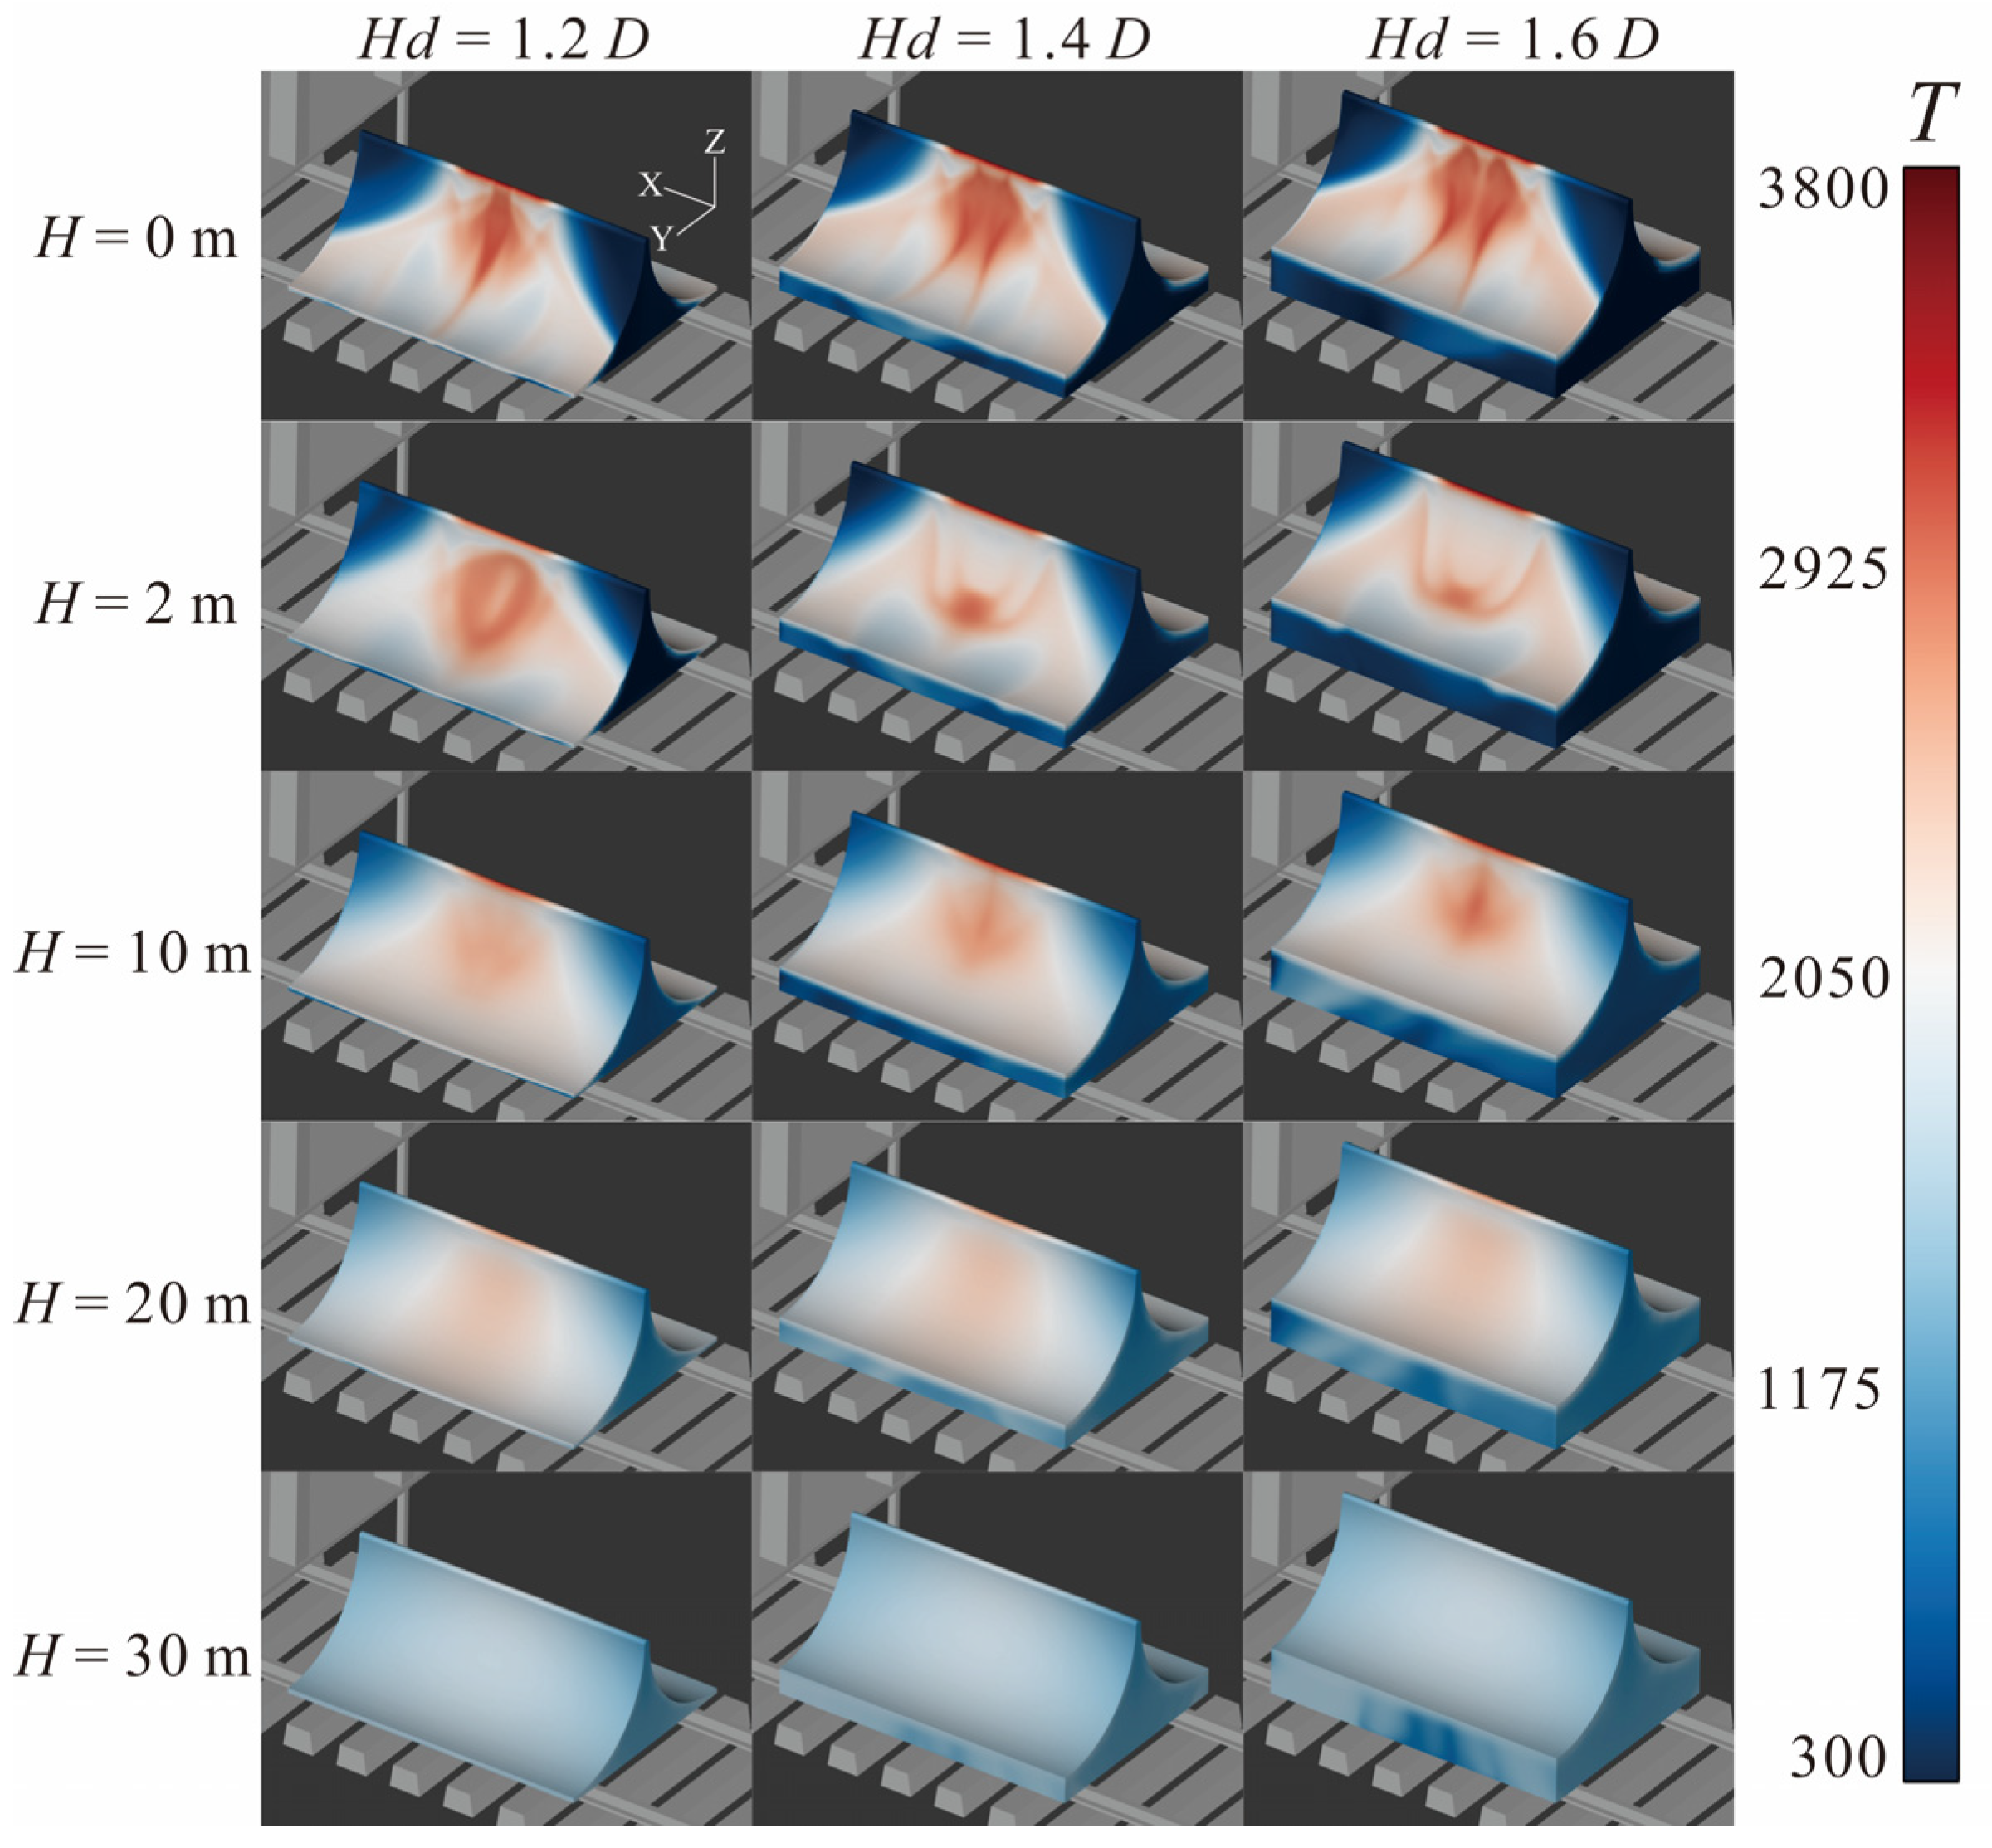
Based on the previous analysis, the thermal environment in the area of the deflector directly impacted by the high-temperature and high-speed gas flow is the most severe. Therefore, the temperature distribution contour on the surface of the deflector is extracted for further analysis. Figure 6 shows a comparison of the gas temperature distribution contours on the surface of the deflector under the impact of the missile at different takeoff altitudes with deflectors of different Hd values. The high-speed gas flow stagnates and heats up when impacting the deflector. At H = 0 m, the surface temperature of the deflector is the highest, and the shape of the heated part is bilaterally symmetric, presenting a trapezoid-like hexagon. The boundary between this region and the unheated dark blue part at the edge of the deflector is very clear. The most intensely heated region is concentrated at the center of the deflector groove, with a dimension of approximately 1.0 D in the X direction and about 1.1 D in the direction along the arc surface of the deflector within the YOZ plane. As Hd increases, the area of the red part with intense temperature rise expands, the maximum temperature also increases from 3088 K to 3258 K, and the morphology changes—the high-temperature core regions where the gas converges on the deflector surface change from one to two. When the missile further rises to H = 2 m, the gas temperature on the deflector surface decreases, and the boundary between the heated region and the unheated blue region is also relatively clear. However, in the case of Hd = 1.2 D, the area of the red high-temperature region is larger than that of Hd = 1.4 D and Hd = 1.6 D, and there are differences in the distribution pattern, which is similar to the distribution of the red heated region when H = 0 m. This is because changes in Hd will cause a shift in the contact position between the deflector and the core region of the gas jet. At lower flight altitudes, the relative degree of such changes is greater, leading to variations in the contact between the gas flow and the deflector at different positions within a complete shock cell of the high-speed jet, which in turn results in differences in the distribution of the heated regions. When the missile further flies to H = 10 m, the gas temperature on the deflector surface decreases further. Due to the increase in flight altitude, the influence range of the jet expands, and the temperature of the originally unheated parts of the deflector also rises slightly. The trapezoid-like hexagonal region mentioned earlier can still be observed, with the boundary between the red high-temperature region and the light blue slightly heated region gradually blurring. At this point, the impact caused by changes in Hd will weaken. At H = 20 m, the red regions fade further, the boundaries between the blue and white regions become more blurred, the impact caused by changes in Hd almost disappears, and the calculation results under different Hd values are basically consistent. When the missile flight altitude increases to H = 30 m, the red regions on the deflector surface disappear, and the entire deflector presents a very uniform light blue color, indicating that the temperature of the gas flow here further decreases. At the same time, the range affected by the gas flow is highly likely to have spread to facilities such as the rails, sleepers, and train carriages around the deflector. Overall, it can be seen that the lower the missile flight altitude H and the higher the deflector height Hd, the greater the thermal load on the deflector. Obviously, this rule is as expected: the closer the deflector is to the missile engine nozzle, the harsher the thermal environment.
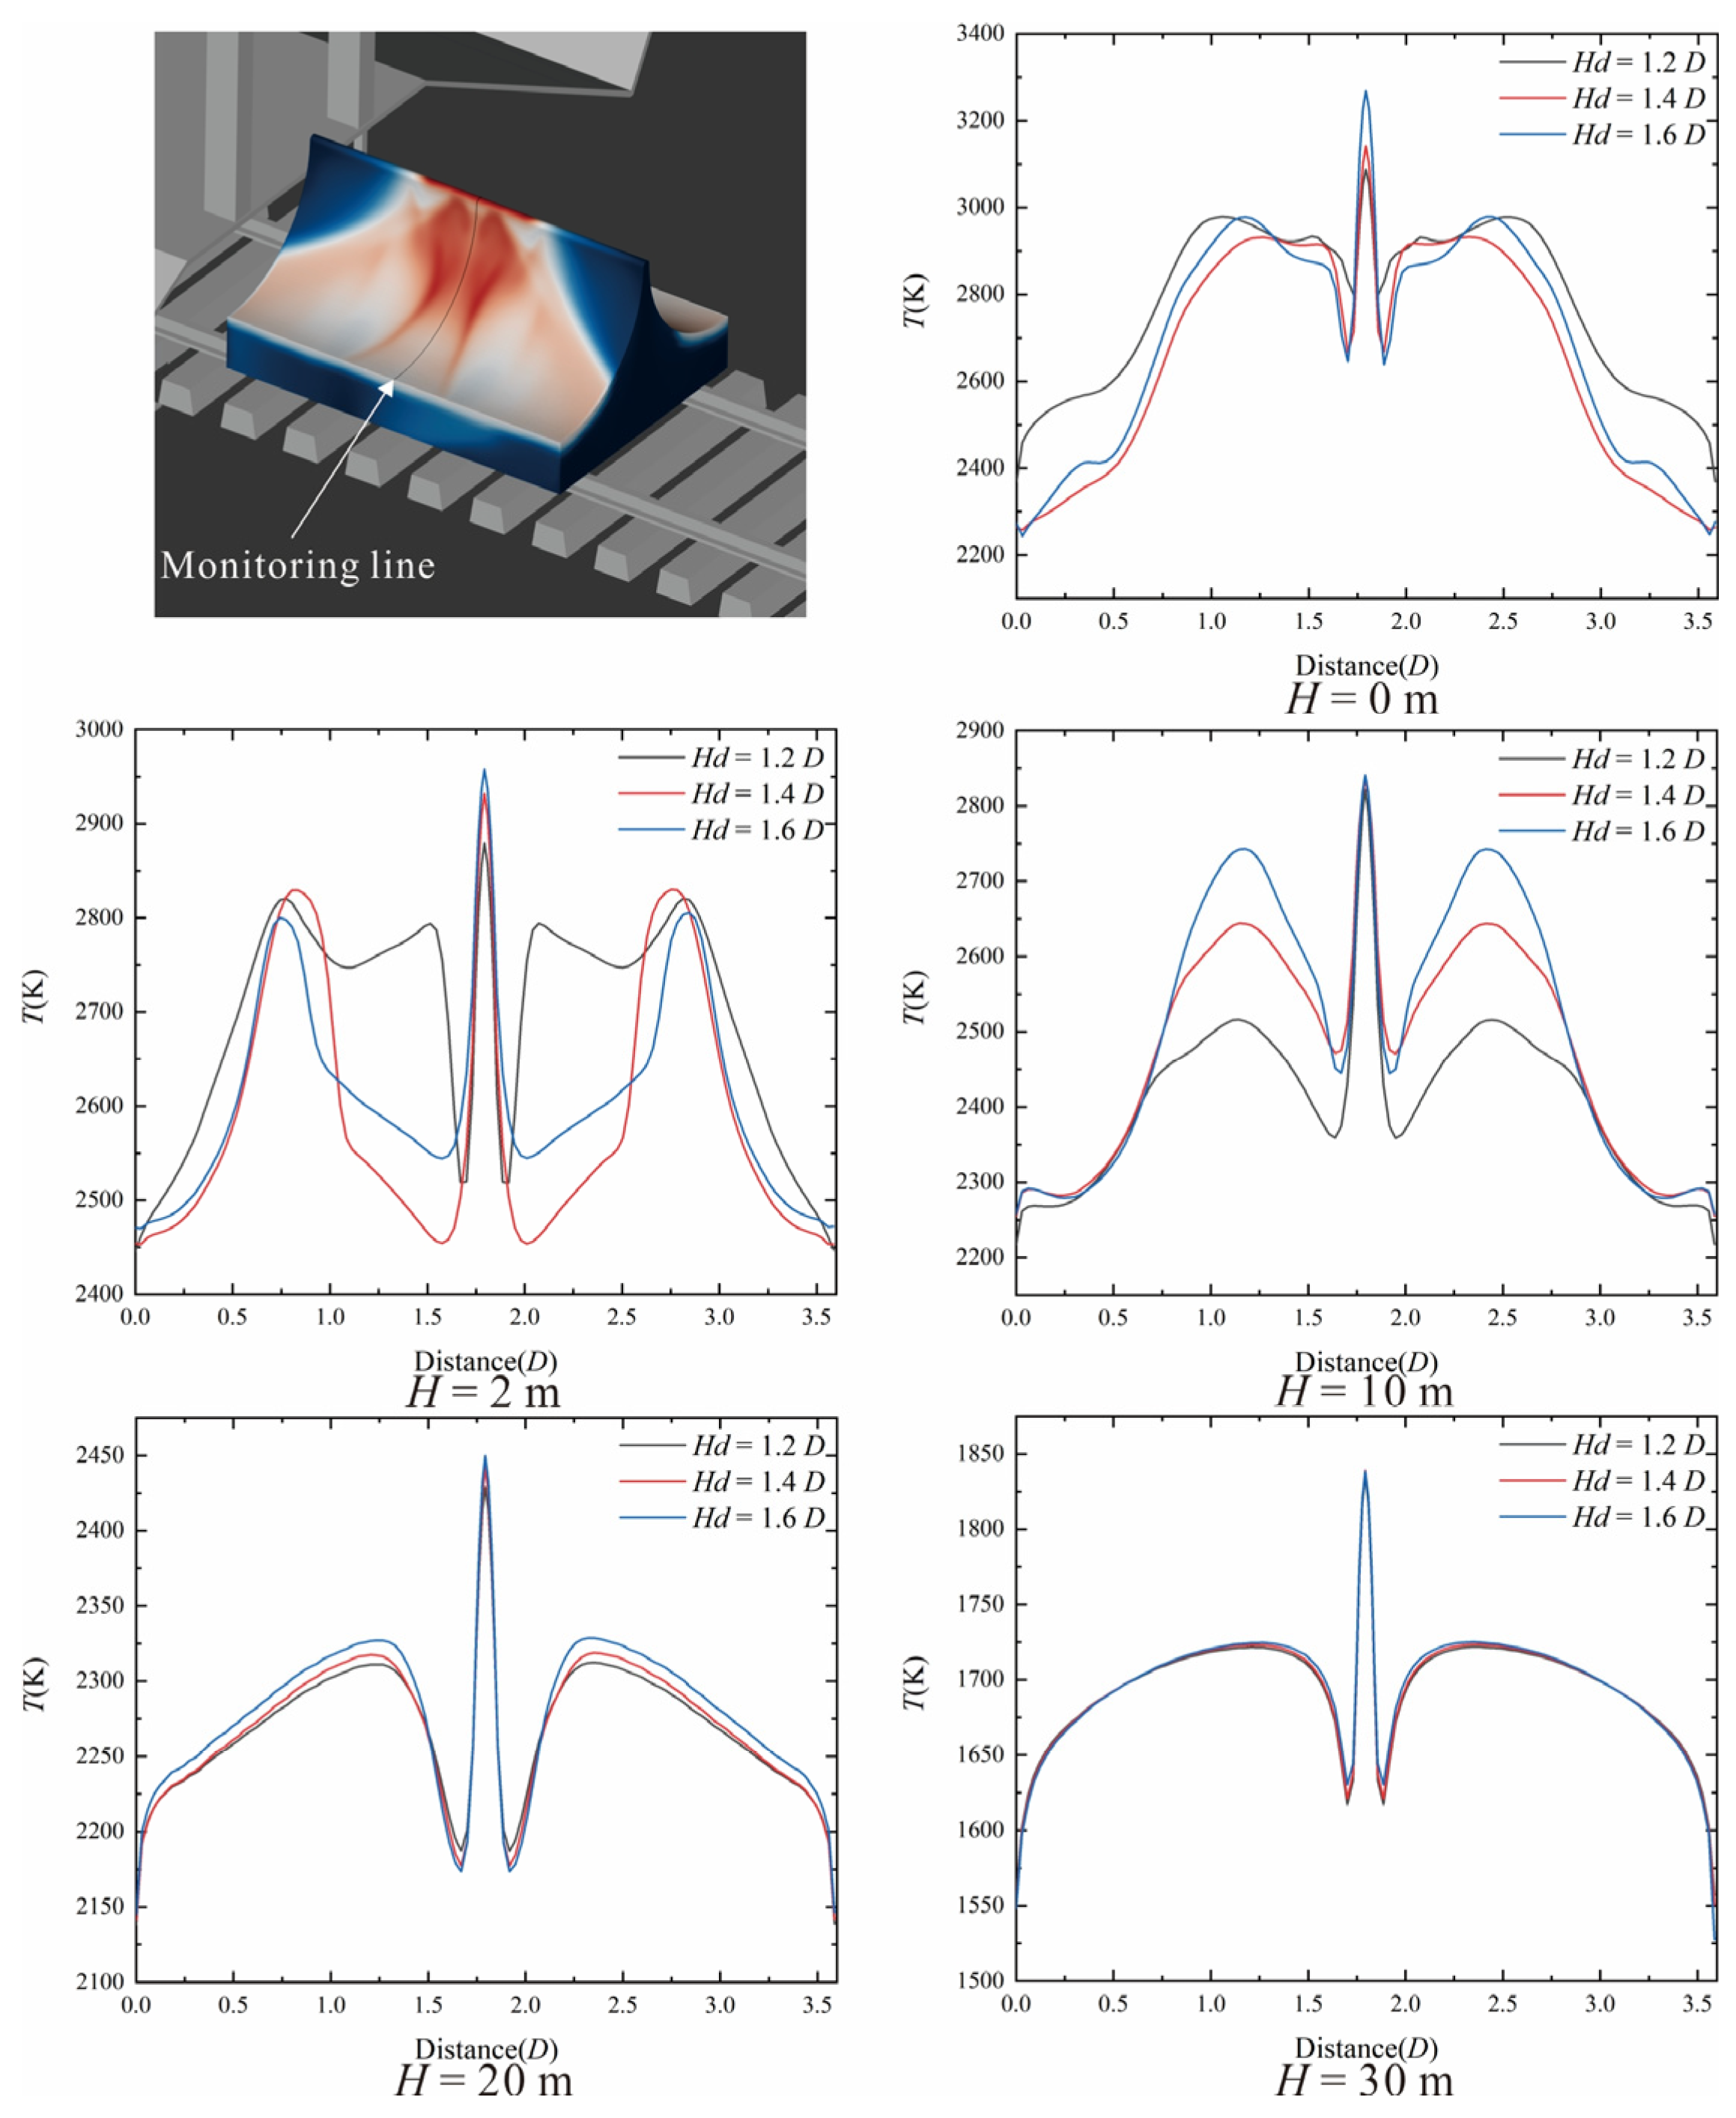
However, a comparison of the calculation results for different Hd values at the same flight altitude H shows that when H is low, only the maximum temperature at the top of the deflector fully conforms to the rule that “the closer the distance, the harsher the thermal environment”. Other areas of the deflector do not fully comply with this rule. Figure 7 shows the gas temperature curves of the monitoring lines on the deflector surface under various working conditions. These curves can describe the above situation in more detail. At H = 0 m, in the area about 0.3 D downward along both sides of the monitoring line from the top of the deflector, the temperature instead decreases as Hd increases. In most of the subsequent regions, the temperature is instead highest under the working condition with the smallest Hd. Comparing the three working conditions at H = 0 m in Figure 6, the shape of the red high-temperature region on the deflector surface changes, gradually splitting into two regions as Hd increases, which exactly separate at the monitoring line. Therefore, in most regions at this time, the temperature curve for Hd = 1.2 D is instead higher than those for the other two working conditions with larger Hd values. A similar situation still exists when H = 2 m. The curves for H = 10 m, H = 20 m, and H = 30 m show that under the working conditions with higher missile flight altitudes (H), the common-sense rule is maintained: the larger the Hd (the closer to the missile body), the harsher the thermal environment on the entire deflector surface. Moreover, this difference gradually weakens as H increases. In the analysis of Figure 7, it is impossible to explain the reason why the change in Hd leads to a significant difference in the shape of the high-temperature core region where the gas flow converges on the deflector surface at lower missile flight altitudes. To address this phenomenon, a further explanation will be provided in combination with the temperature distribution of the deflector.
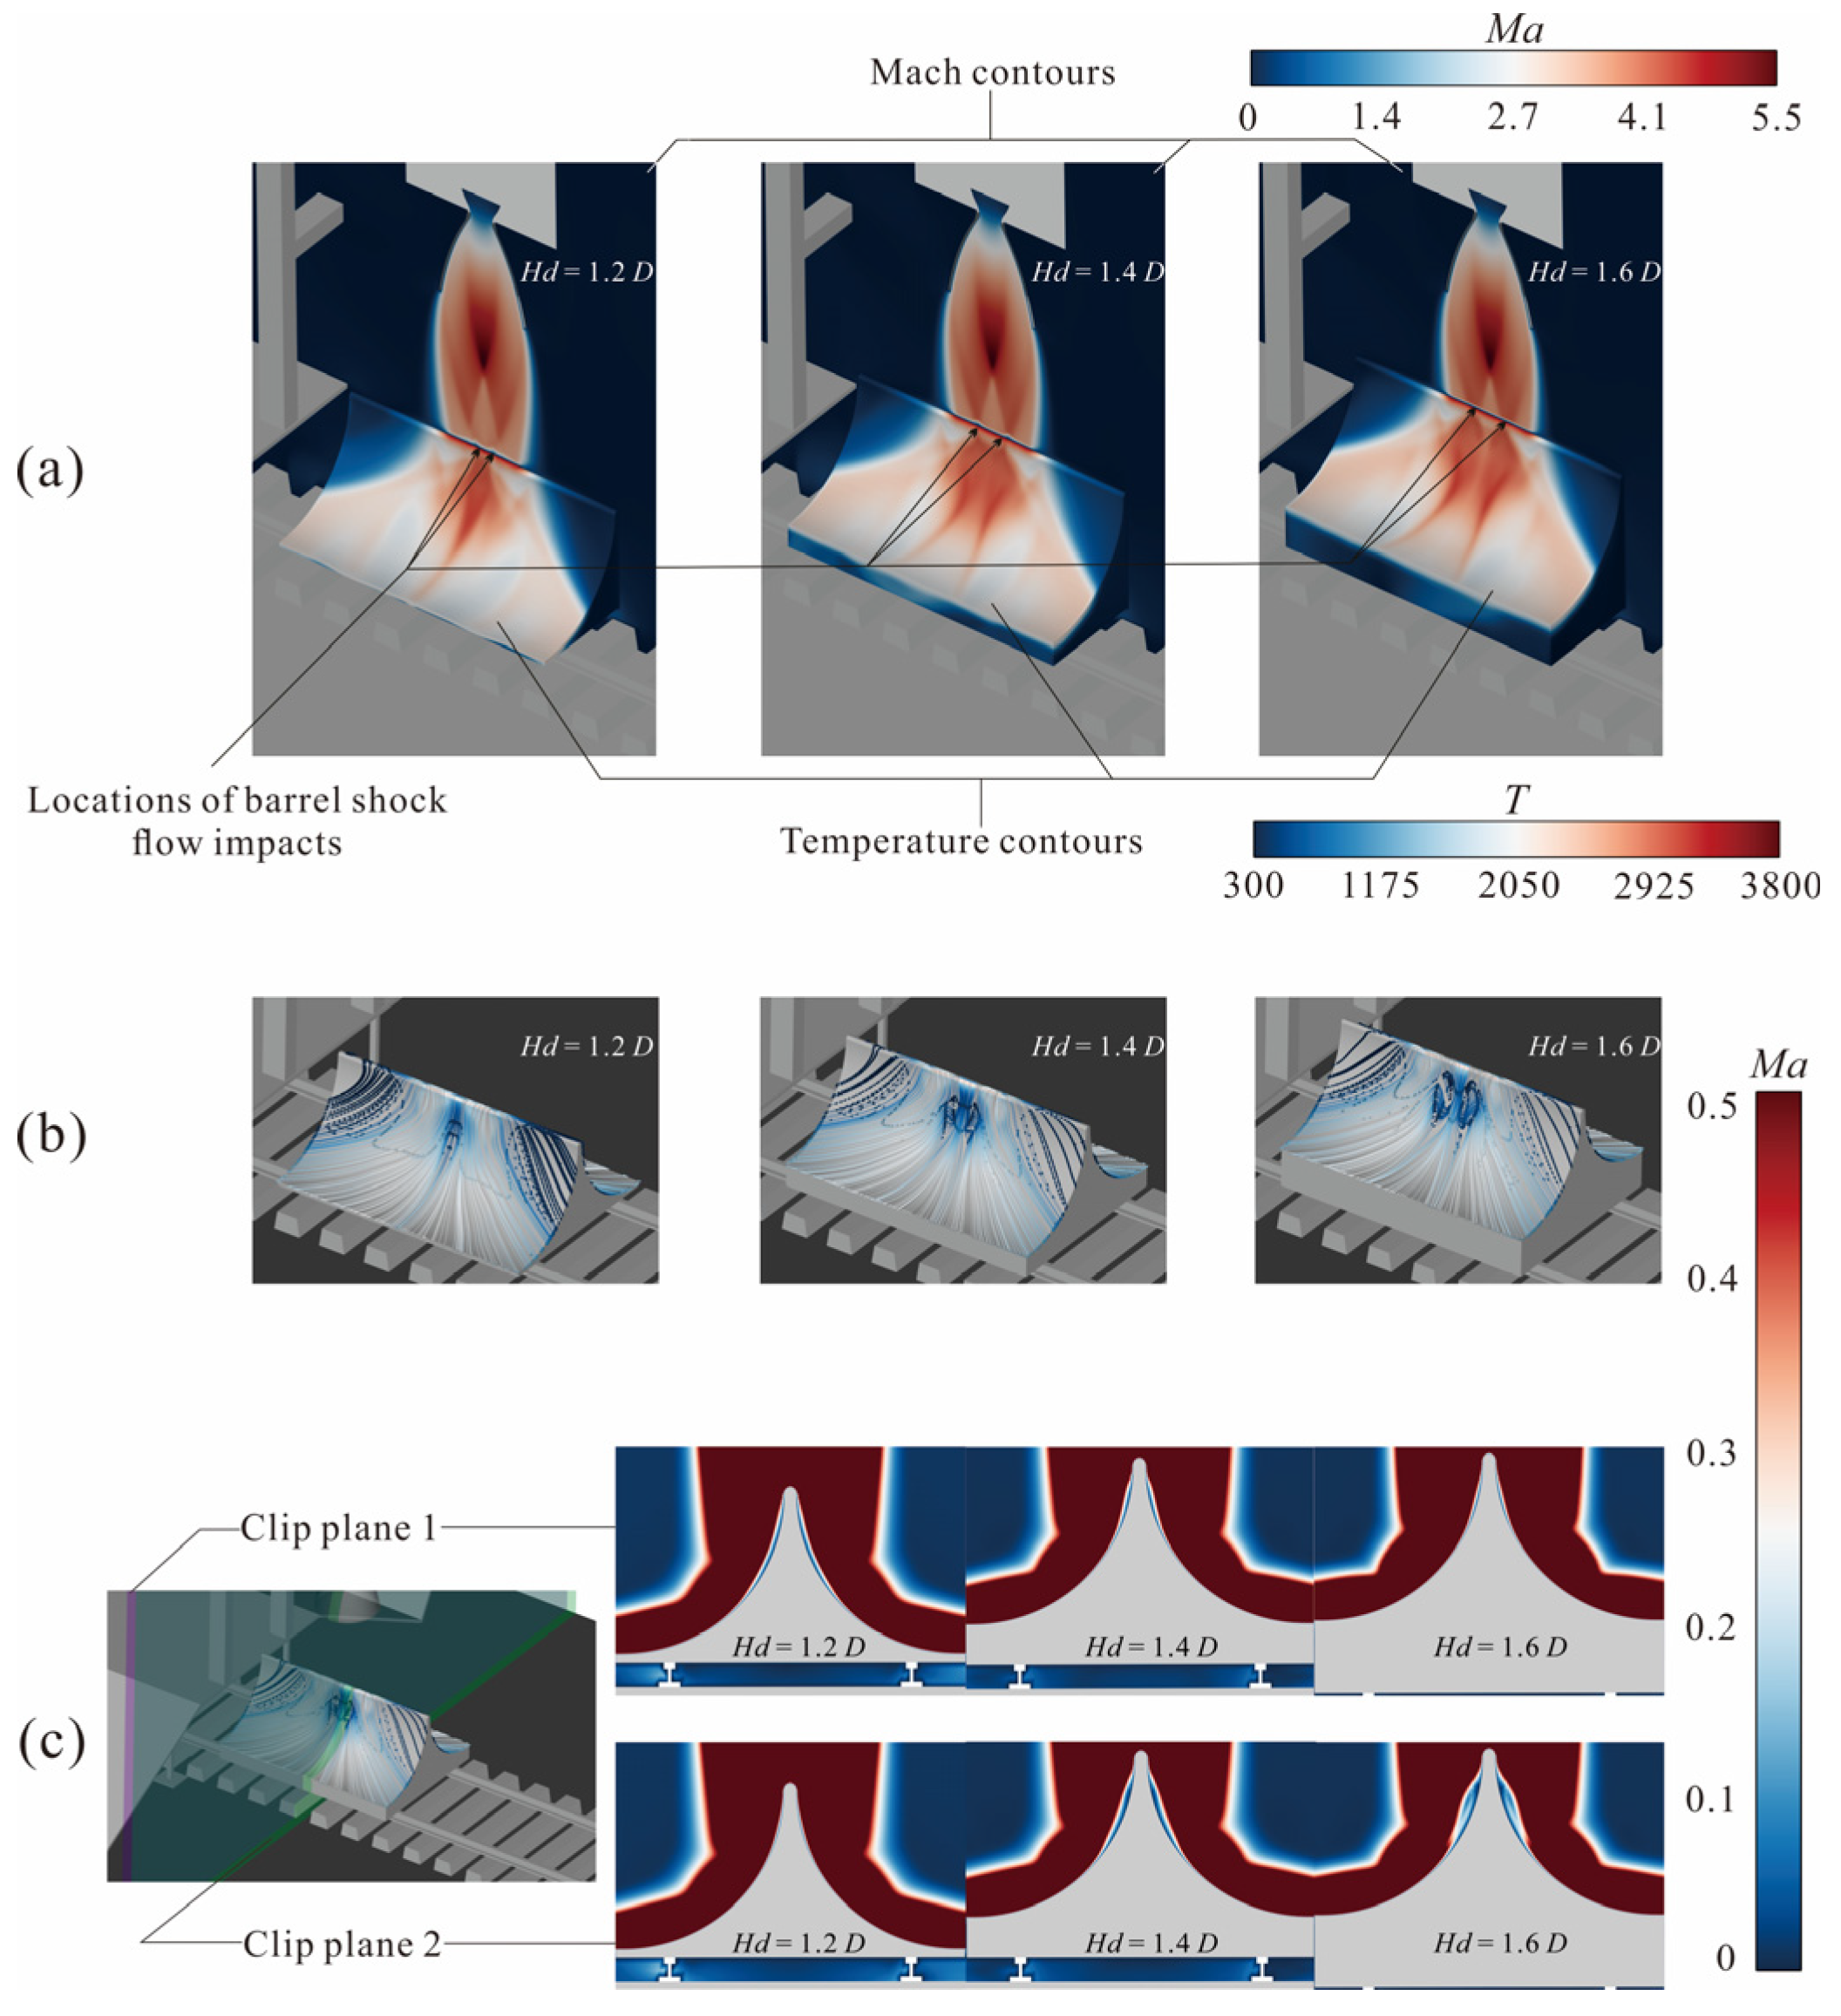
To address the aforementioned phenomenon, Figure 8 selectively displays the flow conditions in the deflector and its adjacent local areas at H = 0 m, in combination with the temperature distribution of the deflector. In Figure 8a, the isosurface is the Mach number contour, and the temperature distribution is displayed on the surface of the deflector. The gas flow is accelerated through the Laval nozzle, forming the first barrel shock wave. The position where the barrel shock wave impinges on the deflector is marked in the figure. When Hd = 1.2 D, the impingement positions of the barrel shock waves are relatively close, so the heated region is relatively concentrated. As Hd increases, the distance between the impingement positions of the barrel shock waves increases. Until Hd = 1.6 D, the distance between the impingement positions causes the stagnation-heated regions of the airflow on the deflector surface to separate (with an obvious white area in the center of the heated regions), forming two seemingly independent heated core regions. Figure 8b shows the streamline diagram of the airflow on the deflector surface. To better illustrate the flow state, the streamlines are colored using the Mach number, with an upper limit set at Ma = 0.5. When Hd = 1.2 D, the image shows that the velocity in the core heated region of the deflector is relatively low, but the streamlines are generally unobstructed. At Hd = 1.4 D, the range of this region expands, and the streamlines in this area begin to spread along both sides of the deflector, with even a slight backflow obliquely upward. When Hd = 1.6 D, this region further expands until a W-shaped vortex is formed. Figure 8c shows the flow states of two cross-sections, namely clip 1 (the middle section of the deflector) and clip 2 (the section at the impingement position of the barrel shock wave). When Hd = 1.2 D, due to the relatively close impingement points of the barrel shock waves, a thin stagnation region appears at clip 1 on the deflector, while the flow at clip 2 is relatively unobstructed. As the distance between the engine and the deflector, as well as the distance between the impingement points of the barrel shock waves, increases, at Hd = 1.4 D, the stagnation region at clip 2 becomes larger than that at clip 1. Furthermore, when Hd = 1.6 D, the stagnation region at clip 2 is significantly larger than that at clip 1. The above analysis indicates that when the missile takeoff altitude H is low, the positions where the barrel shock waves formed by the engine jet impinge on the deflector determine the distribution pattern of the heated core regions. This may lead to an abnormal phenomenon where compared to the top area, the thermal environment of other regions on the deflector surface decreases as Hd increases.

5.3. Gas Temperature Distribution on the Surface of Surrounding Facilities

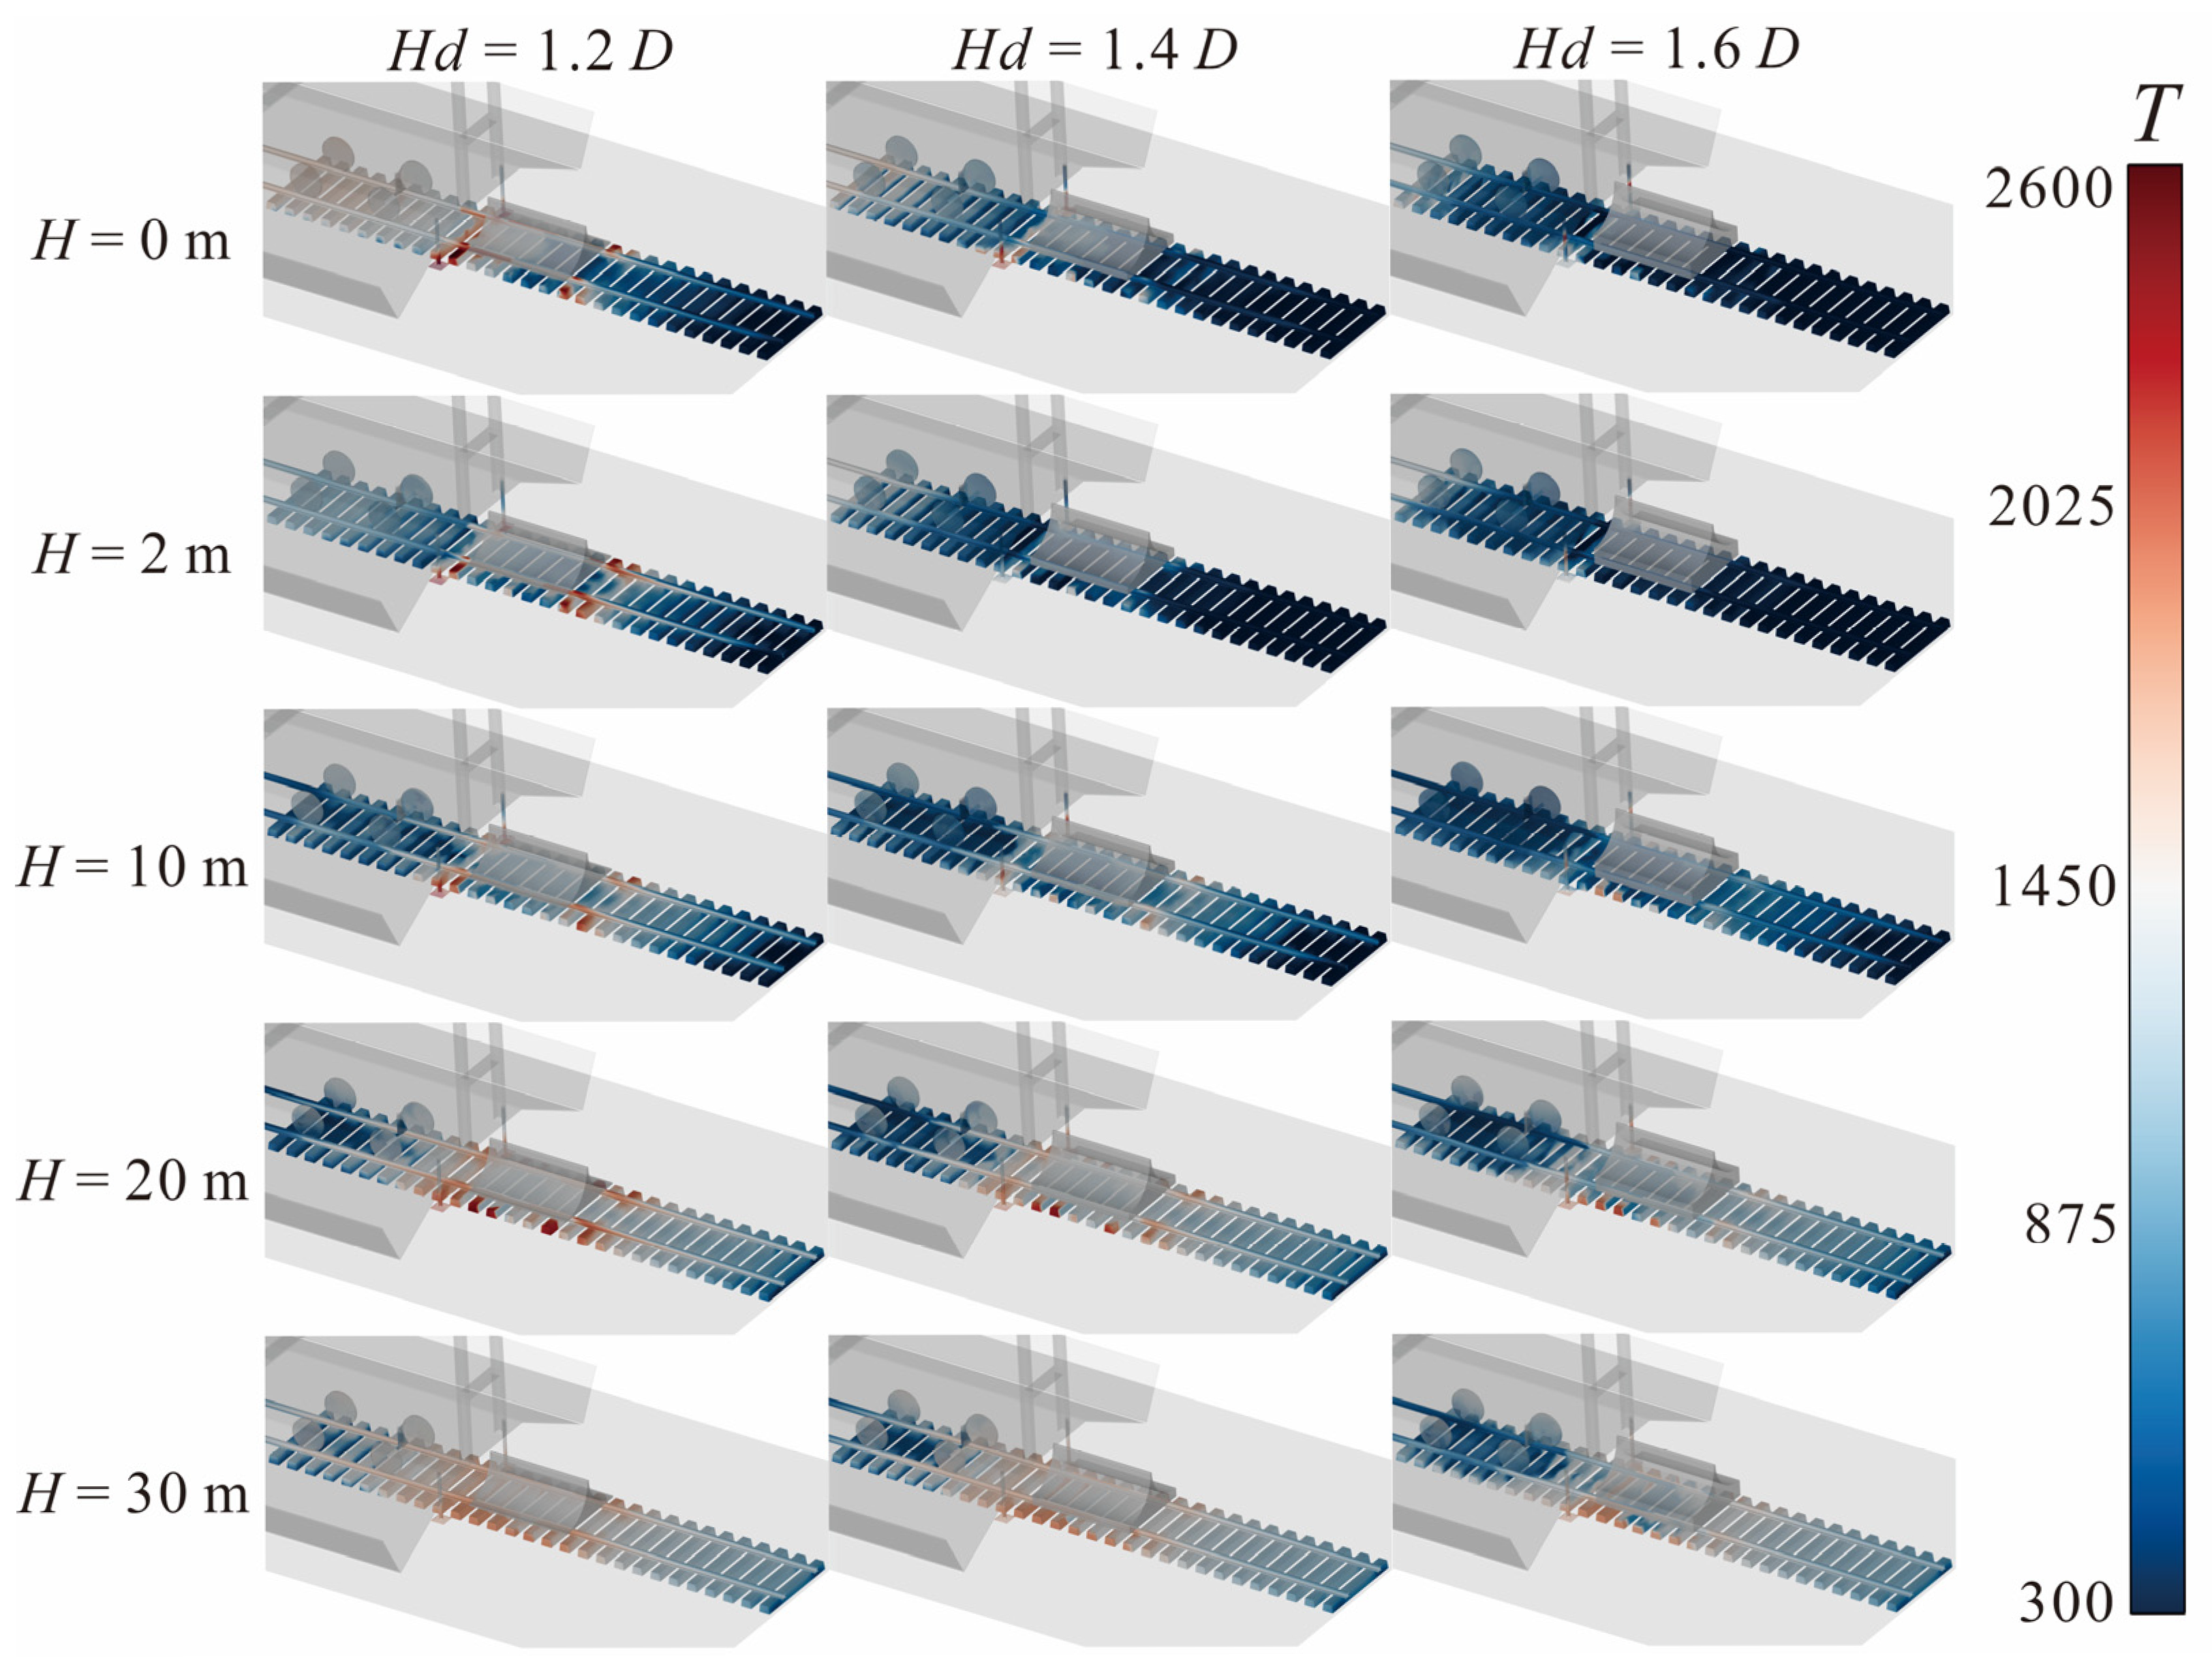
Since the influence range of the gas flow will spread to the surrounding facilities under the carriage as the missile flight altitude increases, and railway tracks and sleepers are infrastructure that needs to be reused, their thermal environment also requires attention. Figure 9 extracts the gas temperature distribution of surrounding facilities including rails and sleepers under different working conditions. The train carriages and deflectors are semi-transparently processed to intuitively show all the shielded parts. When H = 0 m, an excessively small Hd will result in the deflector failing to adequately protect the surrounding facilities under the carriage. At Hd = 1.2 D, due to the excessively low height of the deflector, a considerable portion of the gas flow enters the undercarriage through the gap between the deflector and the train, and fails to effectively protect the surrounding rails and sleepers. Except for the 5 sleepers directly covered by the deflector, the regular structures on both sides experience significant temperature rises. Because facilities such as the train carriage block the airflow, the maximum temperature of the airflow on the surfaces of the sleepers and supporting devices here rises to 2593 K, and the sleepers and wheels at the bottom of the train also heat up. However, when Hd = 1.4 D and Hd = 1.6 D, the thermal environment of the surrounding facilities is greatly improved. In the former case, only the area near the bottom of the supporting device and some parts of the sleepers here have temperature rises, with the maximum temperature reaching 2017 K. In the latter case, only a small area in the middle of the supporting device has a relatively high temperature of about 1975 K, while all the surrounding sleepers are in the white medium-temperature area or blue non-heated area. When H = 2 m, the thermal environment of the surrounding facilities is somewhat improved. However, the deflector with Hd = 1.2 D still cannot effectively protect the surrounding facilities. There are red regions with severe temperature rises on the surfaces of the rails, sleepers, and supporting devices. Due to the increased distance from the missile engine, the gas temperature on the surfaces of these regions has decreased, but it still exceeds 2000 K. At this point, the calculation results for Hd = 1.4 D and Hd = 1.6 D show that there is no severe temperature rise on the rails and sleepers. As the missile continues to ascend to H = 10 m, for the working condition of deflector with Hd = 1.2 D, the thermal environment of the surrounding facilities improves as the engine moves away. Compared with the calculation results at the previous two flight altitudes, the temperature of the heated regions further decreases. However, the calculation results for deflectors with Hd = 1.4 D and Hd = 1.6 D indicate that the thermal environment of the surrounding facilities does not improve with the increasing distance from the rocket engine; on the contrary, due to the full expansion of the gas jet, it exceeds the area covered by the deflector, eventually causing the gas temperature at the nearby rails, sleepers, and supporting devices to rise. The aforementioned cause of temperature rise in surrounding facilities becomes more pronounced when the missile flies to H = 20 m. Although the missile is still moving away from the launch system, the calculation results under different Hd values still show that the thermal environment of the surrounding facilities continues to deteriorate, and the affected areas also spread to the surroundings. Since the deflector with Hd = 1.2 D has a poor shielding effect on the rails and sleepers below, the gas temperature at the sleepers even rises to 2428 K. The deflectors with Hd = 1.4 D and Hd = 1.6 D, due to their better shielding effect, have smaller temperature rise ranges and areas at the nearby rails and sleepers, with the maximum temperatures being 2081 K and 1907 K, respectively. As the missile reaches a flight altitude of H = 30 m, the calculation results show that the influence range of the gas flow after expansion further expands. At this point, the number of sleepers with obvious temperature rises (turning white at least) on both sides of the deflector in the X direction continues to increase. However, since the missile is sufficiently far from the ground facilities, the energy of the gas flow has been fully attenuated when it reaches here. Even though the influence range of the gas flow has increased compared with the calculation results at the previous flight altitude, the surface temperature of various components at the bottom of the carriage has decreased. It can thus be judged that when the missile exceeds a certain altitude, its impact on the facilities around the bottom of the carriage will continue to weaken, and this altitude is between 20 m and 30 m. At this time, the rule that the larger the Hd, the smaller the affected range of the underlying facilities still holds, but the maximum temperature of the surrounding facilities under different Hd conditions has dropped to 1721 K. On the whole, the greater the height Hd of the deflector, the better its protective effect on the facilities at the bottom of the train carriage. However, a continuous increase in Hd will inevitably lead to a rise in the position where it comes into contact with the gas flow. Although this can effectively protect the facilities at the bottom of the carriage, it will bring potential safety risks to the surface of the train carriage at higher positions. Therefore, a further analysis of the relevant conditions on the upper surface of the carriage is required.
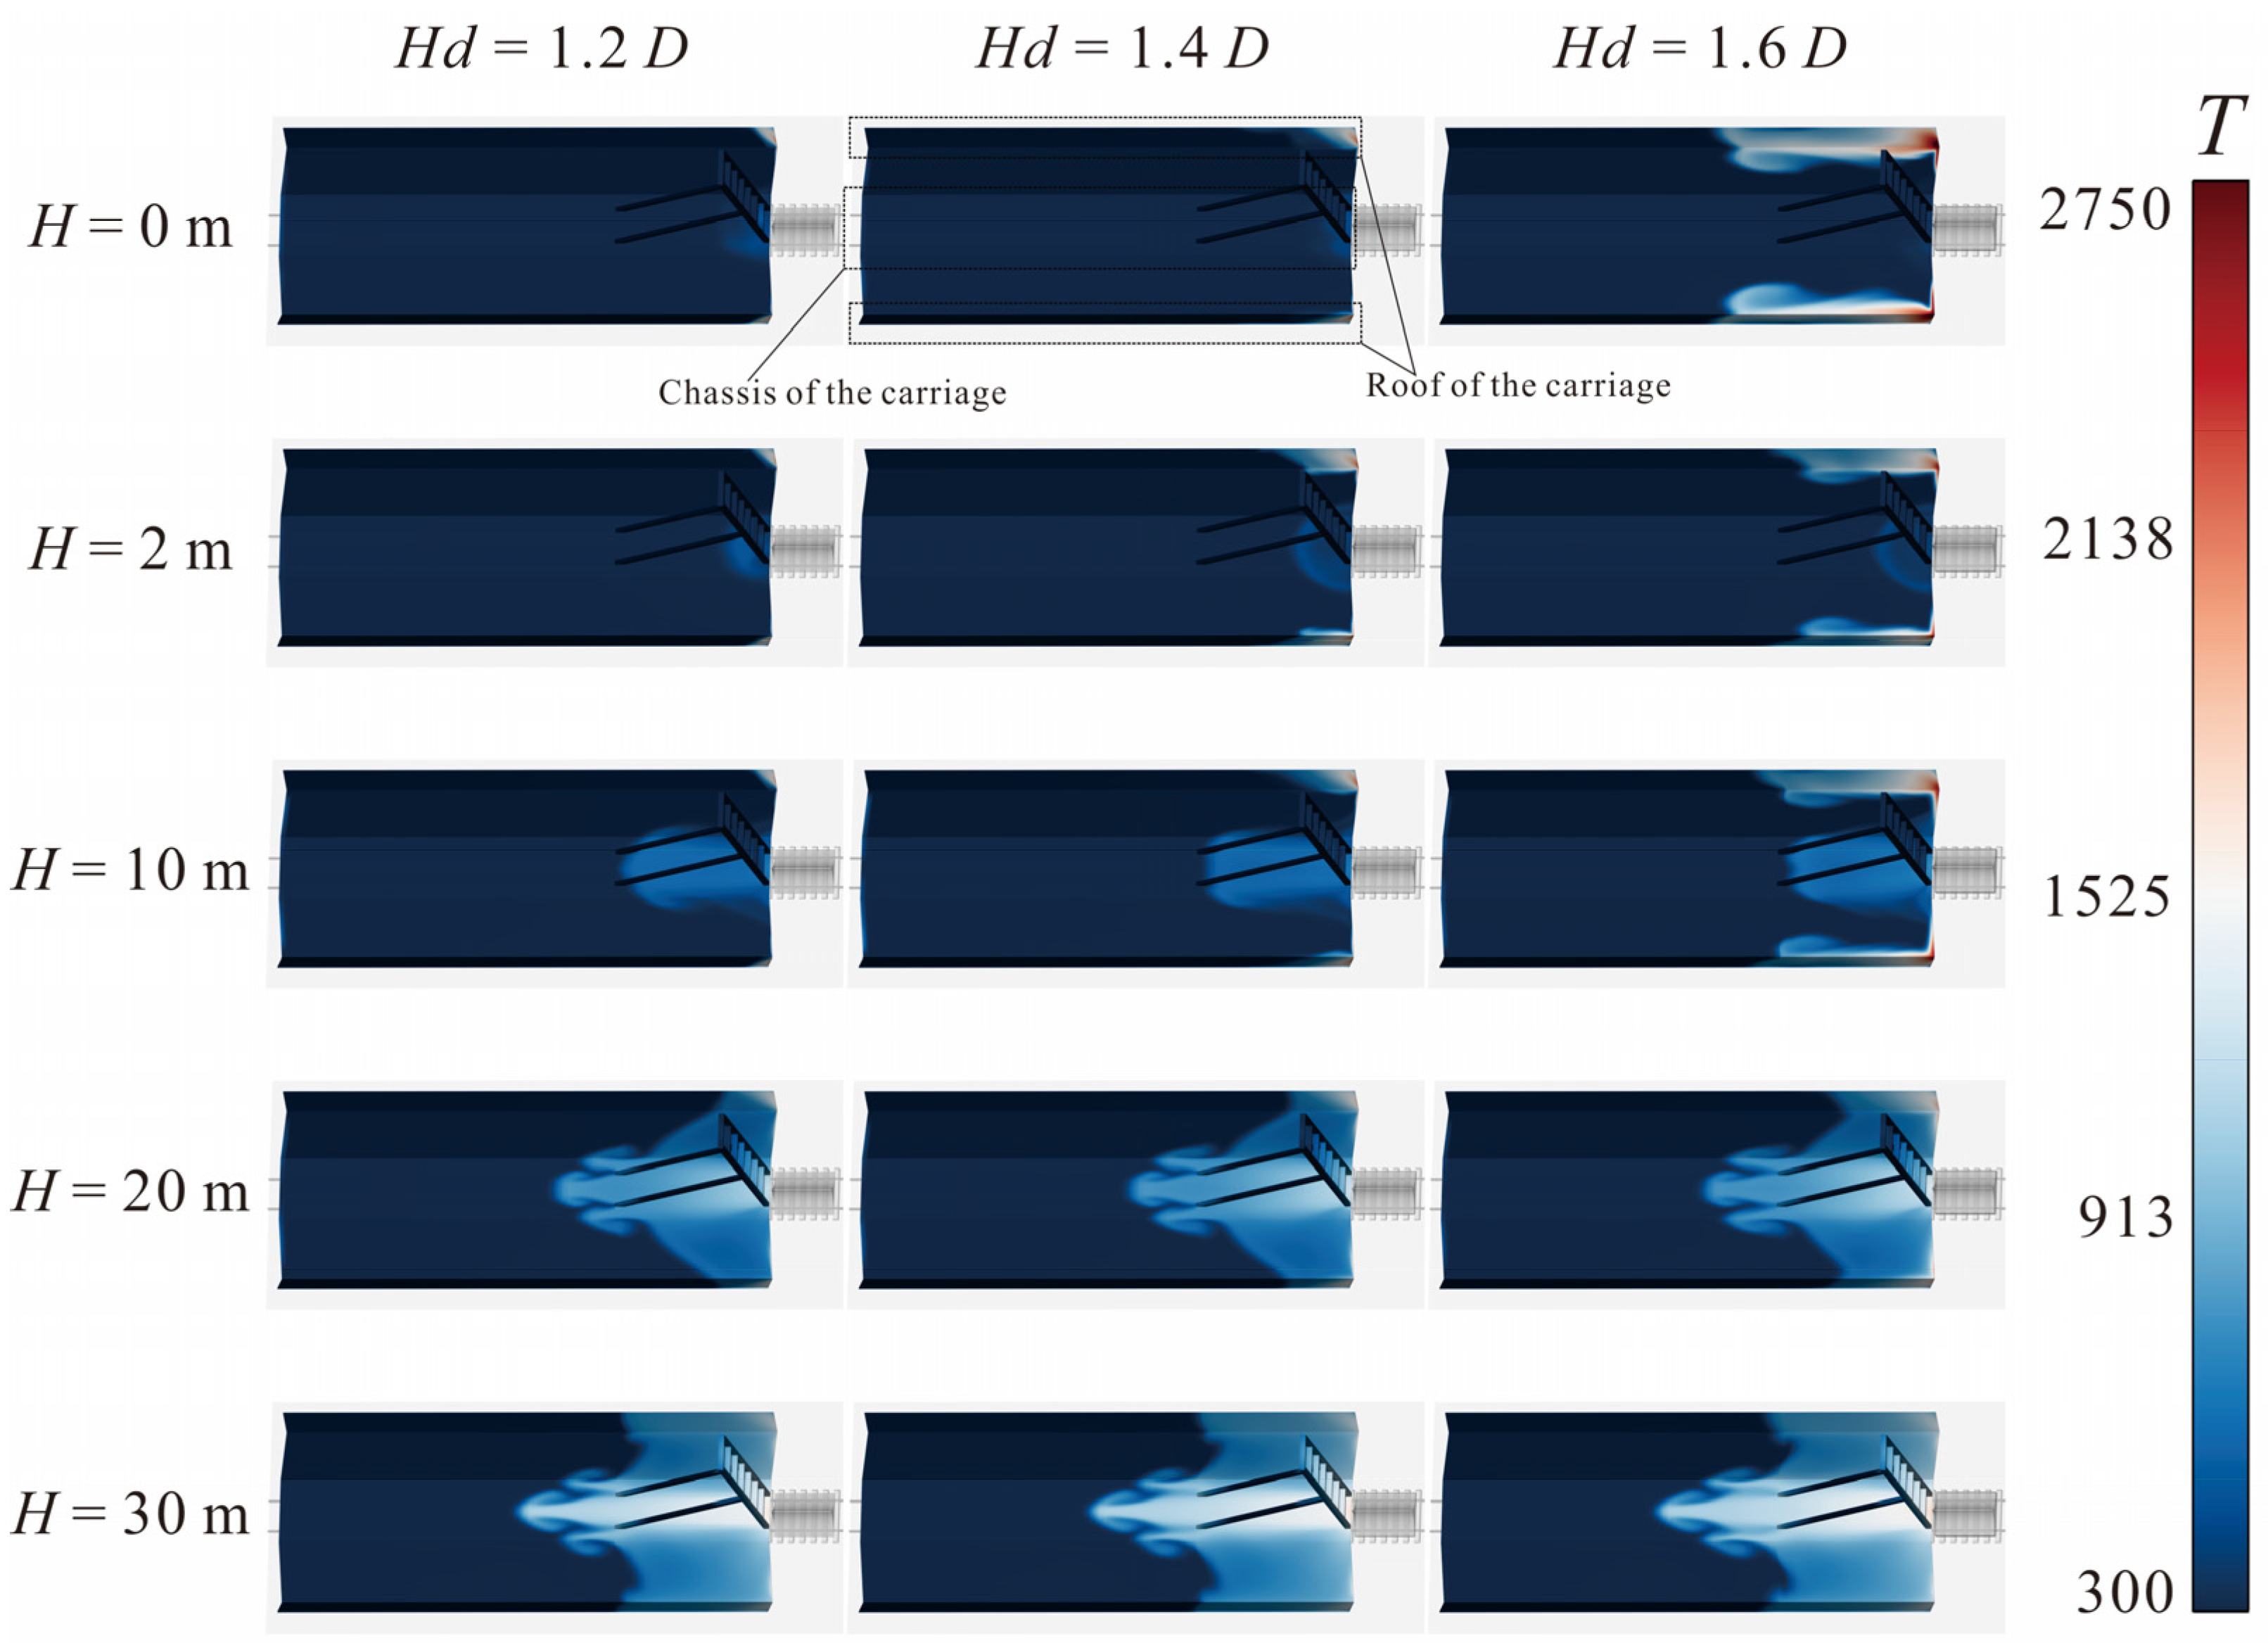
Figure 10 shows the temperature distribution of gas on the upper surface of the carriage under various operating conditions corresponding to different Hd values at different flight altitudes H. It is necessary to discuss the carriage chassis and the deployed roof separately here. At H = 0 m, the calculation results for Hd = 1.2 D show that a heated area appears at the edge of the right side (the side close to the missile) of the deployed carriage roof. The size of this area is described by the length of its distribution in the X-axis direction, which is 1.01 D at this time, with a maximum temperature of 1713 K. When the deflector height increases to Hd = 1.4 D, the length of this area increases to 2.53 D, and the temperature rises slightly. When the deflector height further increases to Hd = 1.6 D, the length of this area increases to 11.24 D, and the maximum temperature surges to 2750 K. Due to the splashing back of high-temperature gas from the ground, rails, and sleepers when Hd = 1.2 D, the chassis has a slight temperature rise at this time. The other two Hd values can better play a role in guiding the flow, so the temperature rise in the chassis is not obvious. At H = 2 m, the size of the gas-heated region on the roof surface shows no significant change when Hd = 1.2 D; when Hd = 1.4 D, it increases to 3.77 D, with no obvious change in the maximum temperature for either of these two cases. For Hd = 1.6 D, the size of this heated region decreases to 8.45 D, and the maximum gas temperature also decreases to 2211 K. However, both the size and maximum temperature of this heated region are still significantly larger than the calculation results for the first two Hd values. At this time, the size of the gas-heated region on the chassis surface increases with the increase in Hd, and the lengths of this region in ascending order are approximately 2.45 D, 2.82 D, and 3.01 D. As the missile ascends to H = 10 m, the distribution pattern of the gas-heated region on the roof remains essentially the same as that at H = 2 m. However, the heated region on the right side of the chassis begins to spread to the left, and the size of this region hardly changes with variations in Hd, all being 7.94 D, with the maximum gas temperature being lower than that on the roof, at 1023 K. When the missile further flies to H = 20 m, the maximum gas temperature in the heated region on the roof decreases to 1556 K. Compared with the previous flight altitude, the size of the heated region increases to 2.74 D at Hd = 1.2 D, shows no significant change at Hd = 1.4 D, but decreases to 5.76 D at Hd = 1.6 D. Both the size and maximum temperature of the heated region on the roof still increase slightly with the increase in Hd, but the differences caused by changes in Hd gradually diminish, indicating that the influence of Hd on the size and maximum temperature of this heated region is relatively weakened. At this time, the heated region on the chassis continues to expand, increasing slightly with the increase in Hd, being 11.67 D, 12.12 D, and 12.59 D, respectively. The maximum gas temperature rises to 1339 K, with no obvious increase or decrease as Hd changes. When H = 30 m, the maximum gas temperature in the heated region on the roof decreases to 1346 K, and the size of the region increases to 8.21 D, 8.51 D, and 9.07 D, respectively, increasing with the increase in Hd. However, compared with the values at H = 20 m (2.74 D, 3.77 D, and 5.76 D), the influence caused by the change in Hd is further reduced. Due to the missile moving away, the gas wake expands fully, and the affected range of the chassis further increases. The maximum gas temperature in the heated region of the chassis slightly rises to 1437 K, and the size of the region increases to 13.81 D, 14.03 D, and 14.46 D, respectively. The relative influence caused by the change in Hd continues to decrease. On the whole, a larger Hd will lead to a worse thermal environment for the chassis. Among them, Hd = 1.6 D will cause a sharp increase in the gas temperature and the size of the heated region on the roof when H ≤ 10 m.
Both Figure 5b and Figure 9 show that although not directly impacted by the gas flow, the bottom of the carriage is still affected by the gas flow. To fully describe the thermal environment of the system, Figure 11 presents the gas temperature distribution at the bottom of the carriage. At H = 0 m, due to the low height of the deflector with Hd = 1.2 D, the deflection of the gas flow occurs later, allowing a large amount of gas flow to pour into this area. As a result, the thermal environment at the entire bottom of the train is the worst, with high-temperature regions where the gas temperature exceeds 2000 K appearing on both the upper and lower sides. The maximum width of these regions in the y-direction is 2.01 D, and the maximum gas temperature reaches 2639 K. The deflector with Hd = 1.4 D can deflect the gas flow earlier, thus reducing the amount of gas flow entering the undercarriage. The range of the high-temperature region is reduced to 1.55 D, and the maximum gas temperature drops to 2447 K. The deflector with Hd = 1.6 D can deflect the gas flow even earlier, further reducing the range of the high-temperature region to 0.49 D, with the maximum gas temperature decreasing to 2334 K. At H = 2 m, as the height of the missile body increases, the thermal environment at the bottom of the carriage is somewhat alleviated. For Hd = 1.2 D, the width of the high-temperature region is 1.87 D, and the maximum gas temperature drops to 2610 K. For Hd = 1.4 D, the width of the high-temperature region is 1.04 D, with the maximum gas temperature decreasing to 2439 K. For Hd = 1.6 D, the high-temperature region further shrinks to 0.35 D, and the maximum gas temperature reduces to 2201 K. When the missile further moves to H = 10 m, the thermal environment at the bottom of the carriage becomes worse than in the previous working conditions. This is because when the missile is at a lower flight altitude, although the engine is closer to the ground facilities, almost all the ejected gas flow comes into contact with the deflector and is deflected by it. However, when the missile is at a higher flight altitude, despite being farther from the ground facilities, in addition to directly impacting the deflector and being deflected, the engine gas flow will also directly impact the surrounding areas, spread, and then move toward the bottom of the carriage. At H = 10 m, for Hd = 1.2 D, the range of the high-temperature region instead increases to 1.92 D, and the maximum gas temperature rises back to 2502 K; for Hd = 1.4 D, the range of the high-temperature region decreases to 1.21 D, with the maximum gas temperature dropping to 2397 K; for Hd = 1.6 D, the range of the high-temperature region reduces to 0.79 D, and the maximum gas temperature falls to 2320 K. At higher missile flight altitudes of H = 20 m and beyond, since the engine is sufficiently far from the ground, different deflector heights (Hd) have little impact on the thermal environment here. There is no significant difference in the temperature distribution patterns under different Hd conditions at H = 20 m and H = 30 m. At H = 20 m, the maximum gas temperatures for Hd = 1.2 D, Hd = 1.4 D, and Hd = 1.6 D are 1961 K, 1939 K, and 1874 K, respectively. At H = 30 m, the maximum gas temperatures for Hd = 1.2 D, Hd = 1.4 D, and Hd = 1.6 D are 1491 K, 1488 K, and 1476 K, respectively. Overall, a larger Hd can improve the thermal environment at the bottom of the carriage, but after H > 10 m, the improvement effect of increasing Hd on the bottom thermal environment will be negligible. In addition, the calculation results at H = 10 m indicate that because the gas flow is not completely deflected by the deflector, the thermal environment at the bottom of the carriage may become worse than that at H = 2 m when the missile is flying around this altitude.
6. Conclusions

This paper studies the impact of gas flow from missile launches on railway launch systems, comparing the thermal environments on the surfaces of various facilities under different deflector heights across five missile flight altitudes. Based on the Navier–Stokes equations, a model of missile gas flow field impacting railway launch devices is established using the realizable k ε turbulence model. The calculation results are compared with experimental data to verify the validity of the above calculation model, and the following conclusions are drawn:
(1) When a missile is launched from a railway launch system, the missile’s flight altitude (H) at which the engine gas flow impacts the deflector most intensely is within 20 m. The thermal environment of the deflector deteriorates as Hd increases, with the maximum gas temperature on the deflector surface reaching 3258 K at H = 0 m and Hd = 1.6 D. The reason why changes in Hd lead to significant differences in the shape of the high-temperature region on the deflector surface at the same flight altitude (H) is that the impact position of the barrel shock wave formed by the engine gas jet on the deflector changes. This difference indicates that small changes in the distance between the missile engine and the deflector (whether due to Hd or H) may significantly alter the distribution pattern of gas temperature on the deflector surface.
(2) The impact of changes in Hd on the thermal environment of the train carriage is discussed in two parts. For the upper surface of the carriage, a larger Hd deflects the gas flow at a higher position, which will cause more gas flow to affect the upper surface of the carriage and deteriorate its thermal environment. The maximum surface gas temperature of 2750 K occurs at H = 0 m and Hd = 1.6 D. For the lower surface of the carriage, a larger Hd, on the contrary, improves the thermal environment at this position, with the maximum surface gas temperature of 2639 K appearing at H = 0 m and Hd = 1.2 D. Overall, the thermal environment at the bottom of the carriage is worse than that on the upper surface of the carriage.
(3) The deflector can effectively protect other facilities of the launch system (rails, sleepers, supporting devices, etc.). The parts of these facilities with the worst thermal environment change with the variation in H. At H = 0 m, the thermal environment of the supporting device is the worst, with the maximum surface gas temperature reaching 2593 K when Hd = 1.2 D. At H = 20 m, due to the expanded influence range of the gas flow, the thermal environment of the rails and sleepers becomes the worst at this time, with the maximum surface gas temperature being 2428 K. The protective effect of the deflector improves as Hd increases. Increasing the deflector height from Hd = 1.2 D to Hd = 1.4 D can significantly improve the thermal environment of these facilities, but further increasing the deflector height to Hd = 1.6 D has a limited effect on enhancing the protective effect
Based on the above CFD simulation results, during the operation of this type of launch system, the key thermal protection locations are the deflector and the bottom of the carriage. Although a higher deflector height (Hd) can improve the thermal environment of the upper surface of the carriage and surrounding facilities, it will deteriorate the thermal environment of the deflector and the bottom of the carriage. Therefore, it is necessary to balance the conditions of different parts when designing thermal protection. In addition, the phenomenon that small changes in the distance between the engine and the deflector lead to significant changes in the gas temperature distribution pattern on the deflector surface indicates that for lower flight altitudes, the commonly used calculation conditions in engineering such as H = 0 m, H = 2 m, and H = 10 m may not be able to predict such changes in temperature distribution patterns caused by differences in the impact position of the barrel shock wave, due to the large distance variations. Therefore, this factor needs to be considered in the process of designing thermal protection for the deflector to establish the maximum envelope range for the thermal protection of the launch system. In addition, this paper also has some limitations. Due to confidentiality policies, the properties of actual materials, the radiation absorption coefficient of actual gas, and the external ballistics curve cannot be provided. These factors have a significant impact on the calculation of heat flux and the evaluation of exposure time. For example, simplified research on these aspects may mislead subsequent studies. Therefore, the “thermal environment” in this paper is limited to using the gas temperature on the object surface as a reference, and we hold an optimistic attitude towards further in-depth research.

Author Contributions

Conceptualization, Y.W.; methodology, Y.S.; software, Z.S.; validation, Y.W.; formal analysis, S.W.; investigation, H.W.; resources, G.L.; data curation, Y.W.; writing—original draft preparation, Y.W.; writing—review and editing, Y.W.; visualization, Y.W.; supervision, G.L. All authors have read and agreed to the published version of the manuscript.

Funding

This research received no external funding.

Data Availability Statement

The data that support the findings of this study are available from the corresponding author upon reasonable request.

Conflicts of Interest

The authors declare no conflict of interest.

References

  1. Gao, T.; Gang, W.; Jin, Z. Analysis of Long-range Ballistic Missile Threat and Defense System Development. J. Proj. Rocket. Missiles Guid. 2018, 38, 55–62. [Google Scholar]
  2. Zimmerman, P. Comparison of basing modes for land-based intercontinental ballistic missiles. AIP Conf. Proc. 1988, 178, 341. [Google Scholar] [CrossRef]
  3. Hobson, A. ICBM vulnerability: Calculations, predictions, and error bars. Am. J. Phys. 1988, 56, 829–836. [Google Scholar] [CrossRef]
  4. Pomeroy, S.A. Echoes That Never Were: American Mobile Intercontinental Ballistic Missiles, 1956–1983. Ph.D. Thesis, Auburn University, Auburn, AL, USA, 2006; 317p. [Google Scholar]
  5. Xing, H.; Zhang, Y.; Lei, P.; Ma, N.; Wang, J.; Kang, D. Research on ground detection model and test of optical reconnaissance satellite. Infrared Laser Eng. 2022, 51, 20210978-1–20210978-7. [Google Scholar]
  6. Zhou, Z.; Ding, Y.; Le, G.; Liang, X.; Sun, P.; Sheng, Y. Studies on thermal environment of liquid launch vehicle tail compartmentat high altitude. J. Astronaut. 2019, 40, 577. [Google Scholar]
  7. Dharavath, M.; Chakraborty, D. Numerical Simulation of Supersonic Jet Impingement on Inclined Plate. Def. Sci. J. 2013, 63, 355–362. [Google Scholar] [CrossRef][Green Version]
  8. Oh, H.; Lee, J.; Um, H.; Huh, H. Numerical study for flame deflector design of a space launch vehicle. Adv. Space Res. 2017, 59, 1833–1847. [Google Scholar] [CrossRef]
  9. Moraes, P.; Morgenstern, A. Evaluation of the effectiveness of VLS launcher flame deflector. Comput. Fluids 2001, 30, 523–532. [Google Scholar] [CrossRef]
  10. Zhao, J.; Wang, C.; Xu, Y.; Chen, Z.; Zhu, C.; Chang, J.; Yan, X. Influence Analysis of Vertical Arm on the Ground-wind Loads of a Launch Vehicle with the Three-Horizontal Test Launch Mode. Aerosp. Shanghai (Chin. Engl.) 2024, 41, 81–86. [Google Scholar]
  11. Wang, Y.; Su, Y.; Le, G. Numerical Analysis of Thermal Environment of Multi-Functional Vertical Arm Impacted by Gas of Launch Vehicle at Different Altitudes. Aerospace 2025, 12, 467. [Google Scholar] [CrossRef]
  12. Chin, C.; Li, M.; Harkin, C.; Rochwerger, T.; Chan, L.; Ooi, A.; Risborg, A.; Soria, J. Investigation of the Flow Structures in Supersonic Free and Impinging Jet Flows. J. Fluids Eng. 2013, 135, 031202. [Google Scholar] [CrossRef]
  13. Chan, L.; Chin, C.; Soria, J.; Ooi, A. Large eddy simulation and Reynolds-averaged Navier-Stokes calculations of supersonic impinging jets at varying nozzle-to-wall distances and impinging angles. Int. J. Heat Fluid Flow 2014, 47, 31–41. [Google Scholar] [CrossRef]
  14. Mayer, E.; Prickett, R. Rocket plume impingement heat transfer on plane surfaces. J. Spacecr. Rocket. 2015, 24, 291–295. [Google Scholar] [CrossRef]
  15. Dettleff, G. Plume flow and plume impingement in space technology. Prog. Aerosp. Sci. 1991, 28, 1–71. [Google Scholar] [CrossRef]
  16. Yang, Y. A Study on Impact of an Adjacent Structure by a Rocket Plume. J. Korean Soc. Aeronaut. Space Sci. 2014, 42, 488–494. [Google Scholar] [CrossRef][Green Version]
  17. Yin, J.; Lei, J.; Jiang, S.; Yin, X. The aerodynamic characteristics and its estimation method of finned missile experiencing spin-deformation coupling motion. Aerosp. Sci. Technol. 2021, 115, 106806. [Google Scholar] [CrossRef]
  18. Tahani, M.; Masdari, M.; Kazemi, M.; Isikveren, A. Aerodynamic performance improvement of a canard control missile. Aircr. Eng. Aerosp. Technol. 2017, 89, 871–878. [Google Scholar] [CrossRef]
  19. Li, F. Investigation of Aerodynamics and Flight Mechanics Characteristics of Ground Effect Missile. Aerospace Sciences Meeting. In Proceedings of the 52nd AIAA Aerospace Sciences Conference, National Harbor, MD, USA, 13–17 January 2014. [Google Scholar]
  20. Rivord, T.; Williams, B. Validation of Multiphase CFD Predictions of the SLS Launch Environment against Artemis I Flight Data. In Proceedings of the AIAA SciTech Forum, Orlando, FL, USA, 8–12 January 2024. [Google Scholar]
  21. Harris, M.F.; Vu, B.T. Modeling of Heat Transfer and Ablation of Refractory Material Due to Rocket Plume Impingement. In Proceedings of the Thaermal Fluids Analysis Workshop (TFAWS 2012), Pasadena, CA, USA, 13–17 August 2012. [Google Scholar]
  22. Allgood, D.; Ahuja, V. Computational Plume Modeling of Conceptual ARES Vehicle Stage Tests. In Proceedings of the 43rd AIAA/ASME/SAE/ASEE Joint Propulsion Conference & Exhibit, Cincinnati, OH, USA, 8–11 July 2007. [Google Scholar]
  23. Zhou, Z.; Zhang, L.; Le, G. Numerical study for the flame deflector design of four-engine liquid rockets. Eng. Appl. Comput. Fluid Mech. 2020, 14, 726–737. [Google Scholar] [CrossRef]
  24. Zhou, Z.; Le, G.; Zhang, L. Numerical Studies of Afterburning on Impingement Flowfield of the Four-Engine Rockets. J. Spacecr. Rocket. 2020, 57, 1284–1294. [Google Scholar] [CrossRef]
  25. Zhao, C.; Su, Y.; Sun, Z.; Wang, Y.; Le, G. Drift and afterburning effect on rocket exhaust plume impingement and optimization of deflector. Adv. Space Res. 2024, 73, 3963–3975. [Google Scholar] [CrossRef]
  26. Lu, C.; Zhou, Z.; Liang, X.; Le, G. Thermal Environment of Launch Pads During Rocket Launching. J. Spacecr. Rocket. 2022, 59, 489–496. [Google Scholar] [CrossRef]
  27. Su, Y.; Lu, X.; Le, G.; Li, G.; Fu, B. Numerical simulations of seawater spraying on launch platform during CZ-8X offshore launching. Adv. Space Res. 2023, 72, 3631–3644. [Google Scholar] [CrossRef]
  28. Vatsa, V.N.; Wedan, B.W. Development of a multigrid code for 3-d navier-stokes equations and its application to a grid-refinement study. Comput. Fluids 1990, 18, 391–403. [Google Scholar] [CrossRef]
  29. Lu, C.; Zhou, Z.; Shi, Y.; Bao, Y.; Le, G. Numerical simulations of water spray on launch pad during rocket launching. J. Spacecr. Rocket. 2020, 58, 566–574. [Google Scholar] [CrossRef]
  30. Zhou, Z.; Liang, X.; Zhao, C.; Le, G.; Ding, Y. Investigations of base thermal environment on four-nozzle liquid launch vehicle at high altitude. J. Spacecr. Rocket. 2019, 57, 49–57. [Google Scholar] [CrossRef]
  31. Zhou, Z.; Lu, C.; Zhao, C.; Le, G. Numerical simulations of water spray on flame deflector during the four-engine rocket launching. Adv. Space Res. 2019, 65, 1296–1305. [Google Scholar] [CrossRef]
  32. Zhou, Z.; Bao, Y.; Sun, P.; Li, Y. Cooling of rocket plume using aqueous jets during launching. Eng. Appl. Comput. Fluid Mech. 2022, 16, 20–35. [Google Scholar] [CrossRef]
  33. Zhou, Z.; Wang, X.; Lu, C.; Le, G. Numerical analysis on thermal environment of liquid rocket with afterburning under different altitudes. Appl. Therm. Eng. 2020, 178, 115584. [Google Scholar] [CrossRef]
  34. Salehian, S.; Mankbadi, R.R. Simulations of rocket launch noise suppression with water injection from impingement pad. Int. J. Aeroacoustics 2020, 19, 207–239. [Google Scholar] [CrossRef]
  35. Mankbadi, R.; Lo, S.C.; Lyrintzis, A.; Golubev, V.; Dewan, Y.; Kurbatskii, K. Hybrid LES-RANS simulations of a jet impinging on a flat plate. Int. J. Aeroacoustics 2016, 15, 535–553. [Google Scholar] [CrossRef]
  36. Brown, M.R.; Frendi, A. Supersonic Jet Impingement on a Flat Plate. In Proceedings of the 18th AIAA/CEAS Aeroacoustics Conference, Colorado Springs, CO, USA, 4–6 June 2012. [Google Scholar]
  37. Lamont, P.J. The impingement of underexpanded, axisymmetric jets on perpendicular and inclined flat plates. J. Fluid Mech. 2006, 100, 471–511. [Google Scholar] [CrossRef]
Figure 1. Geometry of the railway launch system and the missile: (a) The parameters of the nozzle; (b) The parameters of the deflector.
Aerospace 12 00823 g001
Figure 2. Three-dimensional mesh of the railway launch system and the missile.
Aerospace 12 00823 g002
Figure 3. Mesh independence verification: (a) Temperature contour on the deflector with 927 million grids when H = 2 m; (b) Temperature distributions on the monitoring line 1; (c) Temperature distributions on the monitoring line 2.
Aerospace 12 00823 g003
Figure 4. Comparison of experiment and simulation: (a) Comparison of flow field; (b) Comparison of data.
Aerospace 12 00823 g004
Figure 5. The Isosurface contour of the rail-based launch systems: (a) Mach number contour; (b) Temperature contour.
Aerospace 12 00823 g005
Figure 6. The distribution of temperature on the deflector.
Aerospace 12 00823 g006
Figure 7. The distribution of temperature on the monitoring line of deflector.
Aerospace 12 00823 g007
Figure 8. Flow field around the deflector: (a) Mach contours on isosurface and temperature contours on deflector; (b) Tracestreams on the deflector; (c) Mach number contours on the clip planes.
Aerospace 12 00823 g008
Figure 9. The distribution of temperature on the railway and railway sleepers.
Aerospace 12 00823 g009
Figure 10. The distribution of temperature on the carriage.
Aerospace 12 00823 g010
Figure 11. The distribution of temperature on the bottom of carriage.
Aerospace 12 00823 g011
Table 1. Mole fractions for the missile engine inlet gas.
ComponentH2OCO2COH2
Inlet gas0.390.240.280.09
Disclaimer/Publisher’s Note: The statements, opinions and data contained in all publications are solely those of the individual author(s) and contributor(s) and not of MDPI and/or the editor(s). MDPI and/or the editor(s) disclaim responsibility for any injury to people or property resulting from any ideas, methods, instructions or products referred to in the content.