4.1. TSP Experimental Results Analysis
Based on the surface temperature rise distributions obtained from TSP experiments under various
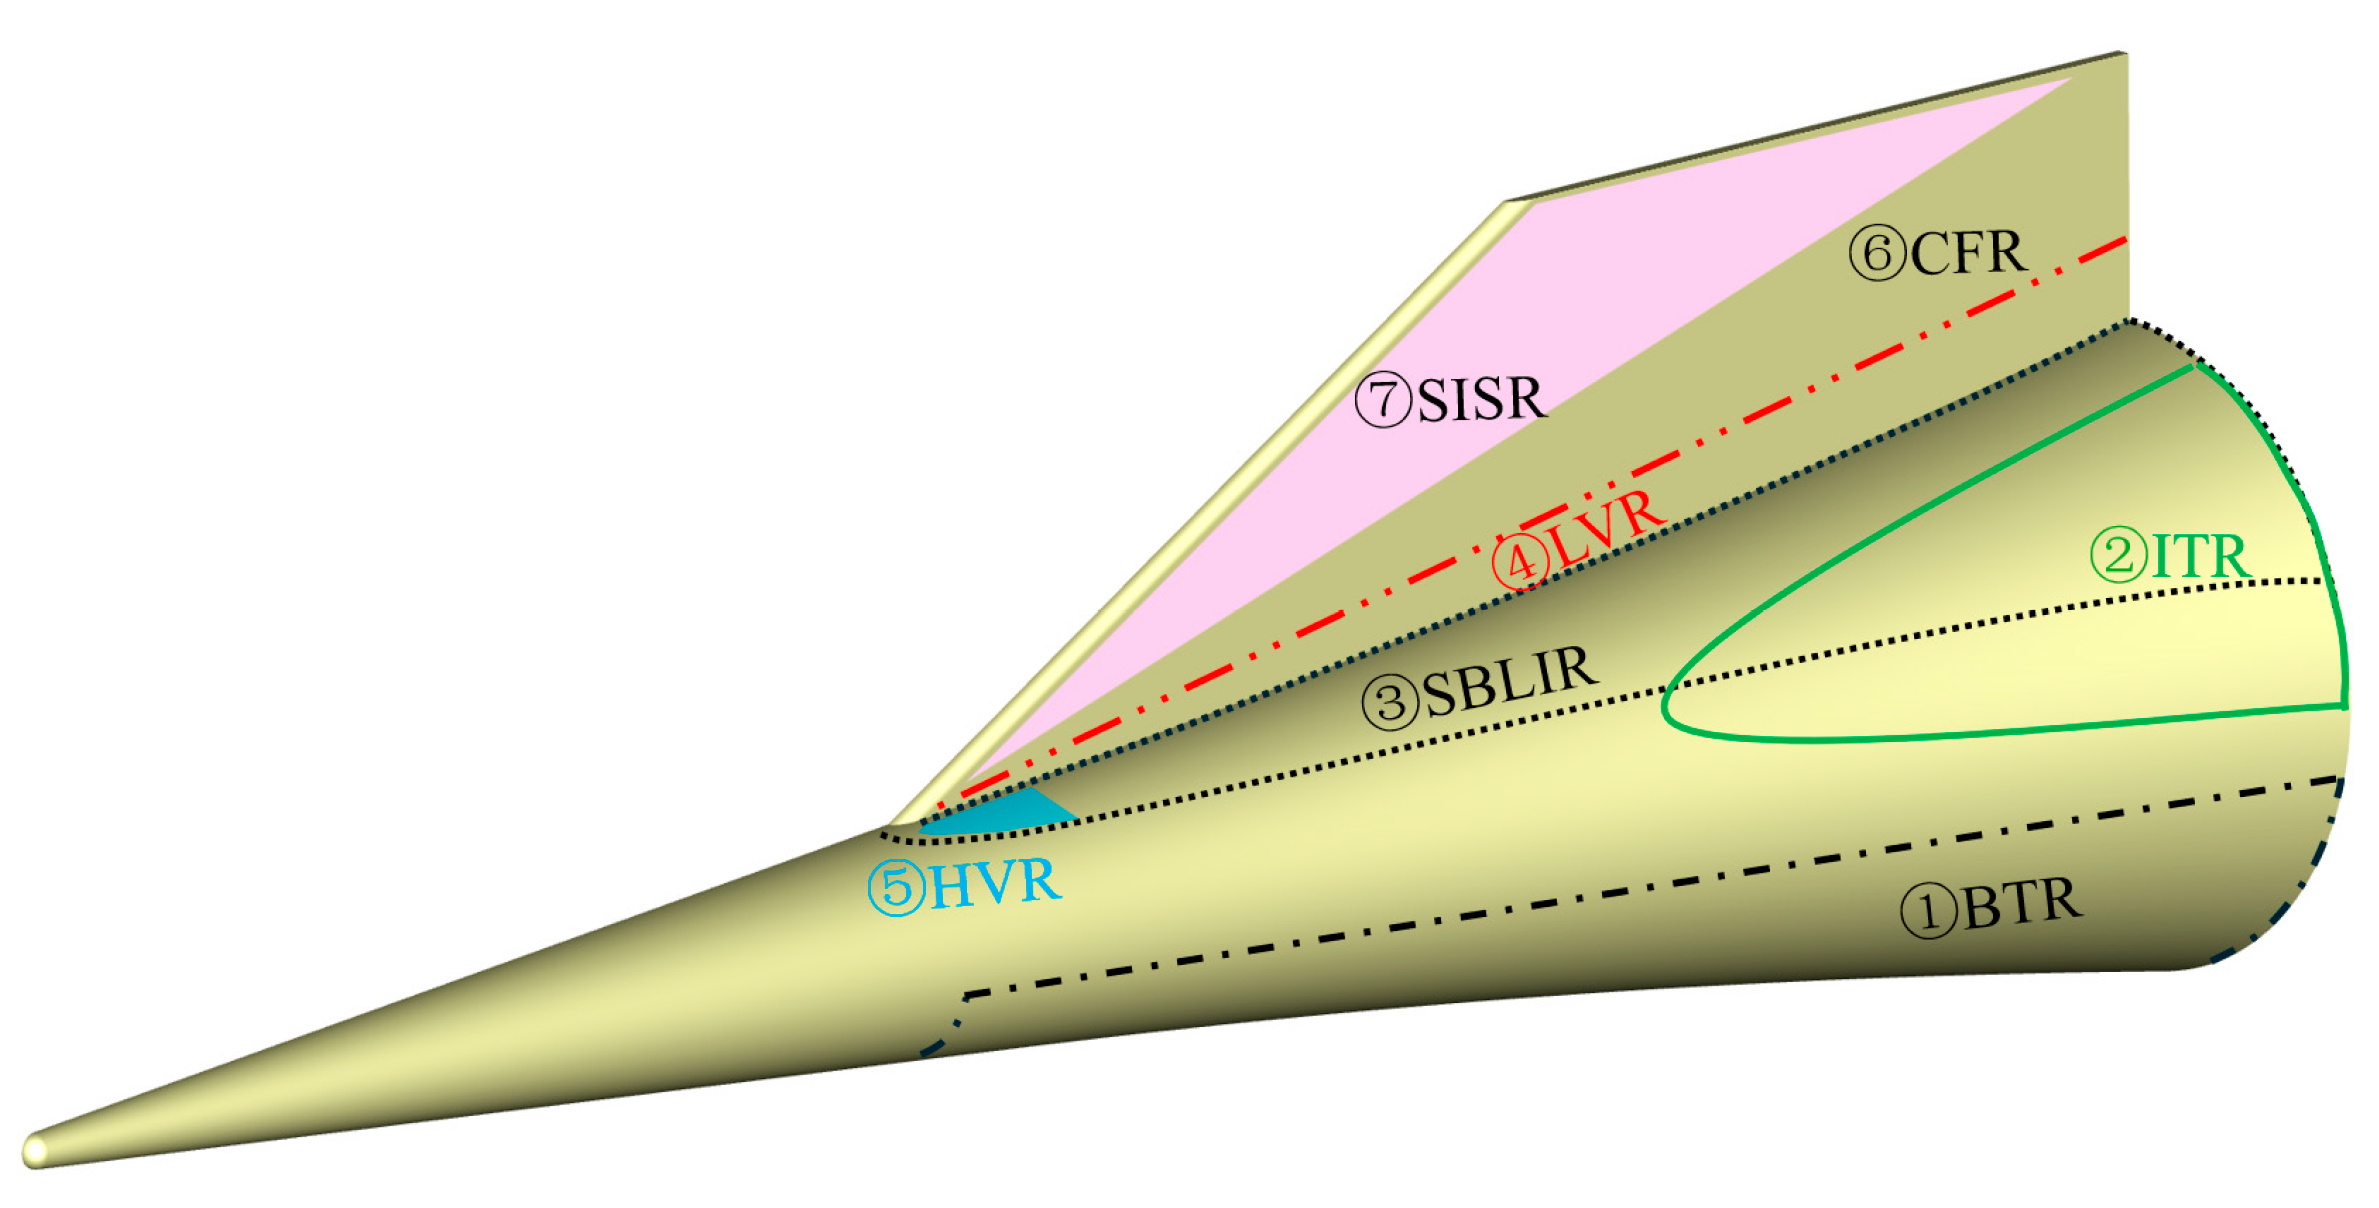
AoA conditions, the surface of the flared cone–swept fin configuration was divided into seven representative regions according to flow structure characteristics and heat flux distribution, as shown in
Figure 7. ① Bottom Surface Transition Region (BTR), located on the bottom surface of the flared cone. ② Interaction Transition Region (ITR), positioned on the upper surface of the flared cone near the junction with the swept fin, with significant positional variation under different
AoA. ③ Shock–boundary Layer Interaction Region (SBLIR), distributed primarily at the junction between the flared cone and the swept fin, relatively stable under 0°
AoA but showing considerable positional variation under varying
AoA. ④ Leading-Edge Vortex Region (LVR), located near the intersection of the swept fin leading edge and the flared cone. ⑤ Horseshoe Vortex Region (HVR), distributed along the flared cone surface near the swept fin root. ⑥ Crossflow Transition Region (CFR), associated with crossflow instability on the swept fin. ⑦ Shear-Induced Streak Region (SISR), located between the swept fin leading edge and the crossflow region.
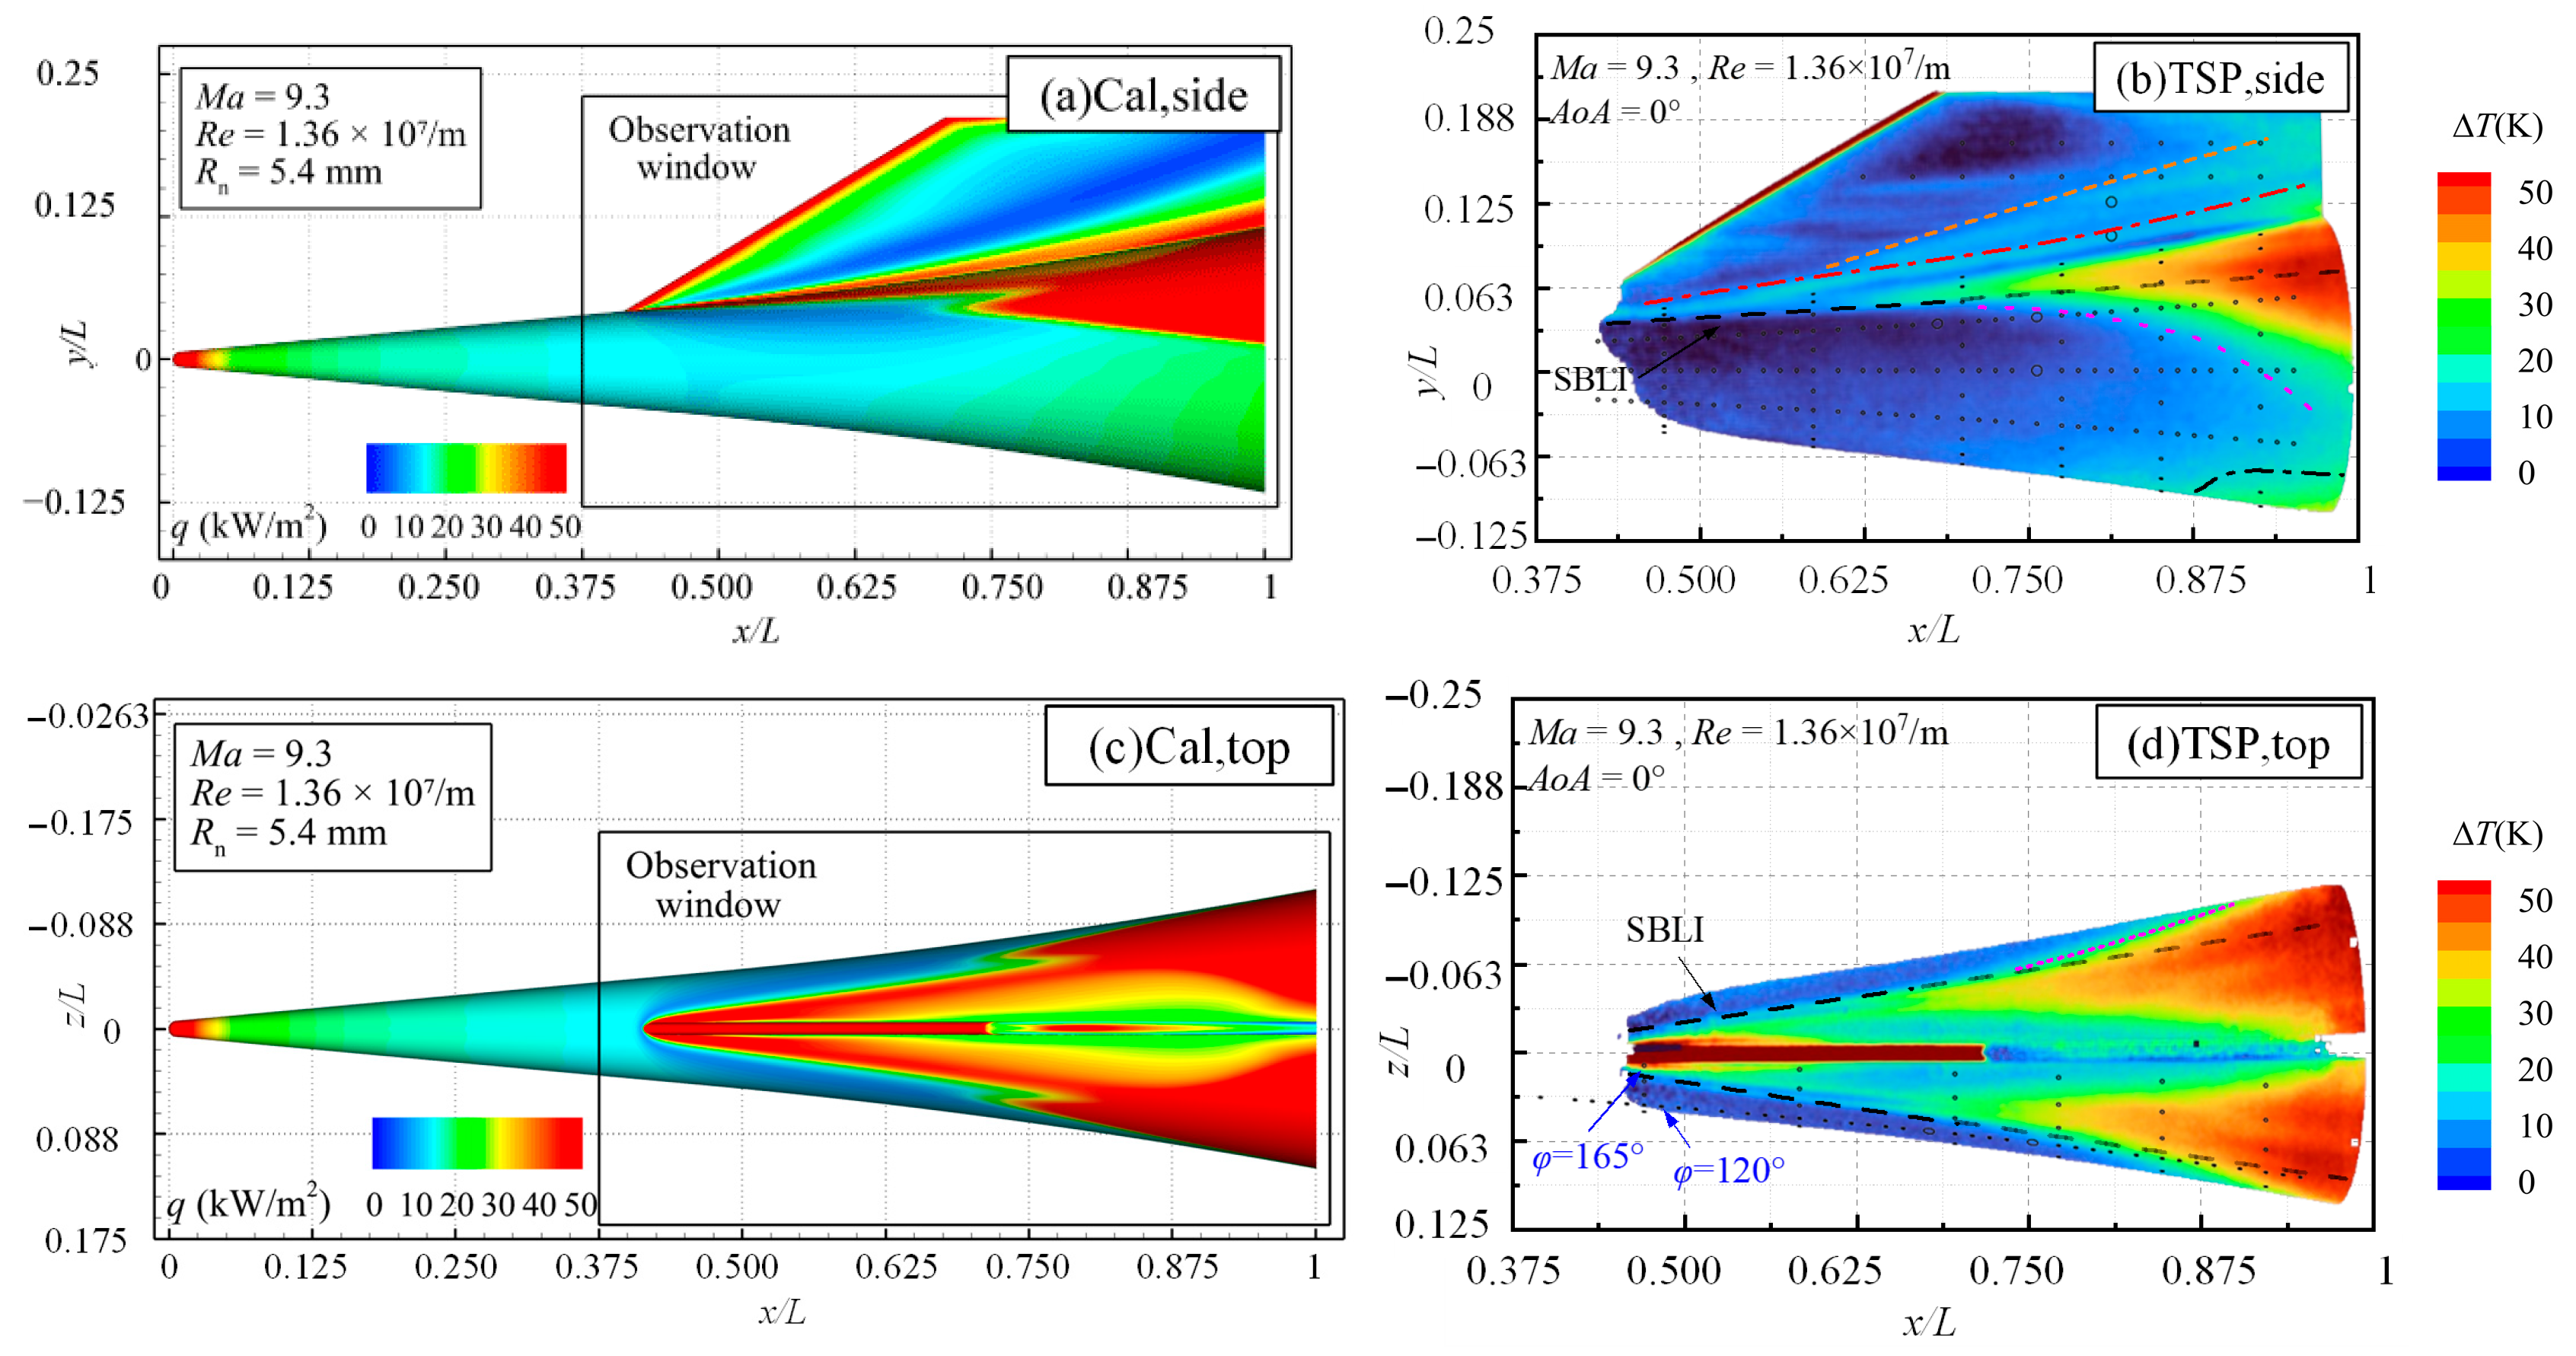
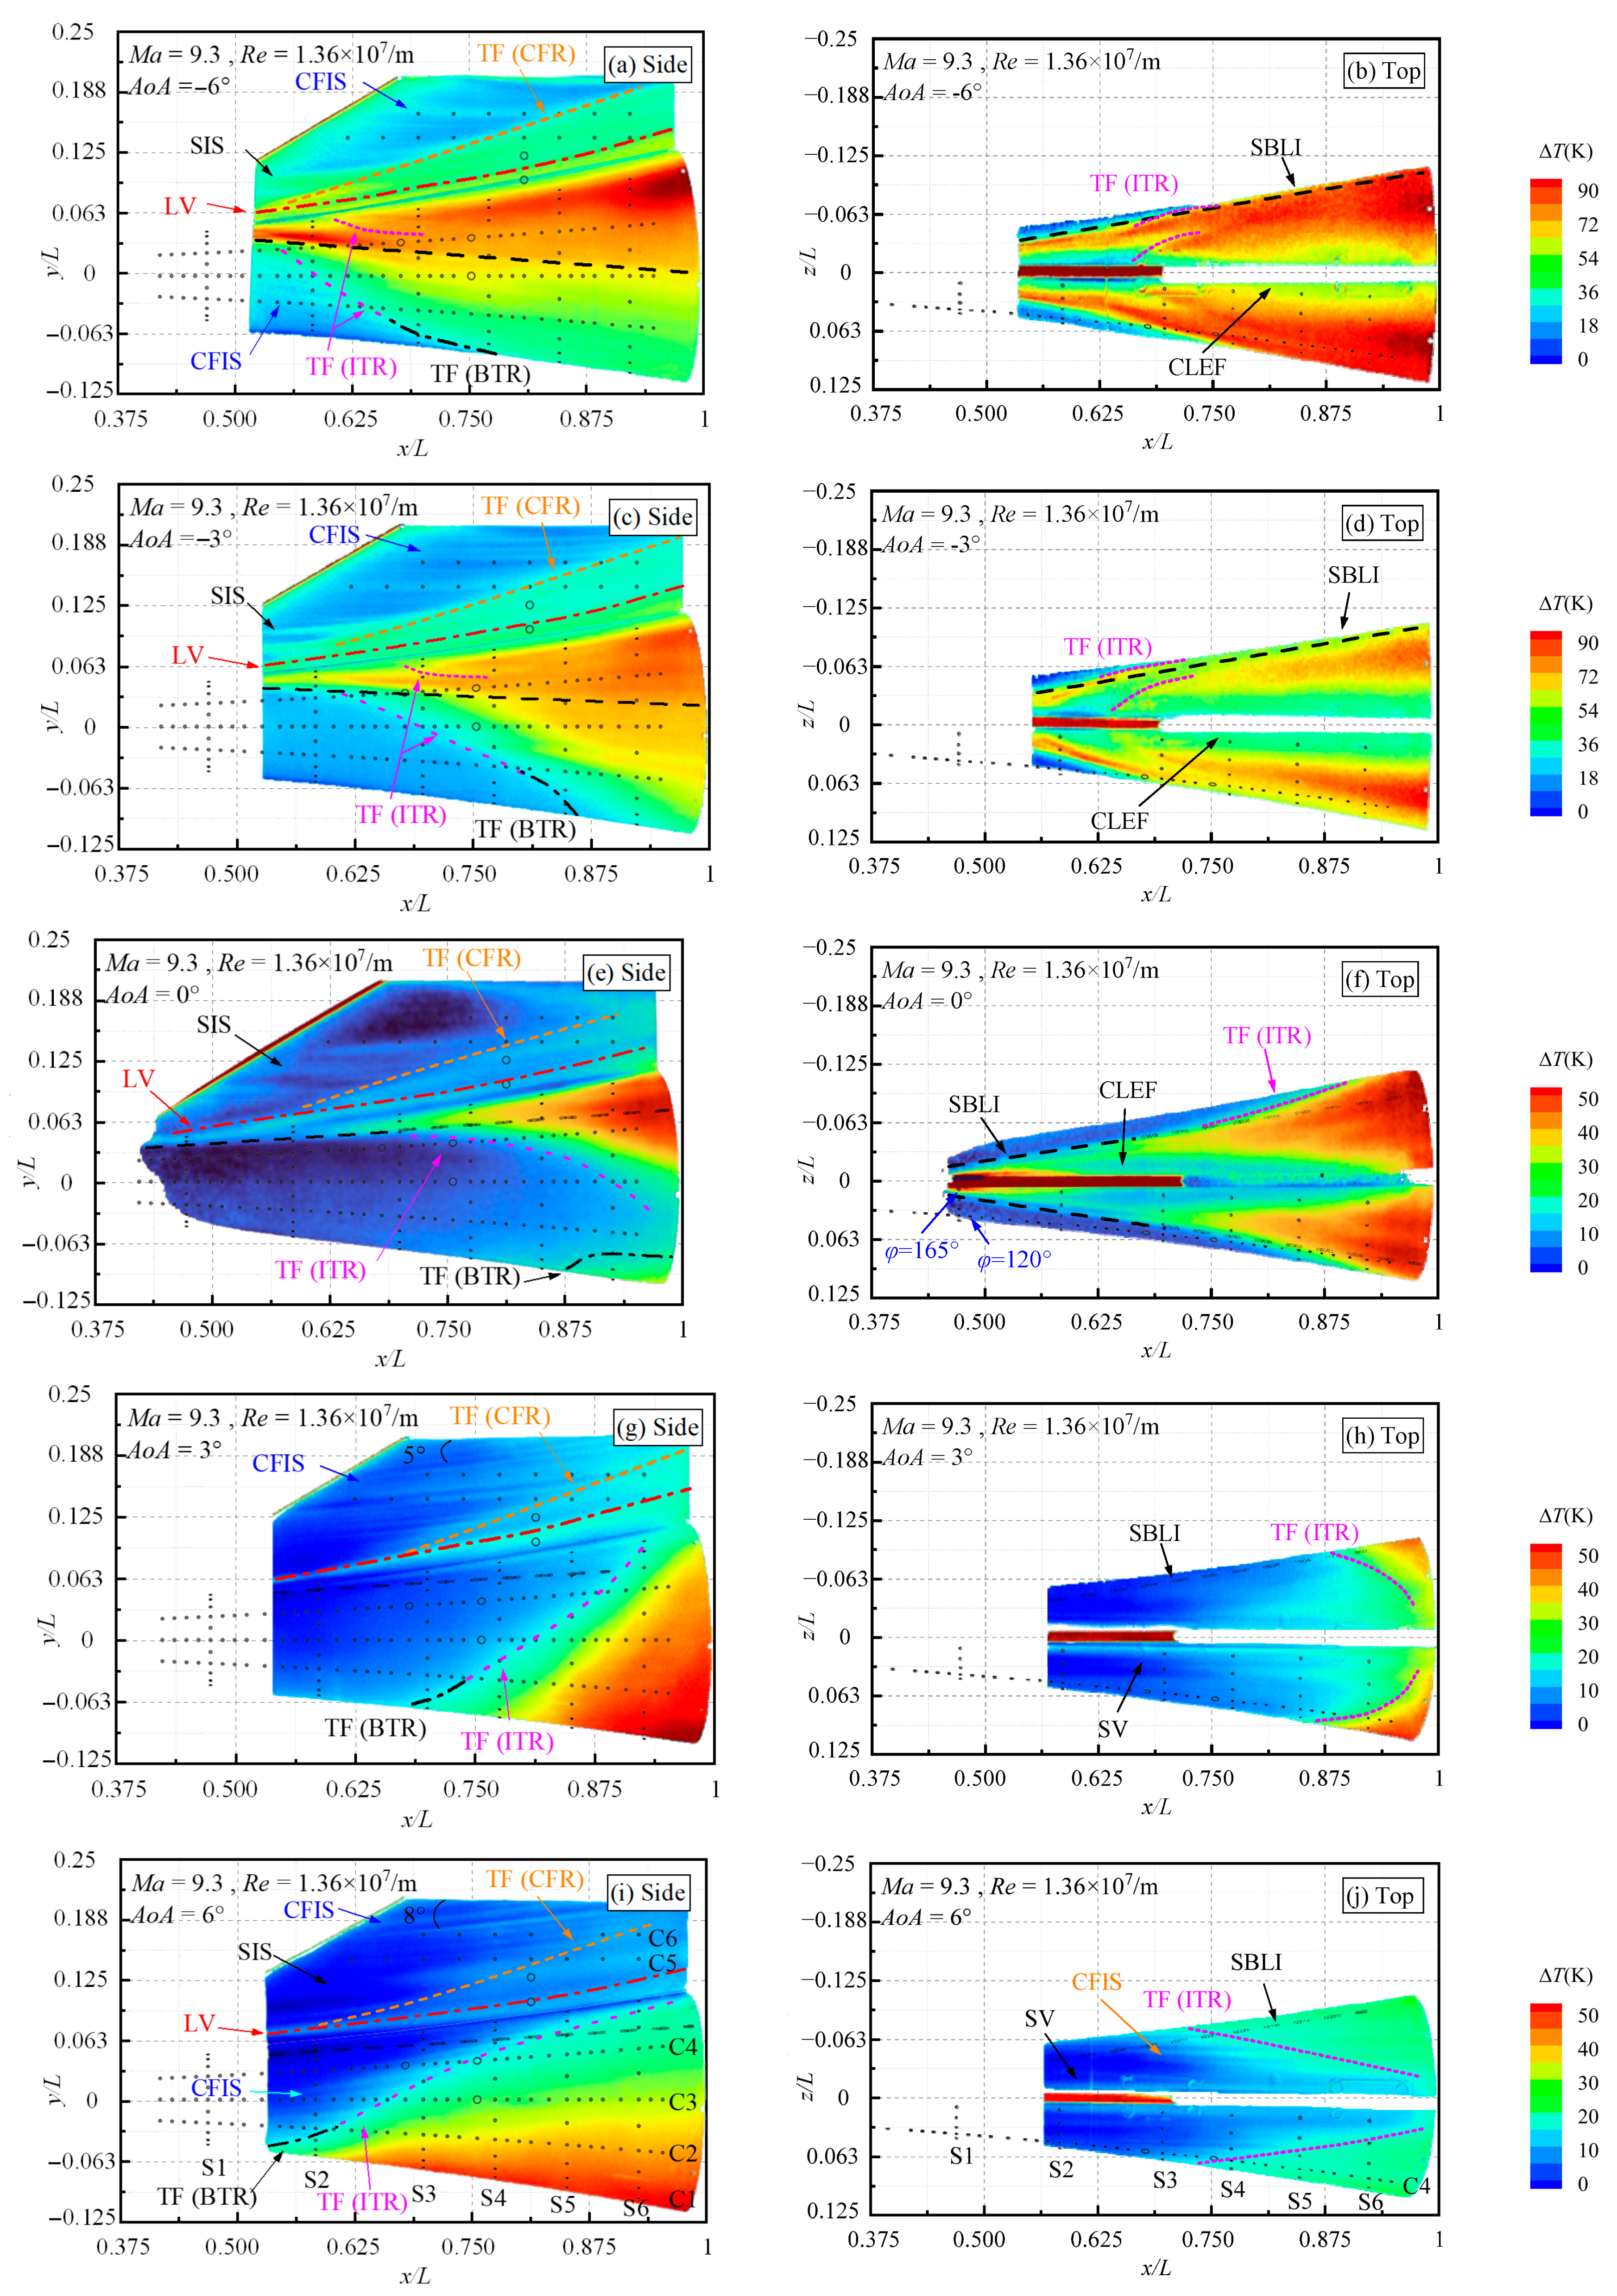
Figure 8 presents the TSP results on the side and top surfaces of the flared cone–swept fin configuration at
Ma = 9.3 and
Re = 1.36 × 10
7/m for different
AoA values (−6°, −3°, 0°, 3°, and 6°). To facilitate comparison with quantitative data obtained from sensors, their locations are marked in the temperature rise contour maps. The results indicate that
AoA significantly affects the boundary layer transition and heat flux distribution on the flared cone and the swept fin. Detailed analyses are provided below.
In the BTR, at AoA = 0°, transition initiates around x/L = 0.875, yet the boundary layer does not achieve a fully turbulent state by the model’s trailing edge. As the AoA decreases to −3°, surface temperatures rise, and the transition onset moves slightly downstream to x/L ≈ 0.9, forming an extended transition region (green area). A further decrease in AoA to −6° advances the onset location to approximately x/L = 0.775, with the transition region widening, though the boundary layer still does not achieve a fully turbulent state. At positive AoA, the transition onset in the BTR moves significantly upstream. At AoA = 3°, the onset moves upstream to approximately x/L = 0.688, with the boundary layer transitioning from laminar to turbulent. When the AoA increases to 6°, the transition onset moves further upstream to approximately x/L = 0.538. These findings indicate that both positive and negative AoAs promote earlier transition in the BTR. However, the observed transition pattern differs from the typical distribution seen on simple geometries, where transition onset is generally delayed on the windward side and advanced on the leeward side.
The heat flux distribution in the ITR varies significantly with changes in AoA. At AoA = 0°, a triangular high-heat-flux region forms along the side surface of the flared cone’s rear, initiating at approximately x/L = 0.738. From the top view, this region intersects the SBLI boundary near x/L ≈ 0.75, forming a local diamond-shaped low-heat-flux area together with the “M”-shaped transition front at the flared cone’s rear. When AoA decreases to −3°, the side surface high-heat-flux region expands, forming two distinct transition fronts inside and outside the SBLI boundary. The outer front moves upstream to x/L ≈ 0.625, while the inner front initiates at x/L ≈ 0.65. From the top view, the two fronts are more distinct, with increased circumferential separation relative to the 0° case. At AoA = −6°, double transition zones are observed on both sides of the SBLI boundary, with further enhancement of high heat flux levels, particularly concentrated near both sides of the fin. A large transition region extends across the rear of the flared cone. The outer transition front starts at approximately x/L = 0.65, with multiple crossflow-induced streaks appearing near x/L ≈ 0.563. The inner transition front initiates around x/L = 0.663. From the top view, the distribution of high-heat-flux regions resembles that at −3° but with higher intensity and more pronounced transition characteristics.
At positive AoA, the high-heat-flux region on the flared cone’s rear surface relocates. At AoA = 3°, the high-heat-flux area becomes concentrated in the BTR, forming a clearer transition zone that extends from the bottom surface toward the top. From the top view, the high-heat-flux regions form a “U”-shaped transition front, with streaks generated by separation vortices (SV) appearing along both sides of the fin. As AoA increases to 6°, the high-heat-flux area further concentrates in the BTR, with the transition zone moving upstream and expanding in width. Crossflow-induced streaks emerge along the leading edge of the transition zone. From the top view, the transition front takes on a “V” shape, with SV-induced streaks still visible along the sides of the fin.
These findings indicate that the ITR is highly sensitive to changes in AoA. At moderate angles (AoA = ±3°), transition initiates earlier at the rear of the flared cone. This extends the transition zone and enlarges the high-heat-flux area, which predominantly shifts towards the leeward side. At higher angles (AoA = ±6°), transition moves further upstream, with the transition zone further extending and the high-heat-flux area becoming more intensified in the spanwise direction. Additionally, under negative AoA, two distinct transition fronts form inside and outside the SBLI boundary. This phenomenon may be attributed to the thinner boundary layer in this region at negative AoA, where minor surface protrusions (such as bolt heads securing the fin) can trigger localized transition, leading to the development of a transition front within the SBLI boundary. This explains the proximity of the transition onset locations under both −3° and −6° conditions.
AoA variations also affect the fin surface heat flux distribution. At AoA = 0°, the fundamental heat flux features observed are consistent with those observed in previous experiments at Ma = 6.4, primarily comprising the LV, CFR, and SIS structures. Under high Mach number conditions, these characteristic heat flux distributions become more distinct. At AoA = −3°, the overall heat flux intensity increases, but the locations of the three typical high-heat-flux regions remain largely unchanged. Additionally, finer-scale streaks appear near the fin tip, likely associated with intensified crossflow activity. As AoA decreases further to −6°, the heat flux intensity in the LV, CFR, and SIS regions continues to increase, while their locations remain relatively stable. A localized high-heat-flux region emerges near the fin tip, possibly due to vortex leakage from the fin tip at this higher negative AoA. When AoA shifts to positive, the overall heat flux on the fin surface decreases. At AoA = 3°, heat flux levels in the LV and CFR regions are notably lower than those at negative AoA. The crossflow streak forms an angle of approximately 5° with the fin tip. At AoA = 6°, heat flux in these regions decreases further, and the angle between the crossflow streak and the fin tip widens to 8°. These results indicate that while the locations of the LV, CFR and SIS regions on the fin surface are relatively insensitive to AoA changes, the primary effect of AoA is an increase in heat flux intensity at negative angles and a decrease at positive angles. Additionally, at non-zero AoA, crossflow-induced streaks can be observed near the fin tip. At negative angles, these streaks tend to align with the fin tip, whereas at positive AoA, a noticeable angle forms between the streaks and the fin tip, increasing with AoA.
The preceding analysis demonstrates that AoA significantly affects boundary layer transition over the flared cone, particularly evident in the upstream shift of the transition onset on the BTR, the relocation of high-heat-flux regions within the ITR, and the evolution of streak structures. In contrast, the positions of characteristic heat flux distributions on the fin surface exhibit minimal changes with AoA, with the primary effects being changes in heat flux intensity and in the angle between crossflow streaks and the fin tip.
4.2. Temperature Sensor Results Analysis
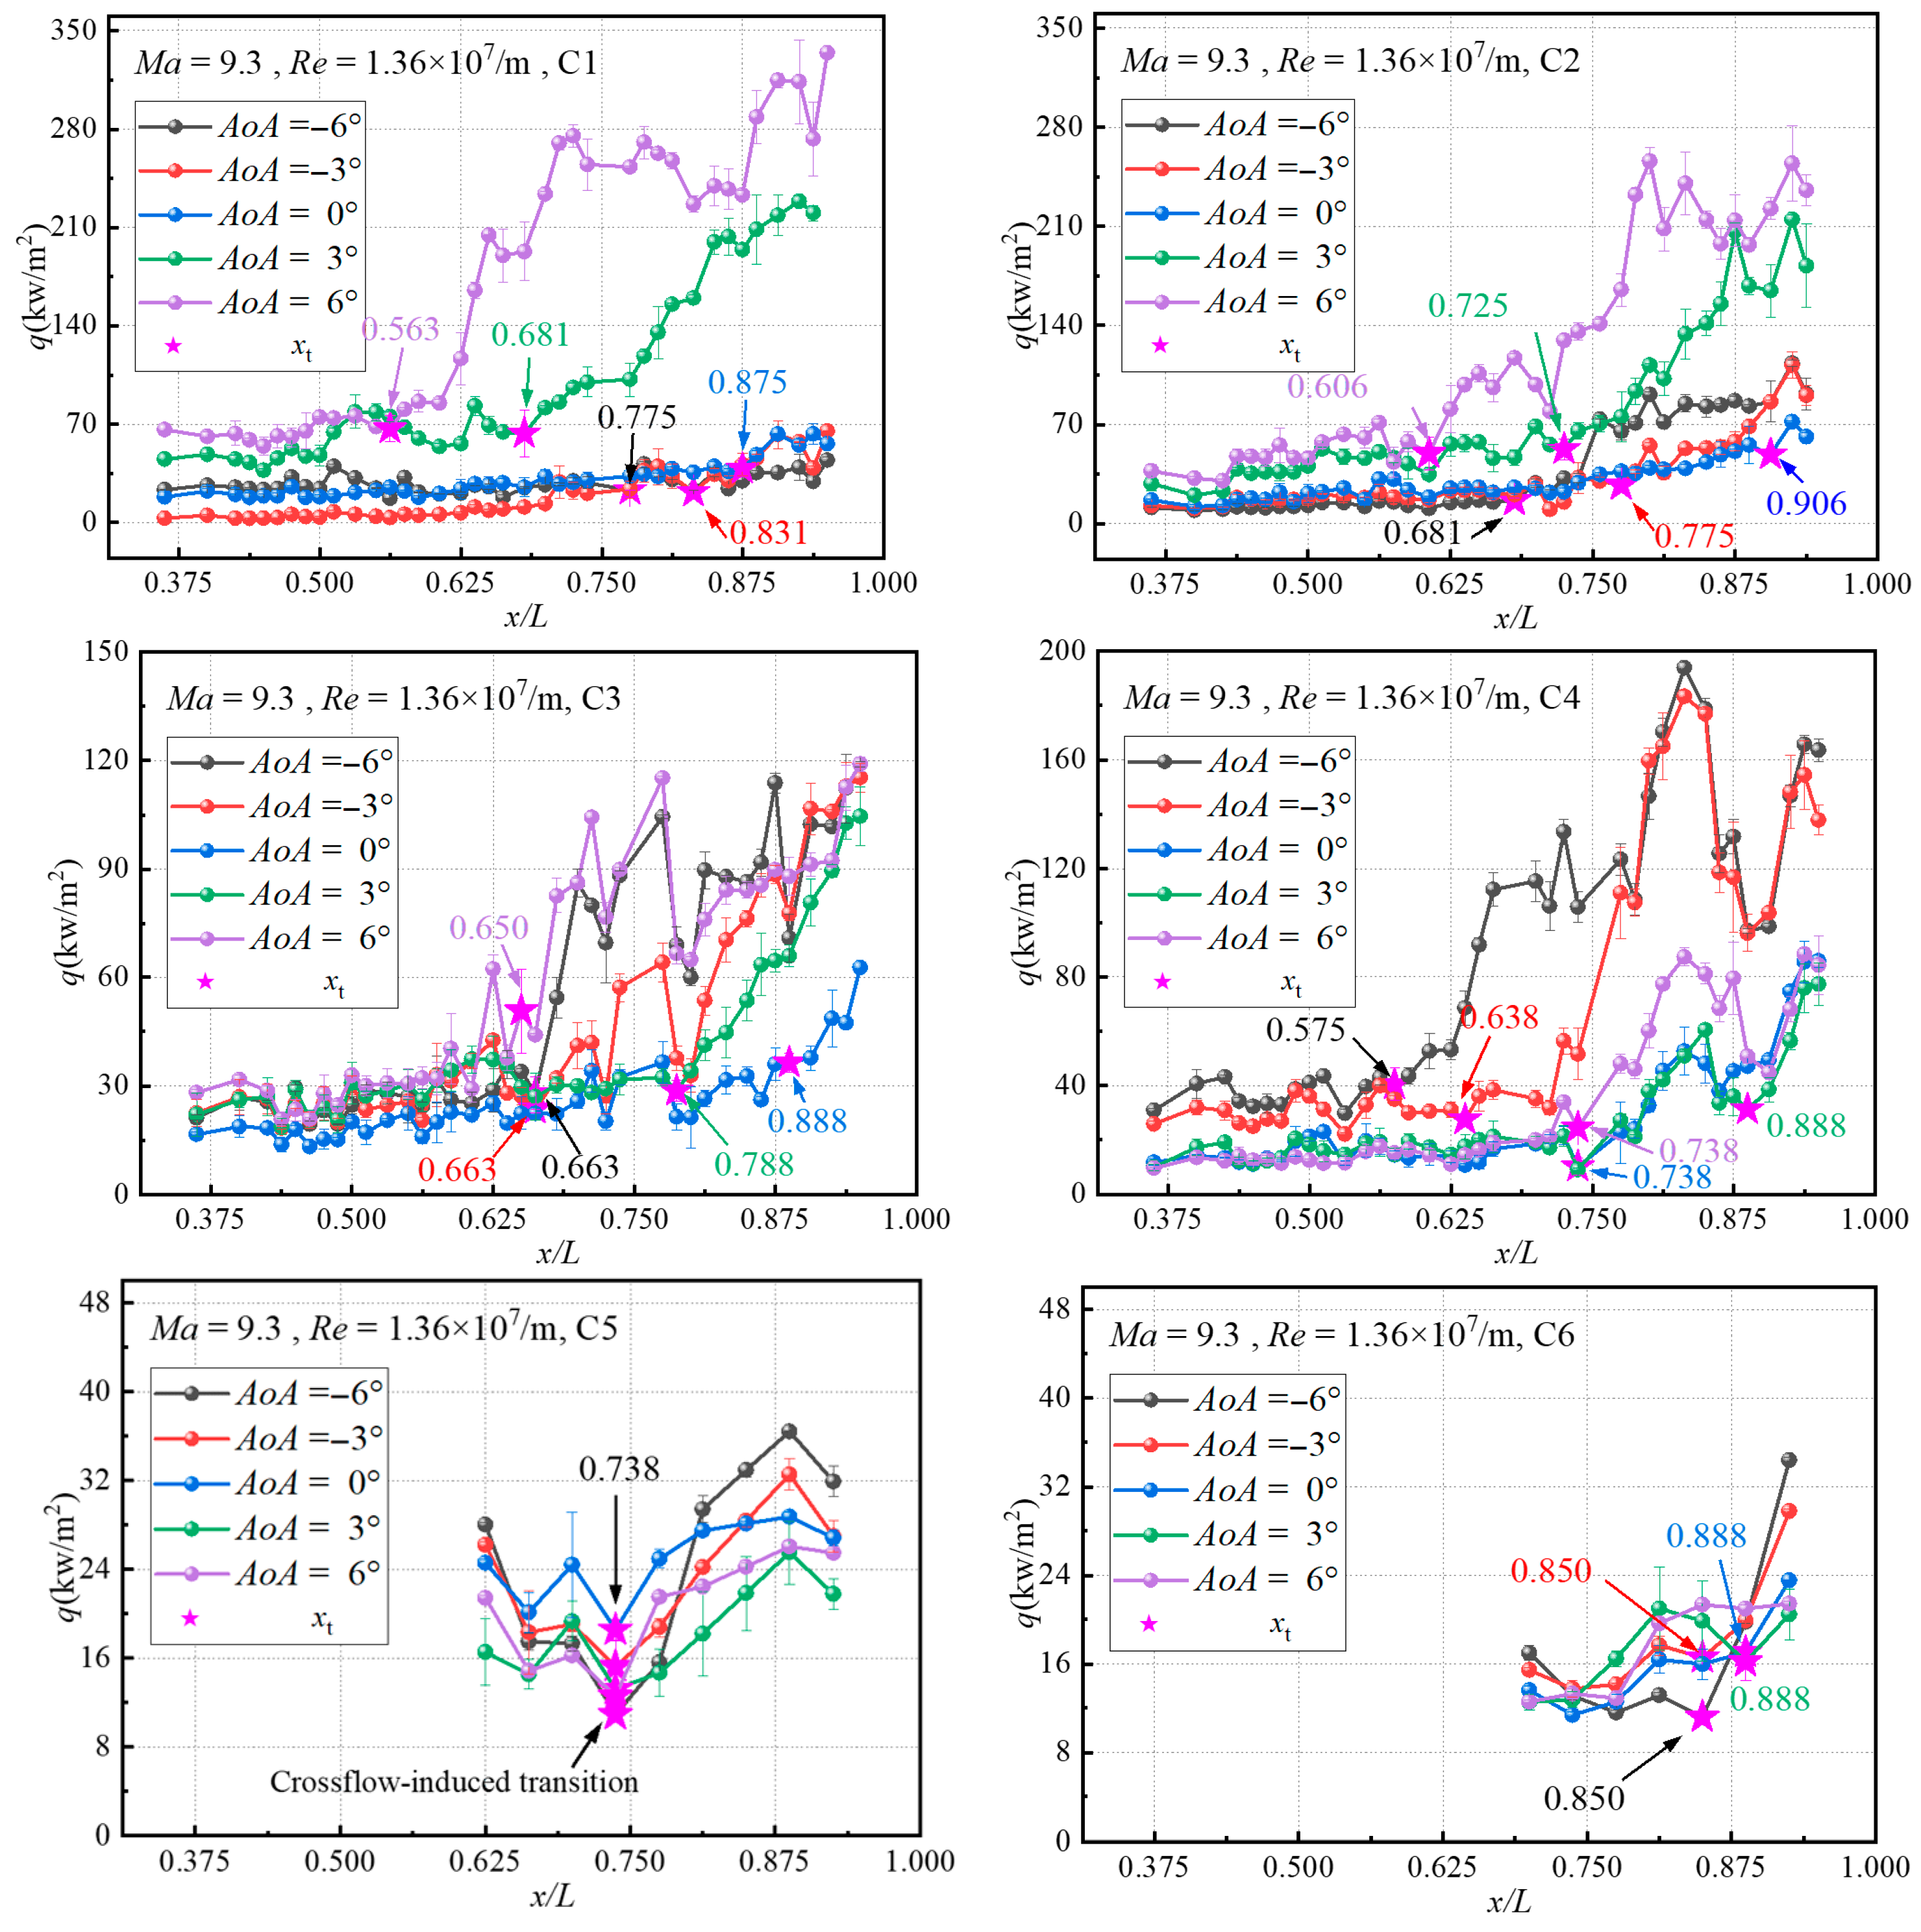
Figure 9 presents the streamwise heat flux distributions on the surface of the flared cone–swept fin configuration at
Ma = 9.3 and
Re = 1.36 × 10
7/m for different
AoA values (−6°, −3°, 0°, 3°, and 6°). Transition onset locations, denoted as
xt, are identified based on an abrupt increase in heat flux above baseline laminar levels. This determination was corroborated by observations from the surface temperature contours obtained in the TSP experiments. These specific onset positions are marked by stars and arrows. Comparing the results across different
AoA conditions, it is evident that the error bands in certain regions are slightly wider at larger magnitude
AoA (−6° and 6°), indicating measurement fluctuations likely associated with localized flow instabilities.
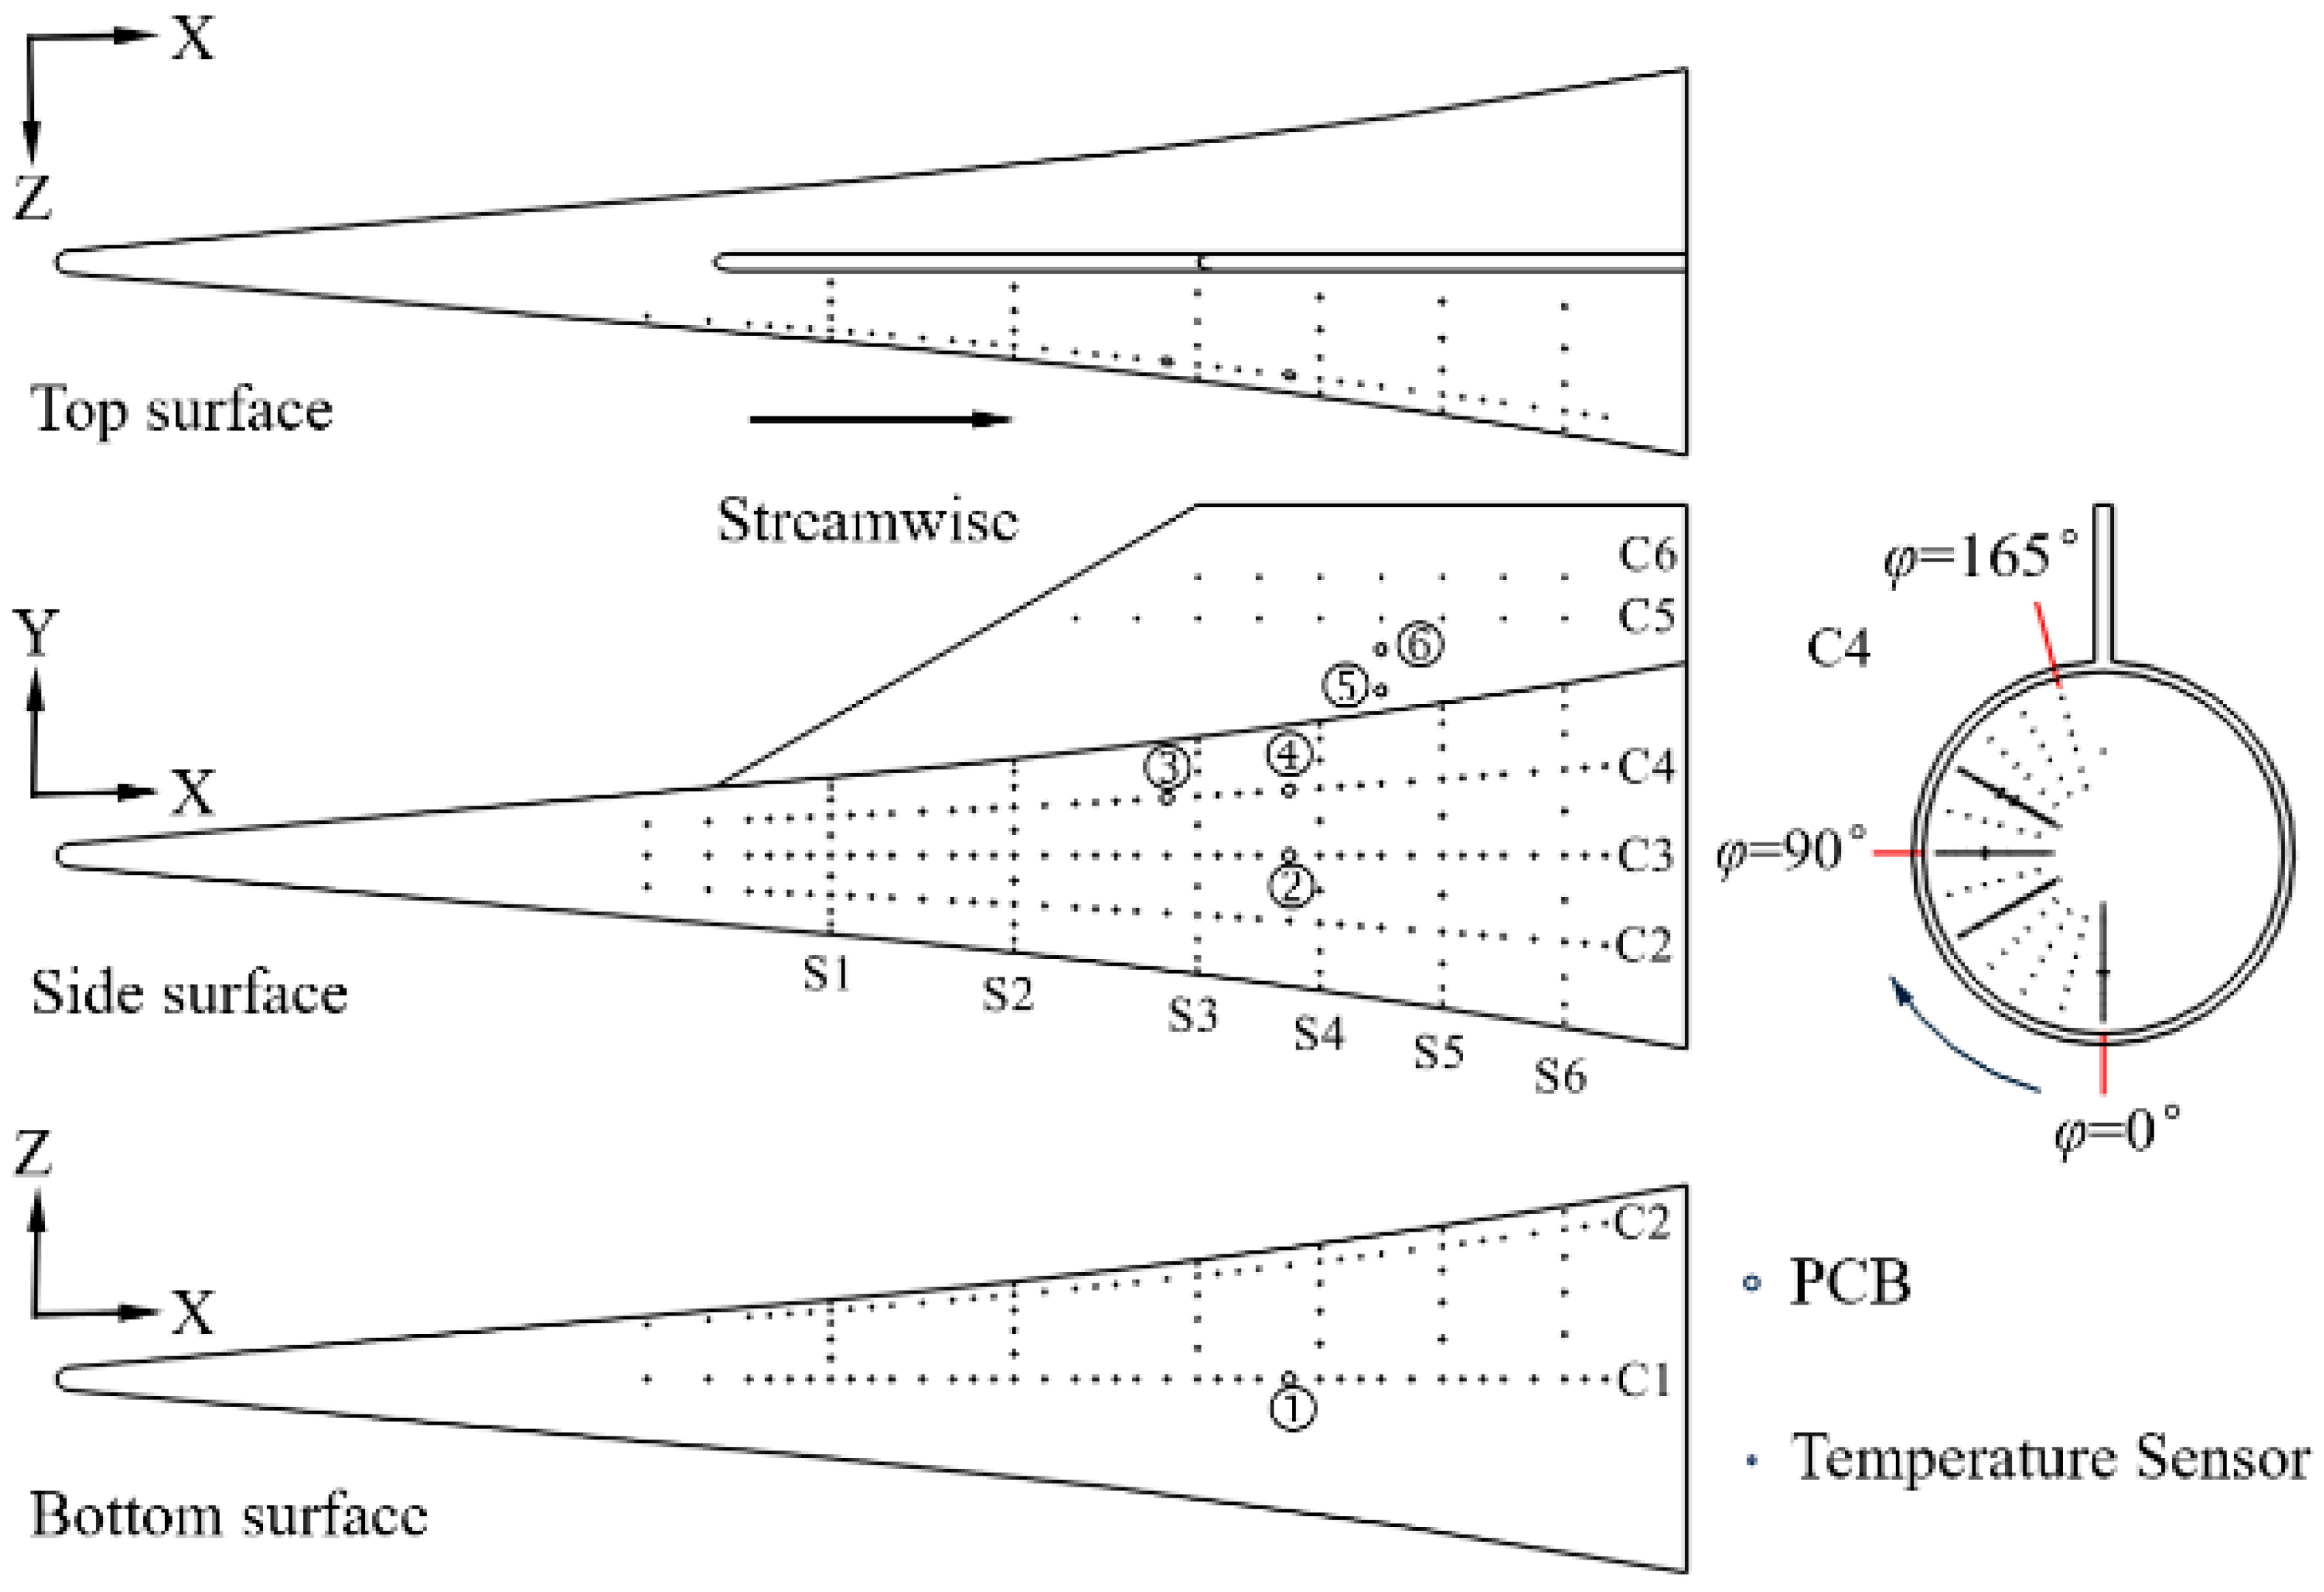
C1 is located along the meridian of the bottom surface (
φ = 0°). At
AoA = 0°, the TSP results in
Figure 8e indicate a transition trend on the bottom surface, with the
xt identified at 0.875 based on the heat flux curve. When
AoA decreases to −3° and −6°, the heat flux along the BTR centerline gradually increases, with
xt shifting upstream to 0.831 and 0.775, respectively, consistent with the TSP patterns in
Figure 8a,c. When
AoA increases to 3° and 6°, the heat flux in the laminar region of the BTR meridian rises, with
xt advancing to 0.681 and 0.563, respectively. Additionally, the post-transition heat flux levels increase significantly, aligning with the TSP results in
Figure 8g,i.
C2 is located along the φ = 60° streamline. At AoA = 0°, the downstream heat flux increases due to the influence of transition in BTR, with xt identified at 0.906. When AoA decreases to −3° and −6°, the heat flux in the laminar region at C2 remains relatively unchanged, but xt shifts upstream to 0.775 and 0.681. As AoA increases to 3° and 6°, the laminar heat flux at C2 gradually rises, with xt advancing to 0.725 and 0.606, respectively. Despite the upstream shift in transition, the peak turbulent heat flux at C2 is consistently lower than that at C1, with reductions of approximately 20–50 kW/m2 across all AoA conditions.
C3 is located at the junction between the side surface and the horizontal plane (
φ = 90°). At
AoA = 0°, the heat flux level increases due to proximity to the transition front in the ITR, with
xt identified at 0.888. When
AoA decreases to −3° and −6°, the transition front moves upstream, and
xt shifts to 0.663. The heat flux in the laminar region remains relatively stable under these conditions but is consistently higher than at 0°
AoA, with a more pronounced increase at −6°. When
AoA increases to 3° and 6°,
xt advances to 0.788 and 0.650, respectively. The oscillations in the heat flux curve before transition at −6° are likely caused by crossflow-induced streaks, consistent with observations in
Figure 8c. Compared to C2, the peak turbulent heat flux at C3 further decreases by approximately 100 kW/m
2.
C4 is located along the
φ = 120° streamline. At
AoA = 0°, this position lies near the intersection of the SBLI boundary and the transition front, with the heat flux increasing and the
xt identified at 0.738. When
AoA decreases to −3° and −6°,
xt shifts upstream to 0.638 and 0.575, respectively, with laminar region heat flux levels notably higher than those at 0° and positive
AoA conditions. When
AoA changes from negative to positive values, the transition onset moves slightly downstream. At
AoA = 3°, a heat flux increase appears at 0.888, as indicated by the SBLI-induced rise observed in the TSP results in
Figure 8g,h. The transition onset is identified at 0.888. When
AoA increases to 6°, the transition onset moves upstream again to 0.575.
C5 and C6 are located on the fin surface at
y = 80 mm and 100 mm, respectively. At high Mach number conditions, the TSP results in
Figure 8e,f show a general increase in surface heat flux, with the shear-induced streaks and crossflow region becoming more pronounced. At C5, the region sequentially passes through the shear layer, SISR and CFR. At
AoA = 0°, the heat flux curve shows an initial decrease followed by a rise, with the transition front in the CFR identified at 0.738. The influence of
AoA changes on the transition onset is minimal at this location; however, within the CFR, the turbulent heat flux under negative
AoA is approximately 10 kW/m
2 higher than that at positive
AoA. The flow characteristics at C6 are generally similar to those at C5. However, a subtle crossflow streak appears between the leading edge and the CFR, causing slight deviations in the heat flux curve across different
AoA conditions.
Overall, AoA variations significantly impact the heat flux distribution and transition characteristics of the flared cone–swept fin configuration. At non-zero AoA conditions, the transition zone on the flared cone surface (C1–C4) expands, with high-heat-flux regions shifting according to the AoA direction. At negative AoA, the high-heat-flux area is primarily concentrated in the ITR, whereas at positive AoA, it shifts to the BTR. For the fin surface (C5 and C6), AoA variations have a minimal effect on the transition onset in the CFR but do influence heat flux intensity in the turbulent region. Specifically, turbulent heat flux in the CFR increases at negative AoA and decreases at positive AoA. Additionally, at larger AoA conditions, finer-scale crossflow streaks appear between the leading edge and the CFR.
To further investigate the impact of
AoA on heat flux distribution in the boundary layer, the circumferential heat flux distribution on the flared cone surface at various
AoA conditions is analyzed in conjunction with the TSP results shown in
Figure 8.
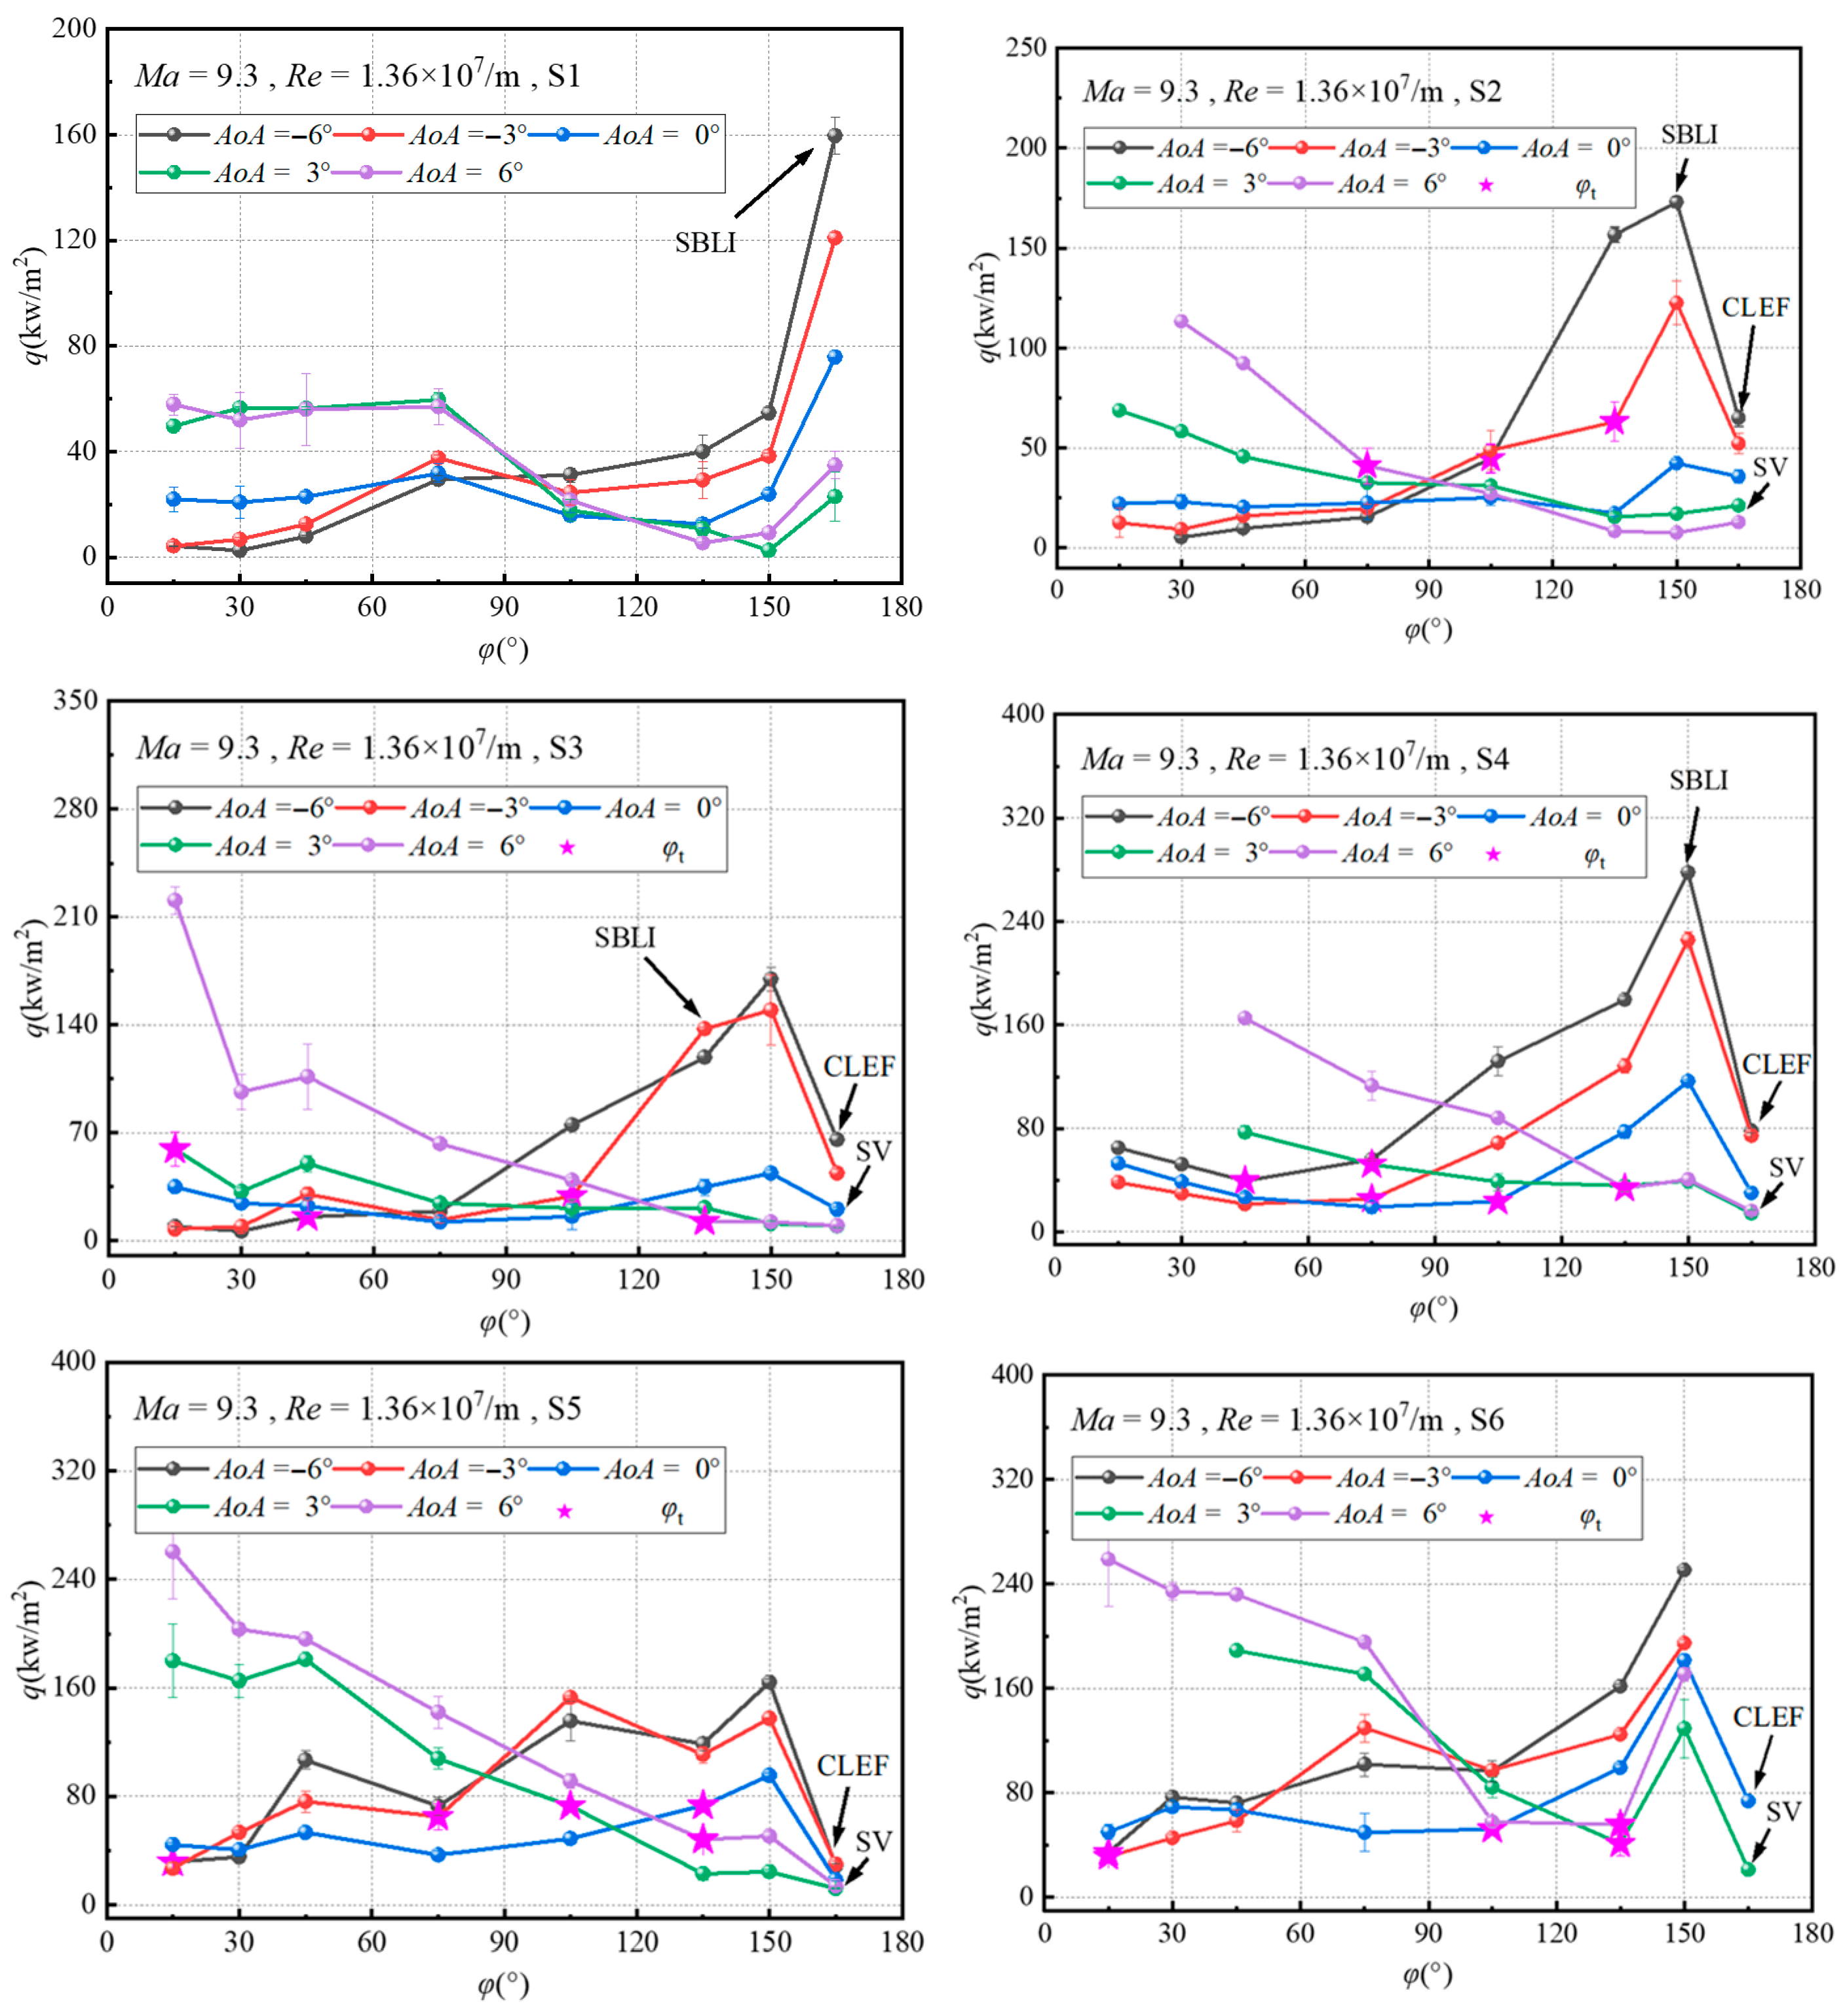
Figure 10 presents the circumferential heat flux distributions at different streamwise sections on the flared cone surface. Transition onset locations (
φt) are marked by stars for each condition.
S1 is located at
x = 380 mm. Although TSP data at this location is partially missing in
Figure 8, the overall trend suggests that the flow remains laminar within the
φ = 0–150° range at all
AoA conditions. At
φ = 165°, a notable rise in heat flux is observed, likely due to SBLI effects in this region. Comparing the peak heat flux across different
AoA conditions relative to the 0° baseline, negative
AoA leads to an increase in peak heat flux by 84 kW/m
2 and 45 kW/m
2 at −6° and −3°, respectively. Conversely, positive
AoA results in a reduction by 53 kW/m
2 and 41 kW/m
2 at 3° and 6°.
S2 is located at
x = 470 mm. Defining
φ = 90° as the dividing line, the heat flux within the
φ = 15–90° range generally increases as
AoA varies from negative to positive. Conversely, within the
φ = 90–165° range, heat flux decreases as
AoA increases from −6° to 6°. According to
Figure 8, the flow at S2 remains largely laminar at
AoA = 0°, 3° and 6°. At
AoA = −3° and −6°, boundary layer transition occurs at
φ = 135° and 105°, respectively. At
AoA = 0°, −3° and −6°, a heat flux peak appears near
φ = 150° due to SBLI, with higher negative
AoA corresponding to higher peak values. At
φ = 165°, the heat flux drops rapidly, influenced by localized low-heat-flux zones associated with the corner vortex and separation vortex.
S3 is located at
x = 560 mm. At
AoA = 0°, the heat flux on the BTR remains higher than at negative
AoA conditions. At negative
AoA, the flow remains laminar, with low heat flux observed within the
φ ≤ 30° range. At
AoA = −3°, transition occurs at
φ = 105°, and at
φ = 135°, heat flux increases due to the combined influence of SBLI and transition. When the
AoA further decreases to −6°, as shown in
Figure 8a, the area near
φ = 45° enters the crossflow-induced streak region, where heat flux gradually rises. At
φ = 105°, the transition front is reached, and heat flux rapidly increases due to the combined effects of transition and SBLI. As
AoA shifts to positive values, transition occurs on the BTR at
AoA = 3°, and by 6°, the flow has fully developed into turbulence. At
φ = 135°, S3 is located within the transition front inside the SBLI boundary, maintaining a high heat flux level.
S4 is located at x = 620 mm. At AoA = 0°, the BTR shows signs of transition development. At negative AoA, the region is in the transition development stage. At AoA = −3°, a transition trend is observed, but the heat flux level is lower than that under AoA = 0°. When the AoA further decreases to −6°, the heat flux exceeds that at AoA = 0°, with a noticeable rise at φ = 135° due to SBLI effects. At positive AoA, the region is fully turbulent. Along the circumferential direction, the heat flux increases at φ = 135° due to SBLI, but the magnitude of the increase remains lower than that at negative AoA. At φ = 165°, the heat flux decreases due to the influence of the separation vortex.
S5 and S6, located at x = 680 mm and x = 740 mm, respectively, exhibit similar heat flux distribution trends to those observed at S4 across different AoA conditions and are therefore not discussed in detail.
The preceding analysis indicates that AoA variations not only affect the distribution of high-heat-flux regions between the upper and lower surfaces of the flared cone but also alter the intensity and extent of SBLI, as well as corner and separation vortex structures. At negative AoA, the heat flux enhancement caused by SBLI is more pronounced, whereas at positive AoA, this effect is relatively subdued. At negative AoA, the characteristic low-heat-flux streaks induced by the corner vortex exhibit a rise in their internal heat flux levels and cover a broader area. In contrast, at positive AoA, the region near the corner is primarily influenced by separation vortex. Additionally, at larger magnitude AoA, new crossflow-induced streaks emerge on the flared cone surface, resulting in localized heat flux increases. These findings reinforce the significance of AoA-induced asymmetry in shaping boundary layer transition and surface thermal loading on complex hypersonic configurations.
4.3. Pressure Fluctuation Sensor Analysis
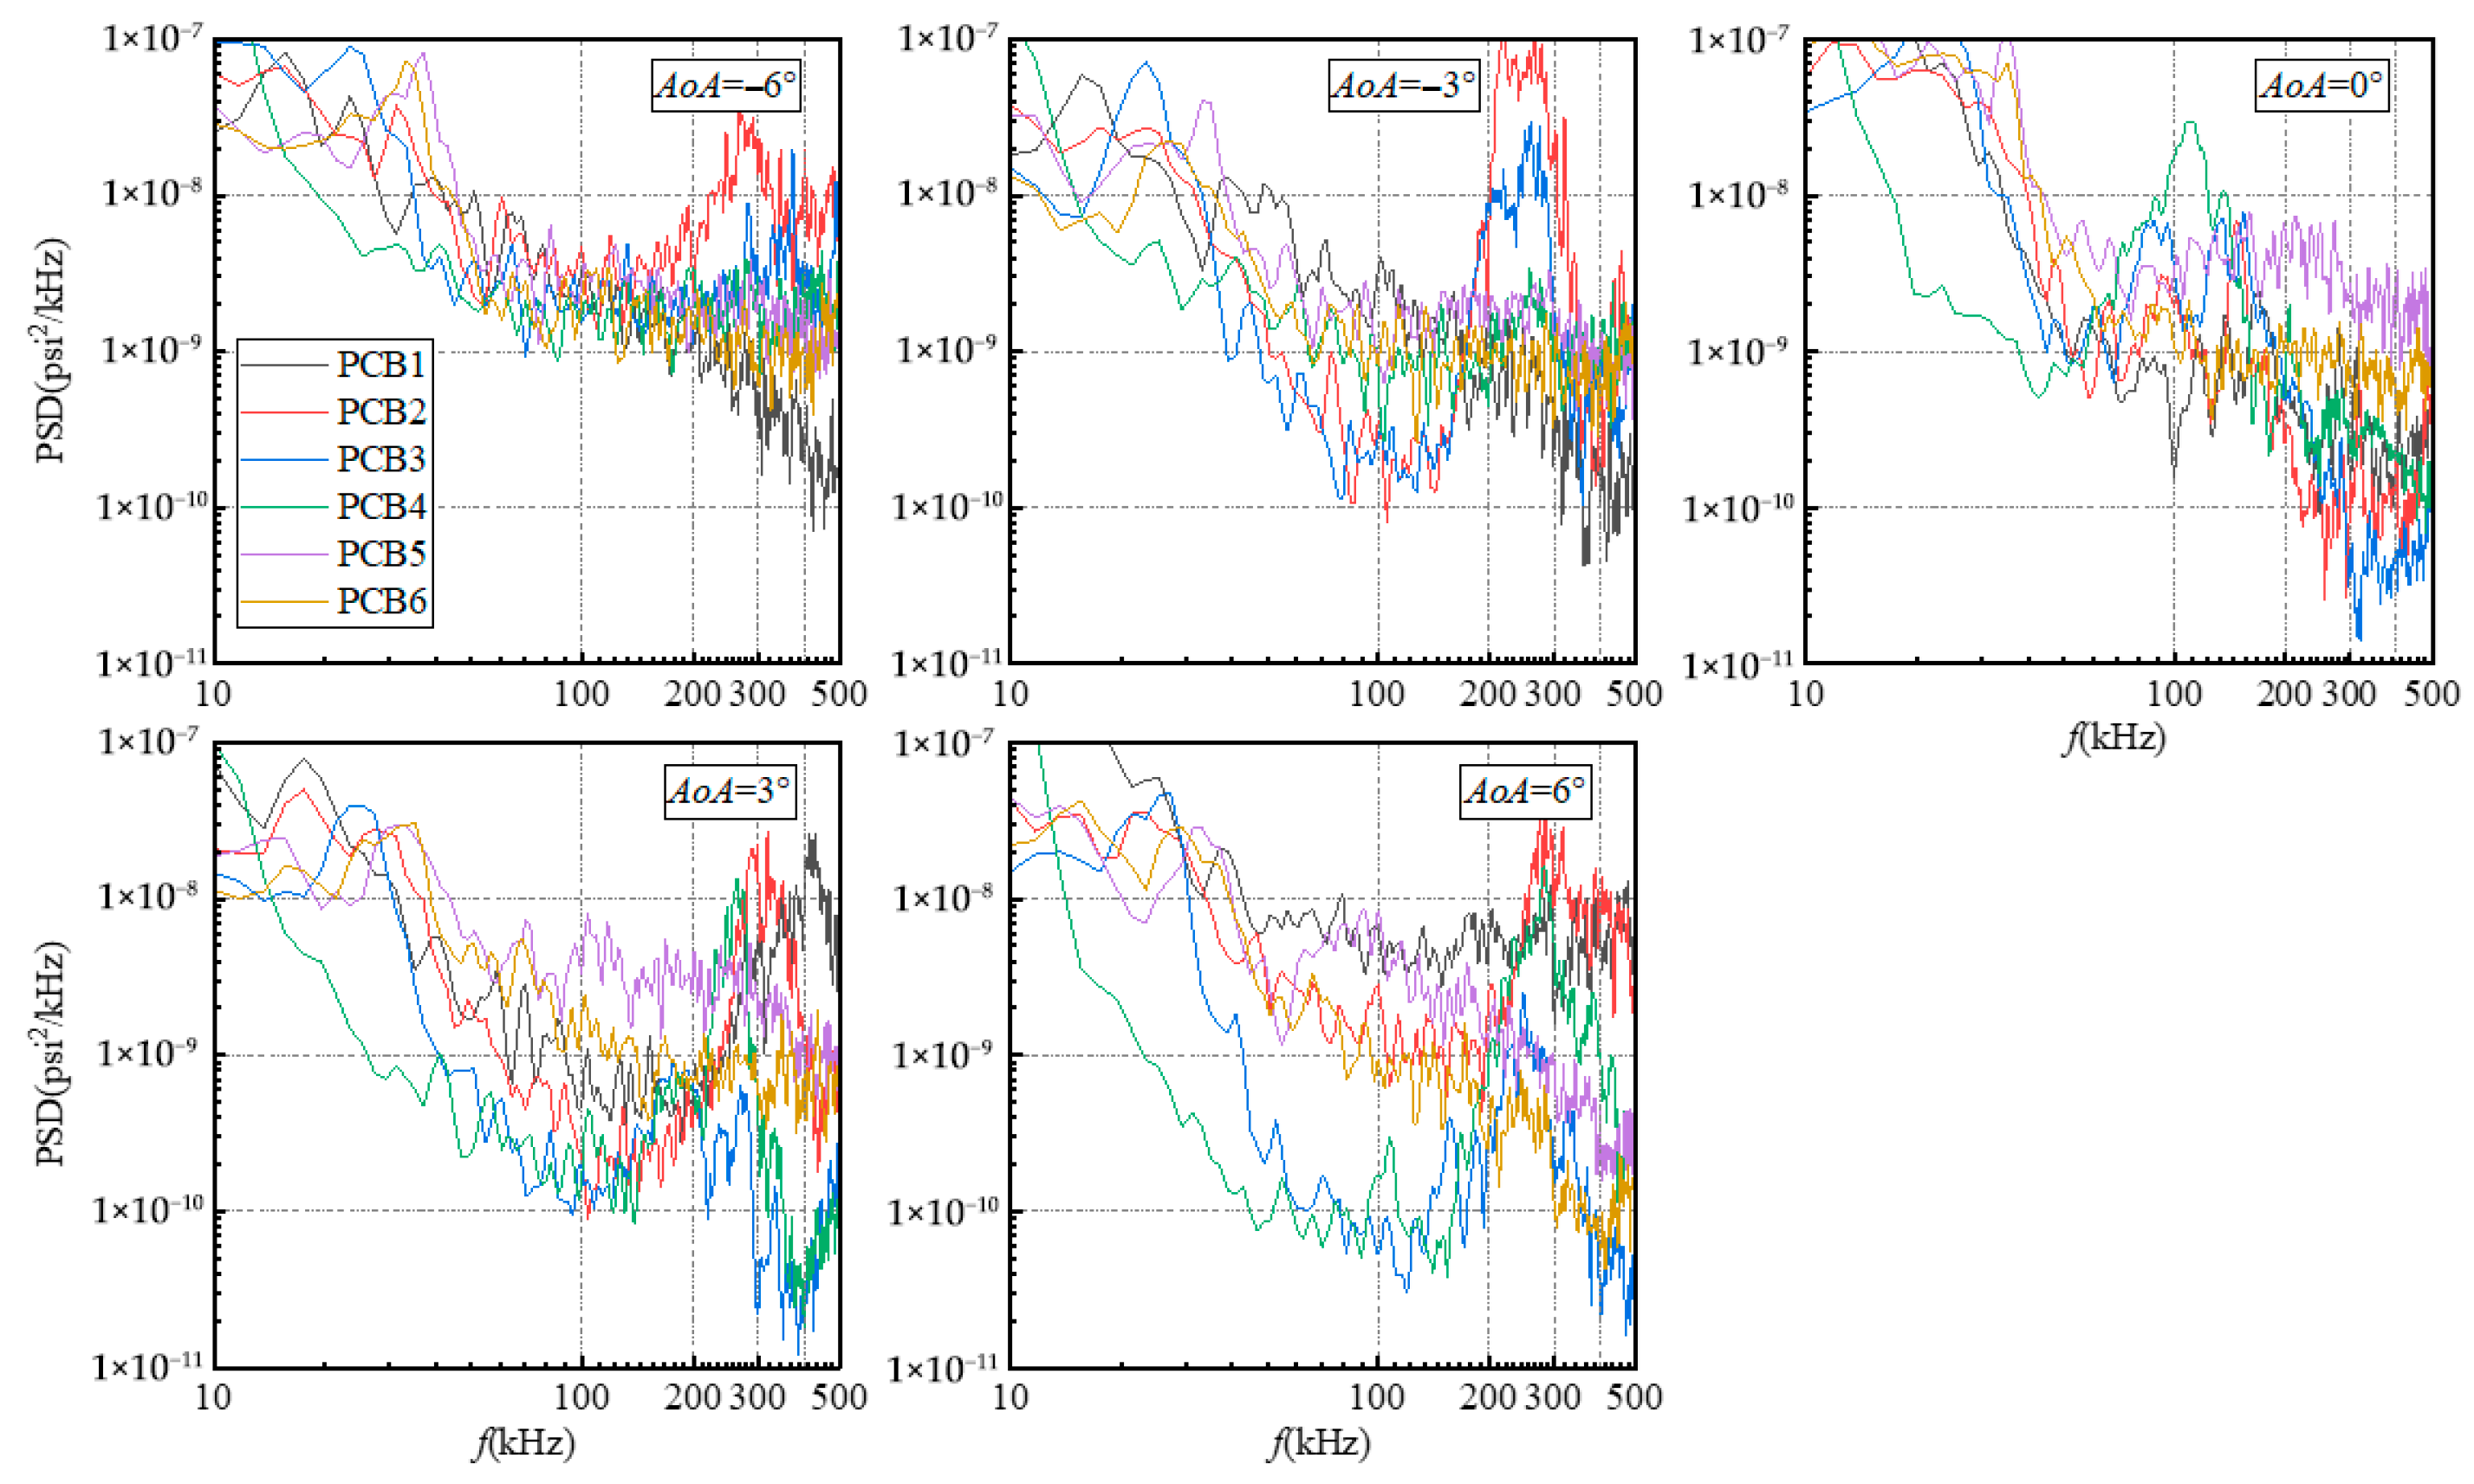
Figure 11 presents the power spectral density (PSD) distributions of pressure fluctuations measured by the six PCB sensors under different
AoA conditions. The results indicate that
AoA variations influence the dominant disturbance frequency range, spectral bandwidth, and energy distribution, with distinct response patterns observed at different sensor locations. Overall, the disturbance responses at PCB1–PCB4, located on the flared cone surface, are more sensitive to
AoA changes, exhibiting broader frequency bands and higher spectral amplitudes compared to those on the swept fin.
To analyze the disturbance response characteristics in each region,
Figure 12 compares the PSD distributions at individual sensor locations under different
AoA. The spectral features are further interpreted in conjunction with the TSP results to identify the corresponding boundary layer states.
At AoA = 0°, distinct spectral responses are observed across the sensor locations. PCB1, positioned along the meridian of the bottom surface, exhibits disturbance peaks in the 100–246 kHz band, with a dominant frequency of approximately 166 kHz. Additionally, a secondary peak appears in the 246–357 kHz band, centered at 279 kHz, indicating the possible presence of second-mode instability, as suggested by the TSP and heat flux data. PCB2, positioned at the junction between the flared cone side surface and the horizontal plane, captures two disturbance bands at 59–127 kHz and 130–175 kHz, with dominant frequencies of 96 kHz and 148 kHz, respectively. At PCB3, disturbances are detected within the 66–203 kHz band, with spectral peaks at 94 kHz and 134 kHz. The TSP contours indicate that PCB4 is positioned near the SBLI boundary, where disturbances in the 42–182 kHz band are recorded, with a dominant frequency of approximately 113 kHz. PCB5 measures a moderate-amplitude disturbance centered at 216 kHz, while PCB6, located in the crossflow region on the fin surface, captures disturbances ranging from 119 to 281 kHz, characterized by relatively high amplitude and limited spectral decay.
At AoA = −3°, compared to the AoA = 0° case, the disturbance frequencies at some sensor locations shift toward higher frequencies, and high-amplitude second-mode instabilities are observed at multiple locations. PCB1, positioned upstream of the transition front on the BTR, exhibits generally weak spectral content with no prominent peaks. At PCB2, positioned within the transition region, a pronounced second-mode disturbance emerges with a dominant frequency around 246 kHz. PCB3, positioned at the junction between the SBLI boundary and the ITR transition front, displays a broadband spectral response centered at 257 kHz. PCB4, positioned in the turbulent region near the downstream end of the SBLI boundary, records a dominant frequency of approximately 263 kHz, indicating a transition into fully developed turbulence. At PCB5, within the intensified leading-edge heat flux streak, disturbance frequencies range from 146 to 291 kHz. PCB6, positioned in the crossflow region, shows spectral characteristics indicative of turbulence development.
At AoA = −6°, compared to the −3° condition, the overall dominant frequencies remain relatively stable, but low-frequency spectral components become more pronounced. At PCB1, positioned near the transition onset, a localized spectral amplification is observed at approximately 287 kHz. At PCB2, positioned near the end of the transition region, the dominant frequency is around 273 kHz, with increased spectral amplitude, indicating a transition toward turbulence. At PCB3, positioned near the transition front within the SBLI boundary, the dominant frequency is approximately 345 kHz, with a slight decrease in spectral intensity. PCB4, located along the high-heat-flux boundary, exhibits a similar band to that at −3°, with the dominant frequency at 279 kHz and a slight increase in spectral amplitude. At PCB5, a minor spectral peak appears around 291 kHz, coinciding with the heat flux streak. PCB6 displays a broadened disturbance band spanning 134–304 kHz, maintaining amplitude levels comparable to those at −3°, with sustained high-intensity spectral content.
At AoA = 3°, the overall disturbance characteristics at each sensor location are comparable to those observed at −3°. At PCB1, positioned near the end of the transition region, a broad spectral band spanning 188–603 kHz is detected, with a dominant frequency around 416 kHz, indicating a transition toward turbulence. PCB2, positioned upstream of the transition front, exhibits a pronounced second-mode instability centered at 306 kHz, with relatively high amplitude. At PCB3, positioned in the laminar region upstream of the ITR transition front, spectral peaks are observed at 175 kHz and 269 kHz. PCB4, positioned downstream of PCB3 and closer to the transition front, shows two prominent spectral peaks at 183 kHz and 263 kHz, the latter falling within the typical second-mode frequency range. At PCB5, positioned along the intensified leading-edge vortex heat flux streak, the dominant frequency is approximately 285 kHz. At PCB6, the frequency range broadens to 166–376 kHz, maintaining high spectral amplitude.
At AoA = 6°, the disturbance amplitude strength at some sensor locations exceeds that observed at 3°. At PCB1, the spectral amplitude further increases, and the PSD curve flattens, indicating that the region may be approaching a fully developed turbulent state. At PCB2, positioned within the transition region, the dominant disturbance frequency is approximately 291 kHz, accompanied by an increase in spectral amplitude. At PCB3, positioned near the crossflow-induced streak upstream of the ITR transition front and close to the SBLI boundary, a spectral peak centered at 248 kHz is detected, with enhanced amplitude. PCB4, positioned at the ITR transition front, exhibits a prominent spectral peak centered at 285 kHz, with further amplification of spectral amplitude. At PCB5, the heat flux streak weakens, and no distinct spectral peaks are observed in the spectrum, indicating a reduction in disturbance intensity. At PCB6, a spectral peak centered at 244 kHz emerges with reduced amplitude. This frequency falls within the typical second-mode range.
The above spectral analysis indicates distinct disturbance response characteristics at different sensor locations under varying AoA. As AoA changes, the dominant disturbance frequencies on the BTR and ITR generally shift toward higher values, with some locations beginning to exhibit features indicative of fully developed turbulence. Overall, under positive AoA, PCB1 and PCB2 on the windward side exhibit higher disturbance amplitudes, whereas under negative AoA, the most pronounced disturbances are observed at PCB3 and PCB4, which are now on the windward side. Notably, at AoA = −3°, PCB2 records the strongest second-mode instability. On the fin surface, PCB5 and PCB6 are located within the leading-edge vortex heat flux streak and the crossflow-dominated region. While disturbance intensity varies slightly with AoA, the overall spectral characteristics at these locations remain relatively consistent.
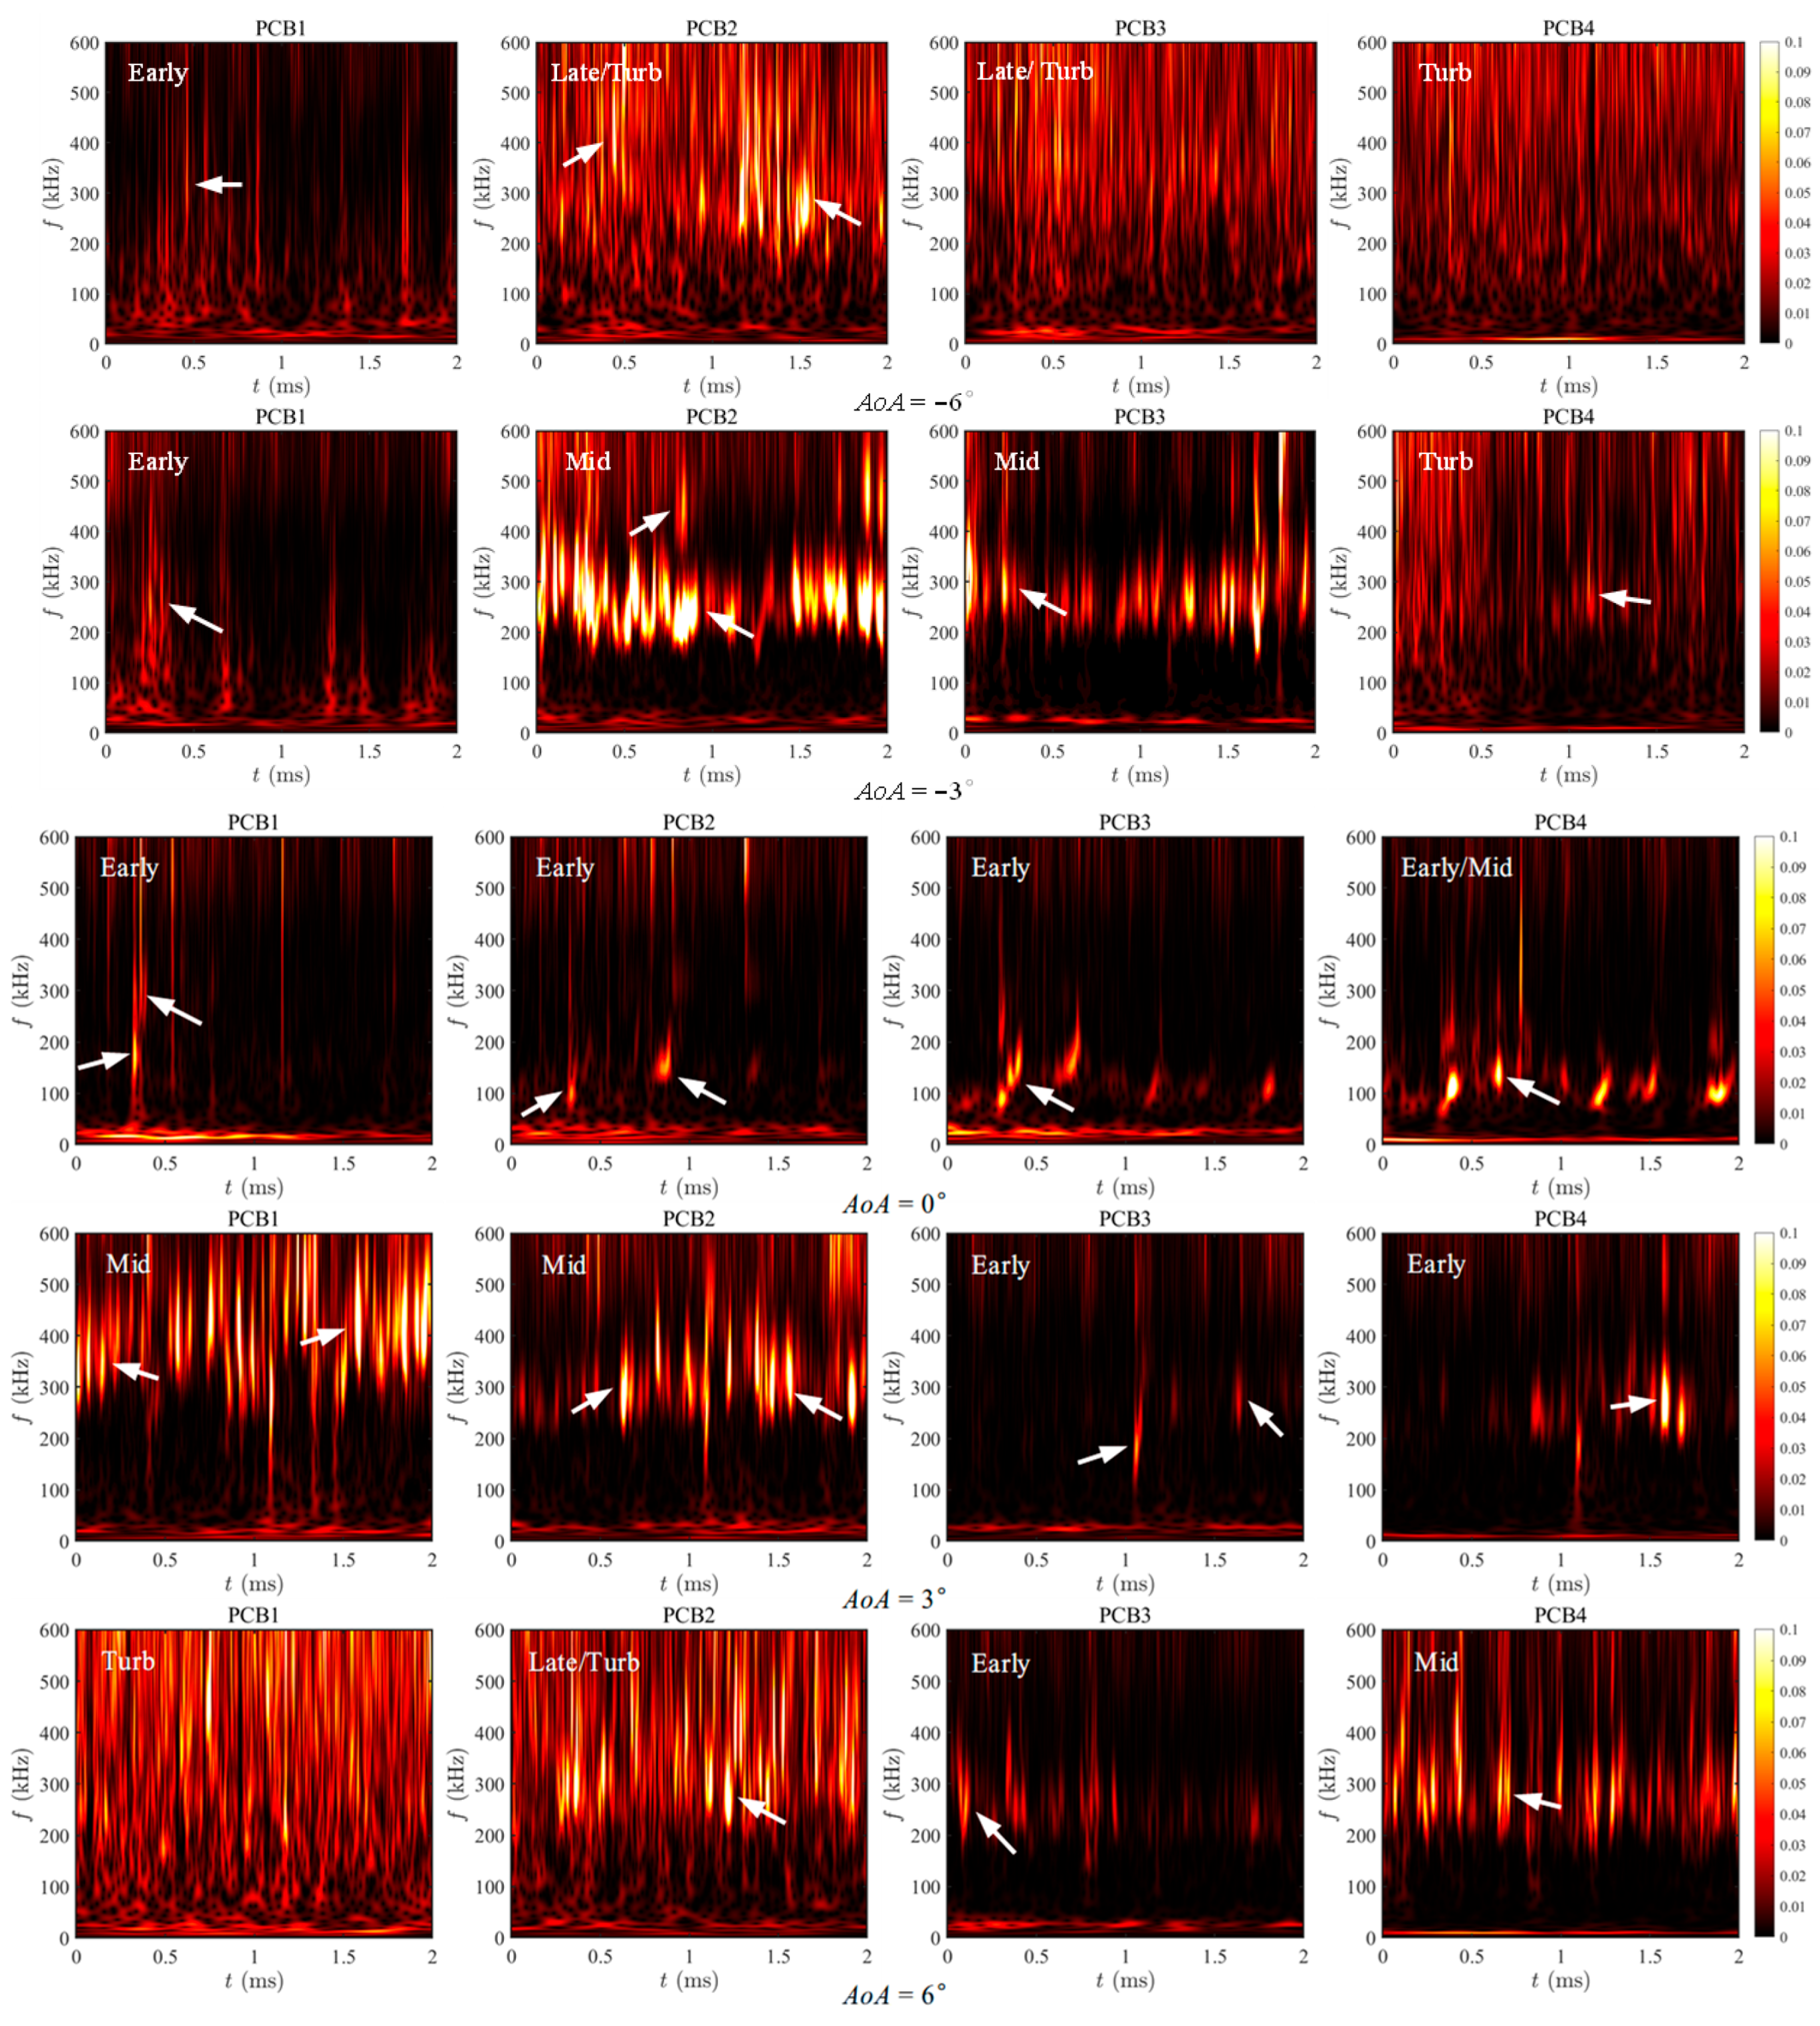
To further identify the temporal development characteristics of local disturbances and their instability evolution, time-frequency analysis was conducted at sensor locations on the flared cone surface using CWT.
Figure 13 presents the wavelet coefficient maps of pressure fluctuations at PCB1–PCB4 under different
AoA values (−6°, −3°, 0°, 3°, and 6°) at
Ma = 9.3 and
Re = 1.36 × 10
7/m, illustrating the effects of
AoA variations on local boundary layer instability. The results indicate noticeable differences in frequency distribution, duration, and local energy intensity across the various
AoA conditions.
At AoA = 0°, PCB1 exhibits two localized disturbance amplifications at approximately 180 kHz and 300 kHz, but the energy distribution is intermittent, indicating that the disturbance response aligns with the typical second-mode frequency range but remains in the early development stage. At PCB2, two localized high-energy regions appear in the 80–180 kHz band, centered around 100 kHz and 150 kHz, but no distinct streak structure is observed. The disturbance signals are isolated and discontinuous, consistent with the PSD results, suggesting that the disturbances are still in the early development phase. At PCB3, disturbances are distributed across the 90–200 kHz band, but localized amplifications are minimal, with signals appearing discontinuous and unsteady. The TSP results suggest that no dominant mode has emerged in this region. The flow is likely in the early transition stage. At PCB4, disturbance amplifications primarily occur in the 80–180 kHz band, with slightly higher amplitudes but a narrower frequency range. The energy distribution is temporally intermittent but relatively stable, indicating that this location may be in the mid-transition stage, as inferred from the TSP data.
At AoA = −3°, compared to the 0° condition, the overall disturbance amplitude increases. At PCB1, disturbance energy exhibits limited amplification, with isolated high-frequency signals observed in the 250–300 kHz band, displaying an intermittent temporal distribution. According to TSP measurements, this location is still in the early transition stage. At PCB2, disturbances intensify significantly, with multiple high-amplitude wave packets appearing in the 150–350 kHz band, along with isolated high-frequency responses around 450 kHz. The disturbances exhibit temporal persistence, indicating a mid-transition stage, as suggested by TSP data. At PCB3, the disturbance amplitude is slightly lower than at PCB2, with the dominant frequency concentrated around 280 kHz. Several distinct disturbance streaks are observed, exhibiting temporal continuity and localized high amplitudes. TSP results indicate that PCB3 is positioned at the junction between the SBLI boundary and the ITR transition front, suggesting that the location is in the mid-transition stage. At PCB4, the frequency band extends to 190–310 kHz, with multiple disturbance streaks exhibiting temporal continuity. The high-frequency component intensifies, resulting in a broad-spectrum, high-amplitude response. Based on TSP data, this location is likely approaching the turbulent stage.
At AoA = −6°, a brief disturbance amplification appears near 300 kHz at PCB1, with slightly extended duration compared to the −3° condition, but overall disturbance energy remains low, suggesting the early stage of transition development. At PCB2, disturbances are concentrated around 280 kHz, exhibiting extended duration, higher amplitude, and a relatively continuous frequency response, indicating that the region has likely entered the late transition stage or is approaching turbulence. At PCB3, disturbances span the 300–400 kHz band, with a broader bandwidth and increased energy levels, suggesting that the location is in the late transition or turbulent stage. At PCB4, the frequency response further broadens, with distinct, continuous streaks indicating turbulent characteristics, indicating a turbulent stage.
At AoA = 3°, on the windward side, PCB1 exhibits multiple high-frequency disturbance zones within the 260–600 kHz band, with notably elevated energy levels. The disturbance streaks display sustained temporal continuity, though with slight frequency shifts, suggesting that the second mode is dominant and the region is in the mid-transition stage. At PCB2, disturbances are concentrated within the 150–350 kHz band, with several distinct energy streaks visible in the wavelet map. The signals display temporal continuity but lack stability, indicating a similar mid-transition stage. At PCB3, disturbance intensity decreases, with isolated amplifications around 190 kHz and 290 kHz. The signals lack temporal continuity, and the PSD amplitude declines. TSP data indicate that PCB3 remains in the laminar region along the flared cone side surface, with minimal SBLI influence, suggesting an early transition stage. At PCB4, located downstream of PCB3, disturbances are concentrated near 260 kHz and 290 kHz, with localized energy streaks corresponding to PSD peaks, suggesting that the region is in the early transition stage.
At AoA = 6°, disturbance amplitudes increase further compared to the 3° condition. At PCB1, located on the windward side, the wavelet map exhibits a more uniform frequency distribution, with pronounced high-frequency responses and overall amplitude amplification, displaying typical turbulent characteristics. At PCB2, a sustained high-energy wave packet emerges around 300 kHz, with distinct high-frequency streaks and relatively stable amplitude. The overall response is characterized by a broad, high-amplitude, and nearly uniform distribution, suggesting that this region has likely entered the late transition stage or is approaching turbulence, as indicated by the TSP data. At PCB3, disturbance amplitudes remain relatively weak, with several continuous streaks appearing within the 150–400 kHz band. Although the signals exhibit some temporal continuity, localized energy remains low, indicating the early stage of transition. At PCB4, disturbance intensity further increases, forming a sustained high-frequency streak near 300 kHz with consistent frequency response and slightly elevated amplitude, indicating the mid-transition stage.
The wavelet analysis reveals distinct differences in disturbance response across sensor locations on the flared cone under varying AoA conditions, in terms of energy intensity, frequency distribution, and temporal continuity. At PCB1, located on BTR, disturbance energy gradually increases as AoA changes from negative to positive. Under positive AoA, high-frequency broadband structures emerge with a relatively continuous frequency distribution, with dominant frequencies aligning with the typical second-mode range. PCB2, positioned at the junction between the flared cone and the horizontal plane, is highly responsive to AoA variations. Strong disturbance responses are observed under both positive and negative AoA, with a broad frequency range and relatively sustained temporal distribution. The disturbance amplitude is generally higher than that under 0° conditions, indicating that this location is susceptible to high-frequency disturbances under various AoA conditions. PCB3 and PCB4, both located within the ITR on the flared cone, exhibit high-amplitude, broadband disturbance streaks under negative AoA, with pronounced intensity. Under positive AoA, disturbance energy decreases, the frequency response becomes more dispersed, and the overall response intensity diminishes.

