Abstract
The increasing demand on combustion-based micro-power generation systems, mainly due to the high energy density of hydrocarbon fuels, created a great opportunity to develop portable power devices, which can be applied on micro unmanned aerial vehicles, micro-satellite thrusters, or micro chemical reactors and sensors. Also, the need for better and cheaper communications networks and control systems has led space companies to invest in micro and meso satellites, such as CubeSat. In this study, we conducted a comprehensive and meticulous study of micro-combustion within wavy channel micro-propulsion systems, which can be applied on micro unmanned aerial vehicles or CubeSat. The primary objective was to gain a deeper comprehension of the dynamics within these complex non-linear geometries and analyze the effect of different materials on the combustion dynamics and propulsion efficiency.
1. Introduction
Progress in micro-fabrication has enabled the creation of Micro Propulsion Systems (MPSs), based on combined electrical and mechanical components for spacecraft applications, where compact power generation and precise thrust control are needed. Typically, these applications rely on batteries with limited energy capacity, so micro-combustion can be a viable alternative for MPSs due to the high energy density of hydrocarbon fuels [1,2]. Early investigations revealed fundamental challenges in maintaining stable flames at micro-scales, primarily due to substantial heat losses through chamber walls and insufficient residence times for complete combustion, as noted by Ju and Maruta [1], Nakamura et al. [3], Maruta et al. [2], and Resende et al. [4] (see also [5,6]).
Given the limitations of experimental approaches, numerical simulations have been crucial for understanding micro-combustion dynamics. Initial computational studies systematically examined critical parameters including wall thermal conductivity and thickness effects [7,8], channel reactor designs [9], boundary condition variations [10], and catalytic flame stabilization techniques [11,12]. The work of Pizza et al. [11] on premixed lean H2/air combustion identified five distinct flame regimes, while their subsequent 3D simulations [13] revealed complex combustion modes dependent on tube diameter and flow velocity.
Further studies analyzed FREI with different fuels. Nakamura et al. [14], Tsuboi et al. [15], and Miyata et al. [16] studied /air mixtures using 1D models validated against experiments and direct numerical simulations to assess boundary conditions like inlet and wall temperatures. Yamamoto et al. [17] examined n-heptane-air combustion, confirming FREI through numerical and experimental approaches. Alipoor et al. [18] extended Pizza et al.’s [11] work on /air mixtures, exploring a broad range of inlet velocities, equivalence ratios, and channel widths. They found increased FREI amplitude with higher velocities, equivalence ratios, and channel widths, with frequency responses varying: velocity increases led to a descending–ascending FREI frequency pattern, higher equivalence ratios with decreased frequency, and narrower channels with increased frequency.
Recent research has focused on burner geometry effects. Abbaspour and Alipoor [19] studied converging–diverging micro-tubes with heated walls using hydrogen/air mixtures, Li et al. [20] explored micro-combustors with cavities and /air fuel, and Zuo et al. [21,22,23] investigated ribbed, thin-walled, and elliptical micro-combustors. Chabane et al. [24] analyzed catalytic combustion in non-planar channels with cavities or obstacles and segmented Pt-coatings. Minaev [25] and Biswas [26] offer comparisons of theoretical, numerical, and experimental work.
Studies on wavy wall geometries in micro-combustion remain limited. Mansouri [27] pioneered wavy micro-channels in Micro-Thermo-Photovoltaic systems, using 2D simulations of /air combustion at 1 m/s and to study flame behavior under varying wave designs. Mansouri [28] optimized these parameters, achieving 8.3% higher efficiency than flat burners and advocating for undulating designs. Han et al. [29] explored ammonia/hydrogen mixtures in wavy combustors, noting reduced NOx emissions and better temperature uniformity at velocities above 12 m/s for smooth arc designs. Resende et al. [30] studied hydrogen/air combustion in wave-shaped combustors, highlighting vortex-enhanced heat loss reduction. Cai et al. [31] showed that periodic wall structures in hydrogen/ammonia micro-combustors reduce emissions by 12.3% and increase exergy efficiency by 11.8%. Zhao et al. [32] found that ammonia/hydrogen-fueled micro-combustors with oval-shaped internal threads achieve optimal wall temperature at , with higher hydrogen blending increasing NO emissions. Cai et al. [33] demonstrated that modified geometric structures in hydrogen/ammonia micro-combustors improve mean outer wall temperature by up to 6.6%, temperature uniformity by 50.5%, and radiation efficiency by 17.7% compared to cylindrical designs. However, these studies have not fully explored the coupled effects of wave geometry and material properties on micro-propulsion systems and thruster-specific performance metrics across different flame regime dynamics.
This numerical investigation focuses specifically on micro-propulsion applications, analyzing /air combustion dynamics in wave-shaped micro-propulsion thrusters across operational velocities (4–12 m/s). Building upon previous thruster studies while addressing identified gaps in wavy-wall characterization, we examine how geometric and material parameters influence key propulsion metrics including specific impulse. The governing equations are detailed in the Section 2, the computational domain is described in the Section 3, results are discussed in the Section 4, and key findings are summarized in the Section 5.
2. Methodology
2.1. Governing Equations
The governing equations used in the numerical simulations are now presented. An in-depth examination of the fundamental equations that govern the dynamics of both gas-phase and gas–solid-phase combustion phenomena (the latter are the scenarios characterized by the presence of a physical enclosure encompassing the combustor) will be presented.
2.1.1. Gas-Phase Equations
For the gas-phase equations, we consider a continuous, compressible, multi-component, and thermally perfect gas mixture for laminar flows (assuming Newtonian fluids), governed by the continuity equation, the momentum balance (assuming gravity is the only external force), the conservation of species mass fractions, and the energy equation.
Here t, , P, , , and g stand for time, density of the mixture, pressure, velocity vector of the mixture, stress tensor of the fluid, and acceleration vector due to gravity, respectively. is the total number of species, T is the temperature, and , , , , and are the mass fraction, diffusion rate, formation rate, enthalpy, and net production rate of species, respectively. represents the specific heat coefficients. The gas mixture is assumed to be an ideal gas, and its density is calculated using the equation of state. The heat flux vector, , is defined as:
where is the mixture thermal conductivity and is the radiative heat transfer.
The species diffusion velocities, k, are calculated from Fick’s law and the thermal diffusion effect:
where , , and are the mole fraction, the thermal diffusion, and the mixture-averaged diffusion coefficient of species k. is related to the binary diffusion coefficients through the following expression:
To ensure mass conversation, the approach introduced by Coffee and Heimerl [34] is adopted. This method involves substituting the velocity term in Equations (3) and (4) with a corrective diffusion velocity, denoted as . The corrective diffusion velocity is precisely defined as follows:
where is a constant correction factor, which is independent of the species but can vary spatially and temporally, used in order to satisfy mass conservation. The calculation of this correction factor is performed using the following equation:
The radiative heat transfer is modeled by assuming the optically thin radiation hypothesis, in which self-absorption of radiation is neglected. The radiative heat transfer contribution in the energy equation is described as:
where is the ambient temperature, is the Stefan–Boltzmann constant, and is the Planck mean absorption coefficient. is defined as follows:
where represents the partial pressure of species k. The extinction coefficient for species k is estimated using the RADCAL toolbox, as detailed in [35].
2.1.2. Gas–Solid-Phase Equations
When using Conjugate Heat Transfer (CHT), it is necessary to solve both the governing equations for the fluid and solid domains. For the fluid domain, the equation is the same as the one presented in Equation (4), and for the solid domain, the energy equation is represented by:
where is the density of the solid , is the specific heat of the solid , is the temperature of the solid , is the heat source inside the solid , is the thermal conductivity of the solid , and t is time .
2.2. Numerical Model
The equations shown in Section 2.1.1 are implemented in the laminarSMOKE numerical framework (that is shown in Figure 1a), which was originally developed by Cuoci et al. [36]. Notably, laminarSMOKE originated from the pisoFOAM solver, which deals with unsteady, compressible, non-reacting flows, is part of the standard OpenFOAM solver collection, and was modified to include kinetic mechanisms. A detailed kinetic mechanism consisting of 32 species and 173 reactions is used in this work to account for the chemical reaction pathways of premixed hydrogen combustion [37]. This mechanism was developed and validated by the CRECK Modelling Group at the Polytechnic University of Milan (see Ranzi et al. [37]).
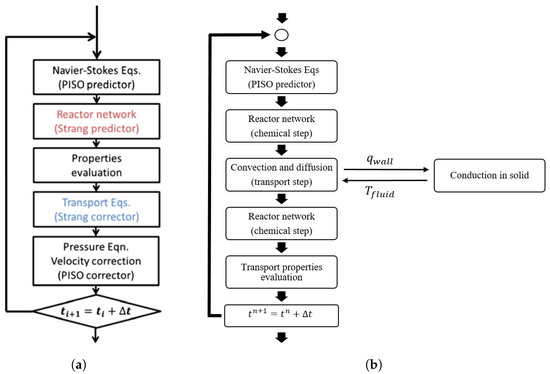
Figure 1.
Algorithm used for the numerical solution of the system of governing equations: (a) without CHT and (b) with CHT. The algorithm was adapted from Cuoci et al. [36].
In order to incorporate the heat transfer of the solid wall, to simulate finite wall micro-chambers of different materials, it is necessary to solve the energy equations concurrently for both the solid and gas phases, a term named solving the Conjugate Heat Transfer problem. The solver is called chtlaminarSMOKE, and the numerical framework is shown in Figure 1b.
The CHT solver employs a Coupled Approach that uses the imposition of heat flux acquired on the fluid side of the interface upon the solid domain, along with the transmission of temperature distribution from the solid side to the fluid domain [38], named the Flux Forward Temperature Back (FFTB) algorithm for managing the interactions between the solid and fluid domains. This algorithm was chosen due to the nature of the cases investigated in this work, which involved situations where (the ratio of conductive resistance to convective resistance on the flow boundary surface ).
To address transient forced convection, the fluid region was solved using the laminar Navier–Stokes equations, while the solid region was solved using the Laplace equations, according to [39]. Additionally, it is crucial to ensure the continuity of temperature and heat flux at the common interface, as represented by Equations (13) and (14). To achieve this, FFTB loops are performed until the temperature and heat flux differences at the common interfaces of the two domains fall below the desired numerical error. And once convergence is attained:
The mathematical and physical models implemented in the laminarSMOKE were validated in previous studies [40,41,42] at the micro-scale, and the results were able to capture the reaction pathways with good accuracy. An earlier version of chtlaminarSMOKE was also validated in [43].
2.3. Micro-Propulsion System
Dias et al. [44] provided a comprehensive review of the advancements in micro-combustion flame dynamics and micro-propulsion systems (MPSs), emphasizing the various challenges associated with micro-combustion and micro-propulsion, their performance metrics, traditional manufacturing techniques, and developments in Micro-Electro-Mechanical Systems manufacturing.
MPS performance is often evaluated within the context of optimal rocket design and development. It is essential to recognize that these conditions depend on a series of assumptions that may not accurately reflect the realities of MPS. One such assumption is the disregard of frictional forces [45]. Therefore, a prudent approach is necessary when implementing these idealized models in micro-propulsion contexts. Consequently, the equations provided above (with indices corresponding to those illustrated in Figure 2) elucidate the optimal performance of micro-propulsion systems. In evaluating thruster performance, two principal outcomes warrant attention: specific impulse and thrust. These equations provide significant insights into the performance characteristics of micro-propulsion devices.
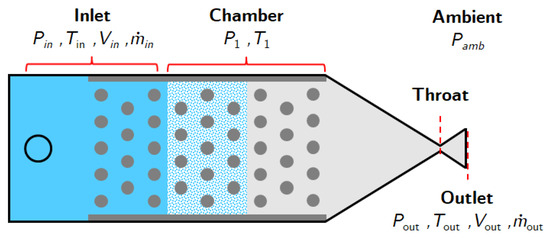
Figure 2.
Diagram of an MPS showing the variables and their indices (adapted from [46]).
2.3.1. Thrust and Specific Impulse
In aircraft, thrust is normally explained through the application of Newton’s third law of action and reaction. A gas, or working fluid, is accelerated by the engine, and the reaction to this acceleration produces a force on the engine. The general derivation of the thrust equation shows that the amount of thrust generated depends on the mass flow rate through the engine and the gas exit velocity [47].
According to Newton’s second law, force is defined as the rate of change in momentum of an object over time. Momentum is the product of an object’s mass and its velocity. The thrust equation for a gas is expressed as:
where and are the mass flow rates at the inlet and outlet of the propulsion system, and are the respective average fluid velocities at the inlet and outlet of the propulsion system, and are the inlet and outlet pressures, and is the area of the outlet section.
In several situations, the outlet and intake pressures of the propulsion system are equivalent to atmospheric pressure. In this instance, the expression equals zero, allowing the equation to be reduced as:
The mass flow rate at the exit is equivalent to the combination of the mass flow rate at the inlet and the mass flow rate of fuel. Based on the fuel-to-air equivalence ratio, , the following relationship can be obtained:
A new variable called specific impulse is introduced, which allows the quantification of efficiency in relation to propellant consumption.
where the constant represents the gravitational acceleration on Earth at sea level. Although articulated in seconds, it does not signify a temporal measurement; instead, it represents the thrust per unit weight of propellant. To optimize propellant consumption efficiency, this value must be maximized.
Under the assumption of constant velocity and pressure at both the exit and inlet, Equation (20) can be simplified. By performing algebraic manipulations and utilizing Equation (19), we derive Equation (21), in which depends exclusively on the engine’s velocity difference.
The introduction of this new variable offers numerous benefits in the analysis of propulsion systems. Firstly, a particular impulse serves as a measure of the mechanism’s efficiency. Distinct engines will invariably have varying specific impulse values. An engine with a greater specific impulse will exhibit enhanced efficiency, as it generates increased thrust for equivalent airflow. Secondly, because of its particular nature, the inlet mass flow rate can be excluded from all intermediate computations, significantly streamlining the mathematical process. Thirdly, it is a variable that enhances the design of the propulsion system.
2.3.2. Thrust Key Indicators
Modern propulsion systems often incorporate many components, including turbines, compressors, and combustion chambers. Typically, many compressors are utilized in succession to incrementally elevate the air pressure. Subsequently, the combustion chamber enables the reaction between fuel and air, followed by the placement of a turbine prior to the exit section of the propulsor. Propulsion is accomplished by the difference between inlet and output velocities, producing the requisite thrust force.
Two pertinent indicators in the field of propulsion processes arise, although they are not discussed in this study. The primary indicator is the Engine Pressure Ratio (EPR), which is defined as the ratio of the total pressure across the engine. As previously elucidated, contemporary engines comprise multiple components, and in this instance, the EPR is derived from the product of pressure ratios across all propulsion system elements. Therefore, the EPR can be streamlined and computed as follows:
The second indicator is the Engine Temperature Ratio (ETR), which, similar to the previous indicator, denotes the ratio of the total temperature across different engine components. Analogous to the prior instance, due to the intricacy of contemporary engines, the ETR is derived from the product of temperature ratios among the engine’s components. Therefore, the ETR is determined using the subsequent equation:
3. Computational Domain
3.1. Geometry and Case Introduction
In this study, we conduct simulations of premixed /air combustion within an undulating symmetric micro-channel burner. The burner has a length of and a height ranging from to at its center. At the inlet and outlet, the height is maintained at for a length of , as depicted in Figure 3a. For more detailed information, readers are referred to Resende et al. [30]. Furthermore, in this study, we consider the inclusion of solid materials in the micro-combustor walls. These walls consist of two finite layers with a thickness of , positioned at the top and bottom, as depicted in Figure 3b.
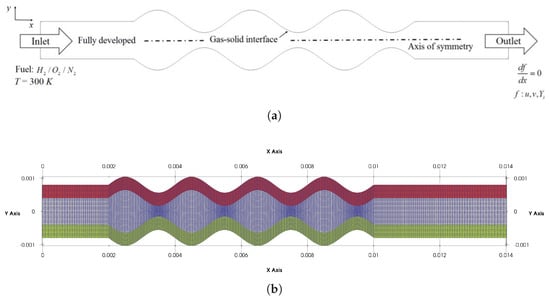
Figure 3.
Schematic illustration of the computational domain (a) and mesh resolution of gas–solid-phase modeling (fluidRegion mesh in blue, solidRegion1 mesh in red, and solidRegion2 in green) (b).
In the simulations, uniform conditions are maintained for the equivalence ratio and inlet temperature, set at (for adiabatic conditions also for ), and , respectively, both under atmospheric pressure. However, the inlet velocities, denoted as , are varied within the range of 4 to 12 m/s. The reaction composition of the /air mixture corresponding to is described by Equation (24):
Given that the surrounding temperatures were prescribed at , the conjugate heat transfer implicates the dissipation of thermal energy to the exterior through the boundaries of the burner. The outward heat flux was formulated by integrating both convective and radiative components:
where represents the heat flux, which is the amount of heat energy transferred per unit time and per unit area, is the convective heat transfer coefficient, a measure of how effectively heat is transferred through convection between the object and its surrounding medium, T and are the temperatures of the object and the surrounding walls, respectively, and and are the Stefan–Boltzmann constant and the emissivity of the object. Additionally, the heat flux is given by the temperature gradient equation:
where represents the temperature gradient and the thermal conductivity of the object (combustor walls). The other boundary conditions are given in the schematic shown in Figure 3a, and for a more detailed description of boundary conditions, readers are referred to Dias et al. [48].
Grid and Numerical Stability
In this analysis, based on the finite volume method, a mesh resolution of 10,836 cells was employed throughout the micro-channel for the fluidRegion, with equidistant spacing at the center, as described in Table 1. This resulted in finer resolution in smaller areas, where the smallest cells had dimensions of 25 by 9 , a resolution that is similar to the mesh resolution of Alipoor and Mazaheri [49]. It has also been previously employed in related studies; notably, Resende et al. [41,42] utilized this mesh resolution to investigate the impact of dilution on and air mixtures in a micro-channel. Their findings demonstrated the ability of this mesh resolution to accurately capture the intricate physics involved in the system. The meshes used to represent the solid walls contained a total 5740 cells each, with a similar resolution to the one used in the fluidRegion and with a similar resolution used in the CHT code validation studies [40,41,42,43].

Table 1.
Employed mesh specifications for the computational regions.
Additionally, it is crucial to ensure numerical stability and temporal accuracy in each computational cell. To achieve this, the Courant number () must always be maintained at a value below 0.5. The Courant number is defined as follows:
where represents the ratio between the time step, represents the magnitude of velocity, and the cell size in the direction of the velocity. To maintain throughout the simulation, we opted to choose to follow the common practice of selecting based on the worst-case scenario, considering the combined effect of the highest flow velocity and the smallest cell size.
3.2. Material Properties
In this study, we examined flame dynamics across a set of ten distinct structural materials, categorized into four groups: Steels, Ceramics, Thermal Conductors, and Amorphous materials. The selection of these materials was made based on their relevance and widespread application within aerospace contexts. Table 2 presents a comprehensive overview of the chosen materials, along with their key heat transfer properties, including thermal conductivity (), density (), specific heat capacity (), thermal diffusivity (), and emissivity ().

Table 2.
Chosen materials for this study and their key heat transfer properties.
As shown in the table, we decided to adopt , the thermal diffusivity, as a key indicator of the material’s thermal characteristics when assessing the performance of an MPS. It basically represents the ability of the material to conduct heat relative to its heat storage capacity per unit volume. A higher implies more efficient heat conduction and faster heat transfer compared to heat retention within the material. Can be calculated using the other shown key material properties, as indicated by Equation (28).
For each material, a series of five simulations were performed, varying the inlet speed, , at five different values: . In Table 3, these simulations are presented along with their corresponding velocities used.

Table 3.
Series of simulations performed utilizing the spark initial condition.
Among the Steels category, two types of stainless steel were chosen for studying: AISI 310, which has a higher carbon percentage, and AISI 430. The Ceramics group comprises two distinct materials: High Temperature Co-fired Ceramic (HTCC) and Low Temperature Co-fired Ceramic. For the Thermal Conductors category, materials that conduct heat exceptionally well, three materials were selected: pure Silicon, an aluminium alloy, and a copper–tungsten alloy. Finally, two amorphous materials, Borosilicate glass and fused silica glass, were studied in detail.
Furthermore, a comparative analysis was performed with an adiabatic material, allowing us to better understand the specific properties and behavior of each material in relation to this reference point. The research methodology involved simulations to study various properties of these solid materials.
4. Results and Discussion
4.1. Overall Flame Dynamics
In this section, we explore the dynamics of flames in a chamber with wavy geometry fueled by a premixed /air mixture. We examine the impact of different inlet velocities on flame behavior, temperature distribution, and heat release rates through numerical analysis. A thorough and comprehensive analysis for the principal types of flame dynamics has already been conducted extensively by Resende et al. [30] and Dias et al. [48,60] regarding the effect of heat loss and wall conduction on combustion dynamics and flow within the micro-channel. Here, we will focus our overview analysis by addressing the stability maps for the combustion in the wavy geometry and exploring global combustion performance within the used materials. The stability map for the performed simulations as a function of the thermal diffusivity of the material, , is presented in Figure 4.
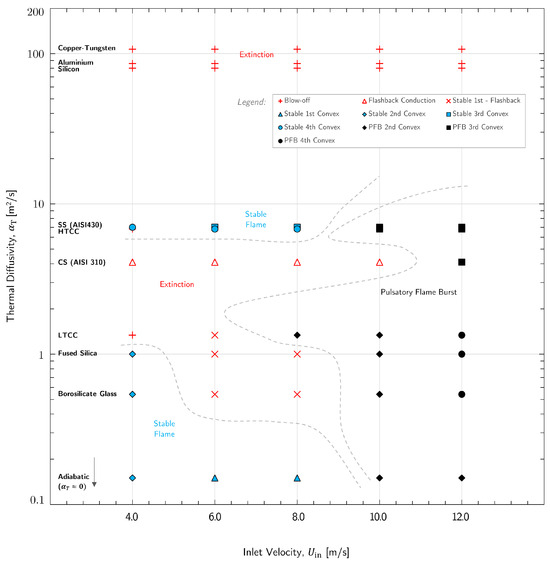
Figure 4.
Stability map for the performed simulations as a function of the thermal diffusivity of the material (updated from Dias et al. [48]).
As observed in Figure 4, when heat diffusivity/conductivity values are high, the issues of blow-off and flashback become more pronounced. For the adiabatic material, we can observe that for the simulations for low flow rates, the combustion could achieve stable flames, while for higher inlet velocities, the flame presented Pulsatory Flame Burst (PFB) dynamics. This phenomenon, known as Pulsatory Flame Burst (PFB), is a specific flame behavior characterized by burst-like flame pulsation due to flow and combustion interactions [30,48,60] and can be described by different stages as the ignition, propagation, bifurcation (splitting), and extinction of the flame in a cyclic manner. Unlike FREI, where the flame extinguishes upstream, in PFB, a new flame emerges before the current one extinguishes. This prevents complete extinction, marking a significant difference. For adiabatic material and as the inlet velocity increases, the heat release rate transmitted through the vortices decreases, with a decrease in the pulsatory burst frequency and an increase in the maximum value of the heat release rate.
For non-adiabatic materials, and as observed in Figure 4, it becomes apparent that for low conductive materials, the simulations result in flame dynamic transition from stable to Pulsatory Flame Burst when flow rate increases, while when heat conductivity values are high, the issues of blow-off and flashback become more pronounced. Additionally, we noted that in the case of CS, despite its lower thermal diffusivity compared to HTCC and SS, the higher solid temperatures observed within the combustor favor backward extinction. This causes a significant backwards flow of energy to the convex zones of the micro-combustor and the flame front, leading to reignition and causing the flame front to move in an upflow direction within the micro-channel (flashback).
To relate global combustion performance within the used materials, we further analyzed the results on three variables: the total heat release rate (average and maximum) within the micro-channel, denoted as , the maximum temperature within the micro-channel, denoted as , and the maximum wall temperature, denoted as .
Figure 5 illustrates the variations in maximum temperature within both the fluid (represented by the dotted lines and transparent colors) and solid phases (represented by solid lines and non-transparent colors) across different materials and velocities. It is essential to recognize the inherent complexity of the dynamics in this context, making it challenging to attribute changes solely to a single variable. As demonstrated earlier, the use of varying velocities and thermal diffusivities introduces a multitude of alterations, contributing to this complexity. Nonetheless, it is apparent that while temperatures generally exhibit a decrease as we introduce more heat loss into the system, the alterations in maximum values are not notably significant.
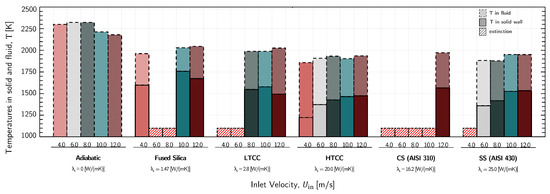
Figure 5.
Temperatures in the solid and fluid domain for the different materials and simulations.
Figure 6 depicts the variations in the total heat release rate for the different simulations conducted. It is well understood that regions with vortices induced by velocity play a pivotal role in facilitating the backflow of energy, where energy moves upstream, ultimately triggering the ignition of new flames, which is why the values increase with . What becomes evident here is that as we introduce heat conduction in the walls, we observe a corresponding increase in the heat flux due to conduction in the solid, especially in materials with higher thermal conductivity. Consequently, this amplifies the back propagation of energy, resulting in faster ignitions, greater consumption of , and consequently higher heat release rates from combustion.
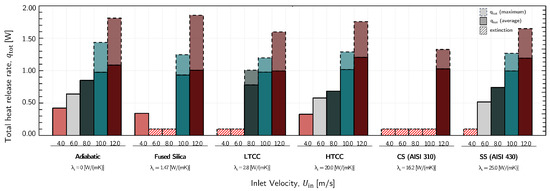
Figure 6.
Maximum and average heat release rate for the different materials and simulations.
As for most materials, we saw that higher thermal difusivities led to lower temperatures overall, both on the fluid and solid, due to more heat being lost. On the other hand, it is important to recognize the significance of regions with vortices induced by velocity, as they play a pivotal role in enabling the retrograde flow of energy, where energy moves upstream, subsequently initiating the ignition of new flames. When we introduce heat conduction into the walls, we observe that as the conductivity increases, the heat flux due to conduction in the solid becomes more pronounced. This is accompanied by an increase in heat release rates because more is able to be consumed. Consequently, we observed a reduction in the amplitude of both temperature and heat release rate signals. This reduction is attributed to the faster unfolding of cycles, resulting in higher overall combustion intensity within the same time frame.
4.2. Micro-Propulsion Indicators
One of the most efficient ways to measure and analyze propulsion capability is by using the specific impulse indicator, . This indicator, as previously demonstrated in Equation (20), is calculated as the ratio of the total impulse (the integral of the momentum force, ) to the total mass of propellant consumed (the integral of mass flow rate, ). By dividing these two quantities and multiplying by , we are essentially comparing the momentum produced by the engine to the mass of propellant it uses while adjusting for the gravity on Earth.
In simpler terms, we are assessing the efficiency of the micro-propulsion system in converting its propellants into thrust. Consequently, higher values of indicate greater efficiency for the MPS. This means that it can generate more thrust using a given amount of propellant (or can sustain operation for a longer duration with the same quantity of propellant).
To obtain the values of for each simulation, we utilized the simplified equation show in Section 2.3.1 (Equation (21)). Knowing that for all simulations and that is known, we only need to determine the average velocity (or mean velocity) at the system’s outlet, denoted as . Mathematically, this value is described by:
defined by the integral of the magnitude of the velocity vector profile over the entire cross-sectional area () at the outlet, divided by the cross-sectional outlet area. Initially, we performed the integration of across the cross-sectional outlet area; subsequently, we divided this result by the micro-channel outlet area, which, in this case, measures . This yielded the mean velocity at the outlet, denoted as . Finally, by employing Equation (21), we calculated the specific impulse.
In Figure 7 we show the outcomes obtained for all simulations conducted with various materials, and we include the results from Macedo [61] for adiabatic simulations using , and .
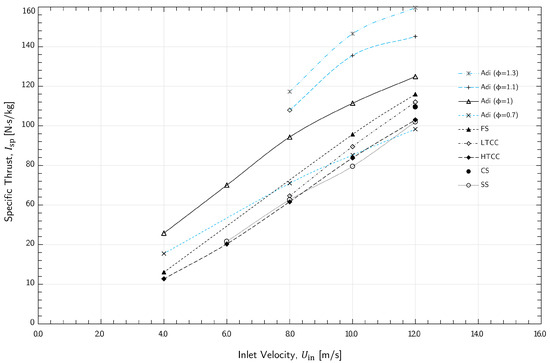
Figure 7.
Specific thrust versus the inlet velocity for different materials.
In general, it is readily apparent that there is a clear influence of the inlet velocity on specific impulses. First, we observe that for the same material (blue lines), it is advantageous from a specific impulse standpoint to increase the equivalence ratio. This is because, if achievable, it results in significant enhancements of these values, as can be seen in the case of the adiabatic material, due to an increase in fuel flow rate. In the context of different materials, we observe a decreasing trend in the values as we increase the thermal diffusivity of the material. This illustrates that heat loss has a direct impact on the propulsion capabilities of the micro-channel, with materials capable of retaining more thermal energy resulting in higher specific impulses. Nevertheless, it is important to note that velocity remains the variable with the most direct influence on the outcomes.
In Figure 8, we depict the outcomes obtained from simulations conducted with various materials using now a bar graph. Additionally, in Figure 9, we showcase the results for the adiabatic regime but with different equivalence ratios. This extends the investigation initiated by Macedo [61] and includes results for . Since we also include the maximum values, we are able to see that the Pulsatory Flame Burst phenomenon leads to significantly higher specific impulse values, and as the inlet velocity increases, the gap between average and maximum values widens. This demonstrates that the oscillatory nature of the PFB is highly advantageous for its applicability in micro-propulsion systems. Another noteworthy observation is that for the majority of materials, there is a significant decrease in the maximum values of specific impulse as we increase the thermal conductivity/diffusivity, which can be undesirable in terms of efficiency and overall performance.
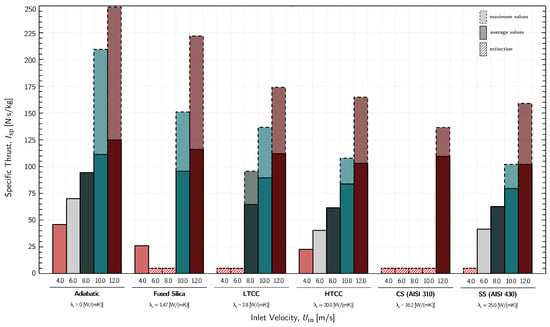
Figure 8.
Average and maximum values of the specific thrust for different materials and simulations.
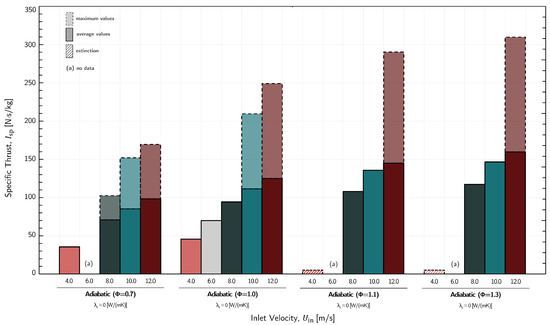
Figure 9.
Average and maximum values of the specific thrust for adiabatic materials using different equivalency ratios.
5. Conclusions
We conducted measurements and a thorough analysis of the propulsion performance of each micro-channel constructed from various materials. To evaluate this performance, we employed the specific impulse metric, with higher values indicating more efficient propellant consumption. Our observations revealed that both velocity and the equivalence ratio play crucial roles in increasing these specific impulse values. Additionally, materials with greater thermal dissipation exhibited a decrease in specific impulse values, particularly evident in the maximum values, which is detrimental in terms of overall efficiency and performance. We also observed that achieving a stable flame or an unsteady PFB is relatively easy for most velocities when working with materials possessing a low conductivity value. Therefore, these materials hold particular significance for MPS prototypes, as they exhibit the highest likelihood of sustaining a flame and delivering superior propulsion performance.
Author Contributions
Conceptualization, D.M.D., P.R.R., and A.M.A.; methodology, D.M.D., P.R.R., and A.M.A.; software, D.M.D., P.R.R., and A.M.A.; validation, D.M.D., P.R.R., and A.M.A.; formal analysis, D.M.D., P.R.R., and A.M.A.; investigation, D.M.D., P.R.R., and A.M.A.; resources, D.M.D., P.R.R., and A.M.A.; data curation, D.M.D., P.R.R., and A.M.A.; writing—original draft preparation, D.M.D., P.R.R., and A.M.A.; writing—review and editing, D.M.D., P.R.R., and A.M.A.; visualization, D.M.D., P.R.R., and A.M.A.; supervision, D.M.D., P.R.R., and A.M.A.; project administration, D.M.D., P.R.R., and A.M.A. All authors have read and agreed to the published version of the manuscript.
Funding
This research received no external funding.
Institutional Review Board Statement
Not applicable.
Informed Consent Statement
Not applicable.
Data Availability Statement
Dataset available on request from the authors.
Acknowledgments
David M. Dias acknowledges the funding by FCT under project No. MCTES/UIDB/00532/2020 (CEFT). P.R. Resende acknowledges the funding by FAPESP through Project No. 2015/26842-3. A. M. Afonso acknowledges FCT - Fundação para a Ciência e a Tecnologia for financial support through LA/P/0045/2020 (ALiCE), UIDB/00532/2020 and UIDP/00532/2020 (CEFT), funded by national funds through FCT/MCTES (PIDDAC).
Conflicts of Interest
The authors declare no conflicts of interest.
References
- Ju, Y.; Maruta, K. Microscale combustion: Technology development and fundamental research. Prog. Energy Combust. Sci. 2011, 37, 669–715. [Google Scholar] [CrossRef]
- Maruta, K.; Kataoka, T.; Kim, N.; Minaev, S.; Fursenko, R. Characteristics of combustion in a narrow channel with a temperature gradient. Proc. Combust. Inst. 2005, 30, 2429–2436. [Google Scholar] [CrossRef]
- Nakamura, Y.; Gao, J.; Matsuoka, T. Progress in small-scale combustion. J. Therm. Sci. Technol. 2017, 12, JTST0001. [Google Scholar] [CrossRef][Green Version]
- Resende, P.R.; Ayoobi, M.; Afonso, A.M. Numerical Investigations of Micro-Scale Diffusion Combustion: A Brief Review. Appl. Sci. 2019, 9, 3356. [Google Scholar] [CrossRef]
- Zamaschcikov, V. An Investigation of Gas Combustion in a Narrow Tube. Combust. Sci. Technol. 2001, 166, 1–14. [Google Scholar] [CrossRef]
- Xu, B.; Ju, Y. Experimental study of spinning combustion in a mesoscale divergent channel. Proc. Combust. Inst. 2007, 31, 3285–3292. [Google Scholar] [CrossRef]
- Norton, D.G.; Vlachos, D.G. Combustion characteristics and flame stability at the microscale: A CFD study of premixed methane/air mixtures. Chem. Eng. Sci. 2003, 58, 4871–4882. [Google Scholar] [CrossRef]
- Norton, D.G.; Vlachos, D.G. A CFD study of propane/air microflame stability. Combust. Flame 2004, 138, 97–107. [Google Scholar] [CrossRef]
- Federici, J.A.; Wetzel, E.D.; Geil, B.R.; Vlachos, D.G. Single channel and heat recirculation catalytic microburners: An experimental and computational fluid dynamics study. Proc. Combust. Inst. 2009, 32, 3011–3018. [Google Scholar] [CrossRef]
- Li, J.; Chou, S.K.; Li, Z.W.; Yang, W.M. A comparative study of H2-air premixed flame in micro combustors with different physical and boundary conditions. Combust. Theory Model. 2008, 12, 325–347. [Google Scholar] [CrossRef]
- Pizza, G.; Frouzakis, C.E.; Mantzaras, J.; Tomboulides, A.G.; Boulouchos, K. Dynamics of premixed hydrogen/air flames in microchannels. Combust. Flame 2008, 152, 433–450. [Google Scholar] [CrossRef]
- Li, J.; Chou, S.K.; Yang, W.M.; Li, Z.W. A numerical study on premixed micro-combustion of CH4-air mixture: Effects of combustor size, geometry and boundary conditions on flame temperature. Chem. Eng. J. 2009, 150, 213–222. [Google Scholar] [CrossRef]
- Pizza, G.; Frouzakis, C.E.; Mantzaras, J.; Tomboulides, A.G.; Boulouchos, K. Three-dimensional simulations of premixed hydrogen/air flames in microtubes. J. Fluid Mech. 2010, 658, 463–491. [Google Scholar] [CrossRef]
- Nakamura, H.; Fan, A.; Minaev, S.; Sereshchenko, E.; Fursenko, R.; Tsuboi, Y.; Maruta, K. Bifurcations and negative propagation speeds of methane/air premixed flames with repetitive extinction and ignition in a heated microchannel. Combust. Flame 2012, 159, 1631–1643. [Google Scholar] [CrossRef]
- Tsuboi, Y.; Yokomori, T.; Maruta, K. Lower limit of weak flame in a heated channel. Proc. Combust. Inst. 2009, 32, 3075–3081. [Google Scholar] [CrossRef]
- Miyata, E.; Fukushima, N.; Naka, Y.; Shimura, M.; Tanahashi, M.; Miyauchi, T. Direct numerical simulation of micro combustion in a narrow circular channel with a detailed kinetic mechanism. Proc. Combust. Inst. 2015, 35, 3421–3427. [Google Scholar] [CrossRef]
- Yamamoto, A.; Oshibe, H.; Nakamura, H.; Tezuka, T.; Hasegawa, S.; Maruta, K. Stabilized three-stage oxidation of gaseous n-heptane/air mixture in a micro flow reactor with a controlled temperature profile. Proc. Combust. Inst. 2011, 33, 3259–3266. [Google Scholar] [CrossRef]
- Alipoor, A.; Mazaheri, K. Combustion characteristics and flame bifurcation in repetitive extinction-ignition dynamics for premixed hydrogen-air combustion in a heated micro channel. Energy 2016, 109, 650–663. [Google Scholar] [CrossRef]
- Abbaspour, P.; Alipoor, A. Numerical study of combustion characteristics and oscillating behaviors of hydrogen–air combustion in converging–diverging microtubes. Int. J. Heat Mass Transf. 2020, 159, 120127. [Google Scholar] [CrossRef]
- Li, L.; Yang, W.; Fan, A. Effect of the cavity aft ramp angle on combustion efficiency of lean hydrogen/air flames in a micro cavity-combustor. Int. J. Hydrogen Energy 2019, 44, 5623–5632. [Google Scholar] [CrossRef]
- Zuo, W.; E, J.; Peng, Q.; Zhao, X.; Zhang, Z. Numerical investigations on thermal performance of a micro-cylindrical combustor with gradually reduced wall thickness. Appl. Therm. Eng. 2017, 113, 1011–1020. [Google Scholar] [CrossRef]
- Zuo, W.; Zhang, Y.; Li, J.; Li, Q.; He, Z. A modified micro reactor fueled with hydrogen for reducing entropy generation. Int. J. Hydrogen Energy 2019, 44, 27984–27994. [Google Scholar] [CrossRef]
- Zuo, W.; E, J.; Hu, W.; Jin, Y.; Han, D. Numerical investigations on combustion characteristics of H2/air premixed combustion in a micro elliptical tube combustor. Energy 2017, 126, 1–12. [Google Scholar] [CrossRef]
- Chabane, A.M.; Truffin, K.; Angelberger, C. Direct numerical simulation of catalytic combustion in a meso-scale channel with non-planar walls. Combust. Flame 2020, 222, 85–102. [Google Scholar] [CrossRef]
- Zamashchikov, V.V.; Minaev, S.S. Limits of flame propagation in a narrow channel with gas filtration. Combust. Explos. Shock Waves 2001, 37, 21–29. [Google Scholar] [CrossRef]
- Biswas, S.; Zhang, P.; Wang, H.; Qiao, L. Propagation and extinction behavior of methane/air premixed flames through straight and converging-diverging microchannels. Appl. Therm. Eng. 2019, 148, 1395–1406. [Google Scholar] [CrossRef]
- Mansouri, Z. Combustion in wavy micro-channels for thermo-photovoltaic applications – Part I: Effects of wavy wall geometry, wall temperature profile and reaction mechanism. Energy Convers. Manag. 2019, 198, 111155. [Google Scholar] [CrossRef]
- Mansouri, Z. A novel wavy micro-combustor for micro-thermophotovoltaic applications. Chem. Eng. Process.-Process Intensif. 2021, 163, 108371. [Google Scholar] [CrossRef]
- Han, L.; Li, J.; Zhao, D.; Xi, Y.; Gu, X.; Wang, N. Effect analysis on energy conversion enhancement and NOx emission reduction of ammonia/hydrogen fuelled wavy micro-combustor for micro-thermophotovoltaic application. Fuel 2021, 289, 119755. [Google Scholar] [CrossRef]
- Resende, P.R.; Morais, L.C.; Pinho, C.; Afonso, A.M. Combustion Characteristics of Premixed Hydrogen/Air in an Undulate Microchannel. Energies 2022, 15, 626. [Google Scholar] [CrossRef]
- Cai, L.; E, J.; Zhao, D. Numerical investigation on NOx emissions and thermal performance of hydrogen/ammonia fueled micro-combustors with periodic wall structures. Renew. Energy 2025, 241, 122347. [Google Scholar] [CrossRef]
- Zhao, H.; Zhao, D.; Becker, S.; Zhang, Y. NO emission and enhanced thermal performances studies on counter-flow double-channel hydrogen/ammonia-fuelled microcombustors with oval-shaped internal threads. Fuel 2023, 341, 127665. [Google Scholar] [CrossRef]
- Cai, L.; E, J.; Zhao, H.; Zhao, D. Effect analysis on thermal performance enhancement and entropy generation reduction in micro-combustors with different geometric structures fueled with the hydrogen/air and hydrogen/ammonia/air. Fuel 2024, 374, 132535. [Google Scholar] [CrossRef]
- Coffee, T.P.; Heimerl, J.M. Transport algorithms for premixed, laminar steady-state flames. Combust. Flame 1981, 43, 273–289. [Google Scholar] [CrossRef]
- Hall, R.J. The radiative source term for plane-parallel layers of reacting combustion gases. J. Quant. Spectrosc. Radiat. Transf. 1993, 49, 517–523. [Google Scholar] [CrossRef]
- Cuoci, A.; Frassoldati, A.; Faravelli, T.; Ranzi, E. Numerical modeling of laminar flames with detailed kinetics based on the operator-splitting method. Energy Fuels 2013, 27, 7730–7753. [Google Scholar] [CrossRef]
- Ranzi, E.; Frassoldati, A.; Grana, R.; Cuoci, A.; Faravelli, T.; Kelley, A.P.; Law, C.K. Hierarchical and comparative kinetic modeling of laminar flame speeds of hydrocarbon and oxygenated fuels. Prog. Energy Combust. Sci. Technol. 2012, 38, 468–501. [Google Scholar] [CrossRef]
- Nettis, L. Conjugate Heat Transfer: Strategies and Applications. Ph.D. Thesis, Politecnico Di Bari, Bari, Italy, 2011. [Google Scholar]
- Panara, D.; Noll, B.E. A coupled solver for the solution of the unsteady conjugate heat transfer problem. In Proceedings of the International Conference on Computational Methods for Coupled Problems Science and Engineering, Ibiza, Spain, 21–23 May 2007; pp. 23–40. [Google Scholar]
- Cova, A.; Resende, P.R.; Cuoci, A.; Ayoobi, M.; Afonso, A.M.; Pinho, C.T. Numerical Studies of Premixed and Diffusion Meso/Micro-Scale Flames. Energy Procedia 2017, 120, 673–680. [Google Scholar] [CrossRef]
- Resende, P.R.; Afonso, A.; Pinho, C.; Ayoobi, M. Impacts of Dilution on Hydrogen Combustion Characteristics and NOx Emissions. J. Heat Transf. 2018, 141, 012003. [Google Scholar] [CrossRef]
- Resende, P.; Pinho, C.; Ayoobi, M.; Afonso, A. Numerical studies of fuel-rich micro combustion: Effect of N2 dilution on NOx emissions. In Proceedings of the 24th ABCM International Congress of Mechanical Engineering, Curitiba, Brazil, 3–8 December 2017. [Google Scholar] [CrossRef]
- Cova, A.M.P. Numerical Studies on Micro-Combustion. Master’s Thesis, University of Porto, Porto, Portugal, 2016. [Google Scholar]
- Dias, D.M.; Resende, P.R.; Afonso, A.M. A Review on Micro-Combustion Flame Dynamics and Micro-Propulsion Systems. Energies 2024, 17, 1327. [Google Scholar] [CrossRef]
- Sutton, G.; Biblarz, O. Rocket Propulsion Elements; A Wiley Interscience Publication; Wiley: Hoboken, NJ, USA, 2001. [Google Scholar]
- de Athayde Costa e Silva, M. MEMS Micropropulsion: Design, Modeling and Control of Vaporizing Liquid Microthrusters. Doctoral Dissertation, Delft University of Technology, Delft, The Netherlands, 2018. [Google Scholar] [CrossRef]
- NASA Glenn Research Center. Aeronautics: Aircraft Specifications and Performance. Available online: https://www.grc.nasa.gov/www/k-12/airplane/specimp.html (accessed on 21 July 2023).
- Dias, D.M.; Resende, P.R.; Afonso, A.M. The effect of micro-combustor material on premixed Hydrogen/air flame dynamics. Appl. Therm. Eng. 2025, 279, 127403. [Google Scholar] [CrossRef]
- Alipoor, A.; Mazaheri, K. Studying the repetitive extinction-ignition dynamics for lean premixed hydrogen-air combustion in a heated microchannel. Energy 2014, 73, 367–379. [Google Scholar] [CrossRef]
- Richter, K.; Norris, P.M.; Tien, C.L. Aerogels: Applications, structure, and heat transfer phenomena. Annu. Rev. Heat Transf. 1995, 6, 61–114. [Google Scholar] [CrossRef]
- MatWeb. Schott BOROFLOAT® Borosilicate Float Glass. 2023. Available online: https://www.matweb.com/search/datasheet_print.aspx?matguid=0c11fe52052f4debb90fc82d5cae73b4 (accessed on 4 May 2023).
- Property Database, M.M. Corning Vycor® 7913 UV-Transmitting Glass. 2023. Available online: https://www.matweb.com/search/datasheet_print.aspx?matguid=7546f96147b847a5ab00091f3c36b8ce (accessed on 4 May 2023).
- LTCC Materials Co., Ltd. LTCC Design Guideline (Standard). 2019. Available online: https://www.ltccm.co.jp/assets/pdf/ltcc_design_guideline_standard_en_20191001.pdf (accessed on 4 May 2023).
- Hermetics, E.P.E. High Temperature Cofired Ceramic (HTCC) Hermetic Packages. 2023. Available online: https://epihermetics.com/htcc-ceramic-feedthroughs/ (accessed on 4 May 2023).
- Materials, A. Stainless Steel—Grade 310 (UNS S31000). 2023. Available online: https://www.azom.com/properties.aspx?ArticleID=966 (accessed on 4 May 2023).
- Materials, A. Stainless Steel—Grade 430 (UNS S43000). 2023. Available online: https://www.azom.com/properties.aspx?ArticleID=996 (accessed on 4 May 2023).
- Ioffe Physical-Technical Institute of the Russian Academy of Sciences Thermal Properties of Silicon. 2016. Available online: https://www.ioffe.ru/SVA/NSM/Semicond/Si/thermal.html (accessed on 4 May 2023).
- Zhang, A.; Li, Y. Thermal Conductivity of Aluminum Alloys—A Review. Materials 2023, 16, 2972. [Google Scholar] [CrossRef] [PubMed]
- Brassinter, S.A. Tungsten—Copper and Molybdenum—Copper Alloys. 2016. Available online: http://www.brassinter.com.br/en/eletrodos.htm (accessed on 4 May 2023).
- Dias, D.M.; Resende, P.R.; Afonso, A.M. Thermal and combustion performance of micro-burner under adiabatic conditions. Appl. Therm. Eng. 2025, 267, 125631. [Google Scholar] [CrossRef]
- Macedo, J.M.R.C.d. Estudos Numéricos em Micropropulsão. Master’s Thesis, Universidade do Porto, Porto, Portugal, 2021. [Google Scholar]
Disclaimer/Publisher’s Note: The statements, opinions and data contained in all publications are solely those of the individual author(s) and contributor(s) and not of MDPI and/or the editor(s). MDPI and/or the editor(s) disclaim responsibility for any injury to people or property resulting from any ideas, methods, instructions or products referred to in the content. |
© 2025 by the authors. Licensee MDPI, Basel, Switzerland. This article is an open access article distributed under the terms and conditions of the Creative Commons Attribution (CC BY) license (https://creativecommons.org/licenses/by/4.0/).