Article

Multi-Objective Design Optimization of Solid Rocket Motors via Surrogate Modeling

1
National Key Laboratory of Solid Rocket Propulsion, Northwestern Polytechnical University, Xi’an 710129, China
2
Xi’an Aerospace Information Institute, Xi’an 710025, China
*
Author to whom correspondence should be addressed.
Aerospace 2025, 12(9), 805; https://doi.org/10.3390/aerospace12090805 (registering DOI)
Submission received: 17 July 2025 / Revised: 5 September 2025 / Accepted: 5 September 2025 / Published: 7 September 2025
(This article belongs to the Section Astronautics & Space Science)

Abstract

To reduce the high computational cost and lengthy design cycles of traditional solid rocket motor (SRM) development, this paper proposes an efficient surrogate-assisted multi-objective optimization approach. A comprehensive performance model was first established, integrating internal ballistics, grain structural integrity, and cost estimation, to enable holistic assessment of the coupled effects of key motor components. A parametric analysis framework was then developed to automate the model, facilitating seamless data exchange and coordination among sub-models through chain coupling. Leveraging this framework, a large-scale, high-fidelity dataset was generated via uniform sampling of the design space. The Kriging surrogate model with the highest global fitting accuracy was subsequently employed to replicate the integrated model’s complex responses and reveal underlying design principles. Finally, an enhanced NSGA-III algorithm incorporating a phased hybrid crossover operator was applied to improve global search performance and guide solution evolution along the Pareto front. Applied to a specific SRM, the proposed method achieved a 4.72% increase in total impulse and a 6.73% reduction in cost compared with the initial design, while satisfying all constraints.

1. Introduction

Solid rocket motors (SRMs) are critical components of space propulsion systems, offering unique strategic value in both military and civilian applications due to their compact design, rapid response, and long-term storability. As the space industry expands, the performance requirements for SRMs have become increasingly stringent, imposing design constraints that balance cost reduction with performance enhancement. Moreover, the inherently multidisciplinary nature of SRM design complicates system-level optimization.
Since the 1980s, multidisciplinary design optimization (MDO) has attracted considerable attention in aerospace research [1,2,3,4,5,6] for its ability to capture coupled interactions across engineering disciplines. Over time, MDO has evolved into a comprehensive framework integrating optimization algorithms, surrogate modeling, and search strategies, enabling efficient and coordinated design across multiple domains.
During the validation and detailed design phases, it is often necessary to generate numerous candidate configurations around a baseline design and perform optimization and selection. In this process, the efficiency of the optimization algorithm, fidelity of the computational model, and reliability of decision-making directly affect the performance of the final solution. As a representative heuristic approach, genetic algorithms (GAs) offer feasible solutions to complex combinatorial optimization problems with manageable computational cost. In particular, the NSGA-III algorithm [7,8], which incorporates a reference point mechanism, effectively maintains a uniform solution distribution and has been widely applied in aerospace propulsion system design. However, NSGA-III primarily relies on a single simulated binary crossover (SBX) operator. While effective for local search, SBX has limited global exploration capability and is prone to premature convergence [9]. This limitation is especially pronounced in SRM optimization due to strong coupling among performance parameters and a highly nonlinear solution space, necessitating enhancements in crossover and mutation mechanisms to fully exploit the algorithm’s potential.
Computational models of SRMs often depend on time-consuming numerical simulations, leading to high computational costs during optimization. To improve efficiency while preserving accuracy, surrogate-based heuristic strategies have been widely adopted. Surrogate models map design variables to performance outputs using sample datasets, substantially reducing computational overhead. For example, Mancini et al. [10] combined GAs with radial basis function neural networks to establish a design-level optimization framework compatible with finite element analysis. Wu Z. P. et al. [11,12,13] proposed a multi-fidelity modeling strategy using parameter mapping from historical designs, enabling knowledge reuse, reducing high-fidelity sample requirements, and improving modeling efficiency. Li W. T. et al. [14,15,16] extended optimization from size-level to topology-level, leveraging neural networks to map geometric coordinates to topology descriptors, integrated with GAs for complex two- and three-dimensional perforated grain geometries. High-accuracy surrogate models rely on well-distributed datasets, making parameterized analysis essential for generating large volumes of performance data. Rohini et al. [17] developed Open Rocket, supporting design, analysis, and assembly via parameterized modules. Zhang Y. Y. et al. [18] created a fully automated, parametrically driven motor assembly template for internal ballistics. Deng Y. M. et al. [19] combined parametric modeling with finite element analysis to assess grain structural integrity. Miao Q. W. et al. [20,21] integrated internal ballistic and structural models through parameterized analysis, enabling data coupling across multidisciplinary models. Although previous studies have demonstrated the advantages of surrogate-assisted heuristic algorithms in conceptual solid rocket motor design, several challenges persist. Systematic evaluations of surrogate model applicability remain limited, and model selection often depends on empirical judgment. Furthermore, the extensive simulation data generated throughout the design process are underutilized for uncovering potential design patterns. These issues underscore the need for efficient surrogate-based multi-objective optimization, comprehensive assessment of various surrogate models, and data-driven extraction of design insights.
Increasing demands for energy density, cost efficiency, and safety in space missions [22] impose stringent multi-objective challenges on SRM design, necessitating advanced optimization techniques. In this study, a representative SRM was selected as the research subject. Parameterized analyses based on internal ballistics, grain structural integrity, and cost models were performed to enable coupled multidisciplinary modeling and integrated information management. A high-accuracy surrogate model was employed to develop a multi-objective optimization framework balancing performance and cost, facilitating systematic exploration of design patterns to inform optimization strategies. To further enhance the optimization process, an improved NSGA-III variant, termed NSGA-III-PHE, was proposed by incorporating a phase-wise hybrid crossover operator. The algorithm’s effectiveness was validated using the DTLZ benchmark test suite and subsequently applied to multi-objective optimization of the selected SRM.

2. Multidisciplinary Design Optimization Formulation

2.1. Optimized Objects

The multidisciplinary design optimization of a solid rocket motor involves the integration of geometric modeling, internal ballistics, structural integrity analysis of the grain, and cost evaluation. These models are highly interdependent, interacting through complex data flows.
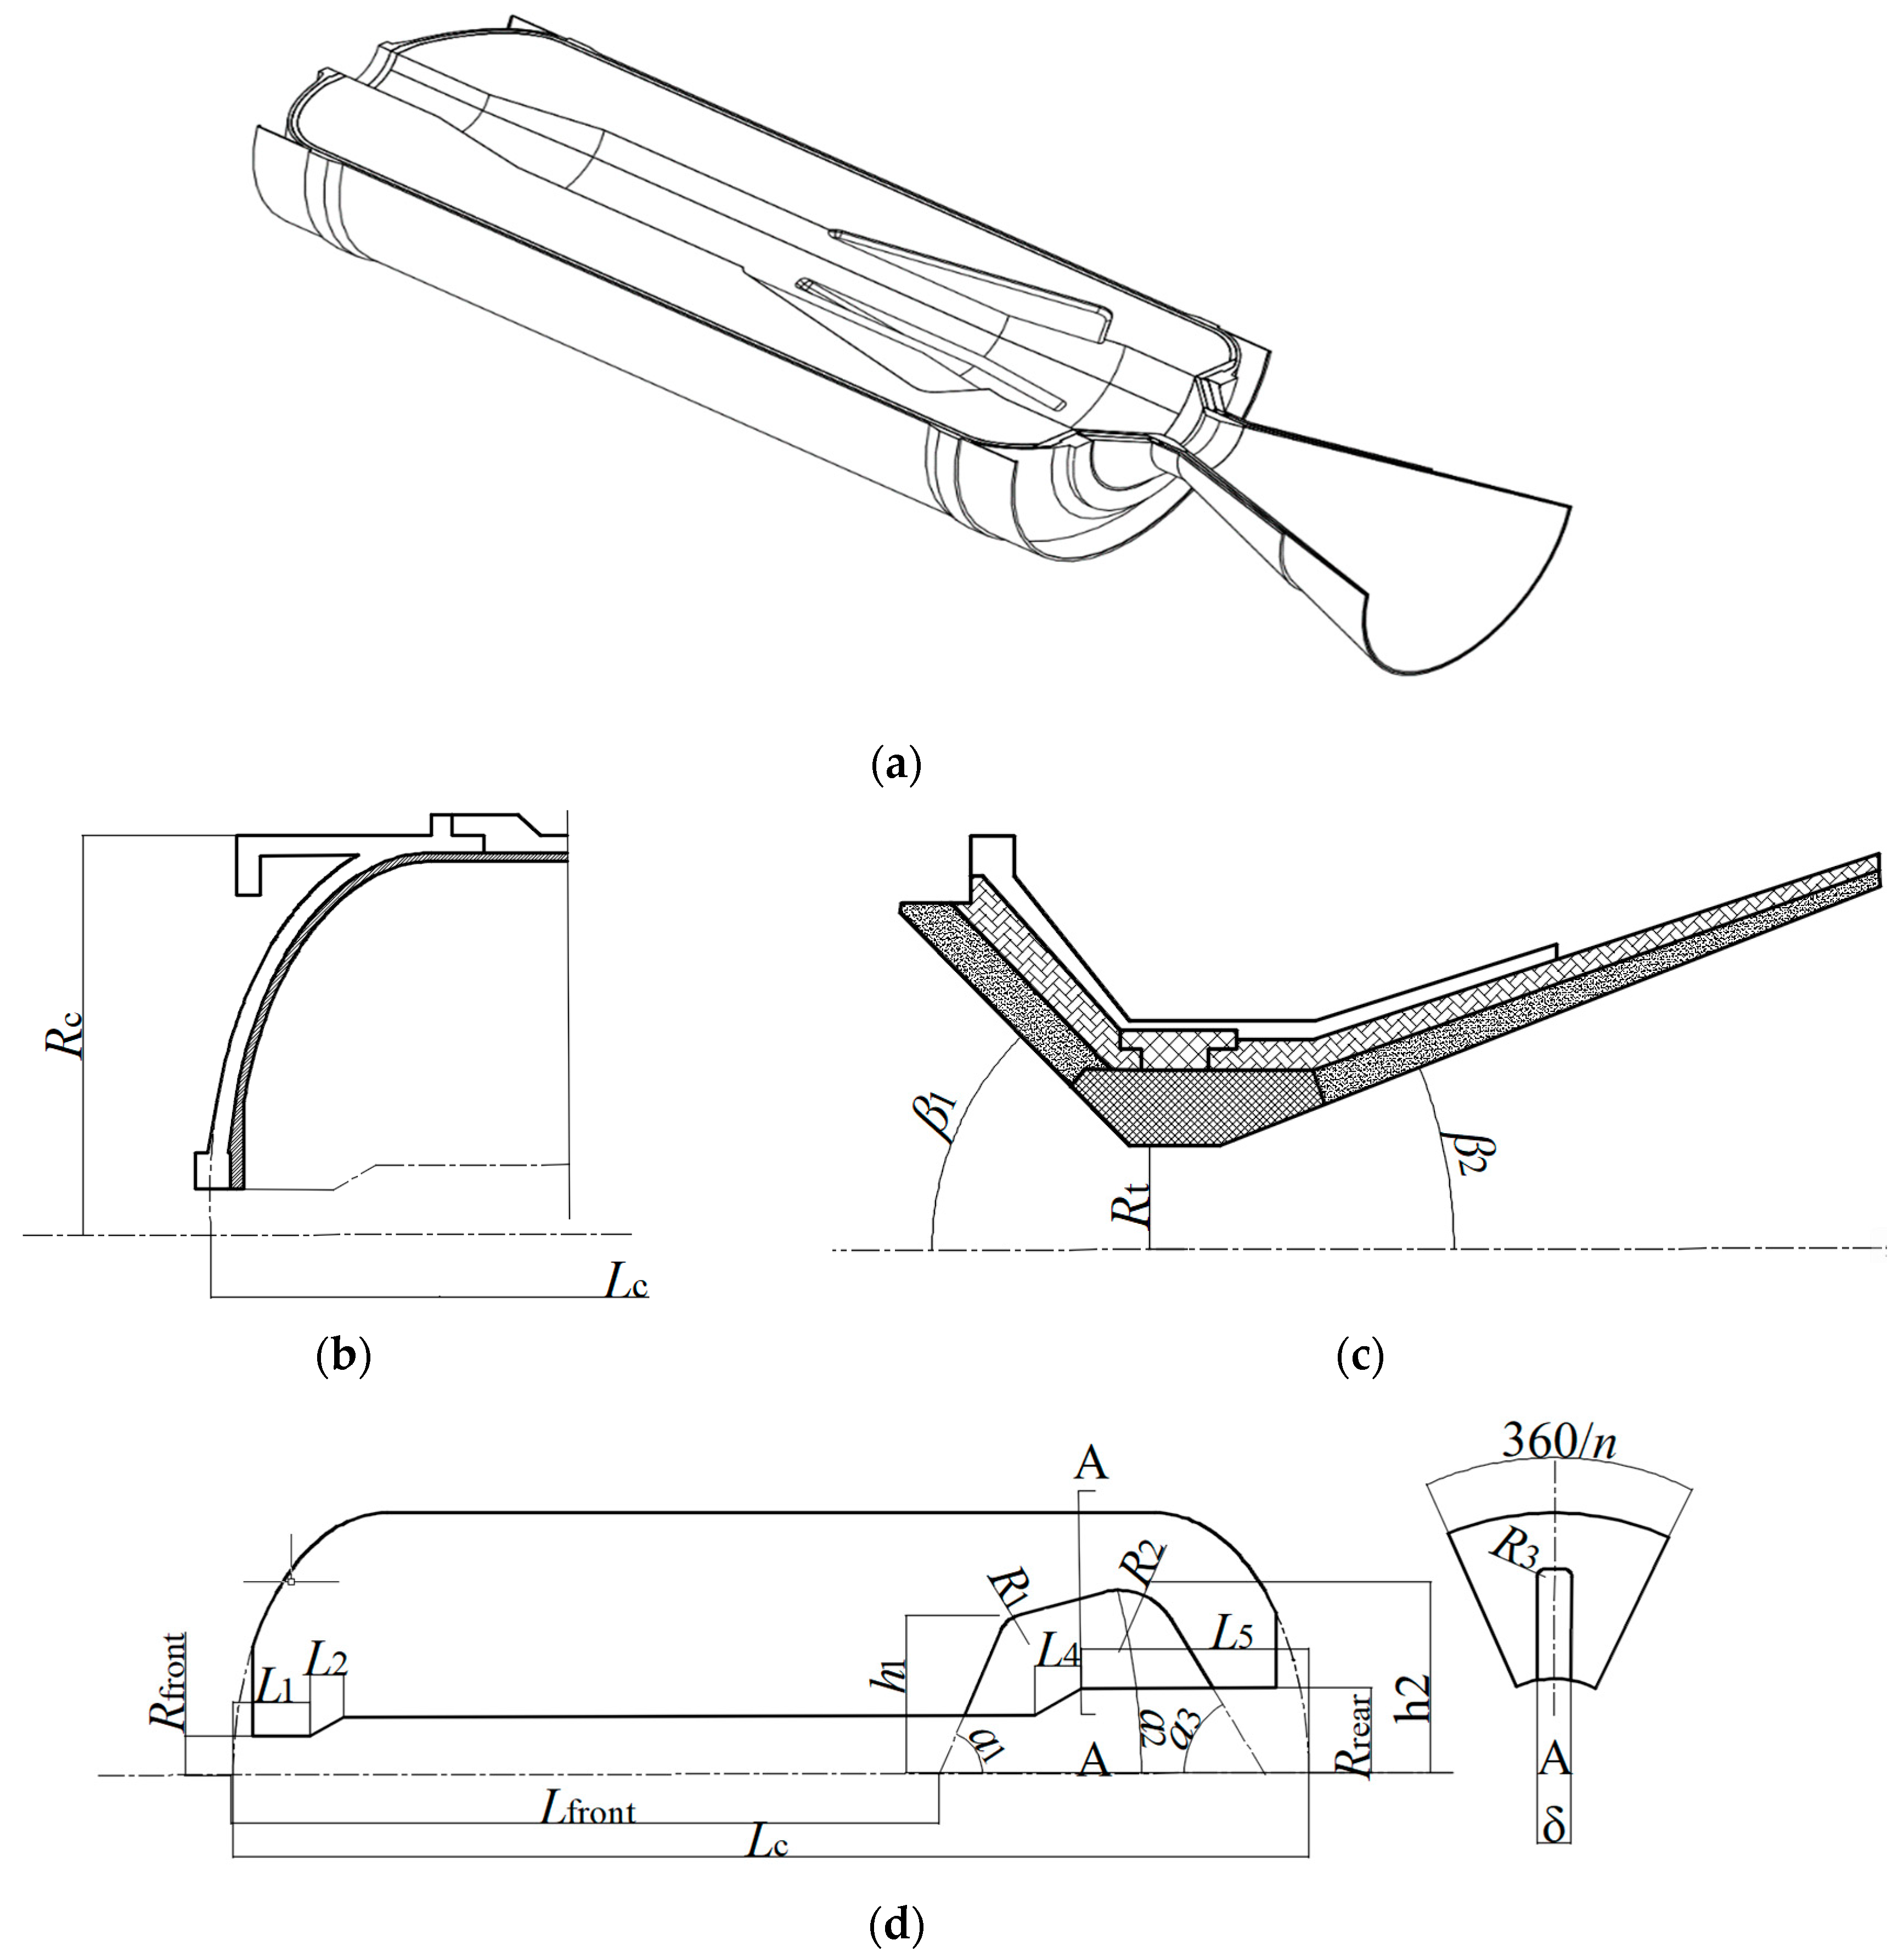
This study examines a representative solid rocket motor and develops an integrated design framework based on the structural configuration provided by the system design department. The motor comprises a finocyl grain, nozzle, combustion chamber shell, and thermal insulation layer, with parameter definitions illustrated in Figure 1.
The design process begins with the definition of key geometric parameters, including the combustion chamber diameter, length, dome ellipsoid ratio, throat diameter, and propellant grain fillet radius. The definitions and ranges of these design variables are presented in Figure 1 and Table 1, respectively. The initial design configuration is determined by selecting the median value of each parameter’s range.
To simultaneously optimize multiple motor performance metrics to satisfy predefined requirements while minimizing development and manufacturing costs, the SRM optimization model is formulated as follows:
min I , C S R M = f X s . t . 1.8 S 2.3 18   k N F ¯ 25   k N L n < 400   m m J 0.6 0.8 η c 0.9 r p 1 7.5   s t w o r k 8.5   s r D 1 x i , b o t x i x i , t o p
Here, X represents a vector of 17 structural design variables, formulated as X = R r e a r , R f r o n t , a 1 , a 2 , a 3 , h 1 , h 2 , L f r o n t , δ , n , L 1 , L 2 , L 4 , L 5 , ε , β 1 , β 2 T . I and C S R M denote the total impulse and cost, respectively, S is the structural integrity safety factor of the grain, F ¯ signifies the average thrust during operation, and L n is the nozzle length. Additionally, J represents the nozzle expansion ratio, η c is the grain packing efficiency, t w o r k denotes the operating time, and r p is the empirical criterion for flow separation in the nozzle. r D is defined as the ratio of the nozzle exit diameter to the combustion chamber diameter. Finally, x i , t o p and x i , b o t represent the upper and lower allowable bounds of the design variable x i , respectively.

2.2. Optimization Objectives and Models

2.2.1. Internal Ballistic Model

As a critical aspect of SRM design and performance prediction, internal ballistic analysis aims to determine the time-dependent ballistic parameters for a given grain configuration, thereby ensuring that the propulsion system satisfies specific performance requirements.
Based on the fundamental assumptions of zero-dimensional modeling, combined with the principles of mass conservation and the ideal gas law, the pressure evolution over time [23] is derived, as shown in Equations (2)–(4).
d p c d t = η c 2 R g T g V c m ˙ p c , e q A t c * η c × 10 6
m ˙ = a p c n A b ρ p e σ p T T 0
p e q = ρ p c * a A b A t 1 1 n
Here, p c   and p c , e q represent the instantaneous and equilibrium pressures within the combustion chamber, respectively, c * denotes the characteristic velocity, a is the burn rate coefficient, A b signifies the burning surface area, and A t is the nozzle throat area. Furthermore, n refers to the pressure exponent, ρ p to the propellant density, V c to the free volume of the combustion chamber, and T g and T 0   to the gas temperature and reference temperature, respectively. Finally, σ p represents the temperature sensitivity coefficient.
In addition, during motor operation, the nozzle throat diameter increases due to gas erosion, which consequently affects internal ballistic performance. The throat area is calculated as follows:
A t = π D t / 2 + E k t 2
Here E k represents the linear ablation rate of the throat.

2.2.2. Grain Structural Integrity Model

Structural integrity analysis is primarily conducted to verify the feasibility of motor designs. Previous studies have shown that structural failure often occurs within the grain body and at its interfaces [23]. Consequently, ensuring grain integrity represents a critical and challenging aspect of the design process, as failure of the solid propellant grain itself is the leading cause of major malfunctions.
Solid propellants, being viscoelastic materials, exhibit mechanical behavior intermediate between that of ideal elastic solids and ideal viscous fluids. Their mechanical properties depend strongly on both time and temperature, with creep and stress relaxation as typical characteristics.
In general-purpose CAD software, the relaxation modulus is typically represented using an n-term Prony series, as shown below. In this study, all computations were performed using CalculiX version 2.18.
E t = E + i = 1 n E i e t / τ i
Here E and τ i   represent the modulus at infinite relaxation time and the characteristic relaxation time.
The time–temperature superposition principle states that the relaxation modulus curves at different temperatures can be equivalently represented by horizontally shifting the time scale of the relaxation modulus curve measured at a reference temperature. Based on this principle, Williams et al. [24] developed the Williams–Landel–Ferry (WLF) model, which has been widely applied in the thermorheological analysis of viscoelastic materials. The model is expressed as:
l g α T = C 1 T T 0 C 2 + T T 0
Here α T denotes the time–temperature shift factor at temperature T , T 0 is the reference temperature, and C 1 and C 2 are material constants.
Using the WLF model, the relaxation modulus at any temperature can be equivalently shifted to the reference temperature by applying a time–scaling factor, thereby relating the time-dependent relaxation modulus at temperature T to that at the reference temperature as follows:
E t , T = E t / α T , T 0

2.2.3. Cost Analysis Model

In this study, cost is normalized and expressed in units of 10,000 Chinese Yuan (CNY) per kilogram [25]. The total motor cost is formulated as:
C S R M = C g + C c + C n + C i g n
Here, the manufacturing cost of the casing is given by:
C c = 1.23 f c m c 0.474
where f c   denotes the process influence factor, which equals 1 for 30CrMnSiAi material, and m c   is the mass of the combustion chamber, including both the casing and thermal insulation layer.
The grain manufacturing cost is strongly influenced by the grain mass m g , propellant type, and fabrication process, and is expressed as:
C g = f p 1 f p 2 m g 0.59
Here, f p 1 is the grain type influence factor, which equals 1 for hydroxyl-terminated polybutadiene (HTPB) propellant, and f p 2 is the fabrication process influence factor, equal to 0.5 for non-composite grains with low processing requirements.
For nozzles used in low-altitude applications, which generally operate for short durations and have expansion ratios below 25, the cost mainly depends on the nozzle mass   m n :
C n = 1.05 m n 0.702
The cost of the ignition device typically accounts for about 5% of the total motor cost and is relatively insensitive to design parameters; therefore, ignition cost C i g n is neglected in this study.

3. Parametric Analysis

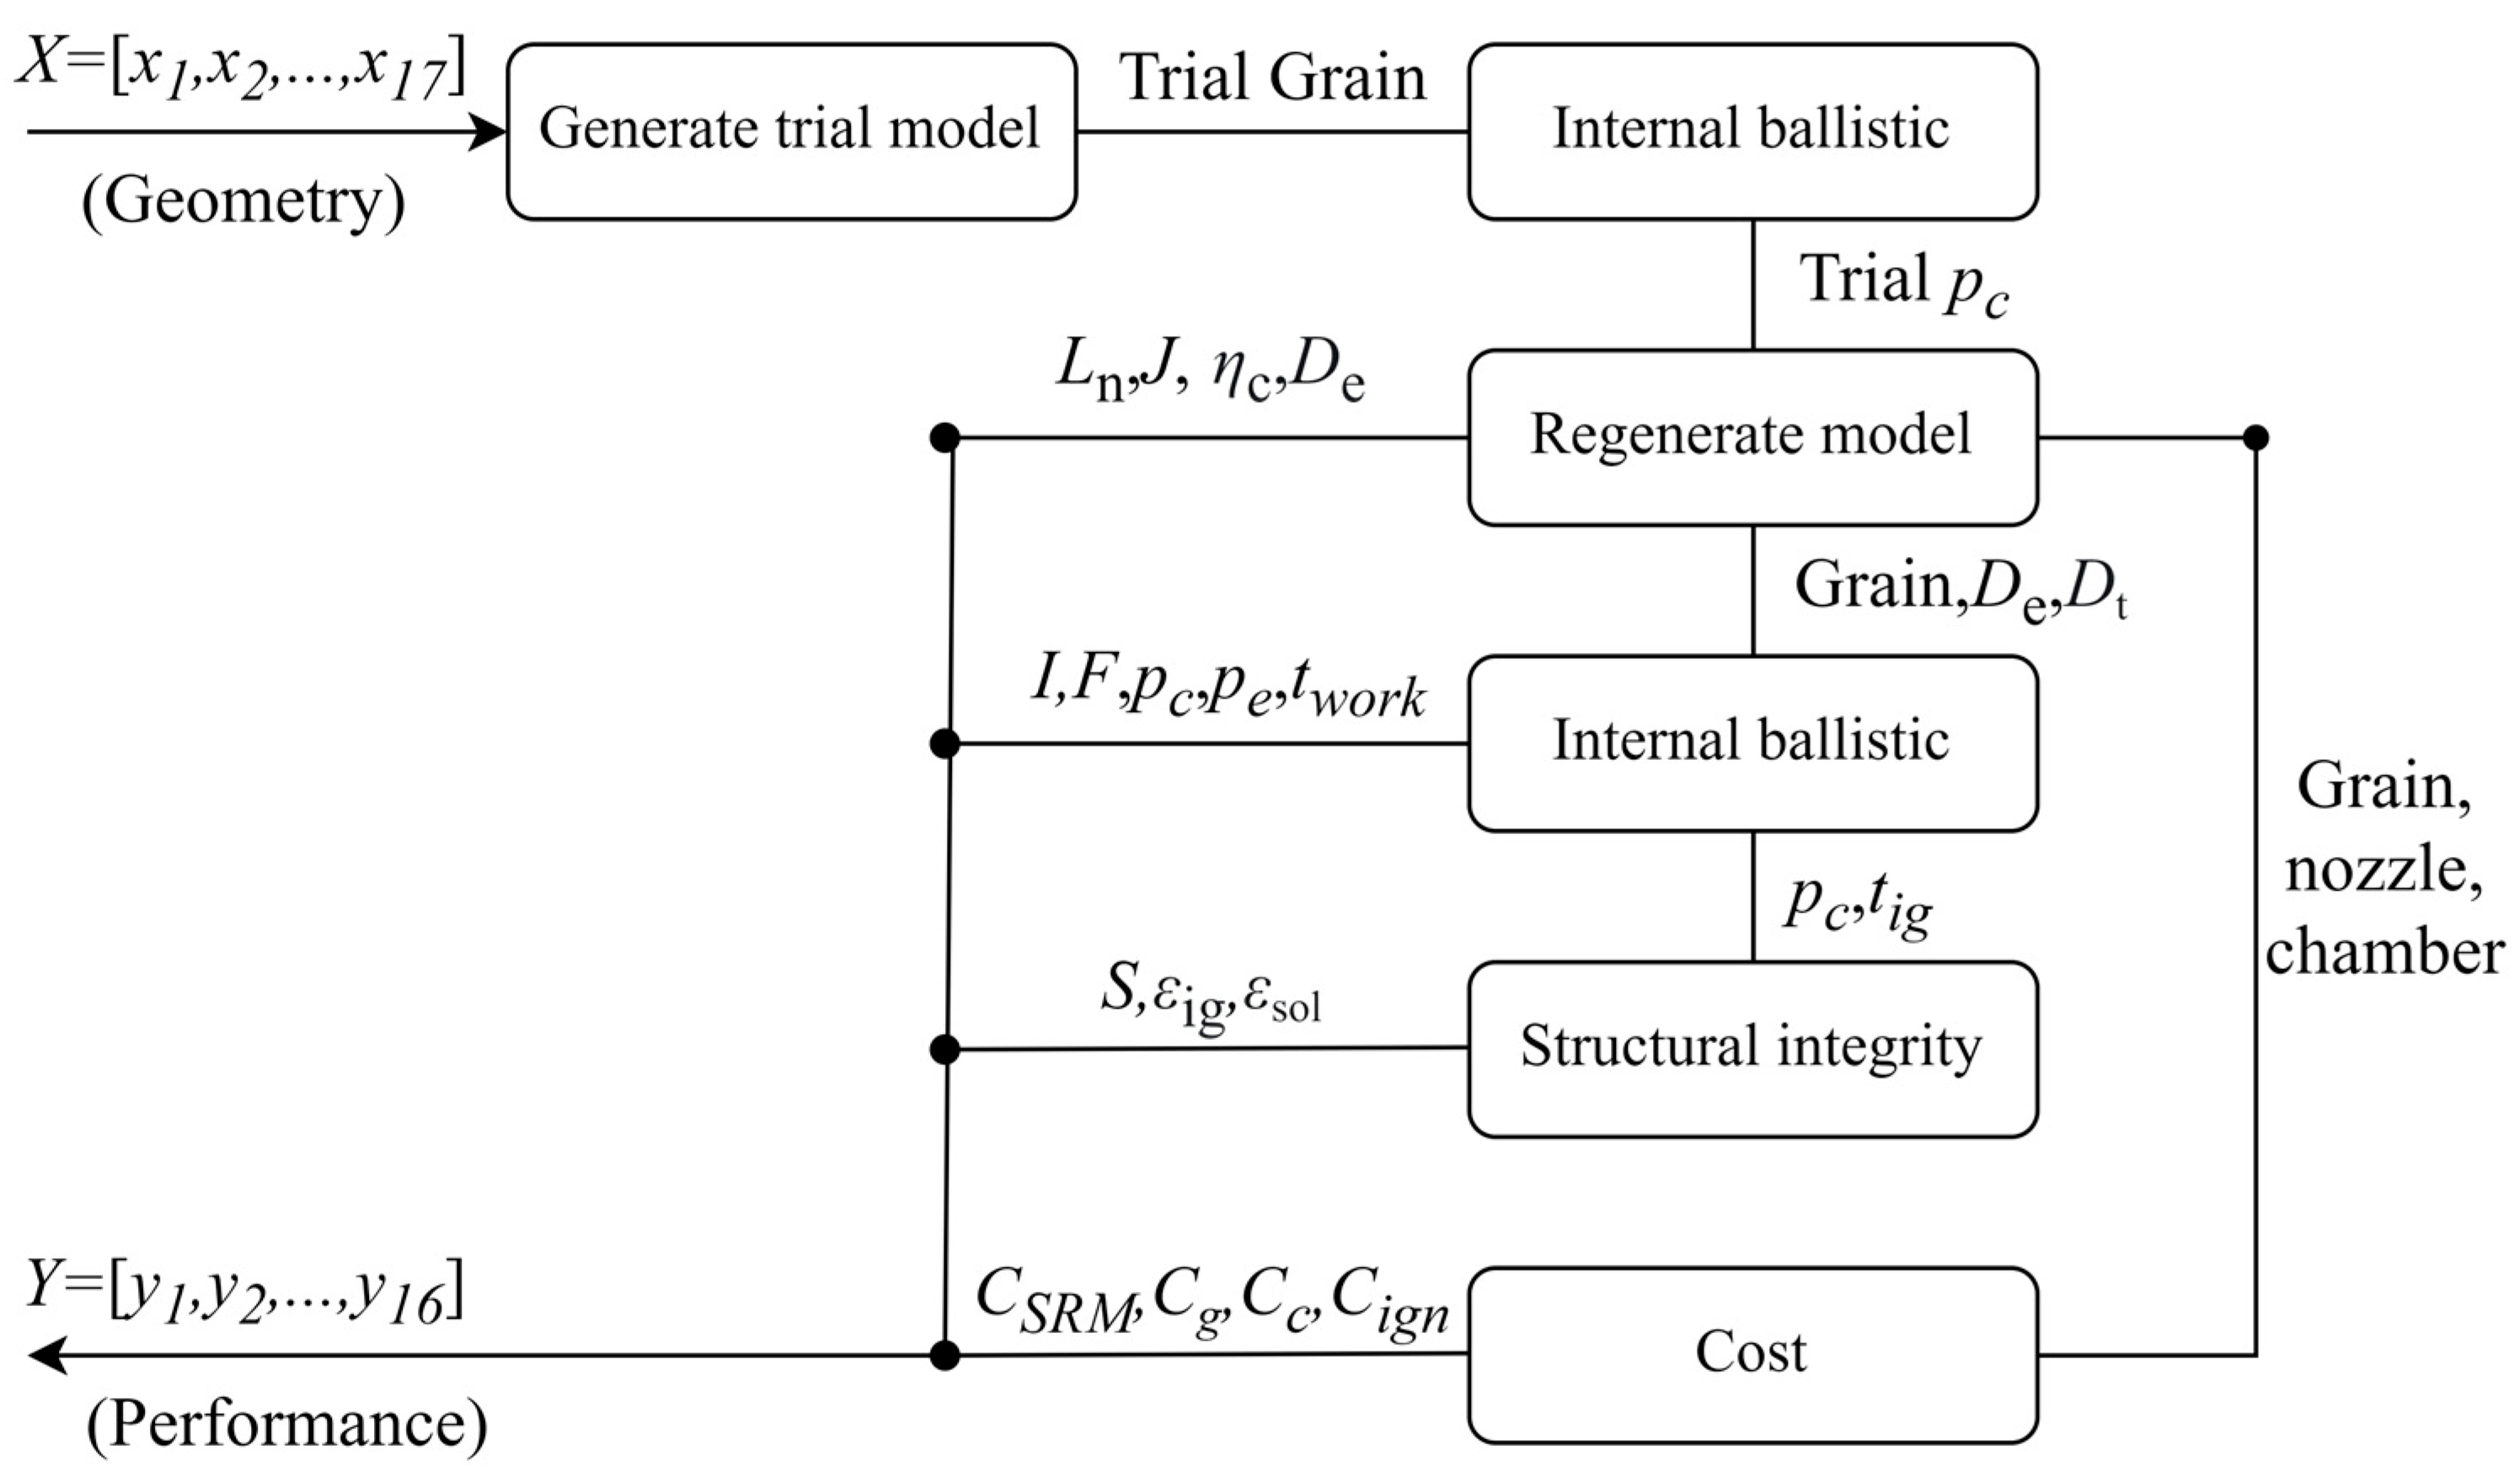
A parametric analysis framework was developed to facilitate the chained coupling of multidisciplinary models and the integrated management of information flow. The corresponding data flow diagram (DFD) is presented in Figure 2, where x i and y i denote the input and output data streams, respectively, and o i represents intermediate trial data.
The parametric analysis proceeds as follows:
  • The outer diameter of the combustion chamber is assumed to match that of the grain. A trial grain model is constructed and applied in internal ballistic estimation to approximate the maximum pressure of the combustion chamber.
  • Based on the estimated maximum pressure, key dimensional parameters—such as the wall thicknesses of the combustion chamber and nozzle shells—are determined. Geometric models of the combustion chamber shell, thermal insulation layer, grain, and nozzle are then generated sequentially.
  • The CAD kernel is used to calculate the mass of each component, which is subsequently applied in mass-based cost estimation.
  • A detailed internal ballistic simulation is performed using the geometric model of the grain in combination with a voxel-based burning surface recession method.
  • The ignition pressure and ignition time derived from the internal ballistic analysis, along with the meshed grain model, are employed to evaluate structural integrity.

3.1. Geometric Model Generation Method

The 3D solid model of the motor is constructed by establishing parametric associations and assembly relationships between the complete system and its subcomponents. This process relies on empirical formulas and structural geometric constraints.
The geometric characteristics of the core output model are calculated using CAD software, including the nozzle length L n , the propellant grain cavity volume V p , and the combustion chamber volume V c . The parameter η c is then defined as:
η c = V p V c
In addition, J and r D are directly derived from structural design parameters:
J = A t A p = D t 2 4 R r e a r 2
r D = D t ε D c

3.2. Interior Ballistics Computational Method

The interior ballistics calculation for a motor requires determining the shape of the burning surface at each time step during regression, as well as the gas generation rate at all points on this surface. Conceptually, this problem can be framed as a challenge in computer graphics: given a continuous surface and the velocity of each point along its local outward normal, the objective is to compute the surface shape at the next time step.
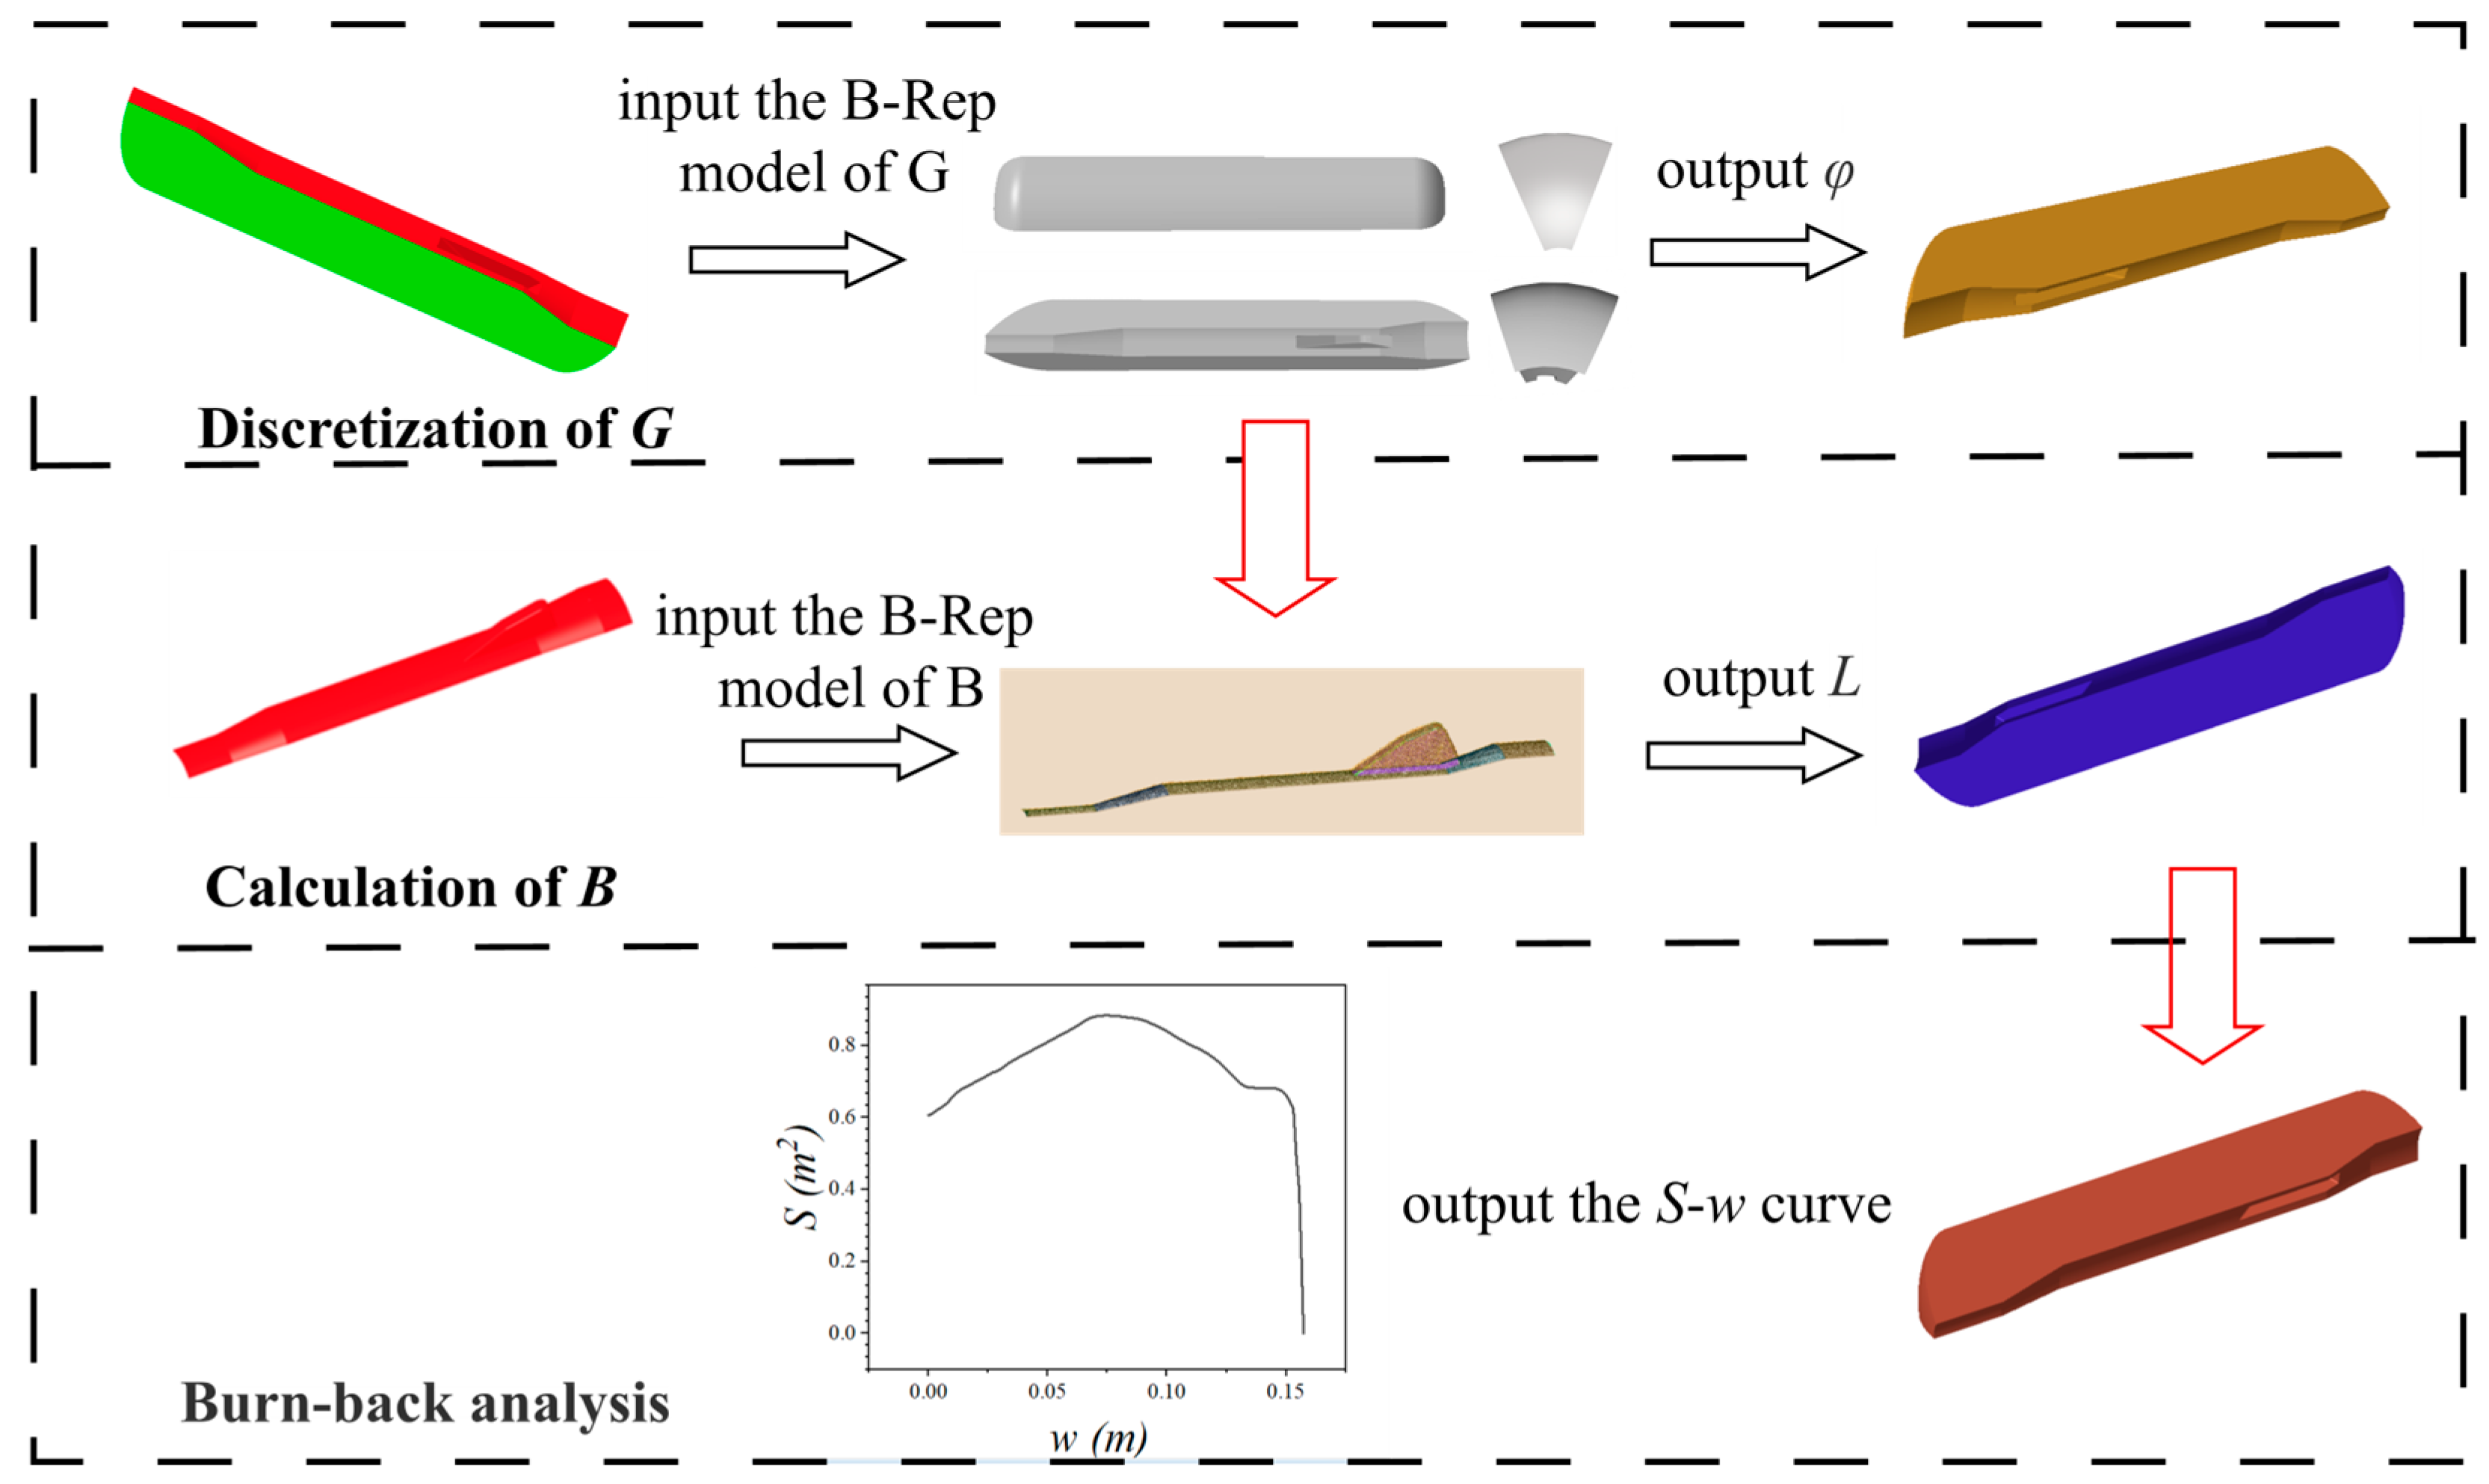
A numerical method for burning surface evolution, based on the level-set approach [26], addresses this challenge. This method approximates the burning surface using numerous simple, computationally manageable discrete elements, enabling an approximate solution to the surface tracking problem within a controllable error margin. A flowchart of the algorithm is presented in Figure 3.
For a propellant grain G of arbitrary shape, it is represented as a regular solid in three-dimensional space using a Boundary Representation (B-Rep). Its set of faces satisfies:
F ( G ) = W ( G ) B ( G , w )
W ( G ) B ( G , 0 ) =
In these equations, F ( G ) , W ( G ) , and B ( G , w ) denote the set of all boundary faces of G , the set of inhibited surfaces, and the set of burning surfaces at a burned web thickness of w , respectively. The effective area of the inhibited surface, W ( G ) , remains constant throughout the regression of the burning surface.
The propellant grain G is then discretized. For any point P in three-dimensional space, an indicator function φ P is defined as follows:
φ P = 1 , P G 0 , o t h e r w i s e
The absolute distance L from a point P to the initial burning surface B G , 0   is defined as follows:
L ( P , B ( G , 0 ) ) = min { | P Q | , Q B ( G , 0 ) } , P P | φ P = 1 i n f , P P | φ P = 0
According to the parallel layer burning law, for a burned web thickness w , the burning surface B ( G , w ) is defined as the set of all points P satisfying:
B G , w = P | P G , L P , B G , 0 = w
For a given web thickness w , interpolation is performed within the distance field L to extract all surface patches that constitute the burning surface. The areas of these patches are then integrated to obtain the total burning surface area, S . This procedure is repeated to generate the burning surface area versus web thickness curve ( S w curve).
Subsequently, Equation (2) is solved numerically using a fourth-order Runge–Kutta method. The computational process terminates when the chamber pressure falls below a predefined end-of-operation pressure.
Table 2 lists the material parameters used in the internal ballistics calculation. From the solid propellant interior ballistics analysis, the following performance metrics and constraint values are obtained: total impulse I , average thrust F ¯ , and the pressure ratio r p :
I = 0 t w o r k F t d t
F ¯ = 0 t w o r k F t d t t w o r k
r p = p ¯ e / 2 3 p a 1.2 p ¯ c 0.2
p c ¯ = 0 t w o r k p c t d t t w o r k

3.3. Grain Structural Integrity Analysis Method

Throughout the motor’s lifecycle—including manufacturing, transportation, storage, and operation—the propellant grain is subjected to a combination of complex loads, including thermal, vibrational, gravitational, and pressure loads. Among these, the loads primarily responsible for failure at the inner surface of the grain are the thermal load generated during curing and cooldown, and the internal pressurization load experienced during ignition and startup [23].
During the curing and cooling phase, the propellant grain is cooled gradually, with its internal temperature assumed to be spatially uniform at all times. The temperature decreases linearly from its initial value to a soaking temperature over 38 h and is then maintained for an additional 48 h.
During the ignition and pressurization phase, burning surface regression is neglected. The pressure rises to a peak value,   p i g , in 0.1 s and is sustained for 0.1 s. The grain temperature is assumed to be constant throughout this phase. The peak ignition pressure p i g   is calculated using the following equation:
p i g = r p e q
Here, r denotes the peak pressure ratio, and p e q represents the initial equilibrium pressure as determined by Equation (4).
The computational process begins with the generation of a structured mesh for the analysis domain. The propellant grain is meshed using a swept meshing method, with the cross-section at the fin slot serving as the source face. Mesh nodes are defined in a cylindrical coordinate system. For nodes located on the mid-longitudinal plane, constraints are applied to the degrees of freedom corresponding to radial displacement UR2, rotation about the axial axis UR1, and rotation about the circumferential axis UR3, thereby restricting nodal movement normal to the plane of symmetry.
For nodes on the cylindrical section of the grain, the outer surface is treated as a fixed support, justified by the casing’s modulus being significantly greater than the propellant’s relaxation modulus. Consequently, these nodes are fully constrained in all six degrees of freedom.
Next, the material properties of the propellant are defined, and boundary conditions and loads are applied. The temperature field is initialized with a specified initial temperature. The structural integrity simulation is then performed using defined time steps and increments to obtain the maximum von Mises strain for each load case.
Based on the theory of cumulative damage, the principle of linear superposition is employed to calculate the combined damage caused by multiple loads. Accordingly, the failure criterion for the propellant grain, subjected to both thermal and pressure loads after the ignition and pressurization stage, is expressed as:
D = ε s o l ε s o l m + ε i g ε i g m > 1
Here, ε s o l and ε i g denote the maximum strains induced by curing and cooldown, and by internal pressure, respectively; ε s o l m and ε i g m represent the allowable strains for curing and cooldown, and for the ignition, respectively.
The von Mises equivalent strain is calculated as follow:
ε = 2 3 ε x ε y 2 + ε y ε z 2 + ε z ε x 2 + 6 ε x y 2 + ε y z 2 + ε z x 2
Finally, the safety factor of the propellant grain is determined as follows:
S = 1 ε s o l ε s o l m + ε i g ε i g m
Figure 4 presents a systematic overview of the closed-loop workflow for the structural integrity analysis of the propellant grain. This workflow comprises a series of critical stages: load assessment, load case definition, application of physical boundary conditions, structured meshing, finite element simulation, and, ultimately, the final structural safety evaluation. The material parameters used in the grain structural integrity analysis are listed in Table 3. The propellant’s relaxation modulus is characterized using a Prony series, as defined in Equation (6), with the coefficients for the first ten terms provided in Table 4.

3.4. Cost Estimation Method

Following the cost model described in Section 2.2.3, the estimation of motor cost is based on determining the masses of its three primary components: the combustion chamber, the propellant grain, and the nozzle. These component masses, obtained directly from the core CAD calculator, are used to predict the solid rocket motor cost, denoted as C S R M .

4. Multi-Objective Optimization Methodology

4.1. Overview of the Methodology

The overarching methodology for multi-objective optimization is illustrated in Figure 5. The process comprises three principal stages: (i) dataset construction, (ii) surrogate model development, and (iii) optimization algorithm enhancement.
Dataset Construction (Section 4.2). This work is founded on a comprehensive parametric analysis framework, built upon the motor performance simulation methods detailed in Section 3. The framework systematically integrates design variables with their corresponding performance and structural metrics, enabling the automated generation of a large-scale dataset.
Surrogate Model Development (Section 4.3). A network of surrogate models is trained using the constructed dataset, mapping a 17-dimensional input vector of design variables, X , to a 9-dimensional output vector of performance and structural parameters, Y = [ I , C S R M , S , η , r p , r D , F , t , J ] . A hybrid modeling strategy is adopted: for each output metric, the fitting accuracy of various model types is evaluated, and the optimal model is selected. This approach produces a high-fidelity ensemble surrogate for the entire motor analysis. Furthermore, the surrogate models facilitate sensitivity analysis, quantifying the importance of each design variable and revealing key heuristic design principles for this class of SRMs.
Optimization Algorithm Enhancement (Section 4.4). The optimization phase employs an enhanced NSGA-III algorithm incorporating a novel phased hybrid crossover operator. The surrogate models developed in the previous stage serve as computationally inexpensive objective functions for the multi-objective, multi-constraint optimization. Finally, as presented in Section 4.5, the process generates the Pareto front representing the trade-off between total impulse and cost, from which a solution of practical engineering value is selected for further analysis.

4.2. Dataset Generation

Based on the parameterized analysis framework established in Section 3, a batch simulation of performance and cost evaluation was conducted for various design parameter combinations of a solid rocket motor. A total of 1200 design schemes were generated using the Latin hypercube sampling method. After filtering out schemes with unreasonable topological parameters, 1125 valid datasets were obtained.
Figure 6a presents the internal ballistic pressure–time curves for all valid design schemes. The peak pressure for most schemes is concentrated between 12.5 MPa and 18.0 MPa, with burn times primarily ranging from 6 to 10 s. Figure 6b shows the histogram of motor cost, indicating an approximately normal distribution. The central interval is mainly between 23.5 × 10⁴ CNY/kg and 27.0 × 10⁴ CNY/kg, with the highest frequency occurring around 25.25 × 10⁴ CNY/kg. Figure 6c depicts the distribution of total impulse, which exhibits a similar quasi-normal pattern, with most values falling between 220 kN·s and 255 kN·s, and the peak region near 237.5 kN·s.
Overall, the batch simulation results are uniformly distributed within the design space, and the distribution patterns of the key performance parameters align with practical engineering expectations. This indicates that the dataset is representative and suitable for subsequent performance evaluation and optimization studies.

4.3. Selection and Evaluation of Surrogate Models

Several established surrogate modeling techniques are evaluated to approximate the performance functions of the solid rocket motor. These techniques include Support Vector Regression (SVR), Radial Basis Function (RBF) networks, Kriging models, and second-order Response Surface Models (RSM). The models are trained using the dataset generated from the parametric analysis framework, which captures the relationship between 17 input design variables and 9 output performance metrics.
The predictive performance of each surrogate model is quantified using the coefficient of determination ( R 2 ), a metric that assesses the model’s goodness-of-fit. The coefficient of determination is defined as follows:
R 2 = 1 i = 1 N y i y i ^ 2 i = 1 N y i y i ¯ 2
Here, N denotes the number of data points, y i   is the actual value obtained from the simulation, y i ^   is the value predicted by the surrogate model, and y i ¯   is the mean of the actual values.
To ensure robust evaluation, the dataset was partitioned into a training set, containing 90% of the data, and a hold-out test set, comprising the remaining 10%. A comparative summary of the predictive accuracy for each model type, evaluated on the test set, is presented in Table 5.
As shown in Table 5, the comparative analysis highlights distinct performance characteristics among the surrogate models. In the table, values corresponding to the best performance among the four models on either the training or test set are indicated in bold. The second-order RSM model, although exhibiting exceptionally high fitting accuracy on the training set, displays substantial degradation in predictive performance on the test set, indicating a clear tendency toward overfitting. The SVM model provides reasonable predictions for certain metrics, such as C S R M , but its overall goodness-of-fit on the training set is comparatively low, suggesting sensitivity to sample distribution and inconsistent generalization capability. In contrast, both the Kriging and RBF models demonstrate excellent consistency across the training and test sets, reflecting superior generalization ability. A closer examination shows that the Kriging model consistently achieves slightly higher evaluation metrics than the RBF model on both datasets. Therefore, considering the trade-off between predictive accuracy and robustness, the Kriging model was selected as the unified surrogate modeling methodology for all performance metrics.
To further validate the global accuracy of the Kriging surrogates, an independent validation set comprising 50 randomly sampled data points was employed. The design parameters from this set were input into the trained Kriging models, and the resulting predictions were compared against the ground-truth values from the high-fidelity simulations. As illustrated in Figure 7, the relative error between the predicted and ground-truth values for all performance metrics remains within ±5%.
To identify the key driving factors in the optimization process and elucidate the trade-offs among performance metrics, this study employs the constructed high-fidelity surrogate model. The surrogate provides an explicit mapping between the design variables and motor performance, thereby enabling effective characterization of the global response across the entire design space.
Figure 8 presents the results of a global sensitivity analysis based on the SHapley Additive exPlanations (SHAP) method, which quantifies the relative importance of each design variable with respect to the performance metrics. The influence of each variable is shown in bar plots, with color indicating the direction of impact. The variables are ranked by global importance, computed as the mean of the absolute SHAP values across all samples.
The sensitivity analysis shows that motor cost, C S R M , is primarily driven by, and negatively correlated with, the grain aft port radius R r e a r , nozzle divergence half-angle β 2 , and expansion ratio ε . Ballistic performance is strongly influenced by both the forward R f r o n t and aft R r e a r port radius. While thrust F is negatively correlated with both parameters, total impulse I exhibits opposing correlations, being positive with R f r o n t and negative with R r e a r , which highlights a critical trade-off. The safety factor S is subject to complex, coupled effects from a broad set of geometric parameters R r e a r , R f r o n t , a 1 , a 2 , h 2 and δ . Working time t is governed primarily by R f r o n t and, to a lesser extent, by the grain segment lengths L 1 , L 2 , and L f r o n t .
Collectively, these results on varied and interdependent sensitivities provide a quantitative foundation for effective multi-objective optimization.

4.4. The NSGA-III-PHE Algorithm

In multi-objective optimization, the quality of a solution is typically evaluated using the concept of Pareto dominance. A solution a is said to dominate another solution b if and only if it is no worse than b in all objectives and strictly better in at least one objective. This relationship is formally defined as:
i = 1 , 2 , , l , f i X a f i X b j = 1 , 2 , , l , f j X a < f j X b
If these conditions are satisfied, solution a is regarded as the superior solution. A solution that is not dominated by any other solution in the search space is termed a Pareto-optimal solution. The collection of all such solutions forms the Pareto front.
Compared with its predecessor NSGA-II, the NSGA-III algorithm achieves improved population diversity, primarily through the introduction of a reference-point mechanism. However, its performance is often constrained by a conventional reliance on the SBX operator, which exhibits limited recombination capability and search range. Although SBX provides strong exploitation ability, enabling fine-grained exploration near current solutions, its restricted scope hinders effective global search. As a result, the population may converge prematurely, becoming trapped in local optima and thereby reducing overall performance. In contrast, the Differential Evolution (DE) crossover operator has a stronger global search capacity, making it advantageous in the early stages of optimization for expanding the search space and enhancing solution diversity. To address these issues, this study proposes a Phased Hybrid Crossover (PHE) strategy, which dynamically employs DE and SBX operators at different evolutionary stages to balance global exploration and local exploitation effectively.
The division of the evolutionary process into distinct phases is determined by the relationship between the change in population entropy across consecutive generations, Δ e t ,   and a predefined threshold μ [27]. When Δ e t > μ , the algorithm is in the exploratory phase, emphasizing a broad search of the solution space to preserve population diversity. Conversely, when Δ e t μ , the algorithm shifts to the refinement phase, progressively focusing the search around the Pareto front to improve the precision and stability of the solutions. The iteration terminates when Δ e t < μ / 1000   for 50 consecutive generations, or when the number of iterations exceeds the maximum generation limit G m a x . The population entropy e t and the threshold μ are defined as follows:
e t = i = 1 n i n f i l g i n f i i = 1 n m i d i t l g m i d i t
μ = D i n f ¯ l g i n f ¯ D i n f ¯ + 1 N l g i n f ¯ + 1 N
Here, i n f i and m i d i t   denote the interquartile range and the standardized median difference in the population, respectively; D is the dimensionality of the decision space, and N is the population size.
During the initial exploratory phase of evolution, the DE crossover operator is applied. Its vector differential mechanism introduces substantial structural perturbations, which facilitates a more comprehensive exploration of the solution space. The DE operator is formulated as follows:
x i ( t + 1 ) = x i ( 1 , t ) + F × x i ( 2 , t ) x i ( 3 , t )
Simultaneously, to mitigate the known sensitivity of the DE operator to the initial population distribution, a specialized initialization procedure is employed. The population is generated 50 times using the sampling process, and the instance with the maximum mean nearest-neighbor distance is selected to initiate the optimization.
D o ¯ = i = 1 N I d i , m i n D
Here, D o ¯ is the mean nearest-neighbor distance of the trial set, d i , m i n is the Euclidean distance from the i-th sample point to its nearest neighbor, and N I is the number of initial sample points.
Conversely, during the later refinement phase of evolution, the SBX operator is applied. SBX enhances solution refinement and accelerates convergence by effectively exploiting the local information contained within the parent solutions. The SBX operator is defined as:
x i ( 1 , t + 1 ) = x i ( 1 , t ) + x i ( 2 , t ) β x i ( 2 , t ) x i ( 1 , t ) / 2 x i ( 2 , t + 1 ) = x i ( 1 , t ) + x i ( 2 , t ) + β x i ( 2 , t ) x i ( 1 , t ) / 2
Here, t denotes the iteration number, i is the variable index, and β is a dynamic random variable determined by a distribution index for crossover, η c r o s s = 30 .
β = 2 μ i 1 / 1 + η c r o s s ,   μ i 0.5 1 / 2 2 μ i 1 / 1 + η c r o s s , o t h e r w i s e
To validate the effectiveness of the proposed NSGA-III-PHE algorithm, experiments were conducted on standard benchmark functions from the DTLZ test suite. The Inverted Generational Distance (IGD) was used as the primary metric for evaluating algorithm performance. As defined in Equation (37), IGD quantifies both the convergence and diversity of a solution set, with lower values indicating a closer approximation to the true Pareto front.
I G D X , P = y P m i n x X d i s ( x , y ) P
Here, X denotes the set of solutions on the obtained Pareto front, P is a reference set of points uniformly sampled from the true Pareto front, and dis ( x , y ) quantifies the Euclidean distance between a point y P and a point x X .
To ensure a fair comparison, the following parameters were applied to all test problems: population size N = 91 , total number of generations G = 200 , crossover probability p c r o s s = 0.9 , mutation probability p m u t a t e = 0.05 , crossover distribution index η c r o s s = 30 , and mutation distribution index η m u t a t e = 20 . The dimensionalities of the decision and objective spaces are denoted by D and M , respectively. Both the standard NSGA-III and the proposed NSGA-III-PHE algorithms were executed independently 50 times on each test function. The results, summarized in Table 6, are presented as mean (variance) of IGD values over the 50 independent runs. The significance level is set at 5%, with ‘+’ indicating that NSGA-III-PHE is significantly superior to NSGA-III, and ‘≈’ indicating no significant difference.
As shown in Table 6, a statistical comparison at a 5% significance level reveals the following. The NSGA-III-PHE algorithm significantly outperforms the standard NSGA-III on the DTLZ1, DTLZ2, and DTLZ3 test functions [28]. This advantage is particularly pronounced on the highly multi-modal DTLZ3 and DTLZ4 problems, where the mean IGD value achieved by NSGA-III-PHE is an order of magnitude lower. This provides strong evidence of enhanced global exploration capability, attributed to the DE operator employed during the initial evolutionary phase, which effectively enables the population to escape local optima and converge toward the true Pareto front.
Furthermore, the robustness of the proposed algorithm is improved. For test cases where NSGA-III-PHE shows a significant advantage, such as DTLZ2, the corresponding result variance (shown in parentheses) is also substantially lower than that of NSGA-III, indicating both superior performance and greater consistency across multiple runs. On the DTLZ4 and DTLZ5 test functions, which evaluate an algorithm’s ability to handle challenges such as biased or degenerate Pareto fronts, no statistically significant difference was observed. This suggests that the PHE strategy enhances global convergence without compromising other critical aspects of algorithm performance, including diversity maintenance.
Using the 2-objective, 7-variable DTLZ1 test function as an illustrative example, Figure 9 provides a visual comparison of the results. Under the specified conditions, the Pareto front obtained by NSGA-III-PHE more closely approximates the true front than that of the standard NSGA-III, and the solutions are more uniformly distributed along the front. These observations collectively indicate an overall improvement in the performance of the NSGA-III-PHE algorithm for this problem.

4.5. Optimized Results

The NSGA-III-PHE and standard NSGA-III algorithms were applied to solve the multi-objective optimization problem for the motor, with results presented in Figure 10. In this figure, the initial dataset (blue stars) is broadly distributed across the objective space defined by total impulse and specific cost, indicating substantial optimization potential. A comparison of the Pareto fronts generated by the two algorithms shows that the solution set obtained by NSGA-III-PHE (green triangles) completely dominates that of the standard NSGA-III (dark cyan inverted triangles), with its front boundary positioned entirely to the upper-left of the latter. This indicates that, for an equivalent cost, NSGA-III-PHE consistently yields a higher total impulse and, conversely, achieves a lower cost for an equivalent impulse, clearly demonstrating the superior optimization performance of the proposed algorithm. The median point on the NSGA-III-PHE Pareto front was selected as the preferred solution (red dot in the figure). The design parameters for this solution are listed in Table 7, with a predicted specific cost of 23.84 × 10⁴ CNY/kg and a predicted total impulse of 251.53 kN·s.
Based on the design parameters of the preferred solution, a high-fidelity solution was obtained through numerical simulation, with the calculation process illustrated in Figure 11. The results indicate that the maximum ignition strain reaches 11.71%, whereas the maximum curing strain is 7.2%. Strain distribution is primarily concentrated in the fin slots and the central hole. The peak internal ballistic pressure is approximately 17 MPa, slightly higher than that of the initial design, and the working time ranges from 7.5 to 8.0 s.
Table 8 compares the predictions of the surrogate model with the results of this high-fidelity solution. The data show that the relative errors for all parameters are within ±3%, and, more importantly, the errors for the core performance indicators (total impulse and cost) are below 1%. Furthermore, all performance indicators satisfy the overall constraints. These findings further confirm that the constructed surrogate model exhibits excellent reliability and robustness.
Table 9 compares motor performance before and after optimization. After multi-objective optimization, the preferred design exhibits a notable improvement in overall performance: total impulse increased by 4.72%, and cost decreased by 6.73%, while all constraints were satisfied.
Based on the sensitivity analysis presented in Section 4.3, the mechanisms underlying the optimization effects can be further examined from a design perspective. Reducing the rear port radius R rear increases the total impulse I while simultaneously lowering motor cost C S R M . Conversely, increasing the front port radius R front can enhance I , but it also raises costs. Increases in the expansion ratio ε and the nozzle divergence angle β 2 both contribute to reducing motor costs, while their effects on I are relatively minor. Compared with the initial design, the optimized configuration features a smaller R rear , a larger β 2 , and a slightly higher ε , whereas R front changes only marginally due to compensating effects on I and motor cost C S R M . Overall, the optimized design improves total impulse while reducing motor costs, demonstrating strong consistency between the optimization results and the design trends revealed by the sensitivity analysis, thereby mutually validating one another.
5. Conclusions

In this study, a surrogate-based multi-objective optimization method was developed for the optimal design of solid rocket motors. By replacing the high-fidelity numerical model with a surrogate, the method effectively mitigates the low efficiency of heuristic algorithms caused by frequent and computationally expensive model evaluations during the iterative process. Concurrently, a multi-objective optimization algorithm incorporating a Phased Hybrid Operator was proposed to enhance the search performance of NSGA-III. The main conclusions are as follows:
  • In fitting the motor’s performance, the Kriging model demonstrated superior accuracy and generalization capability compared to other surrogate models, including RSM, SVM, and RBF. Except for the test set coefficient of determination (R2 = 0.8882) for the cost, the R2 values for all other performance indicators exceeded 0.9. For 50 test samples, the prediction errors for all performance metrics were within 5%, satisfying the requirements of the conceptual design phase.
  • The high-accuracy surrogate model fitting reveals the intrinsic relationships between design variables and performance indicators, providing insightful guidance for conceptual-level optimization.
  • To address the limited exploration capability of the standard NSGA-III algorithm associated with the use of the SBX operator in the early search stages, a Phased Hybrid Crossover operator was introduced, significantly improving search efficiency. Validation tests on the DTLZ benchmark suite demonstrated that the improved algorithm, NSGA-III-PHE, generally outperforms or matches the performance of the original NSGA-III. In the surrogate-based motor optimization task, the Pareto front obtained by NSGA-III-PHE exhibited higher overall quality than that of NSGA-III.
  • Compared to the initial design, the optimized solution obtained using the proposed method achieved a significant improvement in comprehensive performance while satisfying all constraints, yielding a 4.72% increase in total impulse and a 6.73% reduction in cost.

Author Contributions

Conceptualization, X.F. and R.W.; methodology, X.F., Y.H. and W.Z.; validation, X.F., Y.H. and W.Z.; formal analysis, X.F., Y.H. and W.H.; investigation, W.Z. and R.W.; resources, F.B., X.H. and R.W.; data curation, X.F. and Y.H.; writing—original draft preparation, X.F.; writing—review and editing, R.W., X.H., W.H. and F.B.; visualization, X.F. and W.H.; supervision, R.W., L.S. and W.H.; project administration, R.W. All authors have read and agreed to the published version of the manuscript.

Funding

This research was funded by the National Natural Science Foundation of China (No. 52302479).

Data Availability Statement

The original contributions presented in the study are included in the article; further inquiries can be directed to the corresponding author. It can be accessed on GitHub via the following link: https://github.com/fanxinping2025/Multi-Objective-Design-Optimization-of-Solid-Rocket-Motors-via-Surrogate-Modeling.git (accessed on 23 July 2025).

Conflicts of Interest

The authors declare no conflicts of interest.

References

  1. Balesdent, M.; Bérend, N.; Dépincé, P.; Chriette, A. A survey of multidisciplinary design optimization methods in launch vehicle design. Struct. Multidiscip. Optim. 2012, 45, 619–642. [Google Scholar] [CrossRef]
  2. Martins, J.R.R.A.; Lambe, A.B. Multidisciplinary design optimization: A survey of architectures. AIAA J. 2013, 51, 2049–2075. [Google Scholar] [CrossRef]
  3. American Institute of Aeronautics and Astronautics Technical Committee on Multidisciplinary Design Optimization. Current State of the Art on Multidisciplinary Design Optimization; AIAA: Washington, DC, USA, 1991; pp. 1–50. [Google Scholar]
  4. Lincoln, R.; Weaver, P.; Pirrera, A.; Groh, R.M. Optimisation of Imperfection-Insensitive Continuous Tow Sheared Rocket Launch Structures. In Proceedings of the AIAA Scitech 2021 Forum, Virtual Event, 11–21 January 2021. [Google Scholar]
  5. Chen, L.B.; Zhao, H.C. Climb Trajectory Optimization of AAM with Dual-Pulse Motor Based on Particle Swarm Optimization. J. Ordnance Equip. Eng. 2021, 42, 57–63. [Google Scholar]
  6. Yu, L.F.; Ren, Q.B.; Zhang, A.H.; Song, X.Y. Simulation analysis and optimization design of domestic T800 carbon fiber composite case dome of a large-scale SRM. J. Propul. Technol. 2023, 46, 611–620. [Google Scholar]
  7. Araújo, P.P.B.; Tanaka, R.Y.; Silva, C.A.; Passaro, A.; Toro, P.G.P. Multi-objective optimization of a hypersonic airbreathing vehicle. Phys. Fluids 2024, 36, 026120. [Google Scholar] [CrossRef]
  8. Yu, N.; Li, T.; He, H.; Zhao, Y. Multi-objective optimization of thrust control strategies for electric pump-fed rocket engines. Acta Astronaut. 2025, 237, 243–253. [Google Scholar] [CrossRef]
  9. Ma, L.; Zou, D. An Improved NSGA-III with Hybrid Crossover Operator for Multi-Objective Optimization of Complex Combined Cooling, Heating, and Power Systems. Energy Sci. Eng. 2025, 13, 1509–1543. [Google Scholar] [CrossRef]
  10. Mancini, L.; Lucchese, L.; Saltari, F.; Mastroddi, F.; Neri, A. Surrogate finite-element modelling for launch vehicle multidisciplinary optimization. In Proceedings of the AIAA SCITECH 2022 Forum, San Diego, CA, USA, 3–7 January 2022. [Google Scholar]
  11. Wu, Z.; Wang, D.; Zhang, W.; Patrick, O.N.; Fei, Y. Solid-rocket-motor performance-matching design framework. J. Spacecr. Rocket. 2017, 54, 698–707. [Google Scholar]
  12. Wen, Q.; Yang, J.W.; Wu, Z.P. An approximation modeling method of launch vehicles improved by fast cross-validation. Acta Aeronaut. Astronaut. Sin. 2022, 43, 225967. [Google Scholar]
  13. Gao, J.W.; Ma, S.C.; Peng, B.; Wu, Z.P.; Zhang, W.H. Solid rocket motor optimization design driven by pre-trained models. J. Propul. Technol. 2024, 45, 16–24. [Google Scholar]
  14. Li, W.T.; Li, W.B.; He, Y.Q.; Liang, G.Z. Reverse Design of Solid Propellant Grain for a Performance-Matching Goal: Shape Optimization via Evolutionary Neural Network. Aerospace 2022, 9, 552. [Google Scholar] [CrossRef]
  15. Li, W.T.; He, Y.Q.; Li, W.B.; Zhang, Y.Y.; Liang, G.Z. 3D grain reverse design and shape optimization for solid rocket motor. Acta Aeronaut. Astronaut. Sin. 2024, 45, 529089. [Google Scholar]
  16. Li, W.T.; Li, W.B.; He, Y.Q.; Liang, G.Z. Multi-Objective Reverse Design and Pattern Analysis of Solid Propellant Grains. AIAA J. 2024, 62, 3914–3931. [Google Scholar] [CrossRef]
  17. Rohini, D.; Sasikumar, C.; Samiyappan, P.; Dakshinamurthy, B.; Koppula, N. Design & analysis of solid rocket using open rocket software. Mater. Today Proc. 2022, 64, 425–430. [Google Scholar]
  18. Zhang, Y.Y.; He, Y.Q.; Li, W.T.; Liang, G.Z. Parameter-driven assembly model design of solid rocket motors based on Pro/E. J. Solid Rocket Technol. 2023, 46, 653–662. [Google Scholar]
  19. Deng, Y.M.; Wang, Y.T.; Hui, W.H. Quick calculation method of viscoelastic charge under temperature shock. J. Solid Rocket Technol. 2021, 44, 9. [Google Scholar]
  20. Miao, Q.W.; Shen, Z.B.; Cui, Z.X.; Cui, H.R. Optimal design of curing/pressure of solid rocket motor. J. Propul. Technol. 2022, 45, 589–593. [Google Scholar]
  21. Miao, Q.W.; Shen, Z.B.; Zhang, H.H.; Sun, H.T. Multiobjective Optimization Method of Solid Rocket Motor Finocyl Grain Based on Surrogate Model. Aerospace 2022, 9, 679. [Google Scholar] [CrossRef]
  22. Tong, M.X.; Liu, W.; Ning, L.; Liu, J.J.; Wang, P.F. Research Process and Requirement Analysis on Solid Rocket Booster. Astronaut. Syst. Eng. Technol. 2022, 43, 75–84. [Google Scholar]
  23. Bao, F.T.; Hou, X. Solid Rocket Motor Design; China Astronautic Publishing House: Beijing, China, 2016; pp. 1–83. [Google Scholar]
  24. Williams, M.L.; Landel, R.F.; Ferry, J.D. The Temperature Dependence of Relaxation Mechanisms in Amorphous Polymers and Other Glass-forming Liquids. J. Am. Chem. Soc. 1955, 77, 3701–3707. [Google Scholar] [CrossRef]
  25. Ye, N.H.; Hu, S.Q.; Li, H.Y.; Shi, R.H. Multidisciplinary Design Optimization for Solid Rocket Motor Considering Performance and Cost. J. Propul. Technol. 2022, 43, 201017. [Google Scholar]
  26. Wei, R.; Bao, F.T.; Liu, Y.; Hui, W.H. Combined Acceleration Methods for Solid Rocket Motor Grain Burnback Simulation Based on the Level Set Method. Int. J. Aerosp. Eng. 2018, 2018, 4827810. [Google Scholar] [PubMed]
  27. Geng, H.T.; Dai, Z.B.; Wang, T.L.; Xu, K. Improved NSGA–III Algorithm Based on Reference Point Selection Strategy. Pattern Recognit. Artif. Intell. 2020, 33, 191–201. [Google Scholar]
  28. Deb, K.; Thiele, L.; Laumanns, M.; Zitzler, E. Scalable multi-objective optimization test problems. In Proceedings of the 2002 Congress on Evolutionary Computation, Honolulu, HI, USA, 12–17 May 2002. [Google Scholar]
Figure 1. General schematic of the motor structure: (a) overall assembly; (b) thermal insulation layer and combustion chamber; (c) nozzle structure; (d) finocyl grain configuration.
Aerospace 12 00805 g001
Figure 2. SRM parametric analysis DFD.
Aerospace 12 00805 g002
Figure 3. Flowchart of the burning surface evolution algorithm. Arrows indicate the direction of data flow.
Aerospace 12 00805 g003
Figure 4. Flowchart of the grain structural integrity analysis.
Aerospace 12 00805 g004
Figure 5. Flowchart of the multi-objective optimization methodology.
Aerospace 12 00805 g005
Figure 6. Batch calculation results: (a) distribution of internal ballistic curves; (b) distribution of the cost; (c) distribution of the total impulse.
Aerospace 12 00805 g006
Figure 7. Validation of the Kriging Surrogate Model.
Aerospace 12 00805 g007
Figure 8. Global importance of design variables based on SHAP analysis for five key performance metrics: (a) Cost; (b) Thrust; (c) Total impulse; (d) Safety factor; and (e) Working time.
Aerospace 12 00805 g008
Figure 9. Obtained pareto fronts for the DTLZ1 test problem (2 objectives, 7 variables).
Aerospace 12 00805 g009
Figure 10. Comparison of Pareto Fronts for NSGA-III-PHE and NSGA-III Algorithms.
Aerospace 12 00805 g010
Figure 11. High-fidelity validation of the preferred solution.
Aerospace 12 00805 g011
Table 1. Values and variation ranges of SRM Structure discipline design variables.
ParameterValue/RangeInitial ValueParameterValue/RangeInitial Value
Combustion chamberGrain Fin
D c / ( m m ) 400400 n [5, 7]6
L c / ( m m ) 12001200 a 1 / ( ° ) [30, 70]50
m 22 a 2 / ( ° ) [10, 25]17.5
Grain bore a 3 / ( ° ) [40, 80]60
L 1 / ( m m ) [100, 140]120 h 1 / ( m m ) [80, 100]90
L 2 / ( m m ) [100, 140]120 h 2 / ( m m ) [140, 160]150
L 4 / ( m m ) [100, 140]120 δ / ( m m ) [20, 25]22.5
L 5 / ( m m ) [100, 140]120 L f r o n t / ( m m ) [550, 750]650
R front / ( m m ) [20, 60]40 R 1 / ( m m ) 1010
R rear / ( m m ) [70, 110]90 R 2 / ( m m ) 55
R 3 / ( m m ) 22
Nozzle
β 1 / ( ° ) [40, 50]45 ε [15, 25]20
β 2 / ( ° ) [15, 25]20 D t / ( m m ) 7070
Table 2. Material parameters for the internal ballistics calculation.
ComponentsMaterial ParametersValues
Nozzlelinear ablation rate/(m/s)0.00001
Propellant grain Density / k g / m 3 1780
Burning   Rate   Coefficient / m m / s M P a n 6
Pressure Exponent0.4
Flame Temperature/K2900
Specific Heat Ratio1.2
Characteristic Velocity/(m/s)1500
Table 3. Material parameters for the grain structural integrity.
ParametersValues
Possion’s Ratio0.495
Expeansion   Coefficent / K 1 9.5 × 10⁻⁵
Elastic   Modulus / M P a Prony series
Table 4. The first 10 orders of the Prony series.
E i τ i
0.5769955110.001
0.174672670.01
0.0876024150.1
0.0568581171
0.03855390910
0.018940035100
0.0143890361000
0.01133430310,000
0.013055182100,000
Table 5. Fitting accuracy of various surrogate models.
SVRRBFKrigingSecond-Order RSM
TrainTestTrainTestTrainTestTrainTest
I 0.96990.94710.95000.96220.98400.97580.99760.6370
C S R M 0.69880.91710.66990.86030.99270.88820.9625−9.5134
S 0.96880.90690.90490.91440.99950.94140.9964−0.2222
η 0.99130.96810.98420.98300.99850.99780.99980.9716
r p 0.97580.91400.94430.92670.97860.96910.99800.7149
r D 0.99050.95940.97990.97731.00000.98670.99930.8568
F 0.97000.91920.93070.92700.97050.95030.99670.3842
t 0.97570.89970.93350.92640.94250.94230.99540.0540
J 0.99060.96400.96740.96770.99990.99820.99990.9896
L 0.98800.95400.96850.95880.99260.98690.99910.7362
Table 6. IGD performance comparison of NSGA-III-PHE and NSGA-III on DTLZ test functions.
IDTest FunctionMDEvaluationNSGA-III-PHENSGA-III
1DTLZ127+0.2471 (0.2731)1.3039 (0.9244)
2DTLZ137+0.1004 (0.1323)0.9103 (0.7102)
3DTLZ2413+0.1547 (0.0061)2.5038 (1.2777)
4DTLZ3413+0.4849 (0.4376)2.4716 (1.1986)
5DTLZ44130.7878 (0.0618)0.7724 (0.0073)
6DTLZ5370.3030 (0.0195)0.3081 (0.0217)
Table 7. Values of preferred solution design variables.
ParametersPreferred SolutionParametersPreferred Solution
Combustion chamberGrain Fin
D c / ( m m ) 400 n 7
L c / ( m m ) 1200 a 1 / ( ° ) 69.98
m 2 a 2 / ( ° ) 25.00
Grain bore a 3 / ( ° ) 69.23
L 1 / ( m m ) 127.00 h 1 / ( m m ) 99.99
L 2 / ( m m ) 100.02 h 2 / ( m m ) 152.09
L 4 / ( m m ) 128.77 δ / ( m m ) 30.00
L 5 / ( m m ) 100.00 L f r o n t / ( m m ) 550.00
R front / ( m m ) 36.65 R 1 / ( m m ) 10
R rear / ( m m ) 70.00 R 2 / ( m m ) 5
R 3 / ( m m ) 2
Nozzle
β 1 / ( ° ) 40.00 ε 20.58
β 2 / ( ° ) 24.91 D t / ( m m ) 70
Table 8. Comparison between high-fidelity simulation results and surrogate model predictions.
Actual Predict Relative   Error / %
I / k N · s 250.26251.530.51
C S R M / 10 4 C N Y / k g 23.6923.840.63
J 0.25000.24412.36
η 0.89920.89240.76
r p 0.72820.74282.01
r D 0.80200.79161.30
F / ( k N ) 216.28220.421.91
t / ( s ) 8.48858.49430.58
S 1.82401.82300.05
L / ( m m ) 321.92315.901.87
Table 9. Performance comparison of the initial and preferred solutions.
Initial SolutionPreferred Solution Improvement   ( % )
I / k N · s 238.99250.264.72
C S R M / 10 4 C N Y / k g 25.4023.696.73
Disclaimer/Publisher’s Note: The statements, opinions and data contained in all publications are solely those of the individual author(s) and contributor(s) and not of MDPI and/or the editor(s). MDPI and/or the editor(s) disclaim responsibility for any injury to people or property resulting from any ideas, methods, instructions or products referred to in the content.