2.3.1. Waypoint Suitability Identification
To identify suitable low-altitude transport nodes, this study adopts a scenario-oriented evaluation framework aligned with the functional requirements of regional low-altitude applications [
42]. A two-tier waypoint system is introduced [
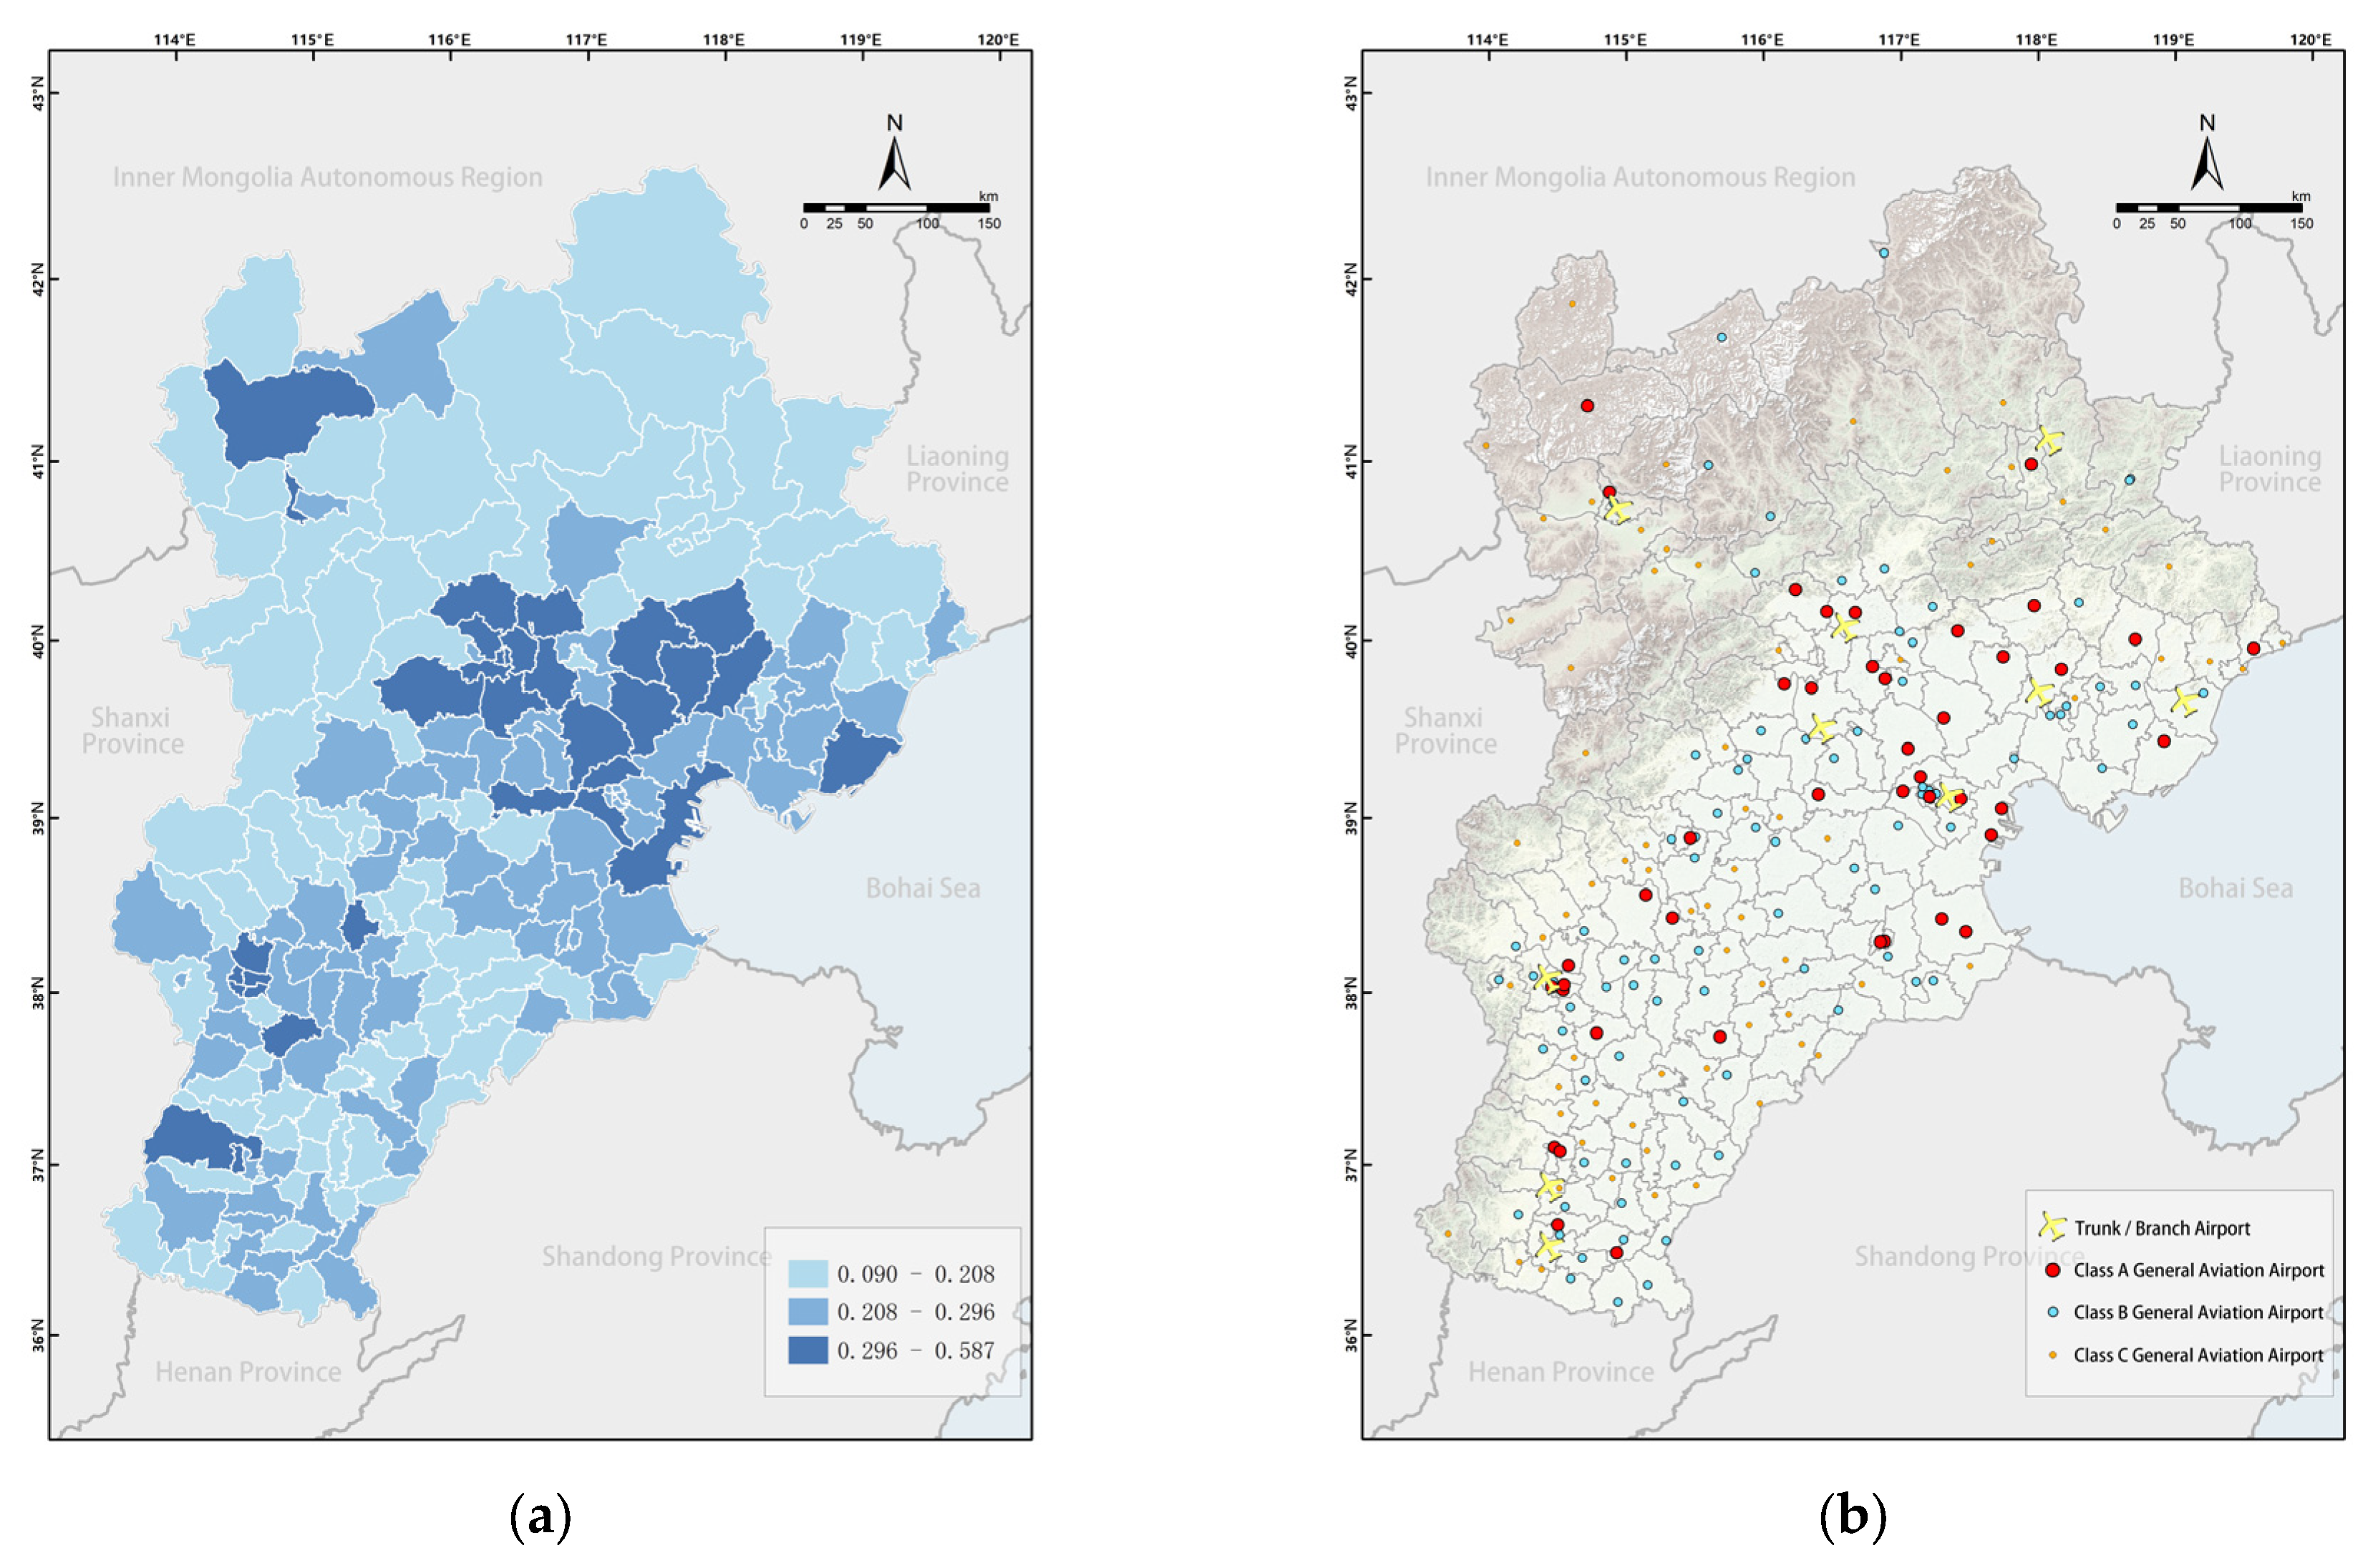
43], comprising (1) district-level and county-level GA airports and (2) township-level large-scale vertiport sites (broadly referring to UAV or eVTOL landing and takeoff locations).
Accordingly, two independent but parallel indicator systems are designed to evaluate the suitability of each node type. Drawing upon the 2024 White Paper on Low-Altitude Economy Scenarios [
44], a hierarchical and function-oriented structure is established, encompassing six primary indicator categories for both tiers—namely, population size, traffic accessibility, industrial support capacity, tourism attractiveness, logistics connectivity, and disaster response capacity. Due to differences in functional scale and infrastructure requirements, the evaluation framework comprises 21 indicators for county-level GA airports and 14 for township-level vertiports.
The Analytic Hierarchy Process (AHP), combined with expert judgment, was used to determine the relative weights of each evaluation indicator, ensuring methodological robustness and transparency (see
Table 2 and
Table 3). The panel of experts comprised university professors with academic expertise in territorial spatial planning, transportation systems, and aviation. Furthermore, they all conducted independent weighting assessments, thereby avoiding group polarization effects. Both indicator hierarchies passed the consistency test, with consistency ratios (CRs) below 0.1, confirming the logical coherence and reliability of the pairwise comparisons.
All input data were standardized and normalized using ArcGIS 10.8 to ensure comparability across heterogeneous units and scales. The final suitability index P was calculated through a weighted summation model:
where
is the overall suitability index,
denotes the standardized score of the i-th indicator,
represents the corresponding weight, and n is the total number of indicators.
A higher suitability score denotes a stronger potential for node deployment in the corresponding administrative unit. Finally, based on the Natural Breaks (Jenks) classification method, areas falling within the top two suitability classes are designated as Class A and Class B candidate regions for node development and serve as the basis for route network design.
To quantify the sensitivity of the overall scores to individual indicator groups, a leave-one-group-out sensitivity test was performed. As a case study, the traffic-accessibility indicators were excluded, and the node suitability rankings were recomputed. The revised ranks were compared with the baseline (including all indicators) using the Spearman rank-order correlation coefficient (ρ) and the top 20 overlap ratio. A Spearman ρ > 0.90 and a top 20 overlap ≥ 80% suggest negligible dependence on any single indicator group, corroborating the robustness and validity of the proposed framework.
To enhance network completeness, spatial equity, and real-world implementability, the site selection strategy for district-level and county-level GA airports was refined in two structured stages: (1) retaining high-suitability existing nodes, and (2) supplementing them according to regional accessibility needs.
In the first stage, all administrative districts currently hosting operational GA airports with a suitability index of 0.25 or higher were designated as Class A development zones. Remaining districts with existing airports—but lower suitability scores—were classified as Class B, leveraging prior infrastructure investments. Concurrently, six Beijing districts were excluded from node designation to comply with national low-altitude airspace restrictions, aligning with air safety regulations and central policy directives.
In the second stage, to promote regional balance, the framework ensures that each prefecture-level city includes at least one Class A node—either newly designated or upgraded—within its municipal center. This guarantees foundational LAT coverage, extends the operational reach of RAM services, and addresses spatial gaps arising from uneven economic development.
Collectively, these adjustments rectify mismatches stemming from economic and infrastructural disparities, eliminate network “blind spots” in underserved areas, and create a balanced, resilient LAT system for the BTH region.
2.3.2. Route Construction and Optimization
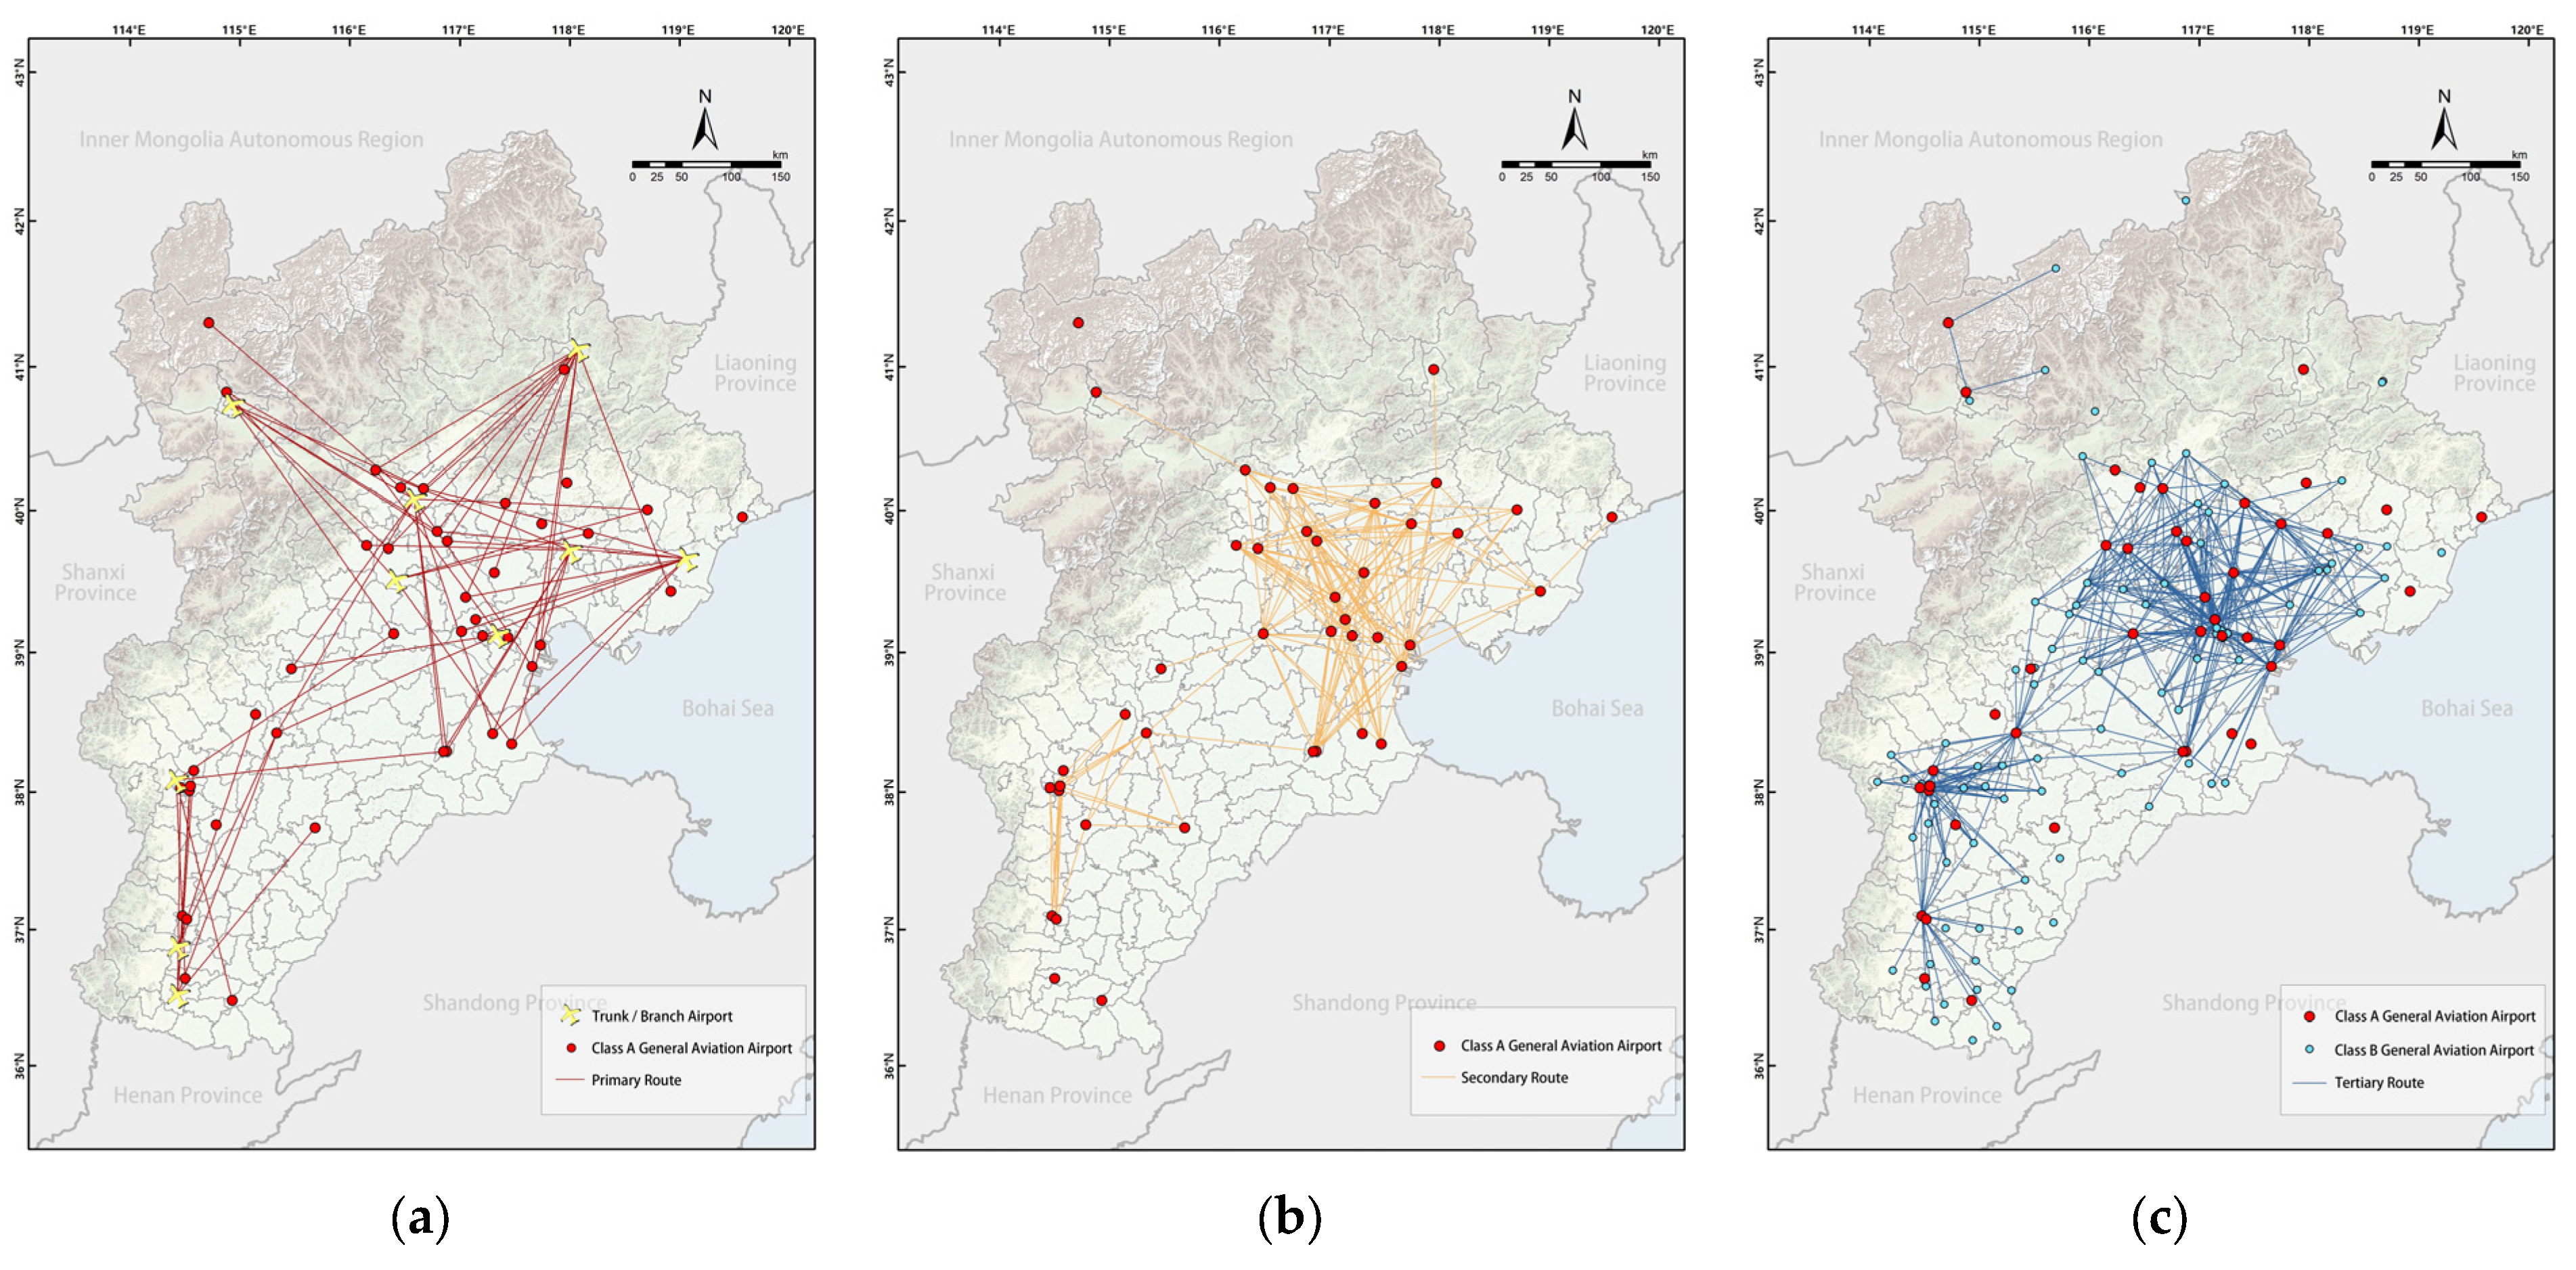
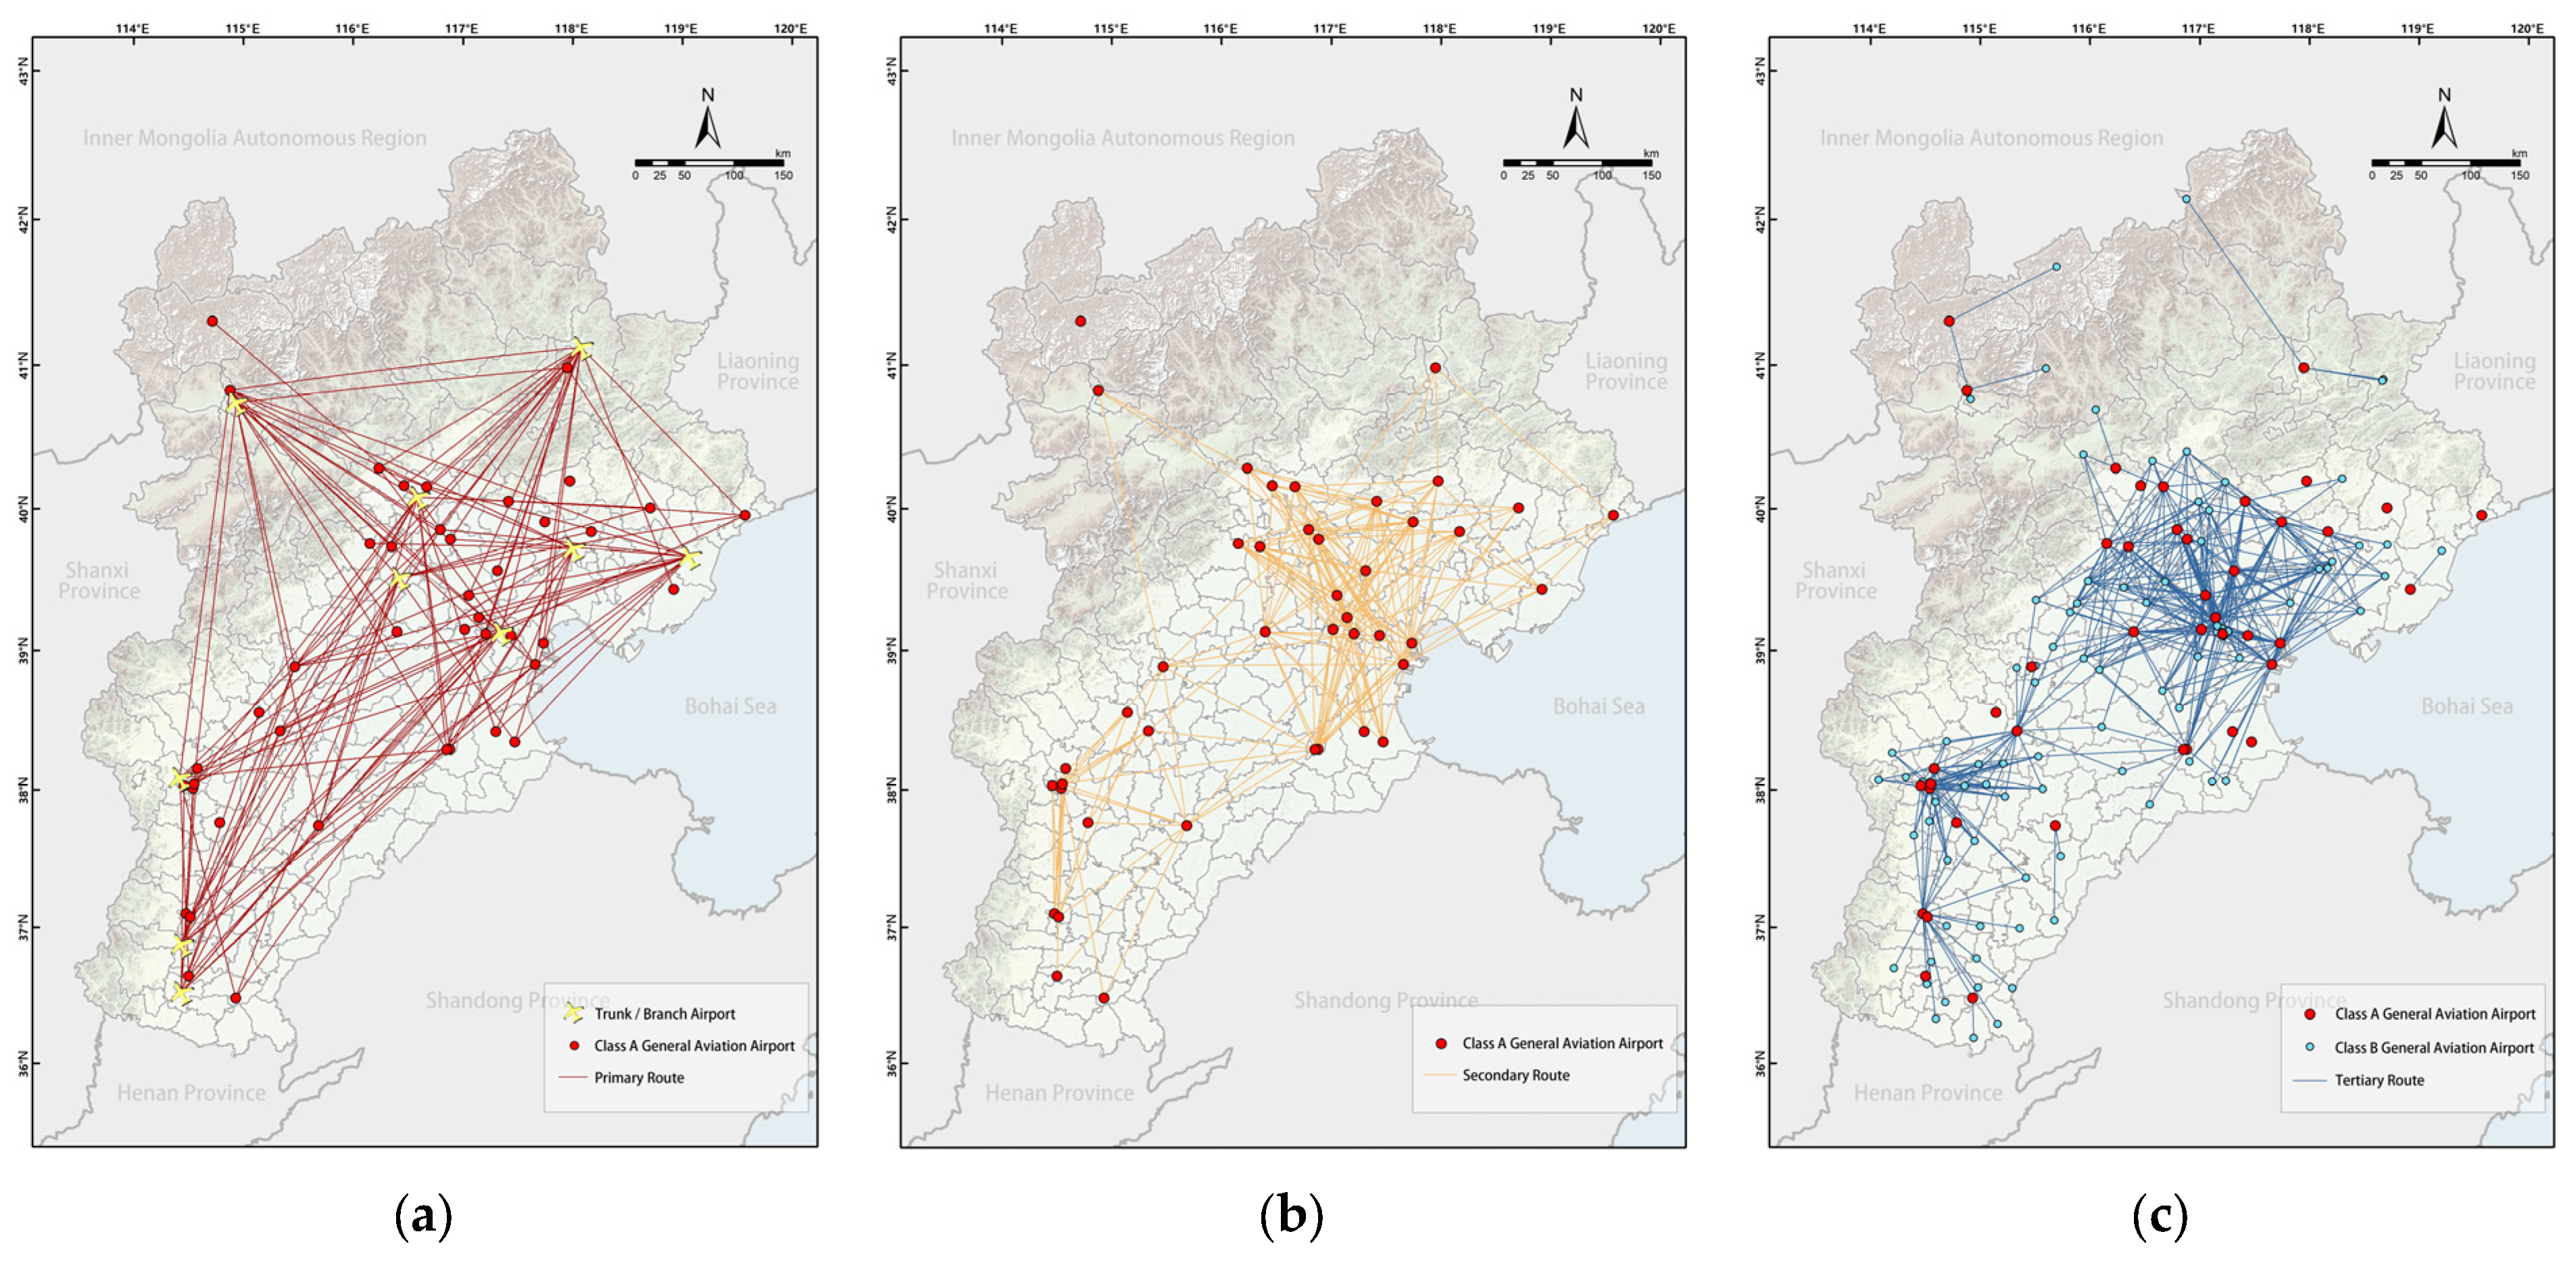
To accommodate the heterogeneous spatial scale and functional hierarchy of low-altitude transport in the BTH region, this study constructs a hierarchical routing system aligned with its multi-tiered hub architecture. Network nodes are defined as trunk and branch airports, Class A GA airports, and Class B GA airports.
A three-level LAT route network is developed, structured around a “backbone–hub–terminal” connectivity paradigm. Specifically, primary routes support long-distance regional commuting, secondary routes enable intra-agglomeration connectivity among hub cities, and tertiary routes ensure last-mile access to peripheral or lower-tier nodes [
45].
Drawing on established aircraft performance metrics (
Table 4) [
46], technical constraints—including effective cruising ranges and functional roles—are defined for each route level (
Table 5). These thresholds provide a foundational basis for the spatial configuration of a scalable, operationally resilient low-altitude route system across the BTH region.
The gravity model, a canonical framework for analyzing spatial interactions, has been widely applied to the estimation of transport flows and the assessment of inter-node connectivity [
47]. In this study, the potential strength of links between LAT nodes is modeled as a function of nodal attractiveness and spatial separation. The suitability index of each node serves as the attractiveness term, while spatial impedance is represented by a squared-distance decay function (β = 2). This conventional specification ensures physical interpretability and mitigates risks of overfitting [
48].
The suitability index of each node is adopted as the core parameter of attraction. A distance decay function is introduced to construct the route scoring model as follows:
where
represents the interaction score between the i node and j node,
and
denote the suitability indices of the respective nodes, and
is the spatial distance between them.
Based on the calculated interaction scores, all potential routes are ranked and grouped into ten classes using the Natural Breaks (Jenks) classification method. A hierarchical screening strategy is then applied: primary routes retain segments from the top three classes, secondary routes retain those within the top five, and tertiary routes retain those within the top seven. This process eliminates inefficient or redundant segments and establishes an initial three-level low-altitude air route network that balances operational efficiency with spatial coverage.
Although the gravity model provides a robust framework for estimating potential route connections, it tends to introduce structural imbalances in regions with significant economic disparities. This often results in an overconcentration of routes in economically advanced areas and the neglect of less-developed regions. To address these limitations, a multi-step correction mechanism is introduced to enhance accessibility equity, promote regional coordination, and align the route structure with broader policy objectives.
For primary routes, which constitute the backbone of the network, all trunk and branch airports are required to maintain direct connections to Class A GA airports located in municipal centers, in addition to satisfying technical distance constraints. This ensures that regional core nodes remain efficiently accessible and enhances the nodal centrality of major urban hubs within the low-altitude transport system. Secondary routes are designed to interconnect Class A GA airports situated in municipal centers, using only flight distance thresholds as the filtering criterion. This approach mitigates the risk of network discontinuity or the isolation of key hubs caused by potential scoring biases in gravity-based modeling.
To ensure inclusivity and structural integrity, all Class B GA airports that remain unconnected after gravity-based screening are manually linked to their nearest Class A counterparts. This guarantees baseline service accessibility, prevents isolated service gaps, and expands the public service reach of the LAT network across the region.
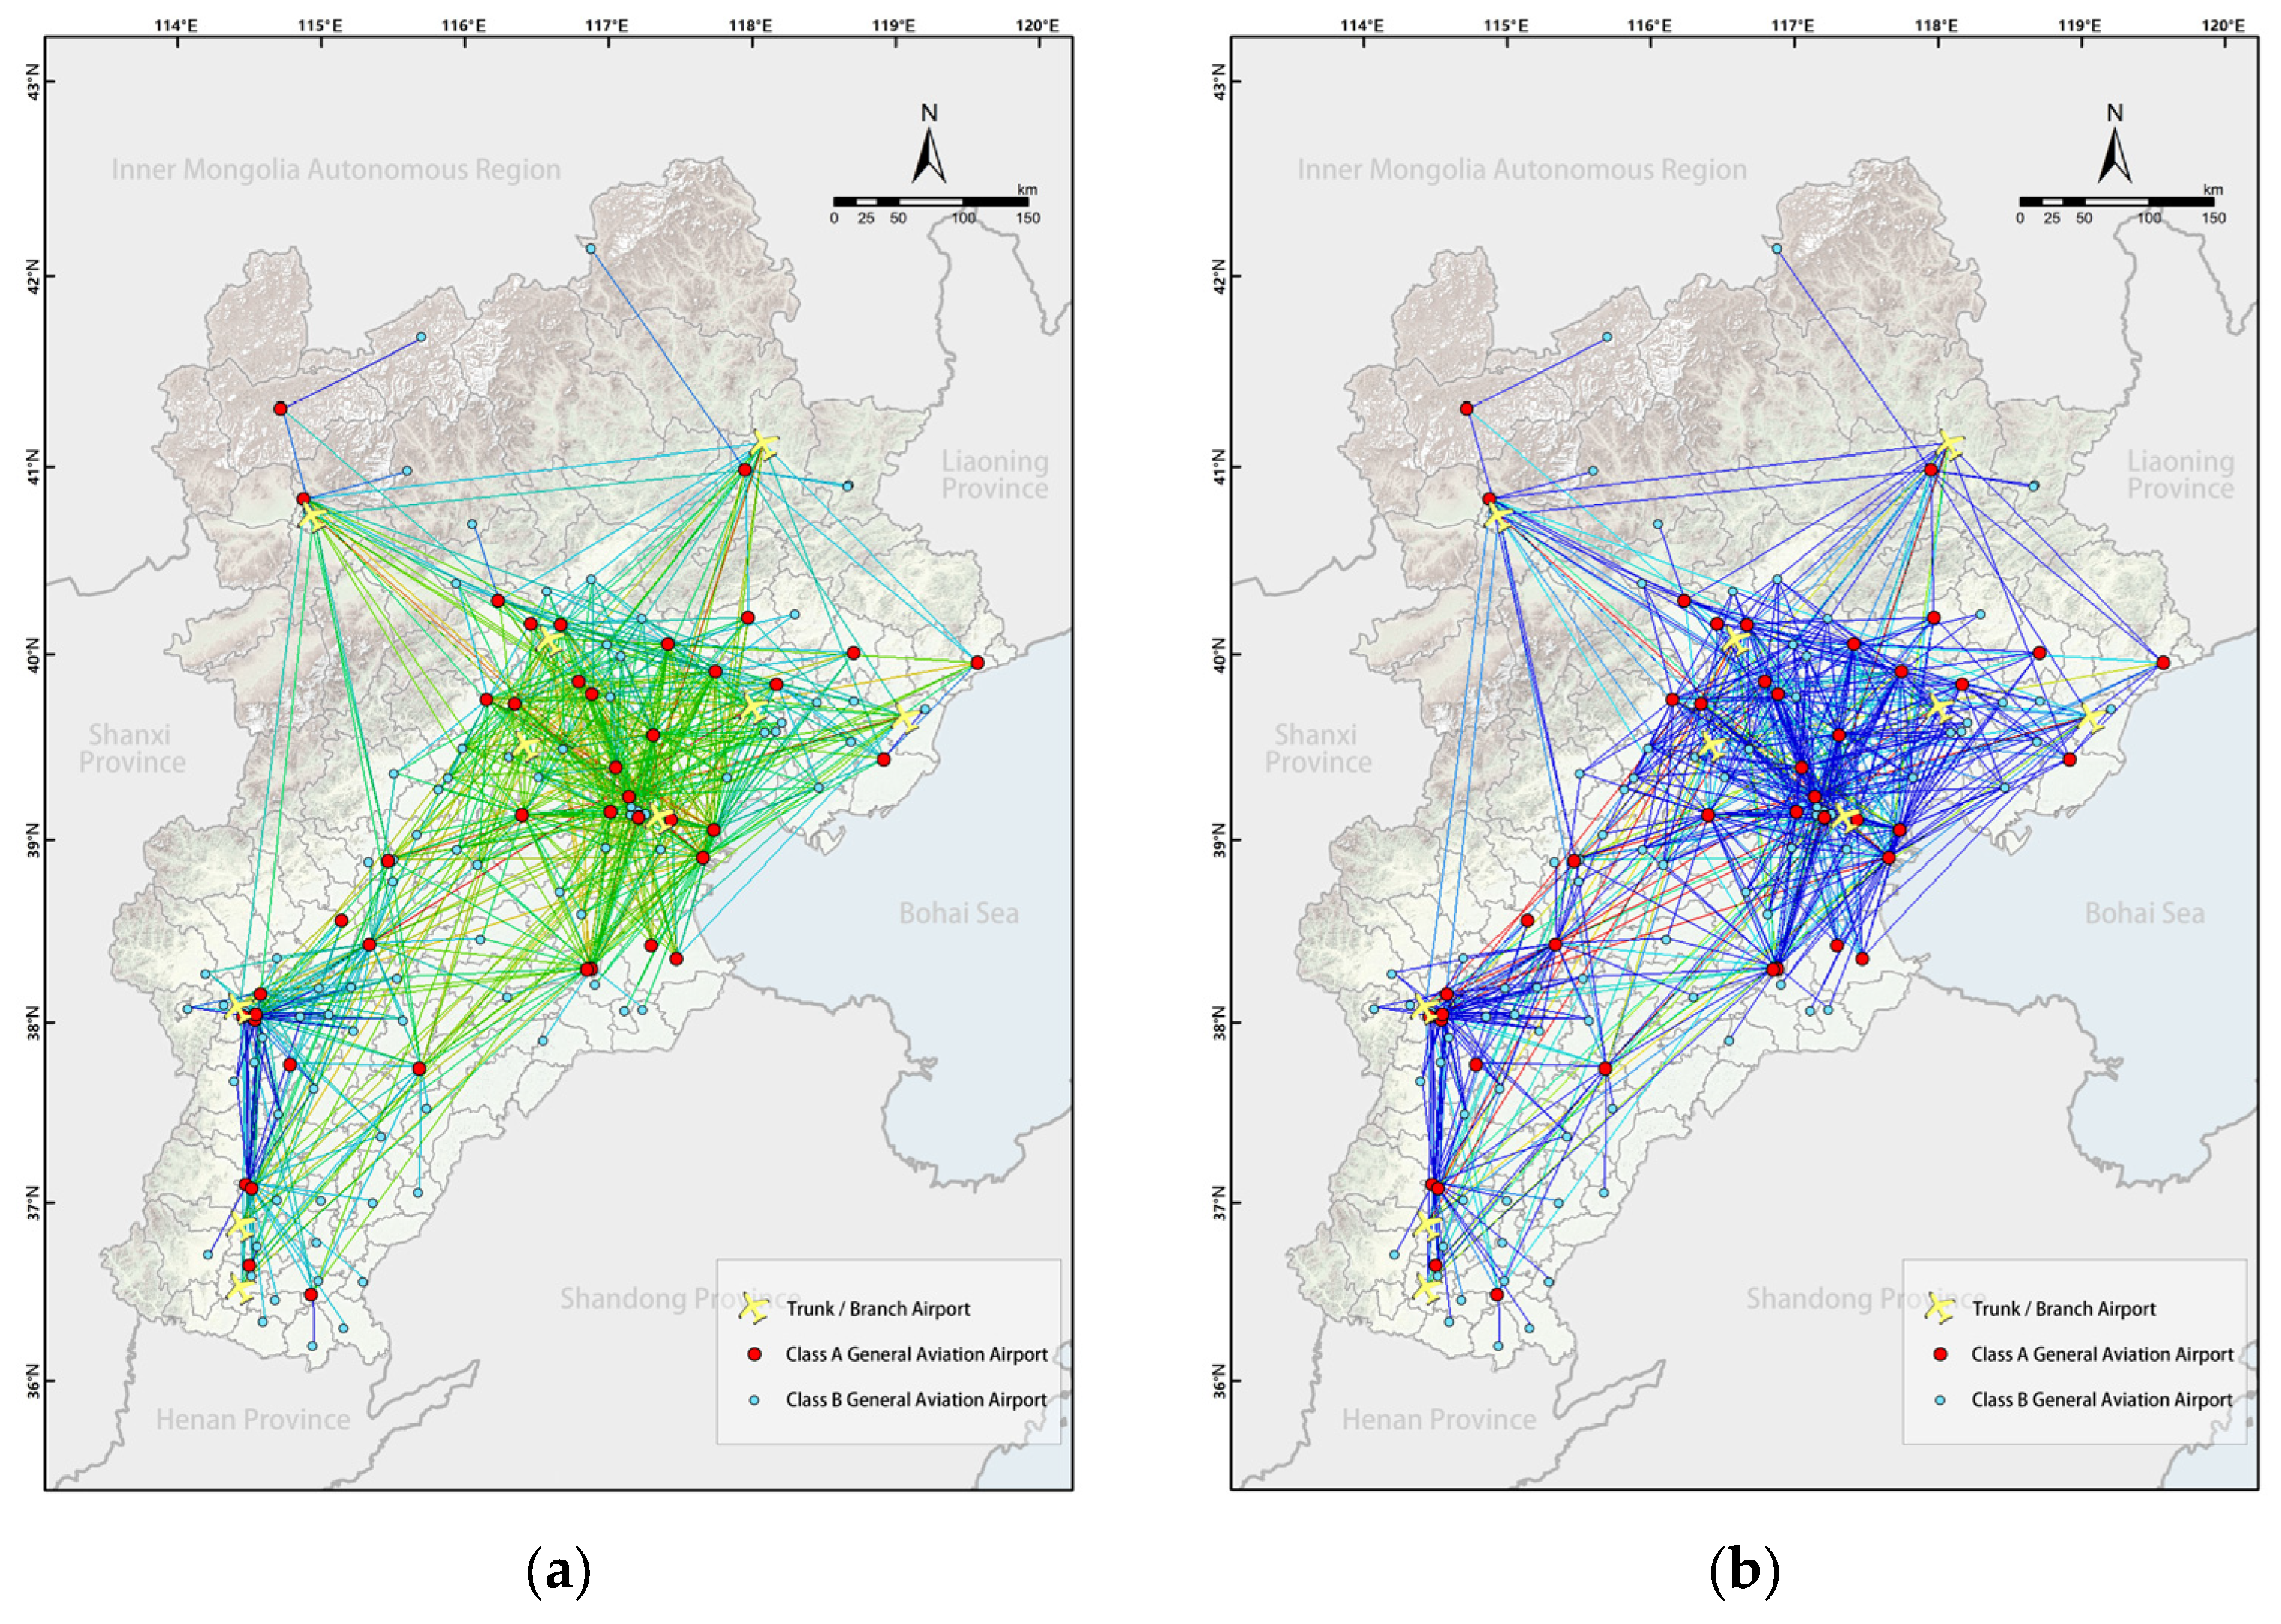
These structural refinements transform the initially gravity-driven, linear network into a multi-nodal, hierarchical low-altitude airspace system that balances operational efficiency, spatial equity, and regional synergy.
2.3.3. Route Network Evaluation
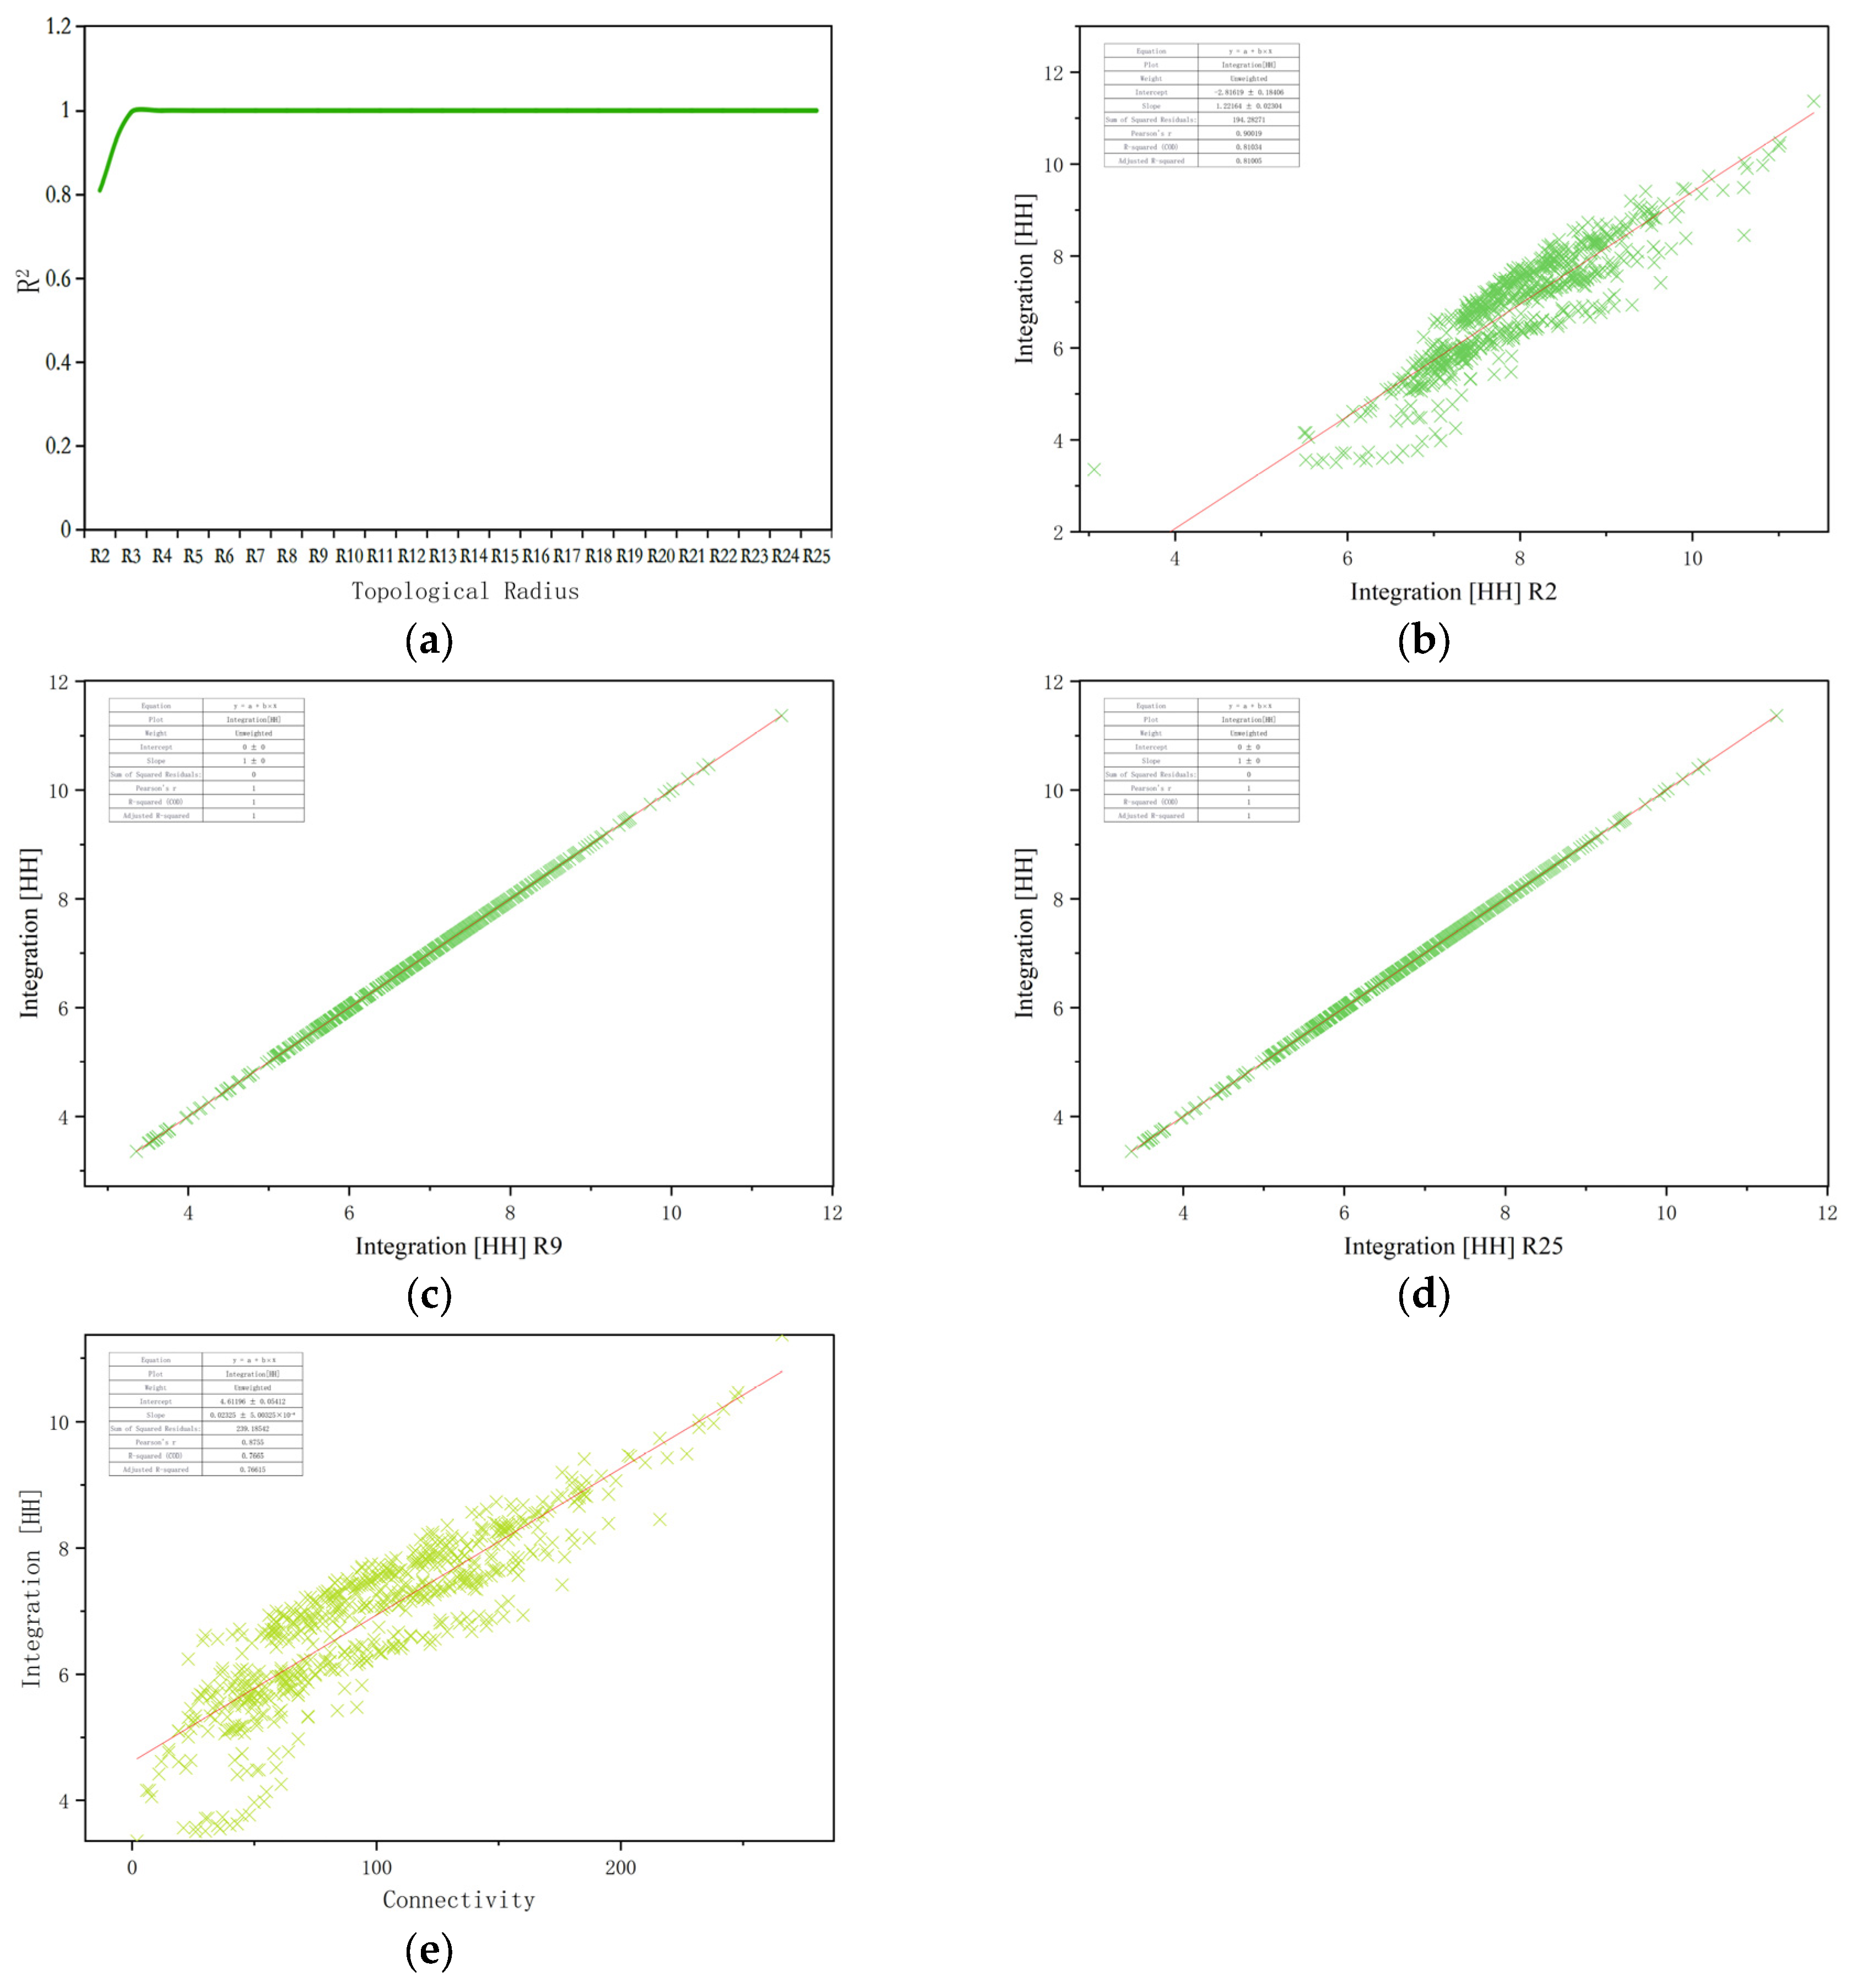
Following the route construction phase, this study evaluates the structural coherence and functional efficiency of the LAT route network using spatial syntax theory. Axial analysis is conducted via Depthmap X 0.8.0 to examine key spatial attributes. The analysis includes core metrics such as global integration, local integration, choice, and connectivity, which collectively assess the network’s accessibility, nodal significance, and spatial configuration. Additionally, two composite metrics—intelligibility and intelligence—are introduced to reflect structural clarity and user navigation efficiency, respectively [
49,
50,
51].
Global integration quantifies the mean topological distance from a given segment to all others in the system; higher values denote better accessibility and overall centrality. Choice (analogous to spatial betweenness) indicates how frequently a segment lies along the shortest paths between other nodes, reflecting potential traffic concentration. Connectivity represents the number of directly linked segments to a given node, serving as a proxy for local accessibility. Local integration measures spatial cohesion within a defined topological radius and is used here to assess localized coverage and service efficiency.
To further interpret the spatial structure, regression analyses are conducted between local and global integration as well as between connectivity and global integration. These relationships inform two derived indicators: intelligence, which evaluates structural regularity and navigational predictability, and intelligibility, which reflects the extent to which users can infer the global spatial configuration from local cues.
High values for both indicators suggest that the proposed LAT network exhibits strong structural efficiency and spatial regularity (high intelligence), as well as high cognitive clarity and navigational intuitiveness (high intelligibility), thereby supporting its seamless integration into broader multimodal transport systems.
Building upon purely topological analysis, weighted betweenness centrality was incorporated to capture the influence of potential traffic flows on hub importance. Flow volumes derived from the gravity model were assigned as edge weights on the axial map, and weighted betweenness was then computed and contrasted with its unweighted counterpart. This comparison highlights convergences and divergences between geometrically prominent and demand-driven nodes, ensuring that structural prominence arising solely from network geometry is not misinterpreted in operational terms [
52].
To evaluate the objectivity and necessity of the proposed rectification rules, network coverage equity is assessed from a population-oriented perspective [
53]. For each node i, accessibility is defined as the sum of edge weights along its incident segments:
where
denotes the accessibility of node i and E represents the set of edges retained after all pruning criteria are applied.
Here,
denotes the resident population used as weights. The population-weighted mean accessibility is then computed as
To further characterize population-level inequities, the population-weighted Gini and Atkinson indices (ε = 0.5, 1.0) are calculated across the node set [
54]. Validation of the rectification rules is conducted through a parallel comparison between two configurations: the baseline network—pruned solely by distance thresholds and gravity scores—and the rectified network, which incorporates multi-criterion adjustment rules. Finally, the top N node overlap ratio (N = 10, 20, 50) is employed to verify that the rectification enhances population-based equity while preserving the backbone structure of the original network.
To evaluate service retention under sudden failures and demand fluctuations, this study applies Monte Carlo-based robustness tests to the established topology with fixed edge weights (
). Two types of disruptions are considered: random removal of nodes and random removal of segments [
55]. For each type, 5%, 10%, and 15% of the elements are deleted, with every fraction replicated 100 times to suppress sampling noise. After each simulation, two performance measures are recorded: connectivity, defined as the relative size of the largest connected component and indicative of network-wide reachability; and service level, measured as the population-weighted mean accessibility to reflect aggregate accessibility from a population perspective. All results are expressed as relative deviations from the baseline network to remove scale effects.
In addition, demand-elasticity scenarios are constructed by uniformly scaling the entire edge-weight matrix by ±50% while keeping the topology unchanged. These experiments capture the network’s sensitivity to atypical passenger and cargo demand, such as seasonal peaks, troughs, or event-driven surges, and they quantify the degree of latent capacity redundancy, thereby providing an empirical basis for assessing resilience in LAT networks.

