Featured Application
The precise identification of vibration modal parameters (natural frequency, mode shape, and damping ratio) of aerospace structures poses a significant challenge for both numerical simulations and physical experiments. Our study puts forward an enhanced identification approach by applying the dynamic mode decomposition (DMD) method, which can markedly enhance the accuracy and applicability of DMD method for operation modal analysis (OMA), thereby laying a solid foundation for the further application of DMD research in the field of modal parameter identification.
Abstract
To address the issue of low accuracy in the dynamic modal decomposition (DMD) method used for operational modal analysis (OMA) under noise conditions of aerospace structures, an enhanced identification approach is proposed in this paper, which integrates subspace orthogonal projection with DMD to better determine the modal properties of linear mechanical systems with noisy observations. Subspace orthogonal projection applied to the Hankelized matrix is utilized for denoising observation signals. Compact singular value decomposition (SVD) is employed on the projection matrix in order to acquire the optimal realization of system matrix. Subsequently, DMD is introduced to reduce the dimensionality of the system matrix and extract the dominant modal features. The effectiveness and practicality of the proposed method are confirmed through numerical and experimental examples. The proposed method demonstrates marginally improved identification accuracy in modal frequency and enhanced performance in damping ratios when compared to representative OMA methods under different white noise conditions.
1. Introduction
The development of an aircraft necessitates a thorough investigation into the dynamic behavior of the structure under the influence of aeroservoelastic forces, and a combination of ground vibration testing and in-flight testing is employed to achieve this objective. Thus, the precise identification of vibration modal parameters (natural frequency, mode shape, and damping ratio) of aerospace structures poses a significant challenge for both numerical simulations and physical experiments. Notwithstanding the current research inclination in system identification towards in-depth exploration of automatic identification [1,2], nonlinearity [3] and time-varying system [4], effective spectral analysis methods persist as the foundation for accurate identification of modal parameters. Operational modal analysis (OMA) [5,6,7], also known as output-only modal analysis, is an identification technique used to determine the modal parameters based on vibration response data collected when a structure is in operation. Since the knowledge of input is assumed to be a realization of random excitation generated by the ambient environment, the determination of a model that conforms to the measured response data is also termed stochastic system identification. In past decades, OMA techniques based on frequency and time domains have become an active subject of modal identification research. Frequency domain methods are based on the output spectrum or half-spectrum matrices estimated from the measured outputs, such as peak picking (PP) [6], frequency domain decomposition (FDD) [8], and enhanced FDD (EFDD) [9]. Regarding the time domain area, the extensively explored methods are essentially based on three types of algorithms and their variants: natural excitation technique (NExT) [10], stochastic subspace identification (SSI) [11,12], and auto-regressive moving average (ARMA) [13].
Dynamic mode decomposition (DMD) is a data-driven spectral analysis method for the Koopman operator, which was first proposed by Schmid [14]. Due to its capacity to extract the inherent dynamic properties from time series, DMD has emerged as the focus of research in data-driven dynamic modeling. Tu et al. [15] established the connections between DMD and the eigensystem realization algorithm (ERA), which is a control–theoretic method for system identification and model reduction, and demonstrated that the low-order linear operators central to each method are related by a similarity transform. Hemati et al. [16] improved the calculation form of standard DMD with a subspace projection step to isolate the source of noise-induced error, and realized the aim of reducing the noise sensitivity of DMD method. In addition to above, DMD has been further investigated in various aspects in recent years, including multi-resolution [17], parallelization [18], sparsity promotion [19], and so on, which has been widely applied in many fields such as fluid dynamics [20] and power system analysis [21].
Since DMD is capable of extracting the dominant features and essential components by reducing the dimensionality for sequential measurements, it is highly appropriate for OMA from a theoretical perspective. Saito et al. [22] discussed the applicability and interpretation of the DMD as a method of experimental modal analysis (EMA), and investigated in-depth the effects of measurement errors, which shows the accuracy of modal parameters is greatly affected by the measurement noise level. Simha et al. [23] advocated for the use of DMD in mechanics and demonstrated the potential in structural health monitoring and surrogate models for nonlinear structures. Guan et al. [24] established the inner connection between modal parameters and eigenvalues and eigenmodes of DMD incorporated into OMA, and subsequently investigated time-varying modal identification with a derived DMD method with weighted recursive strategy. The results indicated that derived DMD has the capability to identify modal properties of slow time-varying structural system with higher computational efficiency and certain limitation in determining the damping ratio accurately due to its complex identification mechanism. Talati et al. [25] applied DMD to the sequential spatiotemporal data of displacement of a vibrating beam in order to identify the dominant frequencies and corresponding mode shapes. The Hankel matrix approach is proposed in DMD to capture the periodic oscillation. Savoeurn et al. [26] estimated the natural frequency and damping ratio of viscoelastic lattice structures based on the Hankel alternative view of Koopman (HAVOK) and DMD. Therefore, the effectiveness and practicality of implementing DMD for modal identification with noisy observations poses considerable challenges.
In this paper, an enhanced identification approach is put forward which integrates subspace orthogonal projection with DMD to more accurately determine the modal properties of linear mechanical systems in the presence of noisy observations. Subspace orthogonal projection applied to the Hankelized matrix is first utilized for denoising observation signals, and compact singular value decomposition (SVD) is employed on the projection matrix to achieve the optimal realization of system matrix. Subsequently, DMD is carried out to reduce the dimensionality of the system matrix and extract the dominant modal parameters. Simulation and experimental examples are utilized to verify the robustness and effectiveness of the proposed method.
This paper is organized as follows. In Section 2, theoretical background of DMD is briefly reviewed and the enhanced identification method is proposed in detail. In Section 3, numerical examples are presented through a classical wing model HA145G. In Section 4, a metal beam vibration experiment is designed to analyze the effectiveness of the proposed method. In the end, conclusions are drawn in Section 5.
2. Background Theory and Identification Methodology
2.1. Dynamic Mode Decomposition
Dynamic mode decomposition (DMD) is a data-driven spectral analysis method for the Koopman operator, which is briefly reviewed in this section. Moreover, more details about the relation between DMD and Koopman operator can be referenced to in [27]. Consider a vibrating structural system, denotes a column vector of measurement signals by sensors at the moment , and an observation time series containing successive snapshots is acquired at a sampling interval , where for . The essence of DMD is determination of a best-fit operator between adjacent observations as:
where reflects the dynamic characteristics of system [28], and can be viewed as the finite dimensional approximation of the Koopman operator [29].
Assume two input matrices and are truncated from original time series . According to Equation (1), there exists the equation as
which leads to
where is the Moore–Penrose pseudoinverse of . Since the scale of measurement data in engineering applications is so large that it is quite difficult to conduct the pseudoinverse of when solving Equation (3), proper orthogonal decomposition (POD) projected DMD is usually applied to reduce the model dimension. Assuming truncated singular value decomposition (truncated SVD) is performed on as follows,
where , , and . The mark * denotes Hermitian transpose of a matrix. Then the low dimensional similar matrix can be expressed as:
According to Equation (3), the similar matrix can be written as
Through similar transformation, the lower dimensional matrix contains main eigenvalues of the original matrix . Suppose that the eigenvalue decomposition of can be taken as:
where is a diagonal matrix constituted of eigenvalues the same with , is the eigenvector matrix. From the similar relation between and in Equation (5), the following expression about eigenvectors can be derived as
where denotes the eigenvector matrix of . Therefore, the eigenvalue decomposition of a high-dimensional matrix can be obtained from a low-dimensional similar matrix through dimensionality reduction.
Based on the vibration theory, the relationship between system pole and eigenvalue can be expressed as
When in a underdamped linear system, the pole can be typically represented by using natural frequency and damping ratio as follows:
where and are a pair of complex conjugate eigenvalues. Hence, undamped natural frequency and modal damping ratio can be computed as:
2.2. Enhanced Subspace DMD for OMA
As is well known, stochasticity is an essential element in physical phenomena and measurement sensing, which implies that the measurement signals are never the “true” physical responses but are accompanied by sampling noises. The accuracy of DMD incorporated into modal identification is notably influenced by the level of measurement noise [22]. Therefore, an enhanced subspace DMD (ES-DMD) for OMA is presented to deal with the white observation noise, which is mainly inspired by subspace DMD in [30].
Let us construct a Hankel matrix of the form through time delay embedding:
where , and represent the past and future snapshots, respectively. Furthermore, there are remarkable improvements in extracting effective modal parameters through the Hankelized approach when the number of sensors is less than the system order in practical applications [15].
Let represent the orthogonal projection of the rows of onto the row space of ,
Then compact SVD is conducted on the projection matrix as follows,
where , , , and . According to the mathematical proofs of subspace DMD in [30], we can extend the formula derivation in the Hankelized form and reach the following conclusion
with probability one, where is an arbitrary unitary matrix. Define and by the first and last rows of , and the equation between matrices and can be expressed as:
After performing Hermitian transpose, Equation (16) is written as
Comparing Equation (17) with Equations (2) and (5), the solution to can be considered as a typical form of DMD calculation with , , which can be solved by the projected DMD in Section 2.1.
Based on the prefacing theoretical description, the complete steps of ES-DMD are shown in Figure 1.
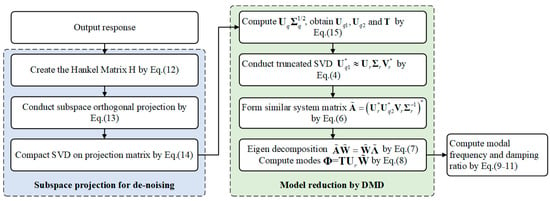
Figure 1.
Flowchart of the proposed ES-DMD method.
3. Numerical Simulation
3.1. Simulation Model Description
The performance of the proposed ES-DMD method is verified in this section using a numerical simulation example of the classical model HA145G for aeroelastic analysis as shown in Figure 2, where the material is magnesium and the structure is fixed supported at nodes 9 and 25.
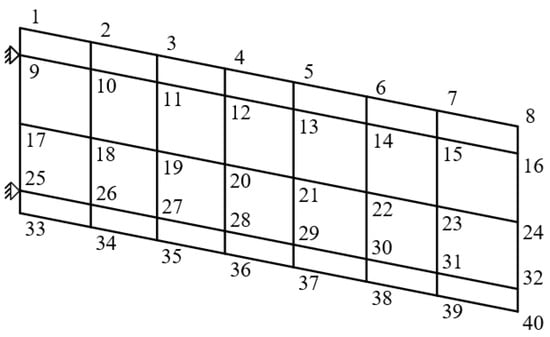
Figure 2.
Model of HA145G.
The fem model is modified by assigning direct damping ratios at each mode and applying external forcing inputs to the surface to generate the time-domain response data. These inputs are characterized as uncorrelated discrete white noise signals sampling at a frequency of 1000 Hz from a zero-mean normal distribution with a standard deviation of 1.0 lbf. Furthermore, the displacement responses of nodes 3, 5, 8, 35, 37, and 40 are extracted and utilized in the subsequent modal parameter identification.
The first three modes (frequency, damping ratio, and shape) are calculated by modal analysis and listed in Table 1 and Figure 3.

Table 1.
The first three modes of HA145G.

Figure 3.
The first three modal shapes of HA145G.
3.2. Identification Results and Analysis
To evaluate the efficacy of the proposed ES-DMD in all aspects, some existing OMA methods (SSI-DATA and DMD) mentioned above are employed for comparative analysis. The identified results of modal frequency, damping ratio, and mode shape of the first three modes are shown in Table 2, Table 3, and Figure 4, respectively.

Table 2.
Identified modal frequencies and percentage errors.

Table 3.
Identified damping ratios and percentage errors.
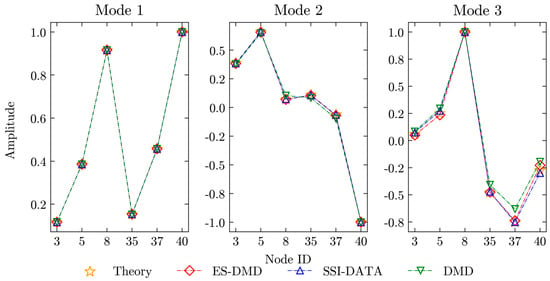
Figure 4.
Identified mode shapes.
As can be seen, the modal frequencies and normalized shapes of the first three modes identified by both methods are captured with good consistency with the theoretical values. Since different signal pre-processing operations are taken in ES-DMD and SSI-DATA, the accuracy of damping ratios by the two subspace-based methods is much better than DMD. The performance of DMD in identifying damping ratios described in Table 3 is not good, which has been mentioned in [24]. Meanwhile, ES-DMD tends to be marginally superior to SSI-DATA in the identification of modal frequencies and damping ratios. Overall, the proposed ES-DMD method demonstrates considerable potential for the identification of modal parameters under noise-free conditions.
Furthermore, the impact of measurement noise on identification performance is examined. Gaussian white noise of different levels is added to the displacement responses for the HA145G model. The mean absolute percentage error (MAPE) of the identified modal parameters is determined by generating 100 samples of noisy datasets at each level, precluding the numerical randomness in the identification process. The formula of MAPE is represented as follows:
where denotes the theoretical value and denotes the identified result.
The identification errors of modal frequencies and damping ratios with different noise levels are depicted in Figure 5 and Figure 6. As can be seen, the errors of modal frequencies at each mode identified through all three methods remain consistently at a relatively low level. With regard to damping ratios, the computational errors of ES-DMD and SSI-DATA tend to increase as the measurement of noise level ascends. ES-DMD exhibits superior accuracy compared to SSI-DATA in the identification of damping ratios. Meanwhile, markedly smaller errors by ES-DMD and SSI-DATA are presented when comparing with DMD in terms of modal frequency and damping ratio.
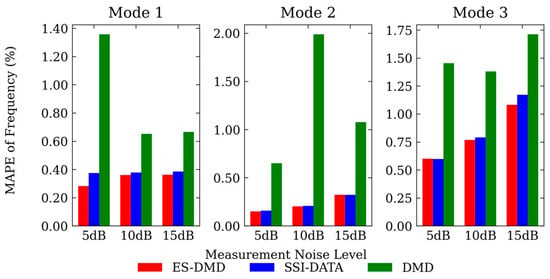
Figure 5.
MAPE of identified modal frequencies with different noise levels.
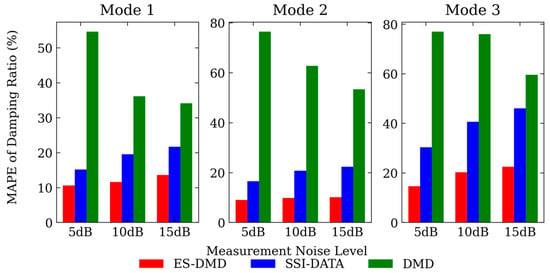
Figure 6.
MAPE of identified damping ratios with different noise levels.
4. Experimental Verification
4.1. Experiment Design and Test
In this section, a metal beam vibration experiment is devised to analyze the practicality of the proposed ES-DMD method. As shown in Figure 7, the experimental system consists of a vibration loading system, a high-precision measurement system, and a data acquisition system. The vibration loading system consists of an electric vibration exciter, a vibration control terminal, and a workbench. The electric vibration exciter is used to apply the vibration excitation load, and the workbench is used to assemble the beam structure with a designed size of 300 mm × 30 mm × 5 mm. The experimental structure is linked to the vibration exciter via a connecting rod and attains the preset stochastic excitation. In addition, the structural displacement response is measured by a non-contact laser displacement meter, which will not produce additional mass. The laser displacement meter is equipped with a measurement range of 50 mm and a measurement accuracy of 1 µm. The DH5922D, dynamic signal experimental and analysis system (Jiangsu Donghua Testing Technology Co., Ltd., Jingjiang, China) is applied for data acquisition, which has multiple channels and can simultaneously collect displacement sensing signals. Based on the preliminary modal analysis, the laser sensor’s measurement point is positioned at the 1/4 location along the beam, and the excitation point from vibration exciter is set at 3/4 position, which can avoid the nodal points of the first three modes in order to acquire displacement responses with high SNR ratio.
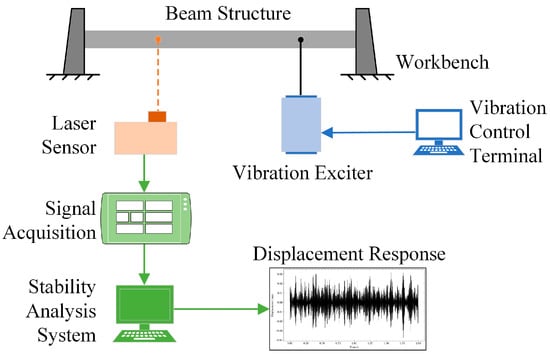
Figure 7.
Schematic diagram of the vibration experimental system.
During the experimental process, the experiment structure is installed vertically and restrained rigidly supported at both ends of the fixture as shown in Figure 8. The foundation excitation is applied to the structure from the electric vibration exciter through a connecting rod. The RMS value of the vibration load spectrum used in this experiment is 1.28 g. The response of the structure is collected by a laser displacement meter and signal acquisition system at a sampling frequency of 5000 Hz as shown in Figure 9.
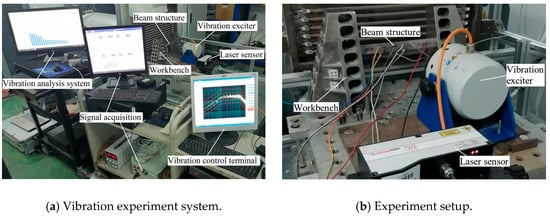
Figure 8.
Vibration experiment setup of the beam structure.
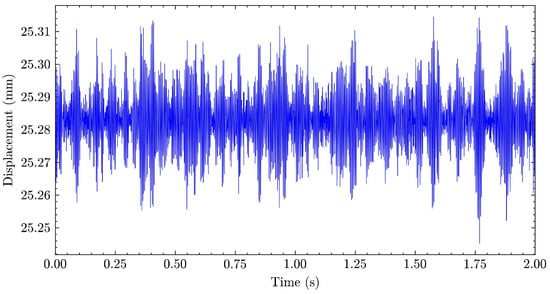
Figure 9.
Displacement response measured from the experimental structure.
4.2. Identification Results and Analysis
The proposed ES-DMD is applied to identify the modal parameters from the experimental displacement response, which is pre-processed by a high-pass filter with cut-off frequency 100 Hz. The stabilization diagram [31] is applied to determine the modal parameters from redundant identified results as shown in Figure 10, and the commonly used stable criterions are:
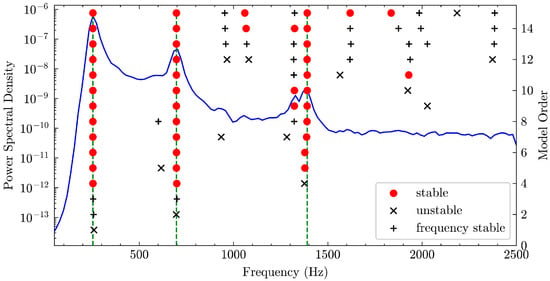
Figure 10.
Stabilization diagram determined by ES-DMD.
In addition, the MAC criterion for mode shape is ignored because there is only one displacement measurement.
As can be observed, the peak information in the power spectral density (PSD) curve of the displacement response is in excellent consistency with the stable modes extracted from the stabilization diagram, which is marked with a green vertical line. Three major peak values correspond to the first three modes of the experimental structure. Hence, this indicates that ES-DMD can effectively identify the modal parameters from the practical engineering response signals with the aid of stabilization diagram technique.
For comparison, the first three modes are identified by all methods, and the obtained modal frequencies and damping ratios are tabulated in Table 4. Based on the identified results, the modal frequencies by three methods exhibit a high degree of consistency. Regarding the damping ratios, the identified results are in good agreement between ES-DMD and SSI-DATA, whereas the DMD method shows limited accuracy.

Table 4.
Comparison in terms of modal frequencies and damping ratios.
5. Conclusions
This paper proposes an enhanced subspace dynamic mode decomposition (ES-DMD) method to extract the system dynamic characteristics in operational modal analysis (OMA) for aerospace structures. The basic theory of DMD for spectral analysis is initially introduced. Then ES-DMD is theoretically proposed. During the identification process, subspace orthogonal projection onto the Hankelized matrix is firstly utilized for denoising observation signals. Subsequently, compact singular value decomposition (SVD) is employed on the projection matrix to achieve the optimal realization of system matrix. Finally, DMD is carried out to reduce the dimensionality of the system matrix and extract the dominant modal parameters.
Numerical simulations with different noise levels of a classical wing model HA145G are carried out to verify the effectiveness and practicability of the proposed method, and the results demonstrate that ES-DMD maintains a superior identification accuracy in dealing with noisy measurement observations compared with SSI-DATA and DMD. The validity of ES-DMD is further verified through the random vibration experiment of a metal beam structure in the end.
However, there are still certain limitations in this method. Redundant false modes will be extracted inevitably as the model order increases, which is commonly observed during the OMA process. Therefore, research on automatic identification necessitates further in-depth investigation. In addition, DMD is a data-driven spectral analysis approach specifically designed for a nonlinear system; further investigation is recommended to explore the potential of integrating DMD for nonlinear modal parameter identification.
In summary, the proposed ES-DMD can markedly enhance the accuracy and applicability of DMD method for OMA, thereby laying a solid foundation for the further application of DMD research in the field of modal parameter identification for aerospace structures. Meanwhile, ES-DMD exhibits superior performance in modal parameters compared with SSI-DATA, a typical OMA approach. However, our study indicates that the identification of modal parameters accurately still remains a challenge when applying ES-DMD to noisy experimental datasets.
Author Contributions
Writing—original draft preparation, H.Z. and R.Z.; writing—review and editing, H.Z. and Y.L.; funding acquisition, Y.L. All authors have read and agreed to the published version of the manuscript.
Funding
This work was supported in part by was supported by the National Natural Science Foundation of China (52175220, 52402446), the Aeronautical Science Foundation of China (2023Z011069001), the Jiangsu Natural Science Foundation (BK20241261), the Southeast University Zhongying Young Scholars Project.
Institutional Review Board Statement
Not applicable.
Informed Consent Statement
Not applicable.
Data Availability Statement
The raw data supporting the conclusions of this article will be made available by the authors on request.
Conflicts of Interest
The authors declare no conflicts of interest.
References
- Jiang, D.; Wang, Y.; Hu, J.; Qian, H.; Zhu, R. Automatic Modal Identification Based on Similarity Filtering and Fuzzy Clustering. J. Vib. Control 2024, 30, 1036–1047. [Google Scholar] [CrossRef]
- Zhu, R.; Jiang, D.; Marchesiello, S.; Anastasio, D.; Zhang, D.; Fei, Q. Automatic Nonlinear Subspace Identification Using Clustering Judgment Based on Similarity Filtering. AIAA J. 2023, 61, 2666–2674. [Google Scholar] [CrossRef]
- Jiang, D.; Li, A.; Wang, Y.; Xie, S.; Cao, Z.; Zhu, R. Integrating Automatic Order Determination with Response Prediction Error Minimization for Nonlinear Subspace Identification in Structural Dynamics. Nonlinear Dyn. 2024, 112, 21881–21900. [Google Scholar] [CrossRef]
- Ma, H.; Tan, Z.; Chen, Q.; Li, Y.; Fei, Q. Output-Only Identification of Time-Varying Structural Modal Parameters under Thermal Environment. Structures 2024, 63, 106338. [Google Scholar] [CrossRef]
- Peeters, B.; De Roeck, G. Stochastic System Identification for Operational Modal Analysis: A Review. J. Dyn. Sys. Meas. Control 2001, 123, 659–667. [Google Scholar] [CrossRef]
- Reynders, E. System Identification Methods for (Operational) Modal Analysis: Review and Comparison. Arch. Comput. Methods Eng. 2012, 19, 51–124. [Google Scholar] [CrossRef]
- Zhou, J.; Kato, B.; Wang, Y. Operational Modal Analysis with Compressed Measurements Based on Prior Information. Measurement 2023, 211, 112644. [Google Scholar] [CrossRef]
- Brincker, R.; Zhang, L.; Andersen, P. Modal Identification from Ambient Responses Using Frequency Domain Decomposition. In Proceedings of the International Modal Analysis Conference (IMAC) (IMAC 18), San Antonio, TX, USA, 7–10 February 2000; pp. 625–630. [Google Scholar]
- Hasan, M.D.A.; Ahmad, Z.A.B.; Leong, M.S.; Hee, L.M. Enhanced Frequency Domain Decomposition Algorithm: A Review of a Recent Development for Unbiased Damping Ratio Estimates. J. Vibroeng. 2018, 20, 1919–1936. [Google Scholar] [CrossRef]
- James, G.H. The Natural Excitation Technique (NExT) for Modal Parameter Extraction from Operating Structures. J. Anal. Exp. Modal Anal. 1995, 10, 260. [Google Scholar]
- Katayama, T. Subspace Methods for System Identification; Springer: Berlin/Heidelberg, Germany, 2005; Volume 1. [Google Scholar]
- Reynders, E.P.B. Uncertainty Quantification in Data-Driven Stochastic Subspace Identification. Mech. Syst. Signal Process. 2021, 151, 107338. [Google Scholar] [CrossRef]
- Bertha, M.; Golinval, J.C. Identification of Non-Stationary Dynamical Systems Using Multivariate ARMA Models. Mech. Syst. Signal Process. 2017, 88, 166–179. [Google Scholar] [CrossRef]
- Schmid, P.J. Dynamic Mode Decomposition of Numerical and Experimental Data. J. Fluid. Mech. 2010, 656, 5–28. [Google Scholar] [CrossRef]
- Tu, J.H.; Rowley, C.W.; Luchtenburg, D.M.; Brunton, S.L.; Kutz, J.N. On Dynamic Mode Decomposition: Theory and Applications. J. Comput. Dyn. 2014, 1, 391–421. [Google Scholar] [CrossRef]
- Hemati, M.S.; Rowley, C.W.; Deem, E.A.; Cattafesta, L.N. De-Biasing the Dynamic Mode Decomposition for Applied Koopman Spectral Analysis of Noisy Datasets. Theor. Comput. Fluid Dyn. 2017, 31, 349–368. [Google Scholar] [CrossRef]
- Kutz, J.N.; Fu, X.; Brunton, S.L. Multiresolution Dynamic Mode Decomposition. SIAM J. Appl. Dyn. Syst. 2016, 15, 713–735. [Google Scholar] [CrossRef]
- Sayadi, T.; Schmid, P.J. Parallel Data-Driven Decomposition Algorithm for Large-Scale Datasets: With Application to Transitional Boundary Layers. Theor. Comput. Fluid Dyn. 2016, 30, 415–428. [Google Scholar] [CrossRef]
- Jovanović, M.R.; Schmid, P.J.; Nichols, J.W. Sparsity-Promoting Dynamic Mode Decomposition. Phys. Fluids 2014, 26, 24103. [Google Scholar] [CrossRef]
- Stankiewicz, W. Recursive Dynamic Mode Decomposition for the Flow around Two Square Cylinders in Tandem Configuration. J. Fluids Struct. 2022, 110, 103515. [Google Scholar] [CrossRef]
- Yang, D.; Wang, B.; Cai, G.; Chen, Z.; Ma, J.; Sun, Z.; Wang, L. Data-Driven Estimation of Inertia for Multiarea Interconnected Power Systems Using Dynamic Mode Decomposition. IEEE Trans. Ind. Inform. 2021, 17, 2686–2695. [Google Scholar] [CrossRef]
- Saito, A.; Kuno, T. Data-Driven Experimental Modal Analysis by Dynamic Mode Decomposition. J. Sound Vib. 2020, 481, 115434. [Google Scholar] [CrossRef]
- Simha, C.H.M.; Biglarbegian, M. A Note on the Use of Dynamic Mode Decomposition in Mechanics. Mech. Res. Commun. 2022, 120, 103848. [Google Scholar] [CrossRef]
- Guan, W.; Dong, L.; Zhang, A.; Cai, Y. Output-Only Modal Identification with Recursive Dynamic Mode Decomposition for Time-Varying Systems. Measurement 2024, 224, 113852. [Google Scholar] [CrossRef]
- Talati, A.; Keshav, M. Identification of Excitation Frequencies of a Vibrating Beam Using Dynamic Mode Decomposition. Mech. Based Des. Struct. Mach. 2024, 53, 839–863. [Google Scholar] [CrossRef]
- Savoeurn, N.; Janya-Anurak, C.; Uthaisangsuk, V. Determination of Dynamic Characteristics of Lattice Structure Using Dynamic Mode Decomposition. J. Appl. Mech. 2024, 91, 071003. [Google Scholar] [CrossRef]
- Rowley, C.W.; Mezić, I.; Bagheri, S.; Schlatter, P.; Henningson, D.S. Spectral Analysis of Nonlinear Flows. J. Fluid Mech. 2009, 641, 115–127. [Google Scholar] [CrossRef]
- Cirillo, G.I.; Mauroy, A.; Renson, L.; Kerschen, G.; Sepulchre, R. A Spectral Characterization of Nonlinear Normal Modes. J. Sound Vib. 2016, 377, 284–301. [Google Scholar] [CrossRef]
- Williams, M.O.; Kevrekidis, I.G.; Rowley, C.W. A Data–Driven Approximation of the Koopman Operator: Extending Dynamic Mode Decomposition. J. Nonlinear Sci. 2015, 25, 1307–1346. [Google Scholar] [CrossRef]
- Takeishi, N.; Kawahara, Y.; Yairi, T. Subspace Dynamic Mode Decomposition for Stochastic Koopman Analysis. Phys. Rev. E 2017, 96, 33310. [Google Scholar] [CrossRef]
- Qin, S.; Kang, J.; Wang, Q. Operational Modal Analysis Based on Subspace Algorithm with an Improved Stabilization Diagram Method. Shock. Vib. 2016, 2016, 7598965. [Google Scholar] [CrossRef]
Disclaimer/Publisher’s Note: The statements, opinions and data contained in all publications are solely those of the individual author(s) and contributor(s) and not of MDPI and/or the editor(s). MDPI and/or the editor(s) disclaim responsibility for any injury to people or property resulting from any ideas, methods, instructions or products referred to in the content. |
© 2025 by the authors. Licensee MDPI, Basel, Switzerland. This article is an open access article distributed under the terms and conditions of the Creative Commons Attribution (CC BY) license (https://creativecommons.org/licenses/by/4.0/).