Article

Suitability Assessment and Route Network Planning for Low-Altitude Transportation in Urban Agglomerations Using Multi-Source Data

School of Architecture and Design, Beijing Jiaotong University, Beijing 100044, China
*
Author to whom correspondence should be addressed.
Aerospace 2025, 12(9), 777; https://doi.org/10.3390/aerospace12090777
Submission received: 16 July 2025 / Revised: 20 August 2025 / Accepted: 26 August 2025 / Published: 28 August 2025
(This article belongs to the Section Air Traffic and Transportation)

Abstract

As low-altitude transportation becomes essential to global integrated transport systems, developing extensive and well-structured networks in urban agglomerations is crucial for fostering regional synergy and enhancing three-dimensional transport. Focusing on the Beijing–Tianjin–Hebei urban agglomeration, this study integrates multi-source data within a three-stage research framework: (1) node suitability assessment, (2) route optimization, and (3) network structure evaluation. It systematically evaluates the suitability of county-level general aviation airports and township-level vertiports. Building on the suitability analysis, a hierarchical route network is constructed using a modified gravity model augmented by spatial correction mechanisms. Finally, spatial syntax analysis, supplemented with equity and robustness assessments, is applied to evaluate network accessibility, topological efficiency, and resilience. The key findings are as follows: (1) The suitability classification identifies 43 Class A, 86 Class B, and 71 Class C general aviation airports, revealing a spatial pattern characterized by higher density in the east, lower density in the west, and a multi-nodal clustering structure. Township-level vertiports markedly increase terminal-node coverage. (2) The optimized hierarchical network includes 114 primary, 180 secondary, and 366 tertiary routes, bridging previous regional connectivity gaps. (3) High values of network integration, choice, spatial intelligibility, and equity-adjusted accessibility indicate robust performance, fairness in service distribution, and resilience under potential disruptions. This study offers a methodological paradigm for the systematic development of low-altitude transport networks and provides valuable references for evidence-based planning of urban agglomeration air mobility systems and the strategic development of regional low-altitude economies.

1. Introduction

In recent years, the U.S. National Aeronautics and Space Administration (NASA) took the lead in 2018 by introducing the concept of Urban Air Mobility (UAM) [1], which was later expanded into the Advanced Air Mobility (AAM) framework. In 2021, the concept of Regional Air Mobility (RAM) was introduced [2], marking the evolution of low-altitude transportation (LAT) systems toward a more systematic and networked structure. This conceptual shift has attracted global attention and has been woven into national strategies worldwide. For example, after launching its unified air traffic management system (U-Space) in 2016, the European Union formulated a four-phase roadmap to guide the sustainable, large-scale deployment of drone services [3]. Meanwhile, countries such as South Korea, Japan, and several Southeast Asian nations have actively promoted low-altitude transport applications in urban commuting, emergency response, and multimodal integration through policy incentives, public engagement, and commercial pilot programs [4,5,6,7].
In China, the term “low-altitude economy” was officially included in the 2024 national government work report as a key driver of “new quality productive forces” [8]. Thereafter, the Ministry of Industry and Information Technology—together with four other ministries—jointly called for integrating low-altitude infrastructure into urban development plans and urged local governments to accelerate airspace liberalization and general aviation network construction [9]. These initiatives have provided clear policy direction and institutional support for the low-altitude economy, facilitating its convergence with advanced manufacturing, diversified services, and other emerging industries [10,11,12]. As a vital component of future three-dimensional integrated transport systems, LAT exhibits significant strategic potential and broad application prospects. LAT relies on civil manned and unmanned aerial vehicles (UAVs) operating within low-altitude airspace, typically defined as below 1000 m above ground level (AGL) and, in some contexts, extending up to 3000 m. LAT is increasingly deployed in urban commuting, logistics, tourism, and emergency services [13]. Within the AAM framework, UAM and RAM correspond to short-range intra-city transport and short- to medium-range inter-regional connectivity, respectively. UAM emphasizes intelligent dispatch and cooperative airspace management to enhance urban operational efficiency and route safety [14], while RAM addresses travel demands within the 80–800 km range by leveraging small airports and next-generation aircraft to establish a highly efficient and convenient regional air transport network [15]. These two modalities are complementary in both functional roles and spatial scales, jointly advancing the three-dimensional and networked development of the LAT system [1,2,16].
In this study, low-altitude transportation (LAT) encompasses both Urban Air Mobility (UAM) and Regional Air Mobility (RAM), encompassing low-altitude operations within urban agglomerations and across regions. In line with national policies, many Chinese provinces and municipalities have initiated comprehensive development plans for general aviation and are carrying out phased pilot projects involving UAV deployment and vertiport construction [17]. At the academic level, the construction of LAT networks has become a rapidly emerging topic at the intersection of urban geographic information science and transportation engineering. Regarding node siting, research has focused on evaluating site service capacity, response time, and spatial coverage. Analytical methods include multi-criteria decision-making (MCDM) models, conditional logit models, and discrete choice models [5,18]. For instance, some studies optimize general aviation infrastructure placement by balancing geospatial distribution, cost-effectiveness, and emergency response efficiency [19,20]. In terms of air route planning, studies generally fall into two categories. The first adopts an accessibility-driven approach that integrates remote-sensing data, infrastructure layers, land-use constraints, and obstacle-avoidance requirements [21,22,23,24]. The second employs optimization algorithms—such as the ant colony algorithm, A* algorithm, and multi-objective programming—to route layout, airspace partitioning, and trajectory design in complex low-altitude environments [25,26,27,28,29,30,31]. A growing body of research also explores integrated UAM-ground operations, aiming to alleviate traffic congestion and resolve last-mile delivery through “ground–air coordination” [32,33,34,35]. Nevertheless, most existing research has been limited to individual cities or specific airport nodes. Systematic planning for low-altitude airspace networks across entire urban agglomerations remains nascent, with few methodologically consistent or regionally adaptive frameworks [36].
Therefore, this study focuses on the Beijing–Tianjin–Hebei (BTH) urban agglomeration and proposes a three-stage analytical framework: waypoint site selection, route planning, and network structure evaluation. By integrating multi-source data—including socioeconomic indicators, land-use data, nighttime light imagery, etc.—this study identifies key LAT nodes and constructs a route network with wide spatial coverage, rational structural hierarchy, and strong systemic resilience. The spatial syntax is employed to assess the topological efficiency and connectivity of the network, providing empirical support for planning a coordinated LAT system and advancing the low-altitude economy within the BTH region.

2. Materials and Methods

2.1. Study Area

The BTH region, in northern China, comprises three provincial-level jurisdictions and covers roughly 216,000 km2, encompassing 199 county-level divisions. As one of China’s foremost urban agglomerations, BTH occupies a central position in the national spatial development strategy (Figure 1).
In recent years, with the low-altitude economy highlighted as a catalyst for “new-quality productive forces,” the governments of Beijing, Tianjin, and Hebei have rolled out targeted policies in succession to open low-altitude airspace and nurture a supportive industrial ecosystem [37,38,39].
As of 2024, the region is home to 37 registered general aviation (GA) airports and 10 trunk/branch airports, placing Beijing second nationally in GA airport count. Although a hub-and-cluster pattern has begun to emerge, LAT development in the region remains nascent [40]. Existing air routes are fragmented, primarily serving isolated use cases and lacking a unified spatial strategy [41]. Key challenges include a limited market scale, low technological maturity, and weak integration with other transport modes. Bridging these gaps requires an integrated, multi-tiered, and resilient LAT network tailored to BTH. Such a system will enhance spatial connectivity, foster coordinated airspace management, and underpin regional high-quality development within a broader three-dimensional transport framework.

2.2. Data Sources

To support the spatial analysis and modeling of the LAT network, a comprehensive set of multi-source geospatial and socioeconomic datasets was compiled and standardized.
Administrative boundary data were obtained from the Ministry of Natural Resources of China. The evaluation model incorporates the following datasets: socioeconomic indicators, nighttime light imagery, road network data, general aviation airport locations, digital elevation models (DEMs), land-use types, point-of-interest (POI) data, UAV no-fly-zone boundaries, population density raster data, office rental levels, and geological hazard maps. Detailed sources are listed in Table 1.
All datasets were georeferenced to district-level administrative boundaries and reprojected using the WGS_1984_World_Mercator coordinate system. Attribute values were aggregated or spatially joined to administrative units as needed, ensuring consistency across spatial layers. These datasets form the foundation for the suitability evaluation, node selection, and network construction procedures described in the following section.

2.3. Research Methods

2.3.1. Waypoint Suitability Identification

  • Indicator System Development
To identify suitable low-altitude transport nodes, this study adopts a scenario-oriented evaluation framework aligned with the functional requirements of regional low-altitude applications [42]. A two-tier waypoint system is introduced [43], comprising (1) district-level and county-level GA airports and (2) township-level large-scale vertiport sites (broadly referring to UAV or eVTOL landing and takeoff locations).
Accordingly, two independent but parallel indicator systems are designed to evaluate the suitability of each node type. Drawing upon the 2024 White Paper on Low-Altitude Economy Scenarios [44], a hierarchical and function-oriented structure is established, encompassing six primary indicator categories for both tiers—namely, population size, traffic accessibility, industrial support capacity, tourism attractiveness, logistics connectivity, and disaster response capacity. Due to differences in functional scale and infrastructure requirements, the evaluation framework comprises 21 indicators for county-level GA airports and 14 for township-level vertiports.
The Analytic Hierarchy Process (AHP), combined with expert judgment, was used to determine the relative weights of each evaluation indicator, ensuring methodological robustness and transparency (see Table 2 and Table 3). The panel of experts comprised university professors with academic expertise in territorial spatial planning, transportation systems, and aviation. Furthermore, they all conducted independent weighting assessments, thereby avoiding group polarization effects. Both indicator hierarchies passed the consistency test, with consistency ratios (CRs) below 0.1, confirming the logical coherence and reliability of the pairwise comparisons.
All input data were standardized and normalized using ArcGIS 10.8 to ensure comparability across heterogeneous units and scales. The final suitability index P was calculated through a weighted summation model:
P = i = 1 n S i × D i
where P is the overall suitability index, S i denotes the standardized score of the i-th indicator, D i represents the corresponding weight, and n is the total number of indicators.
A higher suitability score denotes a stronger potential for node deployment in the corresponding administrative unit. Finally, based on the Natural Breaks (Jenks) classification method, areas falling within the top two suitability classes are designated as Class A and Class B candidate regions for node development and serve as the basis for route network design.
To quantify the sensitivity of the overall scores to individual indicator groups, a leave-one-group-out sensitivity test was performed. As a case study, the traffic-accessibility indicators were excluded, and the node suitability rankings were recomputed. The revised ranks were compared with the baseline (including all indicators) using the Spearman rank-order correlation coefficient (ρ) and the top 20 overlap ratio. A Spearman ρ > 0.90 and a top 20 overlap ≥ 80% suggest negligible dependence on any single indicator group, corroborating the robustness and validity of the proposed framework.
  • Revisions to Site Selection
To enhance network completeness, spatial equity, and real-world implementability, the site selection strategy for district-level and county-level GA airports was refined in two structured stages: (1) retaining high-suitability existing nodes, and (2) supplementing them according to regional accessibility needs.
In the first stage, all administrative districts currently hosting operational GA airports with a suitability index of 0.25 or higher were designated as Class A development zones. Remaining districts with existing airports—but lower suitability scores—were classified as Class B, leveraging prior infrastructure investments. Concurrently, six Beijing districts were excluded from node designation to comply with national low-altitude airspace restrictions, aligning with air safety regulations and central policy directives.
In the second stage, to promote regional balance, the framework ensures that each prefecture-level city includes at least one Class A node—either newly designated or upgraded—within its municipal center. This guarantees foundational LAT coverage, extends the operational reach of RAM services, and addresses spatial gaps arising from uneven economic development.
Collectively, these adjustments rectify mismatches stemming from economic and infrastructural disparities, eliminate network “blind spots” in underserved areas, and create a balanced, resilient LAT system for the BTH region.

2.3.2. Route Construction and Optimization

  • Hierarchical Route Network Design
To accommodate the heterogeneous spatial scale and functional hierarchy of low-altitude transport in the BTH region, this study constructs a hierarchical routing system aligned with its multi-tiered hub architecture. Network nodes are defined as trunk and branch airports, Class A GA airports, and Class B GA airports.
A three-level LAT route network is developed, structured around a “backbone–hub–terminal” connectivity paradigm. Specifically, primary routes support long-distance regional commuting, secondary routes enable intra-agglomeration connectivity among hub cities, and tertiary routes ensure last-mile access to peripheral or lower-tier nodes [45].
Drawing on established aircraft performance metrics (Table 4) [46], technical constraints—including effective cruising ranges and functional roles—are defined for each route level (Table 5). These thresholds provide a foundational basis for the spatial configuration of a scalable, operationally resilient low-altitude route system across the BTH region.
  • Gravity-Model-Based Route Screening
The gravity model, a canonical framework for analyzing spatial interactions, has been widely applied to the estimation of transport flows and the assessment of inter-node connectivity [47]. In this study, the potential strength of links between LAT nodes is modeled as a function of nodal attractiveness and spatial separation. The suitability index of each node serves as the attractiveness term, while spatial impedance is represented by a squared-distance decay function (β = 2). This conventional specification ensures physical interpretability and mitigates risks of overfitting [48].
The suitability index of each node is adopted as the core parameter of attraction. A distance decay function is introduced to construct the route scoring model as follows:
Z i j = P i P j L i j 2
where Z i j represents the interaction score between the i node and j node, P i and P j denote the suitability indices of the respective nodes, and L i j is the spatial distance between them.
Based on the calculated interaction scores, all potential routes are ranked and grouped into ten classes using the Natural Breaks (Jenks) classification method. A hierarchical screening strategy is then applied: primary routes retain segments from the top three classes, secondary routes retain those within the top five, and tertiary routes retain those within the top seven. This process eliminates inefficient or redundant segments and establishes an initial three-level low-altitude air route network that balances operational efficiency with spatial coverage.
  • Route Structure Correction and Enhancement
Although the gravity model provides a robust framework for estimating potential route connections, it tends to introduce structural imbalances in regions with significant economic disparities. This often results in an overconcentration of routes in economically advanced areas and the neglect of less-developed regions. To address these limitations, a multi-step correction mechanism is introduced to enhance accessibility equity, promote regional coordination, and align the route structure with broader policy objectives.
For primary routes, which constitute the backbone of the network, all trunk and branch airports are required to maintain direct connections to Class A GA airports located in municipal centers, in addition to satisfying technical distance constraints. This ensures that regional core nodes remain efficiently accessible and enhances the nodal centrality of major urban hubs within the low-altitude transport system. Secondary routes are designed to interconnect Class A GA airports situated in municipal centers, using only flight distance thresholds as the filtering criterion. This approach mitigates the risk of network discontinuity or the isolation of key hubs caused by potential scoring biases in gravity-based modeling.
To ensure inclusivity and structural integrity, all Class B GA airports that remain unconnected after gravity-based screening are manually linked to their nearest Class A counterparts. This guarantees baseline service accessibility, prevents isolated service gaps, and expands the public service reach of the LAT network across the region.
These structural refinements transform the initially gravity-driven, linear network into a multi-nodal, hierarchical low-altitude airspace system that balances operational efficiency, spatial equity, and regional synergy.

2.3.3. Route Network Evaluation

  • Spatial Syntax
Following the route construction phase, this study evaluates the structural coherence and functional efficiency of the LAT route network using spatial syntax theory. Axial analysis is conducted via Depthmap X 0.8.0 to examine key spatial attributes. The analysis includes core metrics such as global integration, local integration, choice, and connectivity, which collectively assess the network’s accessibility, nodal significance, and spatial configuration. Additionally, two composite metrics—intelligibility and intelligence—are introduced to reflect structural clarity and user navigation efficiency, respectively [49,50,51].
Global integration quantifies the mean topological distance from a given segment to all others in the system; higher values denote better accessibility and overall centrality. Choice (analogous to spatial betweenness) indicates how frequently a segment lies along the shortest paths between other nodes, reflecting potential traffic concentration. Connectivity represents the number of directly linked segments to a given node, serving as a proxy for local accessibility. Local integration measures spatial cohesion within a defined topological radius and is used here to assess localized coverage and service efficiency.
To further interpret the spatial structure, regression analyses are conducted between local and global integration as well as between connectivity and global integration. These relationships inform two derived indicators: intelligence, which evaluates structural regularity and navigational predictability, and intelligibility, which reflects the extent to which users can infer the global spatial configuration from local cues.
High values for both indicators suggest that the proposed LAT network exhibits strong structural efficiency and spatial regularity (high intelligence), as well as high cognitive clarity and navigational intuitiveness (high intelligibility), thereby supporting its seamless integration into broader multimodal transport systems.
Building upon purely topological analysis, weighted betweenness centrality was incorporated to capture the influence of potential traffic flows on hub importance. Flow volumes derived from the gravity model were assigned as edge weights on the axial map, and weighted betweenness was then computed and contrasted with its unweighted counterpart. This comparison highlights convergences and divergences between geometrically prominent and demand-driven nodes, ensuring that structural prominence arising solely from network geometry is not misinterpreted in operational terms [52].
  • Coverage Equity Assessment
To evaluate the objectivity and necessity of the proposed rectification rules, network coverage equity is assessed from a population-oriented perspective [53]. For each node i, accessibility is defined as the sum of edge weights along its incident segments:
A i = j : ( i , j ) E Z i j + j : ( j , i ) E Z j i
where A i denotes the accessibility of node i and E represents the set of edges retained after all pruning criteria are applied.
Here, w i denotes the resident population used as weights. The population-weighted mean accessibility is then computed as
A ¯ w = i w i A i i w i
To further characterize population-level inequities, the population-weighted Gini and Atkinson indices (ε = 0.5, 1.0) are calculated across the node set [54]. Validation of the rectification rules is conducted through a parallel comparison between two configurations: the baseline network—pruned solely by distance thresholds and gravity scores—and the rectified network, which incorporates multi-criterion adjustment rules. Finally, the top N node overlap ratio (N = 10, 20, 50) is employed to verify that the rectification enhances population-based equity while preserving the backbone structure of the original network.
  • Network Robustness Assessment
To evaluate service retention under sudden failures and demand fluctuations, this study applies Monte Carlo-based robustness tests to the established topology with fixed edge weights ( Z i j ). Two types of disruptions are considered: random removal of nodes and random removal of segments [55]. For each type, 5%, 10%, and 15% of the elements are deleted, with every fraction replicated 100 times to suppress sampling noise. After each simulation, two performance measures are recorded: connectivity, defined as the relative size of the largest connected component and indicative of network-wide reachability; and service level, measured as the population-weighted mean accessibility to reflect aggregate accessibility from a population perspective. All results are expressed as relative deviations from the baseline network to remove scale effects.
In addition, demand-elasticity scenarios are constructed by uniformly scaling the entire edge-weight matrix by ±50% while keeping the topology unchanged. These experiments capture the network’s sensitivity to atypical passenger and cargo demand, such as seasonal peaks, troughs, or event-driven surges, and they quantify the degree of latent capacity redundancy, thereby providing an empirical basis for assessing resilience in LAT networks.

3. Results

3.1. Results of Waypoint Suitability Construction

3.1.1. Suitability Assessment of District-Level and County-Level General Aviation Airports

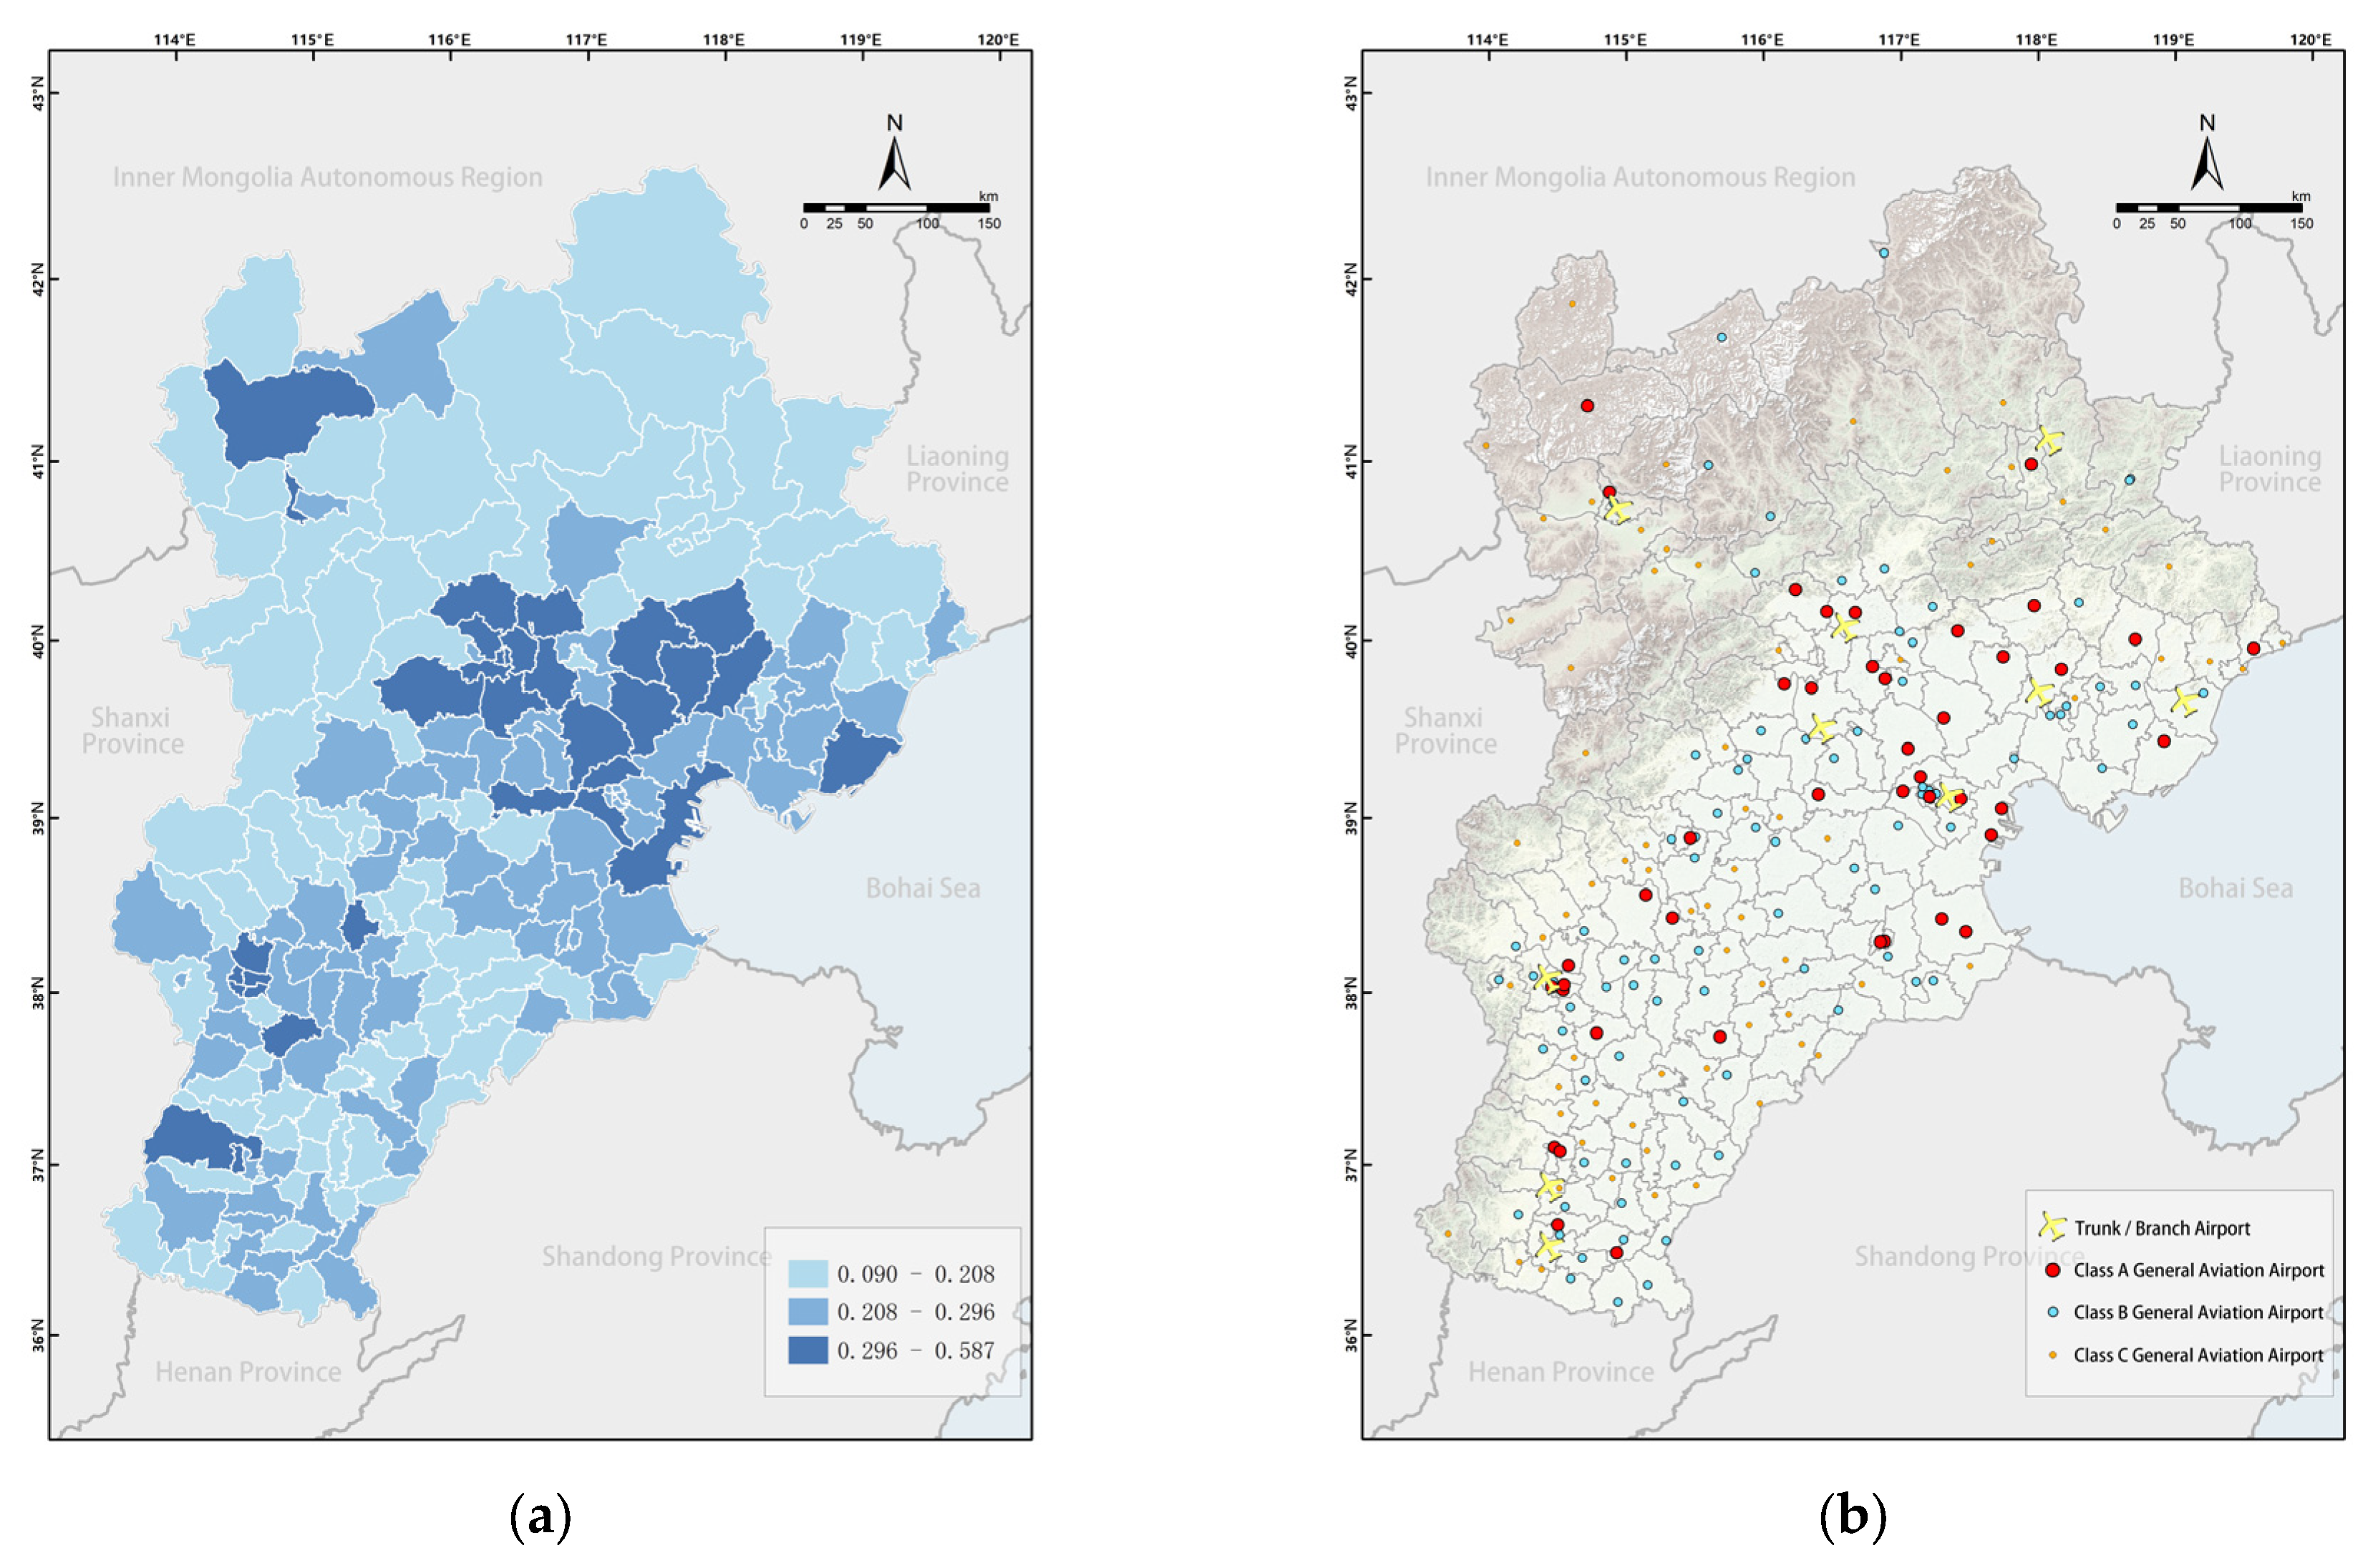
A total of 32 districts and counties were identified as Class A general aviation airport candidates, with suitability indices exceeding 0.296. These areas are marked by large populations, robust industrial bases, and well-developed surface transport, all of which signal a strong demand for general aviation services. Based on these conditions, these locations are prioritized for general aviation airport deployment, serving as regional aviation hubs to support the backbone of the LAT network across the BTH region.
Eighty districts and counties were categorized as Class B, with suitability indices ranging from 0.208 to 0.295. Although they exhibit moderate demographic and economic profiles, limitations in transport accessibility or challenging topography constrain their potential. Airport construction in these areas should be implemented selectively, guided by local planning needs, to supplement Class A hubs. This strategy supports a hierarchical network framework based on a “backbone and complementary nodes” model and improves regional network coherence. Eighty-seven areas fall into the Class C category, with suitability indices below 0.208. These regions are typically sparsely populated, economically underdeveloped, or topographically complex, rendering immediate airport development impractical. Nonetheless, they are retained as long-term planning reserves, preserving spatial flexibility for future LAT expansion.
Spatially, the suitability distribution exhibits a pattern of “dense in the east, sparse in the west, and clustered in structure” (Figure 2a). High-suitability Class A zones concentrate in the Bohai Rim Economic Circle and the central BTH urban corridor—notably Beijing, Tianjin, Shijiazhuang, and their environs—forming a polycentric radial network. Major axial corridors such as Baoding–Langfang–Tangshan and Handan–Xingtai–Shijiazhuang emerge as high-density aviation belts. In contrast, mountainous and hilly northern and western Hebei regions exhibit limited suitability, producing localized coverage gaps.
To reconcile model-based classification with real-world operational and policy considerations, the initial outputs were adjusted and finalized (Figure 2b). The final designation comprises 43 Class A airports: 32 derived from the model, 6 added to ensure representation of municipal centers, and 5 upgraded from existing facilities. Class B includes 86 airports—80 selected through modeling and 6 upgraded based on current operational status. Class C comprises 71 airports retained as long-term candidate sites.
On the basis of the preceding classification, a leave-one-group-out sensitivity analysis was performed to evaluate the robustness of the nodal suitability rankings. Excluding the traffic-accessibility indicators yielded suitability scores that were nearly identical to those derived from the full indicator set (Pearson r = 0.985). Rank-order stability was likewise strong, with Spearman’s ρ = 0.83 and Kendall’s τ = 0.66. Regarding the identification of high-ranking nodes, the top 10 sets were identical, while the top 20 and top 50 overlap ratios reached 85% and 82%, respectively (Appendix A, Table A1 and Table A2). These results demonstrate that the model exhibits only marginal dependence on any single indicator dimension, thereby underscoring the reliability and robustness of the proposed evaluation framework.
Overall, the classification system delivers clear differentiation and structural balance. The spatial distribution of nodes aligns closely with regional economic density, population patterns, and infrastructure readiness. The southeastern coastal zone and core urban agglomerations form high-density clusters that constitute the structural backbone of the LAT network, providing a solid platform for inter-regional aviation connectivity and strategic development.

3.1.2. Suitability Assessment of Township-Level Vertiports

Extending the node classification framework to the township level, this study identifies terminal-level supplementary nodes to further enhance the granularity and inclusiveness of the LAT network. Based exclusively on suitability index thresholds, townships were categorized into three classes: 317 are designated as suitable for Class A vertiport development, 1195 for Class B, and 1824 for Class C. These classifications, illustrated in Figure 3, follow a descending order of suitability and reflect spatial differences in demographic, economic, and topographic conditions.
This hierarchical classification of township-level vertiports is designed to strengthen the overall spatial coverage and redundancy of the network. Increasing the density of access points in underserved or peripheral areas enhances service accessibility and ensures the LAT system’s responsiveness to localized transport needs—particularly in regions beyond the reach of higher-tier general aviation nodes.

3.2. Route Construction and Network Optimization

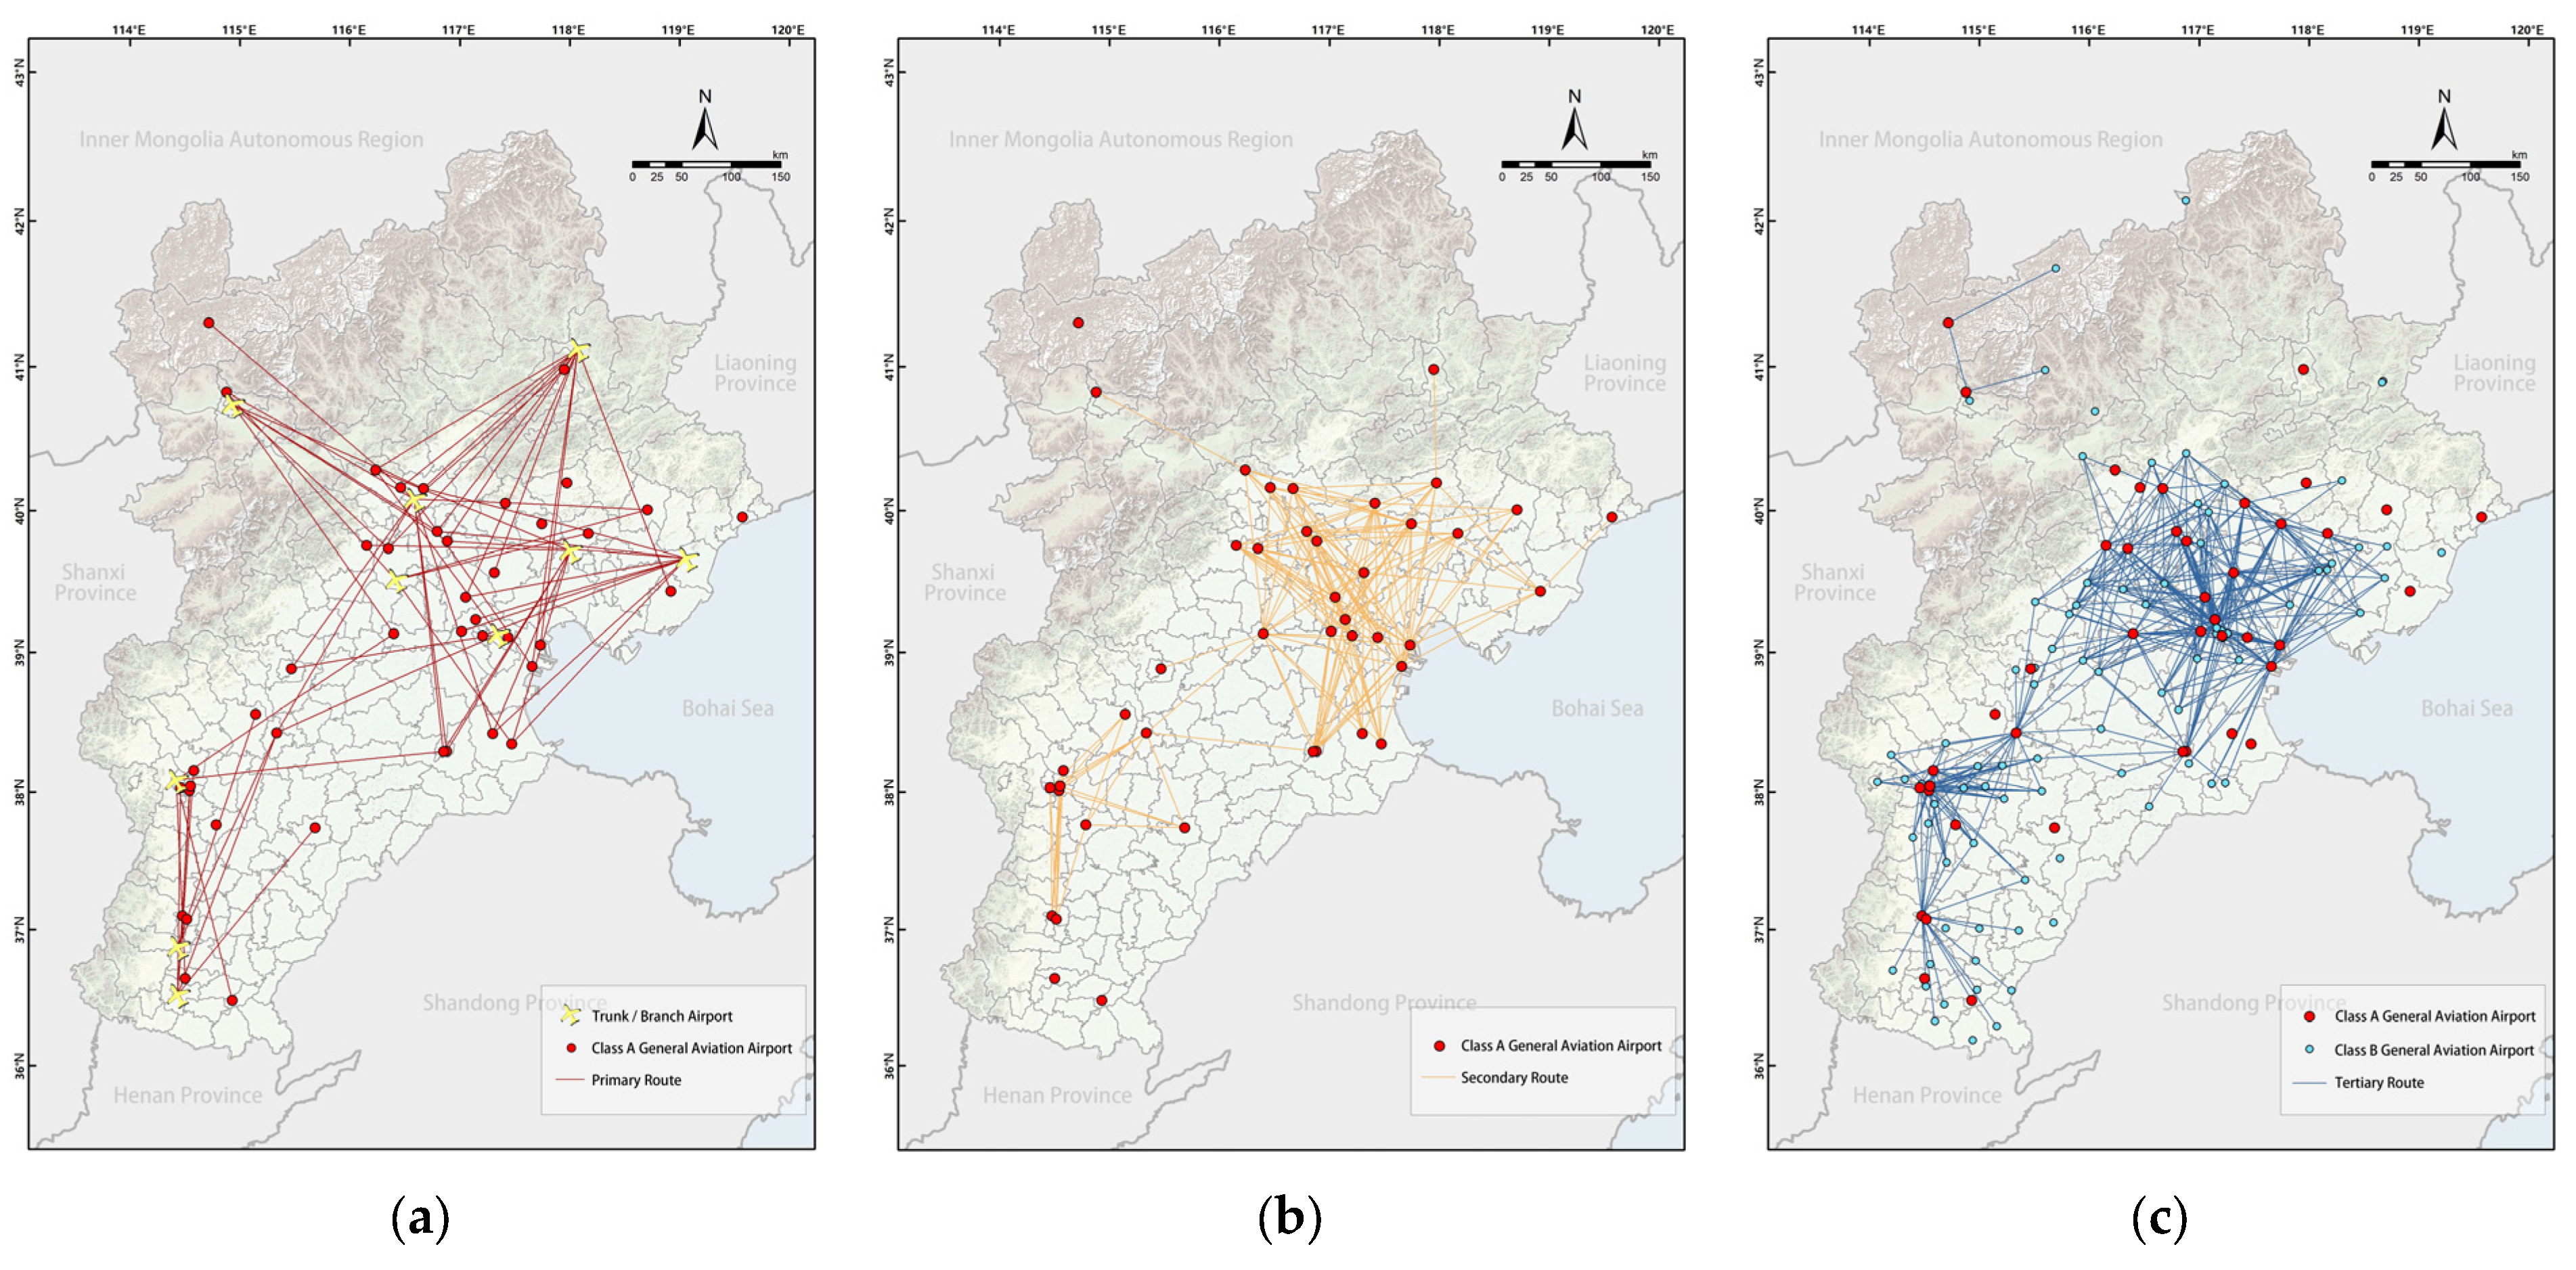
During the gravity-model-based screening stage, a total of 60 primary routes, 156 secondary routes, and 356 tertiary routes were identified. The resulting spatial structure exhibits a pronounced “dense east–sparse west” pattern, with high route density in the Bohai Rim region. A prominent traffic convergence core has emerged around Beijing, Tianjin, and Shijiazhuang, forming the initial backbone of the LAT network (see Figure 4).
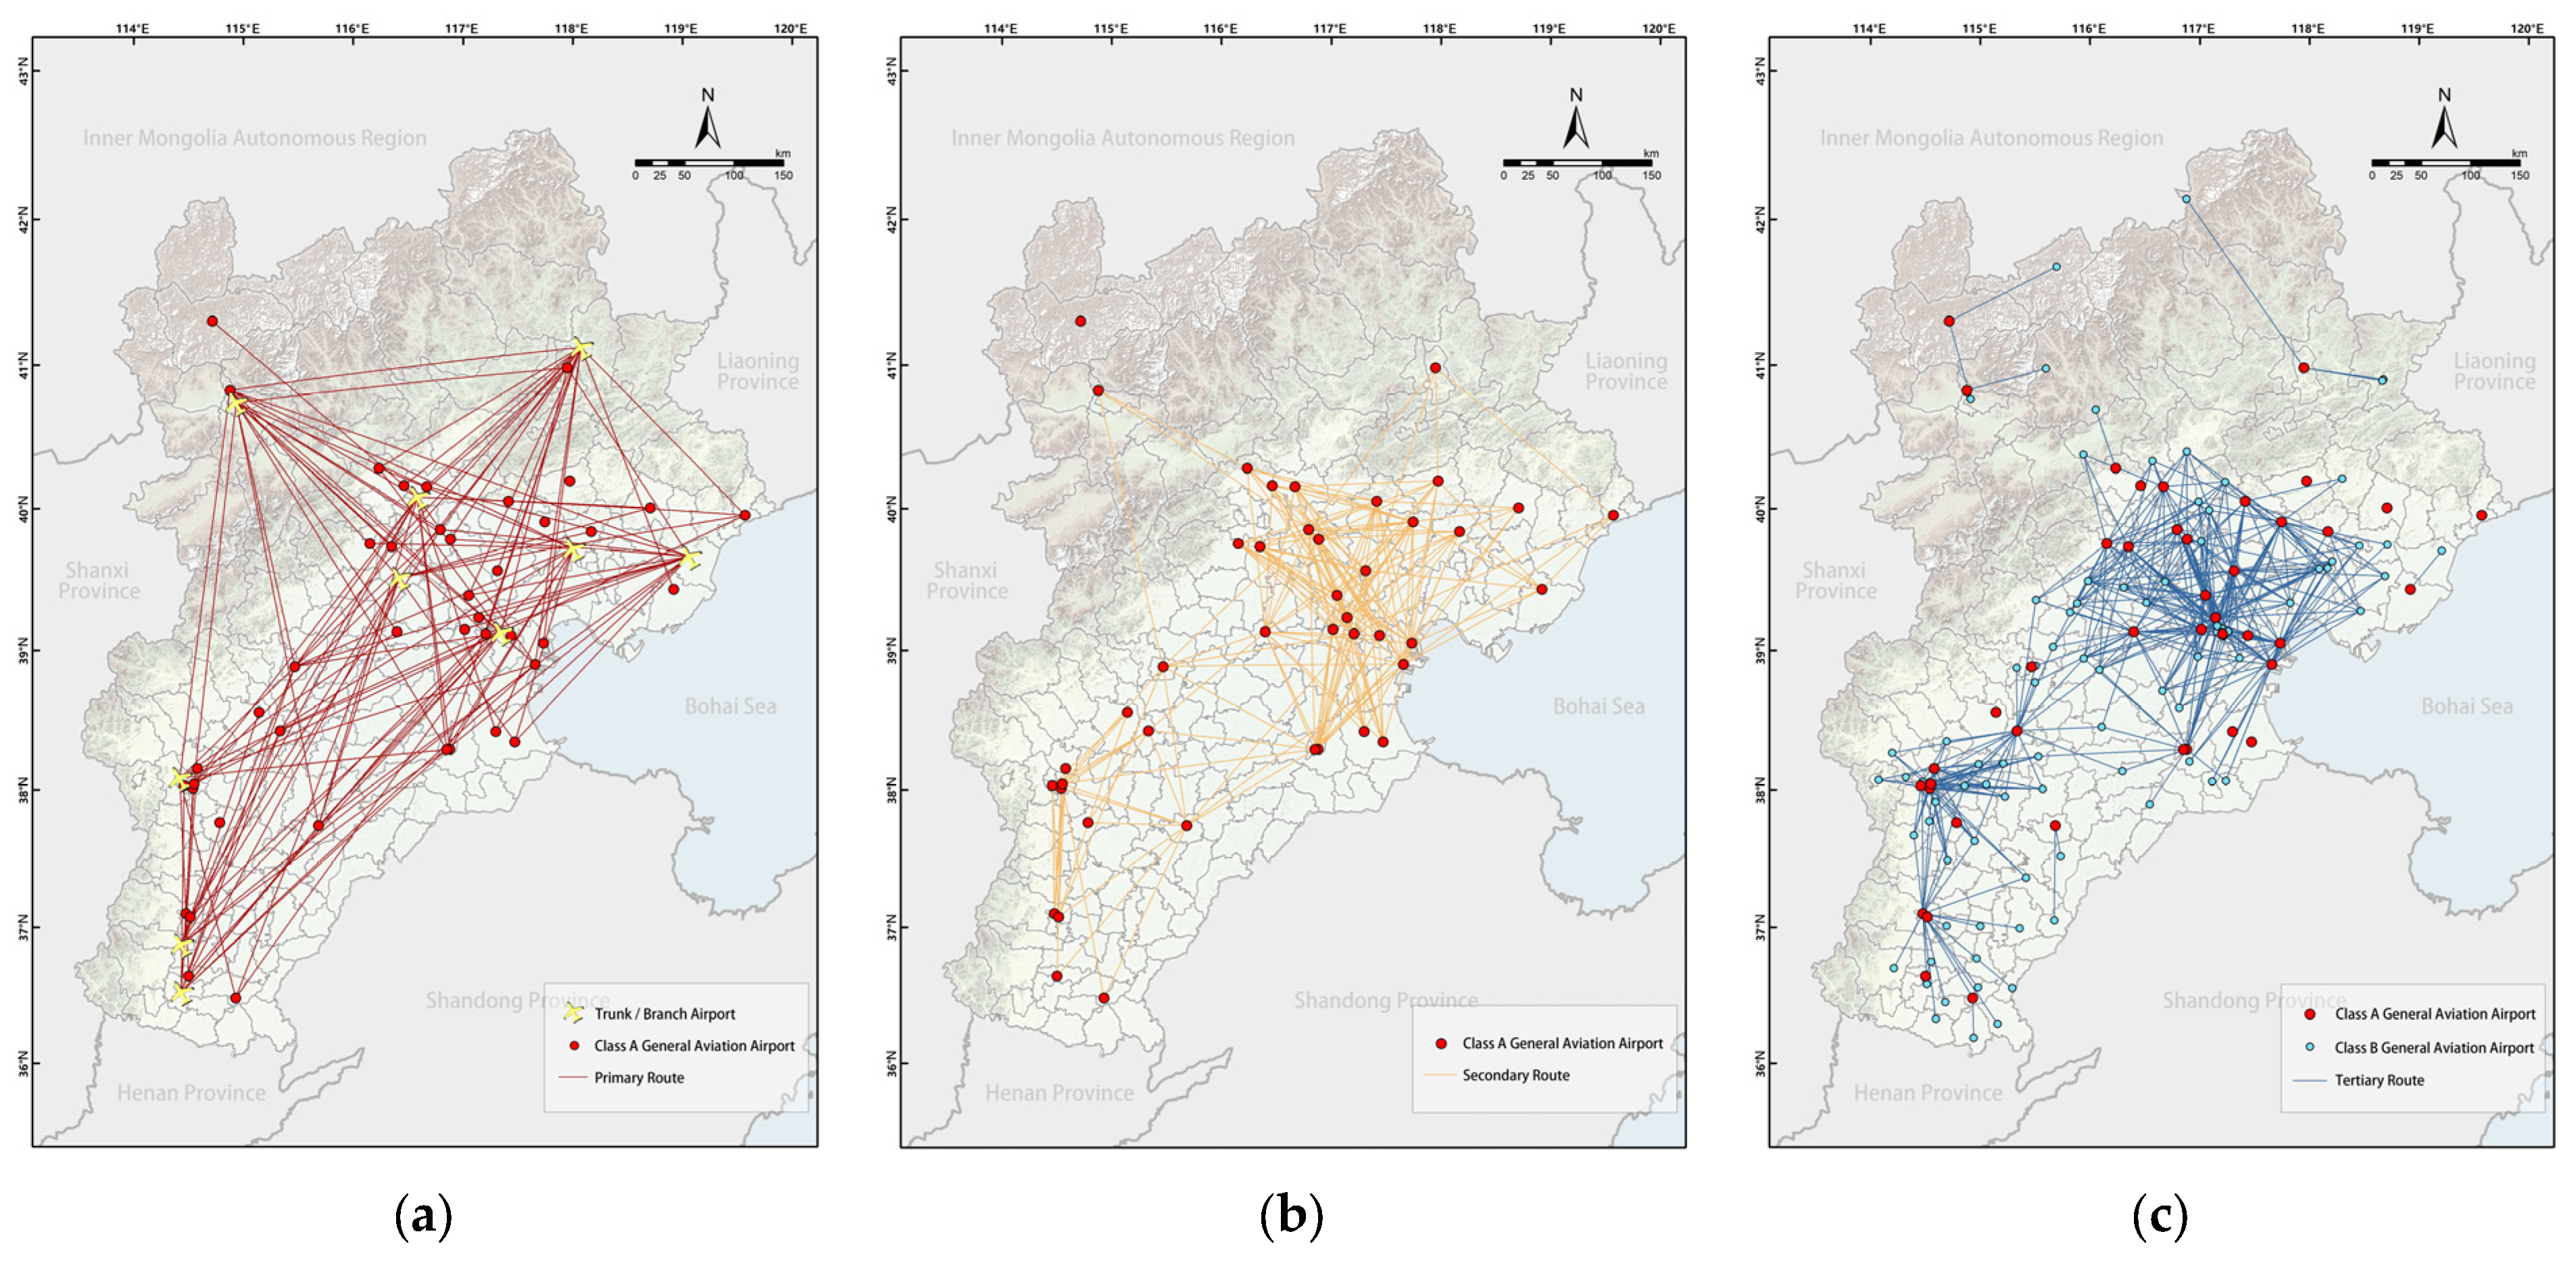
To improve regional equity and correct structural imbalances, a multi-level correction mechanism was implemented. As a result, 54 new primary routes were added to enhance core connectivity between trunk airports and Class A general aviation nodes located in municipal centers. Additionally, 24 secondary routes were introduced to strengthen inter-city navigation corridors, and 10 tertiary routes were incorporated to bridge isolated segments and improve overall network continuity. The optimized spatial layout is shown in Figure 5.
Ultimately, a three-level LAT route network was constructed for the BTH region comprising 114 primary routes, 180 secondary routes, and 366 tertiary routes. This system establishes a hierarchical network architecture characterized by a robust regional backbone, synergistic node clusters, and comprehensive terminal access. Anchored by a dual-core model—centered on the Beijing–Tianjin metropolitan axis and the Shijiazhuang urban hub—the network radiates outward through well-connected clusters, ensuring seamless spatial coverage and operational integration across the region (Figure 6).

3.3. Comprehensive Route Network Evaluation

3.3.1. Spatial Syntax Evaluation

  • Global Accessibility and Penetration
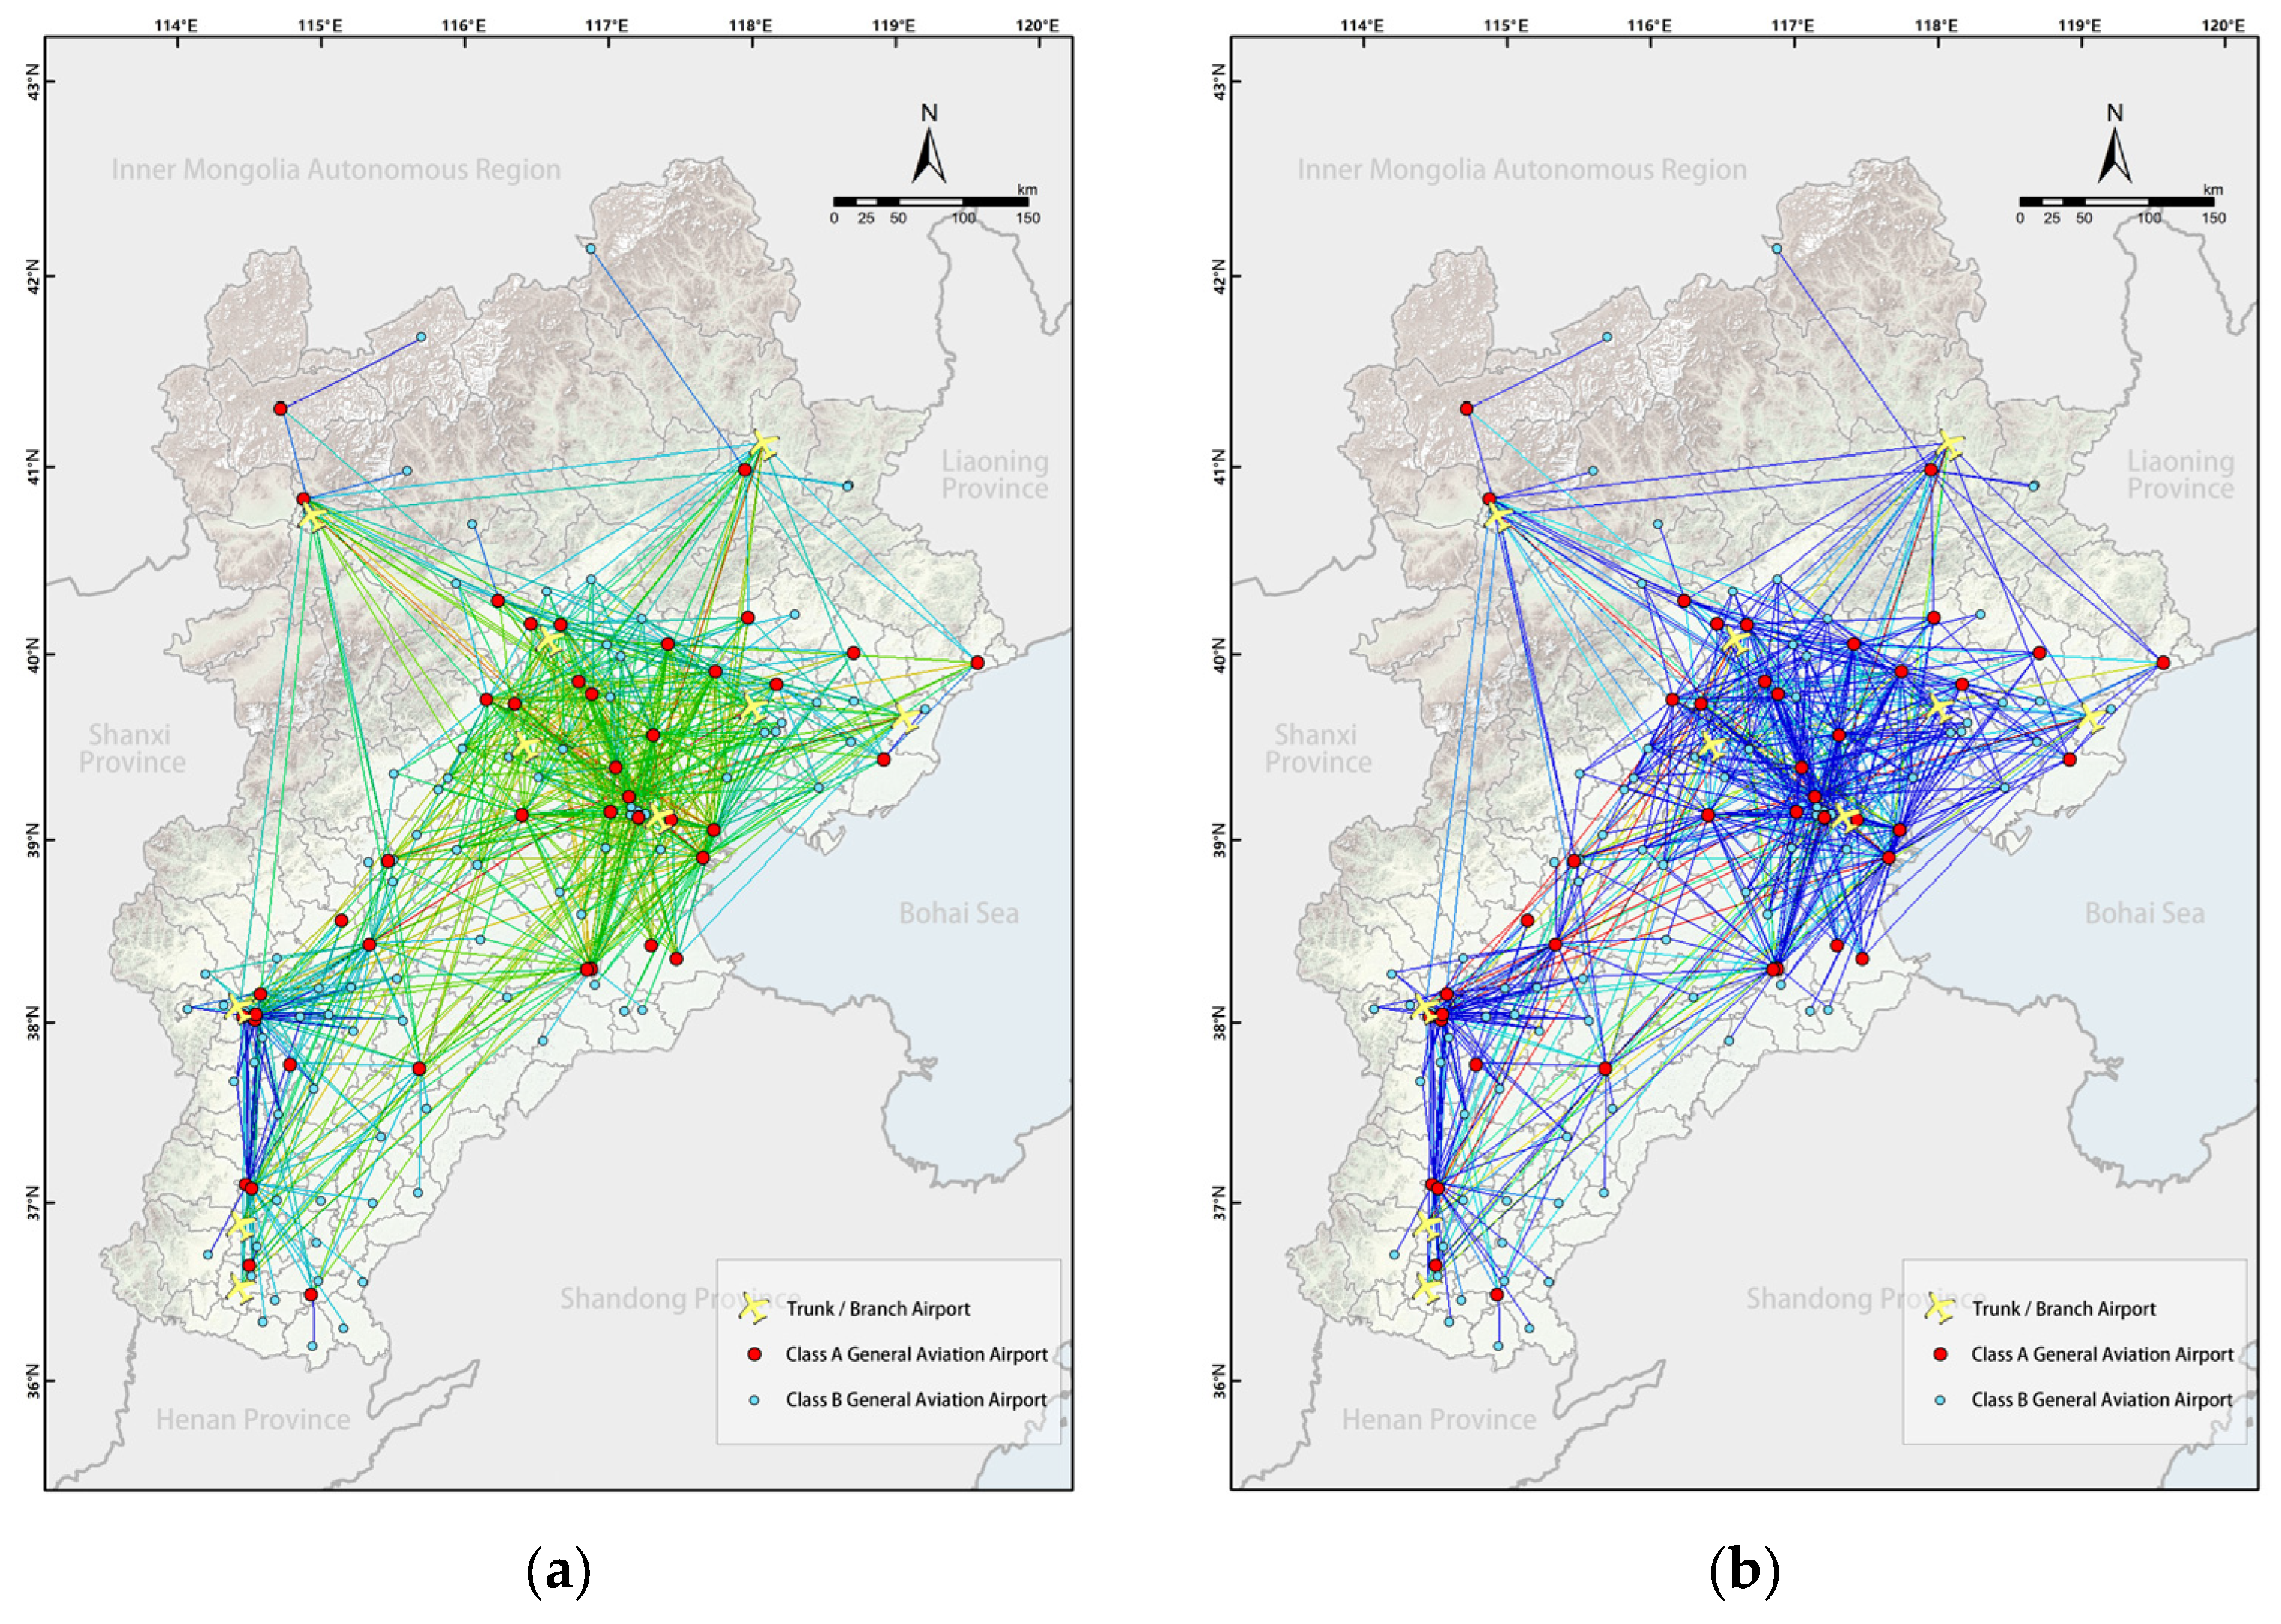
Based on the constructed route network, an axial analysis model was developed using spatial syntax theory. The average global integration value reaches 6.88, with a maximum of 11.4, suggesting generally high levels of spatial accessibility across the system. Segments with the highest global integration scores are predominantly aligned along the key corridors connecting Beijing, Tianjin, and Shijiazhuang—forming the core axis of the regional low-altitude transport network (Figure 7a).
The choice metric, which quantifies how frequently a segment serves as part of the shortest paths between node pairs, yields a maximum value of 25,004 and an average of 676.6. As illustrated in Figure 7b, segments with high choice values are concentrated along major inter-city arterial routes, particularly those linking prefecture-level urban centers. The spatial distribution of choice closely mirrors that of global integration, identifying these segments as dominant spatial corridors facilitating regional movement.
  • Spatial Intelligence and Intelligibility
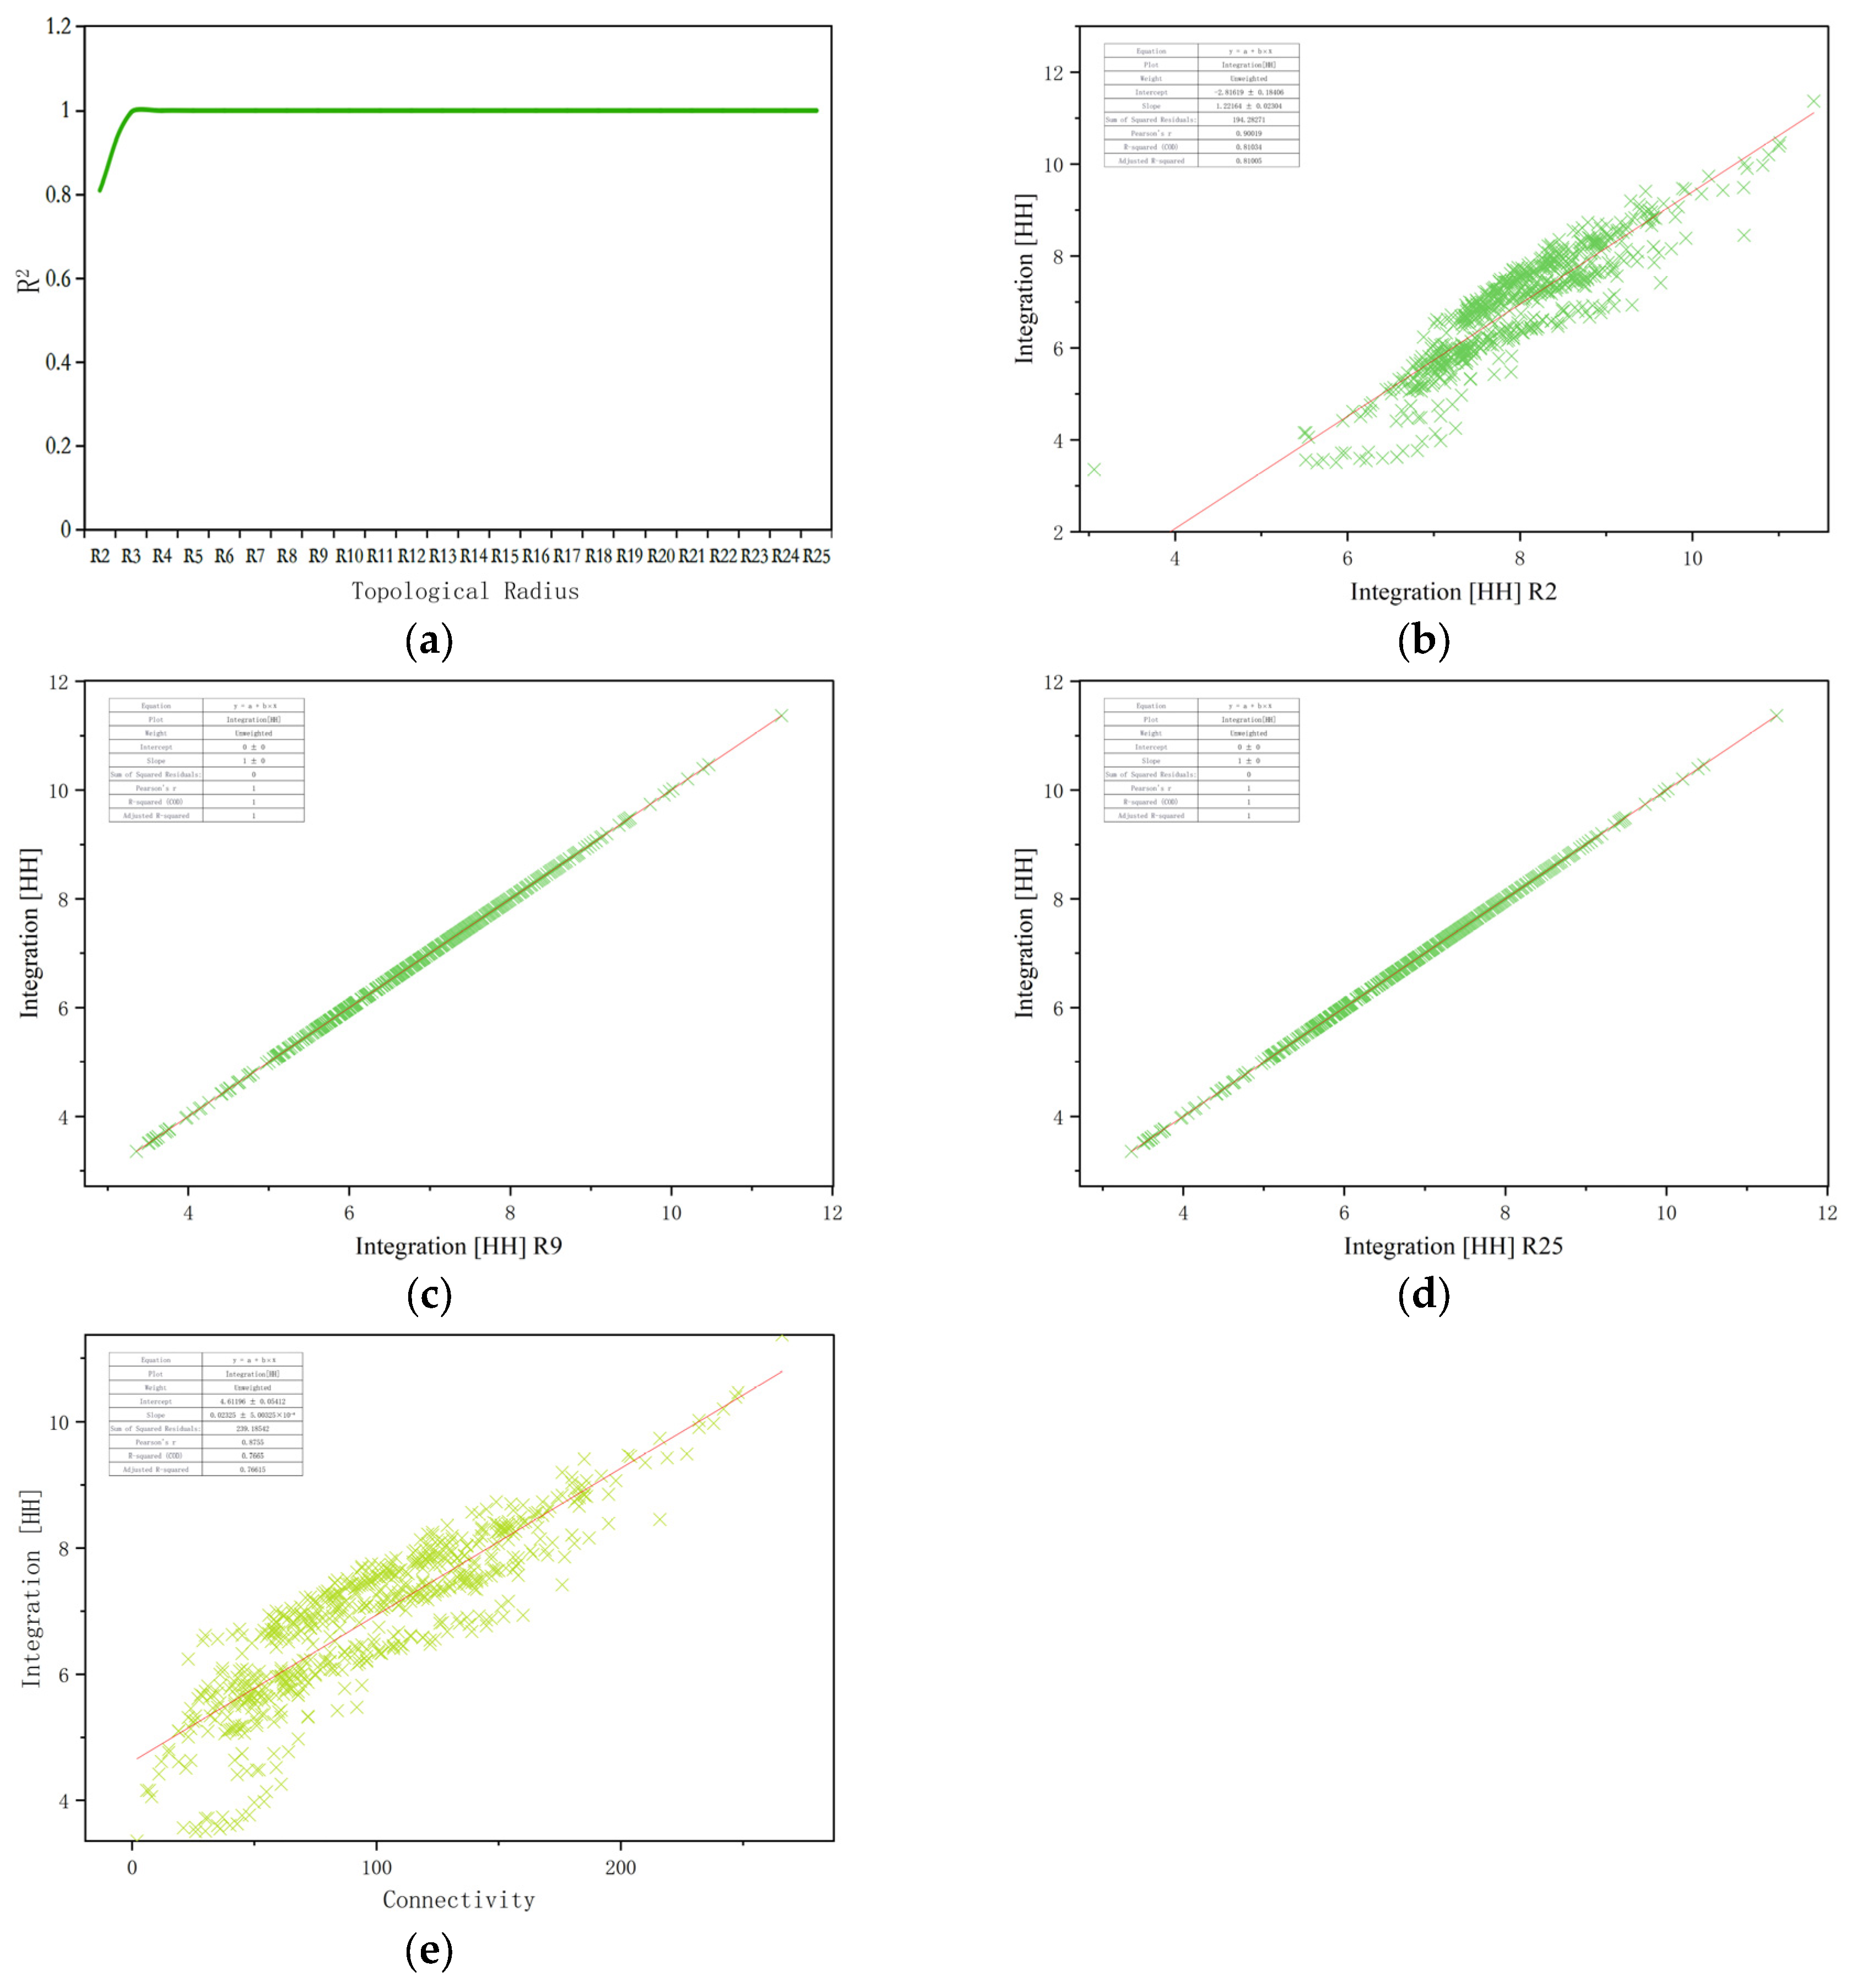
Beyond global accessibility metrics, the spatial coherence and cognitive clarity of the LAT network were further examined through spatial-syntax-based regressions. A linear regression was first performed between local and global integration to evaluate spatial intelligence. To ensure the robustness and reliability of the selected local radius, a sensitivity analysis was conducted by varying the topological radius (r) from 2 to 25.
As shown in Figure 8, the coefficient of determination (R2) increased rapidly from 0.81 at r = 2 to near-perfect levels (R2 ≈ 1.000) beyond r = 4. This trend reflects the high structural regularity of the network, which was intentionally designed using point-to-point straight-line connections between planned waypoints. Such geometric simplicity leads to minimal topological depth variation and consequently high predictability between local and global integration values.
Based on this analysis, r = 9 was selected as the representative local radius, balancing spatial resolution and regional coherence. The regression between local (r = 9) and global integration produced an R2 approaching 1.0, indicating strong spatial intelligence and a highly centralized, well-connected network structure (Figure 8). A second regression between connectivity and global integration resulted in a linear fitting equation of y = 0.02325x + 4.61196, with R2 = 0.77. This finding demonstrates high intelligibility, suggesting that users can effectively infer the global spatial structure from localized spatial cues (Figure 8e).
When edge-weighted betweenness centrality—calculated with Z i j as the edge weight—is applied, the network’s high-value corridors become strongly concentrated along trunk routes and major hubs. Relative to the unweighted results, several critical connecting edges exhibit substantial rank increases; for example, the edge from Taocheng District (Hebei) to Heping District (Tianjin) and that from Taocheng District to Guangyang District (Hebei) record weighted-to-unweighted ratios of 20.74 and 14.23, respectively. In contrast, short segments that appear geometrically central under the unweighted measure decline sharply once edge weights are considered. These results demonstrate that structural prominence alone does not necessarily imply operational significance. The demand backbone revealed by weighted centrality partly overlaps with, but also diverges from, purely topological importance, providing empirical evidence for identifying genuine capacity bottlenecks and redundancies while complementing the preceding topological analysis.
Overall, the proposed three-level LAT route network across the BTH region performs strongly in terms of structural connectivity, movement efficiency, and spatial cognition. These results validate the robustness, clarity, and practical feasibility of the network design, underscoring its capacity to support integrated, resilient, and user-friendly low-altitude transportation operations.

3.3.2. Coverage Equity Assessment

Relative to the baseline network pruned solely by distance thresholds and gravity scores, the multi-criteria rectification increases the population-weighted mean accessibility from 0.000884 to 0.000968 (an improvement of 9.5%), indicating a notable enhancement in overall service coverage. Concurrently, the weighted Gini coefficient decreases from 0.5696 to 0.5197, reflecting reduced disparities in accessibility and a more balanced distribution of network services across regions. Parallel improvements are also evident in the Atkinson index: the value falls from 0.2913 to 0.2267 when ε = 0.5 and from 0.8622 to 0.4728 when ε = 1.0, further confirming a substantial improvement in equity. Importantly, these gains are achieved without compromising the network’s structural integrity. The top N overlap ratios for high-accessibility nodes remain 0.90, 1.00, and 0.90 for N = 10, 20, and 50, respectively, demonstrating that equity gains are realized while preserving the backbone of the original topology (Appendix A, Table A3). Overall, the rectification simultaneously enhances both the public service function and spatial fairness of the LAT network.

3.3.3. Network Robustness Assessment

With the topology held constant, the random removal of 10% of nodes maintains the relative size of the largest connected component at 0.98 ± 0.025, underscoring strong resilience to stochastic perturbations. By contrast, the targeted removal of the 10% most critical nodes—ranked by nodal strength—reduces the component size to approximately 0.904, revealing a structural dependence on key hubs. This vulnerability pattern is consistently observed across demand-elasticity scenarios in which all edge weights are uniformly scaled by ±50%. Under these conditions, overall connectivity remains very close to unity; random failures yield an average component size of 0.98, whereas targeted attacks reduce the size to 0.904 (Appendix A, Table A4). These results demonstrate that the LAT network sustains high connectivity under general disturbances yet exhibits susceptibility to concentrated disruptions at pivotal nodes, highlighting the necessity of reinforcing the reliability and redundancy of critical hubs.

4. Discussion and Recommendations

4.1. Discussion

Low-altitude transportation is a new mode of transportation that will greatly change the spatial structure of urban agglomerations. The layout of low-altitude traffic needs to be innovative and developed based on the existing route planning. The primary contribution of this study lies in the development of an integrated framework for evaluating and designing LAT networks at the city-cluster scale, demonstrated through its application in the BTH region. As one of China’s most representative mega-regions in terms of spatial form and industrial structure, BTH serves as an appropriate benchmark. Nevertheless, broader applicability will necessitate adaptation to local geographic conditions, climatic environments, airspace configurations, and sector-specific requirements. Future research should extend this approach to the Yangtze River Delta and the Chengdu–Chongqing megalopolis, thereby enabling cross-regional comparative analyses to identify both generalizable principles and context-specific variations, which would enhance the model’s scalability and policy relevance.
From the perspective of economic feasibility and sustainability, the development of a LAT network emphasizes the synergistic role of hierarchical nodes in optimizing overall input–output efficiency. For instance, Liupanshan Airport (total investment ≈ USD 63 million), Zhongwei Shapotou Airport in Ningxia (≈USD 51 million), and Zhalute Banner Yindel Airport (≈USD 5.6 million) exemplify differentiated investment–return patterns [56]. Class A general aviation airports, although requiring higher capital commitments, are capable of generating annual operating revenues exceeding several tens of millions of USD through strong passenger and cargo throughput. By contrast, Class B airports achieve county-level coverage with substantially lower capital costs and generally reach operational break-even through ticketing, logistics, and general aviation service charges while providing additional value in commuter, tourism, and emergency response contexts. At the macroeconomic level, China’s low-altitude economy is undergoing rapid expansion. According to projections by the Civil Aviation Administration of China, the market is expected to grow from approximately USD 69 billion in 2023 to around USD 480 billion by 2035 [57]. Driven by both industrial momentum and supportive policy frameworks, the establishment of a multi-tiered LAT network not only delivers immediate economic benefits but also demonstrates strong long-term sustainability and growth potential.
While the current implementation is based on static suitability assessments, dynamic operational factors—such as airspace capacity, meteorological variability, flight safety, and economic viability—remain to be systematically incorporated. Advancing this line of work will require combining dynamic microsimulation with multi-objective optimization to embed safety, traffic-flow, and economic constraints into node selection and route planning. Furthermore, drawing upon international experience in UAM and AAM, the integration of standardization, digitalization, and policy harmonization will provide essential institutional and technological support for the sustainable development of China’s LAT system.

4.2. Policy Recommendations

To facilitate the implementation of a coherent and resilient low-altitude transportation (LAT) system in the Beijing–Tianjin–Hebei (BTH) region, the following strategic recommendations are proposed.

4.2.1. Integrated Policy Framework and Spatial Planning

A regionally coordinated “Special Plan for Low-Altitude Transportation Network Development” should be jointly drafted by the governments of Beijing, Tianjin, and Hebei. The plan must embed GA airport siting and low-altitude corridors within national and regional spatial planning systems, prioritizing seamless integration with surface transport and trunk aviation networks. Class A GA airports can serve as policy-innovation pilots, supported by streamlined airspace-approval processes and fiscal incentives to spur private sector engagement.

4.2.2. Infrastructure Prioritization and Functional Optimization

Construction should focus first on Class A GA airport nodes, accelerating the rollout of takeoff and landing facilities, navigation systems, and energy supply stations. For Class B nodes, modular, scalable designs—tailored to local contexts—are advised to avoid redundant investment and maximize resource efficiency.

4.2.3. Technological Enablement and Adaptive Network Management

Cutting-edge technologies such as AI-driven routing and real-time monitoring should be deployed to dynamically manage airspace traffic and optimize route allocation. A centralized LAT data platform should integrate meteorological, geospatial, logistics, and operational datasets, thereby enhancing responsiveness and system resilience.

4.2.4. Regional Coordination and Standards Harmonization

Unified technical standards, operational protocols, and regulatory frameworks are required across BTH jurisdictions. A cross-regional airspace coordination mechanism should be established to prevent regulatory fragmentation. A cooperative development model should link emerging hubs, such as Xiong’an New Area and the Capital Economic Circle, with applications in inter-city logistics, medical transport, and executive air mobility.

4.2.5. Public Services and Emergency Response Enhancement

Emergency vertiports should be pre-positioned in disaster-prone counties and supported by drone-based logistics for medical and relief-supply delivery. The LAT system should also support public-facing services, such as low-altitude sightseeing routes that connect major tourist attractions with Class A GA hubs, thereby extending the socioeconomic value of low-altitude aviation infrastructure.

5. Conclusions

This study proposes a comprehensive analytical framework for the development of low-altitude transportation (LAT) networks in urban agglomerations, using the Beijing–Tianjin–Hebei (BTH) region as a representative case. The research adopts a three-stage approach—waypoint selection, route planning, and network structure evaluation—supported by multi-source data and spatial syntax analysis. A hierarchical classification system was established for general aviation (GA) nodes at both district/county and township levels: 43 Class A, 86 Class B, and 71 Class C GA airports were identified, while at the township level 317 Class A, 1195 Class B and 1824 Class C vertiports were selected to ensure fine-grained coverage and spatial inclusivity. A three-level LAT route network was constructed, consisting of 114 primary, 180 secondary, and 366 tertiary routes. The network follows a “backbone–multi-node synergy–peripheral coverage” structure, anchored by core municipal centers and supported by regional clusters. This design enhances both inter-city and intra-city accessibility, enabling a balanced and efficient regional aviation structure.
Spatial syntax analysis verifies the structural validity of the proposed LAT network, with a mean global integration of 6.88 and a mean choice value of 676.6, evidencing high accessibility and strong spatial centrality. Primary corridors are concentrated along the Beijing–Tianjin–Shijiazhuang axis, while nodes such as Baoding, Binhai New Area, Tangshan, and Zhangjiakou further reinforce regional spatial cohesion. Regression analysis demonstrates exceptionally high intelligibility, with a coefficient of determination (R2 > 0.99) between local and global integration, attributable to the network’s geometric configuration of direct point-to-point links that minimize topological depth and generate robust local–global correlations. By contrast, the regression between connectivity and global integration yields an R2 of approximately 0.77, indicating only moderate cognitive clarity: users can partially infer the global structure from local cues, though refinement of nodal hierarchy or layout could enhance intuitive readability. Complementary weighted-centrality analysis reveals that structural prominence does not necessarily coincide with operational importance, as several geometrically central edges decline in ranking once flow-based weights are introduced, whereas demand-intensive trunk corridors rise significantly. This divergence underscores the necessity of integrating both topological and flow-based perspectives to accurately identify genuine capacity bottlenecks and redundancies in LAT planning and operations.
Systematic validation affirms the robustness and applicability of the proposed LAT network across multiple performance dimensions. The coverage equity assessment shows that multi-criteria rectification enhances the population-weighted mean accessibility from 0.000884 to 0.000968 (an improvement of 9.5%) while simultaneously reducing inequality, as indicated by a decrease in the weighted Gini coefficient from 0.5696 to 0.5197 and substantial declines in the Atkinson index for ε = 0.5 and ε = 1.0. Importantly, these improvements are achieved without altering the network’s backbone structure, as demonstrated by top N overlap ratios of 0.90, 1.00, and 0.90 for N = 10, 20, and 50, respectively. Robustness experiments further demonstrate that random removal of 10% of nodes maintains the relative size of the largest connected component at 0.98 ± 0.025, whereas targeted removal of the most critical nodes reduces it to approximately 0.904. These results indicate that the network exhibits strong resilience to stochastic disruptions but retains measurable vulnerability to the loss of pivotal hubs, highlighting the importance of reinforcing the reliability of key nodes in future planning.
In conclusion, the proposed three-tier LAT framework demonstrates both theoretical robustness and practical applicability in the BTH region while offering methodological insights for other city clusters. It also provides an analytical foundation for embedding low-altitude aviation into national strategies and multimodal transport systems. Placed in a broader context, the framework resonates with international efforts in UAM and AAM, suggesting its relevance not only for China but also for comparative studies of emerging air mobility systems worldwide. Looking ahead, interdisciplinary collaboration and data-driven technologies will be critical in establishing a safe, intelligent, and sustainable LAT ecosystem that fosters innovation in transport paradigms and supports high-quality regional development.

Author Contributions

Conceptualization, J.L., L.Y., Y.S. and G.Z.; Methodology, J.L., L.Y. and G.Z.; Software, J.L. and L.Y.; Validation, J.L. and L.Y.; Formal Analysis, J.L. and L.Y.; Investigation, J.L., L.Y. and Y.S.; Data Curation, J.L., L.Y. and Y.S.; Writing—Original Draft Preparation, J.L. and Y.S.; Writing—Review and Editing, J.L. and G.Z.; Visualization, J.L.; Supervision, G.Z.; Project Administration, G.Z. All authors have read and agreed to the published version of the manuscript.

Funding

This work was supported by the Humanities and Social Science Fund of the Ministry of Education of China (No. 24YJAZH245).

Data Availability Statement

The original contributions presented in this study are included in the article; further inquiries can be directed to the corresponding author.

Conflicts of Interest

The authors declare no conflicts of interest.

Abbreviations

The following abbreviations are used in this manuscript:
NASAThe U.S. National Aeronautics and Space Administration
UAMUrban Air Mobility
AAMAdvanced Air Mobility
RAMRegional Air Mobility
LATLow-Altitude Transportation
UAV(s)Unmanned Aerial Vehicle(s)
AGLAbove Ground Level
MCDMMulti-Criteria Decision-Making
BTHBeijing–Tianjin–Hebei
DEMDigital Elevation Model
GAGeneral Aviation
POIPoint of Interest
AHPAnalytic Hierarchy Process
CIConsistency Index
CRConsistency Ratio
GISGeographic Information System

Appendix A

Table A1. Sensitivity correlations.
Pearson rSpearman ρKendall τ
0.9850.8310.658
Table A2. Sensitivity top N overlap.
Top N NodesOverlap
101
200.85
500.82
Table A3. Fairness summary.
NetworkPop Weighted Mean AccessGini
Weighted
Atkinson e0.5Atkinson e1.0
before0.0008836710.5696110080.291271730.862212177
after0.000967770.5197000220.2267111460.472768423
Table A4. Robustness results.
ScenarioLargest Connected Component (LCC, %)Random Failure (10%)—MeanRandom Failure (10%)—StdTargeted Failure (10%)—MeanTargeted Failure (10%)—Std
flow base10.9770.0250.80
flow up10.9800.0220.80
flow down10.9840.0200.80

References

  1. Goyal, R.; Reiche, C.; Fernando, C.; Serrao, J.; Kimmel, S.; Cohen, A.; Shaheen, S. Urban Air Mobility (UAM) Market Study; Booz Allen Hamilton Inc.: McLean, VA, USA, 2018. [Google Scholar]
  2. Antcliff, K.; Borer, N.; Sartorius, S.; Saleh, P.; Rose, R.; Gariel, M.; Oldham, J.; Courtin, C.; Bradley, M.; Roy, S.; et al. Regional Air Mobility: Leveraging Our National Investments to Energize the American Travel Experience; NASA—Langley Research Center: Hampton, VA, USA, 2021. [Google Scholar]
  3. European Union Aviation Safety Agency (EASA). European Drones Outlook Study: Unlocking Value for Europe; Publications Office of the European Union: Luxembourg, 2017; ISBN 978-92-9216-082-1. [Google Scholar]
  4. Wang, J.; Tang, Q.; Guo, W.; Dai, J. The Development History and Experience of Urban Air Mobility in the United States, the European Union, and Japan. Urban Plan. Int. 2025; online first. [Google Scholar] [CrossRef]
  5. Hwang, J.-H.; Hong, S. A Study on the Factors Influencing the Adoption of Urban Air Mobility and the Future Demand: Using the Stated Preference Survey for Three UAM Operational Scenarios in South Korea. J. Air Transp. Manag. 2023, 112, 102467. [Google Scholar] [CrossRef]
  6. Public-Private Committee for Advanced Air Mobility. Concept of Operations for Advanced Air Mobility (ConOps for AAM); First Issue, Revision A; Ministry of Land, Infrastructure, Transport and Tourism: Tokyo, Japan, 2024.
  7. Chae, M.; Kim, S.H.; Kim, M.; Park, H.-T.; Kim, S.H. Potential Market Based Policy Considerations for Urban Air Mobility. J. Air Transp. Manag. 2024, 119, 102654. [Google Scholar] [CrossRef]
  8. Lyu, R. The Background, Connotation and Global Pattern of Low-Altitude Economy. Frontiers 2024, 15, 45–56. [Google Scholar] [CrossRef]
  9. Zhong, C.; Hu, X. The New Quality Productivity Logic and Promotion Path for High-quality Development of Low Altitude Economy. J. Shenzhen Univ. (Humanit. Soc. Sci.) 2024, 41, 84–93. [Google Scholar]
  10. Zhang, X. Logic, Obstacles and Suggestions of Low Altitude Economy Enabling New Quality Productive Forces. Contemp. Econ. Manag. 2025, 47, 17–23. [Google Scholar] [CrossRef]
  11. Zhang, X.; Huang, W. Development of Low-Altitude Economy: Global Trend, China’s Current Situation and Promotion Measures. Econ. Rev. J. 2024, 40, 53–62. (In Chinese) [Google Scholar] [CrossRef]
  12. Wang, K.; Qu, X. Urban Aerial Mobility: Reshaping the Future of Urban Transportation. Innovation 2023, 4, 100392. [Google Scholar] [CrossRef]
  13. Huang, H.; Su, J.; Wang, F.-Y. The Potential of Low-Altitude Airspace: The Future of Urban Air Transportation. IEEE Trans. Intell. Veh. 2024, 9, 5250–5254. [Google Scholar] [CrossRef]
  14. Bauranov, A.; Rakas, J. Designing Airspace for Urban Air Mobility: A Review of Concepts and Approaches. Prog. Aerosp. Sci. 2021, 125, 100726. [Google Scholar] [CrossRef]
  15. Wortmann, L.; Hagemann, S.; Stumpf, E. A Method to Determine the Availability and Performance of Fixed-Wing Air Taxis in Real Weather Conditions for Regional Air Mobility within Germany. CEAS Aeronaut. J. 2025, 16, 485–499. [Google Scholar] [CrossRef]
  16. Wishart, J. Regional Air Mobility Market Demand Study. In Proceedings of the ARMD Systems Analysis Symposium, NASA Langley Research Center, Hampton, VA, USA, 2 November 2022; Available online: https://ntrs.nasa.gov/citations/20220015936 (accessed on 16 June 2025).
  17. Han, B. The Current Status, Problems and Countermeasures of Low Altitude Airspace Development in Chinese Civil Aviation Industry. JAST 2020, 8, 61–69. [Google Scholar] [CrossRef]
  18. Mercan, T.; Yavas, V.; Can, D.; Mercan, Y. Vertiport Location Selection Criteria for Urban Air Mobility. J. Air Transp. Manag. 2025, 124, 102760. [Google Scholar] [CrossRef]
  19. Fadhil, D.N.; Moeckel, R.; Rothfeld, R. GIS-Based Infrastructure Requirement Analysis for an Electric Vertical Take-off and Landing Vehicle-Based Transportation System. Transp. Res. Procedia 2019, 41, 101–103. [Google Scholar] [CrossRef]
  20. Wu, Z.; Zhang, Y. Integrated Network Design and Demand Forecast for On-Demand Urban Air Mobility. Engineering 2021, 7, 473–487. [Google Scholar] [CrossRef]
  21. Xu, C.; Ye, H.; Yue, H.; Tan, X.; Liao, X. Iterative construction of UAV low-altitude air route network in an urbanized region: Theoretical system and technical roadmap. Acta Geogr. Sin. 2020, 75, 917–930. [Google Scholar]
  22. Debnath, D.; Vanegas, F.; Sandino, J.; Hawary, A.F.; Gonzalez, F. A Review of UAV Path-Planning Algorithms and Obstacle Avoidance Methods for Remote Sensing Applications. Remote Sens. 2024, 16, 4019. [Google Scholar] [CrossRef]
  23. Yedavalli, P.; Cohen, A. Planning Land Use Constrained Networks of Urban Air Mobility Infrastructure in the San Francisco Bay Area. Transp. Res. Rec. 2022, 2676, 106–116. [Google Scholar] [CrossRef]
  24. Tang, H.; Zhang, Y.; Mohmoodian, V.; Charkhgard, H. Automated Flight Planning of High-Density Urban Air Mobility. Transp. Res. Part C Emerg. Technol. 2021, 131, 103324. [Google Scholar] [CrossRef]
  25. Li, J.; Shen, D.; Yu, F.; Qi, D. A Method for Air Route Network Planning of Urban Air Mobility. Aerospace 2024, 11, 584. [Google Scholar] [CrossRef]
  26. Zheng, Y.; Li, Y.; Cheng, J.; Li, C.; Hu, S. Two-Stage Hierarchical 4D Low-Risk Trajectory Planning for Urban Air Logistics. Drones 2025, 9, 267. [Google Scholar] [CrossRef]
  27. Dai, W.; Pang, B.; Low, K.H. Conflict-Free Four-Dimensional Path Planning for Urban Air Mobility Considering Airspace Occupancy. Aerosp. Sci. Technol. 2021, 119, 107154. [Google Scholar] [CrossRef]
  28. Zhang, Z.; Zheng, Y.; Li, C.; Jiang, B.; Li, Y. Designing an Urban Air Mobility Corridor Network: A Multi-Objective Optimization Approach Using U-NSGA-III. Aerospace 2025, 12, 229. [Google Scholar] [CrossRef]
  29. Xie, Y.; Gardi, A.; Liang, M.; Sabatini, R. Hybrid AI-Based 4D Trajectory Management System for Dense Low Altitude Operations and Urban Air Mobility. Aerosp. Sci. Technol. 2024, 153, 109422. [Google Scholar] [CrossRef]
  30. Zhang, N.; Zhang, M.; Low, K.H. 3D Path Planning and Real-Time Collision Resolution of Multirotor Drone Operations in Complex Urban Low-Altitude Airspace. Transp. Res. Part C Emerg. Technol. 2021, 129, 103123. [Google Scholar] [CrossRef]
  31. Zhang, H.; Tian, T.; Feng, O.; Wu, S.; Zhong, G. Research on Public Air Route Network Planning of Urban Low-Altitude Logistics Unmanned Aerial Vehicles. Sustainability 2023, 15, 12021. [Google Scholar] [CrossRef]
  32. Ma, Z.; Yang, X.; Chen, A.; Zhu, T.; Wu, J. Assessing the Resilience of Multi-Modal Transportation Networks with the Integration of Urban Air Mobility. Transp. Res. Part A Policy Pract. 2025, 195, 104465. [Google Scholar] [CrossRef]
  33. Belgiawan, P.F.; Nurliyana, C.; Wirayat, M.Y.F.; Syarif, A.T.; Safira, M.; Sunitiyoso, Y.; Irawan, M.Z. Exploring Urban Air Mobility as a Feeder to High-Speed Rail: Evidence from Jakarta–Bandung, Indonesia. Res. Transp. Bus. Manag. 2025, 61, 101414. [Google Scholar] [CrossRef]
  34. She, R.; Ouyang, Y. Efficiency of UAV-Based Last-Mile Delivery under Congestion in Low-Altitude Air. Transp. Res. Part C Emerg. Technol. 2021, 122, 102878. [Google Scholar] [CrossRef]
  35. Li, X.; Tupayachi, J.; Sharmin, A.; Martinez Ferguson, M. Drone-Aided Delivery Methods, Challenge, and the Future: A Methodological Review. Drones 2023, 7, 191. [Google Scholar] [CrossRef]
  36. Pons-Prats, J.; Živojinović, T.; Kuljanin, J. On the Understanding of the Current Status of Urban Air Mobility Development and Its Future Prospects: Commuting in a Flying Vehicle as a New Paradigm. Transp. Res. Part E Logist. Transp. Rev. 2022, 166, 102868. [Google Scholar] [CrossRef]
  37. Beijing Municipal Bureau of Economy and Information Technology; Beijing Municipal Commission of Development and Reform; Beijing Municipal Science & Technology Commission and Zhongguancun Science Park Administrative Committee. Beijing Municipal Commission of Transport Notice of the Beijing Municipal Bureau of Economy and Information Technology and Three Other Departments on Issuing the “Beijing Action Plan for Promoting the High-Quality Development of the Low-Altitude Economy Industry (2024–2027)”. Available online: https://www.beijing.gov.cn/zhengce/zhengcefagui/202409/t20240930_3910685.html (accessed on 7 July 2025).
  38. The People’s Government of Tianjin Ninghe District Notice of the People’s Government of Tianjin Ninghe District on Issuing the “Ninghe District Action Plan for High-Quality Development of the Low-Altitude Economy (2024–2026)”. Available online: https://www.tjnh.gov.cn/zwgk/zcwj/qzfwj/qzf/jnhzf/202405/t20240524_6633849.html (accessed on 30 June 2025).
  39. Department of Industry and Information Technology of Hebei Province; Transport Department of Hebei Province; Development and Reform Commission of Hebei Province. Department of Science and Technology of Hebei Province Notice on the Joint Issuance of the “Policy Measures for Accelerating the High-Quality Development of Hebei’s Low-altitude Manufacturing Industry”. Available online: https://gxt.hebei.gov.cn/hbgyhxxht/zcfg30/snzc/2025042121482076842/index.html (accessed on 7 July 2025).
  40. Hao, Y.; Wang, J. The Achievements and Prospects of Building A World-class Hub Cluster in the Beijing-Tianjin-Hebei Region. Urban Dev. Stud. 2024, 31, 28–33. [Google Scholar]
  41. Zhang, H.; Li, S.; Yi, J.; Zhong, G. Review on Urban Low-Altitude Air Route Planning. J. Nanjing Univ. Aeronaut. Astronaut. (Nat. Sci. Ed.) 2021, 53, 827–838. [Google Scholar] [CrossRef]
  42. Zhong, W.; Juan, Z.; Zong, F.; Su, H. Hierarchical Hub Location Model and Hybrid Algorithm for Integration of Urban and Rural Public Transport. Int. J. Distrib. Sens. Netw. 2018, 14, 1550147718773263. [Google Scholar] [CrossRef]
  43. Zhang, L.; Wen, H.; Lu, J.; Lei, D.; Li, S.; Ukkusuri, S.V. Exploring Cascading Reliability of Multi-Modal Public Transit Network Based on Complex Networks. Reliab. Eng. Syst. Saf. 2022, 221, 108367. [Google Scholar] [CrossRef]
  44. Schweiger, K.; Preis, L. Urban Air Mobility: Systematic Review of Scientific Publications and Regulations for Vertiport Design and Operations. Drones 2022, 6, 179. [Google Scholar] [CrossRef]
  45. He, X.; He, F.; Li, L.; Zhang, L.; Xiao, G. A Route Network Planning Method for Urban Air Delivery. Transp. Res. Part E Logist. Transp. Rev. 2022, 166, 102872. [Google Scholar] [CrossRef]
  46. Shakhatreh, H.; Sawalmeh, A.; Al-Fuqaha, A.; Dou, Z.; Almaita, E.; Khalil, I.; Othman, N.S.; Khreishah, A.; Guizani, M. Unmanned Aerial Vehicles: A Survey on Civil Applications and Key Research Challenges. IEEE Access 2019, 7, 48572–48634. [Google Scholar] [CrossRef]
  47. Bridgelall, R. Forecasting Market Opportunities for Urban and Regional Air Mobility. Technol. Forecast. Soc. Change 2023, 196, 122835. [Google Scholar] [CrossRef]
  48. Wang, Z.; Chen, Y. Exploring Spatial Patterns of Interurban Passenger Flows Using Dual Gravity Models. Entropy 2022, 24, 1792. [Google Scholar] [CrossRef]
  49. Fan, W.; Shi, Y.; Che, J.; Chen, H. Influence of Urban Street Configuration on the Location of Urban Commercial Center Based on GIS and Space Syntax. Acta Sci. Nat. Univ. Sunyatseni 2011, 50, 112–117. [Google Scholar]
  50. Hanna, S. The Natural Scale of Urban Networks: Intelligibility Is Not Scale-Free. In Proceedings of the 14th International Space Syntax Symposium (SSS14), Nicosia, Cyprus, 13–17 May 2024; Space Syntax Network: Nicosia, Cyprus, 2024; Volume 14. Available online: https://cyprusconferences.org/14sss/ (accessed on 29 June 2025).
  51. Blanchard, P.; Volchenkov, D. Intelligibility and First Passage Times in Complex Urban Networks. Proc. R. Soc. A 2008, 464, 2153–2167. [Google Scholar] [CrossRef]
  52. Full Article: Transport Network Criticality Metrics: A Comparative Analysis and a Guideline for Selection. Available online: https://www.tandfonline.com/doi/full/10.1080/01441647.2019.1703843?utm_source=chatgpt.com (accessed on 19 August 2025).
  53. Geurs, K.; Zondag, B.; de Jong, G.; de Bok, M. Accessibility Appraisal of Land-Use/Transport Policy Strategies: More than Just Adding up Travel-Time Savings. Transp. Res. Part D Transp. Environ. 2010, 15, 382–393. [Google Scholar] [CrossRef]
  54. Orobio Quiñones, J.C.; Guzmán Rodríguez, D.E.; Murillo-Hoyos, J.; Jaramillo Molina, C. Spatial Accessibility to Opportunities in the Integrated Mass Transportation System of Santiago de Cali: Equity Analysis. Int. J. Transp. Sci. Technol. 2025; in press. [Google Scholar] [CrossRef]
  55. Lai, Q.; Zhang, H.; Wang, X. Robustness Analysis and Optimization of Urban Public Transport Network Based on Complex Network Theory. Comput. Eng. Appl. 2022, 58, 249–254. [Google Scholar] [CrossRef]
  56. Airport Department, Civil Aviation Administration of China Demonstration Templates for General-Airport Construction. Available online: https://www.caac.gov.cn/HDJL/YJZJ/202503/t20250311_226914.html (accessed on 19 August 2025).
  57. Insuring the Low-Altitude Airspace Economy in China|Swiss Re. Available online: https://www.swissre.com/institute/research/topics-and-risk-dialogues/china/insuring-low-altitude-airspace-economy-china.html?utm_source=chatgpt.com (accessed on 19 August 2025).
Figure 1. Study area: (a) location of the study area in the People’s Republic of China; (b) internal administrative divisions in Beijing–Tianjin–Hebei urban agglomeration.
Aerospace 12 00777 g001
Figure 2. Evaluation results for district- and county-level general aviation airports: (a) spatial distribution of construction suitability; (b) classification and site selection outcomes.
Aerospace 12 00777 g002
Figure 3. Evaluation results for township-level vertiports: (a) spatial distribution of construction suitability; (b) classification and site selection outcomes.
Aerospace 12 00777 g003
Figure 4. Optimized route selection based on the gravity model: (a) primary routes; (b) secondary routes; (c) tertiary routes.
Aerospace 12 00777 g004
Figure 5. Corrected and enhanced route network: (a) primary routes; (b) secondary routes; (c) tertiary routes.
Aerospace 12 00777 g005
Figure 6. Spatial distribution of the low-altitude route network in the BTH urban agglomeration.
Aerospace 12 00777 g006
Figure 7. Spatial syntax analysis of the proposed LAT network: (a) global integration distribution; (b) choice value distribution. The color gradient from red to blue represents high to low values, respectively.
Aerospace 12 00777 g007
Figure 8. Spatial analysis: (a) sensitivity analysis curve of intelligence; (b) intelligence scatterplot at topological radius = 2; (c) intelligence scatterplot at radius = 9; (d) intelligence scatterplot at radius = 25; (e) scatterplot of spatial intelligibility for the proposed LAT network.
Aerospace 12 00777 g008
Table 1. Data sources for the study area.
Data TypeOriginal FormatData Source
Socioeconomic dataTabularStatistical Yearbooks of Beijing Municipality, Tianjin Municipality, and Hebei Province (2023)
Nighttime light dataRasterLuojia-1 Satellite
Road network dataVectorOpenStreetMap platform
General aviation airport dataTabularCivil Aviation Administration of China
Digital elevation model (DEM)RasterNational Geospatial Information Resource Directory Service Platform
Land-use dataVectorResource and Environment Science Data Center, Chinese Academy of Sciences
POI dataVectorAmap Open Platform
UAV no-fly zone dataRasterNational UAV Integrated Supervision Service Platform
Population densityRasterWorldPop Platform
Office rental price dataTabularFang Platform
Geological hazard distributionRasterOfficial government portals of Beijing Municipality, Tianjin Municipality, and Hebei Province
Table 2. Weight assignment for district-level and county-level general aviation airport suitability evaluation.
Goal LevelCriterion LevelIndicatorWeightCR
Evaluation of District-Level and County-Level General Aviation Airport Suitability in the BTH RegionComprehensive AttributesTotal population0.07060.0024
Regional GDP0.0545
Road network density0.0261
Number of existing GA airports0.0228
Average terrain slope0.0211
Proportion of land suitable for airport construction0.0379
Infrastructure density0.0294
Flyable area ratio0.0393
Commuting AttributesNighttime light intensity0.0266
Average office rental price0.0375
Density of enterprises0.0575
Average traffic speed0.0370
Tourism AttributesNumber of A-level scenic spots0.0601
Annual tourist volume0.1074
Logistics AttributesNumber of logistics parks0.0681
Number of transport hubs0.0690
Annual freight volume0.0569
Disaster PreventionGeological hazard susceptibility0.0671
Number of hospitals0.0598
Agricultural PotentialProportion of cultivated land0.0299
Share of primary industry output0.0217
Table 3. Weight assignment for township-level vertiport suitability evaluation.
Goal LevelCriterion LevelIndicatorWeightCR
Evaluation of Township-Level Large-Scale Vertiport Suitability in the BTH RegionComprehensive AttributesShare of primary industry output0.02170.0044
Total population0.0858
Road network density0.0362
Average terrain slope0.0321
Proportion of land suitable for vertiport construction0.0452
Infrastructure density0.0364
Flyable area ratio0.0720
Commuting AttributesNighttime light intensity0.0381
Tourism AttributesNumber of A-level scenic spots0.1120
National key tourist town designation0.1817
Logistics AttributesNumber of logistics parks0.0680
Disaster PreventionGeological hazard susceptibility0.1123
Number of hospitals0.1084
Agricultural PotentialProportion of cultivated land0.0436
Share of primary industry output0.0283
Table 4. Endurance capacities of low-altitude aircraft.
Aircraft TypeHelicopterUltralight AircrafteVTOL
Maximum Range≤800 km≤580 km≤250 km
Table 5. Technical constraints and functional orientation of route levels.
Route LevelFlight DistanceConnected NodesPrimary Function
Primary Route200–500 kmTrunk/branch airports–Class A GA airportsRegional commuting
Secondary Route100–300 kmClass A GA airports–Class A GA airportsIntra-agglomeration connectivity
Tertiary Route50–200 kmClass A GA airports–Class B GA airportsLocal access to peripheral sub-nodes
Disclaimer/Publisher’s Note: The statements, opinions and data contained in all publications are solely those of the individual author(s) and contributor(s) and not of MDPI and/or the editor(s). MDPI and/or the editor(s) disclaim responsibility for any injury to people or property resulting from any ideas, methods, instructions or products referred to in the content.