Abstract
An oscillating wing was evaluated for its ability to deliver air mass flow. The evaluation was based on exploring the oscillation parameters that provide a given mass flow rate at the least power requirement with the highest possible thrust generation. Wing oscillation was defined as coupled pitch and plunge motions. The support vector regression algorithm was implemented as a machine learning tool to link the oscillation parameters to power and thrust values. The required power and generated thrust values were computed by solving the unsteady turbulent flows around the wings. The results were also compared to the performance of an axial flow fan that delivered the same amount of air mass flow. It was found that an oscillating wing is compatible with an axial fan in terms of power requirement and thrust generation.
1. Introduction
Bio-inspired aerodynamic considerations like flapping have been increasingly studied in the last three decades as an innovative and efficient way to improve the solutions of propulsion, maneuverability, and wind energy harvesting problems. In addition to the flapping motion in air, there are also numerous studies on oscillating wings used in marine environments.
Knoller [1] and Betz [2] are recognized as the earliest researchers to explain the mechanism of thrust generation in birds. They demonstrated that the flapping motion of bird wings induces a time-varying effective angle of attack, which contributes to the simultaneous production of both lift and thrust forces. For many years, the complexity of the study has kept researchers away from investigating the oscillating motion of the wings. Recent experimental and computational studies shed some light on the aerodynamic performance of oscillating wings. Studies in the last three decades have shown that the power requirement and thrust generation in the flapping motion are closely related to the amplitude and frequency of the oscillations, the phase shift between pitch and plunge motions, and the flow Reynolds number [3].
Numerous researchers have conducted experiments on wing flapping. The aim of these experiments was to observe the dynamic stall phenomenon and boundary layer separations [4,5] and the vortex wake formation behind the foils [6,7,8], as well as to calculate energy extraction and thrust production mechanisms and aerodynamic efficiencies of flapping motion [9,10,11,12,13,14,15].
Tuncer and Platzer [16] conducted a parametric study on thrust production of a flapping airfoil. Flapping parameters were defined as reduced frequency, flapping amplitude, and coordinate shifts of the trailing airfoil. They solved Navier–Stokes equations to compute unsteady flows and compared their solutions to those of an unsteady potential flow solver. They defined the flapping motion with only sinusoidal plunging. They observed that the reduced frequency and amplitude of motion can affect propulsive efficiency in a vigorous way. Also, in a tandem configuration with a stationary airfoil, the propulsive efficiency was 40% higher than that of a single airfoil.
Xu et al. [17] investigated flapping motions through both numerical calculations and experimental measurements. A numerical analysis was performed using an unsteady Reynolds-averaged Navier–Stokes solver coupled with the Spalart–Allmaras turbulence model. A dynamic and sliding mesh technique was used to imply oscillatory motion. Experimental and numerical solutions were in good agreement. They observed that power extraction was negatively influenced by the occurrence of leading-edge vortices, while efficiency increased with the increase in pitching amplitude. The aerodynamic performance of an airfoil undergoing coupled sinusoidal plunge and pitch motions was examined by Kinsey and Dumas [18]. They found that it could attain a power coefficient of around 35 percent, similar to that of a typical wind turbine system.
Ashraf et al. [19] conducted numerical investigations to examine the effect of phase differences between sinusoidal pitching and plunging of an oscillating wing. Their findings indicated that a phase shift within the range of 90° to 110° yielded the highest power output and overall efficiency. Based on these results, they proposed that flapping wing mechanisms could serve as a novel approach for generating thrust and extracting power. Ashraf et al. [20] investigated the influence of some airfoil shape parameters on the thrust production of oscillating wings. Their results indicated that cambered airfoils do not offer a significant advantage over symmetric profiles in terms of thrust generation. Furthermore, their study revealed that thicker airfoils outperform thinner ones when the plunging amplitude is relatively large and the pitching amplitude remains low. In this study, they also investigated the effect of Reynolds number.
The optimum oscillation motion of a wing that maximizes energy harvesting from the wind was investigated by Kaya and Elfarra [21]. Their optimization process was based on the computational fluid dynamics (CFD) solutions for the sinusoidal motion of flapping wings. They validated their CFD computations with experimental results. The maximum power coefficient was calculated as 0.4 at a unity reduced frequency and a 90-degree phase shift, which was comparable with the Betz rule, which was 16/27.
While the majority of studies on oscillating wings have focused on sinusoidal pitching and plunging, some researchers have explored the impact of non-sinusoidal flapping. Tuncer and Kaya [22] reported that non-sinusoidal flapping can produce greater thrust compared to its sinusoidal counterpart. Their findings also highlighted the dominant role of plunge motion in thrust generation but suggested that higher propulsive efficiency could be achieved by reducing the plunge amplitude while increasing the pitch amplitude. Teng et al. [23] conducted numerical analyses to investigate the influence of non-sinusoidal pitching on energy harvesting performance. In their work, plunging was (passively) driven due to the hydrodynamic forces, while pitching was provided as a prescribed oscillation path. The non-sinusoidal oscillation path, which is close to a square, was prescribed based on the small changes over a sinusoidal motion. They observed that such an oscillation path is not as effective as a sinusoidal oscillation, especially if a semi-active oscillation is preferred.
Machine learning techniques have been increasingly applied to optimization problems in which the objective function is based on the solution of complex processes. For this purpose, the complex process and therefore the objective function are represented by machine learning-based metamodels. These models derive patterns from experimental or (expensive) computational datasets and mathematically represent the underlying system behavior using analytical functions. Through the integration of data-driven insights, machine learning methods like artificial neural networks (ANNs) or support vector regression (SVR) offer reliable means for prediction, optimization, and design enhancement [24]. Clarke et al. [25] introduced the support vector regression method as an alternative to common metamodel techniques such as RSM (response surface methodology), RBF, and multivariate regression methods. They stated that SVR provides at least as successful results as ANNs in many studies; moreover, SVR includes less computational cost than ANNs and creates a function from the dataset. They approximated an eighth-order function of Su and Renaud [26] with SVR using five points. In their study, where they compared SVR with other metamodel techniques, they showed that SVR fitted the data with less error than the others. Kaya [27] used support vector regression to obtain an analytical model for his CFD calculations for optimizing the wind turbine blade twist distribution. Guo et al. [28] studied multi-objective optimization of a trimaran using computational fluid dynamics calculations. They used SVR as a metamodel. They stated that support vector regression has high accuracy rates with small sample sizes while building the surrogate model.
This study proposes that an oscillating wing can be used to deliver air flow mass. The oscillation parameters were investigated using a machine learning approach based on SVR and then optimized to deliver a target mass flow rate at the lowest power value possible, with thrust generation as high as possible. The results were also evaluated by comparing them to those obtained for an axial flow fan. It is noteworthy that the thrust generation in oscillating wings can be thought of as an equivalent measure of pressure rise in axial fans.
2. Methodology
2.1. Oscillating Motion of the Wing
For the oscillating wing, we used a low-aspect-ratio untapered wing, the profile of which was the NACA0012 airfoil throughout the span. It should be noted that thickness and camber characteristics do not have significant effects on the aerodynamic loads of an oscillating wing [20].
The oscillating motion is defined by combining a sinusoidal pitch motion,
, with a sinusoidal plunge motion,
, and a phase shift,
, between them:
Here,
is the plunge amplitude. Note that
and
are normalized by the chord length.
denotes the pitch amplitude. The angular frequency of both motions is
. The pitching motion is determined considering a specified pitching center,
, on the airfoil chord. It is typically defined as a non-dimensional distance from the leading edge normalized by the chord length. An oscillating wing profile, as a combination of plunging and pitching with a phase shift,
, is illustrated in Figure 1.
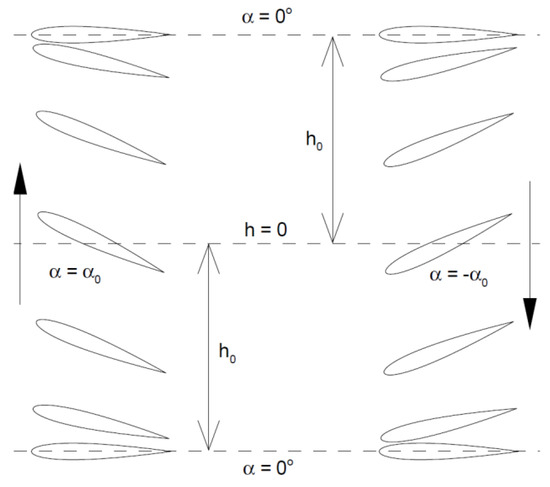
Figure 1.
A plunging and pitching wing from side view with a 90-degree phase shift.
When working with oscillating wings, it is common to use the non-dimensional variable, reduced frequency,
, rather than the angular frequency:
Here,
represents the freestream air velocity, while
is the chord length of the rectangular (untapered) wing.
The effective angle of attack,
, is also another common variable when studying the plunging and pitching motions:
Kaya [3] states that massive flow separations are observed at high effective angles of attack values, while low effective angles of attack cause weak flow separations.
2.2. Flow Solver
The flowfields around the oscillating wing were computed as turbulent employing a commercial CFD solver: FINE/Open [29]. The FINE/Open is a 3D, unstructured, multi-block, and multi-grid finite volume CFD software (version 9.2). One can add user subroutines to FINE/Open in order to extend its unsteady flow capabilities. The solid surfaces can be translated and/or rotated using the software’s internal commands or user subroutines. In this study, the oscillating wing and the mesh around it were moved using rigid body motion, that is, without deforming the mesh cells.
The governing URANS equation solved by the FINE/Open is given below:
Here,
is the conservative variables defined at the control volume,
.
and
are the inviscid and viscous flux vectors acting on the control volume surface,
, respectively. FINE/Open integrates this equation in a time-accurate manner using an implicit finite volume algorithm based on the dual time stepping, while the fluxes were approximated by second-order central formulations.
The eddy viscosity in the flowfield solutions was calculated using the Spalart–Allmaras turbulence model. This turbulence model is widely used when computing the turbulent flowfields around the oscillating wings, and its accuracy has been validated by several researchers working on flapping motion [30,31,32,33,34,35,36,37].
2.3. Support Vector Regression
Support vector regression (SVR) is a supervised machine learning algorithm designed to predict a single continuous output variable based on one or more input features. The general form is a surrogate function that is a metamodel approximating the input–output relationship as given in Equation (6).
Here,
denotes the vector of input variables, while
represents the predicted output provided by the metamodel, which aims to mimic the true output variable
. The
operation is the scalar product of the weights,
, with the so-called feature mapping function,
, of
. The bias in the model is denoted by the constant b. In the present work, the open source library LIBSVM, developed by Chang and Lin [38], was employed to estimate the model parameters—namely the weight vector and bias term—in the support vector regression framework. For the feature mapping function, the widely used Radial basis function (RBF) kernel was selected, enabling the SVR model to capture nonlinear input–output relationships effectively.
In this study, two separate SVR models were trained, which both use the same set of input variables: the parameters that define the oscillation motion of the wing. The first model was trained to predict the required power for sustaining the prescribed oscillation, while the second one estimated the produced thrust. It is important to emphasize that both power and thrust values were calculated once the flowfields were computed. Then, these two SVR models were constructed as metamodels to establish a mathematical relationship between the oscillation parameters (input) and the corresponding power/thrust values (output).
Equation (7) shows the input and output variables studied in this work. As seen from the equation, there are five input parameters that define the wing oscillation.
2.4. Optimization
In this study, two optimization problems were considered. The first one was maximizing thrust generation under some geometrical constraints on the oscillation. It should be noted that an upper limit for the power requirement is also a constraint. The second optimization problem was solved for the minimum power requirement under geometric constraints again. In this second problem, there was also a constraint on thrust generation, which was limited from below. Equation (8) shows both optimization problems studied.
In the equation,
is the highest power value allowed, while
denotes the lowest thrust value that must be obtained above.
and
are lower and upper geometric limits for the oscillation parameters.
It is important to note that the objective functions, the required power,
, and the produced thrust,
are the metamodels obtained using support vector regression.
3. Validation of the CFD Tool for Wing Oscillation
The solver was validated using the available data from experimental studies on steady and unsteady flows [39,40]. For this purpose, firstly, the spatial resolution to be used in the meshes was determined. Secondly, we selected a proper time step size for an accurate unsteady solution.
For the determination of the mesh resolution, that is, to show the grid independence, three different grids (0.7 million cells, 2 million cells, and 6 million cells) were investigated for flow at steady-state conditions. In both grids, farfield boundaries were 30 chords away from the wing. The size of the first cell over the no-slip wing surface was such that y+ had a value of 50 there. It is important to note that the turbulence model used in the solution was the Spalart–Allmaras model with an extended wall function. Figure 2 shows the 2-million-cell grid with farfield and near wing illustrations, while boundary surfaces and planes are shown in Figure 3.
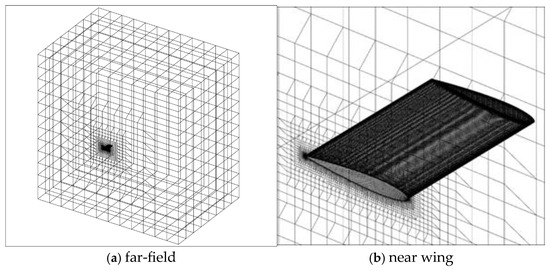
Figure 2.
Illustration of the 2-million-cell grid with farfield and near-wing views.
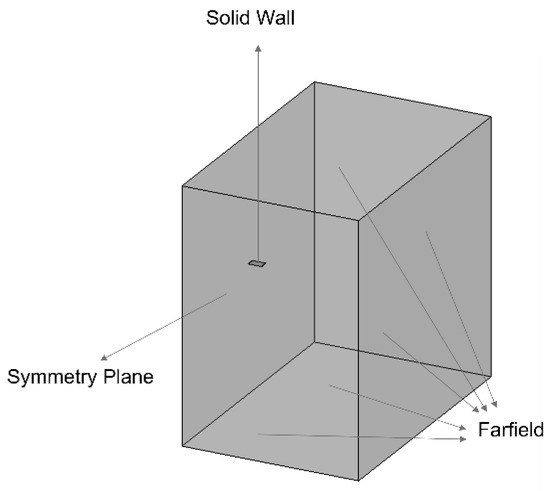
Figure 3.
Boundary conditions of the domain for CFD computations.
The case analyzed in the grid independence study, that is, the steady flow, is an experimental work by Gregory and O’Reilly [39] commonly used for the validation of the numerical studies in the literature. The wing in this experiment was a rectangular wing with the NACA0012 airfoil as the profile, the aspect ratio of which was 10. The wing underwent a 15-degree angle of attack, which is almost the stall angle. Figure 4 compares the solutions based on the 0.7-million-cell, 2-million-cell, and 6-million-cell meshes by also validating their results against the experimentally obtained pressure coefficient values on the upper surface of the wing. It should be noted that Gregory and O’Reilly published the lift coefficient for the whole wing under the 15-degree angle of attack, although they presented the pressure coefficient distribution only on the upper surface. It is clearly seen from Figure 4 that solutions based on 2-million-cell and 6-million-cell meshes are both in good agreement with the experimental measurements. Moreover, the lift coefficient measured by Gregory and O’Reilly was
, which is almost the same value calculated in this study, where the solutions with 2-million-cell and 6-million-cell meshes predicted
as 1.49 and 1.50, respectively. It is noteworthy that the coarsest grid, which was the mesh with 0.7 million cells, was far from being in good agreement with the experimental values. Hence, the mesh with two million cells was selected for further computations.
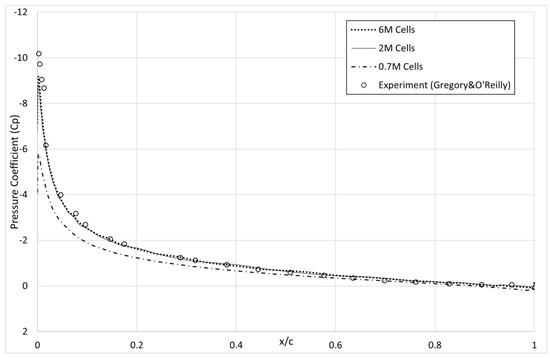
Figure 4.
Validation and grid independence study in terms of the pressure coefficient distribution [39].
Two different time step sizes were tested to decide on the temporal resolution. The unsteady flow analyzed for this purpose was an oscillating wing problem with high amplitude and high frequency (ho = 1.0, αo = 11.4°, k = 0.628). This is a case from the experimental work by Simpson [40], who investigated the unsteady flow due to the oscillation of a NACA0012 airfoil, which has coupled pitch and plunge motions. The first step size employed led to 500 time steps for one cycle of the oscillation motion, while the other time step completed one cycle of oscillation with 2500 time steps; that is, the first step size was 5 times larger than the second one. Figure 5 compares the unsteady drag coefficient calculated based on these two time steps. It is observed that both step sizes produce almost the same solution. Moreover, the unsteady lift coefficient based on the larger time step (500 steps in a single oscillation cycle) was compared to the experimental measurement, which is given in Figure 6. It is clearly seen that the computed history of the lift coefficient along an oscillation cycle is in good agreement with the experimental data. Therefore, the larger step size for time was selected for further computations. It is also observed from the figure that some computed instantaneous values differ from the experiment at a few temporal locations during the motion. These locations are the phases when the effective angle of attack (Equation (4)) is near its highest value. It should be noted that this is a high-frequency oscillation case. Moreover, high instantaneous values of the effective angle of attack led to the formation of massive flow separations, as stated in Section 2.1. This might be the reason for the difference between computations and experiments. Taking also the average values (Section 4) over an oscillation cycle into consideration, one can say that these differences do not have a significant effect on the overall average value.
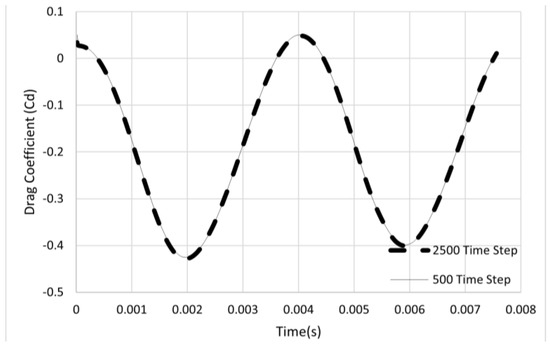
Figure 5.
Time step comparison for the unsteady flow solutions.
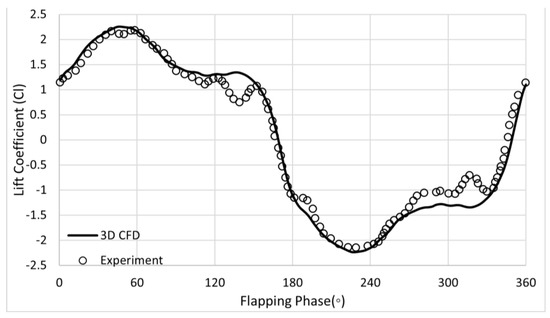
Figure 6.
Validation of the computed unsteady lift coefficient against experiment.
4. Power and Thrust of the Oscillating Wing
The power requirement, P, of the oscillating wing was calculated as an average value during an oscillation cycle, T, as follows:
Here, L is the time-varying lift force acting on the wing,
is the velocity of the plunge motion, M is the pitching moment about the pitching center, and
denotes the angular velocity due to the pitch motion. The generated thrust, F, during an oscillation cycle is also given as an average value:
Here, D refers to the time-dependent drag force acting on the wing.
in Equations (9) and (10) is any instantaneous time during the oscillation. In the calculations,
was taken as the beginning of the third cycle.
A comparison was made between the power required by the oscillating wing and that of an axial flow fan delivering the same mass flow. The generated thrust, which can be thought of as a measure of the pressure rise, was also considered while evaluating the performance.
The axial flow fan used for comparison was the B2 Fan investigated by Bruneau [41] and Wilkinson and Spuy [42]. The performance of the B2 Fan is depicted in Figure 7 in terms of power and the static pressure rise values obtained from both experiments and computations at a rotational speed of 750 RPM. These values are given for outlet pressure and temperature values of 100,300 Pa and 297 K, respectively. Figure 8 shows only the computed values by converting the pressure rise to generated thrust. In this study, a single case of air mass flow was investigated, which was the case with the rate of 15.4 m3/s. This case was selected because it required almost the highest power with moderate thrust generation. As seen from Figure 7 and Figure 8, the B2 Fan required a power value in the range of 5000–6000 W to deliver the mentioned air mass flow rate. The pressure rise for this case was approximately 200 Pa, corresponding to the thrust generation of about 340 N.
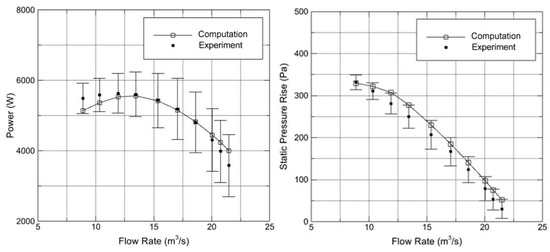
Figure 7.
Power consumption and pressure rise performance of the B2 Fan.
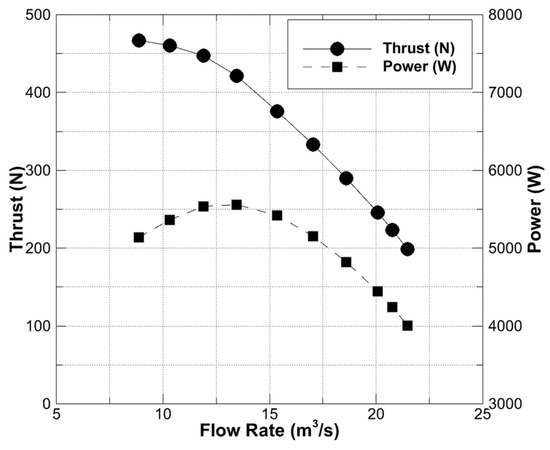
Figure 8.
Required power and generated thrust of the B2 Fan.
Through the optimization problems solved in this study, we implicitly sought to optimize the required power for the oscillation motion to be as close as possible to the 5000–6000 W range for the mass flow rate of 15.4 m3/s, while thrust generation is as close as possible to the value of 340 N.
5. Design of Experiment (DoE)
Machine learning can be thought of as a white box that relates the input and output using some mathematical functions. In order to determine the parameters of these functions, that is, to train the machine learning algorithm, a dataset comprising input–output pairs is required. In this study, this dataset was constructed using the design of experiment (DOE) technique. DOE techniques facilitate the efficient selection of experiments (or numerical cases) to be performed [43].
The design of experiment technique employed in this study is the Box–Behnken method [44]. The basics, advantages, and disadvantages of the Box–Behnken method, which is a commonly used design of experiment (DoE) technique in machine learning or response surface methodology, were examined by Ferreira et al. [45]. They stated that the Box–Behnken method is much more efficient than the three-level full factorial design of experiment methods, comparing the number of variables to the number of experiment ratios. An advantage of the Box–Behnken method is that experiments are not carried out with design limits.
The Box–Behnken method was used with five variables, since wing oscillation was defined using the following parameters:
1. Reduced frequency, k;
2. Pitch amplitude,
;
4. Plunge amplitude,
;
3. Phase shift between plunging and pitching,
;
5. Pitching center,
;
This means that the input vector to the machine learning algorithm had five components, while the output vector had two components, namely the required power and the generated thrust values.
If one has 5 input variables, the number of experiments, that is, the number of CFD cases to be analyzed, is 41 according to the Box–Behnken method. It should be noted that the number of experiments does not depend on the number of output variables. While constructing the list of the experiments (41 CFD analyses), the Box–Behnken method required the minimum, intermediate, and maximum values of the input variables, which are given in Table 1. Table 2 shows a few cases from the list of 41 CFD analyses, while the full design of experiment is given in Appendix A.

Table 1.
Minimum, maximum, and intermediate values of the input variables for the Box–Behnken method.

Table 2.
List of the CFD analyses (so-called experiments or cases) given by the Box–Behnken method.
6. Results
All 41 cases listed in Table 2 were solved for a freestream velocity of 8.19 m/s, which corresponds to the mass flow rate of 15.4 m3/s in the B2 Fan investigations. Moreover, in order to match the inlet area of the B2 Fan, the span of the oscillating wing was kept at 1.494 m for all the cases, in which the flow window size was determined according to the plunging and pitching amplitudes. It should be noted that the CFD analyses were carried out using the symmetry boundary condition; that is, the generated grids were only for the half span.
The solutions were computed using parallel processing, where the flow domain (mesh) was partitioned into 16 subdomains and handled by 16 different cores of a computer processor. It should be noted that using 16 cores enhanced the speed of the computation of a typical solution by almost 10 times.
As mentioned before, each flow computation (41 cases in Table 2) was solved for three oscillation cycles, which required 1500 steps of time integration. The average required power and generated thrust, as given in Equations (9) and (10), were calculated using the instantaneous values in the last oscillation cycle.
Once the SVR models for power and thrust output were built against the input parameters, that is, the variables defining the oscillation motion, the optimization problems given in Section 2.4 (Equation (8)) were solved. Table 3 gives the results of the power minimization problem with various lower limit constraints on thrust generation. The lowest thrust value allowed in this power minimization problem is denoted in Table 3 as “desired thrust”. The results of thrust maximization with various higher limit constraints on the power requirement are given in Table 4. The highest power value allowed in this thrust maximization problem is denoted in Table 4 as “desired power”. It is important to note that the power and thrust values listed in the tables are doubled to give the full wingspan values since the computations were carried out for the half span.

Table 3.
Predictions of the SVR model,
, for minimum power under a lower thrust constraint.

Table 4.
Predictions of the SVR model,
, for maximum thrust under an upper power constraint.
Remembering that the B2 Fan delivers a mass flow rate of 15.4 m3/s, requiring a power in the range of 5000–6000 W and generating a thrust value of about 340 N, the oscillating wing appeared to show promising performance. With a power slightly larger than 6000 W, the oscillating wing could generate a 300 N thrust. It should be noted that the mechanisms and, therefore, flow physics were totally different in both cases.
The influence degree of each oscillation variable on the power requirement and thrust generation was also analyzed. For this purpose, the sensitivity of power and thrust was investigated based on their correlation with the oscillation variables using a Monte Carlo simulation with 10,000 samples. Table 5 gives the calculated correlation values. As seen from the table, the reduced frequency had the strongest correlation with both power and thrust values. The second most correlated variable was the pitching amplitude. Interestingly, the plunge amplitude had almost zero correlation with both power and thrust. This might be because of the fact that the correlation measures only a linear relation.

Table 5.
Correlation of the required power and generated thrust with oscillation variables.
Table 5.
Correlation of the required power and generated thrust with oscillation variables.
| (°) | (°) | ||||
|---|---|---|---|---|---|
| Power | 0.007 | −0.469 | 0.787 | 0.251 | −0.048 |
| Thrust | −0.007 | −0.319 | 0.819 | 0.383 | −0.103 |
The optimization results are based on the SVR metamodels. The validation of these results was carried out using extra CFD solutions on some selected cases from Table 3 and Table 4. Table 6 compares the power values predicted by the SVR model to those calculated using CFD. The first selected case is
from Table 4. This case exhibited a compatible amount of required power with that of the B2 Fan. The second case,
from Table 3, generated a quite high thrust value. The third selected case is also from Table 3, with a higher plunge amplitude:
. This case produced a compatible thrust value with the B2 Fan. According to Table 6, predictions of the SVR models were in good agreement with the CFD computations. The highest difference between SVR and CFD was about 2 percent. This shows that the optimization results based on the SVR predictions are accurate and reliable.

Table 6.
Validation of the SVR models,
and
, against the CFD results.
Table 6.
Validation of the SVR models,
and
, against the CFD results.
| (°) | (°) | Power by SVR(W) | Power by CFD (W) | Error (%) | |||
|---|---|---|---|---|---|---|---|
| 1.00 | 47.0 | 3.29 | 91.9 | 0.25 | 5400 | 5500 | 1.82 |
| 1.00 | 49.9 | 4.45 | 92.6 | 0.37 | 9684 | 9800 | 1.18 |
| 1.96 | 60.0 | 3.03 | 93.9 | 0.33 | 7928 | 7849 | 1.01 |
| (°) | (°) | Thrust by SVR (N) | Thrust by CFD (N) | Error (%) | |||
| 1.00 | 47.0 | 3.29 | 91.9 | 0.25 | 266 | 260 | 2.35 |
| 1.00 | 49.9 | 4.45 | 92.6 | 0.37 | 380 | 374 | 1.60 |
| 1.96 | 60.0 | 3.03 | 93.9 | 0.33 | 340 | 336 | 1.06 |
Figure 9 shows the power and thrust histories for the
case as a demonstration of the unsteady behavior of the required power to sustain the wing oscillation and the corresponding generated thrust due to this oscillation. These time histories were plotted for the last computed cycle, during which the average power and thrust were calculated.
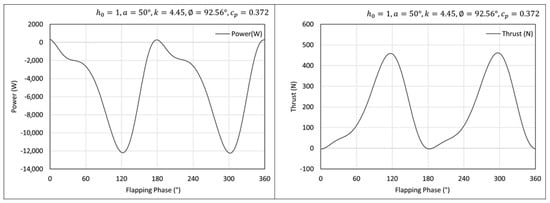
Figure 9.
Time variation of power and thrust for the oscillation motion case of
The instantaneous flowfields computed at various phases in the last cycle are shown in Figure 10 and Figure 11 in terms of the velocity. Figure 10 gives the flowfields for the optimum oscillation case, providing the maximum thrust, while the minimum power case is shown in Figure 11. As seen from both figures, leading-edge vortices formed during the upstroke and downstroke of the wing, and then they advected over the wing surface until they were shed to the wake. However, the vortex formation in Figure 10 is more clearly seen compared to Figure 11. It should also be noted that the vortices observed in Figure 10 were stronger. Therefore, one can say that the generated thrust and the required power are directly proportional to the massiveness of the vortex shedding. Furthermore, the antisymmetry between the computed flowfields during the upstroke and downstroke phases can also be clearly observed, as expected.
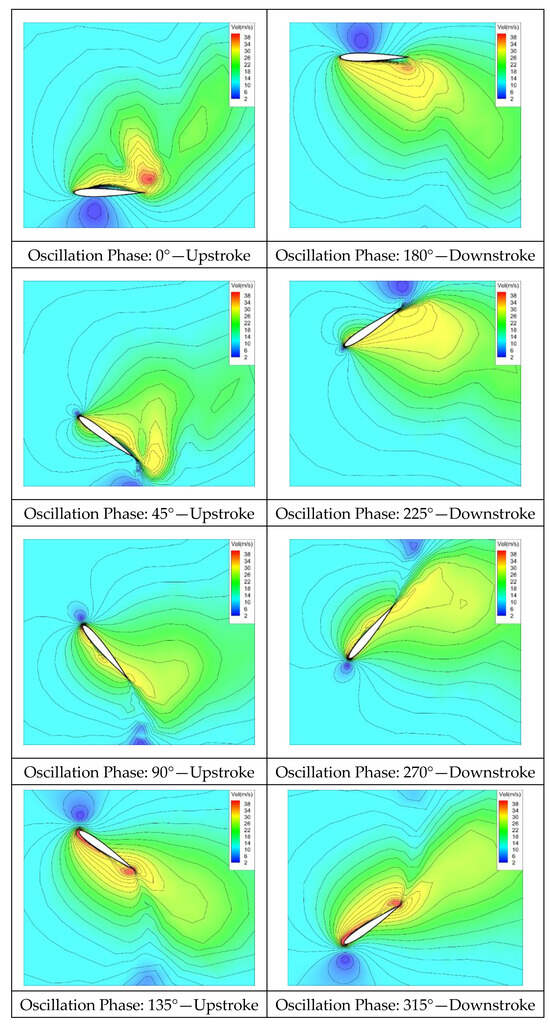
Figure 10.
Instantaneous velocity field for the oscillation motion case of
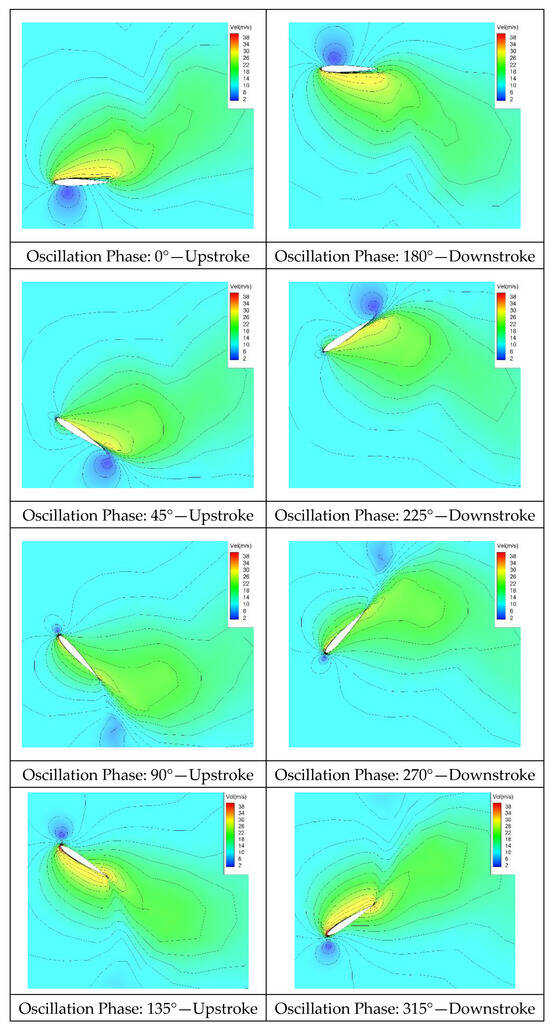
Figure 11.
Instantaneous velocity field for the oscillation motion case of
7. Conclusions
In this study, the ability of oscillating wings to deliver air mass flow was evaluated according to the required power sustaining the oscillation. The produced thrust because of this oscillation was also considered. The wing oscillation was prescribed as coupled sinusoidal plunge and pitch motions, which were based on five parameters: plunge and pitch amplitudes, oscillation frequency, pitching center, and phase shift of pitching from plunging.
The flowfields around the oscillating wing were computed by solving the unsteady Reynolds-averaged Navier–Stokes (URANS) equations for 41 different oscillation motion cases suggested by the Box–Behnken design of experiment method. The power and thrust values calculated for each case were modeled as a function of oscillation variables using the support vector regression method, which is a machine learning algorithm. Cases with the least power requirement and highest thrust generation were determined based on various constrained optimization studies.
The results and the performance of the oscillating wings were also compared to the power requirement of an axial flow fan. The thrust generation corresponding to the pressure rise concept in axial fans was also taken into consideration. The oscillating wing exhibited promising performance. A slightly greater power compared to an axial fan was required to deliver the same amount of air mass with almost 10% less thrust generation. Since the mechanisms and therefore the flow physics were totally different in both cases, this study is expected to encourage the usage of oscillating wings to deliver air mass flow like axial flow fans.
Given the fact that the flow through axial flow fans is ducted, oscillating wings in a duct will be analyzed in future work. Moreover, oscillating wings in a biplane and/or tandem configurations will be investigated to enhance the performance of air mass flow delivery.
Author Contributions
Conceptualization, M.K. and E.B.O.; methodology, M.K.; software, E.B.O.; validation, E.B.O.; formal analysis, E.B.O.; investigation, M.K.; resources, E.B.O.; writing—original draft preparation, E.B.O.; writing—review and editing, M.K.; visualization, M.K.; supervision, M.K. All authors have read and agreed to the published version of the manuscript.
Funding
This research received no external funding.
Data Availability Statement
The original contributions presented in the study are included in the article, further inquiries can be directed to the corresponding author (privacy).
Conflicts of Interest
The authors declare no conflicts of interest.
Appendix A

Table A1.
The full design of experiment parameters using the Box–Behnken method.
Table A1.
The full design of experiment parameters using the Box–Behnken method.
| Case | Reduced Frequency | Pitch Amplitude | Plunge Amplitude | Phase Shift | Pitching Center |
|---|---|---|---|---|---|
| 1 | 4 | 45 | 1.5 | 90 | 0.333 |
| 2 | 3 | 30 | 1.5 | 90 | 0.333 |
| 3 | 3 | 45 | 1.0 | 90 | 0.333 |
| 4 | 5 | 45 | 1.0 | 90 | 0.333 |
| 5 | 4 | 45 | 1.0 | 75 | 0.333 |
| 6 | 4 | 45 | 1.0 | 105 | 0.333 |
| 7 | 4 | 45 | 1.0 | 90 | 0.250 |
| 8 | 4 | 45 | 1.0 | 90 | 0.417 |
| 9 | 3 | 45 | 1.5 | 75 | 0.333 |
| 10 | 3 | 45 | 1.5 | 105 | 0.333 |
| 11 | 5 | 45 | 1.5 | 75 | 0.333 |
| 12 | 5 | 45 | 1.5 | 105 | 0.333 |
| 13 | 4 | 30 | 1.5 | 90 | 0.250 |
| 14 | 4 | 30 | 1.5 | 90 | 0.417 |
| 15 | 4 | 60 | 1.5 | 90 | 0.250 |
| 16 | 4 | 60 | 1.5 | 90 | 0.417 |
| 17 | 4 | 45 | 1.5 | 75 | 0.250 |
| 18 | 4 | 45 | 1.5 | 105 | 0.417 |
| 19 | 4 | 60 | 1.0 | 90 | 0.333 |
| 20 | 4 | 45 | 1.5 | 75 | 0.417 |
| 21 | 4 | 45 | 1.5 | 105 | 0.250 |
| 22 | 5 | 30 | 1.5 | 90 | 0.333 |
| 23 | 3 | 60 | 1.5 | 90 | 0.333 |
| 24 | 5 | 60 | 1.5 | 90 | 0.333 |
| 25 | 3 | 45 | 1.5 | 90 | 0.250 |
| 26 | 3 | 45 | 1.5 | 90 | 0.417 |
| 27 | 5 | 45 | 1.5 | 90 | 0.250 |
| 28 | 5 | 45 | 1.5 | 90 | 0.417 |
| 29 | 4 | 30 | 1.5 | 75 | 0.333 |
| 30 | 4 | 30 | 1.5 | 105 | 0.333 |
| 31 | 4 | 60 | 1.5 | 75 | 0.333 |
| 32 | 4 | 45 | 2.0 | 90 | 0.250 |
| 33 | 4 | 30 | 1.0 | 90 | 0.333 |
| 34 | 4 | 30 | 2.0 | 90 | 0.333 |
| 35 | 4 | 45 | 2.0 | 90 | 0.417 |
| 36 | 3 | 45 | 2.0 | 90 | 0.333 |
| 37 | 5 | 45 | 2.0 | 90 | 0.333 |
| 38 | 4 | 45 | 2.0 | 75 | 0.333 |
| 39 | 4 | 45 | 2.0 | 105 | 0.333 |
| 40 | 4 | 60 | 1.5 | 105 | 0.333 |
| 41 | 4 | 60 | 2.0 | 90 | 0.333 |
References
- Knoller, R. Die Gesetze des Luftwiderstandes. Flug-undMotortechnik (Wien) 1909, 3, 1–7. [Google Scholar]
- Betz, A. Bin Beitrag zur Erklaerung des Segelfluges. Z. Flugtech. Mot. 1912, 3, 269–272. [Google Scholar]
- Kaya, M. Path Optimization of Flapping Airfoils Based on Unsteady Viscous Flow Solutions. Doctoral Dissertation, Graduate School of Natural and Applied Sciences, Middle East Technical University, Ankara, Turkey, 2008. [Google Scholar]
- McCroskey, W.J.; Philippe, J.J. Unsteady viscous flow on oscillating airfoils. AIAA J. 1975, 13, 71–79. [Google Scholar] [CrossRef]
- McCroskey, W.J.; Carr, L.W.; McAlister, K.W. Dynamic stall experiments on oscillating airfoils. AIAA J. 1976, 14, 57–63. [Google Scholar] [CrossRef]
- Godoy-Diana, R.; Aider, J.L.; Wesfreid, J.E. Transitions in the wake of a flapping foil. Phys. Rev. E—Stat. Nonlinear Soft Matter Phys. 2008, 77, 016308. [Google Scholar] [CrossRef]
- Bohl, D.G.; Koochesfahani, M.M. MTV measurements of the vortical field in the wake of an airfoil oscillating at high reduced frequency. J. Fluid Mech. 2009, 620, 63–88. [Google Scholar] [CrossRef]
- Schnipper, T.; Andersen, A.; Bohr, T. Vortex wakes of a flapping foil. J. Fluid Mech. 2009, 633, 411–423. [Google Scholar] [CrossRef]
- Delaurier, J.D.; Harris, J.M. Experimental study of oscillating-wing propulsion. J. Aircr. 1982, 19, 368–373. [Google Scholar] [CrossRef]
- Triantafyllou, M.S.; Triantafyllou, G.S.; Gopalkrishnan, R. Wake mechanics for thrust generation in oscillating foils. Phys. Fluids A 1991, 3, 2835–2837. [Google Scholar] [CrossRef]
- Anderson, J.M.; Streitlien, K.; Barrett, D.S.; Triantafyllou, M.S. Oscillating foils of high propulsive efficiency. J. Fluid Mech. 1998, 360, 41–72. [Google Scholar] [CrossRef]
- Schouveiler, L.; Hover, F.S.; Triantafyllou, M.S. Performance of flapping foil propulsion. J. Fluids Struct. 2005, 20, 949–959. [Google Scholar] [CrossRef]
- Baik, Y.S.; Bernal, L.P.; Granlund, K.; Ol, M.V. Unsteady force generation and vortex dynamics of pitching and plunging aerofoils. J. Fluid Mech. 2012, 709, 37–68. [Google Scholar] [CrossRef]
- Vuruskan, A.; Fenercioglu, I.; Cetiner, O. A study on forces acting on a flapping wing. EPJ Web Conf. 2013, 45, 01028. [Google Scholar] [CrossRef]
- Mackowski, A.W.; Williamson, C.H.K. Direct measurement of thrust and efficiency of an airfoil undergoing pure pitching. J. Fluid Mech. 2015, 765, 524–543. [Google Scholar] [CrossRef]
- Tuncer, I.H.; Platzer, M.F. Thrust generation due to airfoil flapping. AIAA J. 1996, 34, 324–331. [Google Scholar] [CrossRef]
- Xu, G.D.; Xu, W.H.; Dai, J. Numerical and experimental study of a flapping foil generator. Appl. Ocean Res. 2017, 63, 242–250. [Google Scholar] [CrossRef]
- Kinsey, T.; Dumas, G. Parametric study of an oscillating airfoil in a power-extraction regime. AIAA J. 2008, 46, 1318–1330. [Google Scholar] [CrossRef]
- Ashraf, M.A.; Young, J.; Lai, J.C.S.; Platzer, M.F. Numerical analysis of an oscillating-wing wind and hydropower generator. AIAA J. 2011, 49, 1374–1386. [Google Scholar] [CrossRef]
- Ashraf, M.A.; Young, J.; Lai, J.C.S. Reynolds number, thickness and camber effects on flapping airfoil propulsion. J. Fluids Struct. 2011, 27, 145–160. [Google Scholar] [CrossRef]
- Kaya, M.; Elfarra, M. CFD based optimization of oscillatory wing motion for maximum energy harvesting from wind. Int. J. Renew. Energy Res. 2018, 8, 540–551. [Google Scholar] [CrossRef]
- Kaya, M.; Tuncer, I.H. Nonsinusoidal path optimization of a flapping airfoil. AIAA J. 2007, 45, 2075–2082. [Google Scholar] [CrossRef]
- Teng, L.; Deng, J.; Pan, D.; Shao, X. Effects of non-sinusoidal pitching motion on energy extraction performance of a semi-active flapping foil. Renew. Energy 2016, 85, 810–818. [Google Scholar] [CrossRef]
- Yondo, R.; Andrés, E.; Valero, E. A review on design of experiments and surrogate models in aircraft real-time and many-query aerodynamic analyses. Prog. Aerosp. Sci. 2018, 96, 23–61. [Google Scholar] [CrossRef]
- Clarke, S.M.; Griebsch, J.H.; Simpson, T.W. Analysis of support vector regression for approximation of complex engineering analyses. J. Mech. Des. 2005, 127, 1077–1087. [Google Scholar] [CrossRef]
- Su, J.; Renaud, J.E. Automatic Differentiation in Robust Optimization. AIAA J. 1997, 35, 1072–1079. [Google Scholar] [CrossRef]
- Kaya, M. A CFD based application of support vector regression to determine the optimum smooth twist for wind turbine blades. Sustainability 2019, 11, 4502. [Google Scholar] [CrossRef]
- Guo, J.; Zhang, Y.; Chen, Z.; Feng, Y. CFD-based multi-objective optimization of a waterjet-propelled trimaran. Ocean Eng. 2020, 195, 106755. [Google Scholar] [CrossRef]
- NUMECA International. FINE/Open Software Package, ver.6.1; User Manual; NUMECA International: Brussels, Belgium, 2017. [Google Scholar]
- Alberti, L.; Carnevali, E.; Costa, D.; Crivellini, A. A Computational Fluid Dynamics Investigation of a Flapping Hydrofoil as a Thruster. Biomimetics 2023, 8, 135. [Google Scholar] [CrossRef]
- Pang, X.; Zhang, B.; Yao, H. Study on energy harvest performance of a flapping hydrofoil with swept leading edges by numerical methods. Ocean Eng. 2024, 312, 119336. [Google Scholar] [CrossRef]
- Kinsey, T.; Dumas, G. Computational Fluid Dynamics Analysis of a Hydrokinetic Turbine Based on Oscillating Hydrofoils. J. Fluids Eng. 2012, 134, 021104. [Google Scholar] [CrossRef]
- Ma, P.; Wang, Y.; Xie, Y.; Han, J.; Sun, G.; Zhang, J. Effect of wake interaction on the response of two tandem oscillating hydrofoils. Energy Sci. Eng. 2019, 7, 431–442. [Google Scholar] [CrossRef]
- Mo, W.; He, G.; Ghassemi, H.; Yang, H.; Mao, W. Wake vortex structures and hydrodynamics performance of a power-extraction flapping hydrofoil. Phys. Fluids 2023, 35, 025105. [Google Scholar] [CrossRef]
- Ol, M.V.; Reeder, M.; Fredberg, D.; McGowan, G.Z.; Gopalarathnam, A.; Edwards, J.R. Computation vs. Experiment for High-Frequency Low-Reynolds Number Airfoil Plunge. Int. J. Micro Air Veh. 2009, 1, 99–119. [Google Scholar] [CrossRef]
- Srinivasan, G.R.; Ekaterinaris, J.A.; McCroskey, W.J. Evaluation of turbulence models for unsteady flows of an oscillating airfoil. Comput. Fluids 1995, 24, 833–861. [Google Scholar] [CrossRef]
- Alberti, L.; Carnevali, E.; Crivellini, A. Assessment of a RANS Transition Model with Flapping Foils at Moderate Reynolds Numbers. Fluids 2023, 8, 23. [Google Scholar] [CrossRef]
- Chang, C.C.; Lin, C.J. LIBSVM: A Library for support vector machines. ACM Trans. Intell. Syst. Technol. 2011, 2, 27. [Google Scholar] [CrossRef]
- Gregory, N.; O’Reilly, C.L. Low-Speed Aerodynamic Characteristics of NACA 0012 Aerofoil Section, including the Effects of Upper-Surface Roughness Simulating Hoar Frost. Aeronaut. Res. Counc. Rep. Memo. 1970, 3726, 35. [Google Scholar]
- Simpson, B. Experimental Studies of Flapping Foils for Energy Extraction. Master's Thesis, Massachusetts Institute of Technology, Cambridge, MA, USA, 2009. [Google Scholar]
- Bruneau, P.R.P. The Design of a Single Rotor Axial Flow Fan for a Cooling Tower Application. Ph.D. Thesis, University of Stellenbosch, Stellenbosch, South Africa, 1994. [Google Scholar]
- Wilkinson, M.B.; Van Der Spuy, S.J. The effect of fan tip configuration on air-cooled condenser axial flow fan performance. In Proceedings of the International Conference on Fan Noise, Fan Technology and Numerical Methods, Lyon, France, 15–17 April 2015. [Google Scholar]
- Cavazzuti, M. Optimization Methods: From Theory to Design, 1st ed.; Springer: Berlin/Heidelberg, Germany, 2013; Volume 53, ISBN 978-3-642-31186-4. [Google Scholar]
- Box, G.; Behnken, D. Some new three level designs for the study of quantitative variables. Technometrics 1960, 2, 455–475. [Google Scholar] [CrossRef]
- Ferreira, S.L.C.; Bruns, R.E.; Ferreira, H.S.; Matos, G.D.; David, J.M.; Brandão, G.C.; da Silva, E.G.P.; Portugal, L.A.; dos Reis, P.S.; Souza, A.S.; et al. Box-Behnken design: An alternative for the optimization of analytical methods. Anal. Chim. Acta 2007, 597, 179–186. [Google Scholar] [CrossRef]
Disclaimer/Publisher’s Note: The statements, opinions and data contained in all publications are solely those of the individual author(s) and contributor(s) and not of MDPI and/or the editor(s). MDPI and/or the editor(s) disclaim responsibility for any injury to people or property resulting from any ideas, methods, instructions or products referred to in the content. |
© 2025 by the authors. Licensee MDPI, Basel, Switzerland. This article is an open access article distributed under the terms and conditions of the Creative Commons Attribution (CC BY) license (https://creativecommons.org/licenses/by/4.0/).