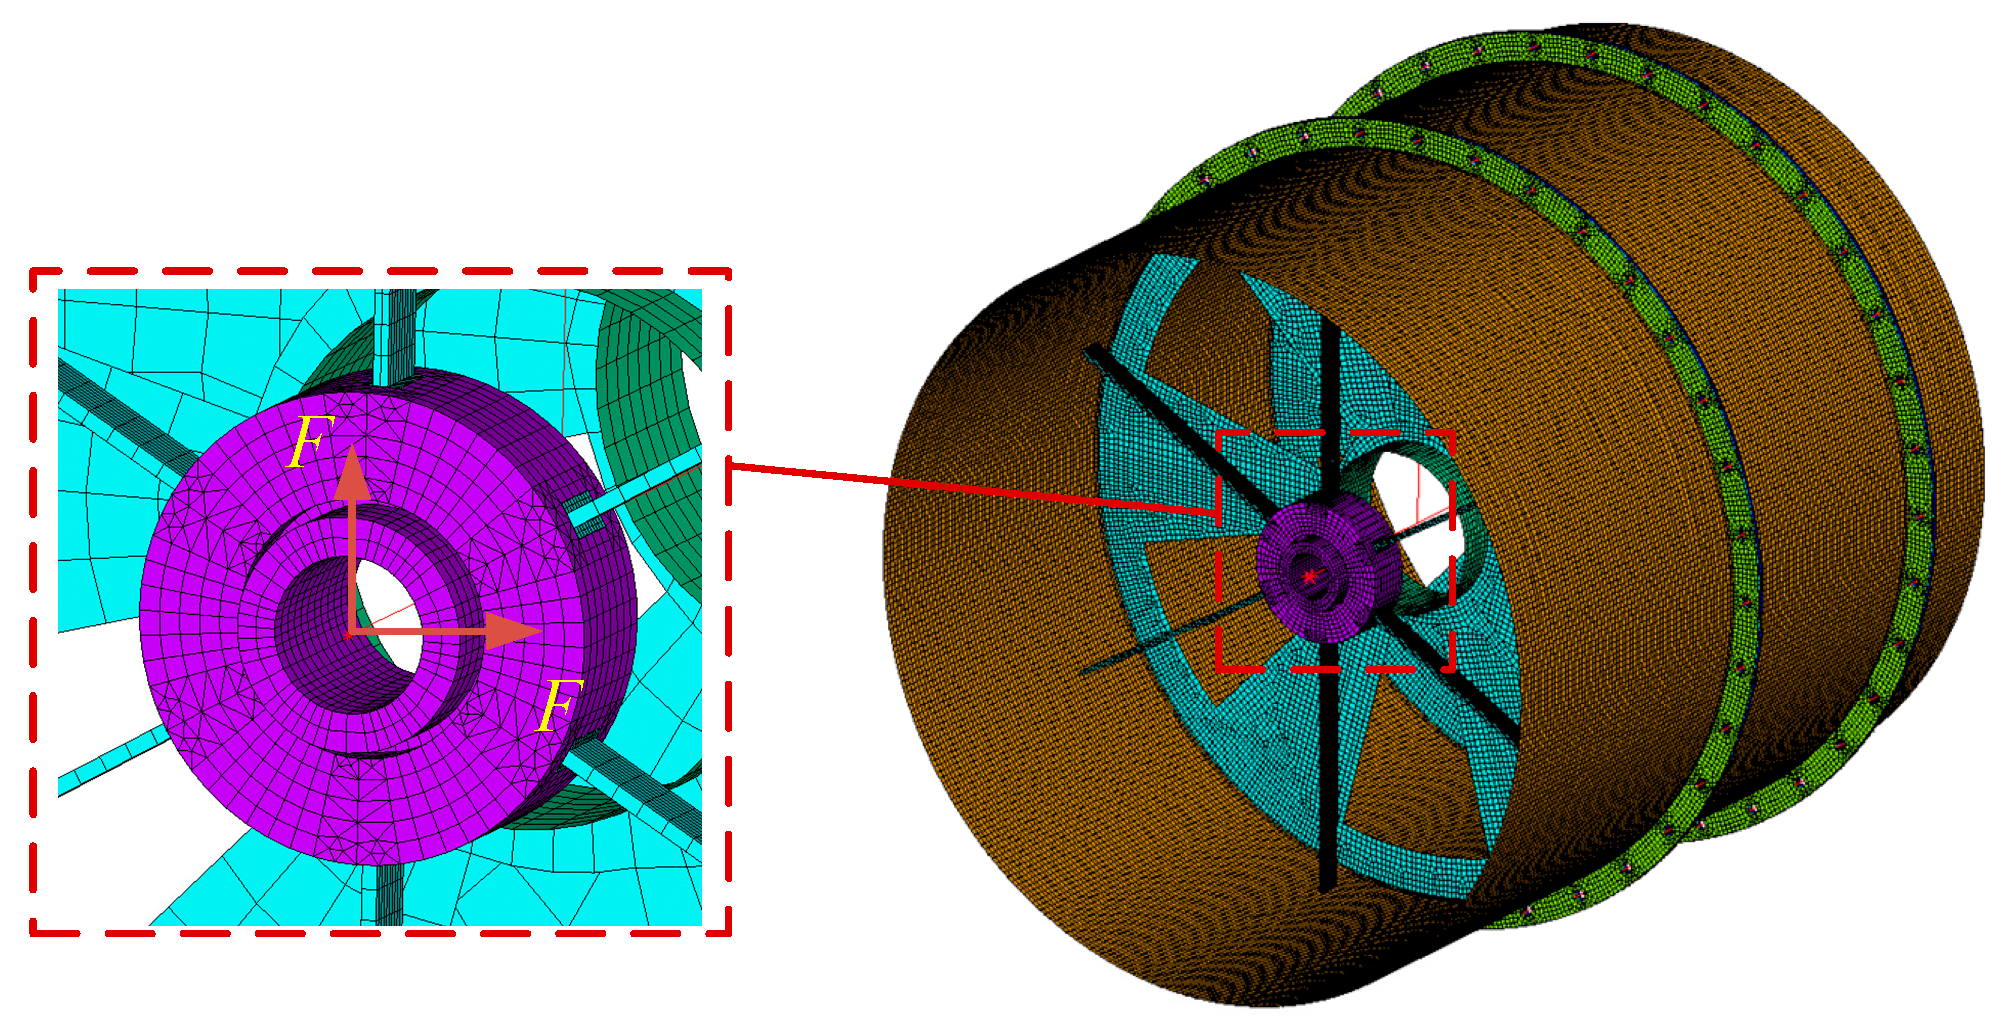
Figure 1.
Three-dimensional model of rotor–stator coupled structure.
Figure 1.
Three-dimensional model of rotor–stator coupled structure.
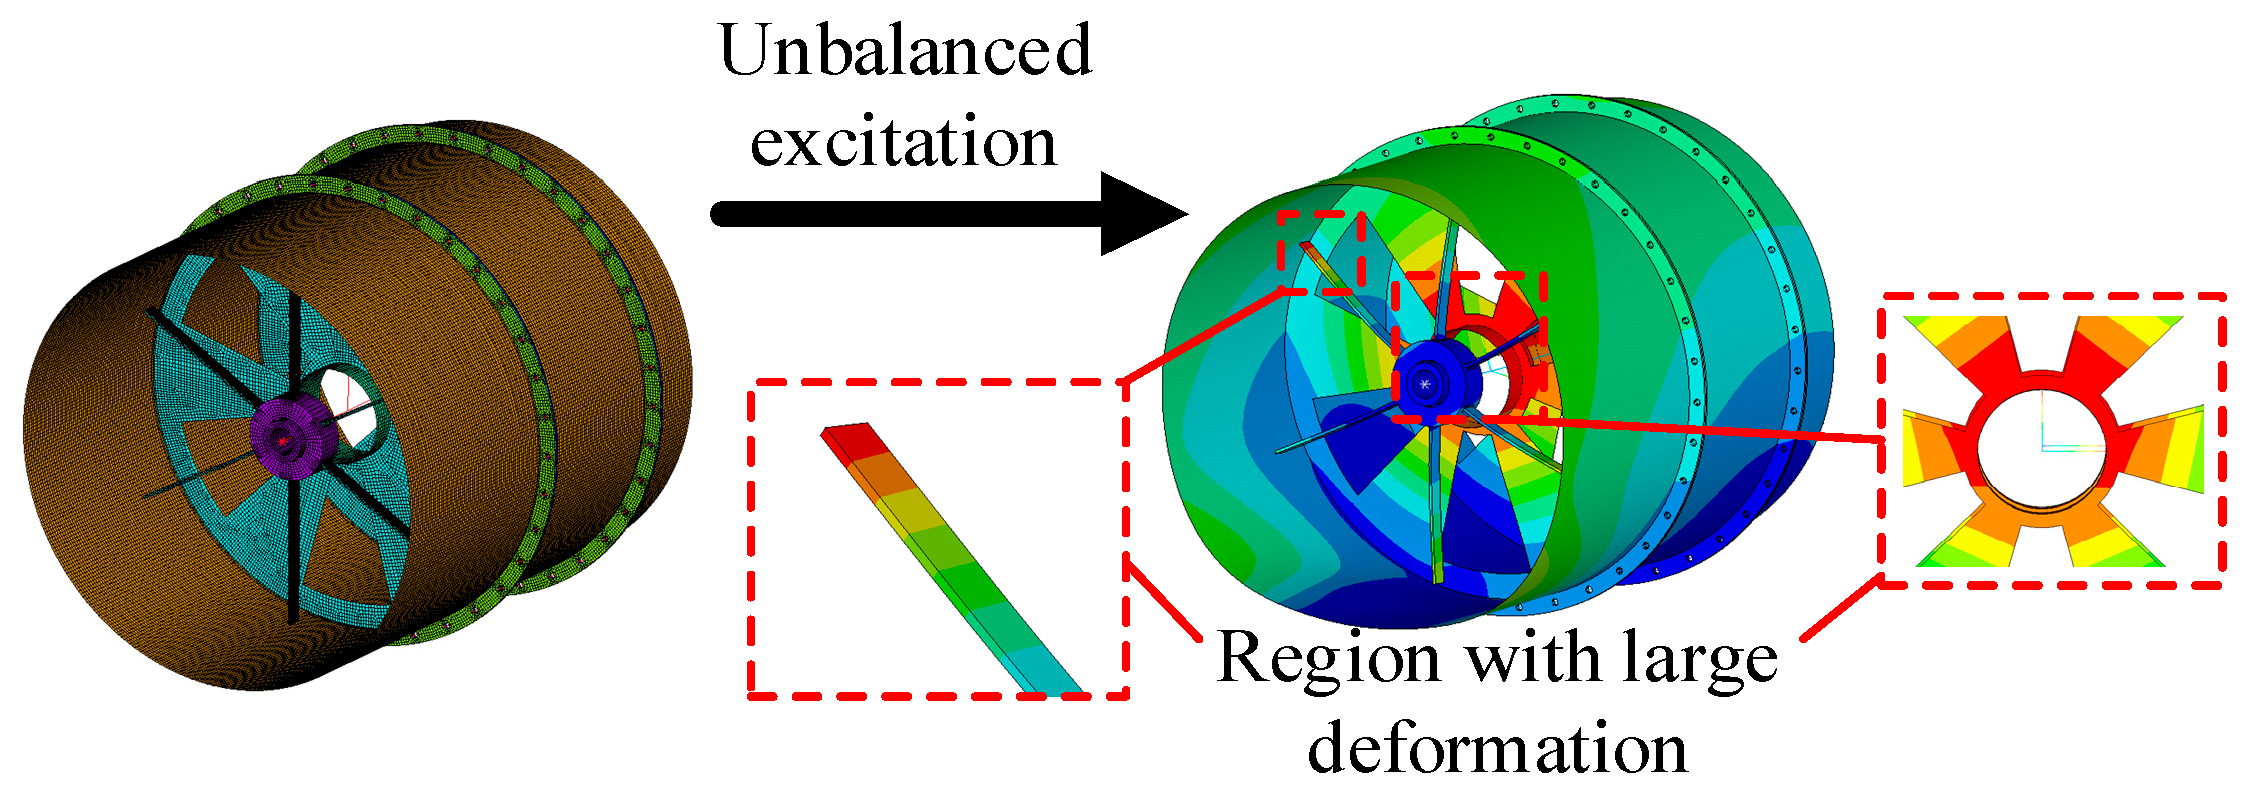
Figure 2.
Large deformation region of coupled structure.
Figure 2.
Large deformation region of coupled structure.
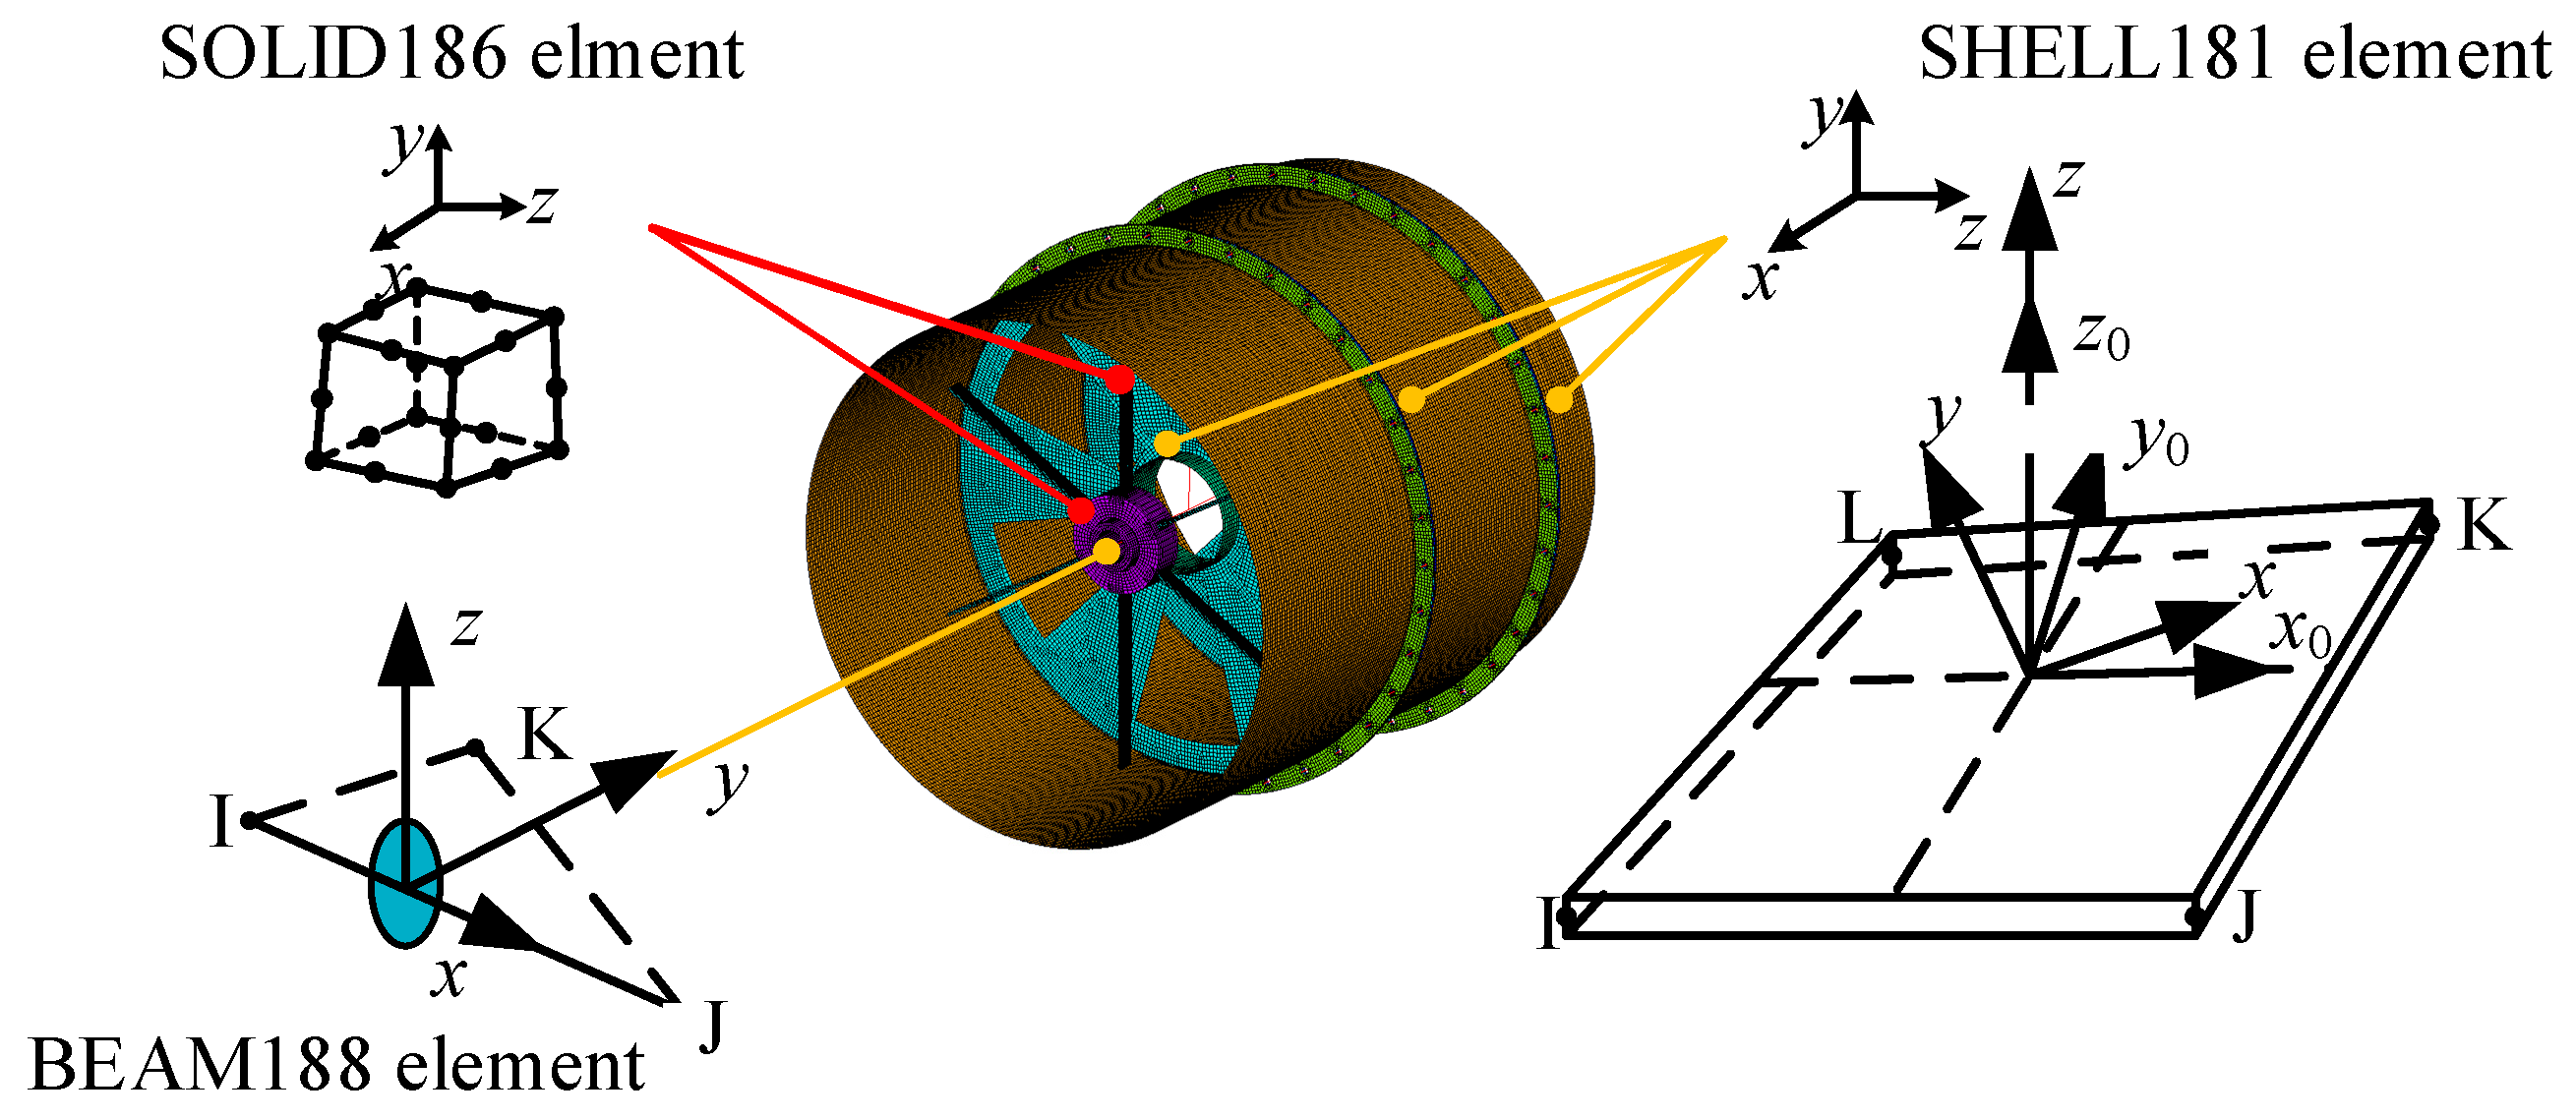
Figure 3.
Modeling idea of rotor–stator coupled structure.
Figure 3.
Modeling idea of rotor–stator coupled structure.
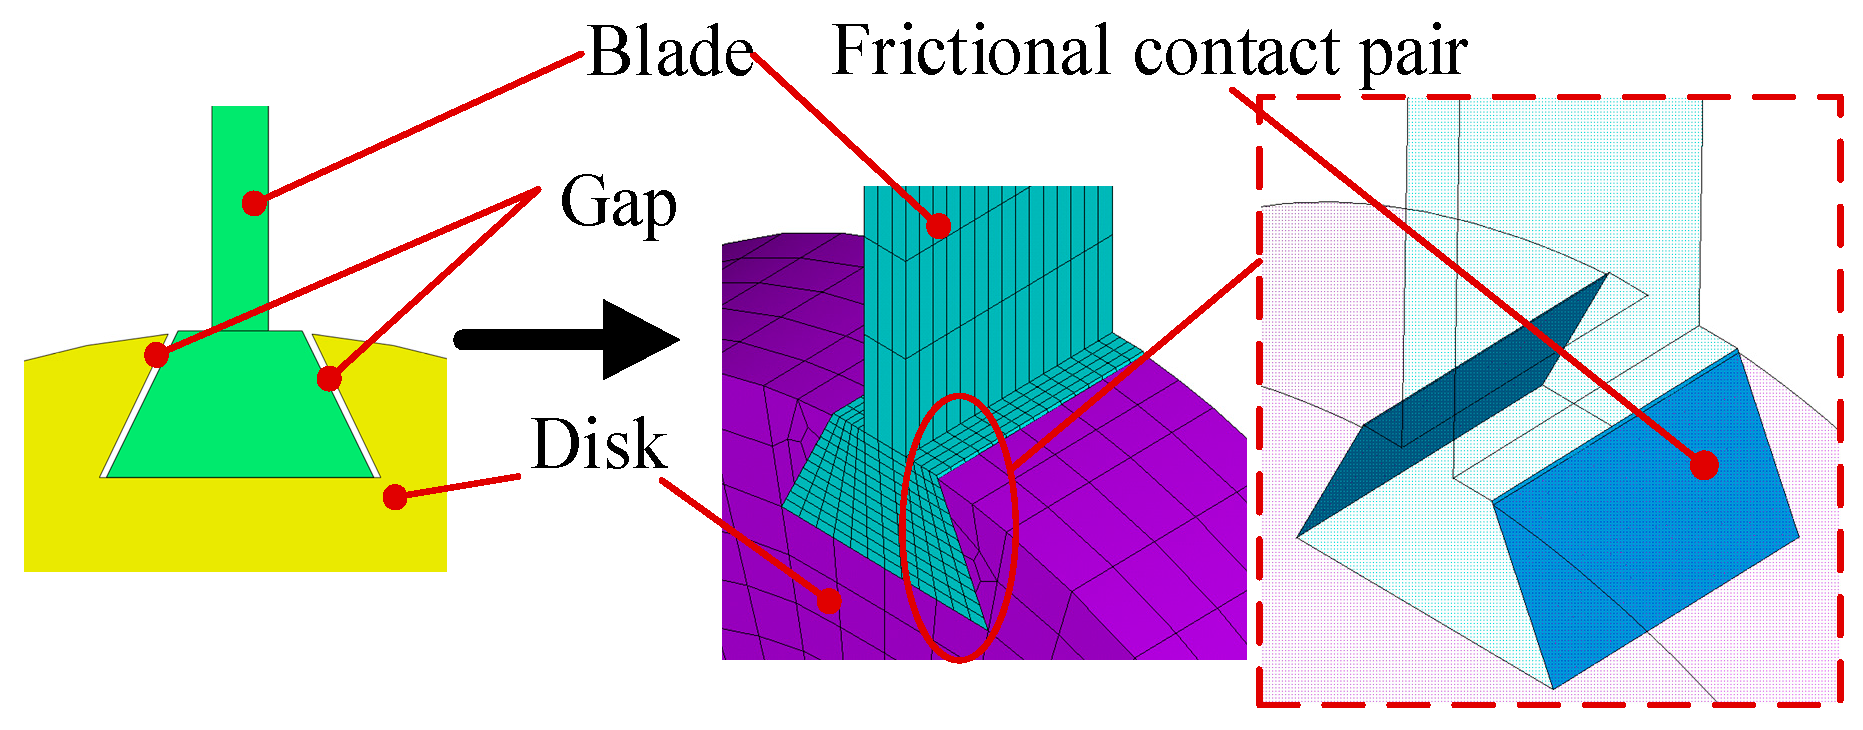
Figure 4.
Dovetail connection between blade tenons and disk grooves.
Figure 4.
Dovetail connection between blade tenons and disk grooves.
Figure 5.
Tenon-blade stop ring coupling method based on friction contact.
Figure 5.
Tenon-blade stop ring coupling method based on friction contact.
Figure 6.
Bolt connection structure of stator.
Figure 6.
Bolt connection structure of stator.
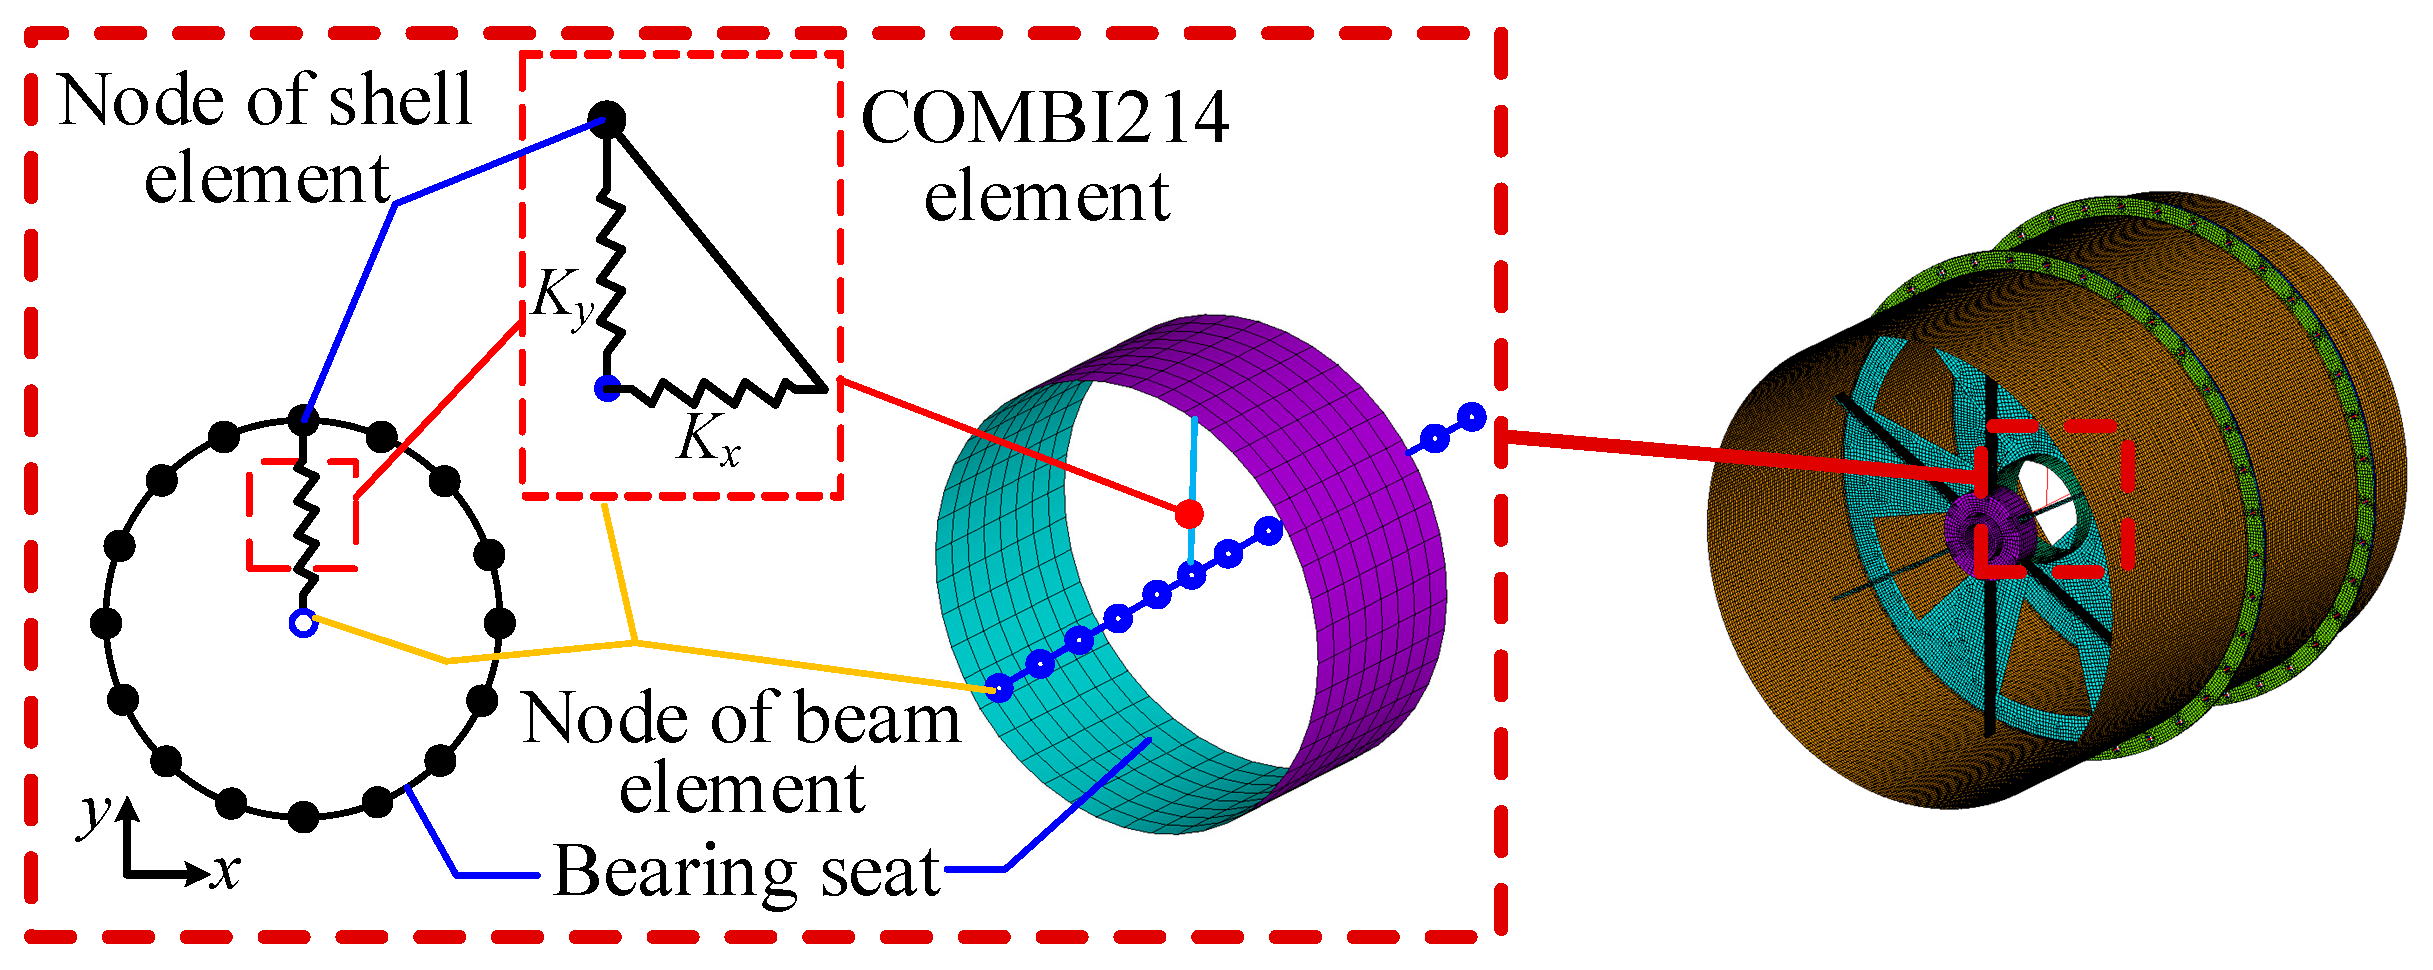
Figure 7.
Schematic diagram of spring element simulating bearing.
Figure 7.
Schematic diagram of spring element simulating bearing.
Figure 8.
Simulation of imbalance forces.
Figure 8.
Simulation of imbalance forces.
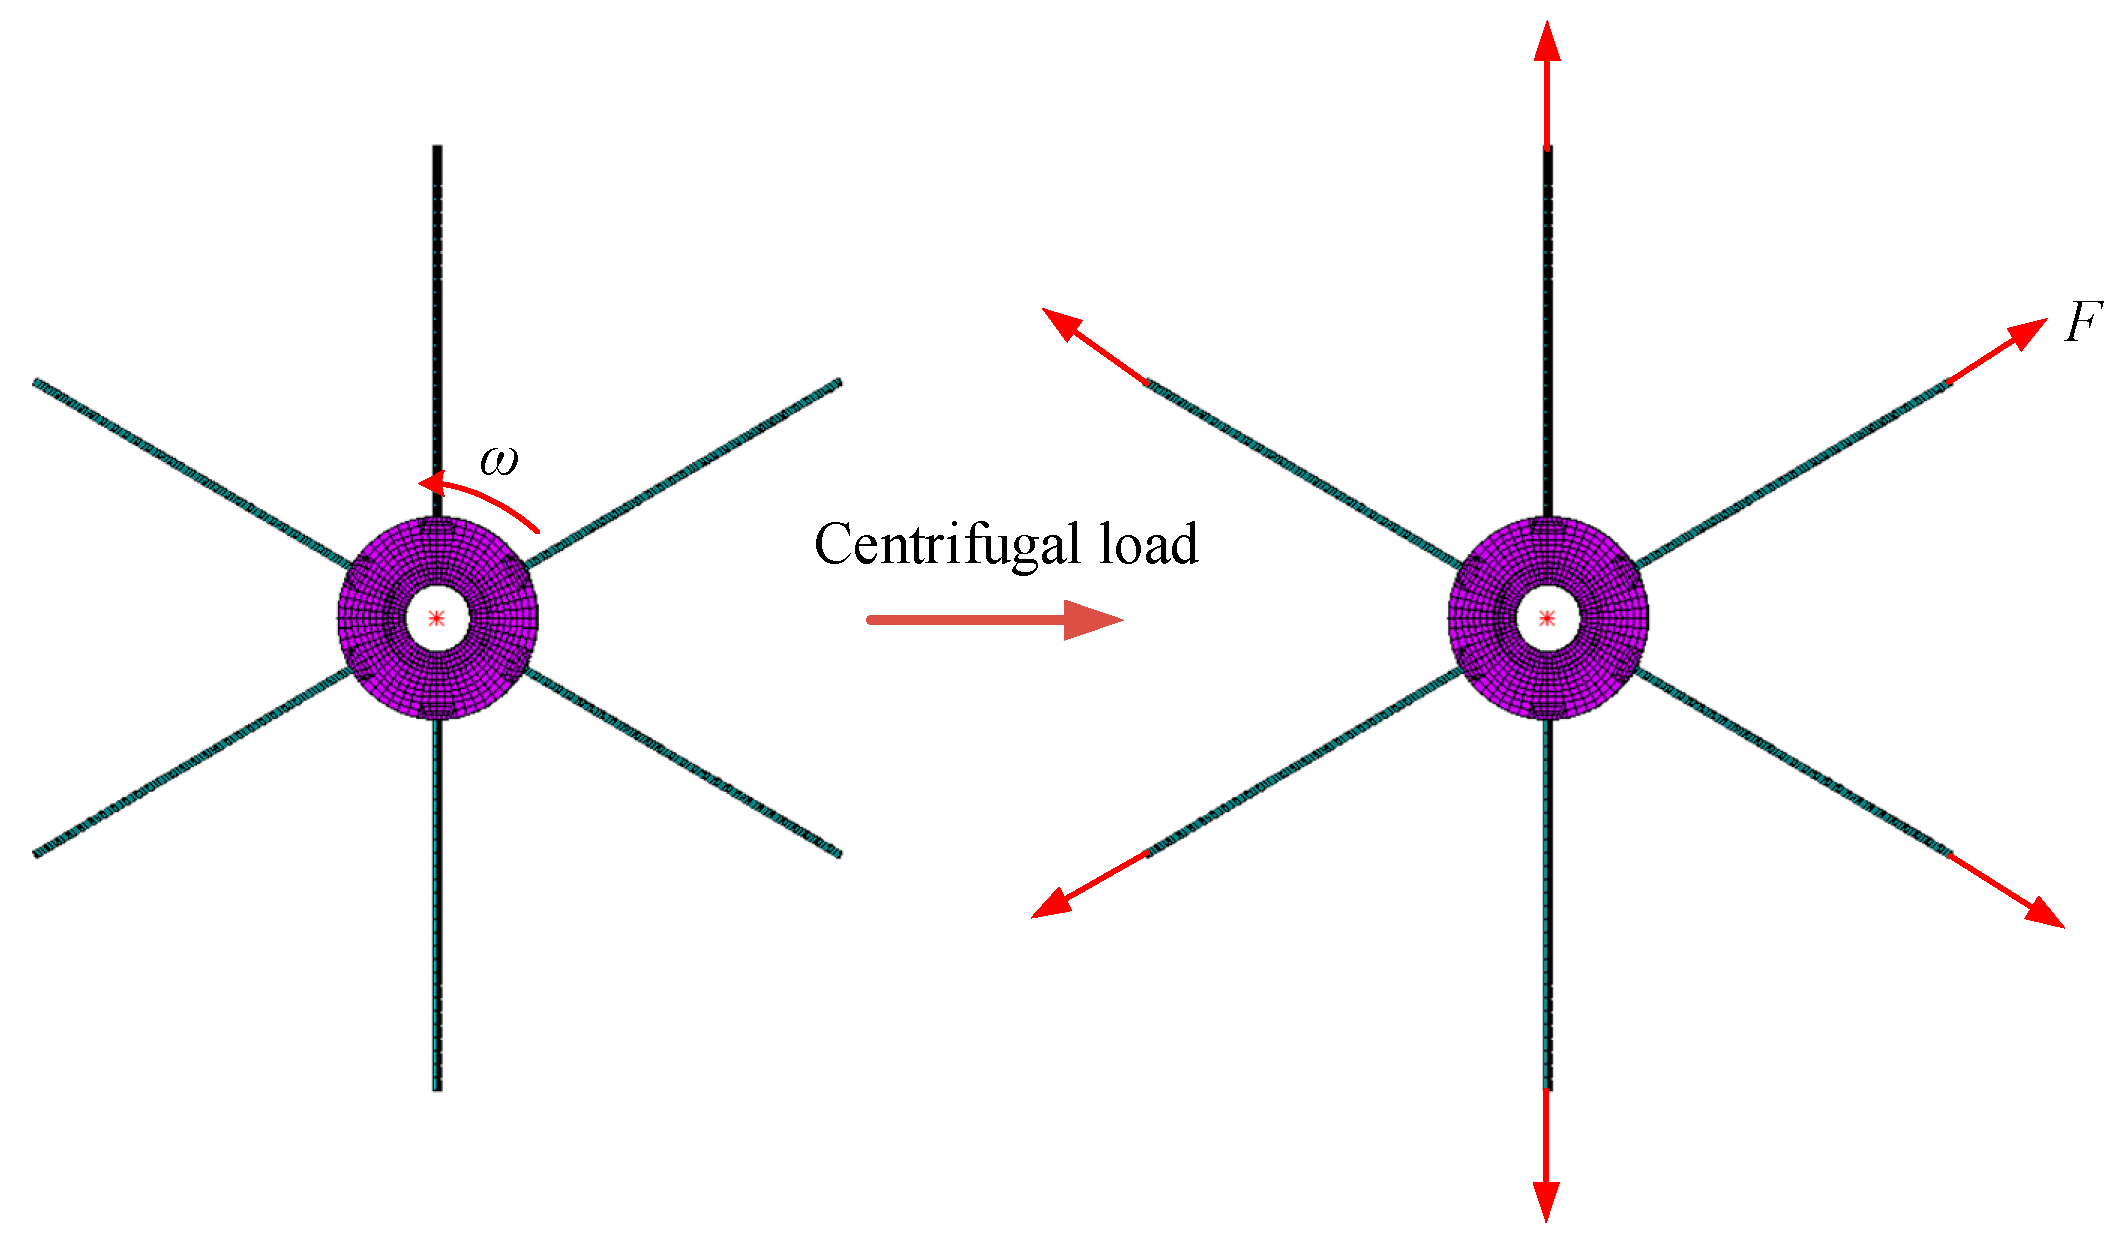
Figure 9.
Schematic diagram of applying centrifugal load.
Figure 9.
Schematic diagram of applying centrifugal load.
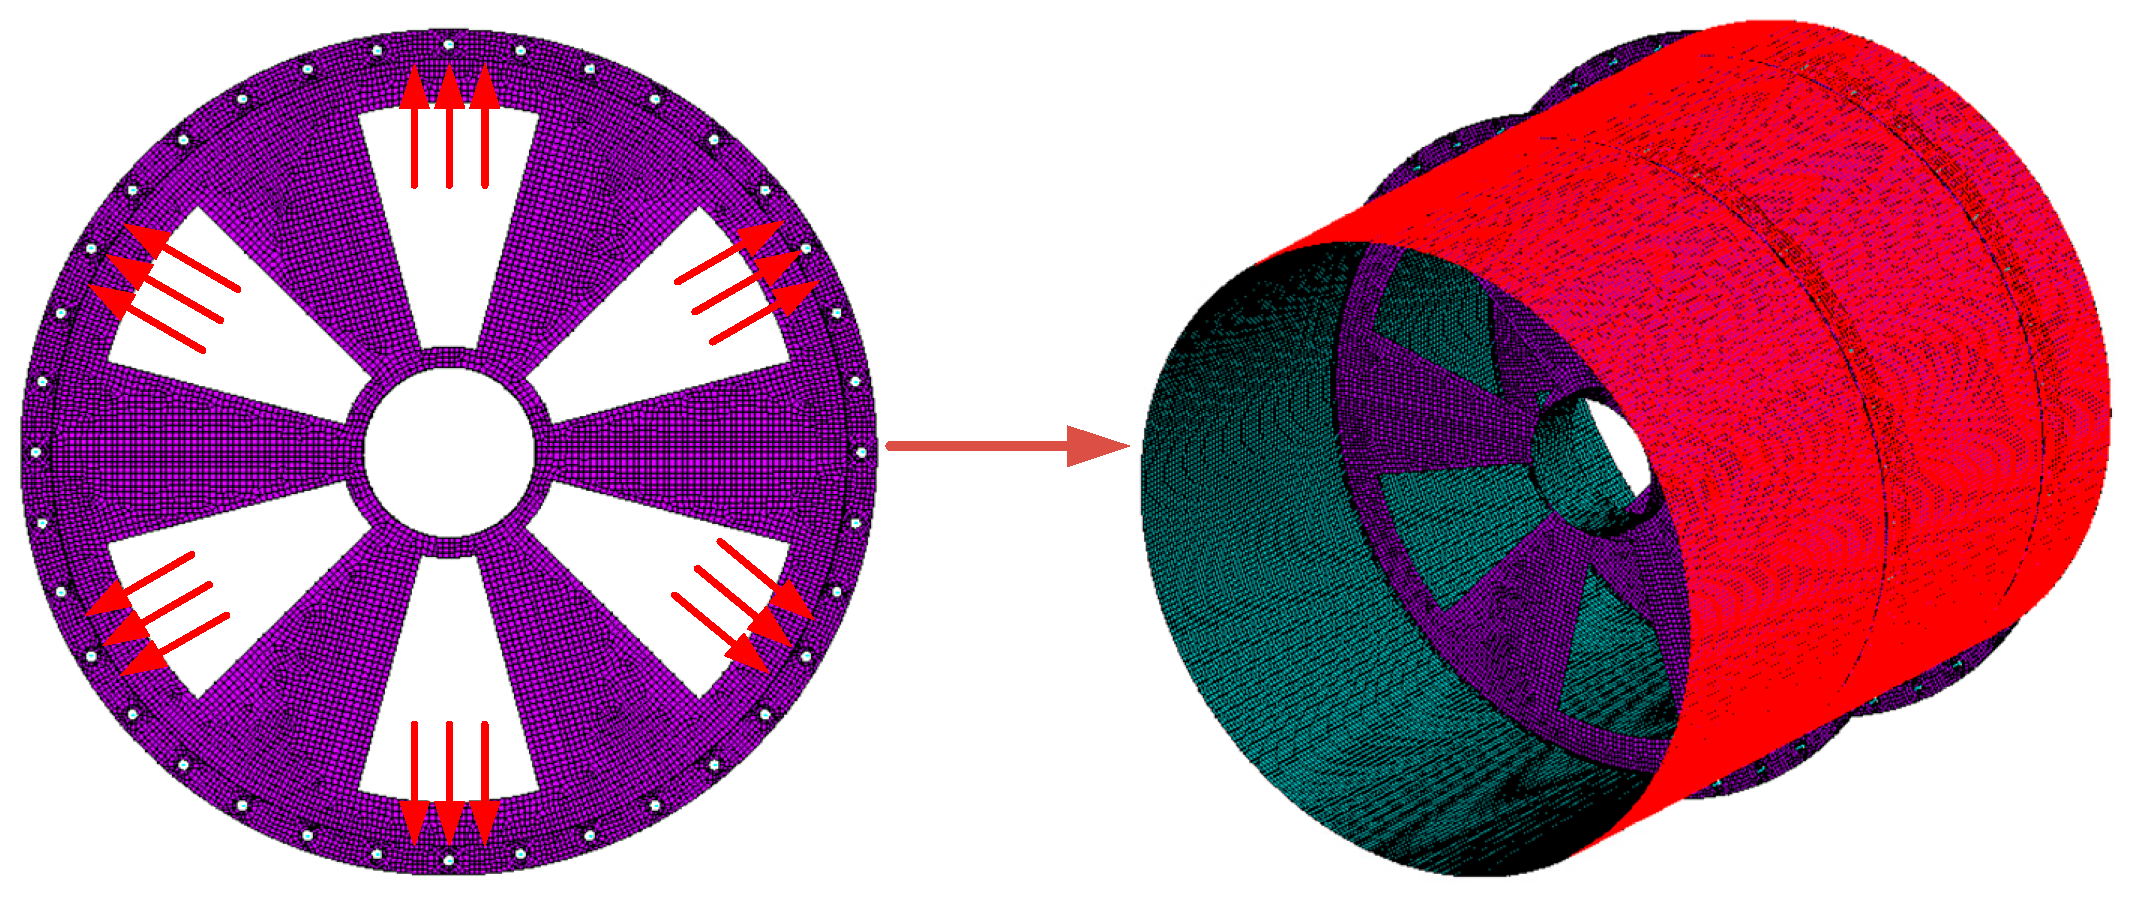
Figure 10.
Schematic diagram of applying aerodynamic load.
Figure 10.
Schematic diagram of applying aerodynamic load.
Figure 11.
Application of temperature load.
Figure 11.
Application of temperature load.
Figure 12.
Initial temperature load distribution.
Figure 12.
Initial temperature load distribution.
Figure 13.
Comparison of rotor deformation in two states.
Figure 13.
Comparison of rotor deformation in two states.
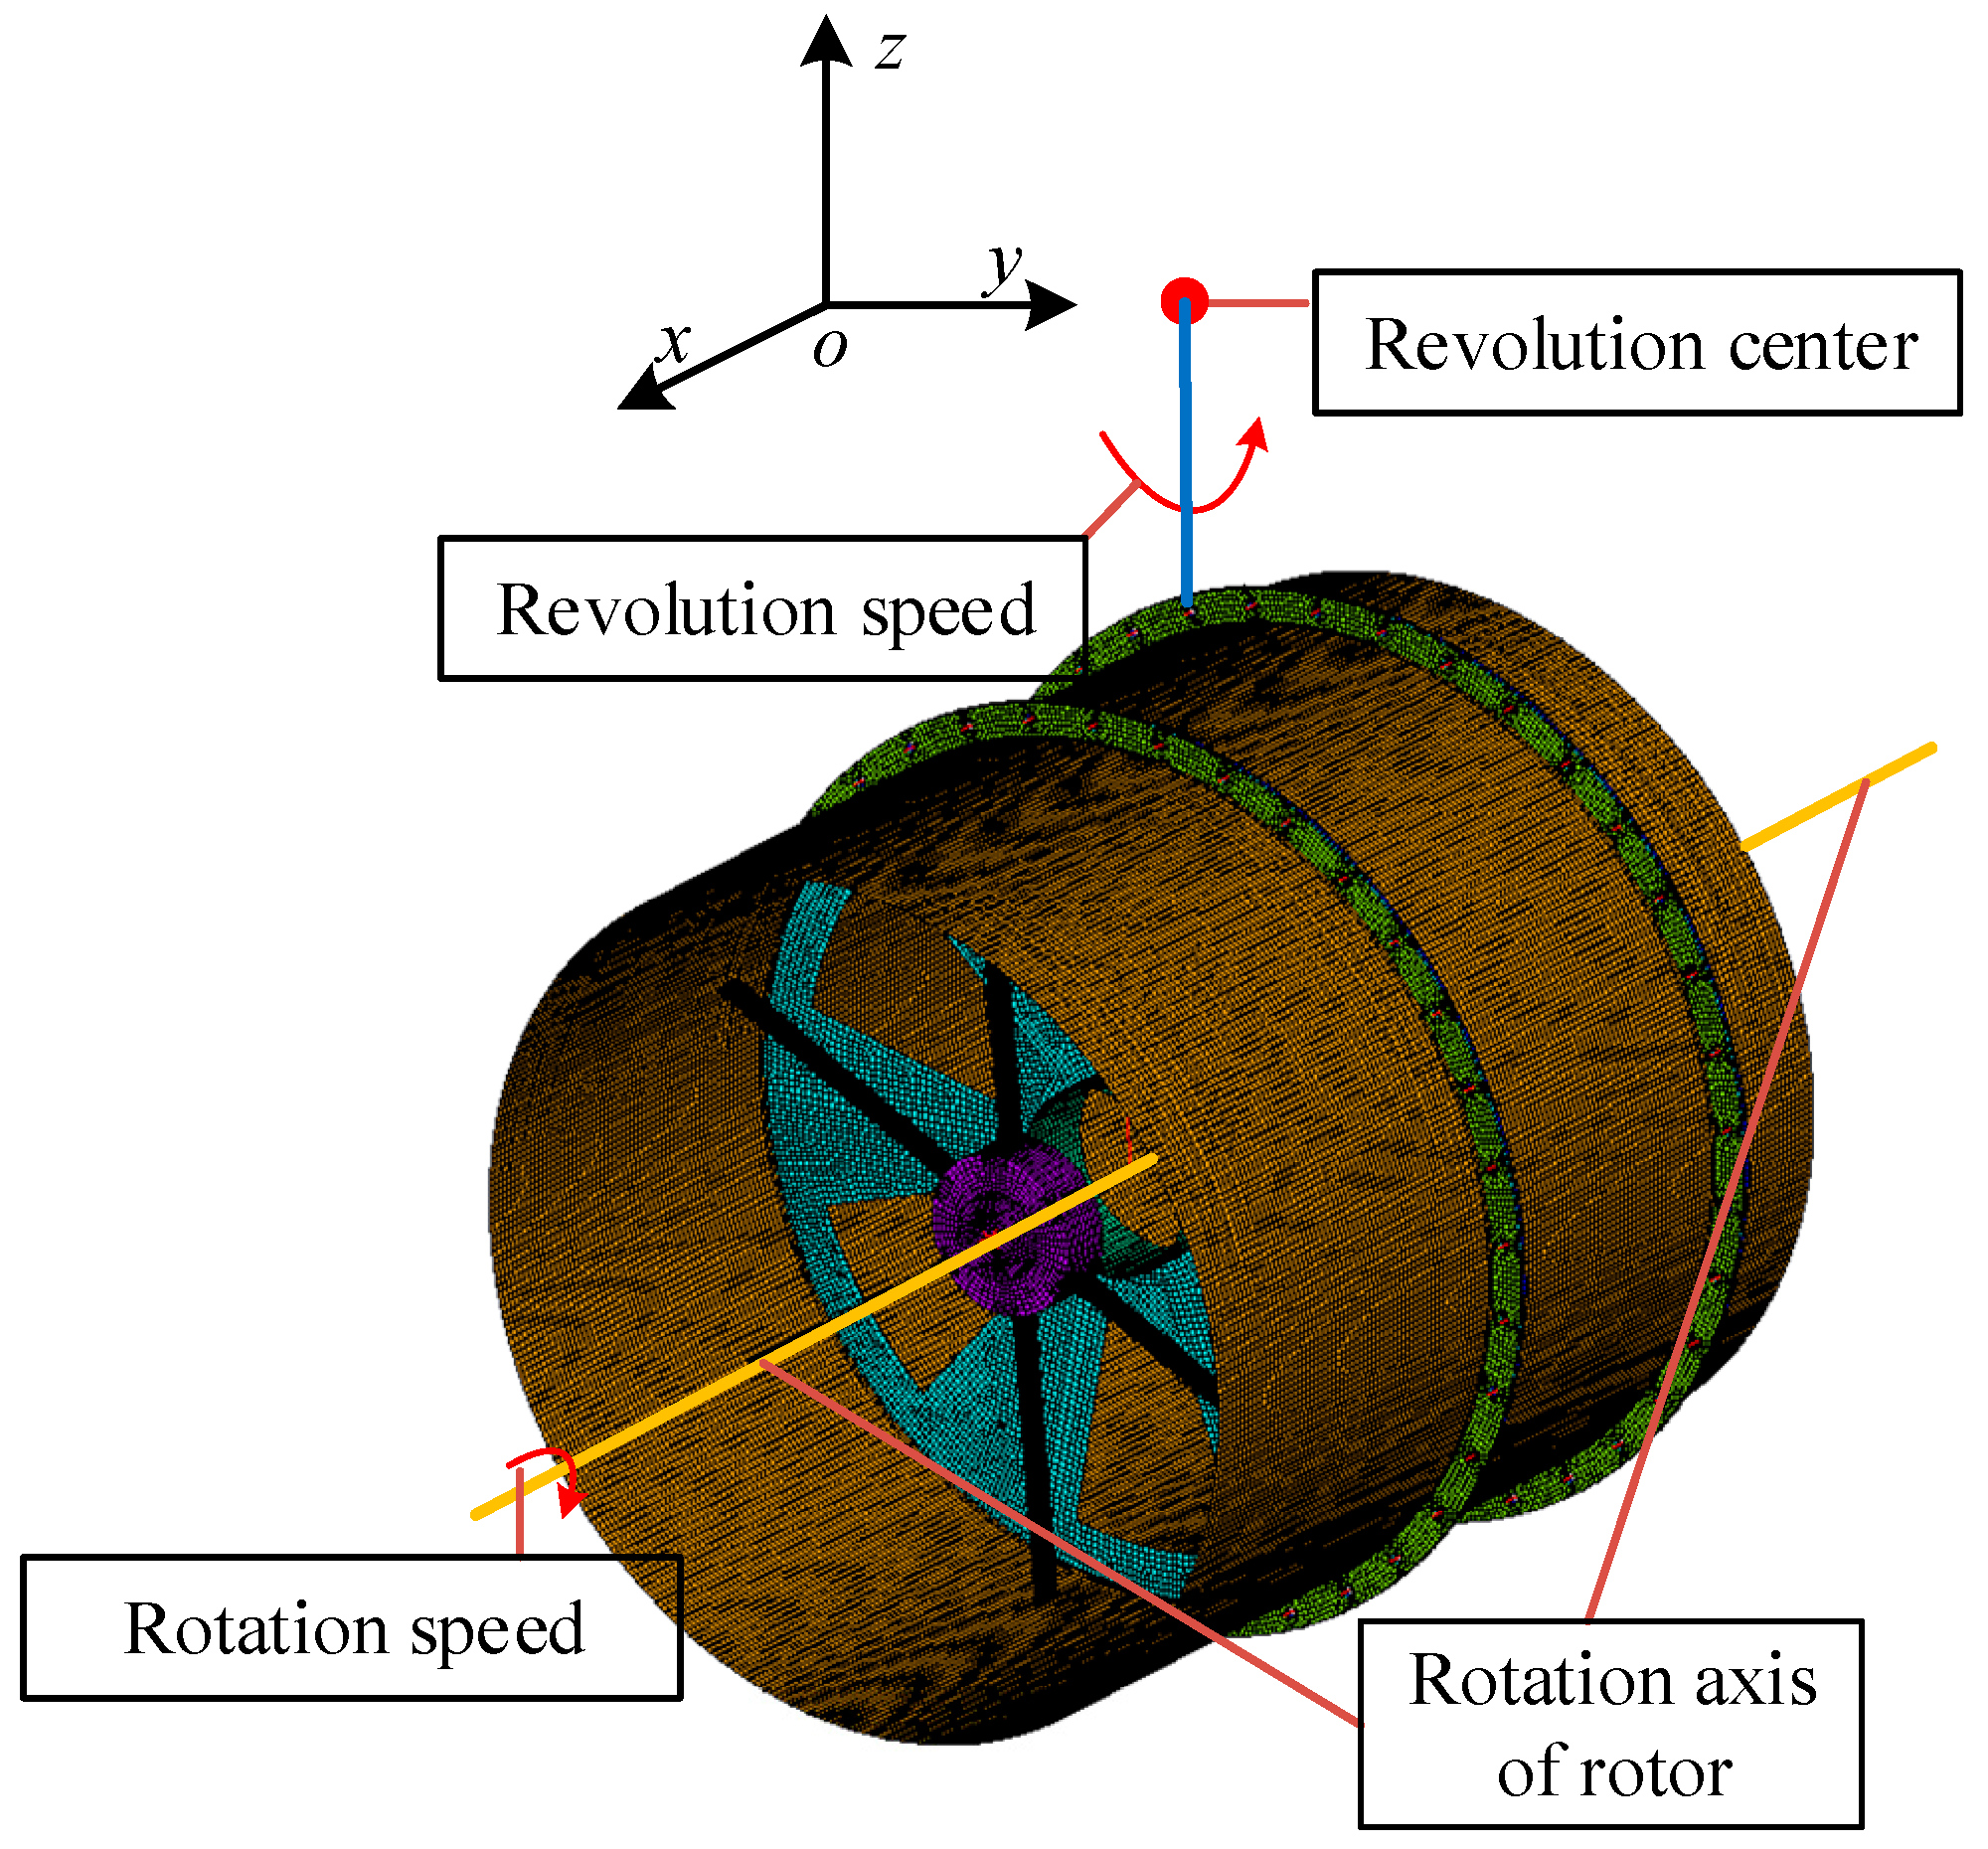
Figure 14.
Schematic diagram of inertial moment application under maneuvering flight condition.
Figure 14.
Schematic diagram of inertial moment application under maneuvering flight condition.
Figure 15.
Schematic structure of the concrete rotor–stator coupled structure.
Figure 15.
Schematic structure of the concrete rotor–stator coupled structure.
Figure 16.
Finite element model of stator, rotor, and rotor–stator coupled structure. (a) Finite element model of stator. (b) Finite element model of rotor without blades. (c) Finite element model of rotor–stator coupled structure.
Figure 16.
Finite element model of stator, rotor, and rotor–stator coupled structure. (a) Finite element model of stator. (b) Finite element model of rotor without blades. (c) Finite element model of rotor–stator coupled structure.
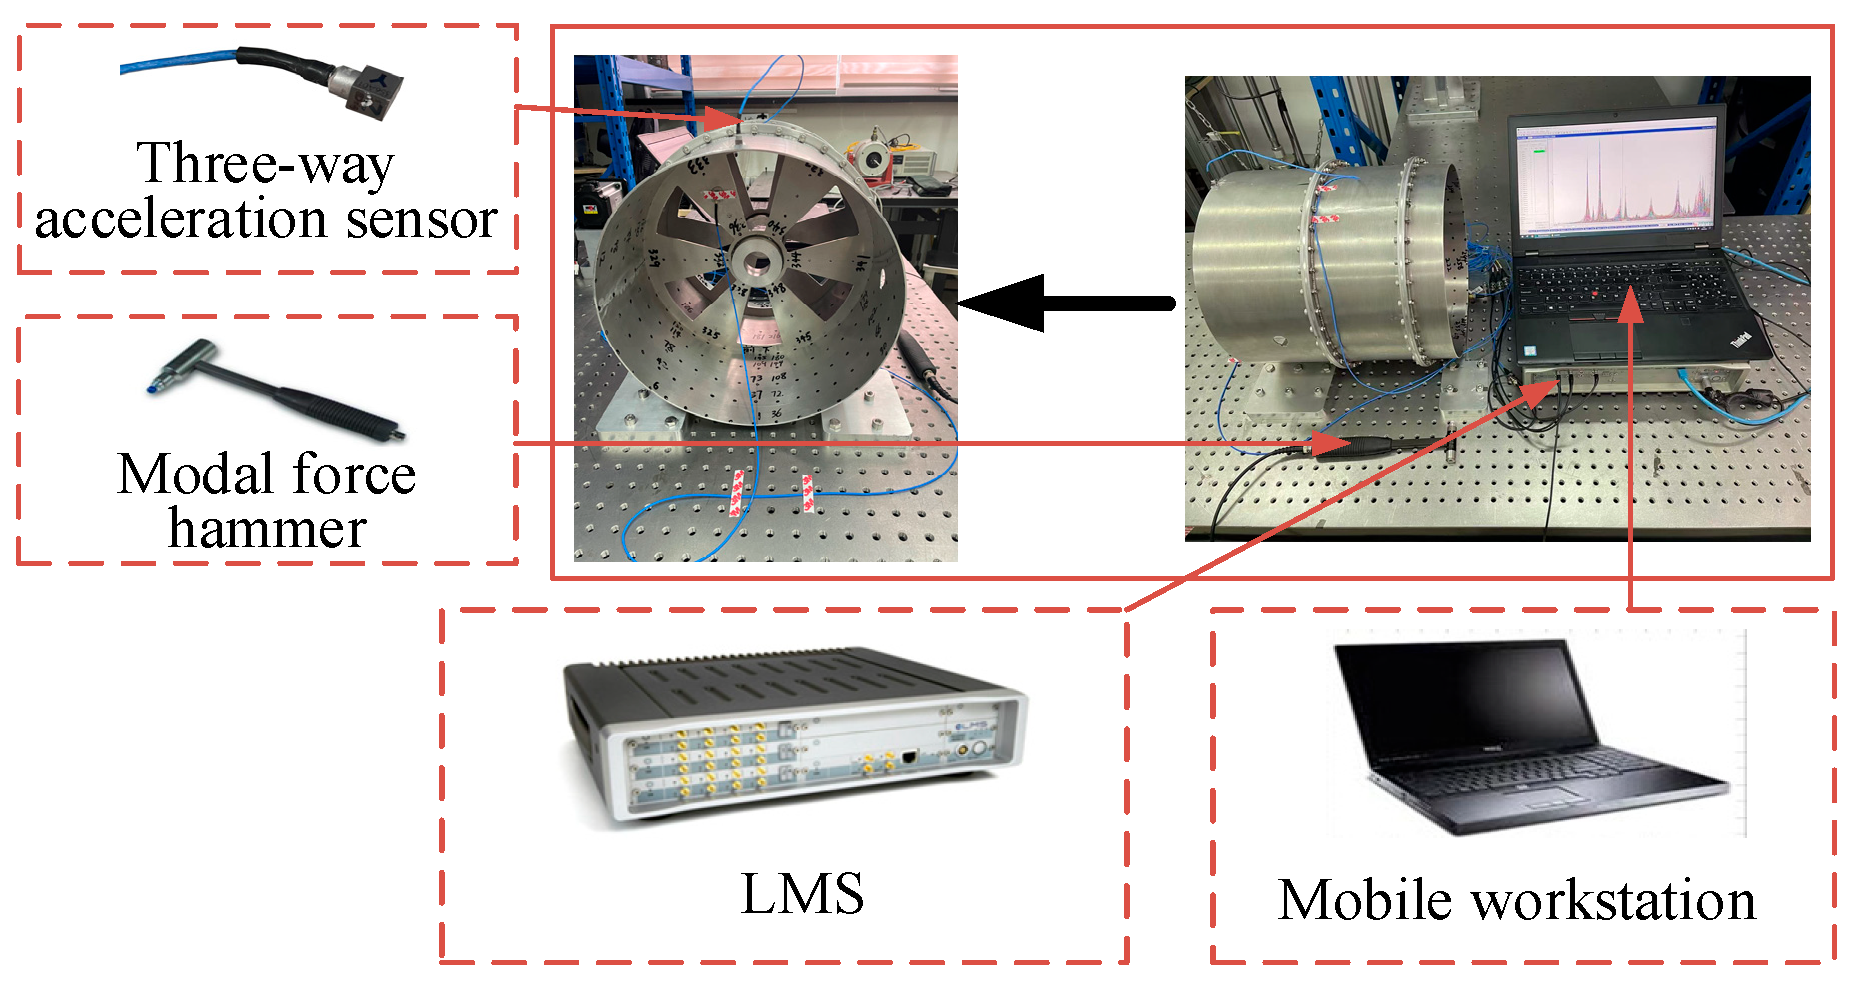
Figure 17.
Modal test system of stator.
Figure 17.
Modal test system of stator.
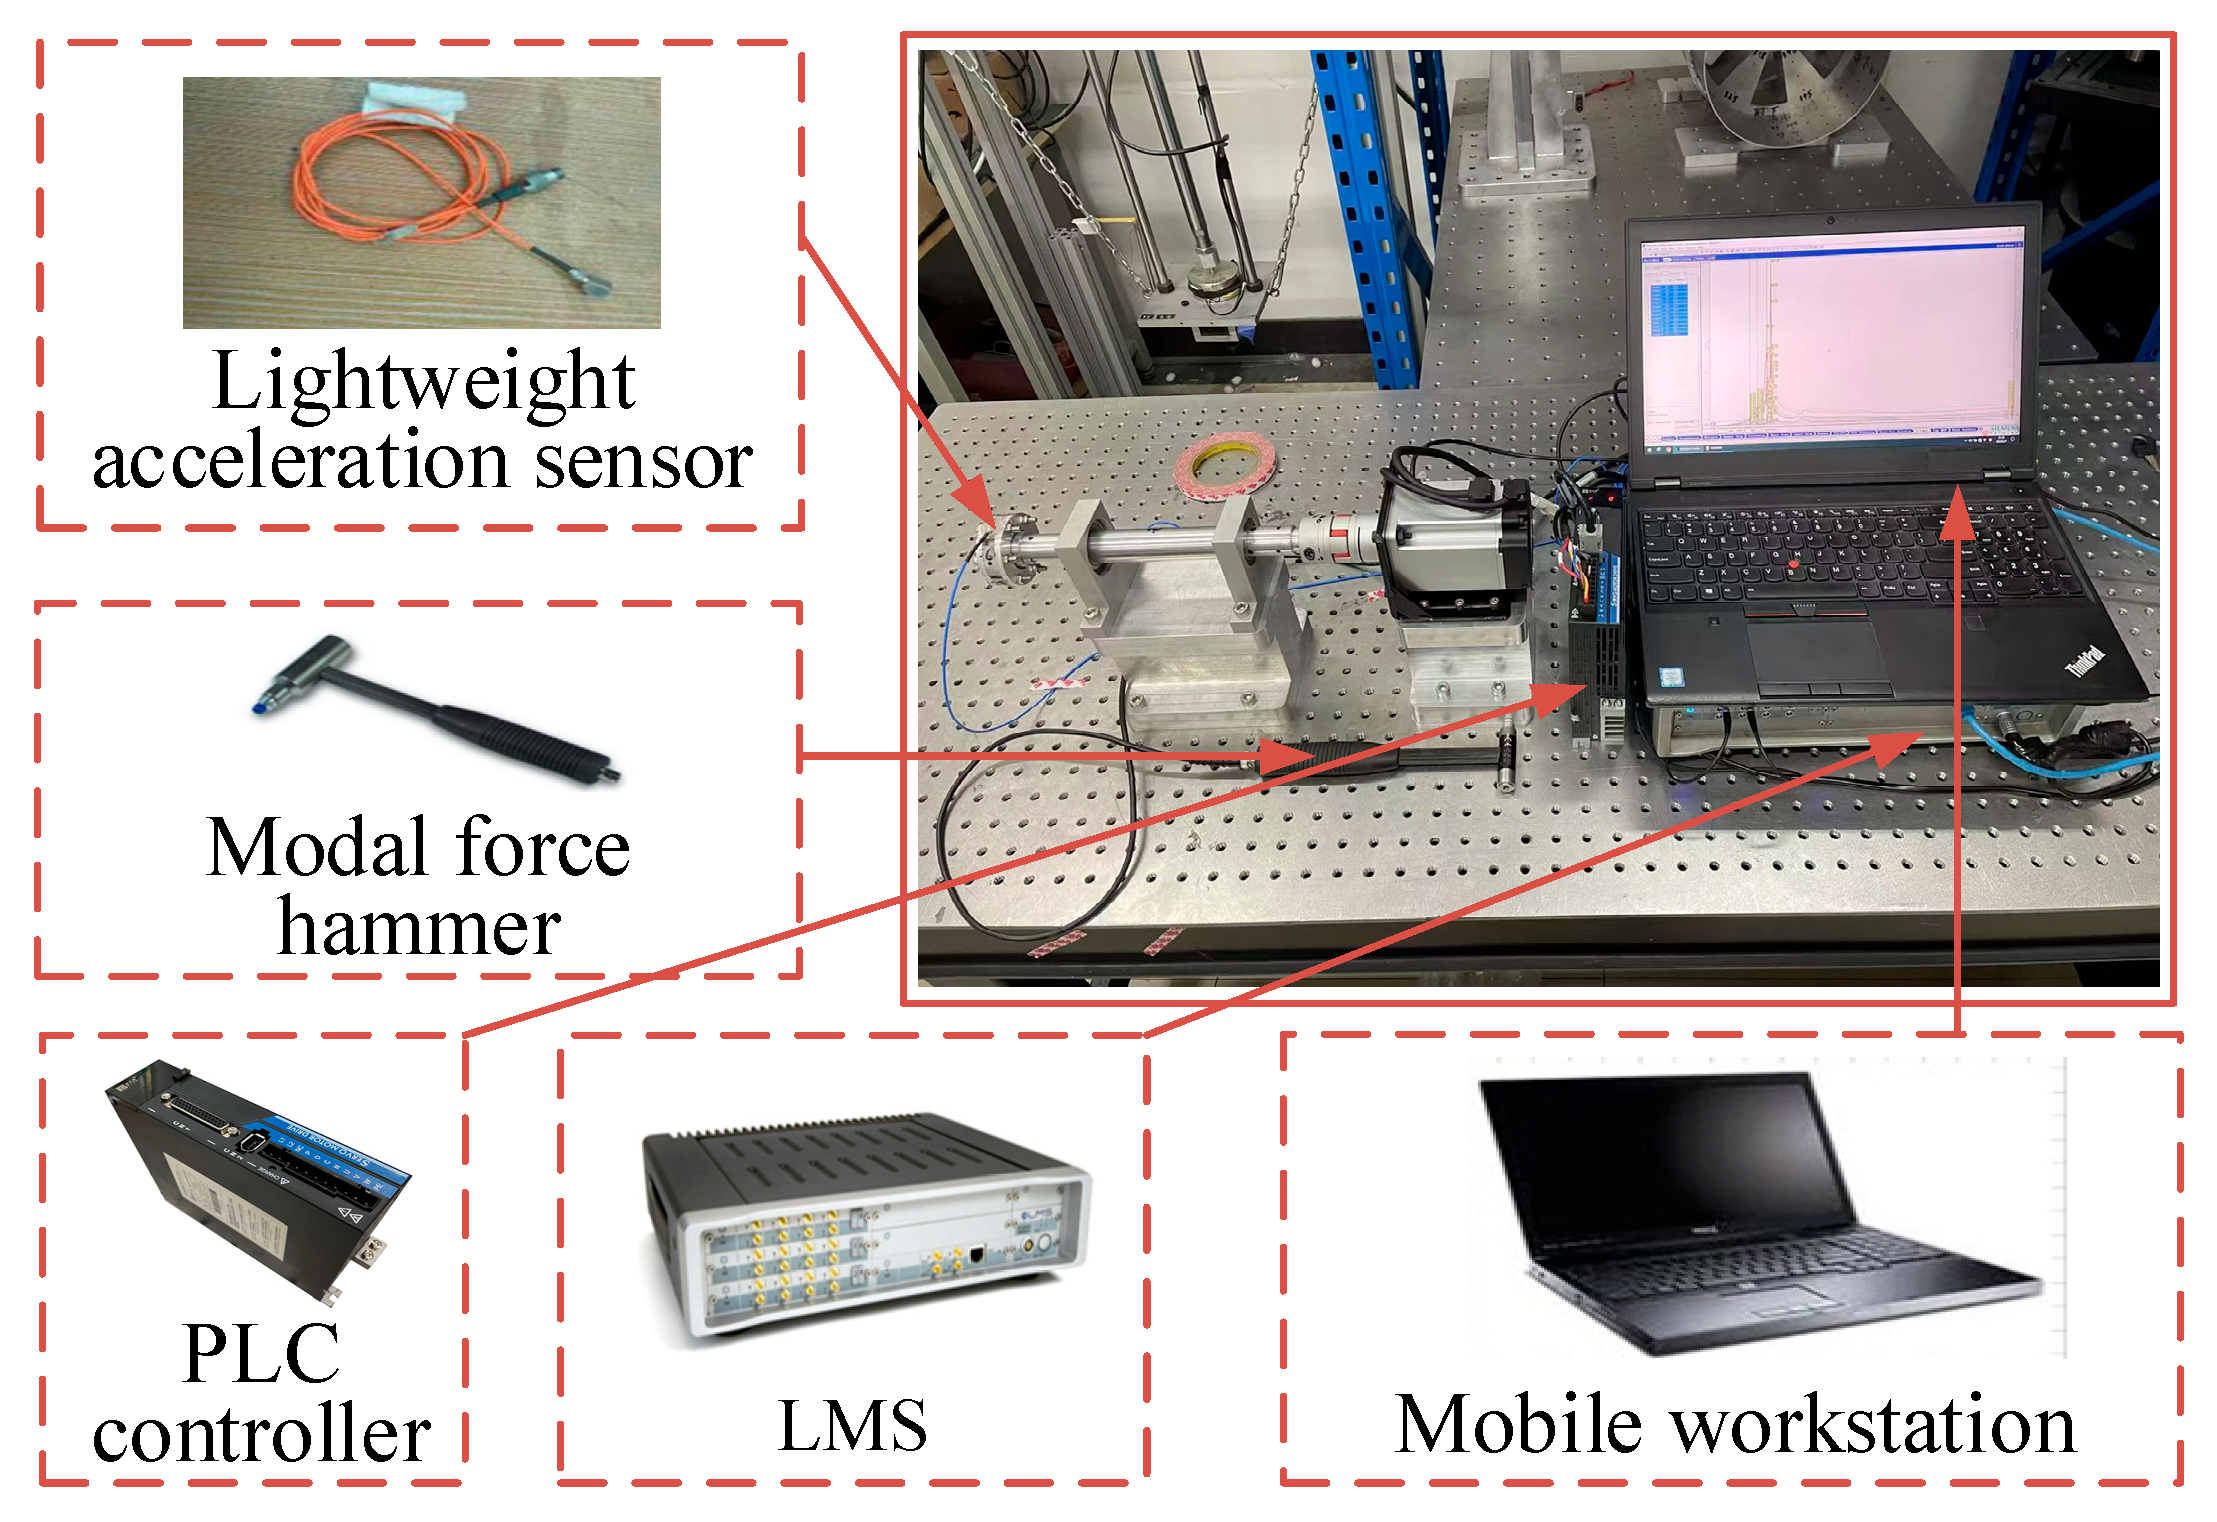
Figure 18.
Modal test system of rotor.
Figure 18.
Modal test system of rotor.
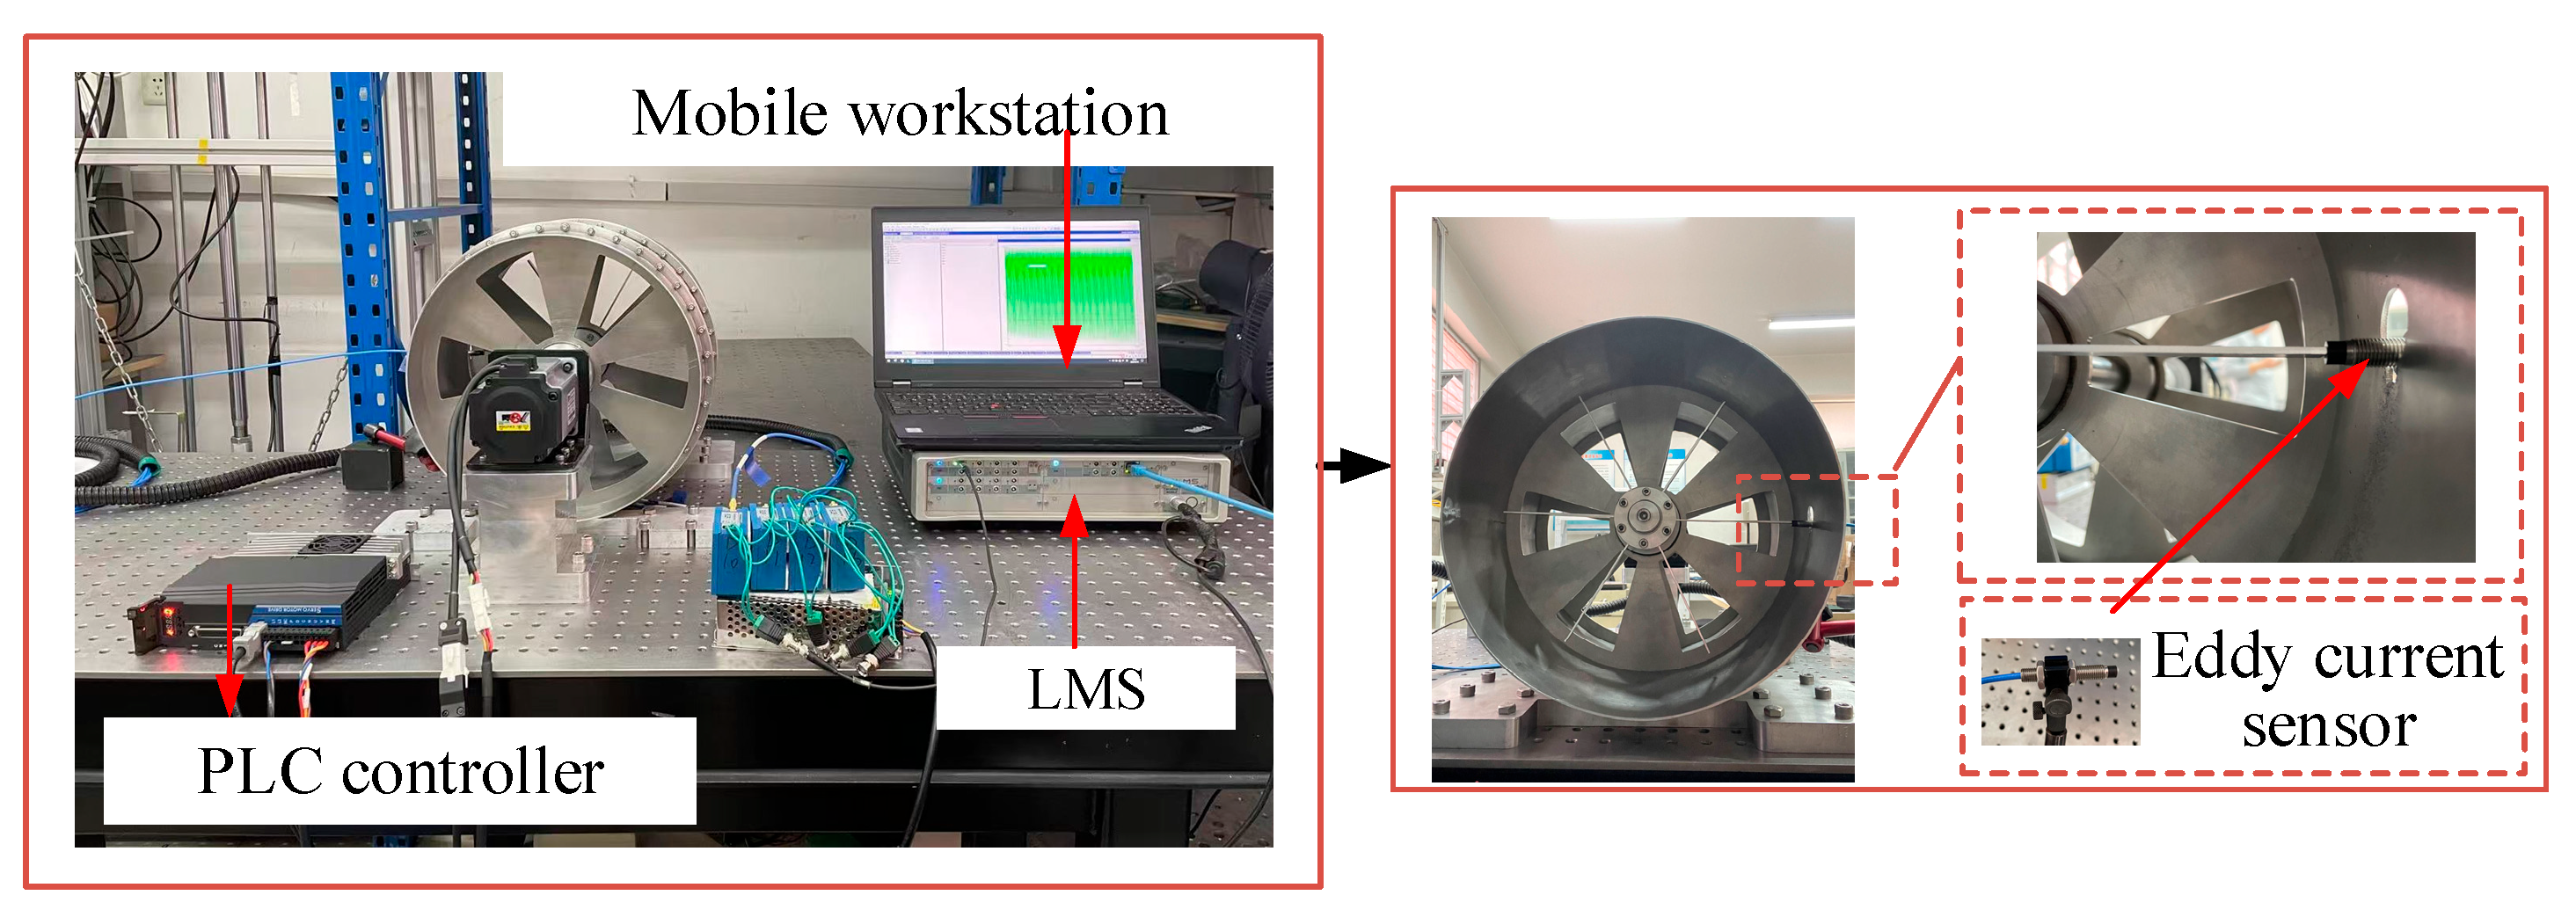
Figure 19.
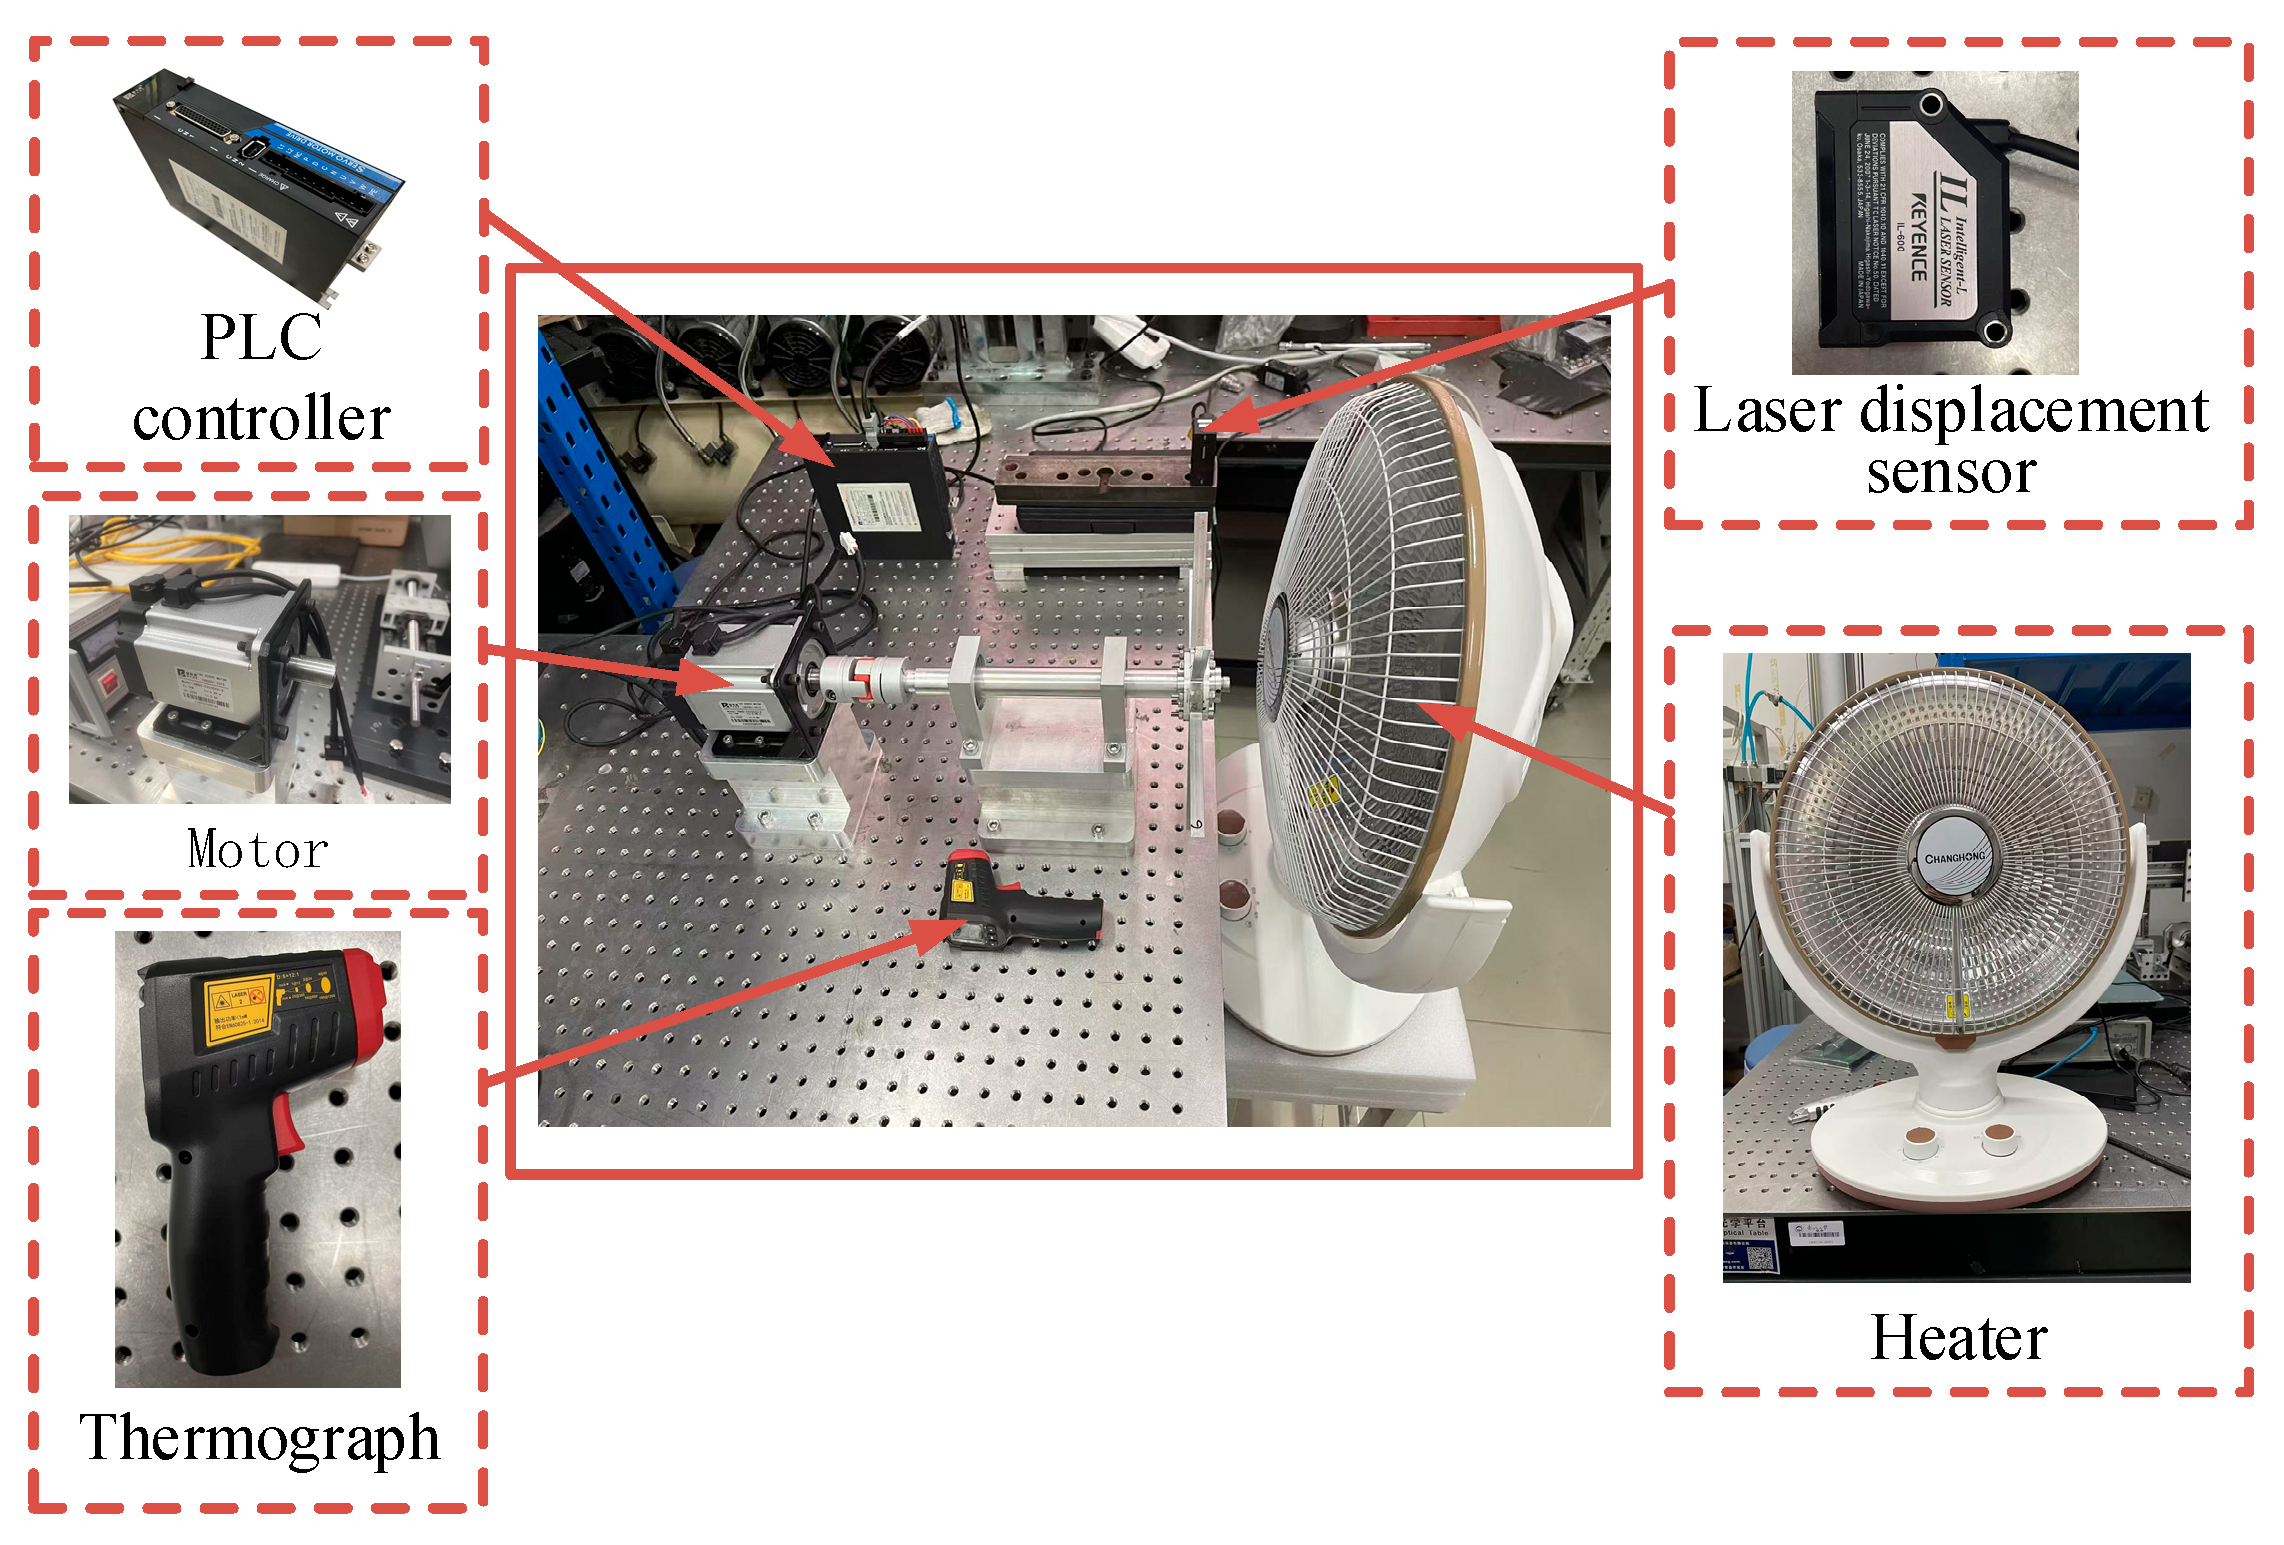
Clearance change test system of rotor–stator coupled structure.
Figure 19.
Clearance change test system of rotor–stator coupled structure.
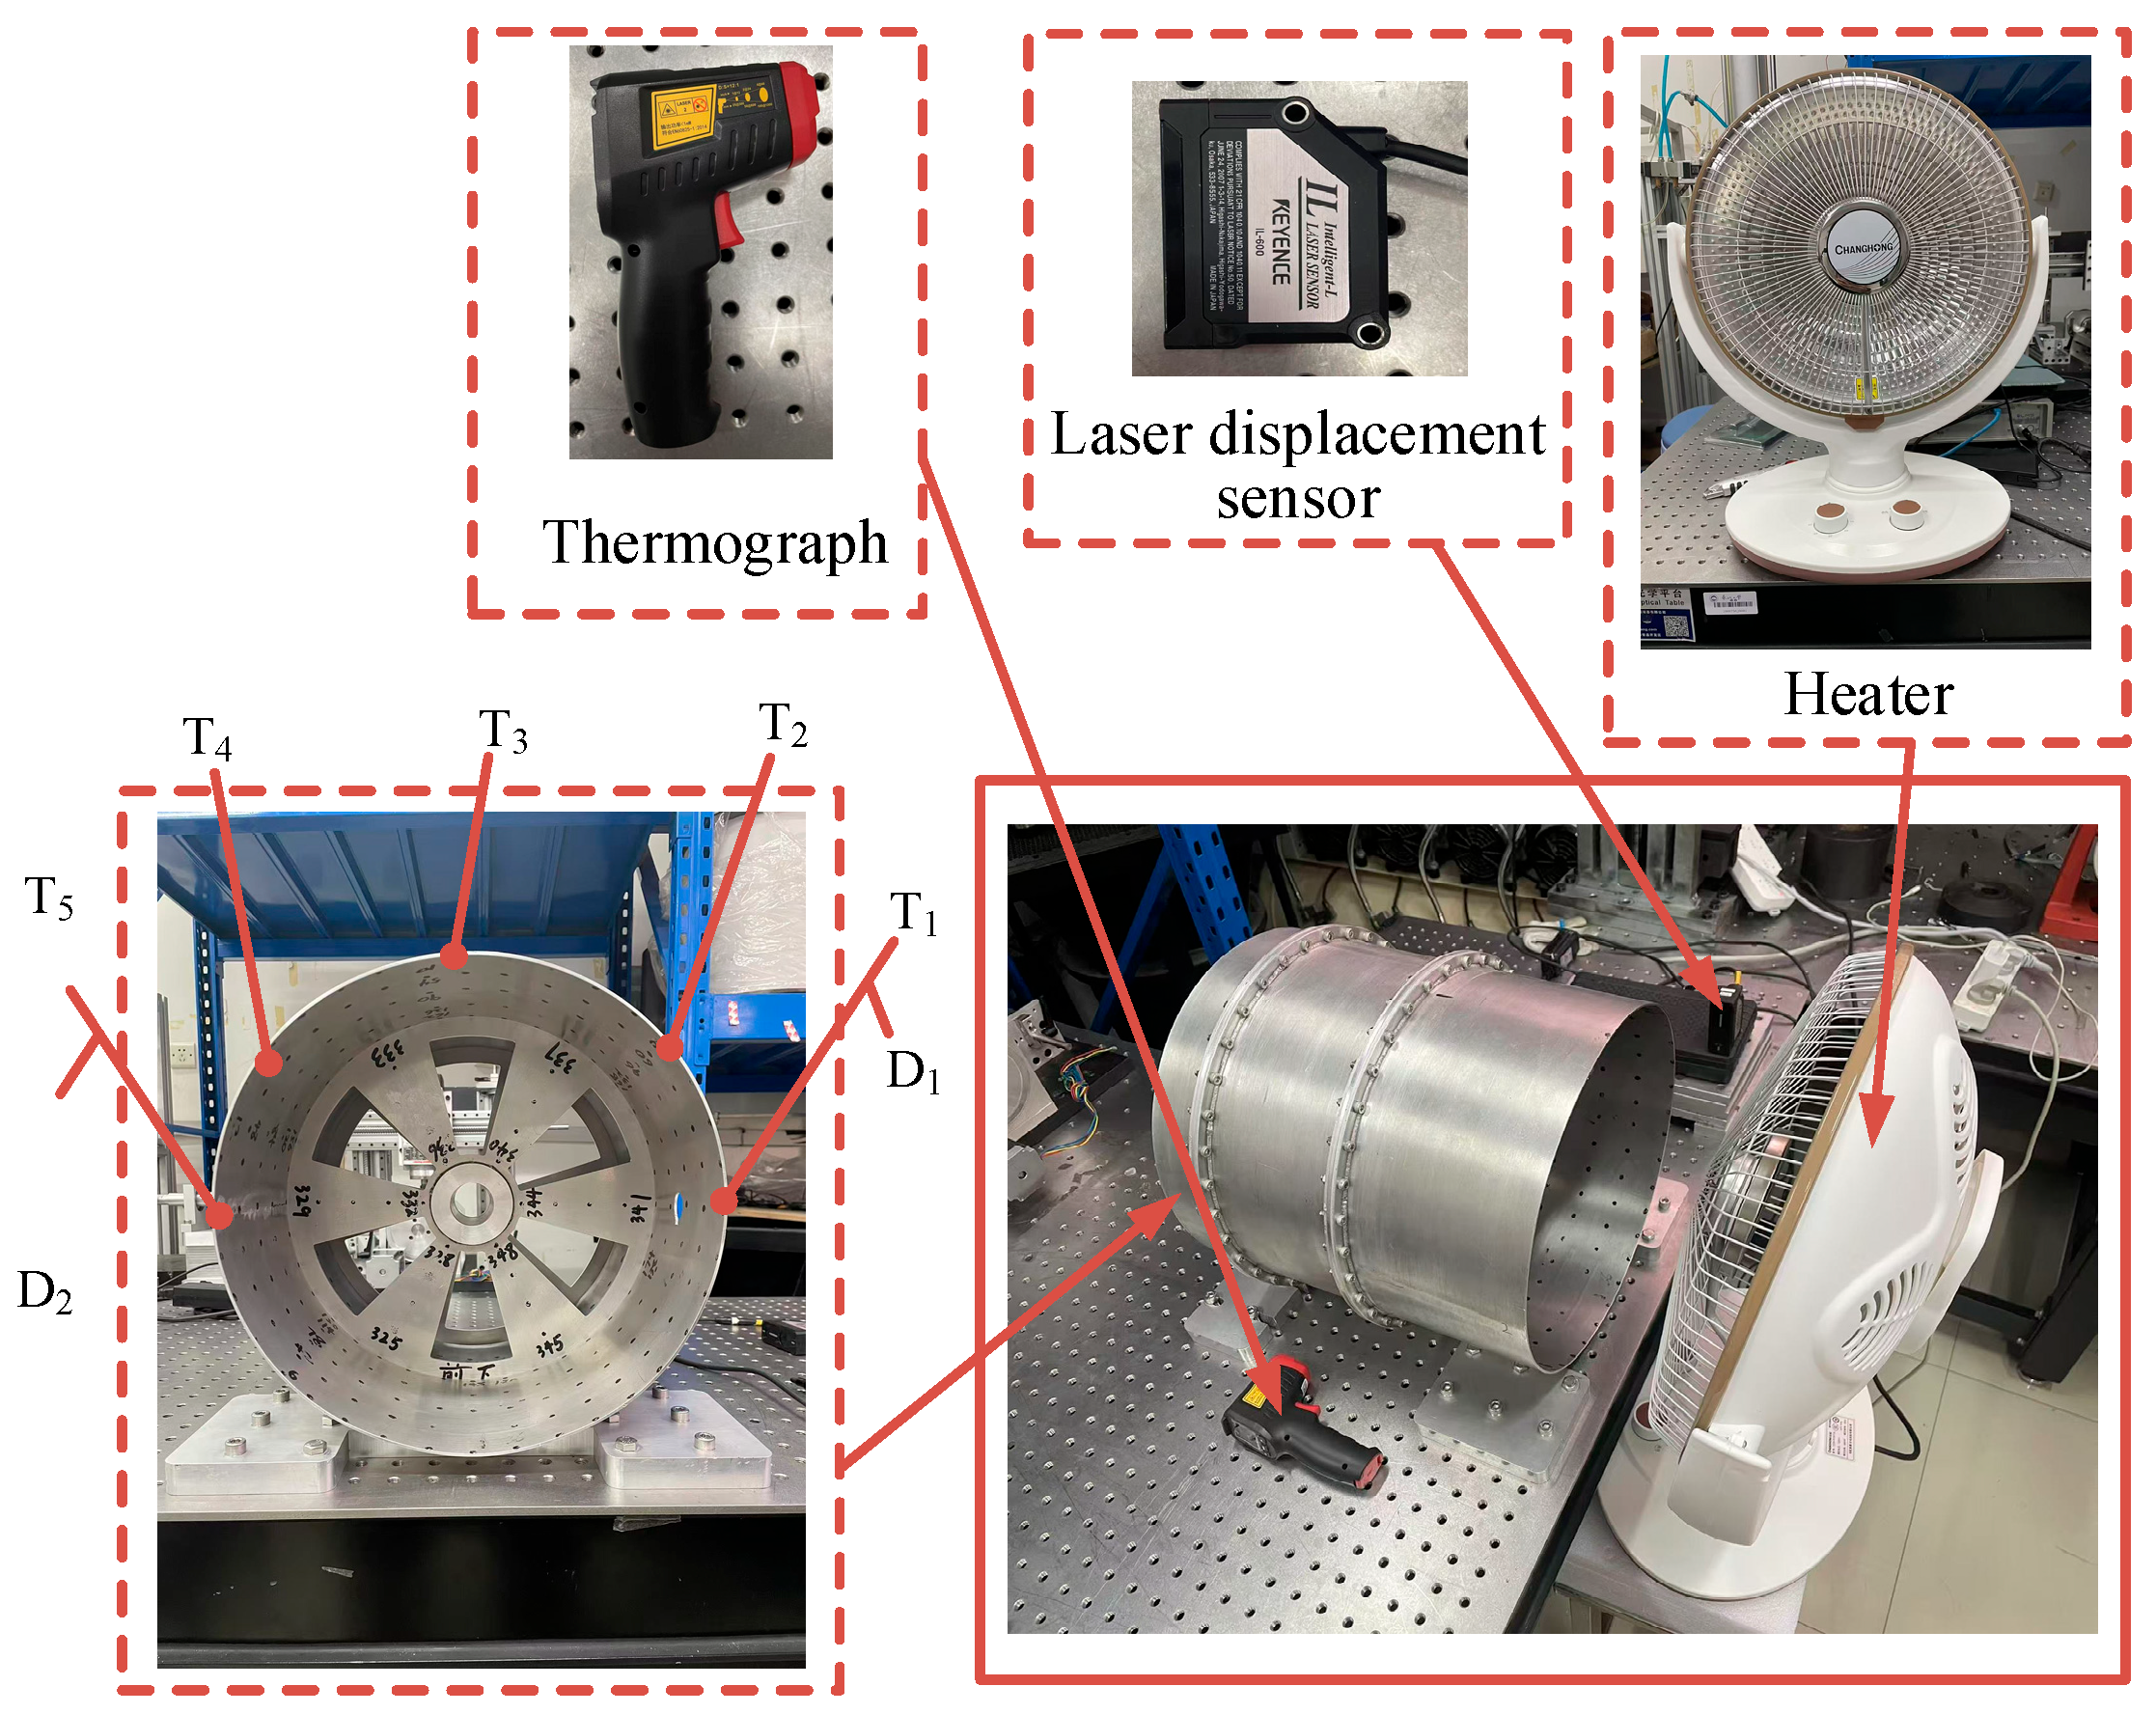
Figure 20.
Experimental system for measuring stator thermal deformation.
Figure 20.
Experimental system for measuring stator thermal deformation.
Figure 21.
Experimental system for measuring rotor thermal deformation.
Figure 21.
Experimental system for measuring rotor thermal deformation.
Figure 22.
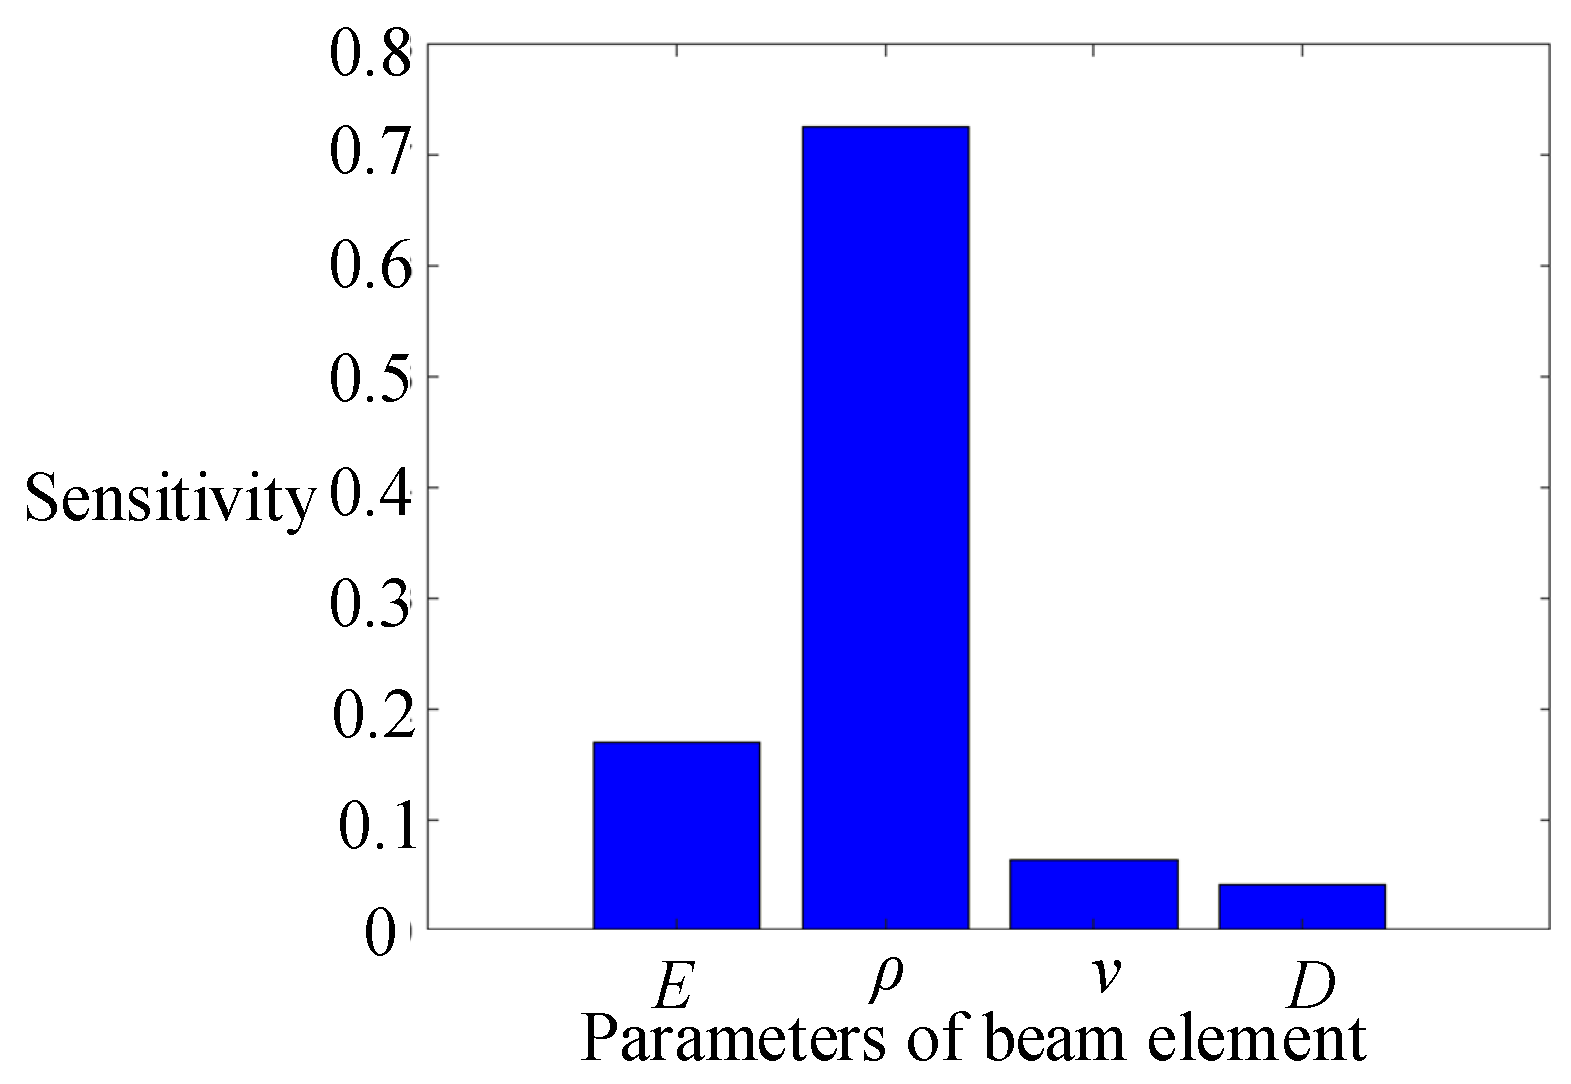
Sensitivity analysis of beam element parameters.
Figure 22.
Sensitivity analysis of beam element parameters.
Figure 23.
Distance Δl from blade to eddy current sensor at 400 rpm.
Figure 23.
Distance Δl from blade to eddy current sensor at 400 rpm.
Figure 24.
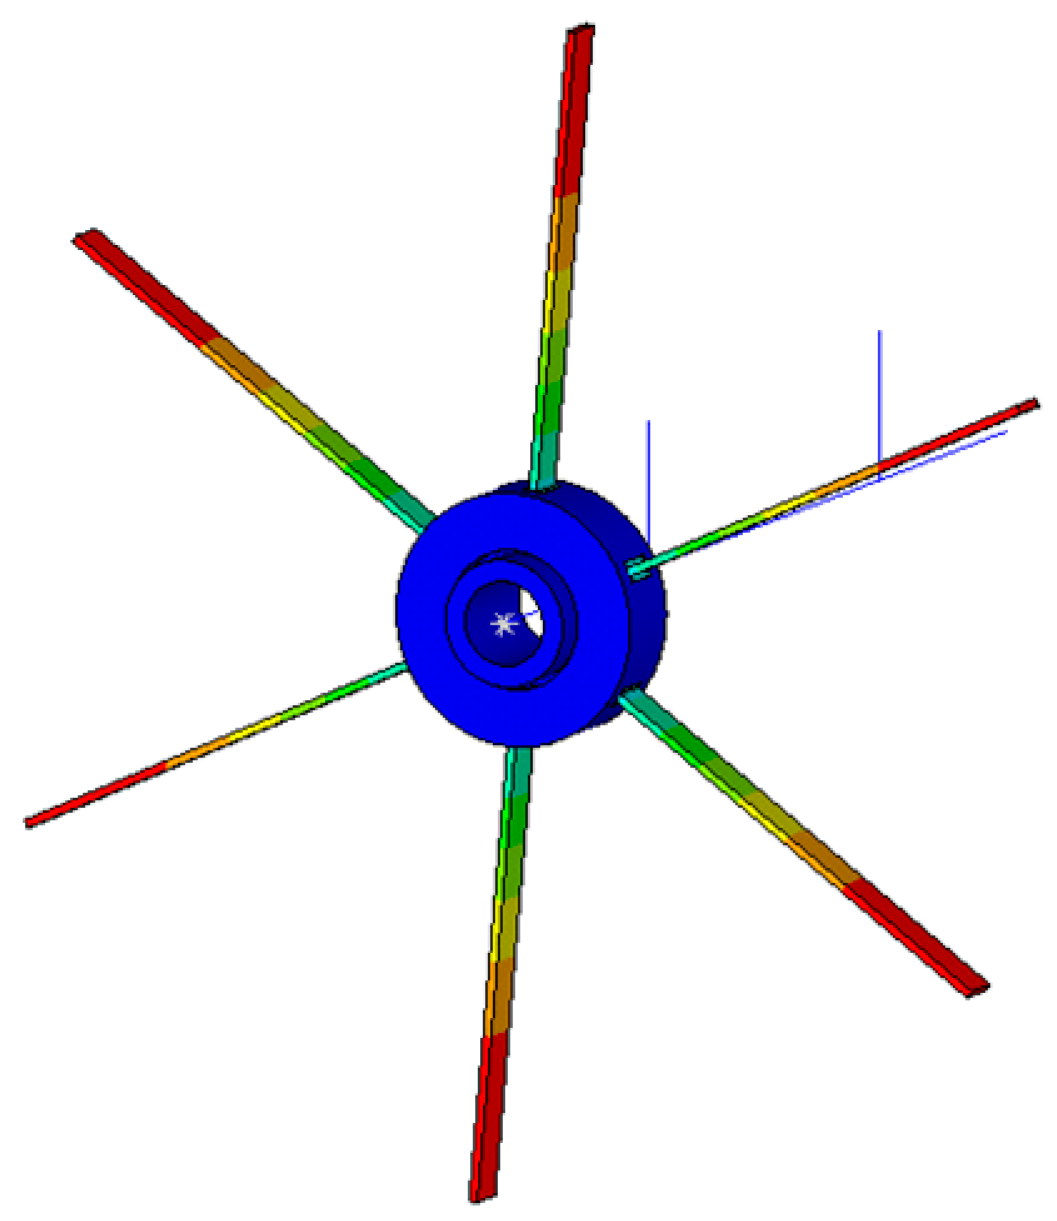
Radial deformation cloud diagram of rotor under centrifugal load.
Figure 24.
Radial deformation cloud diagram of rotor under centrifugal load.
Figure 25.
Blade-tip clearance curve under different rotating speeds.
Figure 25.
Blade-tip clearance curve under different rotating speeds.
Figure 26.
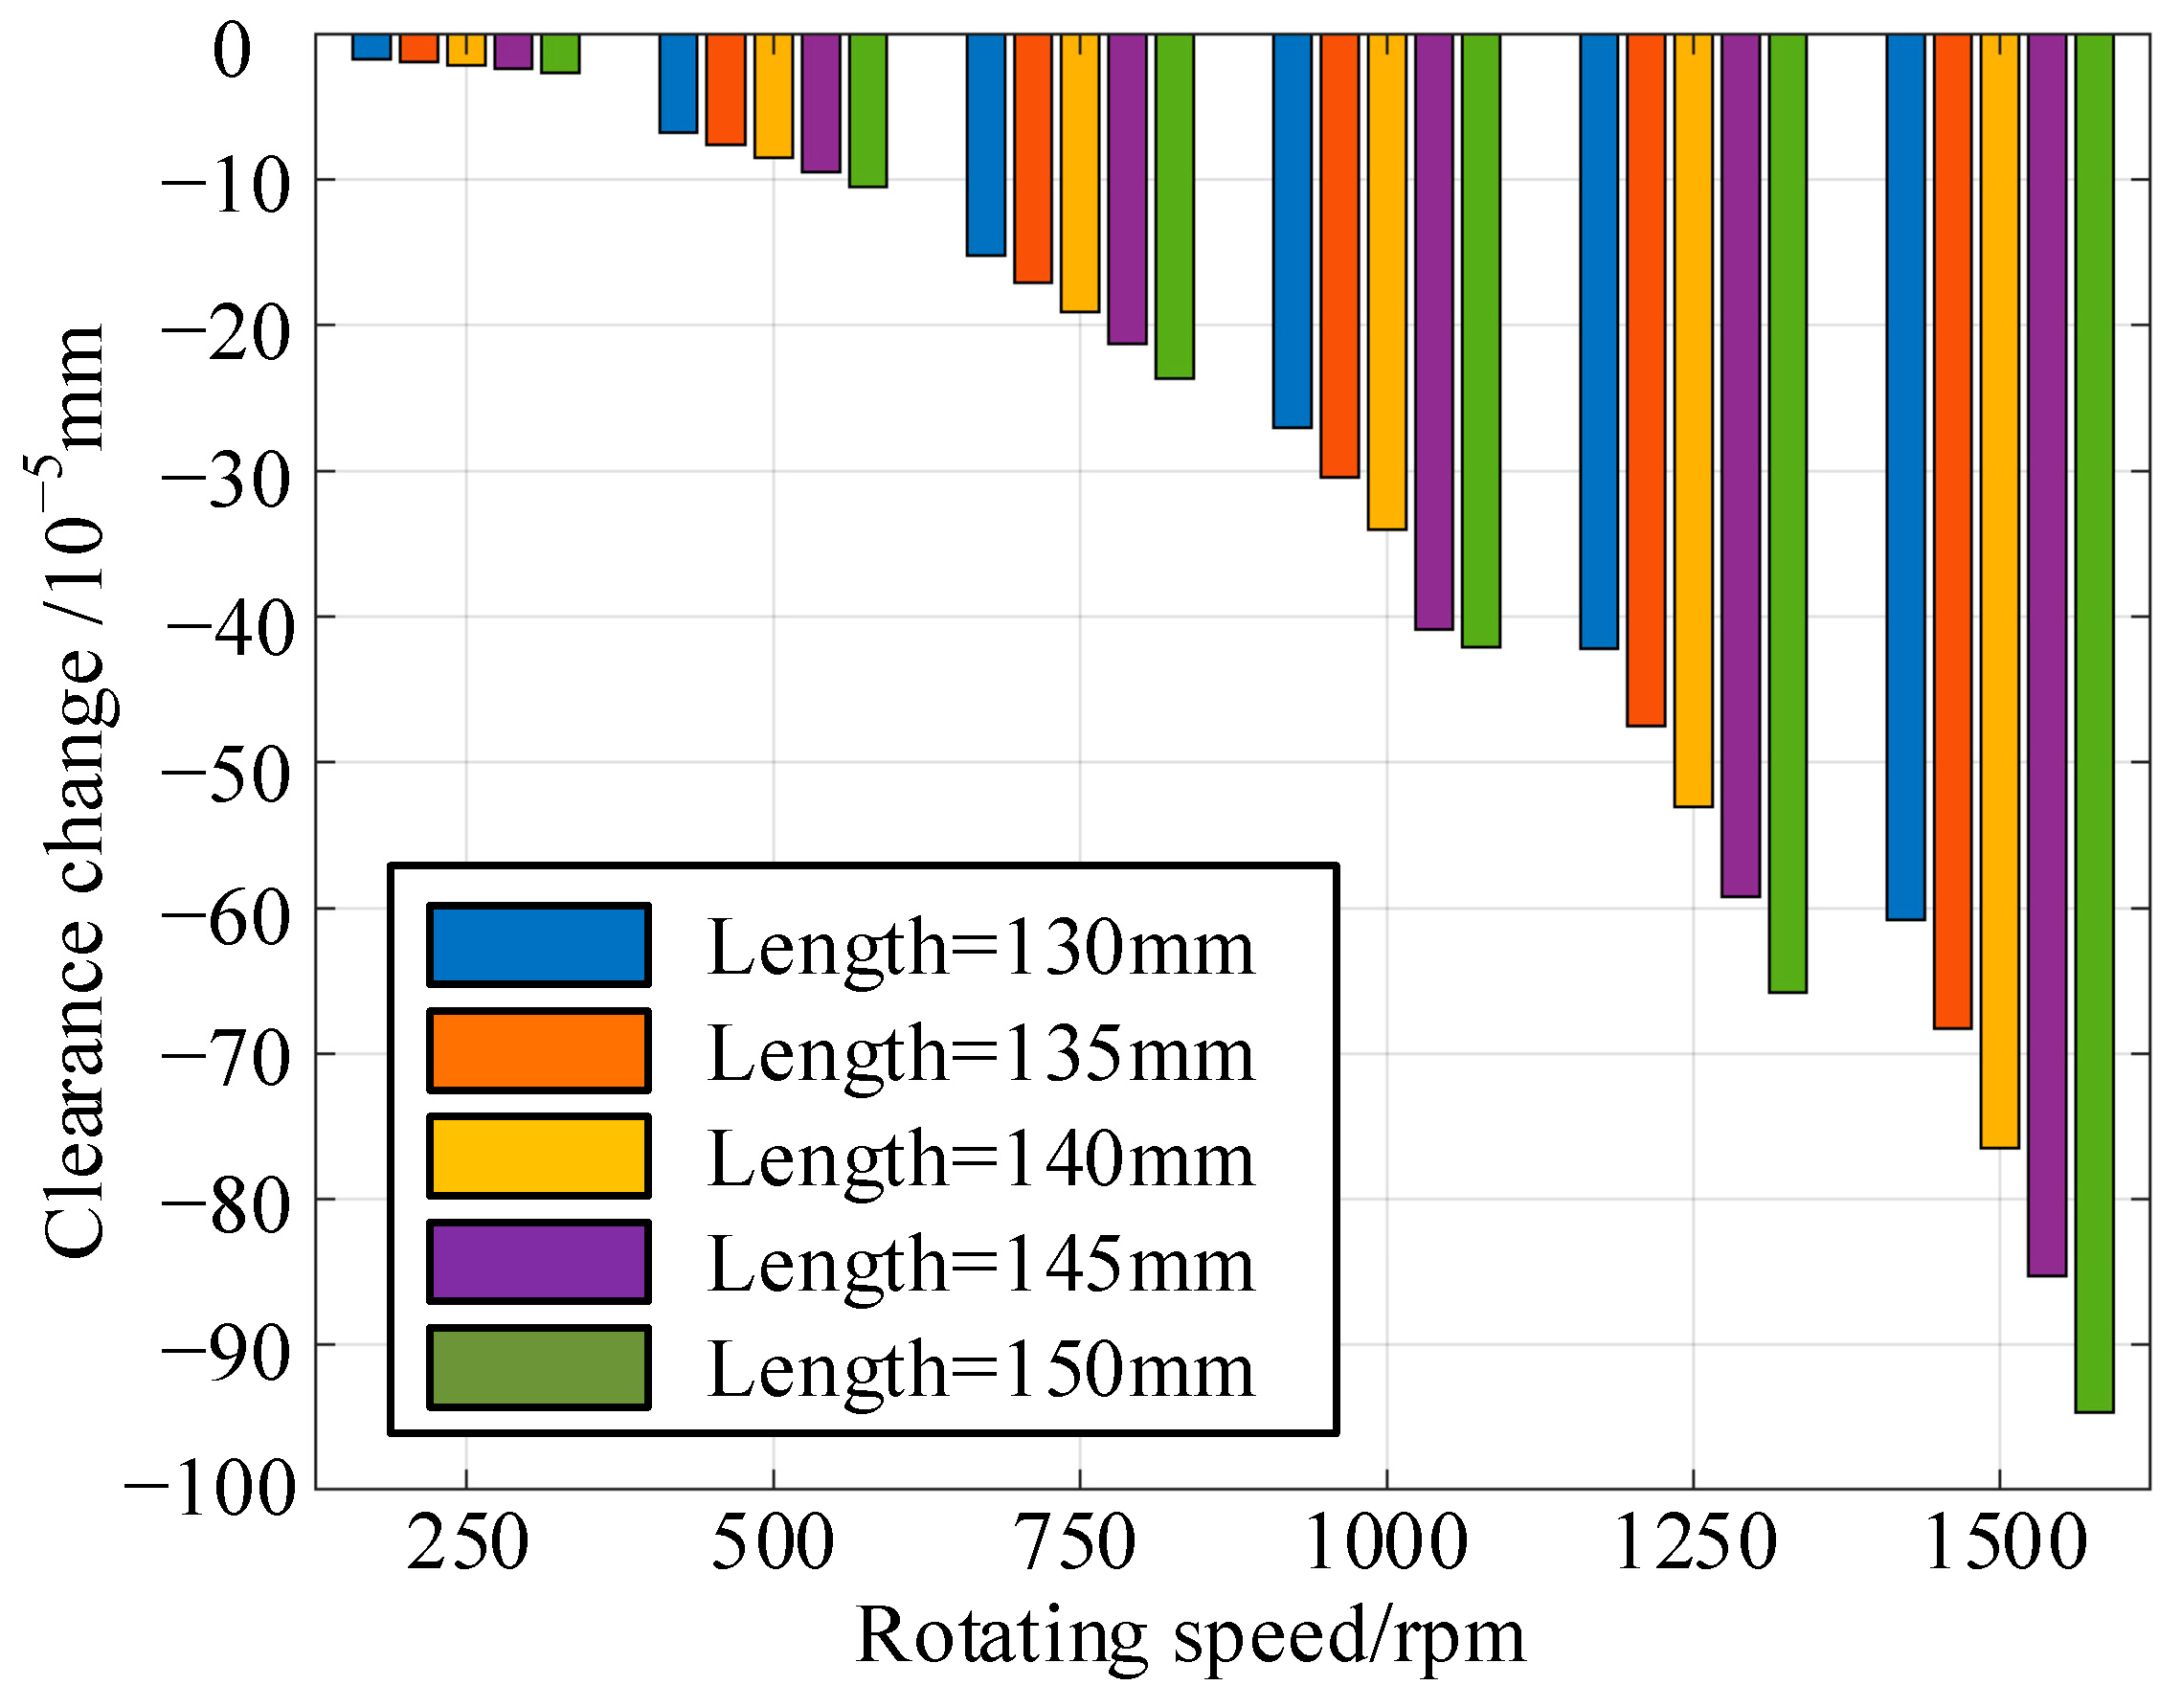
Bar diagram of clearance variations under different rotating speeds and blade lengths.
Figure 26.
Bar diagram of clearance variations under different rotating speeds and blade lengths.
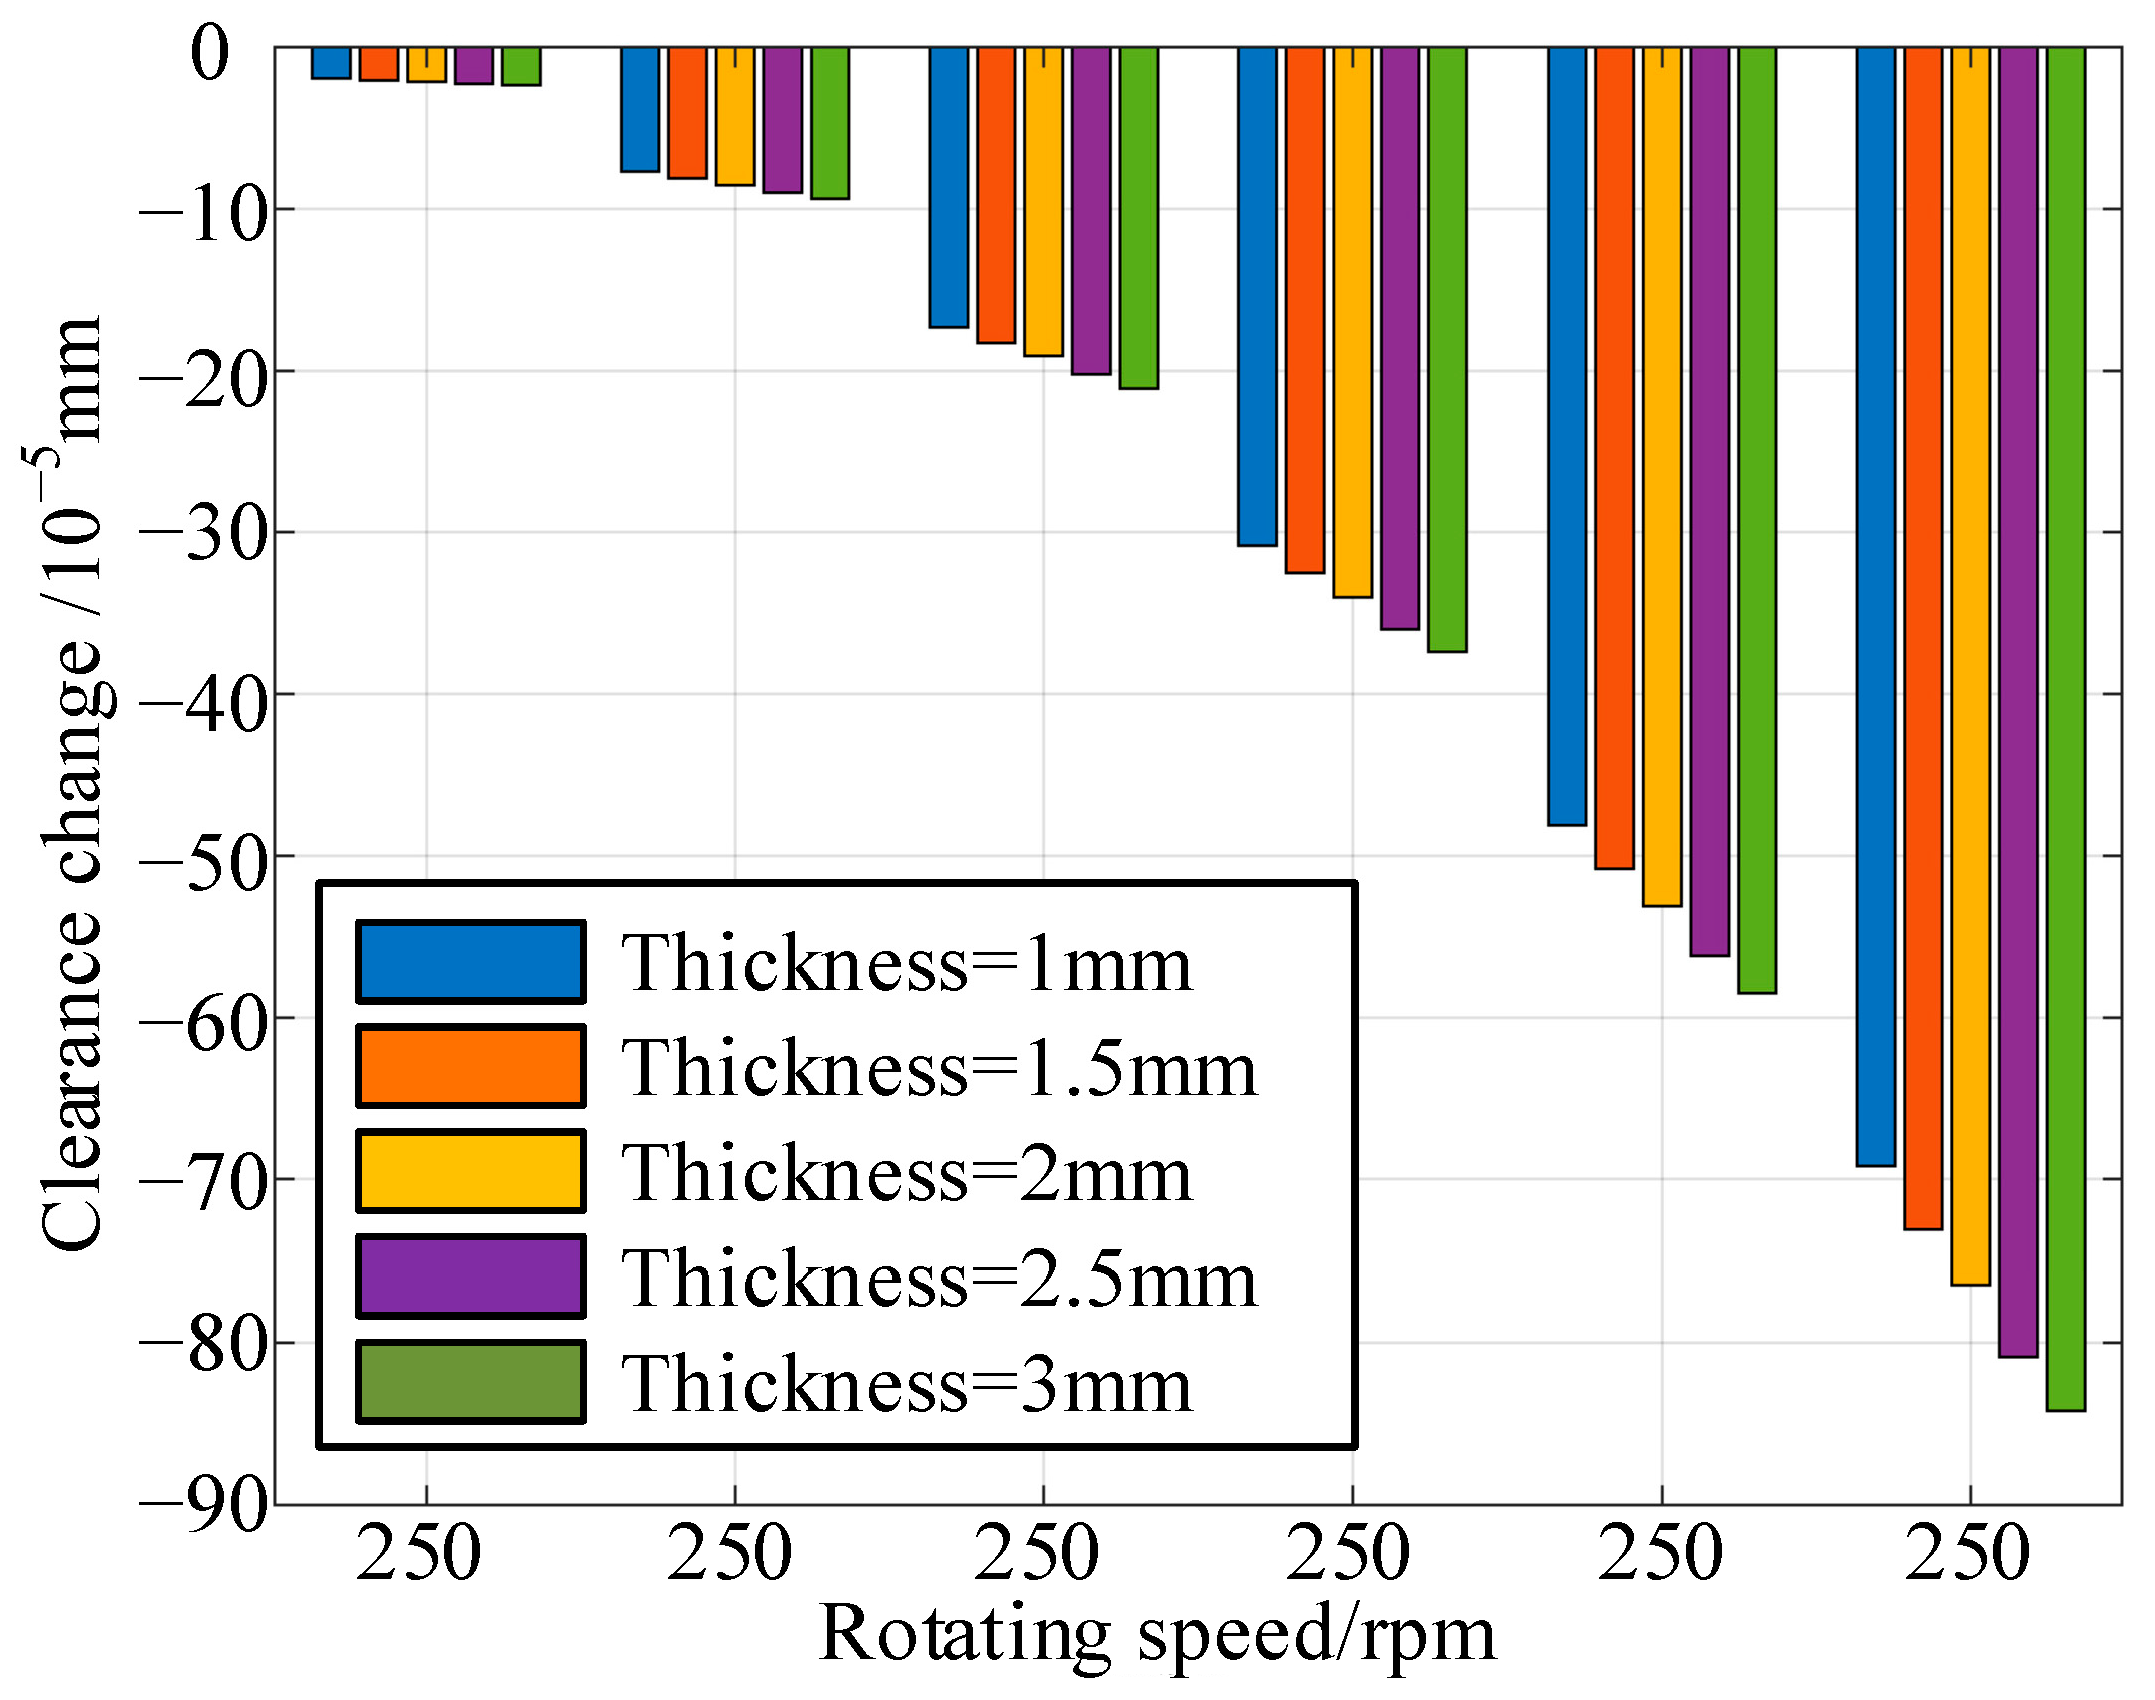
Figure 27.
Bar diagram of clearance variations under different thicknesses of blade and rotating speeds.
Figure 27.
Bar diagram of clearance variations under different thicknesses of blade and rotating speeds.
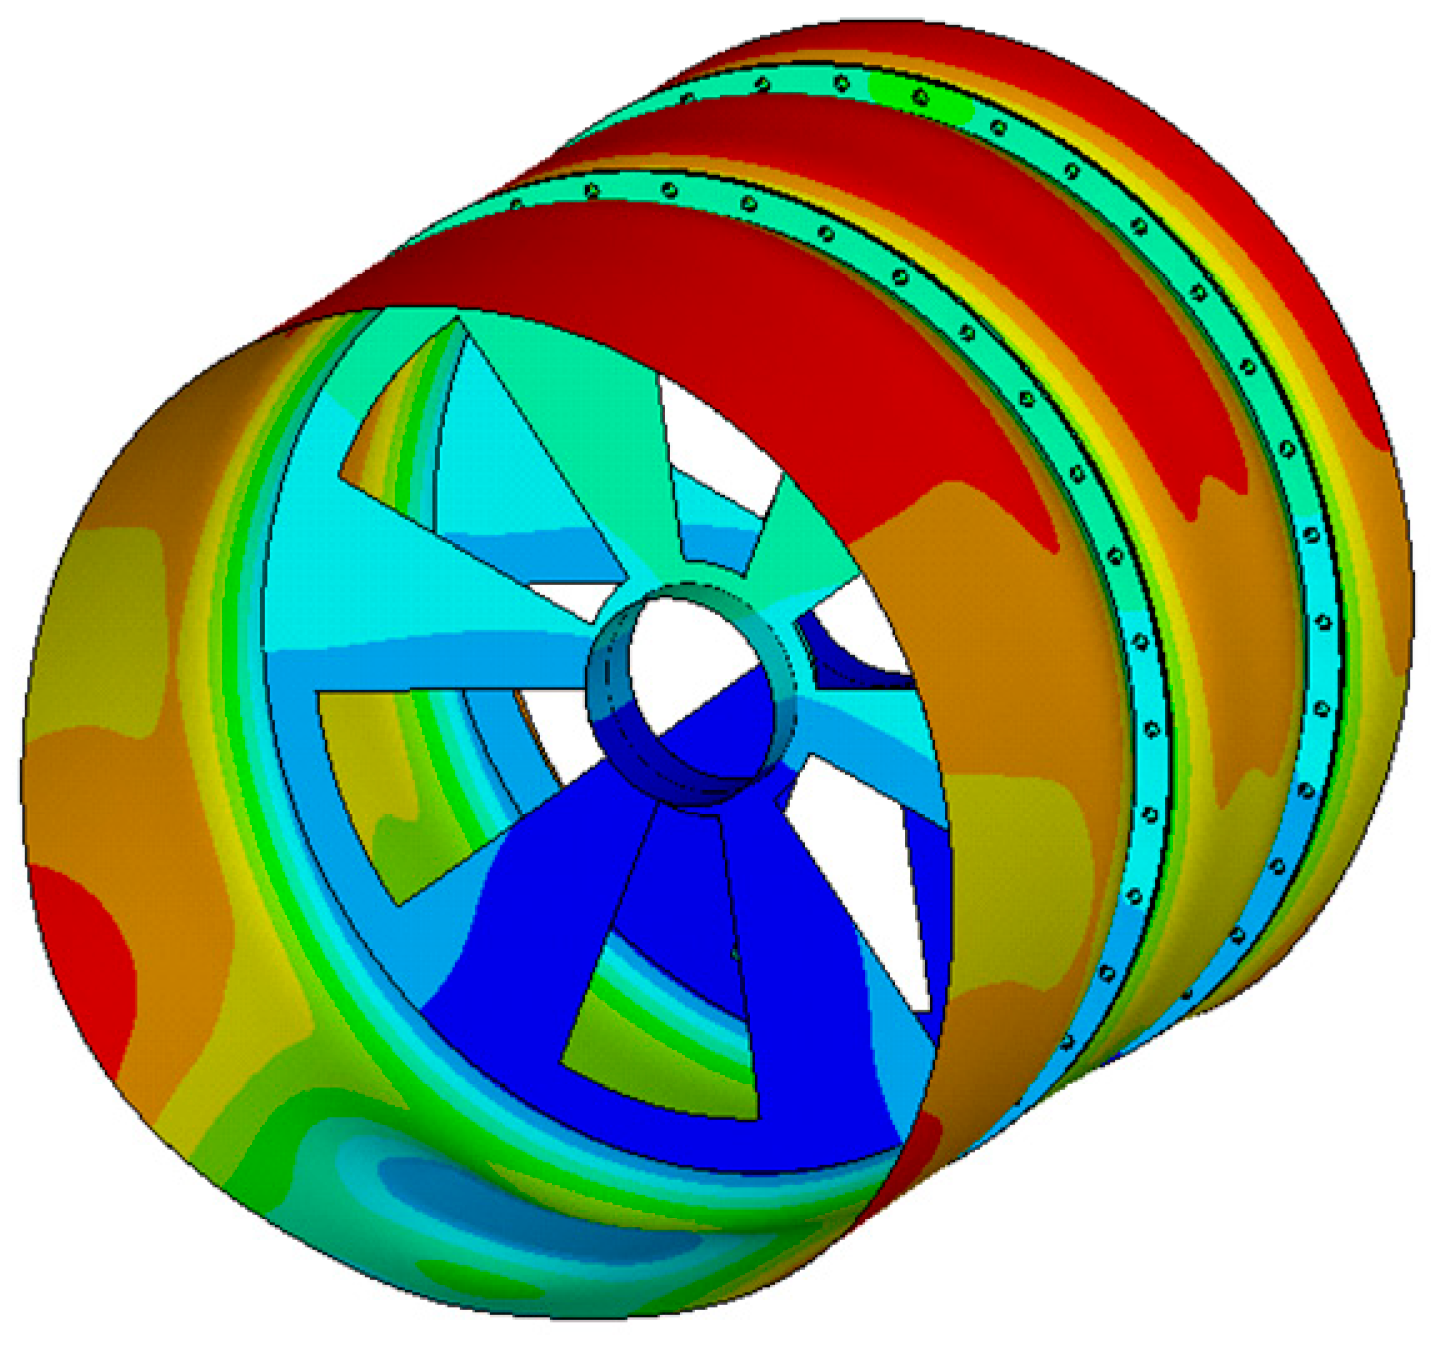
Figure 28.
Cloud diagram of radial deformation under aerodynamic load.
Figure 28.
Cloud diagram of radial deformation under aerodynamic load.
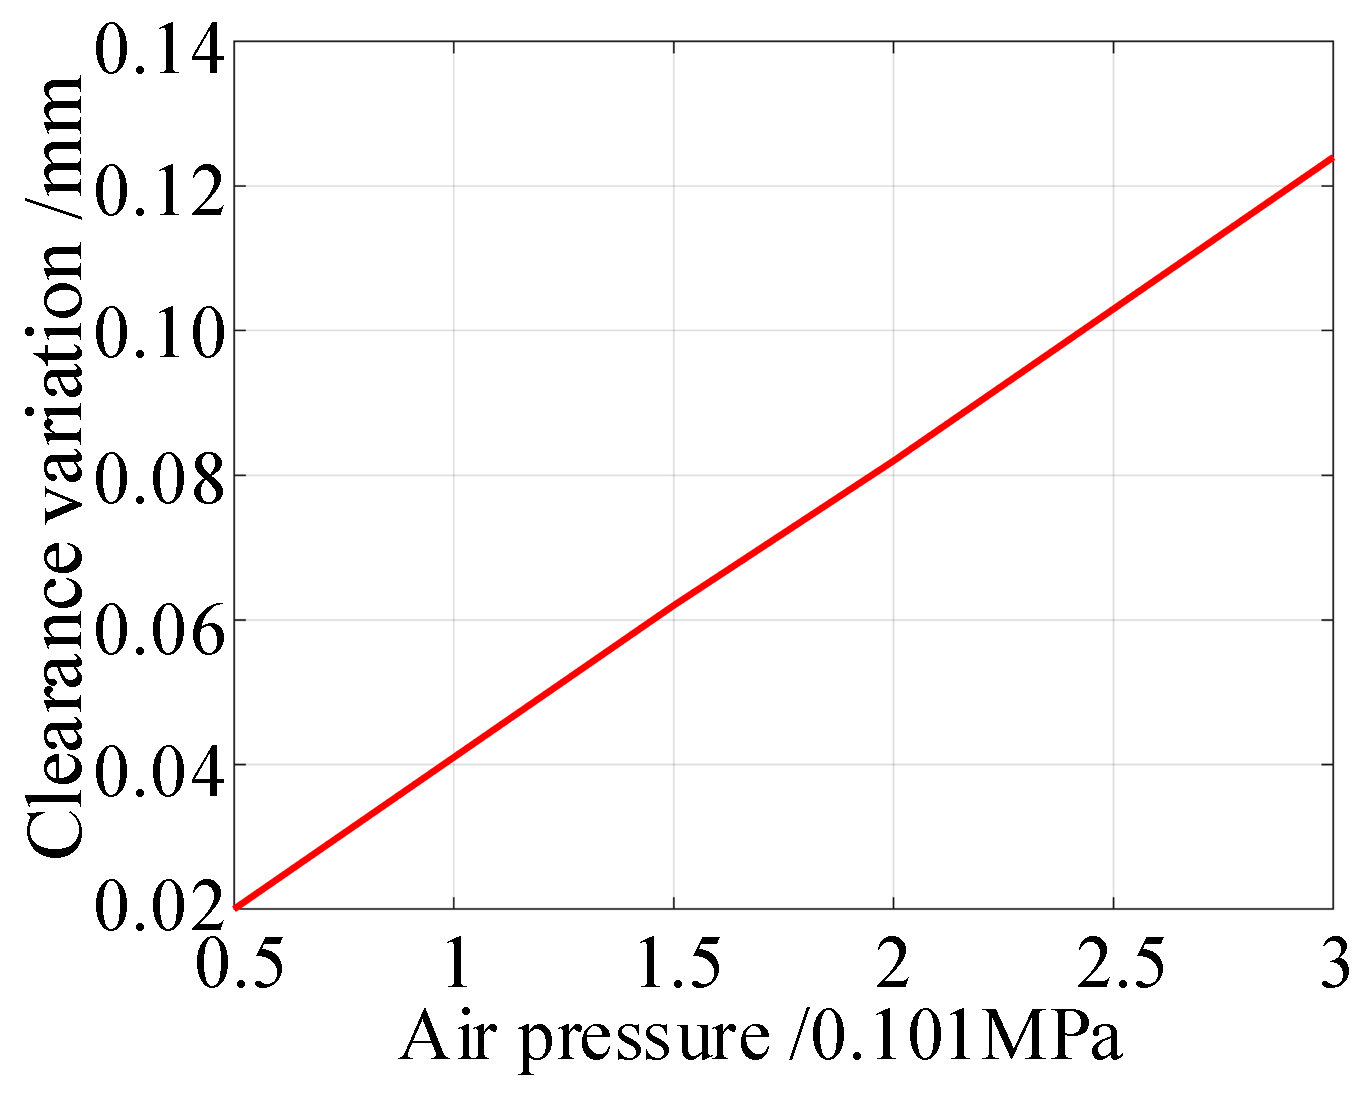
Figure 29.
Change curve of clearance variation under aerodynamic load.
Figure 29.
Change curve of clearance variation under aerodynamic load.
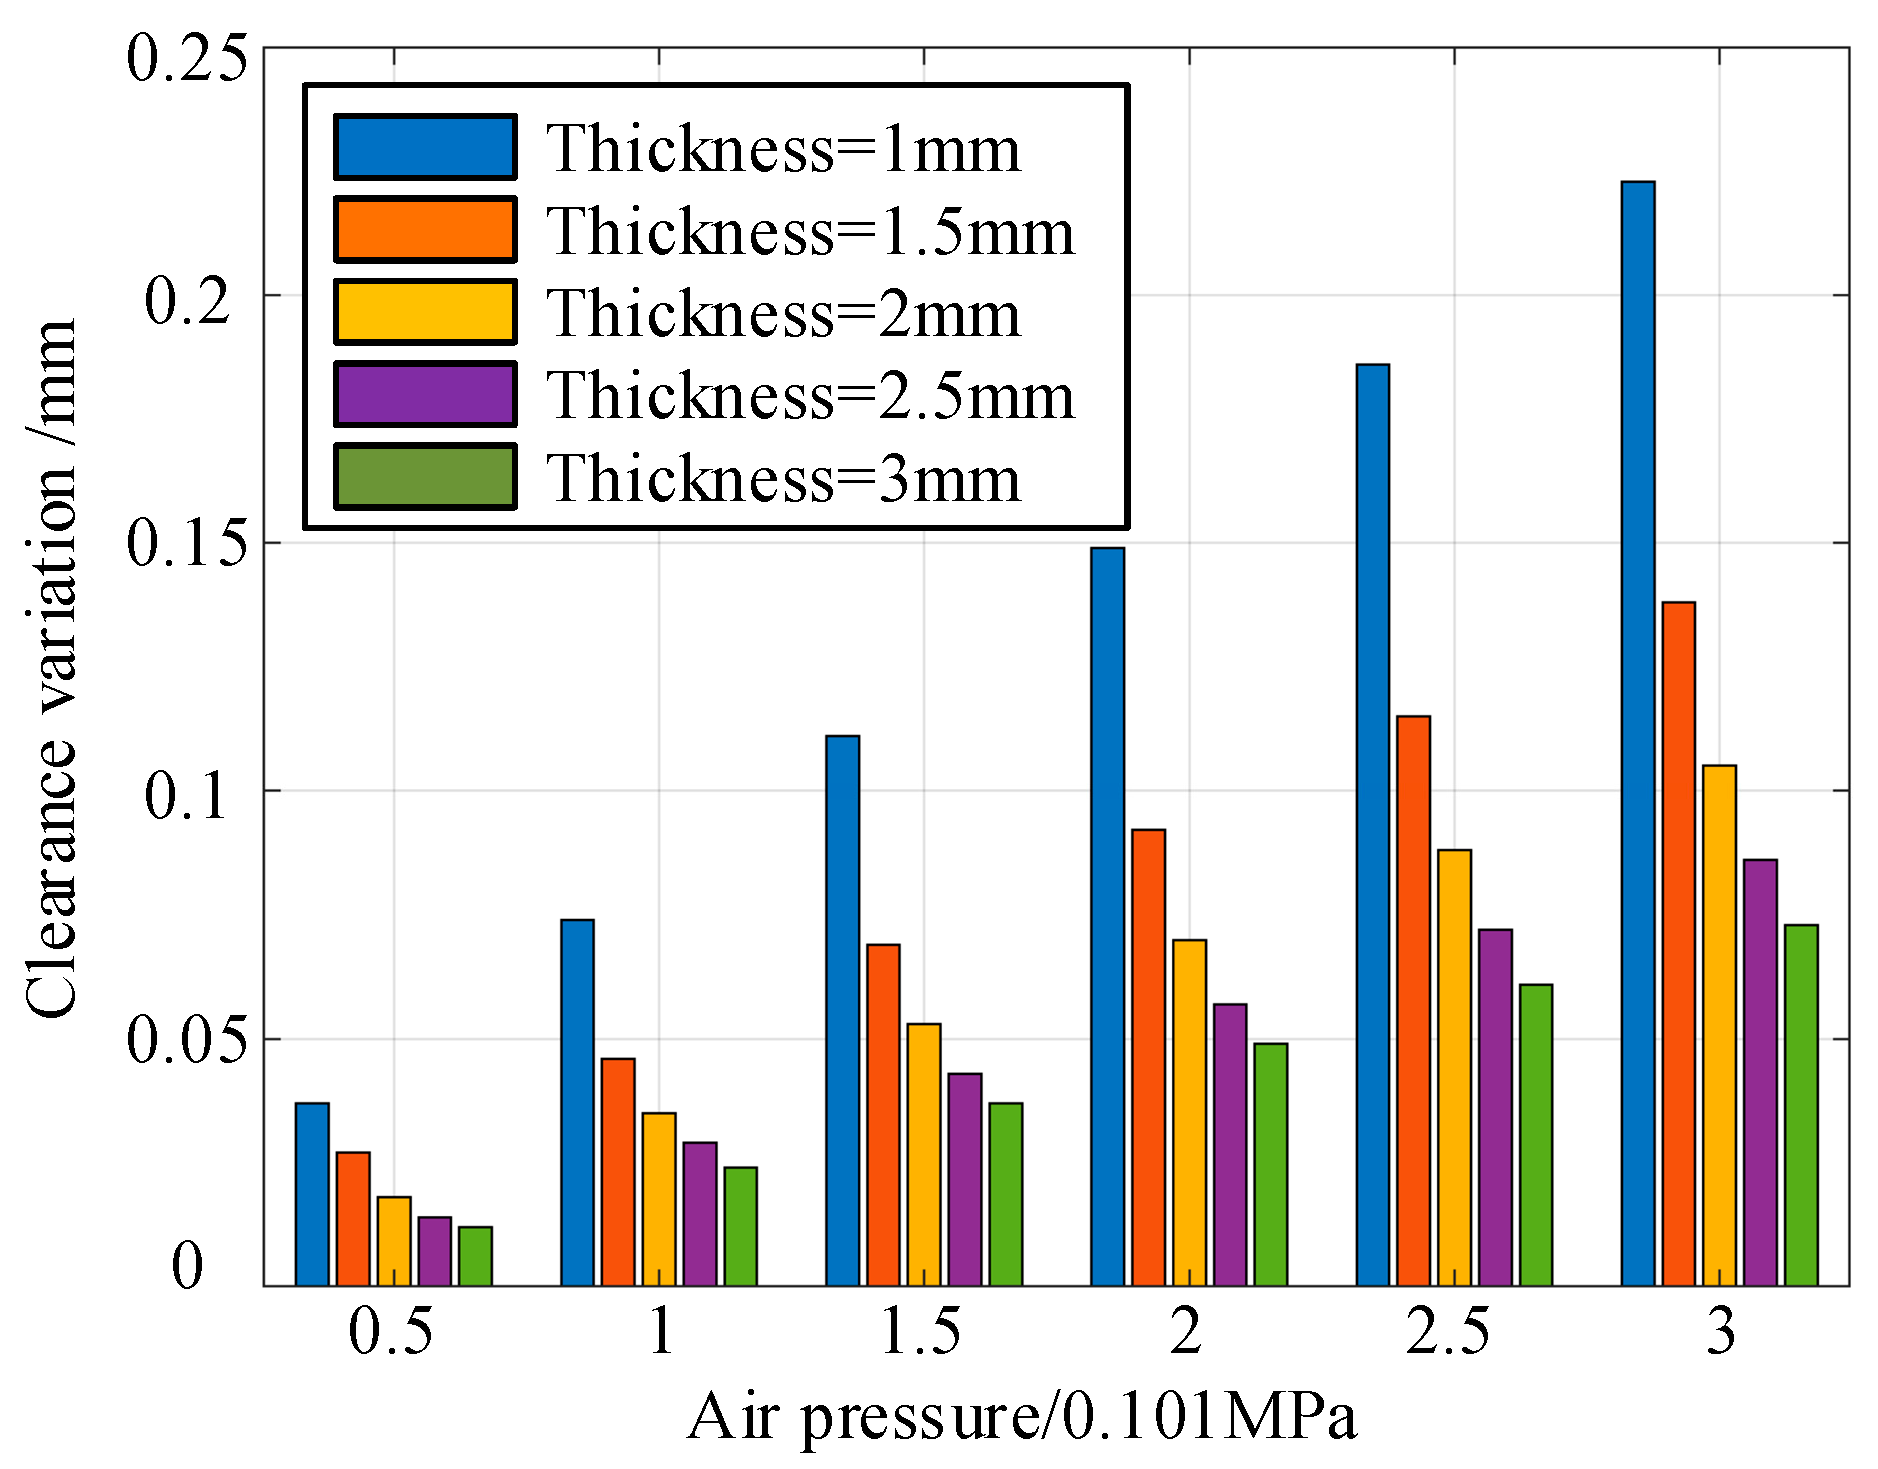
Figure 30.
Bar diagram of clearance variation under different air pressures and thicknesses of shell.
Figure 30.
Bar diagram of clearance variation under different air pressures and thicknesses of shell.
Figure 31.
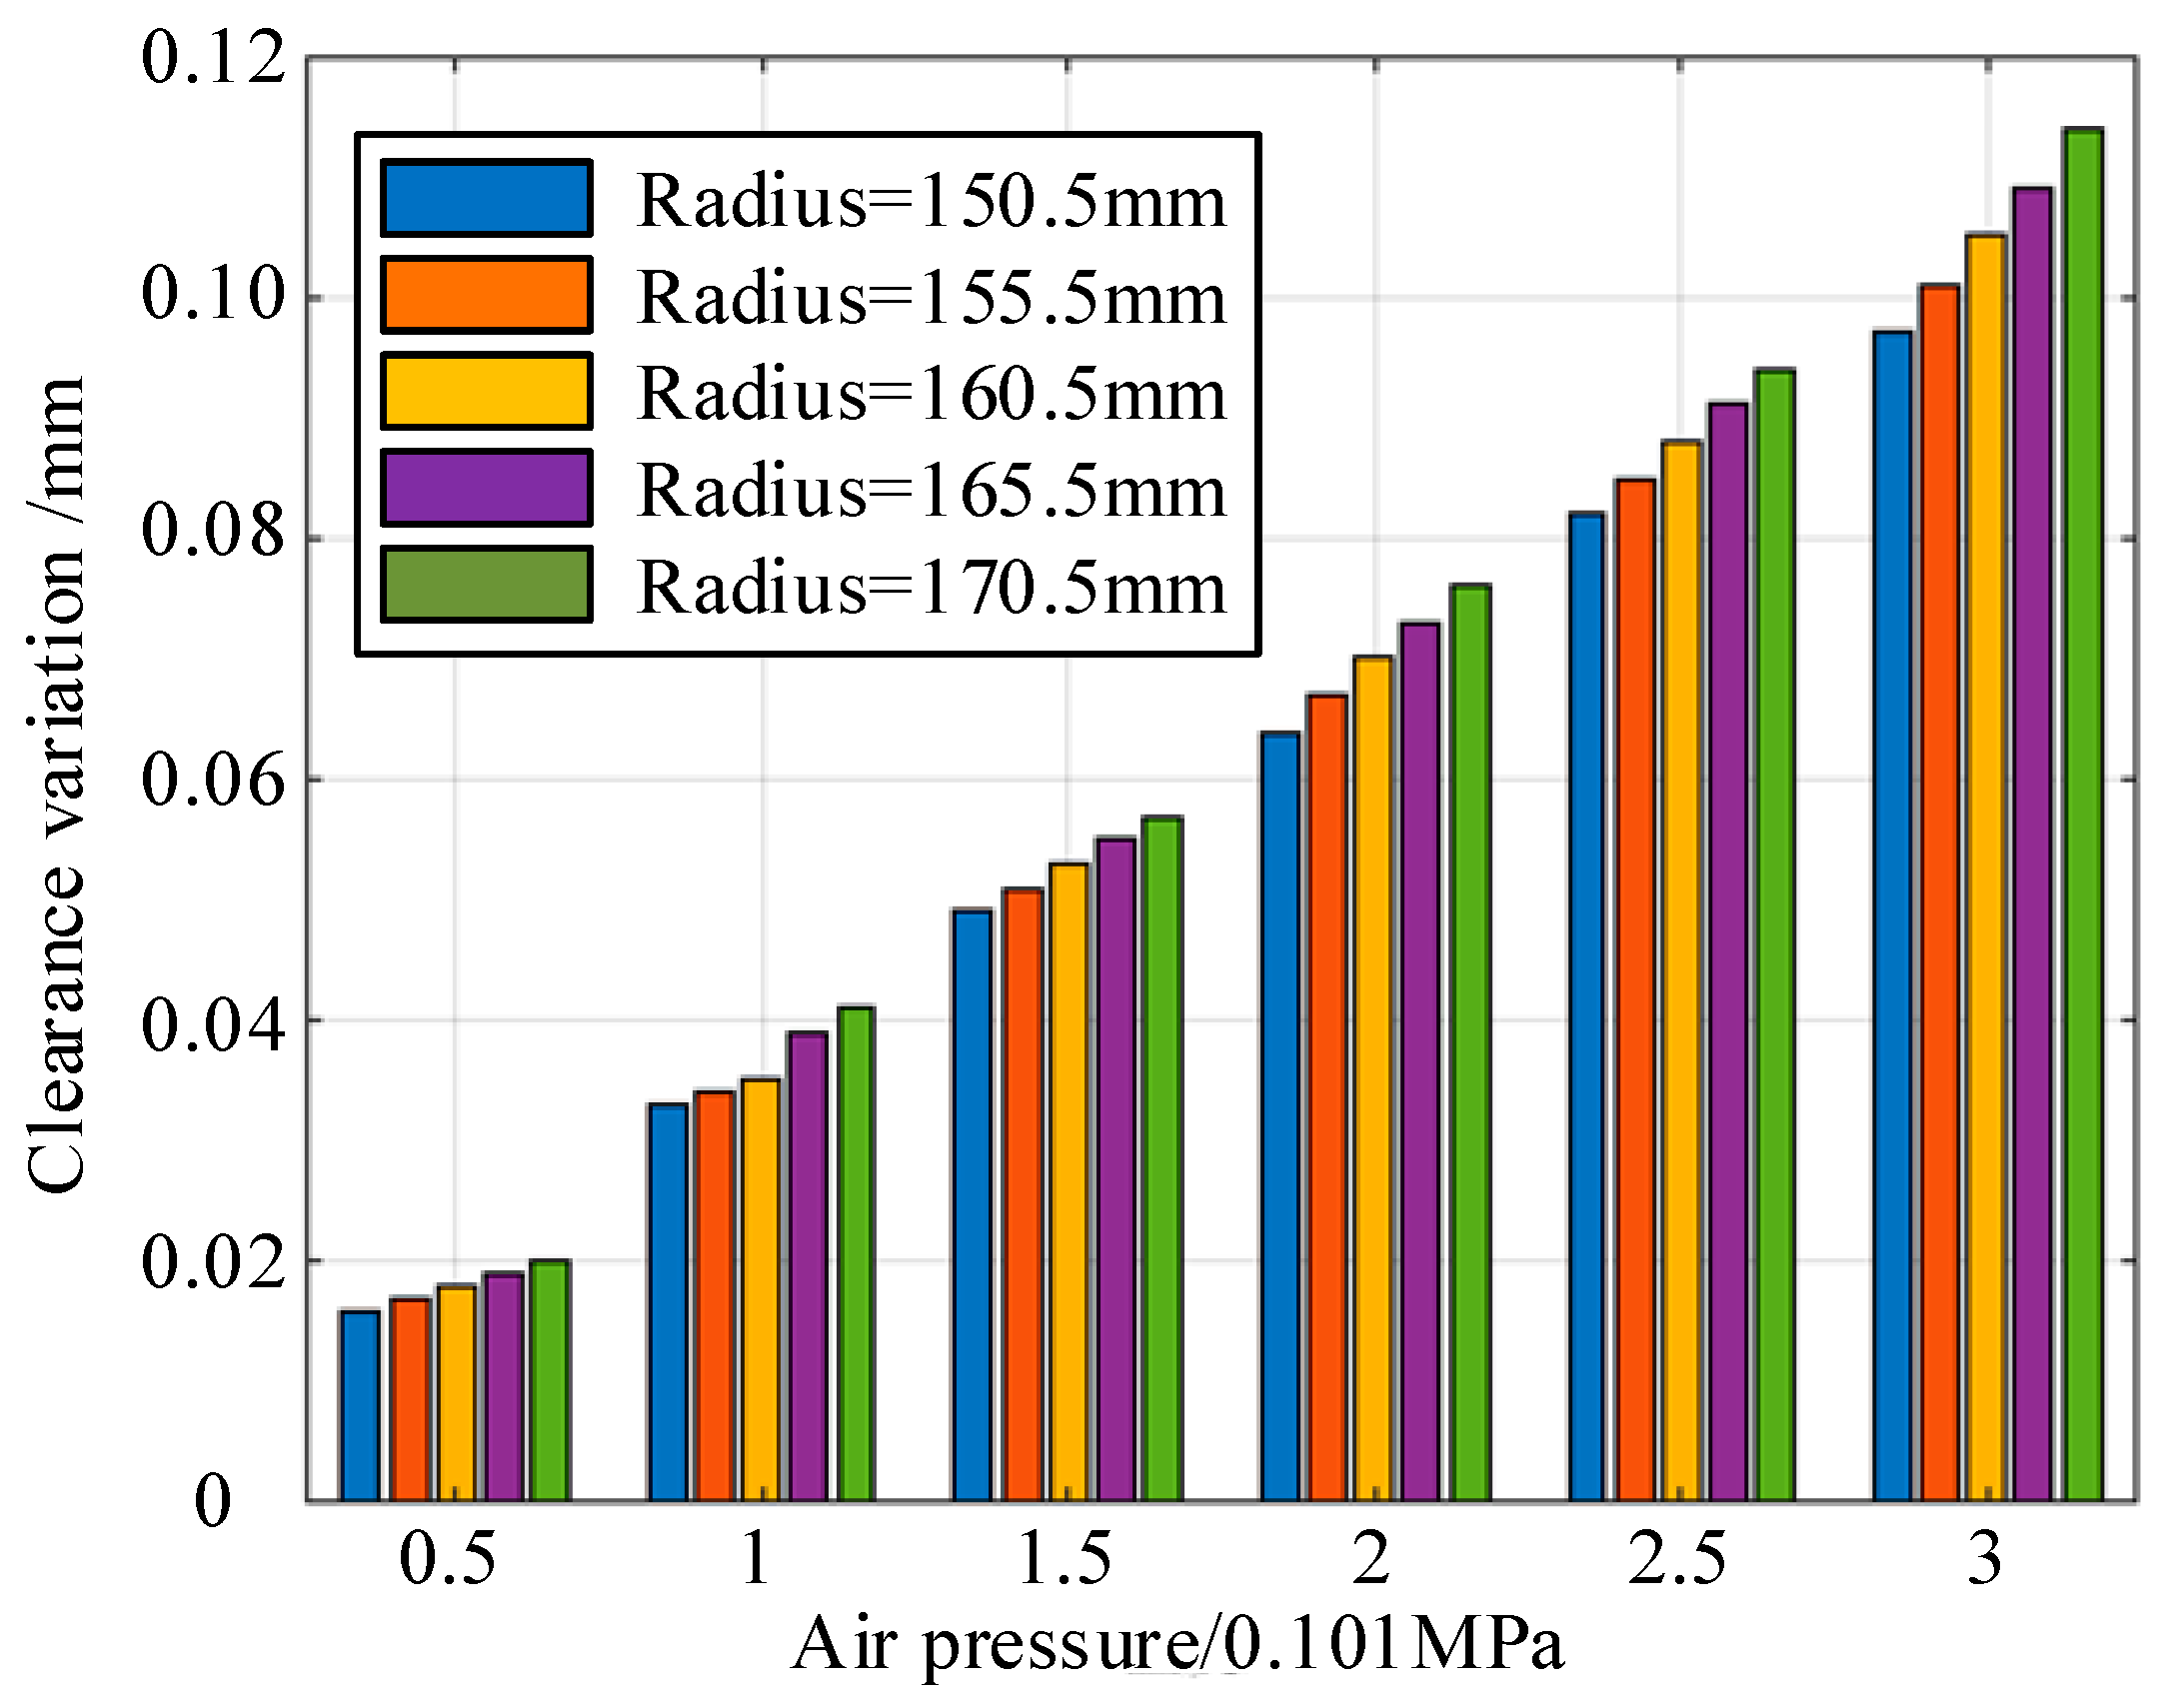
Bar diagram of clearance variation under different air pressures and radii of shell.
Figure 31.
Bar diagram of clearance variation under different air pressures and radii of shell.
Figure 32.
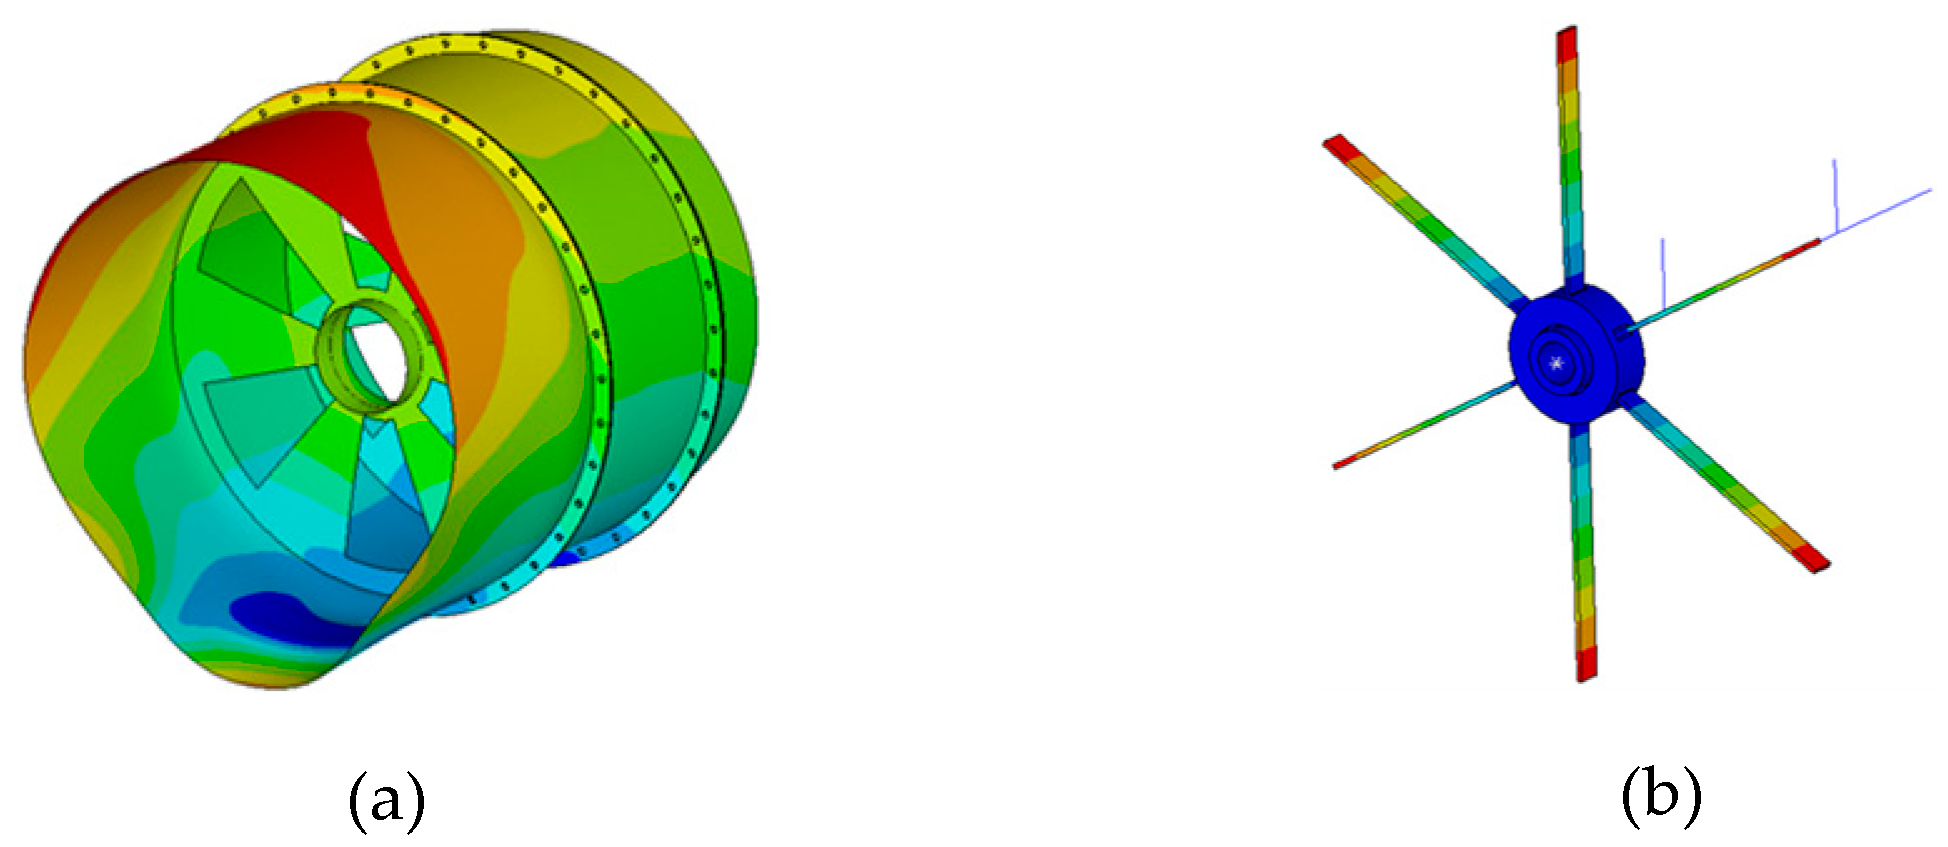
Radial deformation cloud diagram under temperature load. (a) Radial deformation cloud diagram of stator under temperature load (b) Radial deformation cloud diagram of rotor under temperature load.
Figure 32.
Radial deformation cloud diagram under temperature load. (a) Radial deformation cloud diagram of stator under temperature load (b) Radial deformation cloud diagram of rotor under temperature load.
Figure 33.
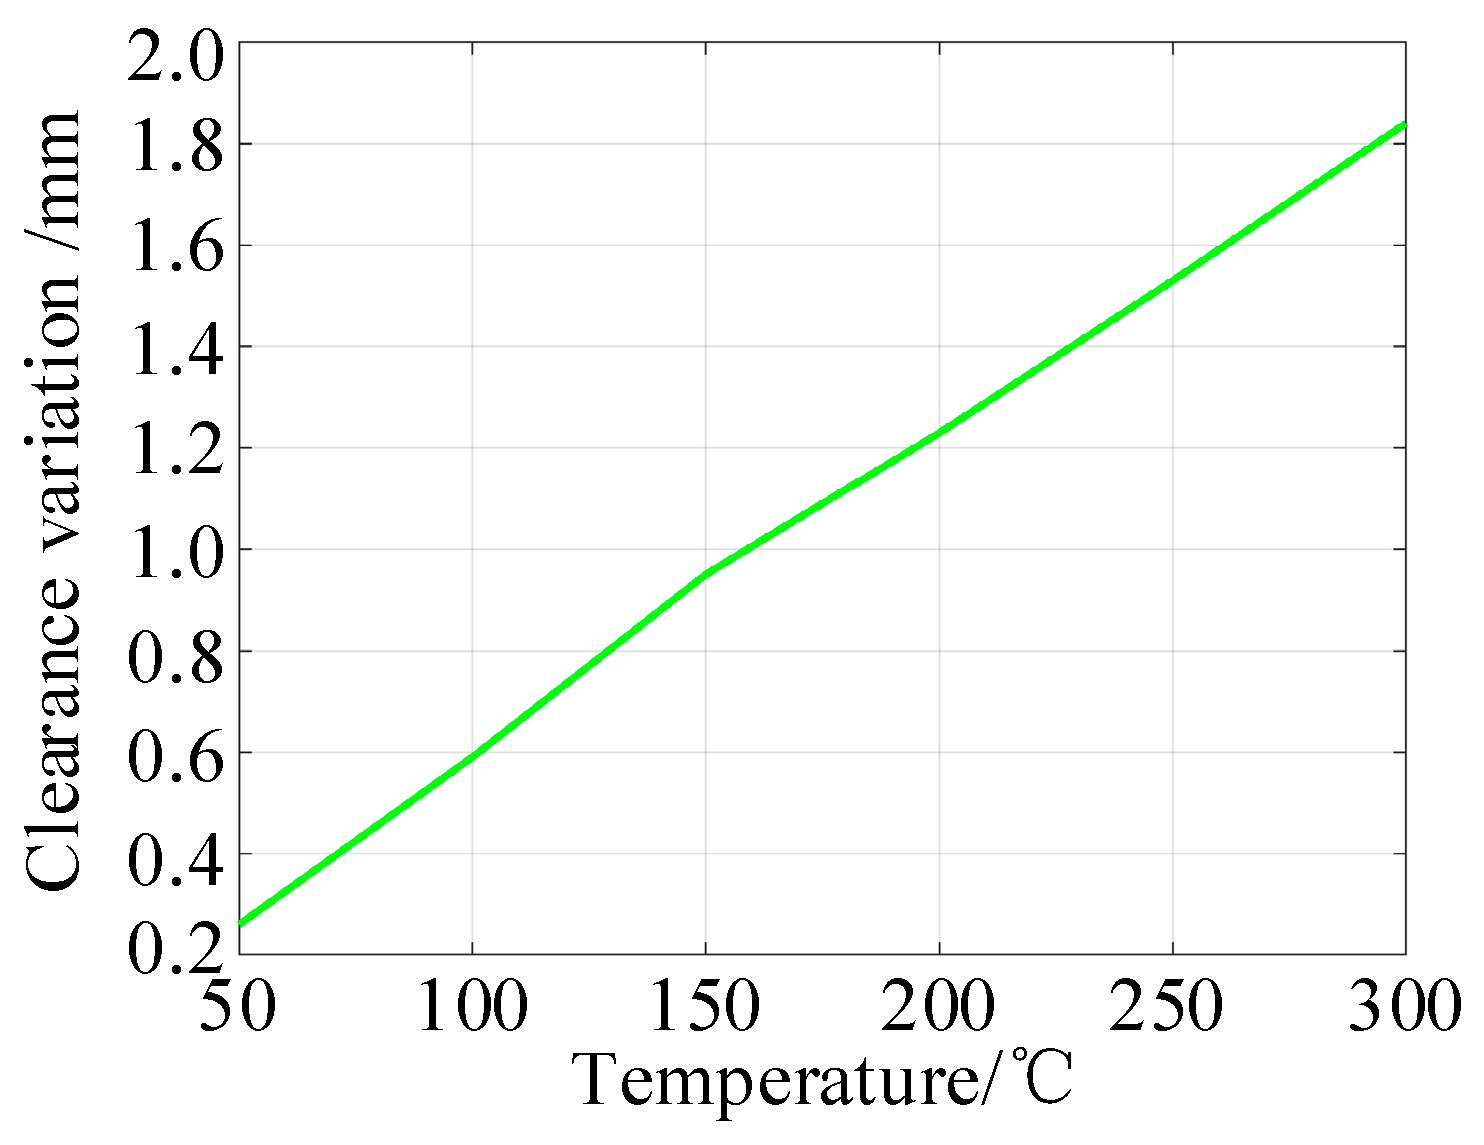
Change curve of clearance variation under temperature load.
Figure 33.
Change curve of clearance variation under temperature load.
Figure 34.
Bar diagram of clearance variation of the structure under different temperatures and different thicknesses of shell.
Figure 34.
Bar diagram of clearance variation of the structure under different temperatures and different thicknesses of shell.
Figure 35.
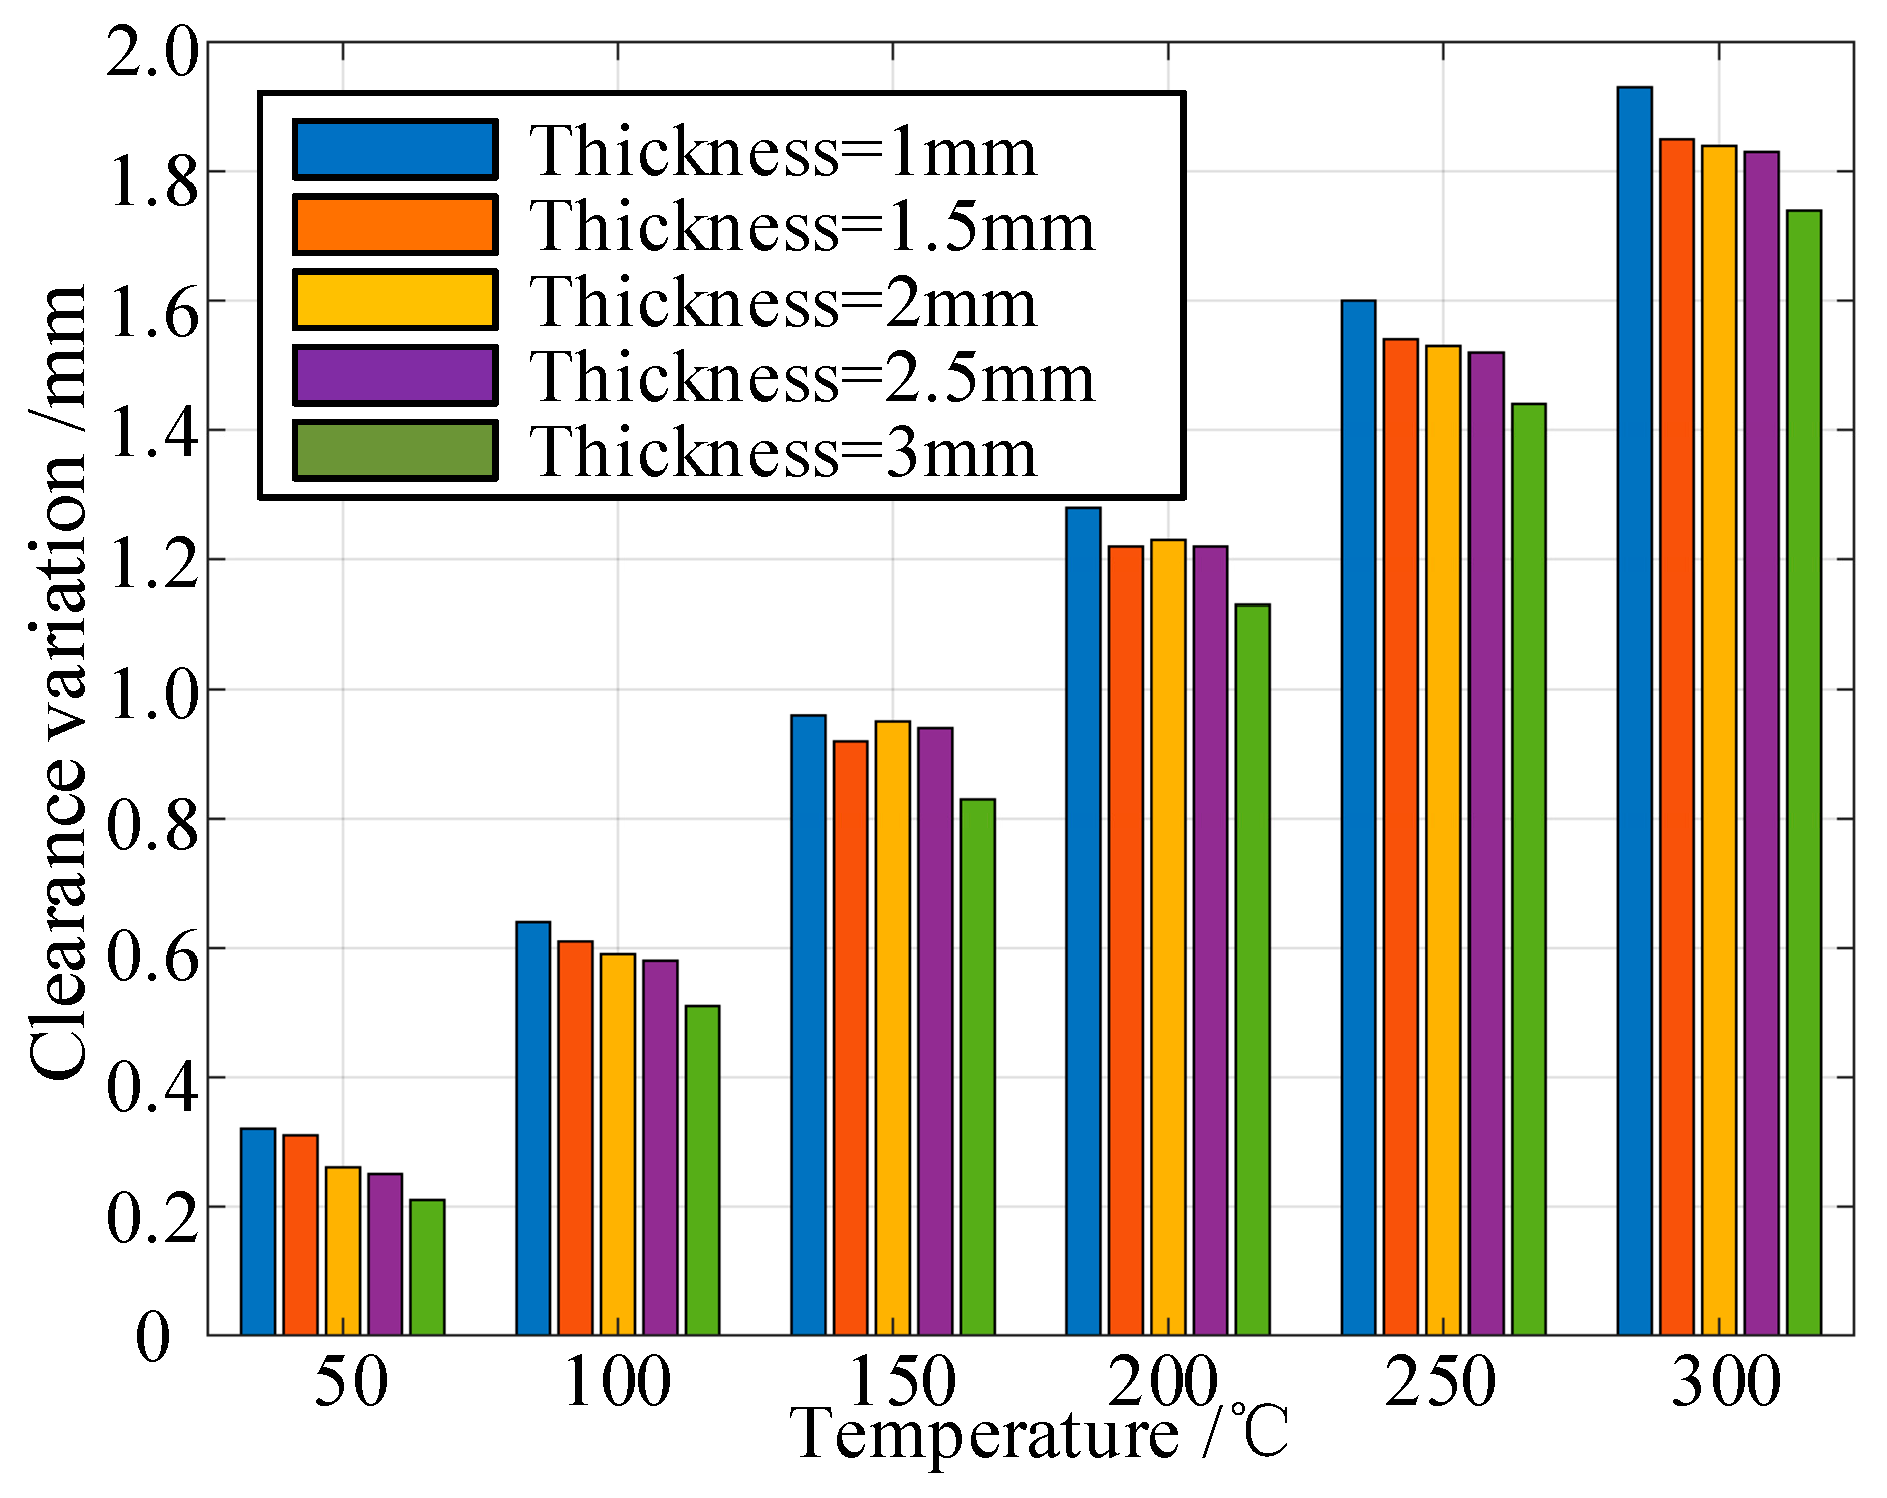
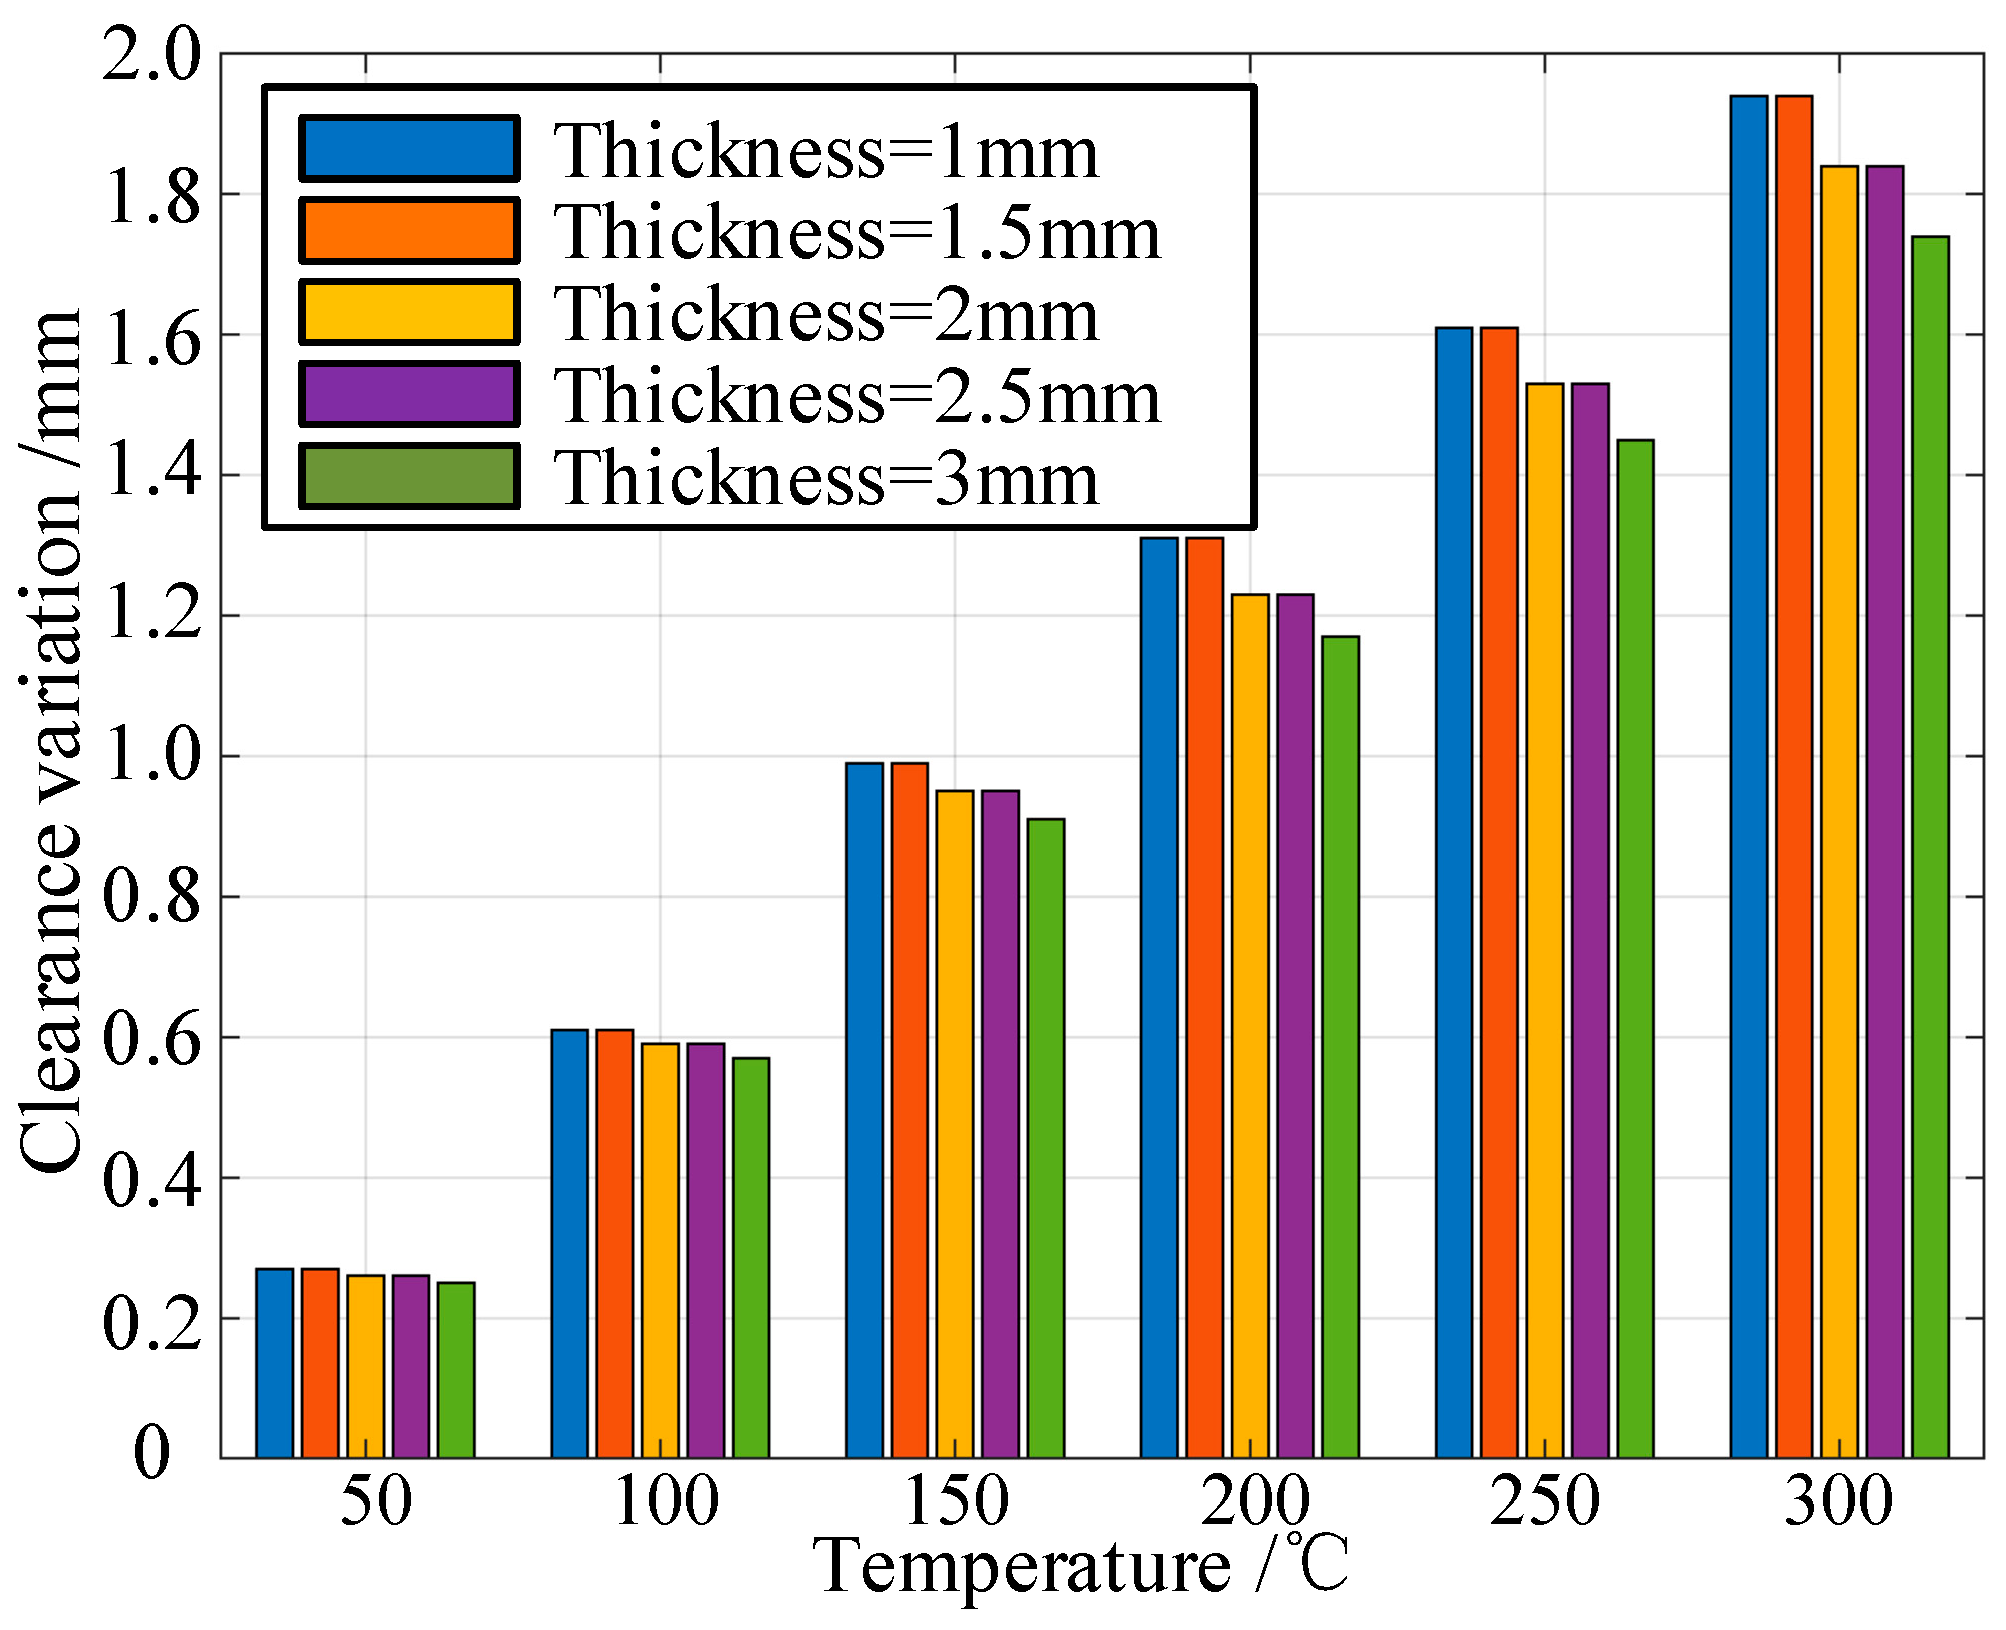
Bar diagram of clearance variation of the structure under different temperatures and different thicknesses of blade.
Figure 35.
Bar diagram of clearance variation of the structure under different temperatures and different thicknesses of blade.
Figure 36.
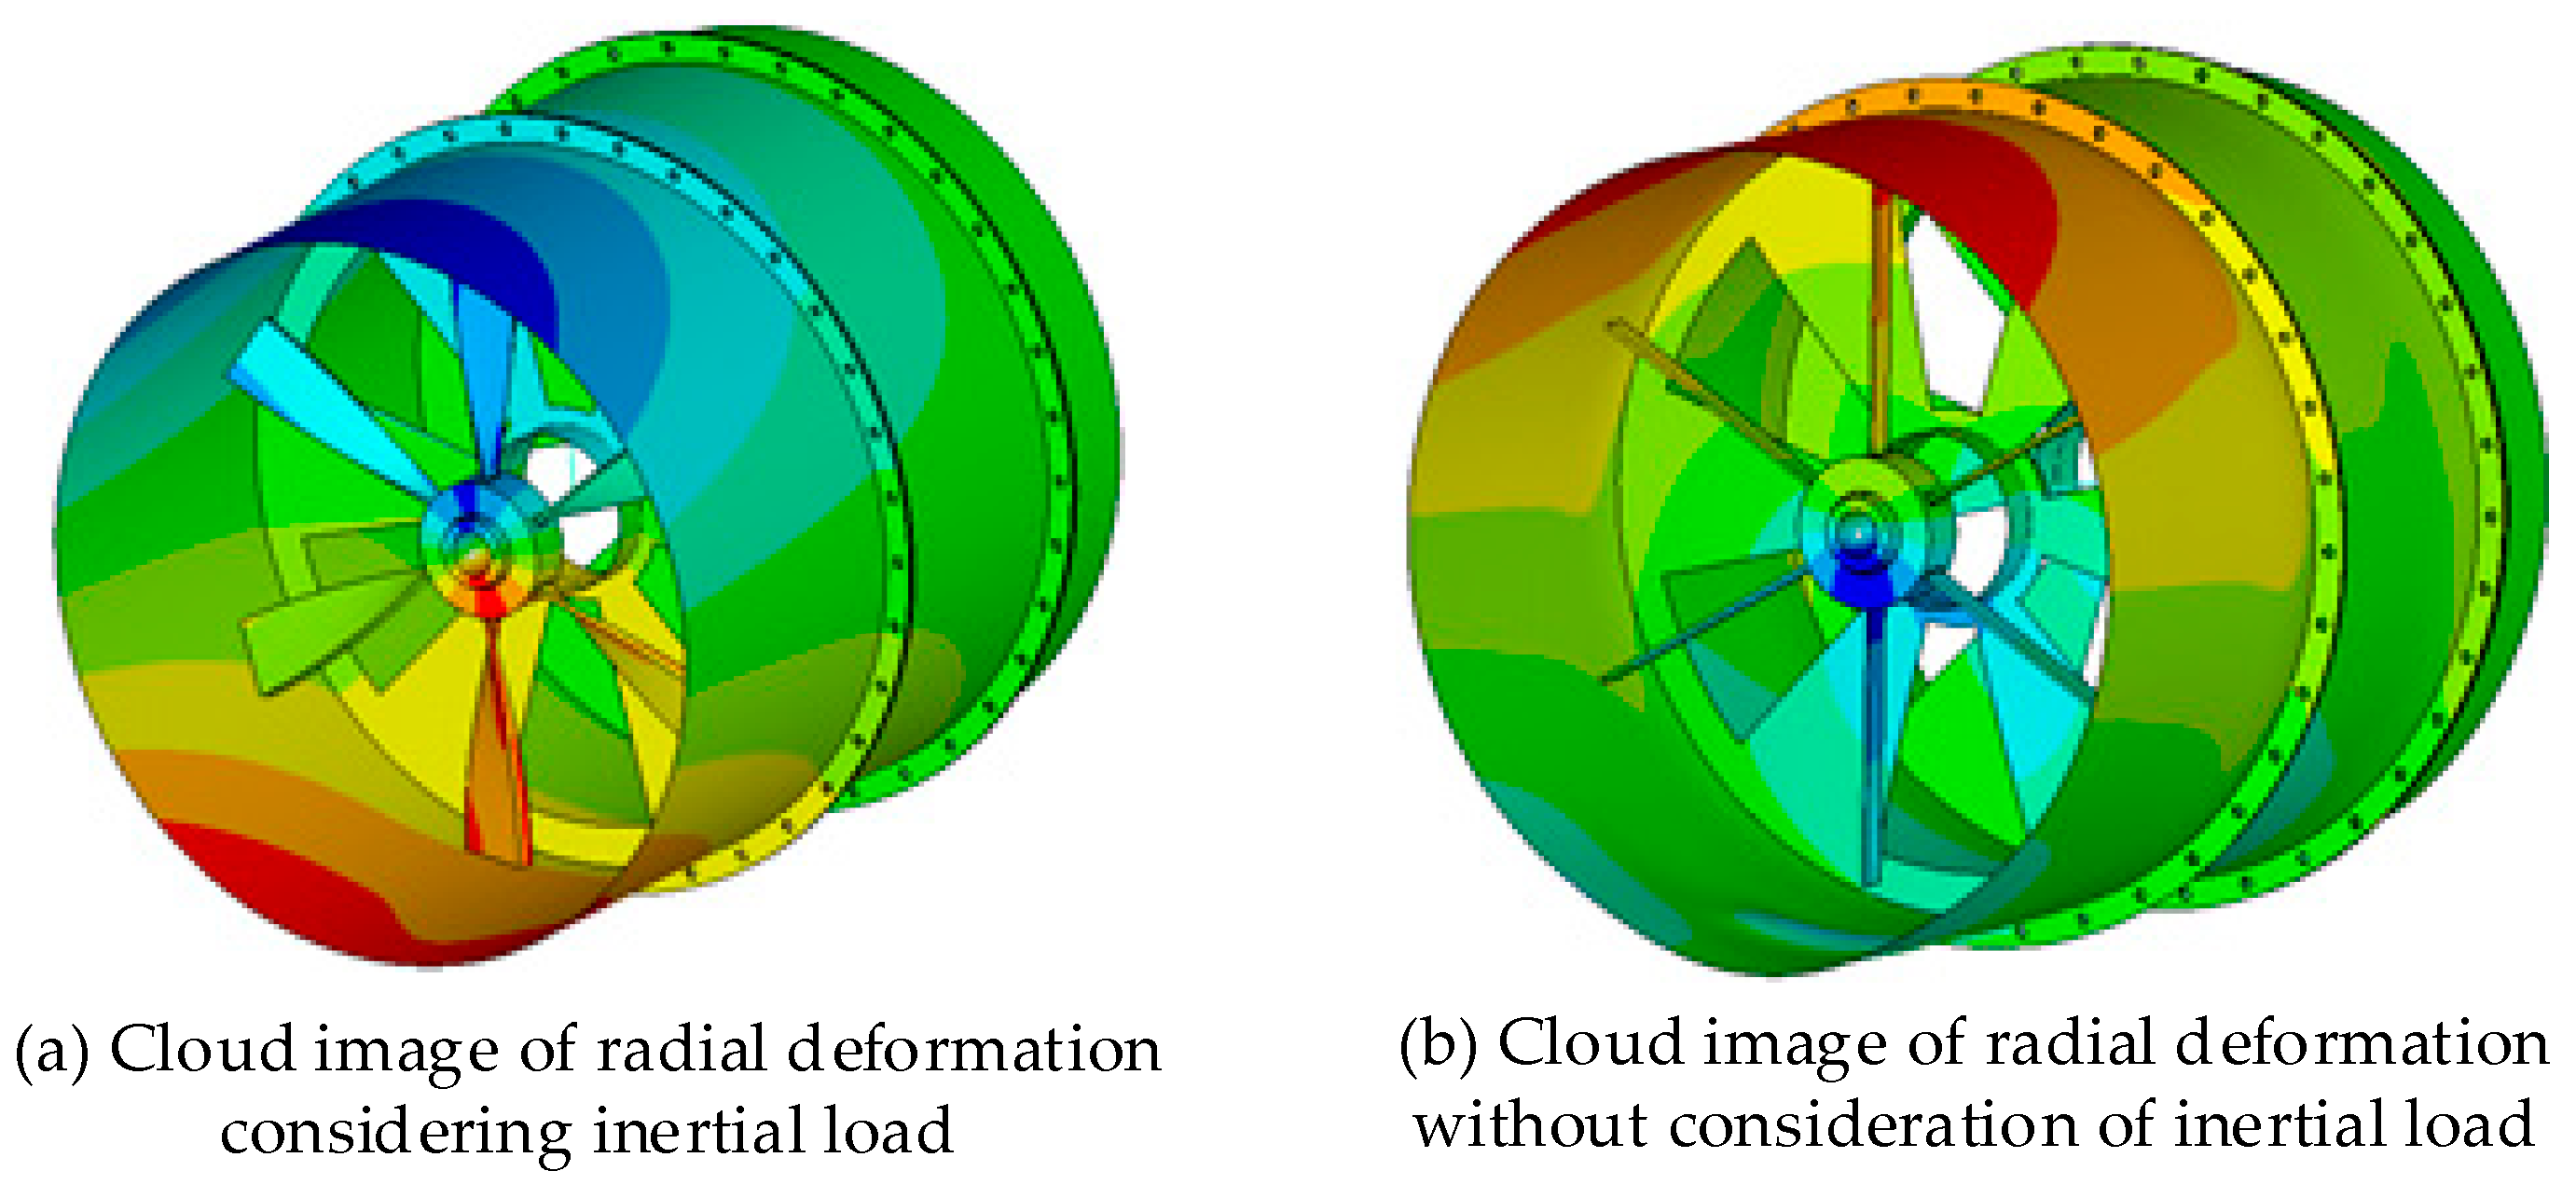
Radial deformation cloud of the rotor–stator coupled structure under multi-physical fields.
Figure 36.
Radial deformation cloud of the rotor–stator coupled structure under multi-physical fields.
Figure 37.
Change curve of clearance variation under different rotation speeds.
Figure 37.
Change curve of clearance variation under different rotation speeds.
Figure 38.
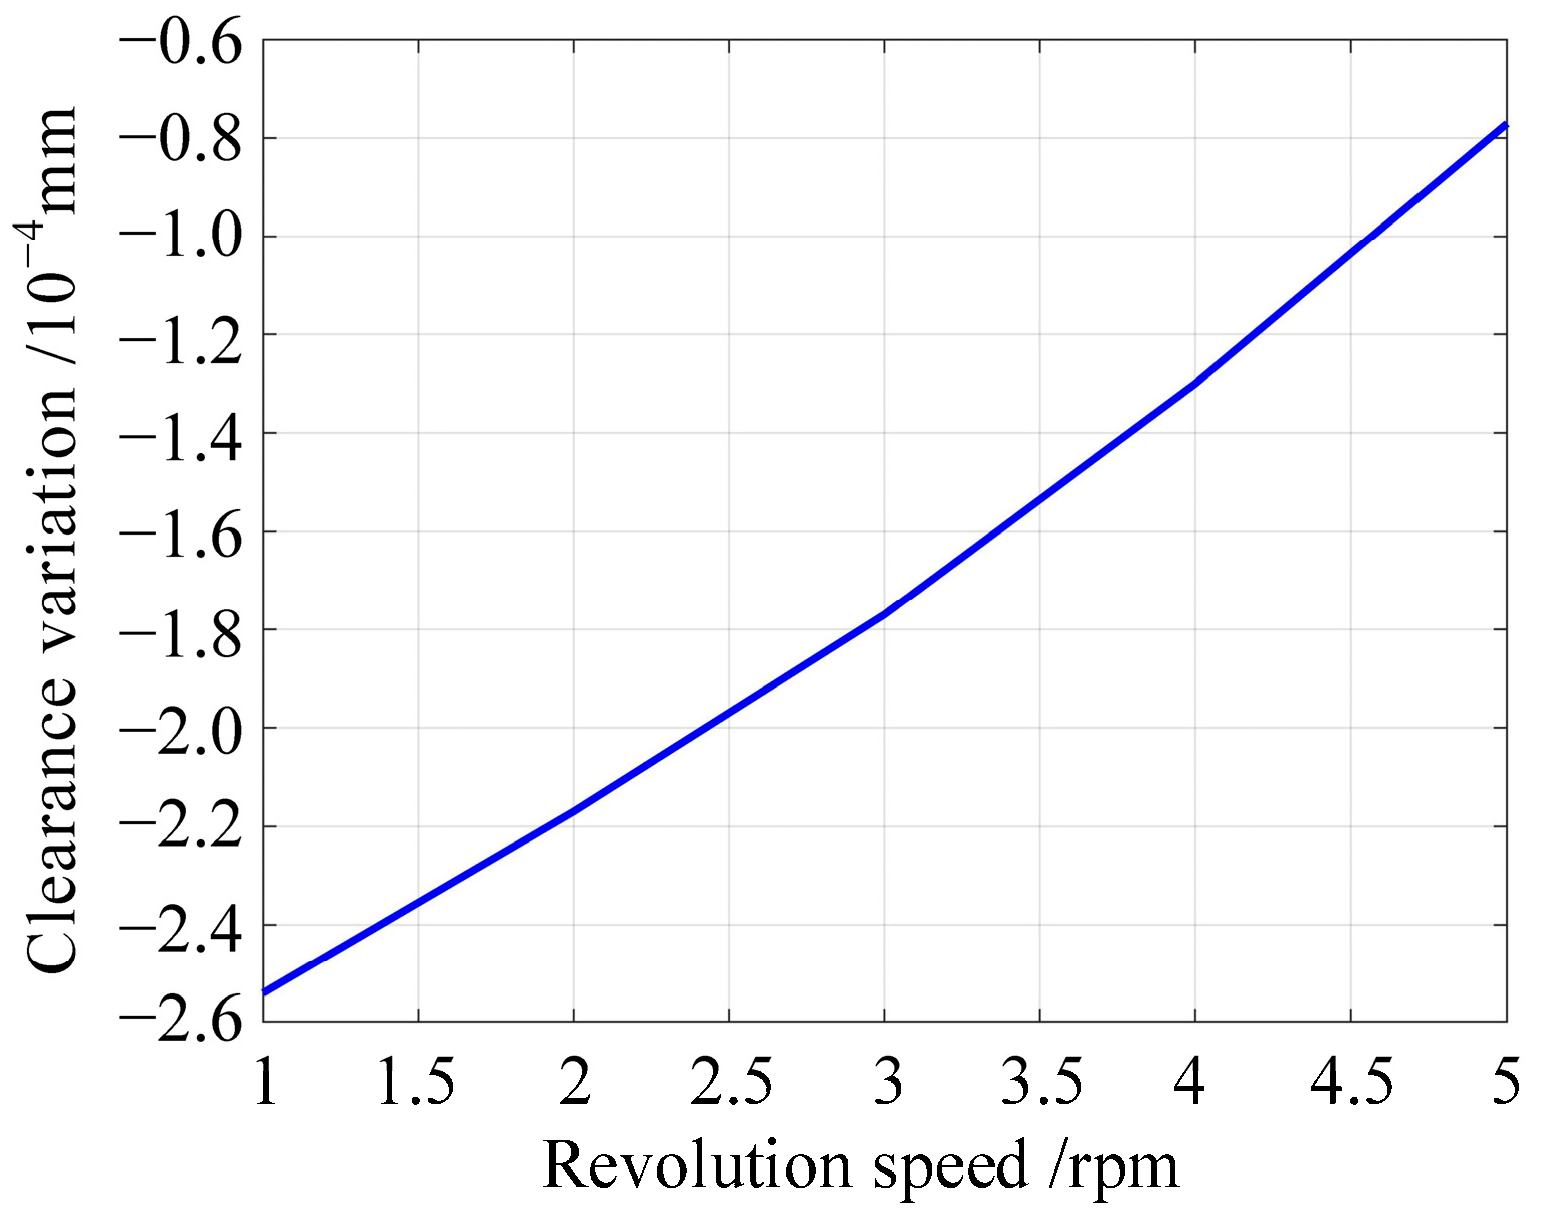
Clearance variation curve of the rotor–stator coupled structure with the revolution speed.
Figure 38.
Clearance variation curve of the rotor–stator coupled structure with the revolution speed.
Figure 39.
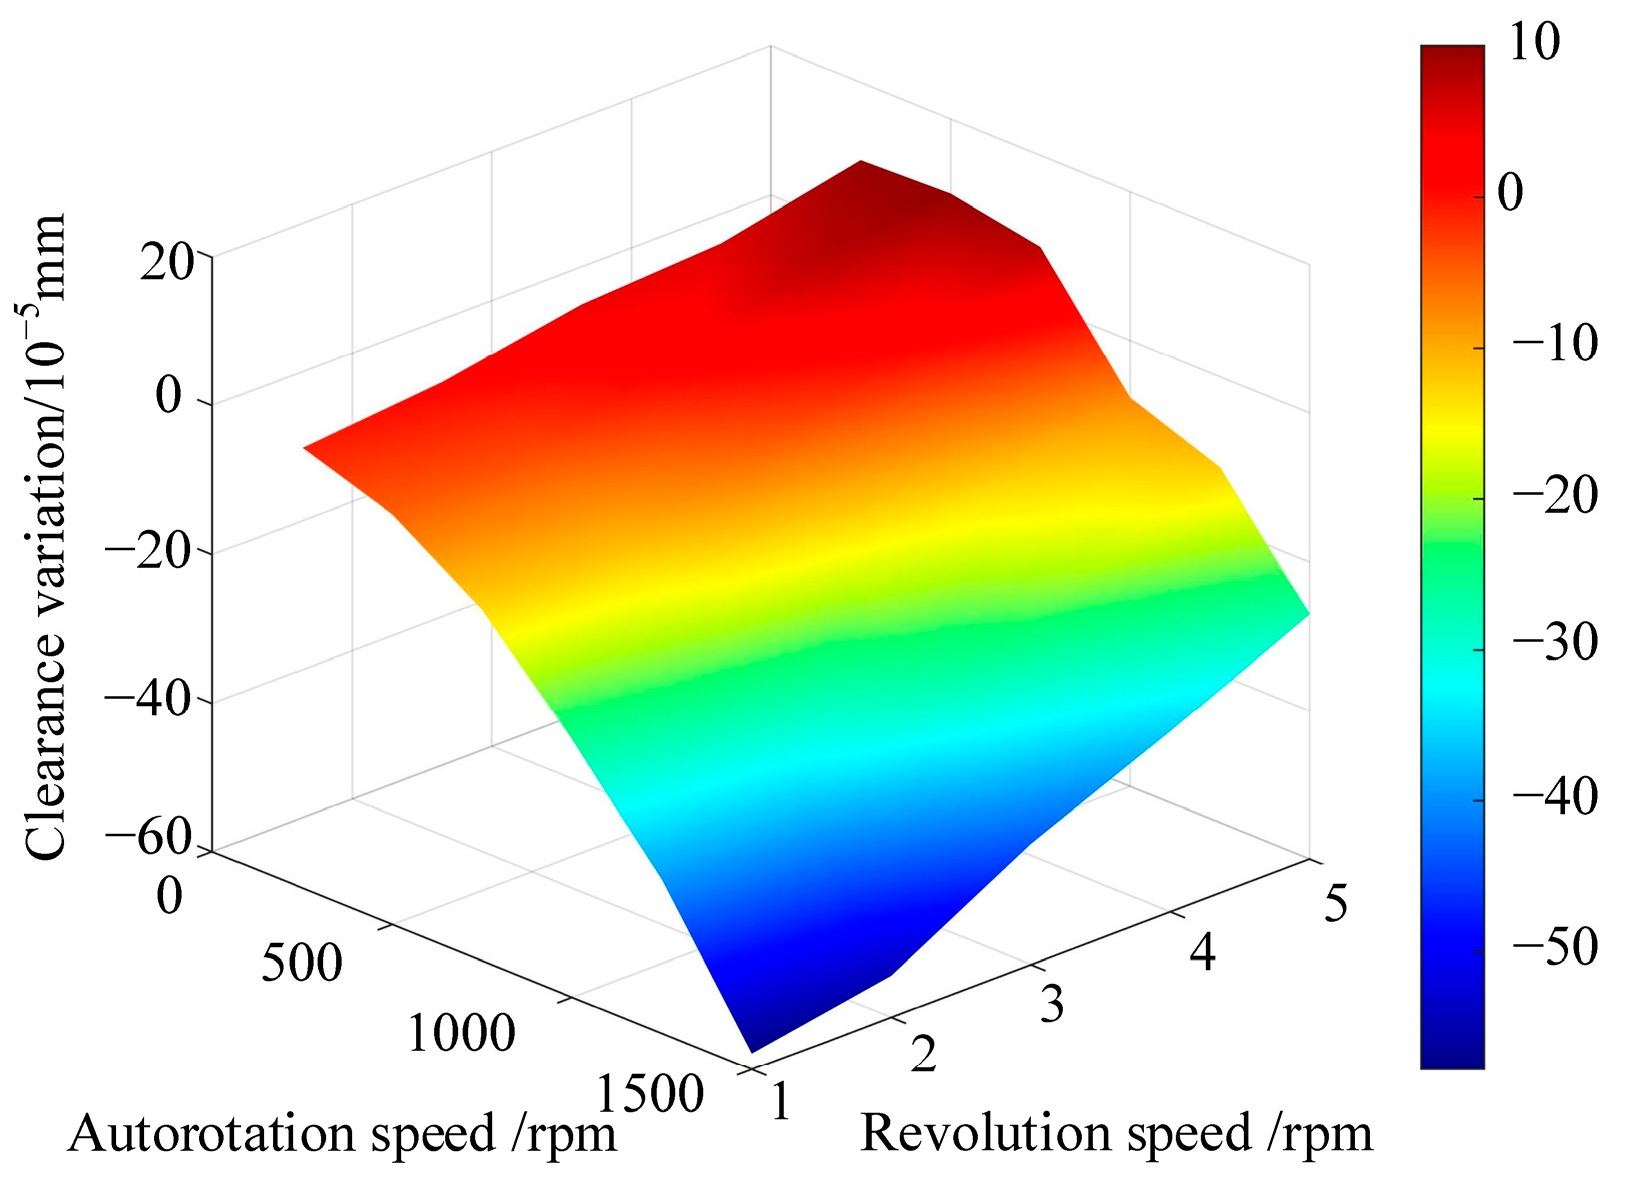
Cloud diagram clearance variation of the rotor–stator coupled structure under different revolution speeds and rotation speeds.
Figure 39.
Cloud diagram clearance variation of the rotor–stator coupled structure under different revolution speeds and rotation speeds.
Table 1.
The force situation of the structure under different operating conditions.
Table 1.
The force situation of the structure under different operating conditions.
| Operating Conditions | Cruising condition | Maneuvering flight condition |
| Force Situation | Including centrifugal load, aerodynamic load, and temperature load | Including centrifugal load, aerodynamic load, temperature load, and inertial moment |
Table 2.
Specific type and parameters of blades.
Table 2.
Specific type and parameters of blades.
| Type | Mean Camber Angle | Length | Width | Thickness |
|---|
| Non-swirled blade | 0 | 110 mm | 10 mm | 2 mm |
Table 3.
Initial value of the parameters to be modified.
Table 3.
Initial value of the parameters to be modified.
| Parameters | Initial Value |
|---|
| Elastic modulus of beam element E | 2 × 10¹¹ Pa |
| Density of beam element ρ | 7850 kg·m−3 |
| Poisson’s ratio of beam element ν | 0.3 |
| Diameter of the beam element D | 2.5 mm |
| Stiffness of the spring element Kx | 2 × 10¹¹ N·m−1 |
| Stiffness of the spring element Ky | 2 × 10¹¹ N·m−1 |
Table 4.
Comparison between natural frequencies obtained by experiment and simulation.
Table 4.
Comparison between natural frequencies obtained by experiment and simulation.
| Order | Experiment Results/Hz | Simulation Results/Hz | Difference/% |
|---|
| 1 | 594.2 | 549.95 | 7.4 |
| 2 | 695.031 | 649.22 | 1.5 |
| 3 | 809.314 | 797.07 | 1.5 |
| 4 | 978.431 | 937.19 | 4.2 |
| 5 | 1035.018 | 1109.124 | 7.2 |
Table 5.
Comparison between modal shapes obtained by simulation and experiment.
Table 6.
Parameters of beam element before and after modification.
Table 6.
Parameters of beam element before and after modification.
| Parameters | Before Modification | After Modification |
|---|
| Elastic modulus of beam element E/Pa | 2 × 10¹¹ | 1.967 × 10¹² |
| Density of beam element ρ/kg·m−3 | 7850 | 17,500 |
Table 7.
Comparison between natural frequencies obtained by simulation and experiment.
Table 7.
Comparison between natural frequencies obtained by simulation and experiment.
| Order | Experiment Results/Hz | Simulation Results/Hz | Difference |
|---|
| 1 | 594.2 | 577.84 | 2.80% |
| 2 | 695.031 | 665.17 | 0.89% |
| 3 | 809.314 | 807.22 | 0.26% |
| 4 | 978.431 | 989.69 | 1.15% |
| 5 | 1035.018 | 1038.90 | 0.38% |
Table 8.
Comparison between natural frequencies of rotor obtained by experiment and simulation.
Table 8.
Comparison between natural frequencies of rotor obtained by experiment and simulation.
| Order | Experiment Results/Hz | Simulation Results/Hz | Difference |
|---|
| 1 | 511.125 | 544.51 | 7.02% |
| 2 | 3085.554 | 3505.3 | 11.90% |
Table 9.
Comparison of modal shapes between simulation and experiment of rotor.
Table 10.
Parameters of spring element before and after modification.
Table 10.
Parameters of spring element before and after modification.
| Parameters | Before Modification | After Modification |
|---|
| Stiffness Kx/N·m−1 | 2 × 10¹¹ | 8.87 × 10⁷ |
| Stiffness Ky/N·m−1 | 2 × 10¹¹ | 1.58 × 10⁹ |
Table 11.
Comparison between natural frequencies of rotor obtained by simulation and experiment.
Table 11.
Comparison between natural frequencies of rotor obtained by simulation and experiment.
| Order | Experiment Results/Hz | Simulation Results/Hz | Difference |
|---|
| 1 | 511.13 | 523.40 | 2.40% |
| 2 | 3085.55 | 3045.00 | 1.31% |
Table 12.
Comparison between simulation results and experimental values of stator thermal deformation.
Table 12.
Comparison between simulation results and experimental values of stator thermal deformation.
| Measuring Point | Experimental Result/mm | Simulation Result/mm | Error |
|---|
| 1 | 0.2 | 0.209 | 4.5% |
| 2 | 0.2 | 0.209 | 4.5% |
Table 13.
Comparison between simulation results and experimental values of rotor thermal deformation.
Table 13.
Comparison between simulation results and experimental values of rotor thermal deformation.
| Measuring Point | Experimental Result/mm | Simulation Result/mm | Error |
|---|
| Blade 1 | 0.1 | 0.093 | 7% |
| Blade 4 | 0.1 | 0.093 | 7% |
Table 14.
Comparison between simulation results and experimental results of clearance change.
Table 14.
Comparison between simulation results and experimental results of clearance change.
| Clearance Change | Experimental Results | Simulation Results | Difference |
|---|
| Blade 1/mm | 0.45 | 0.47 | 4.44% |
| Blade 4/mm | −0.48 | −0.49 | 2.08% |
Table 15.
Blade-tip clearance under different rotating speeds.
Table 15.
Blade-tip clearance under different rotating speeds.
| Rotating speed/rpm | 250 | 500 | 750 | 1000 | 1250 | 1500 |
| Clearance change/mm | −2.12 × 10⁻⁵ | −8.50 × 10⁻⁵ | −1.91 × 10⁻⁴ | −3.40 × 10⁻⁴ | −5.31 × 10⁻⁴ | −7.65 × 10⁻⁴ |
Table 16.
Clearance variation (10−5 mm) under different rotating speeds and blade lengths.
Table 16.
Clearance variation (10−5 mm) under different rotating speeds and blade lengths.
| | Rotating Speed/rpm | 250 | 500 | 750 | 1000 | 1250 | 1500 |
|---|
| Blade Length/mm | |
|---|
| 130 | −1.69 × 10⁻⁵ | −6.76 × 10⁻⁵ | −1.52 × 10⁻⁴ | −2.70 × 10⁻⁴ | −4.22 × 10⁻⁴ | −6.08 × 10⁻⁴ |
| 135 | −1.90 × 10⁻⁵ | −7.59 × 10⁻⁵ | −1.71 × 10⁻⁴ | −3.04 × 10⁻⁴ | −4.75 × 10⁻⁴ | −6.83 × 10⁻⁴ |
| 140 | −2.12 × 10⁻⁵ | −8.50 × 10⁻⁵ | −1.91 × 10⁻⁴ | −3.40 × 10⁻⁴ | −5.31 × 10⁻⁴ | −7.65 × 10⁻⁴ |
| 145 | −2.37 × 10⁻⁵ | −9.47 × 10⁻⁵ | −2.13 × 10⁻⁴ | −4.09 × 10⁻⁴ | −5.92 × 10⁻⁴ | −8.53 × 10⁻⁴ |
| 150 | −2.63 × 10⁻⁵ | −1.05 × 10⁻⁴ | −2.37 × 10⁻⁴ | −4.21 × 10⁻⁴ | −6.58 × 10⁻⁴ | −9.47 × 10⁻⁴ |
Table 17.
Clearance variation (10−5 mm) under different rotating speeds and thicknesses of blade.
Table 17.
Clearance variation (10−5 mm) under different rotating speeds and thicknesses of blade.
| | Rotating Speed/rpm | 250 | 500 | 750 | 1000 | 1250 | 1500 |
|---|
| Blade Length/mm | |
|---|
| 1 | −1.92 × 10⁻⁵ | −7.69 × 10⁻⁵ | −1.73 × 10⁻⁴ | −3.08 × 10⁻⁴ | −4.81 × 10⁻⁴ | −6.92 × 10⁻⁴ |
| 1.5 | −2.03 × 10⁻⁵ | −8.12 × 10⁻⁵ | −1.83 × 10⁻⁴ | −3.25 × 10⁻⁴ | −5.08 × 10⁻⁴ | −7.31 × 10⁻⁴ |
| 2 | −2.12 × 10⁻⁵ | −8.50 × 10⁻⁵ | −1.91 × 10⁻⁴ | −3.40 × 10⁻⁴ | −5.31 × 10⁻⁴ | −7.65 × 10⁻⁴ |
| 2.5 | −2.25 × 10⁻⁵ | −8.99 × 10⁻⁵ | −2.02 × 10⁻⁴ | −3.60 × 10⁻⁴ | −5.62 × 10⁻⁴ | −8.09 × 10⁻⁴ |
| 3 | −2.34 × 10⁻⁵ | −9.36 × 10⁻⁵ | −2.11 × 10⁻⁴ | −3.74 × 10⁻⁴ | −5.85 × 10⁻⁴ | −8.42 × 10⁻⁴ |
Table 18.
Radial deformation of stator under aerodynamic load and clearance change.
Table 18.
Radial deformation of stator under aerodynamic load and clearance change.
| Air pressure/0.101 MPa | 0.5 | 1 | 1.5 | 2 | 2.5 | 3 |
| Clearance variation/mm | 0.020 | 0.041 | 0.062 | 0.082 | 0.103 | 0.124 |
Table 19.
Clearance variation (mm) under different air pressures and thicknesses of shell.
Table 19.
Clearance variation (mm) under different air pressures and thicknesses of shell.
| | Air Pressure/0.101 MPa | 0.5 | 1 | 1.5 | 2 | 2.5 | 3 |
|---|
| Thicknesses/mm | |
|---|
| 1 | 0.037 | 0.074 | 0.111 | 0.149 | 0.186 | 0.223 |
| 1.5 | 0.027 | 0.046 | 0.069 | 0.092 | 0.115 | 0.138 |
| 2 | 0.018 | 0.035 | 0.053 | 0.070 | 0.088 | 0.105 |
| 2.5 | 0.014 | 0.029 | 0.043 | 0.057 | 0.072 | 0.086 |
| 3 | 0.012 | 0.024 | 0.037 | 0.049 | 0.061 | 0.073 |
Table 20.
Clearance variation (mm) under different radii of shell and air pressures.
Table 20.
Clearance variation (mm) under different radii of shell and air pressures.
| | Air Pressure/0.101 MPa | 0.5 | 1 | 1.5 | 2 | 2.5 | 3 |
|---|
| Radius/mm | |
|---|
| 150.5 | 0.016 | 0.033 | 0.049 | 0.064 | 0.082 | 0.097 |
| 155.5 | 0.017 | 0.034 | 0.051 | 0.067 | 0.085 | 0.101 |
| 160.5 | 0.018 | 0.035 | 0.053 | 0.070 | 0.088 | 0.105 |
| 165.5 | 0.019 | 0.039 | 0.055 | 0.073 | 0.091 | 0.109 |
| 170.5 | 0.020 | 0.041 | 0.057 | 0.076 | 0.094 | 0.114 |
Table 21.
Clearance variation and radial deformation of stator and rotor under different temperatures.
Table 21.
Clearance variation and radial deformation of stator and rotor under different temperatures.
| Temperature/°C | 50 | 100 | 150 | 200 | 250 | 300 |
|---|
| Deformation of stator/mm | 0.39 | 0.78 | 1.18 | 1.57 | 1.96 | 2.36 |
| Deformation of rotor/mm | 0.13 | 0.19 | 0.23 | 0.34 | 0.43 | 0.52 |
| Clearance variation/mm | 0.26 | 0.59 | 0.95 | 1.23 | 1.53 | 1.84 |
Table 22.
Clearance variation under different thicknesses of shell and temperature.
Table 22.
Clearance variation under different thicknesses of shell and temperature.
| | Temperature/°C | 50 | 100 | 150 | 200 | 250 | 300 |
|---|
| Thickness/mm | |
|---|
| 1 | 0.32 | 0.64 | 0.96 | 1.28 | 1.60 | 1.93 |
| 1.5 | 0.31 | 0.61 | 0.92 | 1.22 | 1.54 | 1.85 |
| 2 | 0.26 | 0.59 | 0.95 | 1.23 | 1.53 | 1.84 |
| 2.5 | 0.25 | 0.58 | 0.94 | 1.22 | 1.52 | 1.83 |
| 3 | 0.21 | 0.51 | 0.83 | 1.13 | 1.44 | 1.74 |
Table 23.
Clearance variation under different thicknesses of blade and different temperatures.
Table 23.
Clearance variation under different thicknesses of blade and different temperatures.
| | Temperature/°C | 50 | 100 | 150 | 200 | 250 | 300 |
|---|
| Thickness/mm | |
|---|
| 1 | 0.27 | 0.61 | 0.99 | 1.31 | 1.61 | 1.94 |
| 1.5 | 0.27 | 0.61 | 0.99 | 1.31 | 1.61 | 1.94 |
| 2 | 0.26 | 0.59 | 0.95 | 1.23 | 1.53 | 1.84 |
| 2.5 | 0.26 | 0.59 | 0.95 | 1.23 | 1.53 | 1.84 |
| 3 | 0.25 | 0.57 | 0.91 | 1.17 | 1.45 | 1.74 |
Table 24.
Clearance variation of the rotor–stator coupled structure with the rotation speed.
Table 24.
Clearance variation of the rotor–stator coupled structure with the rotation speed.
| Revolution speed/rpm | 2 |
| Rotation speed/rpm | 250 | 500 | 750 | 1000 | 1250 | 1500 |
| Clearance variation/mm | 9.7 × 10⁻⁶ | −3.25 × 10⁻⁵ | −1.08 ×1 0−4 | −2.17 × 10⁻⁴ | −3.63 × 10⁻⁴ | −5.44 × 10⁻⁴ |
Table 25.
Clearance variation of the rotor–stator coupled structure with the revolution speed.
Table 25.
Clearance variation of the rotor–stator coupled structure with the revolution speed.
| Rotation speed/rpm | 1000 |
| Revolution speed/rpm | 1 | 2 | 3 | 4 | 5 |
| Clearance variation/mm | −2.54 × 10⁻⁴ | −2.17 × 10⁻⁴ | −1.77 × 10⁻⁴ | −1.30 × 10⁻⁴ | −7.70 × 10⁻⁵ |
Table 26.
Clearance variation of the rotor–stator coupled structure under different revolution speeds and rotation speeds.
Table 26.
Clearance variation of the rotor–stator coupled structure under different revolution speeds and rotation speeds.
| | Rotation Speed/rpm | 250 | 500 | 750 | 1000 | 1250 | 1500 |
|---|
| Revolution Speed/rpm | |
|---|
| 1 | −8.15 × 10⁻⁶ | −4.86 × 10⁻⁵ | −1.28 × 10⁻⁴ | −2.54 × 10⁻⁴ | −3.93 × 10⁻⁴ | −5.78 × 10⁻⁴ |
| 2 | 9.70 × 10⁻⁶ | −3.25 × 10⁻⁵ | −1.08 × 10⁻⁴ | −2.17 × 10⁻⁴ | −3.63 × 10⁻⁴ | −5.44 × 10⁻⁴ |
| 3 | 4.38 × 10⁻⁵ | 1.83 × 10⁻⁵ | −4.36 × 10⁻⁵ | −1.77 × 10⁻⁴ | −2.72 × 10⁻⁴ | −4.38 × 10⁻⁴ |
| 4 | 5.52 × 10⁻⁵ | 7.6 × 10⁻⁵ | 1.01 × 10⁻⁵ | −1.30 × 10⁻⁴ | −2.00 × 10⁻⁴ | −3.57 × 10⁻⁴ |
| 5 | 9.59 × 10⁻⁵ | 1.00 × 10⁻⁴ | 7.73 × 10⁻⁵ | −7.70 × 10⁻⁵ | −1.22 × 10⁻⁴ | −2.70 × 10⁻⁴ |

