Abstract
Surrogate modeling has been rapidly evolving in the field of aerospace engineering, further reducing the cost of computational analyses. These models often require large amounts of information to learn the underlying process, which is at odds with obtaining and using the highest-fidelity data. This study assesses the efficacy of multi-fidelity modeling (MFM) to improve simulation accuracy while reducing computational cost. A database of hovering rotor simulations with perturbations of the rotor design and operating conditions was first generated using two different fidelity levels of the OVERFLOW 2.4D Computational Fluid Dynamics software. MFM was then used to quantify the effectiveness of this approach for the development of accurate surrogate models. Multi-fidelity models based on Gaussian Process Regression (GPR) were derived for hovering rotor performance prediction given the geometric rotor blade inputs that currently include twist, planform, airfoil, and the collective pitch angle. The MFM approach was consistently more accurate at predicting the hold-out test data than the surrogate model with high-fidelity data alone. An MFM using just 20% of the available high-fidelity training data was as accurate as a solely high-fidelity model trained on 80% of the available data, representing an approximate fourfold reduction in computational cost.
1. Introduction
Surrogate modeling has long been a topic of interest in aerospace engineering. Although early efforts date back a few decades, the recent enthusiasm around artificial intelligence and machine learning has spurred a great deal of research and study to further develop new methods. The use of surrogate modeling has also been expanding greatly in rotorcraft and vertical take-off and landing (VTOL) vehicles in the last few years [1,2,3,4,5,6]. Researchers have also recently organized working groups, such as the American Institute of Aeronautics and Astronautics (AIAA) Applied Aerodynamics Surrogate Modeling (AASM) group, to share best practices and expand the application of these tools [7]. The Aeromechanics Office at the National Aerodynamics and Space Administration (NASA) Ames Research Center, for example, has contributed a publicly available airfoil database for use by the AASM community [8,9].
Advancements in computational efficiency and the availability of toolboxes for training complex surrogate models have enabled widespread access to researchers interested in these topics. The expanding literature, along with working group discussions, such as with the AASM, have identified a few key challenges with the current methods and best practices in surrogate modeling. Despite all these recent advancements in methodologies and computational power, serious limitations still exist in applied surrogate modeling. The curse of dimensionality persists, for example, requiring massive training datasets for studies involving more than just a handful of input features. Fortunately, in rotorcraft numerical modeling, there are a broad range of modeling approaches to select, each with its own tradeoffs of modeling fidelity and cost. While there is no universally agreed upon definition for each fidelity level, these modeling approaches can be categorized as follows.
Low-fidelity modeling approaches simplify the flow field by treating the rotor wake as a flux of momentum across a disk, often coupled with blade element theory (BET) to estimate rotor performance efficiently. A common example is CFD-based actuator disk modeling, where the rotor is represented as a source of momentum and energy. At each time step, induced velocities are extracted from the flow and used with BET to compute rotor loads, which are then applied as source terms in the Navier–Stokes equations. Since the wake is modeled only through fluxes, coarse grid refinements can be used without significantly compromising accuracy. Additionally, the method supports steady-state simulations, reducing computational cost at the expense of largely truncating unsteady wake dynamics.
Additionally, disk modeling relies on BET, which, despite improvements, still depends on empirical models requiring case-specific calibration. To avoid this, high-fidelity blade-resolved CFD can be used, offering reasonably accurate predictions for complex cases such as outwash [10] and downloading [11]. However, this comes at a significant increase in computational cost compared to low-fidelity modeling, with simulations often taking weeks or months to run on hundreds, if not thousands, of CPUs. As in many engineering applications, this creates a trade-off between fidelity and data volume. Lower-fidelity methods enable more simulations with less accuracy, while high-fidelity methods produce limited but more accurate data. While it is outside the scope of this study, it is important to note that there are a broad range of mid-fidelity modeling approaches not mentioned in this paper, each with their own advantages and drawbacks. Depending on the application of interest, modeling approaches of vortex filament line and panel methods, Vortex Transport Method (VTM), Viscous Vortex Particle Method (VVPM), Lattice Boltzmann Method (LBM), and actuator line-based CFD modeling may be used.
Historically, studies often relied heavily on a single modeling approach to generate datasets for surrogate modeling, thus requiring a choice of either higher fidelity or more domain sampling. Recent work, however, has searched for solutions to this problem via multi-fidelity modeling (MFM). The application of MFM to rotorcraft analysis has gained increasing attention in the pursuit of integrating higher-fidelity Computational Fluid Dynamics (CFD) data with predictions from reduced-order, computationally less expensive aerodynamic models. For a review of rotor modeling approaches, including their relative accuracy and computational cost, see [12]. Kriging-based MFM has shown great success for small to mid-sized data sets owing to its robustness and straightforward implementation: early work by Willke examined the use of MFM for aerodynamic optimization of helicopter rotors and yielded up to 69% reduction in computational cost [13]. Another group followed a similar approach using co-kriging to achieve the reported reduction in computational cost by several orders of magnitude and a 2.2% reduction in rotor power requirement [14]. Other early studies by Joby Aviation and the Army Research Laboratory (ARL) applied MFM methods to create accurate surrogate models of highly complex configurations, including the Joby aircraft concept and a tiltrotor pylon setup, respectively [15,16]. The ARL study, which created surrogate models to predict pylon aerodynamics, found that combining low- and high-fidelity data led to a more accurate model than a combination of low-, mid-, and high-fidelity data. Reviews of methods in MFM have recently been provided for both a more general audience [17,18] and an aerospace specific audience [19].
More recent studies have continued expanding the literature on MFM for rotorcraft problems, including airfoil optimization and inverse design [20,21], rotor performance analysis [22,23], and the actual frameworks for supporting MFM creation [24].
This study delves deeper into MFM for hovering rotor performance to identify best practices in database generation, data pre-processing, and MFM construction and analysis. To explore these topics, this study created a preliminary multi-fidelity database of hovering rotor simulations using the OVERFLOW CFD toolset. Two fidelity levels of OVERFLOW simulations were run, including blade-resolved and actuator disk implementations. Thousands of simulations spanning a wide design space were run on the NASA High-End Compute Capability’s (HECC) Graphical Processing Unit (GPU) resources. MFMs of these data were created to provide models for predicting hovering rotor performance.
2. Methods
2.1. Rotor Design Space Sampling
The focus of this study is on advancing MFM methods towards the creation of generalizable models for rotor performance prediction and analysis. As such, this first study focuses on the parametrization of a hovering rotor. Rotor blade geometric input features were included for the: (1) linear taper; (2) linear twist; (3) inboard airfoil thickness; (4) inboard airfoil camber; (5) outboard airfoil thickness; and (6) outboard airfoil camber. The operating conditions of (7) blade-tip Mach number and (8) collective were also included in the simulation parametrization. The ranges for these input features are reported in Table 1. Airfoil thickness is held constant along the inboard (from root cut-out to 80% r/R) and separately along the outboard (from 85% r/R to blade tip) sections, with a linear blend between the two sections.

Table 1.
Range of Variable Input Features in the Hovering Rotor Simulation Database.
A few rotor parameters were held constant to limit the scope of study for this first investigation. All analyses use a 4-bladed rotor of 5-meter radius with a chord of 0.322 m at the 75% radial location. This results in all rotors having a consistent number of blades and constant solidity. These constants are summarized in Table 2. See Figure 1 for an annotated diagram of the rotor.
Table 2.
Fixed Design Variables in the Hovering Rotor Simulation Database.
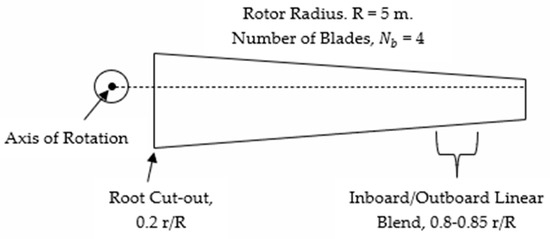
Figure 1.
Schematic of the Rotor Design Variables.
The Greedy Farthest Point (GreedyFP) algorithm was used to intelligently sample this eight-feature input space [25]. GreedyFP is a space-filling algorithm with many benefits for sampling complex high-parameter design spaces. It generates a large random set of candidate points within the design space using a scale factor multiple beyond the desired number of samples. The algorithm then selects the desired number of samples as a subset of the candidate points by maximizing the Euclidean distance between samples. A case list of 10,000 samples was generated for this study, using a scale factor of 20. This means that 200,000 candidates were initially randomly generated in the eight-feature input space, and the final 10,000 samples were selected from that set by iteratively selecting samples to maximize the distance between them. This results in a list of samples that incrementally improve coverage of the design space by selecting new points that are farthest from existing samples, ensuring progressively more even coverage of the domain.
GreedyFP is more computationally efficient compared to other common methods such as Latin Hypercube Sampling [25]. A scale factor of 10 has been shown to provide satisfactory results, with a scale factor of 20 being a moderate value and 50 being a high value. The final case list of 10,000 samples covers the full design space and incrementally increases the coverage from the top of the list down. This is favorable for MFM as, if a user is restricted in the number of samples they can obtain, they simply start at the top and work their way down the list. This provides nearly evenly spaced coverage for an arbitrary number of samples. The sampling can be easily expanded after-the-fact by adding additional samples starting from wherever the previous batch left off in the case list. The co-located sampling also benefits MFM approaches that rely on cross-variogram estimation, such as co-kriging, since the lower-fidelity datasets will contain all the higher-fidelity samples. This overlap can be used to directly quantify the accuracy of the fidelity levels relative to each other.
2.2. OVERFLOW Database Generation
All CFD simulations completed in this study used the NASA OVERFLOW solver. The OVERFLOW code is an overset high-order compressible CFD code often leveraged in the rotorcraft community [26,27]. This study required the generation of CFD datasets for hovering rotors at two fidelity levels: namely, high and low fidelity. The high-fidelity dataset was generated using blade-resolved CFD simulation. To generate the near-body rotor grids, a surface mesh of the blade was initially constructed. In the spanwise direction, the mesh used a spacing of 1% chord length at both the rotor root and tip, with a maximum spacing of 10% along the span and a growth rate of 1.05. Chordwise meshing was refined near the leading and trailing edges using a spacing of 0.01% chord length and a total node count of 532. The resulting blade surface grid consisted of approximately 40,150 nodes. To close the blade surfaces at the root and tip, a series of overset patch grids were implemented. All surface grids in this study were generated using the Chimera Grid Tools (CGT) BladeGen grid automation program [28]. Volume grids were constructed by extruding the surface mesh outward from the blade by 1.5 chord lengths, using 100 grid points with an initial spacing selected to maintain a target y+ of 1 near the wall and a maximum growth rate of 1.1. The complete near-body mesh for the four-blade configuration comprised approximately 26 million nodes.
After constructing the near-body grid system, a series of Cartesian multiblock off-body grids were automatically generated using OVERFLOW. A zoomed-in view of the combined near-body and off-body grid system is shown in Figure 2. In this figure, DeltaS is defined as 20% of the chord length at the 75% radial location of the rotor blade (i.e., DeltaS = 0.20 c75). The rotor near-body grids can be observed at the top of the image, exhibiting an approximate cell aspect ratio of 1:1 at the overset boundary between the rotor grids and the Cartesian background grids. Off-body grid generation employed two refinement regions. The first region used a grid refinement of ΔS/2 and extended 0.2R radially beyond the blade tip, 0.35R above the rotor, and 0.65R below the rotor. The second refinement region used a grid refinement of DeltaS and extended 2R below the rotor. The far field then extends 20 rotor radii from the rotor’s hub, while progressively doubling off-body cell lengths. For the far field, characteristic outflow based on Riemann invariants with freestream imposed on the incoming characteristics was used. In total, 10 million nodes were used to model the off-body grids. For turbulence modeling, the Spalart–Allmaras single-equation turbulence model with rotation corrections was used. In this study, the Euler terms were discretized using central differencing, with sixth-order accuracy applied in the off-body regions and third-order accuracy used in the near-body regions. To save computational cost, rotational source terms were used rather than rotating the overset rotor system.
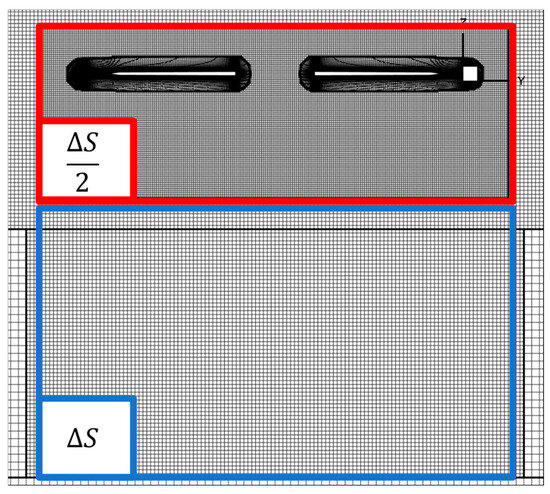
Figure 2.
A Zoomed-in Visual of the Off-Body Grid Refinement (DeltaS = 20% of Chord).
All OVERFLOW simulations were parallelized on the NASA HECC GPU resources using the newly released GPU capable OVERFLOW solver. Benchmarking was conducted on various HECC architectures, including: (1) four NVIDIA V100 GPUs with a 36-core CPU processor; (2) four NVIDIA V100 GPUs with a 48-core CPU processor; (3) four a100 GPUs with a 64-core CPU processor; and (4) ten 28-core processors with no GPUs. An entire simulation could be run on a single GPU node, and the higher availability of GPU nodes on the NASA HECC resulted in a larger throughput. Testing was carried out, which confirmed that the GPU and CPU solutions produced identical results. A total of 200 blade-resolved CFD simulations (the first 200 case list samples) were completed at this fidelity level. An example OVERFLOW blade-resolved CFD simulation is shown in Figure 3. An isolated 4-bladed rotor is shown in hover (the rotor hub geometry is not modeled). The rotor blade-tip vortex wake is observed to propagate and contract beneath the rotor as expected.
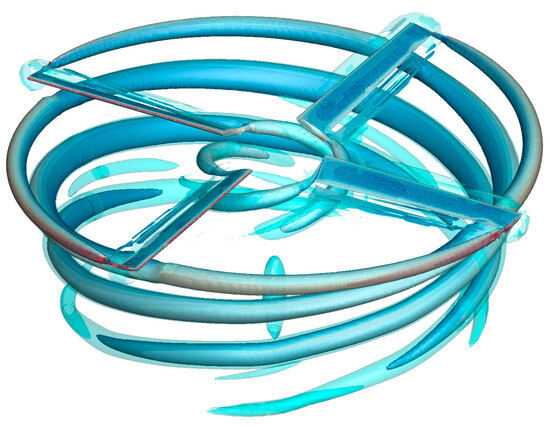
Figure 3.
Blade-Resolved OVERFLOW Simulation of a Hovering Rotor. Graphic shows iso-surfaces of q-criterion contoured by coefficient of pressure.
A refinement study was conducted using a DeltaS of 10% * c75 to verify the grid convergence. Twenty of these higher resolution blade-resolved simulations were run (the first 20 case list samples) to ensure the grid was sufficiently converged throughout the design space. These higher resolution cases, consisting of approximately 88 million grid points, showed an average deviation for FM of only 1.5% from the coarser blade-resolved simulations. As such, a DeltaS of 20% chord was deemed sufficient for this study.
For the lower-fidelity simulations, the recently implemented BET source term-based rotor disk model was used in OVERFLOW. In the current implementation of the OVERFLOW rotor disk model, source terms are applied to the single cell layer where the disk model is defined, and induced velocities are extracted from this same layer. In this study, no tip loss model for the BET solver was used. To compute rotor loads using the BET rotor disk model, a surrogate model of the OVERFLOW Machine Learning Airfoil Performance (PALMO) Database was used [10,11]. This surrogate model was used to populate airfoil performance lookup tables as a function of each simulation’s respective rotor geometry and operating condition. The rotor disk model was implemented with a mesh using 81 nodes aligned with the radial direction, 109 nodes aligned with the thrust axis, and an axisymmetric boundary condition to significantly reduce the computational cost. A spacing of 10% chord length was used near the rotor disk, and a stretching ratio of 1.2 was used as the grid was extended to the far field. In a similar fashion to the BR simulations, a Cartesian multiblock off-body mesh was used with DeltaS of 20% * c75 and the same refinement regions as the BR cases. The generation of this geometry required 1 overset near-body grid and approximately 25 thousand grid points. This represents a reduction in cell count of more than three orders of magnitude compared to the BR simulations.
For all OVERFLOW simulations, second-order temporal discretization was used with a constant global Courant–Friedrichs–Lewy (CFL) value. Simulations used fourth-order central differencing for the Euler terms and Beam–Warming for the viscous terms. The simulation boundary was set at 20 rotor radii for the BR cases and 10 radii for the disk cases, following recommendations found in the literature [29,30]. No central body was used inside the root cut-out region. A total of 1000 of these lower-fidelity hybrid BET-CFD simulations were completed. For the blade-resolved cases, a characteristic outflow condition based on Riemann invariants was applied at the far-field boundary. In the actuator disk simulations, the bottom boundary uses outflow extrapolation, the top and outer radial boundaries apply Riemann-invariant conditions, and the inner radial boundary enforces axial symmetry.
In this study, convergence was assessed by monitoring the power coefficients. For the actuator disk simulations, which were run in a steady state, simulations continued until the variation in power coefficient was less than 0.1%. Given the simplicity of the actuator disk setup, this convergence criterion was relatively easy to meet, and all desired cases achieved convergence. For the blade-resolved simulations, load coefficients were averaged over the final two revolutions of the simulation. Cases were retained only if the power coefficients varied by less than 2% between these two revolutions. Using this convergence criterion, 96.5% of the blade-resolved cases were retained.
This study focuses on deriving meaningful and generalizable surrogate models from CFD simulation data. In developing such a surrogate model from high-fidelity overset curvilinear CFD simulation data, two key challenges arise:
- (1)
- Efficient automatic generation of parametrically defined high-quality overset curvilinear grids. Generating CFD databases of hundreds to thousands of simulations necessitates significant automated processes for grid generation. NASA’s Chimera Grid Tools (CGT) code, a curvilinear grid generation tool, was used to create all the necessary grids for CFD simulations in this study. The CGT code is commonly employed for generating the grids of pylons, fuselages, and rotors for simulations in OVERFLOW. This study used the recently implemented BladeGen program to create high-quality overset rotor grids. BladeGen is an internal NASA grid generation tool designed to automatically create high-quality grids for wings and rotor blades [28]. Although BladeGen is not currently available for public release, it will be included in the upcoming CGT 2.3 release.
- (2)
- Deriving meaningful data-driven surrogate models is predicated upon a sufficiently large number of CFD simulations. The database in this study comprises 200 high-fidelity BR OVERFLOW simulations. Traditionally, completing so many three-dimensional high-fidelity simulations would be infeasible within a single study. However, the recently described developments in OVERFLOW that enable it to run on GPUs, combined with NASA HECC’s investment in GPU hardware, made it possible to efficiently complete all parametrized simulations. Despite each BR simulation requiring tens of millions of cells and thousands of iterations, the use of GPUs allowed each simulation to be completed in roughly one hour. By leveraging up to 132 NVIDIA V100 GPUs simultaneously, this study completed the 220 higher-fidelity BR simulations and the 1000 lower-fidelity BET-CFD axisymmetric simulations in just a few days, thereby generating an extensive, multi-fidelity CFD database for the development of surrogate modeling best practices, particularly MFM.
2.3. Multi-Fidelity Modeling
In most applied engineering scenarios, the amount of high-fidelity data is still limited due to computational cost or the physical cost of experimentation, which often prohibits robust surrogate model fitting. On the other hand, lower-fidelity data can be obtained in larger quantities but with associated higher levels of uncertainty. MFM addresses these issues by leveraging the computational efficiency of low-fidelity data generation to learn trends, allowing for a large enough dataset to provide meaningful inference, while increasing the accuracy of the predictions through select, high-fidelity data anchoring points.
First, a visualization and statistical characterization of the generated data is completed to assess the quality of the database, particularly in terms of its efficacy for MFM. Next, surrogate modeling techniques are applied to the data with an emphasis on Gaussian Process Regression (GPR), which is briefly accounted for below. For a regression problem with response variable , explanatory variables , and additive Gaussian noise consider the forward model . Formulated in a Bayesian framework, the prior distribution over is taken as a Gaussian process with associated mean function and covariance kernel , such that . Given a new evaluation point , the posterior predictive distribution is also a Gaussian, with a closed-form expression for its mean and covariance that allows for straightforward sampling. GPR is a popular choice for small to mid-sized data set surrogate modeling, owing to its ability to capture non-linear features, ease of implementation, and probabilistic representation, which allows for intrinsic uncertainty quantification of the model predictions. It also naturally extends to a multivariate formulation, allowing the correlation of multiple input variables to enhance predictions, as exploited with co-kriging approaches.
This study demonstrates MFM for the hovering rotor database using the seminal linear autoregressive model by Kennedy and O’Hagan [31] with Kriging building blocks. Considering two levels of fidelity, with priors denoted by and for high and low fidelity, respectively, the linear relationship between fidelities is formulated as
In Equation (1), is a scaling constant and is an additive correction term, which is modeled as an independent Gaussian process throughout this study. In many applications, however, the assumption of linearity is too restrictive for the dataset at hand. To overcome this constraint, a non-linear generalization by Perdikaris [32], as implemented in the open-source Python package Emukit [33], was also considered for this study. The linear scaling factor is replaced with a non-deterministic function such that
where a GP prior is also assigned to . The choice of kernel for is a composite kernel, as detailed in Ref. [32]. For tractability, Equations (1) and (2) can be decoupled by substituting the prior distribution with the posterior predictive , meaning that the GPRs can be sequentially solved for instead of sampling from the much more complex joint posterior distribution. To quantify potential improvements in accuracy and reductions in cost achieved with MFM, the results are compared to ordinary GPRs derived exclusively from high-fidelity data.
3. Results
3.1. Aerodynamic Database Size and Computational Cost
A total of 1220 OVERFLOW CFD simulations consisting of 1000 disk, 200 BR Coarse, and 20 BR Fine (each marching down from the top of the 10,000 case list samples generated using the GreedyFP algorithm) were completed to support this study. All 20 of the BR Fine conditions were also included in the other two datasets, and all 200 of the BR Coarse conditions were also run as part of the disk simulations. Due to the nature of the GreedyFP algorithm, the 20 BR Fine points are the 20 most space-filling points from the initial 10,000, then the 200 BR Coarse data add additional samples, and finally the 1000 disk samples continue to fill the space according to the algorithm beyond the first 200. The first 20 samples were generated using all three fidelity levels, and the first 200 were generated using both the BR Coarse and disk approaches. The simulations spanned the range of rotor design features and operating conditions reported in Table 1 and Table 2. The specifics of the CFD simulation database are reported in Table 3. Select flow visualizations from BR sample numbers 1, 25, 50, and 100 are depicted in Figure 4. The varied wake geometry highlights the large case-to-case differences in both rotor geometry and operating condition throughout the database.
Table 3.
OVERFLOW CFD Models of the Isolated Rotor Hover Database.
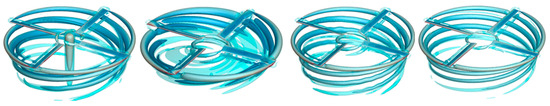
Figure 4.
Blade-Resolved OVERFLOW Simulation of Case List Samples 1, 25, 50, and 100. Graphic shows iso-surfaces of q-criterion contoured by coefficient of pressure.
Simulation results are displayed in Figure 5 for fundamental rotor performance metrics including thrust coefficient, ; torque coefficient, ; and Figure of Merit, and . The BR Coarse and Fine simulations produced nearly identical results, but the disk cases exhibit a much wider deviation from the BR cases. Although some of the BR results have suspiciously low FM, this was expected as some of the rotor designs and operating conditions are such that they would result in low FM, e.g., thick airfoils, low collective, or rotor stall. The disk cases have a much wider spread and the PALMO-derived airfoil tables used in the disk model were found to over-predict profile drag for large airfoil thickness (24% t/c) and underpredict at very small thickness (6% t/c). This larger spread of the data and higher apparent uncertainty created a better test case for this investigation of multi-fidelity modeling. If the MFM is found to outperform a surrogate model trained on the blade-resolved data alone, then using even more accurate low-fidelity data would further improve the comparisons. The other interpretation is that very low-fidelity data can be used provided that the data are corrected by high-fidelity data in the MFM.
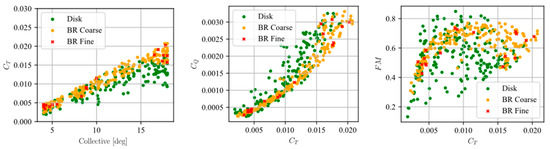
Figure 5.
Multi-fidelity Comparison of OVERFLOW Simulation Output.
Plots comparing the accuracy of the OVERFLOW output at both fidelity levels to the highest resolution BR cases are included in Figure 6. As described earlier, the BR Coarse and Fine models gave almost indistinguishable results for both thrust and torque coefficients. Slight discrepancies can be discerned when observing the FM comparisons. Larger discrepancies are observed when comparing the disk model simulations to the BR Fine data, however. The disk model is found to underpredict both thrust and torque coefficients at their higher values. The discrepancies are again amplified when viewing the FM comparison plot. These comparisons are only reported for a small subset of the data where all three simulation models had been run for identical cases, namely, the first 20 samples in the case list since only 20 BR Fine cases were run.
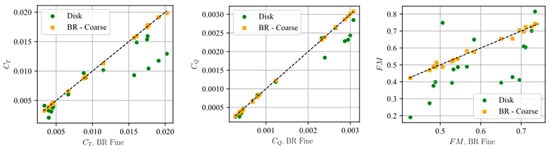
Figure 6.
OVERFLOW Predictive Accuracy of Varying Model Fidelity (Disk and BR Coarse vs. BR Fine).
The apparent lower accuracy of the low-fidelity disk modeled cases was considered valuable for this study of MFM methodologies. Given the computational efficiency of the axisymmetric disk modeled cases, simulations can be run to cover a massive design space, and the multi-fidelity surrogate is then tasked with learning the high-fidelity correction of the data. Such a correction is likely only viable if the lower-fidelity data has a structured, deterministic bias and follows coherent trends. While there is an apparent ‘randomness’ of the error in Figure 6, this is partially due to co-plotting the error of the 8-input feature space along a single axis. This study uses test statistics on the hold-out data to indicate whether a multi-fidelity model has learned a meaningful correction towards the high-fidelity “truth” data.
3.2. Data Statistics and Analysis
To better quantify the discrepancies between the two fidelity levels, histograms of the delta between blade-resolved (high-fidelity) and actuator disk simulations (low-fidelity) were created, as shown in Figure 7. The plots show that the thrust coefficient, torque coefficient, and FM are all under-predicted with the disk model. The mean absolute percentage error (MAPE) is also reported for each metric, with both the thrust coefficient and FM having MAPE around 18.2% and the torque MAPE standing at approximately 11.6%. This result appears well suited for MFM if the model can learn to correct the observed bias of the disk vs. BR simulations.
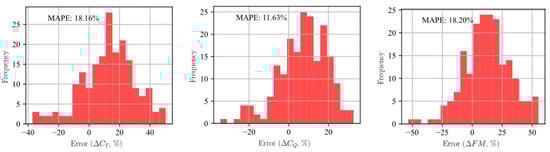
Figure 7.
Distribution of Differences Between OVERFLOW Axisymmerror = (Blade-Resolved − Disk)/Blade-Resolved.
The surrogate models are tasked with learning the forward mapping from the variable rotor blade design features, as tabulated in Table 1, to the target rotor performance metrics (thrust and torque). Inevitably, the sensitivity of the targets to perturbations in each separate feature differs, meaning that certain input variables will have more explanatory value toward the aerodynamic performance metrics. This tendency is illustrated in Figure 8, where the mutual information (MI) between Actuator Disk(Low-fidelity) and BR Coarse (High-fidelity) Predictions, E thrust, and each of the rotor simulation input features are presented. Originating from the field of information theory, MI is a measure of mutual variable dependence, with the appealing feature of not being confined to linear correlations. The metric is symmetrically quantifying how knowledge of one variable reduces uncertainty about the other; an MI score of zero implies total independence, and increasing scores indicate larger co-dependence. It is noted, however, that MI is not model-based, and thus does not necessarily imply predictive capabilities. As expected, Figure 8 shows how the collective dominates the shared information statistics for thrust.
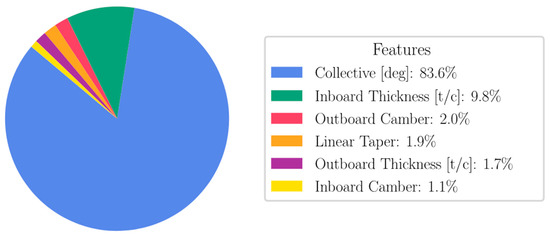
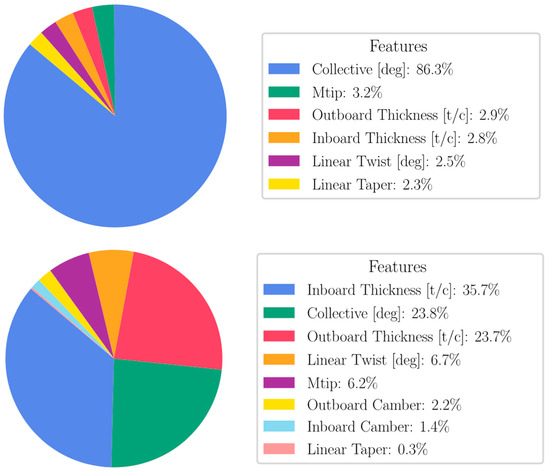
Figure 8.
Mutual Information Between , Figure of Merit, and Rotor Design Features.
Dominance of a given feature risks overfitting models to that specific variable, losing generalizability and overshadowing important but more granular relationships with other features. This may pose a particular problem when employing the surrogates to aid rotor design optimization, as dependence on the actual rotor blade planform and airfoil shape is lost in favor of the collective pitch angle in predicting the rotor performance of the design candidate. To weaken the inherent dependency of thrust on collective angle, results from blade element theory are utilized to engineer an augmented target. For a constant chord and linear twist, blade element theory (BET) gives the non-linear relationship between the collective, , and thrust through Equation (3) [34]:
Solving for gives thrust coefficient as predicted by BET, denoted here by . The new, augmented target is the delta between simulated thrust in CFD and the blade element predictions and is plotted against the collective in Figure 9 for both actuator disk and BR simulations. The augmented target, which is the difference between the CFD and analytic BET thrust coefficients, is observed to increase with an increasing collective. This is because the BET approach assumes a constant lift curve slope and does not include any stall-related effects at a high rotor collective and thrust coefficient.
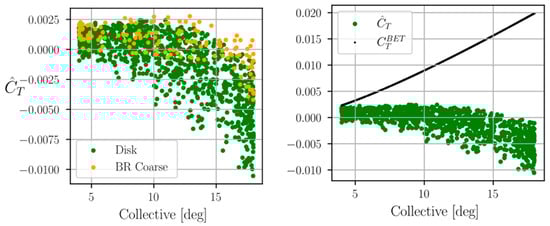
Figure 9.
(Left) Thrust Delta from Blade Element Theory, . (Right) Demonstration of de-correlation of augmented thrust coefficient from collective.
The MIs for the augmented thrust target are contrasted against the raw thrust results in Figure 10 for the three features with the largest mutual dependence, showing the successful disentanglement through the decrease in collective and increase in the airfoil thickness dependencies, respectively. This results in a dataset more likely to produce a high-performing surrogate model.
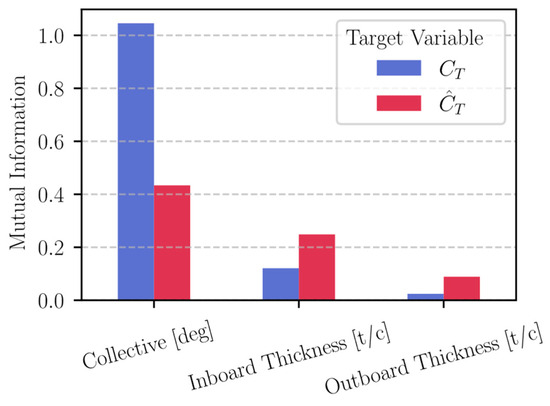
Figure 10.
Contrasting Mutual Information Between Original and Augmented Thrust Coefficient .
To build surrogate models and benchmark the MFMs against single-fidelity GPR models, the database is split into a training and a test dataset. Staying with the GreedyFP case list, the last 20% of the high-fidelity BR samples were held out as a test set. This meant that up to a maximum of 160 high-fidelity cases could be used as training data, and 40 BR cases were withheld for testing the models. Figure 11 shows comparisons of the test and training data distributions throughout the input feature space. The leftmost plot shows the first two principal components (PCs) of the training and test data features. The test data spreads well within the boundaries of the components and does not exhibit significant clustering, which is a first-order indication of a successfully representative test data distribution. The middle and right plots show kernel density estimates (KDEs) for the thrust and torque coefficients, showing the comparable characteristic and coverage between the training and test dataset. This verifies that the test data hold-out is representative of model predictive accuracy on unseen data, i.e., applicable throughout the entire domain.
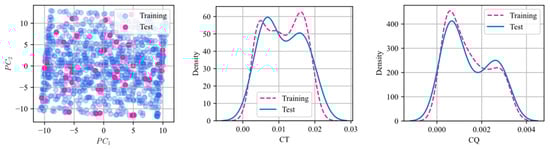
Figure 11.
Training vs. Test Data Principal Components 1–2 (Left). Thrust and Torque Coefficient KDE’s (Middle, Right).
3.3. Multi-Fidelity Modeling
Surrogate models were first generated for the high-fidelity dataset alone to create a baseline for comparison with the MFM models. All the training data were standardized through pre-processing. Unless stated otherwise, a Radial Basis Function kernel was adopted, and kernel hyperparameters were determined by maximizing the marginal log-likelihood of the simulated outputs given the inputs. A GPR model was implemented and is referred to as “High-fidelity GPR” for the remainder of the paper. Both the linear and non-linear co-kriging approaches were used to compare with the baseline, using all the available high- and low-fidelity data. These are referred to as “Linear MFM” and “Non-linear MFM” for the rest of the discussion. The parity plots in Figure 12 show the predictive accuracy of the three surrogate model implementations to predict the held-out high-fidelity BR data. In addition to showing good predictive capability with the surrogates, these figures give an indication that the differences in the approaches are not very large when including all high-fidelity data. This observation highlights the capabilities of ordinary GPR models when sufficiently large training data sets are available. The results for MAPE in Table 4, however, clearly indicate that the Non-linear MFM has the best predictive accuracy on the held-out test data across the target coefficients. For linear autoregressive models, erroneous trends in the low-fidelity dataset (the actuator disk simulations) will usually involve the high-fidelity data dominating the predictions and may explain the similar prediction accuracy to the High-fidelity GPR. Modeling a non-linear correlation between fidelities can protect against this to a greater extent while still extracting useful trends, implying greater data efficiency and final generalizability, as indicated in Table 4. Following the approach for target engineering the thrust by subtracting the analytical BET, the accuracy on the test set is increased by 0.5% on average across the board, which for the thrust gives a final 2.51% mean absolute percentage error using the non-linear MFM.
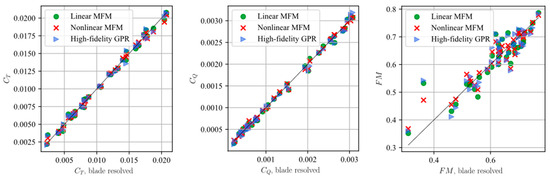
Figure 12.
Surrogate Model Predictions on the High-fidelity Test Data Hold-out.
Table 4.
Model Predictive Accuracy, Mean Absolute Percent Error.
Nonetheless, the benefit as suggested here is potentially not great enough to warrant all the extra effort of MFM. To better understand the MFM accuracy improvement together with the computational cost reduction, a set of surrogate models was created sweeping the number of High-fidelity GPR cases included in the training dataset. The same test data hold-out was retained as before, but the number of high-fidelity BR cases used to create the High-fidelity GPR and the MFM models was incrementally increased. Figure 13 shows the results of this study, with the MFM clearly outperforming the single-fidelity model for most of the conditions. It is particularly important to note that the MFM using just a small fraction of the high-fidelity training data is nearly as accurate as the single-fidelity model using all available training data. This implies similar predictive accuracy with huge computational cost savings. Notably, the MFM rapidly converges to final predictive accuracy early, while the single-fidelity model requires a much larger amount of the high-fidelity training data before the predictive model accuracy plateaus. MFM models using just 20% of the high-fidelity data are observed to have accuracy on par with the High-fidelity GPR using 80% (all the training data) of the BR simulations.
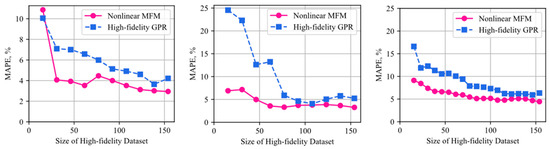
Figure 13.
Prediction Accuracy vs. Amount of High-fidelity Training Data for (Left) Thrust Coefficient, (Middle) Torque Coefficient, and (Right) Figure of Merit.
4. Discussion and Conclusions
This study aimed to create a methodology for the creation of a generalized hovering rotor surrogate model. The GreedyFP space-filling algorithm was used to sample the 8-input feature design space. A total of 200 high-fidelity blade-resolved simulations and 1000 lower-fidelity actuator disk simulations were run in OVERFLOW on the NASA High-End Compute Capability systems. These simulations covered rotor blade design and operating condition perturbations generated using the GreedyFP space-filling algorithm. Post-processing of the data validated the hold-out methodology and quantified the accuracy of the various CFD fidelity levels to one another. Grid refinement studies were used to verify the simulation setup.
Mixed-fidelity surrogate models were created to assess the accuracy versus computational cost of various database generation strategies. Non-linear MFMs were found to be the best performing model. For these cases, both rotor thrust and torque coefficients were predicted within 3%. The MFM also outperformed the direct GPR by a factor of four for low quantities of the higher-fidelity data. The MFM model with 25% of the available high-fidelity training data was found to have comparable accuracy to the GPR model using all available high-fidelity training data. This represents a fourfold computational cost savings in the database generation step, which may enable the use of high-fidelity data in surrogate model generation for those with limited computational resources.
This study has made novel contributions to the development of aerodynamic database generation for surrogate modeling. The main conclusion is that large parameter spaces can be represented with extremely inexpensive data and corrected with a small amount of high-fidelity data, which opens the door for applications requiring a higher number of input features. Novel methods using adjusted training targets for thrust and torque coefficient were found to increase the accuracy of the final predictions on true thrust and torque coefficients. Finally, a multi-fidelity model using one fourth of the available high-fidelity data had accuracy on par with a model using all the available high-fidelity model alone.
Future Work: For future follow-up studies, efforts must be made to improve the fidelity of the high-fidelity blade-resolved CFD simulations. One clear area for improvement is to move away from the URANS model and in favor of DES/DDES simulation. Due to an unbounded growth of turbulent eddy viscosity, previous studies have demonstrated URANS struggles to obtain high-fidelity (within 1%) predictions for hovering rotor FM. However, these same studies have demonstrated that DDES blade-resolved simulations can, in some cases, obtain predictions well within 1% of experimental measurements. Furthermore, future blade-resolved modeling efforts should include a rotor hub to reduce recirculation effects at the rotor root cut-out and use rotor source/sink far-field conditions more typically used for hovering rotor performance predictions. Future work should also investigate the feasibility of implementing alternative reasonably low-fidelity rotorcraft modeling approaches, with the objective of identifying areas for further cost reduction. Additional work is also underway in novel implementations of the multi-fidelity surrogate models. Continued work also aims to increase the dimensionality of the problem and explore modeling options to mitigate the curse of dimensionality for such use cases.
Author Contributions
Conceptualization, methodology, software, and validation, N.P., T.Å. and J.C.; formal analysis, T.Å. and H.H.; investigation, N.P., T.Å., H.H. and J.C. (all); data curation, N.P.; writing—original draft preparation, J.C.; writing—review and editing, all; supervision, project administration, funding acquisition, J.C. All authors have read and agreed to the published version of the manuscript.
Funding
This research was funded by the NASA Ames Research Center’s Center Innovation Fund.
Data Availability Statement
The data created through this study are not currently publicly available; however, the group’s PALMO database is embedded in the publicly available NASA/TM—20240014546 [10].
Acknowledgments
The authors would like to thank the NASA Ames Research Center’s Center Innovation Fund for their support in funding the work for this project. Additionally, many thanks are owed to the NASA High-End Compute Capability for their assistance and support in leveraging the NASA supercomputer and GPU nodes for this study. The authors also thank Sesi Kottapalli, Wayne Johnson, Allen Ruan, and Carl Russell for their thoughtful comments and feedback on this study.
Conflicts of Interest
The authors declare no conflicts of interest.
Nomenclature and Abbreviations
The following nomenclature and abbreviation are used in this manuscript:
| c75 | Chord at 75% r/R |
| FM | |
| R | Rotor Radius (m) |
| r | Rotor Radial Location (from axis of rotation) (m) |
| r/R | Non-dimensional Rotor Radial Location (%) |
| AASM | Applied Aerodynamics Surrogate Modeling (AIAA Discussion Group) |
| ARL | Army Research Laboratory |
| BET | Blade Element Theory |
| BR | Blade-Resolved |
| CFD | Computational Fluid Dynamics |
| GPU | Graphical Processing Unit |
| HECC | High-End Compute Capability |
| KDE | Kernel Density Estimates |
| MAE | Mean Absolute Error |
| MAPE | Mean Absolute Percent Error |
| MFM | Multi-Fidelity Modeling |
| MI | Mutual Information |
| PC | Principal Components |
| PMAE | Percent Mean Absolute Error |
| VTOL | Vertical Take-Off and Landing |
References
- Li, J.; Du, X.; Martins, J. Machine Learning in Aerodynamic Shape Optimization. Prog. Aerosp. Sci. 2022, 134, 100849. [Google Scholar] [CrossRef]
- Yeh, S.; Du, X. Optimal Tilt-Wing eVTOL Takeoff Trajectory Prediction Using Regression Generative Adversarial Networks. Mathematics 2023, 12, 26. [Google Scholar] [CrossRef]
- Paternostro, N.; Marepally, K.; Anand, A.; Lee, B.; Baeder, J. Application of CFD-Trained Neural Networks on the Rotorcraft Airfoil Design Process. In Proceedings of the VFS Autonomous VTOL Technical Meeting, Mesa, AZ, USA, 24–26 January 2023. [Google Scholar]
- Shalul, H.; Govindarajanl, B.; Sridharan, A.; Singh, R. Blade Shape Optimization of Rotors Using Neural Networks. In Proceedings of the 79th Annual Forum of the Vertical Flight Society, West Palm Beach, FL, USA, 16–18 May 2023. [Google Scholar] [CrossRef]
- Sella, V.; O’Leary-Roseberry, T.; Du, X.; Guo, M.; Martins, J.; Ghattas, O.; Willcox, K.; Chaudhuri, A. Improving Neural Network Efficiency with Multi-Fidelity and Dimensionality Reduction Techniques. In Proceedings of the AIAA SciTech Forum, Orlando, FL, USA, 6–10 January 2025; pp. 2025–2807. [Google Scholar] [CrossRef]
- Cornelius, J.; Schmitz, S. Coaxial Rotor CFD Validation and ML Surrogate Model Generation. In Proceedings of the VFS Aeromechanics Specialists’ Conference, Santa Clara, CA, USA, 6–8 February 2024; Available online: https://rotorcraft.arc.nasa.gov/Publications/files/1686_Cornelius_Final_012324.pdf (accessed on 1 May 2025).
- Bekemeyer, P.; Hariharan, N.; Wissink, A.; Cornelius, J. Introduction of Applied Aerodynamics Surrogate Modeling Benchmark Cases. In Proceedings of the AIAA SciTech Forum, Orlando, FL, USA, 6–10 January 2025. [Google Scholar] [CrossRef]
- Cornelius, J. PALMO: An OVERFLOW Machine Learning Airfoil Performance Database, version 1.0; NACA 4-Series. NASA/TM—20240014546; National Aeronautics and Space Administration: Washington, DC, USA, 2024. Available online: https://rotorcraft.arc.nasa.gov/Publications/files/NASA_TM_PALMO_12-3-2024_R2.pdf (accessed on 1 May 2025).
- Cornelius, J.; Peters, N.; Aagren, T.; Lugo, D. PALMO: An OVERFLOW Machine Learning Airfoil Performance Database. In Proceedings of the AIAA SciTech Forum, Orlando, FL, USA, 6–10 January 2025. [Google Scholar] [CrossRef]
- Peters, N.; Shirazi, D. On the Application of an Actuator Line Model for Rotorcraft Outwash Predictions. In Proceedings of the AIAA SciTech Forum, Orlando, FL, USA, 6–10 January 2025. [Google Scholar] [CrossRef]
- Wissink, A.; Tran, S.; Lim, J. An Assessment of XV-15 Tiltrotor Hover Download Predictions. In Proceedings of the VFS Aeromechanics for Advanced Vertical Flight Technical Meeting, San Jose, CA, USA, 25–27 January 2022. [Google Scholar]
- Komerath, N.; Smith, M.; Tung, C. A Review of Rotor Wake Physics and Modeling. J. Am. Helicopter Soc. 2011, 56, 22006. [Google Scholar] [CrossRef]
- Wilke, G. Variable-Fidelity Methodology for the Aerodynamic Optimization of Helicopter Rotors. AIAA J. 2019, 57, 3145–3158. [Google Scholar] [CrossRef]
- Bailly, J.; Didier, B. Multifidelity Aerodynamic Optimization of a Helicopter Rotor Blade. AIAA J. 2019, 57, 3132–3144. [Google Scholar] [CrossRef]
- Mikić, G.; Bain, J.; Bevirt, J.; Stoll, A. A CFD Based Method to Model Aerodynamic Interactions in Complex eVTOL Configurations for Realtime and Medium Fidelity Simulation. In Proceedings of the 77th Annual Forum of the Vertical Flight Society, Virtual Event, USA, 10–14 May 2021; Available online: https://www.semanticscholar.org/paper/A-CFD-Based-Method-to-Model-Aerodynamic-in-Complex-Mikic-Bain/b8da665e47cb89d969366ffcfe7262c93b16cbec (accessed on 1 May 2025).
- Anusonti-Inthra, P. Data-Driven Modeling of Aerodynamic Loadings for Tiltrotor Pylon using Multi-Fidelity CFD Data. In Proceedings of the AIAA SciTech Forum, National Harbor, MD, USA, 23–27 January 2023. [Google Scholar] [CrossRef]
- Peherstorfer, B.; Willcox, K.; Gunzurger, M. Survey of Multifidelity Methods in Uncertainty Propagation, Inference, and Optimization. SIAM Rev. 2018, 60, 550–591. [Google Scholar] [CrossRef]
- Fernandez-Godino, M.G. Review of Multi-fidelity Models. Adv. Comput. Sci. Eng. 2023, 1, 351–400. [Google Scholar] [CrossRef]
- Kilic, D.; Nikbay, M. A Comparative Study on Multi-Fidelity Machine Learning Modeling for Aerospace Problems. In Proceedings of the AIAA SciTech Forum, Orlando, FL, USA, 6–10 January 2025. [Google Scholar] [CrossRef]
- Anand, A.; Safdar, M.; Marepally, K.; Baeder, J. Multi-Fidelity Artificial Neural Networks for Rotorcraft Airfoil Design. In Proceedings of the 50th European Rotorcraft Forum, Marseille, France, 10–12 September 2024; Available online: https://www.researchgate.net/publication/384227622 (accessed on 1 May 2025).
- Healy, R.; Beals, N.; Anusonti-Inthra, P. Multi-Fidelity Training Data Generation for the Development of DeepAirfoil, an Airfoil Design and Analysis Tool. In Proceedings of the AIAA Aviation Forum, Las Vegas, NV, USA, 29 July–2 August 2024. [Google Scholar] [CrossRef]
- Walizer, L.; Haehnel, R.; Allen, L. Application of Multi-Fidelity Methods to Rotorcraft Performance Assessment. In Proceedings of the AIAA Scitech Forum, Orlando, FL, USA, 8–12 January 2024. [Google Scholar] [CrossRef]
- Anusonti-Intrha, P.; Healy, R. Development of Multi-fidelity Surrogate Models for Rotor Performance Prediction. In Proceedings of the AIAA SciTech Forum, Orlando, FL, USA, 6–10 January 2025. [Google Scholar] [CrossRef]
- Wissink, A.; Liu, M.; House, A.; Kaminsky, A.; Simin, A.; Ranjan, R. Multi-fidelity Surrogate Modeling for Aerodynamics Using Sage. In Proceedings of the AIAA SciTech Forum, Orlando, FL, USA, 6–10 January 2025. [Google Scholar] [CrossRef]
- Kamath, C. Intelligent Sampling for Surrogate Modeling, Hyperparamter Optimization, and Data Analysis. Mach. Learn. Appl. 2022, 9, 100373. [Google Scholar] [CrossRef]
- Caprace, D.; Diaz, P.; Yoon, S. Simulation of the rotorwash induced by a quadrotor urban air taxi in ground effect. In Proceedings of the Vertical Flight Society’s 79th Annual Forum and Technology Display, West Palm Beach, FL, USA, 16–18 May 2023. [Google Scholar]
- Peters, N.; Silva, C.; Ekaterinaris, J. A Data-Driven Reduced Order Model for Rotor Optimization. Wind. Energy Sci. 2023, 8, 1201–1223. [Google Scholar] [CrossRef]
- Peters, N.; Pereyra, C. RotorGen: A ‘high-level’ Structured Grid Generation Program for High-Fidelity Rotor CFD Simulation. In Proceedings of the AIAA Overset Grid Symposium, Dayton, OH, USA, 7–10 October 2024. [Google Scholar]
- Ahmad, J. NASA/TM—20220005496; Application of Rotor Disk Model in the OVERFLOW CFD Code; NASA: Washington, DC, USA, 2022.
- Chaderjian, N. A Quantitative Approach for the Accurate CFD Simulation of Hover in Turbulent Flow. J. Am. Helicopter Soc. 2023, 68, 42009–42028. [Google Scholar] [CrossRef]
- Kennedy, M.; O’Hagan, A. Predicting the output from a complex computer code when fast approximations are available. Biometrika 2000, 87, 1–13. [Google Scholar] [CrossRef]
- Perdikaris, P.; Raissi, M.; Damianou, A.; Lawrence, N.D.; Karniadakis, G.E. Nonlinear information fusion algorithms for data-efficient multi-fidelity modelling. Proc. R. Soc. A Math. Phys. Eng. Sci. 2017, 473, 20160751. [Google Scholar]
- Paleyes, A.; Pullin, M.; Mahsereci, M.; Lawrence, N.; Gonzalez, J. Emulation of Physical Processes with Emukit. In Proceedings of the 2nd Workshop on Machine Learning and the Physical Science, Vancouver, BC, Canada, 8–14 December 2019. [Google Scholar] [CrossRef]
- Johnson, W. Rotorcraft Aeromechanics; Cambridge University Press: Cambridge, UK, 2013; Volume 36. [Google Scholar] [CrossRef]
Disclaimer/Publisher’s Note: The statements, opinions and data contained in all publications are solely those of the individual author(s) and contributor(s) and not of MDPI and/or the editor(s). MDPI and/or the editor(s) disclaim responsibility for any injury to people or property resulting from any ideas, methods, instructions or products referred to in the content. |
© 2025 by the authors. Licensee MDPI, Basel, Switzerland. This article is an open access article distributed under the terms and conditions of the Creative Commons Attribution (CC BY) license (https://creativecommons.org/licenses/by/4.0/).