Abstract
The exhaust duct of aero-engine exhibits complex vibration response characteristics under the influence of temperature fields and vibration loads. Taking the non-axisymmetric exhaust duct of turboshaft engine as the object of study, a finite element model of the exhaust duct was established using three-dimensional finite element analysis methods to analyze the thermal modal and random vibration response characteristics under axial loading for large thin-walled non-axisymmetric exhaust ducts. The simulation analysis method was validated through thermal vibration experiments on the scaled model. In a thermal environment, the shape of the power spectral density curves for displacement and stress of the exhaust duct remains largely unchanged in the low-frequency range; however, the response frequencies exhibit a significant forward shift. When subjected to Y-axial loading, the amplitude of the X- and Z-direction displacement response at 1st order (12.96 Hz) and the stress response at 6th order (30.92 Hz) significantly increase. Random vibration loads excite multiple modes of the exhaust duct, with lower-order modes being more easily stimulated. When subjected to X- and Z-axial loading, 1st order (12.96 Hz) has the greatest impact on the X- and Z-direction displacement responses, while 2nd order (16.93 Hz) and 13th order (82.79 Hz) frequencies have the greatest impact on the displacement response in the Y-direction and equivalent stress response. When subjected to Y-axial loading, the 5th order (22.35 Hz) and 12th order (81.69 Hz) modes have the most significant effects on the displacement responses in the X, Y, and Z directions and equivalent stress responses. Attention to these orders is essential during the design process, along with implementing certain stiffness reinforcement measures to reduce response amplitudes.
1. Introduction
In aerospace design, thin-walled shell structures are commonly used to reduce weight, particularly in components such as inlets, ducts, and combustion chambers of aircraft engines; fan casings and exhaust nozzles of supersonic aircraft; and skin panels, thermal protection plates, and radar covers of spaceplanes. These thin-walled shell structures, subjected to high temperatures and high-speed airflow, endure thermal loads and vibration loads, displaying complex vibration response characteristics under the influence of temperature fields and vibration loads. The coupling effects of various external loads greatly impact their structural safety and reliability. Since a series of flight accidents caused by the failure and fracture of thin-walled structures in aero-engines occurred internationally in the mid-20th century, experts and scholars have begun to attach great importance to the analysis of the vibration characteristics of metal thin-walled structures in the working environment of aero-engines. Turboshaft engines employed in heavy helicopters exhibit outer dimensions of the non-axisymmetric exhaust duct that exceed 1 m in length, width, and height, with a wall thickness of approximately 1 mm. This configuration highlights significant structural vibration design challenges.
In the field of aerospace engineering, researchers both domestically and internationally have investigated the random vibration responses of thin-walled structural components within thermal environments. Crandall et al. [1,2,3] analyzed and experimentally validated the vibration responses of rectangular plates, triangular plates, circular plates, and cylindrical shells under random excitation with simply supported boundary conditions. The results indicated that the spatial distribution patterns of random responses tend to become simpler as the number of response modes increases. White [4] and Dhainaut [5] et al. conducted extensive sound excitation random vibration tests on thin-walled structures, demonstrating that high sound pressure-level random noise loads can induce structural resonance, leading to crack formation. They performed numerical calculations of the vibration responses of thin-walled plates using large deflection theory, and by integrating experimental results with numerical analyses, they confirmed the feasibility of this approach for analyzing the vibration responses of thin-walled structures. Vaicaitis et al. [6] studied and analyzed the nonlinear vibration responses of thin-walled plates and thin-walled shell structures under thermos-acoustic loads based on the Galerkin method and Monte Carlo method, proposing response patterns of these structures under simultaneous thermal and acoustic vibration loads. Whitney et al. [7] investigated the vibration characteristics of symmetric and asymmetric composite thin plates under different temperature conditions, revealing that their vibration characteristics are significantly affected by temperature. Przekop et al. [8] combined finite element methods and boundary element methods to study the vibration response of composite thin plates under thermal vibration environments with boundary conditions other than cantilever supports. Their study found that as environmental temperature increases, their natural frequencies decrease while the amplitudes of vibration responses rise, although experimental validation was not provided.
Zhang et al. [9] developed a finite element model of thin-walled cylindrical shell structures, including aircraft engine combustion chambers. They examined the correlation between the nodes of the finite element model and the arrangement of experimental measurement points, subsequently optimizing the positioning of these measurement points based on modal shape testing. Brown [10] performed a theoretical analysis and numerical calculations to determine the natural frequencies and modes of the X-34 FASTRAC composite rocket nozzle in high-temperature environments. Romuald [11] performed calculations on the vibration responses of the EJ200 turbofan engine using a three-dimensional shell element full model and compared the results with the findings from bench tests. Spivey [12] conducted thermal modal testing research on the X-37 wing structure, analyzing how the modal frequencies of the structure change with temperature; however, due to the influence of sensor sensitivity variations with temperature, he was unable to obtain the thermal modal shapes of the structure. Sha et al. [13,14] conducted extensive research on the thin-walled aerospace structures in thermal environments, exploring the calculation and analysis methods for the vibration responses of thin-walled plates and shells subjected to wide-band random vibration loads. They discussed the displacement and stress response characteristics of thin-walled plates, cylindrical shells, and flame tubes under high-temperature random loads, conducted high-temperature random vibration tests, analyzed the variations in structural random vibration responses at different environmental temperatures, and used probabilistic density methods and power spectral density methods to analyze the responses and estimate the fatigue failure times of thin-walled structures under high-temperature random vibrations. Jie et al. [15] developed a high-temperature vibration fatigue experimental system to study the random vibration fatigue characteristics of cantilever thin plate structures in thermal vibration environments. The experimental results indicated that the modal frequencies of the structures shift toward lower frequency ranges under thermal loads, and increases in stress and temperature significantly reduce the fatigue life of the structures.
The structural layout form of the output from the transmission shaft represents a significant category in turbo-shaft engines, utilized in various operational and research platforms. This design is also utilized in heavy helicopter platforms, such as the Mi-26 heavy helicopter, which employs the D-136 turbo-shaft engine featuring an elbow-type non-axisymmetric exhaust duct. In turboshaft engines with dynamic rear output, the asymmetric design of the power shaft, which passes through the exhaust duct and deflects to one side, results in a highly irregular exhaust duct profile. Additionally, the use of thin-walled sheet metal components in these structures contributes to their large dimensions, thin walls, and low rigidity. During engine assembly experiments or random flights, the exhaust duct operates in high-temperature environments and under complex vibration loads, leading to frequent vibration fatigue failures that negatively impact the overall safety and reliability of the engine. Furthermore, excessive vibrations can degrade the aerodynamic performance of the exhaust duct, while strong vibrations may be transmitted to the aircraft, thereby affecting flight safety.
Currently, research on the random vibration analysis of exhaust ducts in thermal environments is limited, and systematic analyses are scarce. Therefore, this paper focuses on the non-axisymmetric exhaust duct of a turboshaft engine operating under thermal environments and random vibration loads, analyzing its modal characteristics and displacement and stress responses under axial random vibration loads before and after heating. Additionally, experimental research was conducted, providing valuable reference data for the structural design and optimization of large, thin-walled, irregular exhaust ducts.
2. Research Methodology
2.1. Analysis Method for Structural Random Vibration Characteristics in Thermal Environments
2.1.1. Thermal Stiffness Matrix
The effect of a high-temperature environment on the vibration characteristics of a structure is essentially an impact on the overall stiffness matrix of the structure. In a thermal environment, there are two main aspects to consider regarding how the overall stiffness of the structure is influenced by temperature. On one hand, in a high-temperature environment, the elastic modulus of the material experiences significant changes with variations in temperature, thereby reducing the overall stiffness of the structure itself [16]. In a high-temperature environment, the initial stiffness matrix of the structure
has the same form as that at ambient temperature, as Equation (1).
In Equation (1),
is the structural deformation matrix, and
is the elastic matrix of the structure.
On the other hand, in a high-temperature environment, certain thermal stresses are generated within the structure, which in turn leads to an additional initial stress stiffness matrix that alters the overall stiffness of the structure. The initial stress stiffness matrix
is shown in Equation (2).
In Equation (2),
is the shape function matrix, and
is the stress matrix.
In summary, the thermal stiffness matrix of the structure
is shown in Equation (3), which is the total stiffness matrix of the structure used in the finite element computation of the structural thermal vibration problem under the conditions of temperature and thermal stress.
2.1.2. Thermal Modal Analysis
Modal analysis computes the natural frequencies and modal shapes of a structure, forming the basis for random vibration analysis. Utilizing the results of modal analysis, the system’s frequency response function is developed to evaluate the structure’s response to random excitation. The core of modal analysis lies in solving the motion differential equations of a linear system with n degrees of freedom by substituting the physical coordinates with modal coordinates corresponding to each modal shape, thus decoupling the differential equations into independent equations [17]. This methodology facilitates the determination of the system’s modal parameters. The motion differential equations for a system with n degrees of freedom are presented in Equation (4).
In the equation,
is the structural mass matrix,
is the structural damping matrix, and
is the thermal stiffness matrix obtained from Equation (3).
,
and
represent the vibration acceleration, velocity, and displacement vector, respectively.
is the system excitation load vector.
The structural damping of the exhaust duct has a negligible impact on the natural frequency; therefore, external loads and damping are not considered. Thus, Equation (4) can be simplified to Equation (5).
The structural displacement can be decomposed into a superposition of harmonic motions. It is assumed that the displacement vector
can be expressed in Equation (6).
In the equation,
is the amplitude vector, and
is the frequency of the vibration.
Substituting Equation (6) into Equation (5) yields the generalized eigenvalue problem:
When the orders of matrices
and
are n, Equation (7) is an n-order real coefficient equation. The problem of determining the vibration characteristics (natural frequencies and modal shapes) of the system is equivalent to solving for the eigenvalues of the matrix
.
2.1.3. Structural Random Vibration Analysis
During the operation of an aero-engine, the excitation parameters of the exhaust duct cannot be accurately predicted and are thus described as a random process based on statistical principles. The random vibration analysis is based on two fundamental assumptions [18]: (1) the system exhibits no random characteristics and is linear; the stiffness/damping and mass remain constant over time, and the system is lightly damped; and (2) the action process is a stationary normal distribution random process experienced by each state.
In random vibration analysis, the statistical characteristics of random excitation are described by the power spectral density (PSD) curve. The power spectral density function represents statistical information about the amplitude of the various states experienced during the process in the frequency domain, as shown in Equation (8).
In Equation (8),
represents the difference between any two time points
and
in the random process.
is the correlation function of the random process
at time
, as shown in Equation (9).
Based on the input PSD values and using a single degree of freedom transfer function and the modal superposition technique, the frequency response function
(FRF) is presented in Equation (10).
In Equation (10), the magnitude of the frequency response function is the ratio of the input amplitude to the output amplitude, namely as Equation (11).
For a single input PSD value
, the system output
is presented in Equation (12).
2.2. Finite Element Method
Figure 1 illustrates the non-axisymmetric exhaust duct, which consists of an annular diffuser, a bend, a central tube, and struts. Six struts are uniformly distributed around the inlet of the exhaust duct, connecting the central tube to the bend through a large, rounded corner transition. Additionally, the central tube and the bend are connected by a large, rounded corner transition. The geometric design method for the non-axisymmetric exhaust duct is detailed in reference [19]. The dimensions of the benchmark exhaust duct model are substantial, measuring approximately 1200 mm × 1000 mm × 1300 mm (length × width × height). The overall structure of the exhaust duct is formed through combination welding between the annular diffuser, bend, central tube, and struts. All components are constructed from GH3536 material, with a sheet thickness of 1 mm, and the material parameters are derived from the aerospace materials handbook [20], as shown in Table 1. The finite element calculation model is divided into a hexahedral mesh format with local refinement, totaling 46,105 elements, as shown in Figure 2.
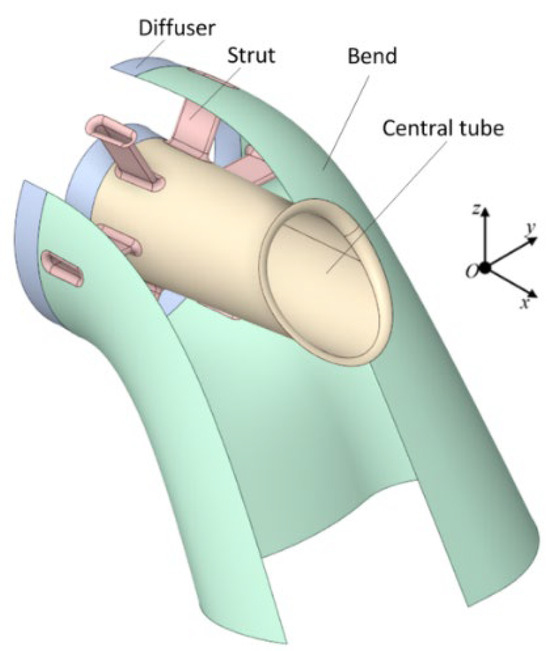
Figure 1.
Geometric model.

Table 1.
Thermal and mechanical property parameters of GH3536 material.
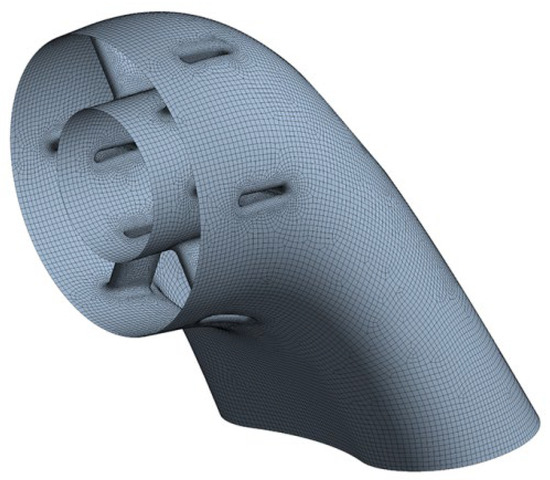
Figure 2.
Finite element model.
According to the installation conditions of the exhaust duct during actual operation, the front mounting edge of the diffuser is set as a fixed constraint boundary condition. By utilizing the coupling relationship between fluid software and structural finite element software, the temperature field obtained from the fluid-thermal coupling calculations is interpolated and mapped onto the structural mesh of the exhaust duct. This process enables a thermodynamic analysis that yields the wall temperature distribution of the mapped structural mesh, as illustrated in Figure 3. The areas of uneven temperature distribution in the exhaust duct are mainly at the front edge of the struts and the inner side of the bend, particularly at the outlet end of the bend, where a large area of low-temperature region exists.
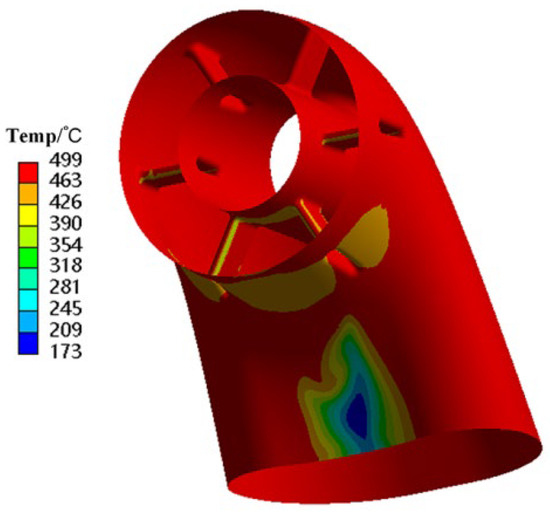
Figure 3.
Wall temperature of exhaust duct.
Based on the temperature field distribution of the exhaust duct, the thermal stress distribution is obtained through thermal-structural coupling analysis, as shown in Figure 4. The overall stress level of the exhaust duct is relatively low, with noticeable stress concentrations occurring only at the front edge of the struts and the inner side of the bend. The thermal stress at the front edge of the struts is approximately 182 MPa, while the thermal stress on the inner side of the bend is about 197 MPa, both of which are well below the material’s yield strength and will not lead to fatigue failure. Therefore, this also indicates from another perspective that the vibration stress of the exhaust duct in a thermal environment is the primary cause of its potential fatigue failure.
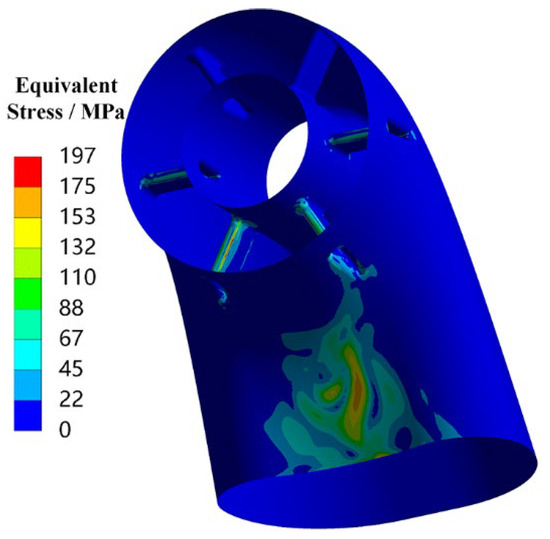
Figure 4.
Thermal stress of the exhaust duct.
3. Results and Discussion
3.1. Influence of Temperature on the Modes of the Exhaust Duct
The variation in the first 20 natural frequencies of the exhaust duct under thermal and ambient temperature conditions is shown in Figure 5. As illustrated, the natural frequencies of all modes decrease when the structure is subjected to heating, with the differences becoming increasingly pronounced at higher modes. This phenomenon can be attributed to the structural heating, which leads to thermal stress and changes in the material properties, particularly the elastic modulus, resulting in a reduction in stiffness and thus causing the natural frequencies of the exhaust duct to decrease.
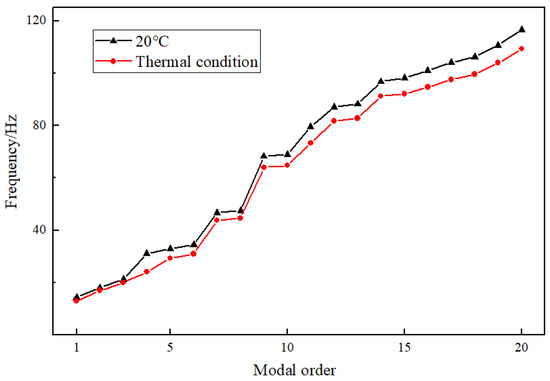
Figure 5.
Comparison of the natural frequencies of the exhaust duct.
A comparison of the finite element analysis results reveals that the mode shapes of each order remain largely consistent before and after heating. As discussed in Section 2, the high-temperature environment primarily affects the overall stiffness of the structure, but the stiffness distribution remains largely unchanged. Additionally, the structure’s geometry and boundary conditions remain unaffected. Therefore, the mode shapes are essentially the same before and after heating. Due to space limitations, only the modal shapes of the exhaust duct under thermal conditions are presented in this paper. Figure 6 shows several typical modal shapes of the exhaust duct under thermal conditions. The modal shapes of the exhaust duct can be mainly categorized into local modes and global modes. Local modes are primarily distributed at the outlet end of the bend and the front end of the central tube, where the low-order vibration modes in the initial few orders develop from a single circumferential waveform at the outlet of the bend into multiple waveform shapes. In contrast, global modes exhibit coupling and interaction among the bend, central tube, and struts, with the 12th order mode being the first mode of the overall modal shape of the exhaust duct. The primary modal characteristics of the exhaust duct, as presented above, suggest that the stiffness of the diffuser section is relatively high due to the fixed boundary conditions at the inlet, making it less susceptible to excitation. In contrast, the central tube and the latter half of the bend exhibit more intricate modal characteristics due to their cantilevered structure.
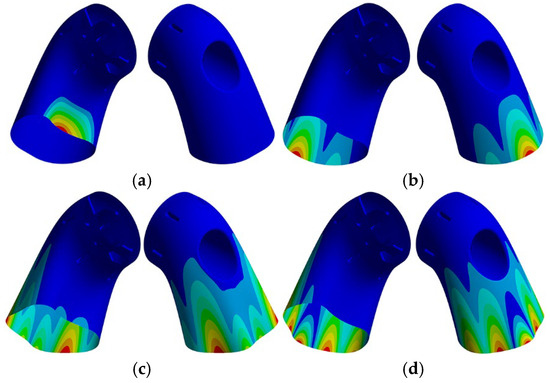
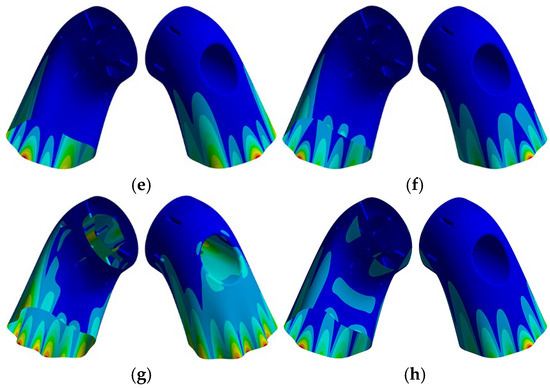
Figure 6.
Typical modal shapes of specific orders. (a) 1st order; (b) 2nd order; (c) 5th order; (d) 6th order; (e) 7th order; (f) 9th order; (g) 12th order; and (h) 13th order.
3.2. Influence of Temperature on the Random Vibration Response of the Exhaust Duct
The random vibration load is presented in the form of an acceleration load spectrum consisting of a broadband background plus narrowband peaks, as shown in Figure 7. Based on practical engineering considerations, the frequency range and magnitude of the random vibration power spectral load are determined. The frequency range of the broadband background is 0–300 Hz, with a magnitude of 0.06 g2/Hz; the narrowband peak frequencies are 1 to 3 times the speed of the power turbine, specifically at 80 Hz, 180 Hz, and 280 Hz, with a magnitude of 1.6 g2/Hz.
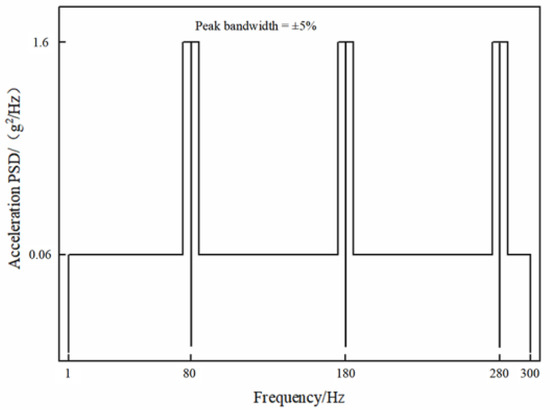
Figure 7.
Acceleration power spectral load.
For random vibrations, the results obtained through power spectral density analysis are not absolute but represent the likelihood of reaching a specific value. The outcomes derived from this analysis represent the values of various parameters (such as displacement, stress, etc.) at a confidence level of 1σ. for instance, if the maximum displacement value of a specific structure is determined to be x, its physical significance is that, under the corresponding random spectral excitation, the probability of the structure’s maximum displacement being equal to or less than x is 1σ (68.27%).
3.2.1. Random Vibration Response of the Exhaust Duct Under X-Axial Loading
The 1σ deformation in the X, Y, and Z directions and equivalent stress distribution of the exhaust duct under X-axis random vibration loading are presented in Figure 8. It can be observed that, under X-axis loading, both the displacements and equivalent stresses in all directions increase under thermal conditions, especially with significant increases in X-direction deformation and overall equivalent stress. The maximum deformation in the X and Z directions is concentrated on the outer and inner sides of the exit end of the bend, while the maximum deformation in the Y-direction is concentrated on both sides of the exit end of the bend. Regions with higher equivalent stress include the rounded corners where the struts transition to the central tube, as well as the exit end of the bend, with the maximum stress occurring on the outer side of the lower bend’s exit end. Therefore, it is evident that under X-axis loading, the maximum equivalent stress and displacements in all directions occur at the exit end of the bend. This can be attributed to the low stiffness of the exit section, which results from the long cantilever structure of the exhaust duct and corresponds with the modal shapes of the exhaust duct.
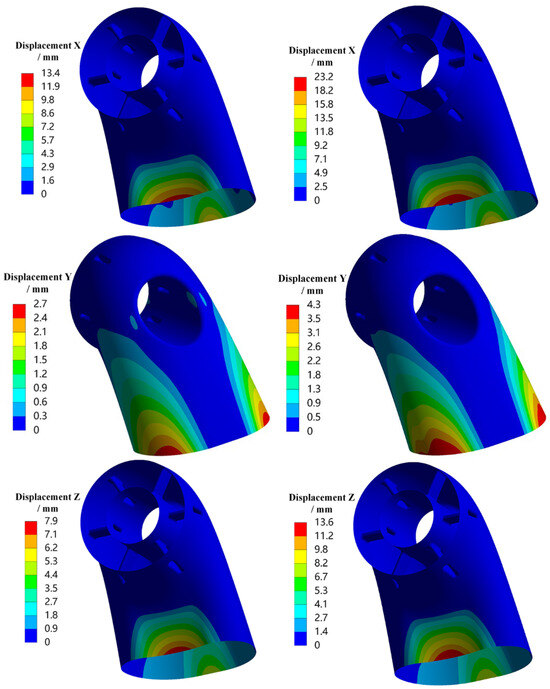
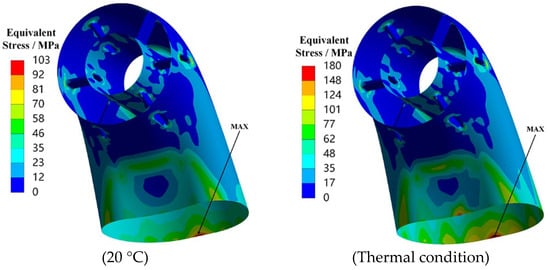
Figure 8.
Displacement and stress response contours of the exhaust duct under X-axis loading (1σ).
Based on the displacement deformation contours of the exhaust duct, the positions of maximum deformation in the X and Z directions are identical. Node 3206 at the inner side of the exit end of the bend is selected for X-direction and Z-direction displacement response analysis, as shown in Figure 9; Node 3414 on the right side of the exit end of the bend is selected for Y-direction displacement response analysis, as shown in Figure 10; and Node 3379 at the inner side of the exit end of the bend is selected for equivalent stress response analysis, as shown in Figure 11. It can be observed that the PSD response curves exhibit peaks at multiple frequencies, indicating that the random vibration load has excited several modes of the exhaust duct, with lower-order modes being more easily excited. Furthermore, influenced by the temperature field, the response peaks of the exhaust duct have shifted to lower frequencies, which is attributed to the decrease in thermal modal frequencies of the exhaust duct at the same orders. Moreover, the response amplitudes of both displacement and equivalent stress of the exhaust duct under thermal conditions have significantly increased, which aligns with the distribution observed in the displacement and equivalent stress contours presented in Figure 8.
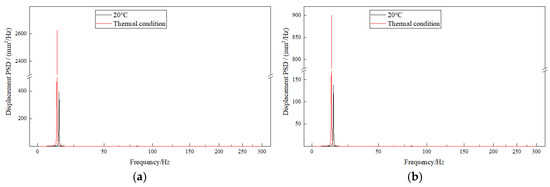
Figure 9.
Displacement response at node 3206 (1σ). (a) X-direction; and (b) Z-direction.
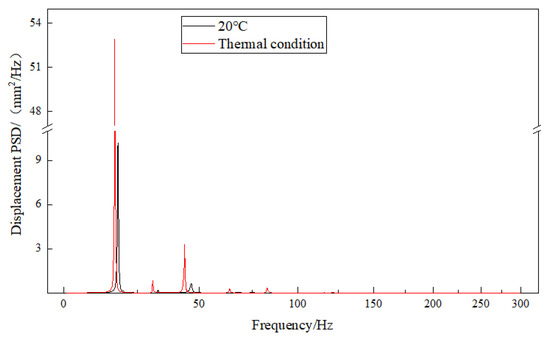
Figure 10.
Y-direction displacement response at node 3414 (1σ).
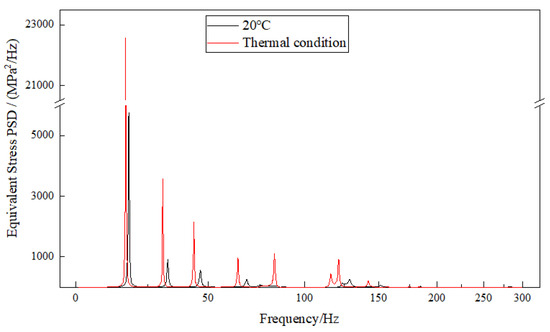
Figure 11.
Stress response at node 3379 (1σ).
From a numerical perspective, the peak frequency of displacement responses in the X and Z directions at node 3206 under a thermal environment is primarily at the 1st order (12.96 Hz), indicating that the displacements in the X and Z directions are mainly excited by the 1st order frequency. At node 3414, the peak frequencies of displacement response in the Y direction are primarily observed at the 2nd order (16.93 Hz) and 7th order (43.76 Hz), mainly excited by the 2nd order frequency. The peak frequencies of equivalent stress response at node 3379 are primarily observed at the 2nd order (16.93 Hz), 6th order frequency (30.92 Hz), 7th order (43.76 Hz), 9th order (64.02 Hz), and 13th order (82.79 Hz). This distribution suggests that the maximum equivalent stress is generated through the coupling of multi-modal responses, with the predominant response frequencies exhibiting considerable overlap.
3.2.2. Random Vibration Response of the Exhaust Duct Under Y-Axial Loading
Figure 12 illustrates the 1σ displacement deformation in the X, Y, and Z directions, as well as the 1σ equivalent stress of the exhaust duct, under the application of random vibrational loads along the Y-axis. It can be observed that, under axial loading along the Y-axis, the directional displacements and overall equivalent stress in a thermal environment are observed to increase significantly, particularly notable is the rise in equivalent stress, where the peak value escalates from 150 MPa to 353 MPa. The deformation of the exhaust duct in the X and Z directions is primarily located on the outer side of the bend’s outlet; in the Y-direction, the deformation mainly occurs on both sides of the bend’s outlet and at the front end of the central tube. The areas with higher equivalent stress are primarily found on the outer side of the bend and at the arc junctions between the strut and the bend/central tube.
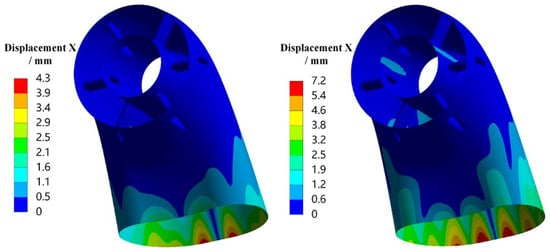
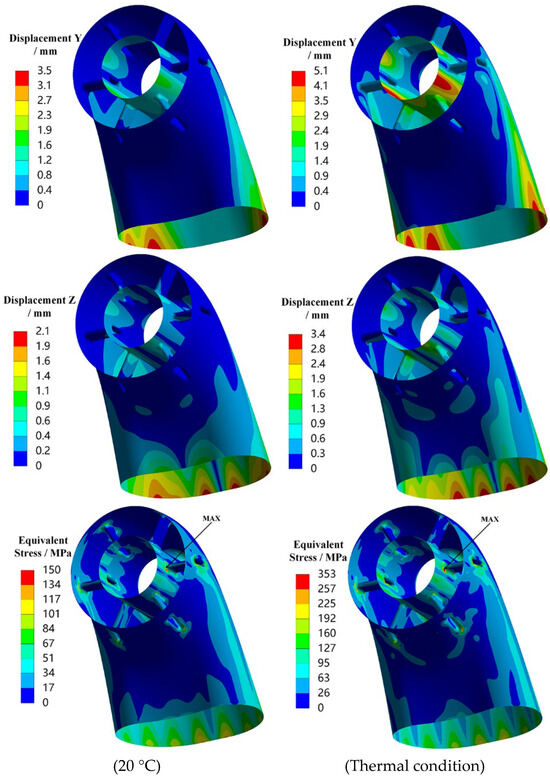
Figure 12.
Displacement and stress response contours of the exhaust duct under Y-axis loading (1σ).
Based on the displacement contours of the exhaust duct, the positions of maximum deformation in the X and Z directions are identical; however, there are differences compared to the maximum deformation positions during axial loading along the X-axis. The displacement response analysis is conducted at node 3387, located at the inner side of the bend’s outlet, as shown in Figure 13. The deformation in the Y-direction of the exhaust duct also differs from that during axial loading along the X-axis, although the maximum deformation position remains unchanged. The Y-direction displacement response analysis is performed at node 3414, located on the right side of the bend’s outlet, as shown in Figure 14. The maximum equivalent stress in the exhaust duct is found at the arc junction between the front edge of the middle strut and the central tube. Consequently, node 17,246 in this area is selected for stress PSD curve analysis, as shown in Figure 15.
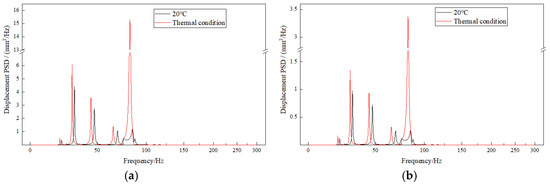
Figure 13.
Displacement response at node 3383 (1σ). (a) X-direction; and (b) Z-direction.
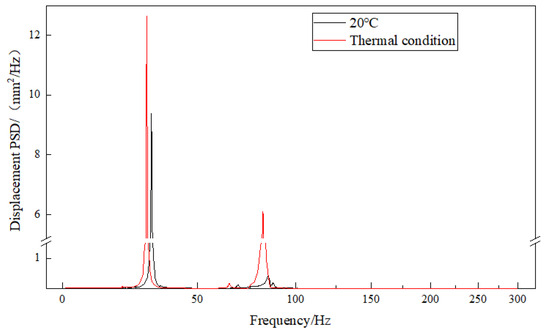
Figure 14.
Y-direction displacement response at node 3414 (1σ).
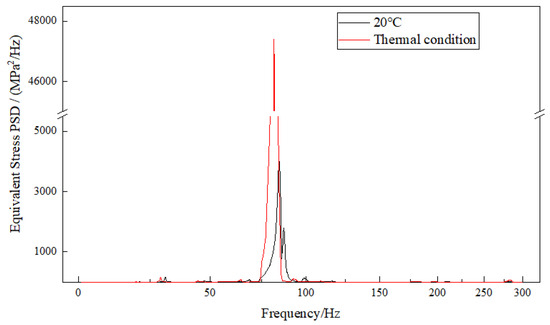
Figure 15.
Stress response at node 17,246 (1σ).
Numerically, the frequencies of the first five peaks of the X- and Z-direction displacement responses at node 3387 under a thermal environment are identical, specifically at the 3rd order (19.98 Hz), 5th order (229.26 Hz), 8th order (44.59 Hz), 10th order (64.75 Hz), and 12th order (81.69 Hz). This indicates that the displacement responses in these two directions are generated by the coupling of multi-modal responses. For the Y-direction displacement response at node 3414, there are fewer modal frequencies, primarily the 5th order (22.35 Hz) and the 12th order (81.69 Hz), with the peak values of both modes being similar. This indicates that the Y-direction displacement response of the exhaust duct is mainly influenced by the coupling of the local mode of the 5th order and the overall mode of the 12th order. The peak response frequency at node 17,246, where the maximum equivalent stress of the exhaust duct is located, is at the 12th order (81.69 Hz), indicating that the equivalent stress in the Y-direction loading is primarily affected by the 12th order overall mode. Additionally, the maximum stress response of the exhaust duct in a thermal environment is an order of magnitude higher than that at ambient temperature, which also explains the significant increase in equivalent stress of the exhaust duct under thermal conditions, as shown in Figure 12.
3.2.3. Random Vibration Response of the Exhaust Duct Under Z-Axial Loading
The deformation and equivalent stress distribution of the exhaust duct in the X, Y, and Z directions under Z-axis random vibration loading are presented in Figure 16. It can be observed that under axial loading along the Z-axis, the amplitude variations in the displacement and equivalent stress in all directions of the exhaust duct in a thermal environment are relatively small. The displacement deformation in the X, Y, and Z directions, as well as the overall equivalent stress distribution, is essentially consistent with that under axial loading along the X-axis, while the displacement deformation in all directions has decreased, but the equivalent stress has increased to some extent.
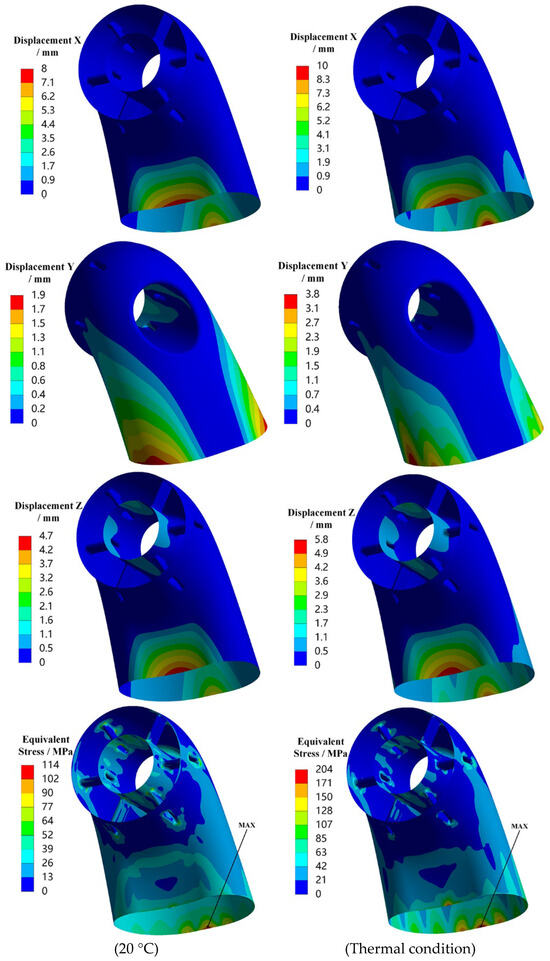
Figure 16.
Displacement and stress response contours of the exhaust duct under Z-axis loading (1σ).
Based on the above analysis, the same nodes (3206, 3414, 3379) utilized for X-axis loading are selected for the PSD response analysis of directional displacement and equivalent stress under Z-axis loading, as illustrated in Figure 17, Figure 18, Figure 19. In a thermal environment, the peak displacement response of the exhaust duct is similar to that in ambient temperature conditions, showing no significant increase. This suggests that the temperature field has a minor effect on the displacement deformation of the exhaust duct during axial loading along the Z-axis. Conversely, the peak stress response at the 13th order (82.79 Hz) has significantly increased compared to that in ambient temperature conditions, while the peak responses of the other modes are comparable to those at ambient temperature, indicating that the 13th order mode shape is the main factor contributing to the increase in equivalent stress of the exhaust duct in a thermal environment.
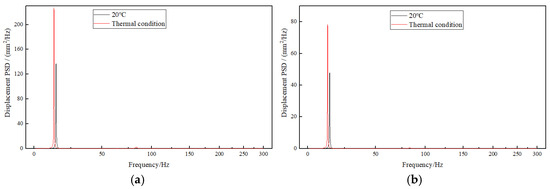
Figure 17.
Displacement response at node 3206 (1σ). (a) X-direction; and (b) Z-direction.
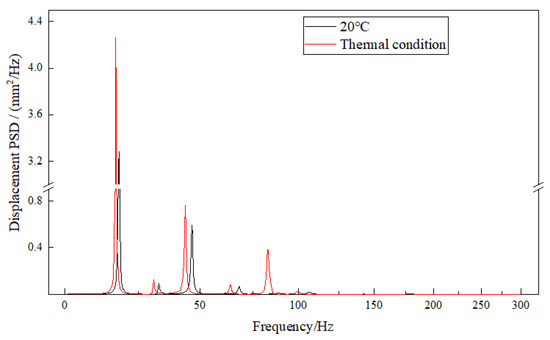
Figure 18.
Y-direction displacement response at node 3414 (1σ).
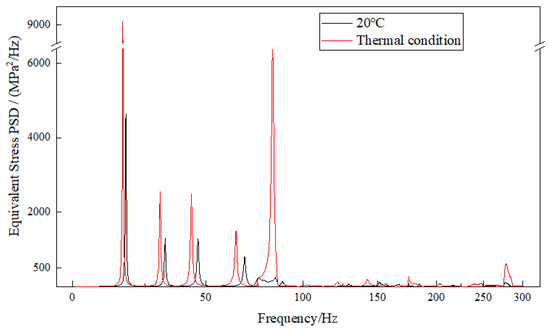
Figure 19.
Stress response at node 3379 (1σ).
The peak frequency responses of the exhaust duct in the X, Y, and Z directions are the same as those during axial loading along the X-axis, but the response peak values have significantly decreased. The peak frequency responses of the first few orders of equivalent stress are also the same as those during X-axis axial loading; however, the response peak values for the 2nd order (16.93 Hz), 6th order (30.92 Hz), 7th order (43.76 Hz), and 9th order (64.02 Hz) have decreased compared to those during X-axis axial loading, while the 13th order (82.79 Hz) has increased.
3.3. Vibration Experiment of Scale Model Under Thermal Environment
3.3.1. Design of Scale Model Design
Due to the characteristics of the non-axisymmetric exhaust duct, including large external dimensions, thin-walled structures, and welded components, direct experimentation with the prototype presents several challenges, such as high experimental difficulty, significant costs, and spatial limitations. As a result, scaled model experiments are required. However, when designing these experimental models, constraints such as the prototype’s structural dimensions and specific geometric parameters may prevent the scaled model from maintaining proportionality with the prototype. This necessitates the development of a distorted geometric similarity model. Conducting scaled model experiments based on the theory of dynamic similarity has widespread applications in the field of structural vibration [21].
The exhaust duct studied in this article is extremely thin, with a thickness of only 1mm, making it difficult to obtain a similar scaled-down model with an even smaller thickness through conventional fabrication methods. Therefore, a distorted geometric similarity model must be established. In the experimental model presented in this study, only the wall thickness exhibits distortion, while all other geometric structures and material properties are scaled according to the principle of geometric similarity. Based on dynamic similarity theory, the relationship for the model’s natural frequency is as follows [22]:
In the equation,
is the similarity ratio of the model’s natural frequency,
is the similarity ratio of the material’s elastic modulus,
is the similarity ratio of the material density,
is the similarity ratio of the thin-walled structure thickness, and m is the distortion similarity factor of the thickness.
Due to the challenges in establishing a universal similarity relationship between structurally dissimilar prototypes and scaled models, and considering that the structural response is primarily influenced by several fundamental frequencies, this study employs a segmented similarity method to predict structural modes and vibration responses. The segmented similarity method analyzes a specific scaled model to identify the similarity relationship between the structural prototype and the specific scaled model, without analyzing the universality of the similarity, thereby providing a theoretical basis for practical engineering analysis [22]. The segmented similarity method consists of the following steps: (1) identifying the order of the structural natural frequency corresponding to the frequency of the peak in the response curve; (2) dividing the frequency response curve into n segments near the response peak, with each segment containing one peak response; and (3) determining the frequencies of each segment and the corresponding similarity coefficients based on simulation results, and utilizing the response data from the scaled model to predict the response of the original model.
Combining the analysis in Section 3.2, it can be observed that for the exhaust duct prototype structure, when loaded in the X-axial, the equivalent stress response frequencies predominantly correspond to the 2nd order (16.93 Hz), 6th order (30.92 Hz), 7th order (43.76 Hz), 9th order (64.02 Hz), and 13th order (82.79 Hz); when loaded in the Y-axial, the equivalent stress response frequency predominantly corresponds to the 12th order (81.69 Hz). Therefore, utilizing the segmental similarity method, an analysis is performed to predict the modal and vibration responses of the scaled model at the corresponding orders.
A scaled physical model is constructed based on a size ratio of 1:4. Finite element simulation analysis is performed according to the methodology outlined in Section 2.2, producing the modal and vibrational responses for both the scaled and original models. The natural frequencies and similarity ratios of the scaled model at the relevant orders are presented in Table 2. The typical modal shapes of the exhaust duct scaled model are presented in Figure 20. While the modal shapes of the scaled and original models are not entirely identical, the vibration patterns and trends exhibit sufficient similarity, thereby fulfilling the criteria for modal similarity.
Table 2.
Natural frequencies and similar distortion factors of the exhaust duct prototype and scaled model.
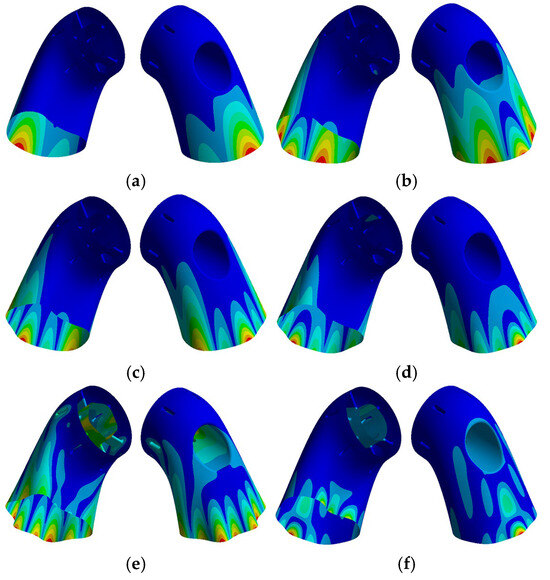
Figure 20.
Typical modal shapes of specific orders. (a) 2nd order; (b) 6th order; (c) 7th order; (d) 9th order; (e) 12th order; and (f) 13th order.
Based on the modal similarity relationship between the scaled and original model, the random vibration power spectral load of the exhaust duct is adjusted, as shown in Figure 21. The frequency range and magnitude of the random vibration power spectrum are specified as follows: the frequency range of the broadband background is 1–1000 Hz, with a magnitude of 0.06 g2/Hz; and the frequency of the narrowband peak is 710 Hz, with a bandwidth of 675–745 Hz, and a magnitude of 1.6 g2/Hz.
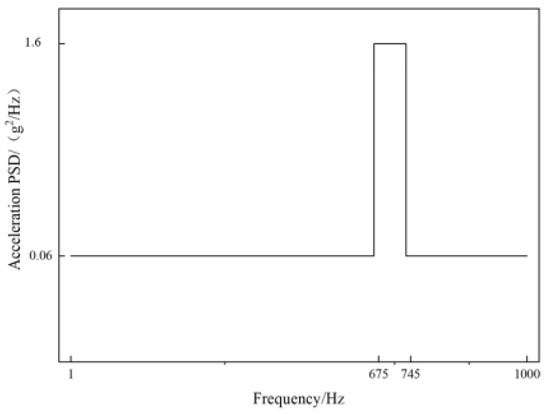
Figure 21.
Acceleration power spectral load of scaled model.
The same location exhibiting maximum equivalent stress, as identified in Section 3.2, is designated as the monitoring point. For the analysis of vibration response under X-axial loading, monitoring point A (located at the position of node 20,651) is selected; conversely, for Y-axial loading, monitoring point B (located at node 1178) is chosen. As illustrated in Figure 22, the stress response trends of the exhaust duct remain consistent, although the response amplitudes vary. In practical engineering applications, particular emphasis is placed on the magnitude of peak responses and their corresponding frequencies in the frequency response curve, thereby necessitating the use of the segmental similarity method to predict the original model’s response based on the response quantities of the scaled model.
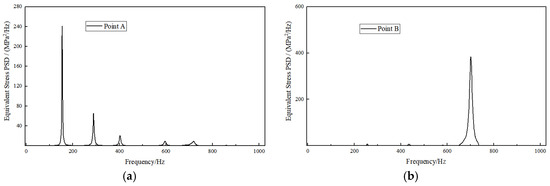
Figure 22.
Equivalent stress responses of the scaled model under different axial loadings. (a) X-axial; and (b) Y-axial.
By integrating Figure 22 and Figure 11, Figure 15 from Section 3.2, it can be concluded that, under X-axial loading, the stress response similarity atios
at monitoring point A for the 2nd, 6th, 7th, 9th, and 13th order frequencies of the exhaust duct are 93.437, 54.469, 104.927, 95.643, and 117.283, respectively. In the case of Y-axial loading, monitoring point B reveals a stress response similarity ratio
of 123.035 for the 12th order frequency of the exhaust duct. The similarity ratio transformation values of the scaled model and calculated results of the original model are compared, as shown in Figure 23. It can be seen that by applying the similarity ratio transformation to the vibration response curve of the scaled model, there is a good agreement with the original model.
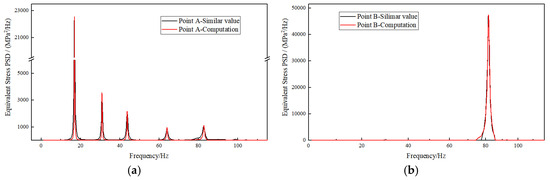
Figure 23.
Comparison of the similarity ratio transformation values with the calculated results of the original model. (a) X-axial; (b) Y-axial.
3.3.2. Experiment Results and Analysis
The random vibration experiment system under thermal environment primarily consists of four components: a multi-axial vibration table, a control system, a data acquisition system, and a display recording system. The schematic diagram of this exhaust duct thermal vibration experiment is shown in Figure 24. The equipment involved mainly includes the vibration table, sensor devices, data acquisition equipment, display recording devices, and data analysis equipment.
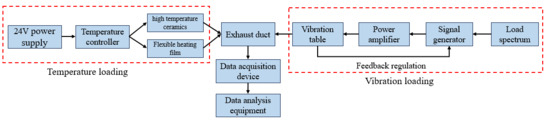
Figure 24.
Schematic diagram of the thermal vibration experiment.
In the context of vibration loading, the load spectrum is converted into a voltage signal input for the signal generator, which subsequently produces the corresponding voltage signal. After amplification by the power amplifier, this signal drives the vibration table, with real-time feedback provided by the acceleration sensor to adjust the voltage signal; simultaneously, the acceleration signal is recorded and saved. Regarding temperature loading, the temperature controller is powered by a 24 V power supply and regulates the exhaust duct’s temperature using 50 mm × 50 mm high-temperature ceramics, 15 mm × 15 mm high-temperature ceramics, and flexible heating film. Temperature is continuously monitored, and feedback is provided in real time via a thermocouple, thereby establishing a closed-loop control system. The data acquisition system collects data through strain gauges and transmits it to the data analysis equipment for post-processing. The data analysis equipment then processes the collected strain data to generate strain spectra, which are subsequently converted into stress spectra.
The clamping method for the experiment specimen and the positions of the measurement points are illustrated in Figure 25. The experiment specimen is installed on the horizontal slider of the vibration table using a test fixture, with bolts securing the specimen to the fixture. The fixture is fixed to the vibration table using circular array bolts, and strain gauges are attached to monitoring points A and B.
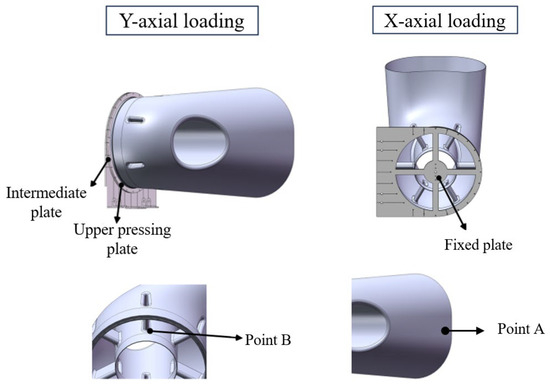
Figure 25.
The clamping method for the experiment specimen and the positions of the measurement points.
The experimental equipment utilized in this vibration experiment is presented in Figure 26. The excitation device is the SA-JZ010 vibration table, the spectrum generator is the DG1022U, and the power amplifier is the SA-PA020. The sensor equipment includes the PCB 356A26 temperature sensor, the CJ-YD0025 accelerometer, and the EB120-3A resistance strain gauge. The data acquisition device employed is the USB-1202FS data acquisition system.
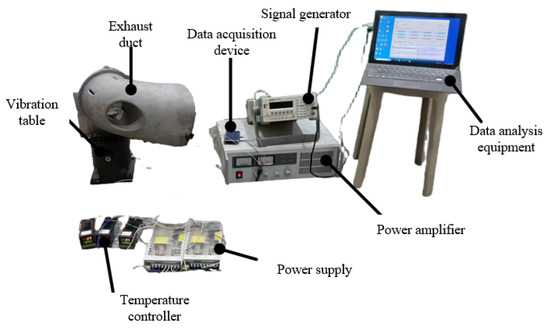
Figure 26.
The experimental equipment.
Figure 27 illustrates the experimental site. The data acquisition system records micro-strain signals output by the strain gauges installed at monitoring points A and B on the exhaust duct, operating at a constant sampling rate, which results in the creation of the original strain-time series data. This data is transmitted to the data analysis equipment via cables, where a low-pass filter is applied to eliminate high-frequency noise, and baseline offsets caused by temperature drift or initial installation are removed. The pre-processed strain time-domain data is then transformed into frequency-domain data using Fast Fourier Transform (FFT), generating a strain spectrum. Finally, the strain spectrum is further converted to produce the final stress response spectrum.
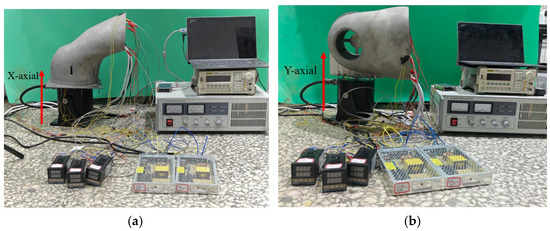
Figure 27.
On-site diagram of the thermal vibration experiment. (a) X-axial loading; and (b) Y-axial loading.
By converting the time-domain signals of the test results into frequency-domain signals, the stress response spectrum of the experiment specimen was obtained. During the experiment, three repeat tests were conducted, demonstrating relatively good consistency in the results. Ultimately, the final experimental result was derived by calculating the average of these three test results. Subsequently, based on the frequency and stress similarity ratios from Section 3.3.1, the stress response spectrum of the measurement points on the specimen after similarity transformation was derived and compared with the finite element analysis results. Table 3 presents a comparison of the predicted frequencies from the exhaust duct experimental model with those of the original model. It can be observed that the predicted frequencies, after transformation using the similarity ratio, have a relative error of no more than 5% when compared to the computed frequencies of the original model, indicating a good agreement between the analysis results and the experimental results.
Table 3.
Comparison of predicted frequencies of the experimental model and the original model.
Figure 28 compares the stress response spectrum of monitoring points A and B, after similarity transformation, with the finite element computation results of the original model. The fitness of the stress response curves is quite good, with the calculated values of the peak stress responses and the experimental data showing an error of no more than 15%. This reflects the dynamic characteristics of the actual structure quite accurately and meets the engineering precision requirements. The analysis above demonstrates that the random vibration responses obtained from experiments on the scaled model, after transformation using similarity ratios, can effectively predict the responses of the original model. This validates the reasonableness and reliability of the simulation method, providing a theoretical foundation and reference for the random vibration analysis of large-size thin-walled structural components in engineering.
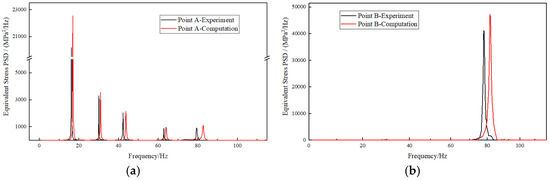
Figure 28.
Comparison of the similarity ratio transformation experimental values with the calculated results of the original model. (a) X-axial; and (b) Y-axial.
4. Conclusions
This paper investigates analytical methods for assessing the random vibration characteristics of a non-axisymmetric exhaust duct under thermal environment, establishing a finite element model that couples thermal loads and vibrational loads. It analyzes the modal characteristics of the non-axisymmetric exhaust duct before and after heating, as well as the random vibration response characteristics under various axial loadings. The main research conclusions are as follows:
(1) The exhaust duct exhibits a wide range of natural frequency components, and the modal shapes for each mode remain largely consistent before and after heating. These modal shapes primarily include both local and overall modal shapes, with local modal shapes predominantly located at the outlet end of the bend and the front end of the central tube. In contrast, the overall modal shapes represent the coupled interaction among the bend, central tube, and struts.
(2) In the thermal environment, the shapes of the power spectral density curves for displacement and stress in the exhaust duct remain largely unchanged in the low-frequency range; however, the response frequencies exhibit a noticeable shift toward lower frequencies. When subjected to Y-axial loading, the response amplitudes of the X and Y-direction displacements, as well as the equivalent stress at the 12th-order modal frequency, significantly increase.
(3) Random vibrational loads excite multiple modes of the exhaust duct, resulting in a pronounced multi-modal characteristic in the responses, with lower-order modes being more readily excited. The displacement and equivalent stress responses in all directions under X and Z-axial loading are fundamentally similar. The response of the exhaust duct under Y-axial loading differs significantly from that under X and Z-axial loading. Therefore, responses under different axial loads must be considered in random vibration analysis.
(4) Under X- and Z-axial loading, the 1st order (12.96 Hz) frequency has the greatest influence on the displacement responses in the X and Z directions, while the 2nd order (16.93 Hz) and 13th order (82.79 Hz) frequencies have the most significant impact on the displacement response in the Y-direction and the equivalent stress response. When subjected to Y-axial loading, the 5th order (22.35 Hz) and 12th order (81.69 Hz) frequencies have the greatest influence on the displacement responses in the X, Y, and Z directions and equivalent stress responses. Therefore, during the design process, special attention should be given to these frequencies, and certain stiffness enhancement measures should be implemented to reduce the amplitude of the responses.
(5) The simulation method has been experimentally validated using a scaled model, revealing that relative frequency errors do not exceed 5%, the stress response curves show a strong correlation, with the relative error in peak stress responses not exceeding 15%. These results meet engineering precision standards and demonstrate the validity and reliability of the method, providing a valuable reference for the random vibration analysis of large thin-walled structural components in engineering.
Author Contributions
Conceptualization, J.D. and L.Z.; methodology, J.D.; software, J.D.; validation, J.D., L.Z.; investigation, J.D.; data curation, J.D.; writing—original draft preparation, J.D.; writing—review and editing, L.Z.; visualization, J.D., L.Z.; supervision, L.Z. All authors have read and agreed to the published version of the manuscript.
Funding
This research was funded by the National Science and Technology Major Project of China, grant number: J2019-III-0009-0053.
Data Availability Statement
Data is contained within the article.
Conflicts of Interest
The authors declare no conflicts of interest.
Abbreviations
| PSD | Power Spectral Density. |
| FFT | Fast Fourier Transform |
| Nomenclature | |
| E | elastic modulus (GPa) |
| f | Frequency (Hz) |
| K | stiffness matrix (N/m) |
| l | geometric dimensions |
| m | distortion similarity factor |
| T | temperature (°C) |
| X , Y , Z | coordinates (m) |
| Greek letters | |
| linear expansion coefficient (10−6/°C−1) | |
| μ | poisson’s ratio |
| similarity ratio |
References
- Crandall, S.H. Random vibration of one- and two-dimensional structures. Dev. Stat. 1979, 2, 1–82. [Google Scholar]
- Itao, K.; Crandall, S.H. Wide-band random vibration of circular plates. J. Mech. Des. 1978, 100, 690–695. [Google Scholar] [CrossRef]
- Crandall, S.H.; Zhu, W.Q. Wide band random vibration of an equilateral triangular plate. Probabilistic Eng. Mech. 1986, 1, 5–12. [Google Scholar] [CrossRef]
- White, R.G. The acoustic excitation and fatigue of composite plates. AIAA J. 2013, 253–260. [Google Scholar] [CrossRef]
- Dhainaut, J.M.; Mei, C. Nonlinear response and fatigue life of isotropic panels subjected to nonwhite noise. J. Aircr. 2015, 43, 975–979. [Google Scholar] [CrossRef]
- Vaicaitis, R.; Jan, C.; Shinozuka, M. Nonlinear panel response and noise transmission from a turbulent boundary layer by a monte carlo approach. In Proceedings of the Aerospace Sciences Meeting, Grapevine, TX, USA, 7–10 January 2013. [Google Scholar]
- Whitney, J.M.; Ashton, J.E. Effect of environment on the elastic response of layered composite plates. AIAA J. 1971, 9, 1708–1713. [Google Scholar] [CrossRef]
- Przekop, A.; Rizzi, S.A. Dynamic snap-through of thin-walled structures by a reduced-order method. AIAA J. 2007, 45, 2510–2519. [Google Scholar] [CrossRef]
- Zhang, C.P.; Zang, D.J. Model validation for structural dynamics in the aero-engine design process. Energy Power Eng. 2009, 3, 480–488. [Google Scholar]
- Brown, A.M. Temperature-dependent modal test/analysis correlation of X-34 FASTRAC composite rocket nozzle. J. Propuls. Power 2002, 18, 284–288. [Google Scholar] [CrossRef]
- Moreno, B.J. Multiple Boundary Conditions for analysis and validation of the FE models of critical structural aero engine components. In Proceedings of the International Conference on Structural Dynamics Modelling, Test, Analysis, Correlation and Validation, Denver, CO, USA, 22–25 April 2002. [Google Scholar]
- Spivey, N.D. High Temperature Modal Survey of a Hot Structure Control Surface; TM-2011-215965; NASA: Washington, DC, USA, 2011. [Google Scholar]
- Sha, Y.D.; Ai, S.Z.; Zhang, J.M.; Jiang, Z.Q.; Zhao, Q.T. Random vibration response caclution and fatigue analysis of thin-walled structures under heat flux environment. J. Aerosp. Power 2020, 35, 1402–1412. [Google Scholar]
- Sha, Y.D.; Gao, Z.J.; Xu, F.; Li, J.Y. Influence of thermal loading on the dynamic response of thin-walled structure under thermo-acoustic loading. Adv. Eng. Forum 2011, 2, 876–881. [Google Scholar] [CrossRef]
- Jie, X.L.; Li, L.Y.; Hu, Y.H.; Xie, X.; Wu, Y. Fatigue life of titanium alloy thin-walled structure under thermal vibration environment. J. Aerosp. Power 2023, 38, 55–60. [Google Scholar]
- Manav, B.; Eli, L. Design-oriented thermo-structural analysis with external and internal radiation, part 2: Transient response. AIAA J. 2009, 47, 1228–1240. [Google Scholar]
- Jurij, A.; Maks, O. Thermal vibrational analysis for simply supported beam and clamped beam. J. Sound Vib. 2007, 308, 514–525. [Google Scholar] [CrossRef]
- Wang, Y.G. Random Vibrations: Theory and Applications; Taylor & Francis Group: Philadelphia, PA, USA, 2025. [Google Scholar]
- Ding, J.T.; Zhang, J.Z.; Shan, Y. Parametric design and aerodynamic performance of non-axisymmetric exhaust nozzles. Therm. Sci. Eng. Prog. 2025, 61, 103529. [Google Scholar] [CrossRef]
- China Aeronautical Materials Handbook Editorial Committee. China Aeronautical Materials Handbook, Volume 2: Cast High-Temperature Alloys and Deformed High-Temperature Alloys; Standards Press of China: Beijing, China, 2002. [Google Scholar]
- Luo, Z.; Zhu, Y.P.; Han, Q.K.; Wang, D.Y.; Liu, Y.Q. Review and prospect for dynamic similitude theory and its applications in the structure vibration. J. Mech. Eng. 2016, 52, 114–134. [Google Scholar] [CrossRef]
- Ge, M. Research on Vibration Similarity of Hoop Truss Antenna Based on Similarity Theory. Master’s Thesis, Harbin Institute of Technology, Harbin, China, 2015. [Google Scholar]
Disclaimer/Publisher’s Note: The statements, opinions and data contained in all publications are solely those of the individual author(s) and contributor(s) and not of MDPI and/or the editor(s). MDPI and/or the editor(s) disclaim responsibility for any injury to people or property resulting from any ideas, methods, instructions or products referred to in the content. |
© 2025 by the authors. Licensee MDPI, Basel, Switzerland. This article is an open access article distributed under the terms and conditions of the Creative Commons Attribution (CC BY) license (https://creativecommons.org/licenses/by/4.0/).