Article

Efficient Uncertainty Quantification for Satellite Antenna Pointing: A GSA-PEM Framework Integrating Multi-Source Disturbances

School of Astronautics, Harbin Institute of Technology, Harbin 150001, China
*
Author to whom correspondence should be addressed.
Aerospace 2025, 12(8), 720; https://doi.org/10.3390/aerospace12080720
Submission received: 24 June 2025 / Revised: 28 July 2025 / Accepted: 8 August 2025 / Published: 13 August 2025
(This article belongs to the Section Astronautics & Space Science)

Abstract

Space-borne antenna pointing is affected by uncertain disturbances like satellite attitude, structural flexibility, and manufacturing/installation errors. Understanding the effect of these uncertainties is crucial for antenna performance. The main contribution of this paper is the proposal of an uncertainty quantification (UQ) framework for antenna pointing performance that integrates the Global Sensitivity Analysis (GSA) method and Point Estimate Method (PEM), named the GSA-PEM Integrated Framework (GSA-PEM in short). This framework enables systematic analysis of how uncertain parameters (satellite attitude, manufacturing/installation errors, joint rotation, structural deformation, feed displacement, etc.) impact antenna pointing. It establishes a pointing model via coordinate transformation, utilizes the total-effect of the Sobol method to prioritize the key parameters for reliability analysis, and computes pointing performance statistics characteristic via PEM to evaluate pointing reliability. Two case studies are presented to validate the accuracy and efficiency of the proposed framework. Monte Carlo Simulation (MCS) and the Maximum Entropy method using the Fractional-order Moments (ME-FMs) are comparison methods. Results demonstrate that the proposed framework achieves a trade-off between accuracy and efficiency in assessing antenna pointing performance under parameter uncertainty.

1. Introduction

Nowadays, space-borne observation devices are widely used due to their broad field of view and are free from geographical restrictions [1]. The performance of such devices, particularly their pointing accuracy and stability, is critical for ensuring communication quality and efficiency. However, the in-orbit operation of satellites is subject to numerous disturbances that severely impact pointing performance [2].
Many researchers have investigated the impact of disturbances on pointing accuracy. Zhao et al. [3] modeled the mirror normal pointing error of 2D scanning mirrors and proposed a calibration method considering assembly and datum errors. Zhang et al. [4] examined pointing performance in laser communication systems, incorporating static bias, dynamic jitter, and structural coupling effects. Francesco et al. [5] proposed a dynamic model for flexible space antennas with stringent pointing requirements. Xu et al. [6] developed a pointing performance calibration model for rotation shaft deformation effects.
These studies highlight that manufacturing and installation errors, satellite attitude, internal and external disturbances, and structural flexibility all influence antenna pointing. In practice, such factors often exhibit uncertainty. Fabrication limitations lead to structural uncertainty; installation errors are inevitable; actuating components like control moment gyroscopes [7], Solar Array Drive Assemblies (SADAs) [8], and motors also contain manufacturing- and wear-induced uncertainty. External disturbances, especially thermal fluctuations caused by periodic transitions in and out of Earth’s shadow, can also be modeled probabilistically [9].
Therefore, quantifying the impact of these uncertain parameters on antenna pointing performance is vital for robust design and operation. Despite existing work, a comprehensive framework for assessing uncertainty impact remains underdeveloped. Relevant studies include the following: Hughes [10] conducted original research about the pointing performance uncertainty by the Monte Carlo Simulation (MCS). Huang et al. [11] modeled the pointing error of optical instruments under normally distributed uncertainty errors using the MCS method; Zhang et al. [12] analyzed the influence of static bias error, dynamic jitter, and coupled motion uncertainty on antenna pointing performance, demonstrating that the pointing error of flexible optical components follows the Rayleigh distribution; Fan et al. [13] used generalized Polynomial Chaos (gPC) to model the pointing performance of opto-mechanical systems considering multiple sources of uncertainty errors. Uxia et al. [14,15] studied pointing errors caused by thermal uncertainty in telescope systems and platform thermo-elastic deformation using the Statistical Error Analysis (SEA) method, proposing a thermal design framework of antennas. Janos et al. [16] analyzed uncertainty in the precise pointing control of flexible spacecraft, establishing a pointing model considering structural flexibility, damping ratio, and mass uncertainty by the interval method. Qian et al. [17] used a Back Propagation (BP) neural network to model the uncertainty impact in deployable mechanisms; however, their approach, while precise, required high computational resources, resulting in low feasibility for complex systems with numerous parameters. Jiang et al. [18] applied a fractional-order control method to mitigate uncertain wind-induced pointing errors. Ding et al. [1] studied the pointing performance of space-borne observation platforms considering orbital and attitude errors, as well as platform angular vibrations, using a modified interval method to evaluate the impact of these errors.
There are various uncertainty quantification methods, including Interval Methods [1], SEA [14,15], gPC [13], MCS [10,11], and Point Estimate Method (PEM) [19]. These methods have significant trade-offs between computational efficiency, accuracy, and applicability. For complex systems with many uncertain parameters, surrogate model methods (e.g., gPC) suffer from the curse of dimensionality, whereas MCS maintains dimension-independent convergence but can require a large number of calculations. Interval Methods, while efficient, provide only bounds without probabilistic information. The PEM has a balance in trade-off between efficiency and application.
Another critical challenge in analyzing such complex systems is identifying the key uncertain parameters driving the pointing error, as considering all parameters is inefficient. Global Sensitivity Analysis (GSA) is essential for this screening. Among GSA methods, the Sobol method is particularly suitable as it rigorously quantifies both individual parameter contributions (main effects) and their interactions (total effects), enabling precise ranking of parameter importance and significant dimensionality reduction for subsequent UQ analysis [20]. This is crucial for overcoming the computational bottleneck in multi-parameter uncertainty analysis.
Although both the Sobol global sensitivity analysis and the point estimate method (PEM) are well-established and widely applied in engineering practice, a unified framework that integrates these two approaches for analyzing satellite antenna pointing performance under multi-source uncertainties has been lacking. This manuscript addresses this methodological gap by proposing the GSA-PEM Integrated Framework, which systematically and efficiently combines Sobol sensitivity analysis with the PEM. The framework enables a comprehensive probabilistic characterization of antenna pointing accuracy while capturing the influence of various uncertainty sources. Its effectiveness and computational efficiency are validated through comparisons with the Maximum Entropy–Fractional Moment (ME-FM) method [21] and MCS, demonstrating the advantages of the GSA-PEM approach in both reliability prediction and computational cost.
This paper is organized as follows: The general antenna pointing model is proposed in Section 2. The theoretical foundations of the GSA-PEM Integrated Framework are introduced in Section 3. In Section 4, the accuracy and efficiency of the proposed framework are validated through two progressively complex examples considering different satellite body-to-antenna connection configurations, with comparisons made against mainstream uncertainty quantification (UQ) methods. This paper is concluded in Section 5.

2. Structure Description, Kinematic Model, and Pointing Model

To analyze the reliability of the antenna pointing performance, the essential step is to establish the antenna pointing model. The first step is creating the kinematics model of the satellite. Then, the new model is established by combining the kinematics model with the antenna pointing model to analyze the influence of uncertain parameters on the antenna pointing performance.

2.1. Structure of the Satellite

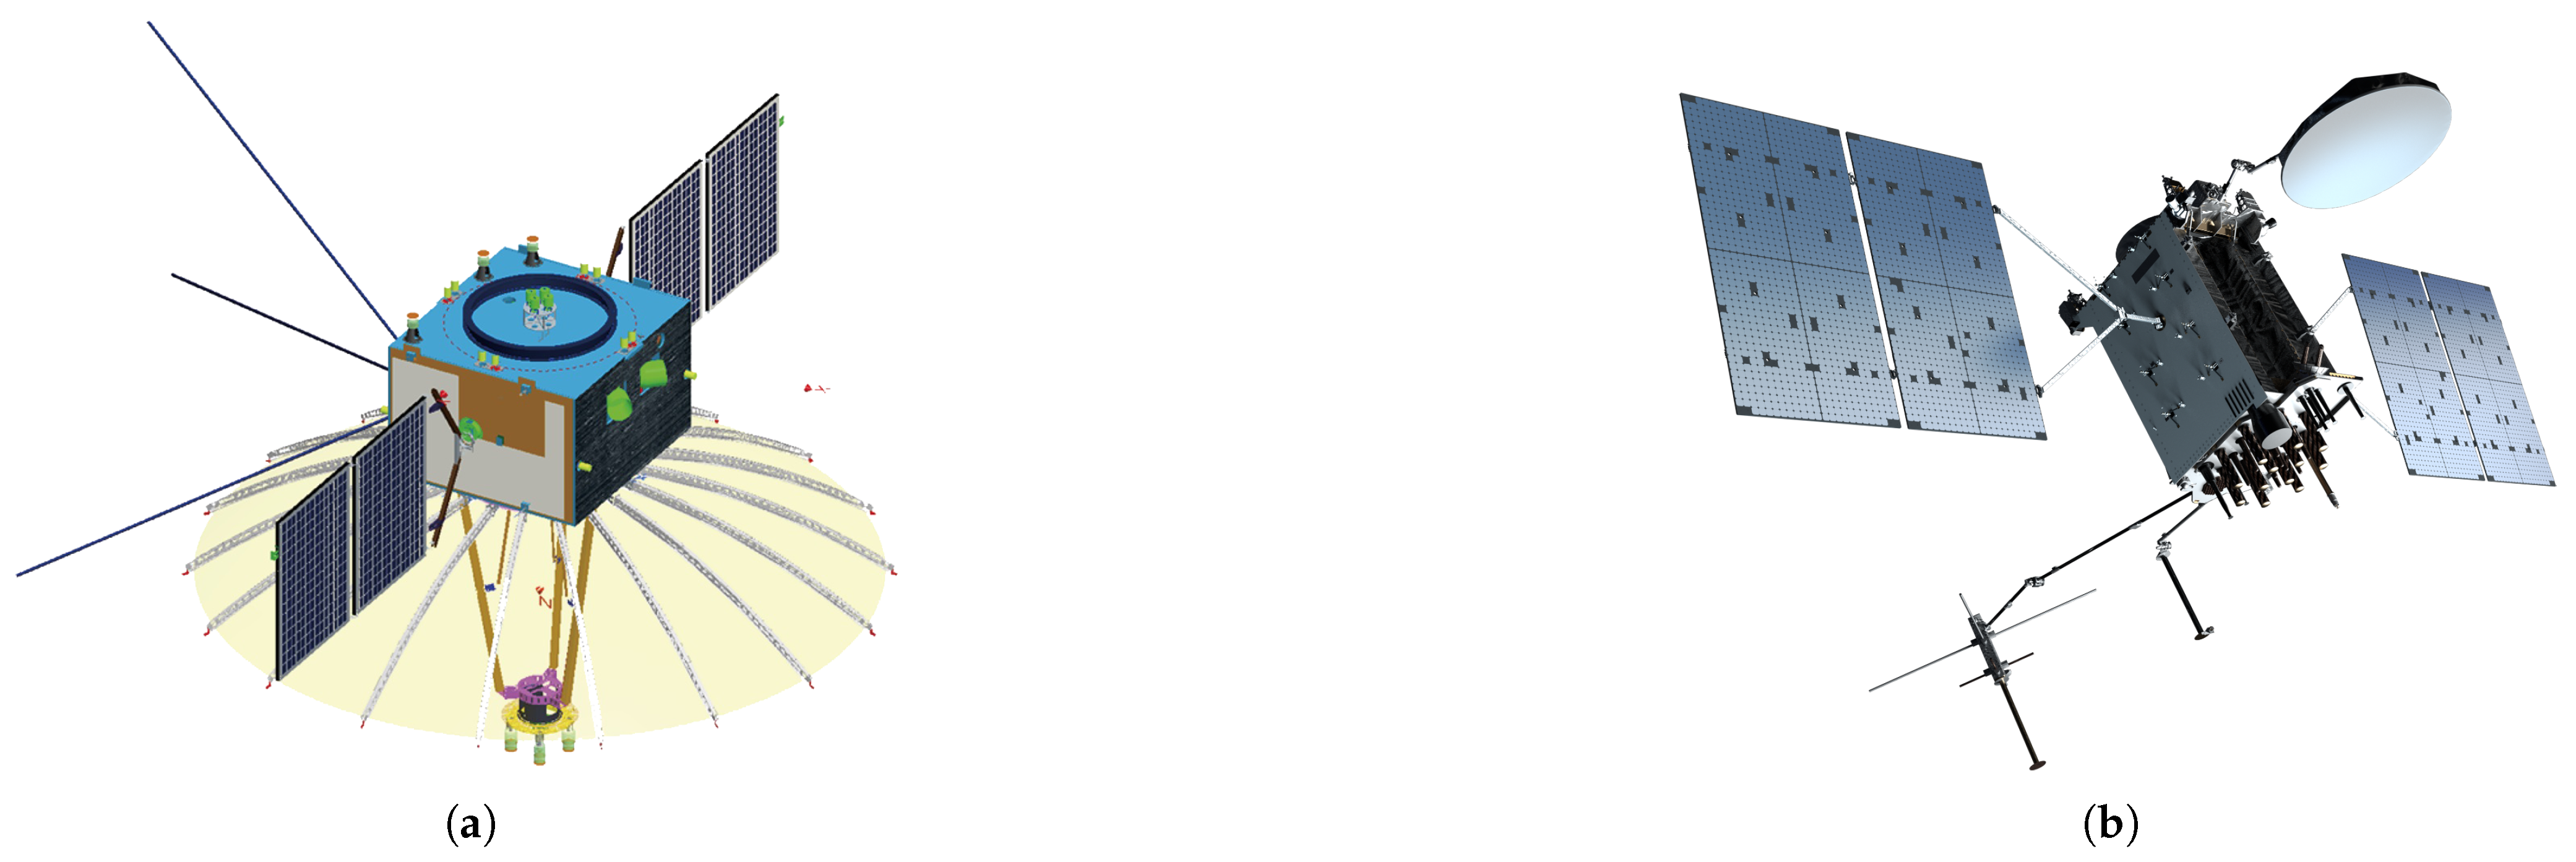
Figure 1 shows the common satellite structure models. The satellite is divided into two parts: the payloads and the mainbody. The payload is the core component of a satellite that realizes various functions such as communication, imaging, observation, etc. The mainbody is the support and service system of the satellite, which provides many capabilities, such as real-time calculation, energy management, attitude adjustment, etc. Satellite structures typically comprise a mainbody and a payload. Two primary connection configurations exist between these components: a rigid connection (Figure 1a), or a linkage mechanism with rotating shafts permitting payload motion relative to the mainbody (Figure 1b). These distinct configurations differentially impact antenna pointing performance, a critical communication system evaluation metric. Establishing an antenna pointing model constitutes the essential first step in analyzing this performance.

2.2. Kinematic Model of the Satellite

To quantify the influence of different parameters on the satellite antenna pointing performance, the first step is to establish the kinematic model of the satellite system. This model defines the interactions between the various components that influence the antenna pointing performance. The transformation sequence between coordinate systems is illustrated in Figure 2. The rotation matrices corresponding to the three coordinate axes are provided as follows:
R o t x ( α ) = 1 0 0 0 cos ( α ) sin ( α ) 0 sin ( α ) cos ( α )
R o t y ( β ) = cos ( β ) 0 sin ( β ) 0 1 0 sin ( β ) 0 cos ( β )
R o t z ( γ ) = cos ( γ ) sin ( γ ) 0 sin ( γ ) cos ( γ ) 0 0 0 1
where R o t i ( · ) represents the rotation matrix around the i-axis, with α , β , and γ being the rotation angles of the coordinate system around the x, y, and z axes, respectively.
The rotation between two adjacent coordinate systems Σ i 1 and Σ i is shown in Figure 2. The transformation matrix between two coordinate systems is given as follows:
T i i 1 = R o t x ( α ) R o t y ( β ) R o t z ( γ )
The transformation matrix between the first coordinate system to the last coordinate system is given as follows:
T = T 2 1 · T 3 2 T i i 1
where the 1 , 2 , 3 is the coordinate system symbol of each coordinate.

2.3. Pointing Model of the Satellite System

The accuracy of satellite antenna pointing is critical for the overall performance of communication systems, as it directly influences signal quality and reliability. The pointing error is defined as the angular deviation between the ideal pointing vector, v ideal , and the actual pointing vector, v real .
After the kinematic model has been established, the next step is to identify the sources of errors that may influence the pointing performance of the antenna. In this paper, the factors that affect antenna pointing performance are divided into two categories:
  • Err I : Errors from the satellite system include attitude misalignments, installation shaft rotation errors, and similar factors, represented by the transformation matrix T A I .
  • Err II : Errors from the antenna, including reflector deformation and feed lateral displacement, modeled by the transformation matrix T R e f A .
The influence of these two types of errors on the antenna pointing performance is illustrated in Figure 3.
As shown in Figure 3, the ideal pointing vector v ideal can be obtained by the summation of pointing vectors in two sub-systems without error, i.e., v ideal = v i _ I + v i _ II . The v real is the real pointing vector, in which the two kinds of error shown above are considered, the v real = v r _ I + v r _ II . The transformation matrix between the inertia coordinate system and the reflector coordinate system is given as follows:
T R e f I = T A I ( Err I ) · T R e f A ( Err II )
where the superscript I means the Inertia coordinate system, the superscript A means the Antenna coordinate system, and R e f means the Reflector coordinate system.
The Err I i i 1 is the error vector between two adjacent coordinate system Σ i 1 and Σ i is given as [ α i + Δ α i , β i + Δ β i , γ i + Δ γ i ] , where α i , β i , γ i is the rotation angle and Δ α i , Δ β i , Δ γ i is the error of each axis, respectively. The coordinate system transformation matrix that considers the first type error Err I is given as Equation (7).
T A I ( Err I ) = T 2 I ( Err I 2 I ) · T 3 2 ( Err I 3 2 ) · T A n 1 ( Err I A n 1 ) = R x ( α 1 + Δ α 1 ) · R y ( β 1 + Δ β 1 ) · R z ( γ 1 + Δ γ 1 ) · R x ( α n + Δ α n ) · R y ( β n + Δ β n ) · R z ( γ n + Δ γ n )
where Err I = [ Err I 2 I ,   Err I 3 2 , ,   Err I A n 1 ] is the error vector. There are n 1 transformation matrices in total.
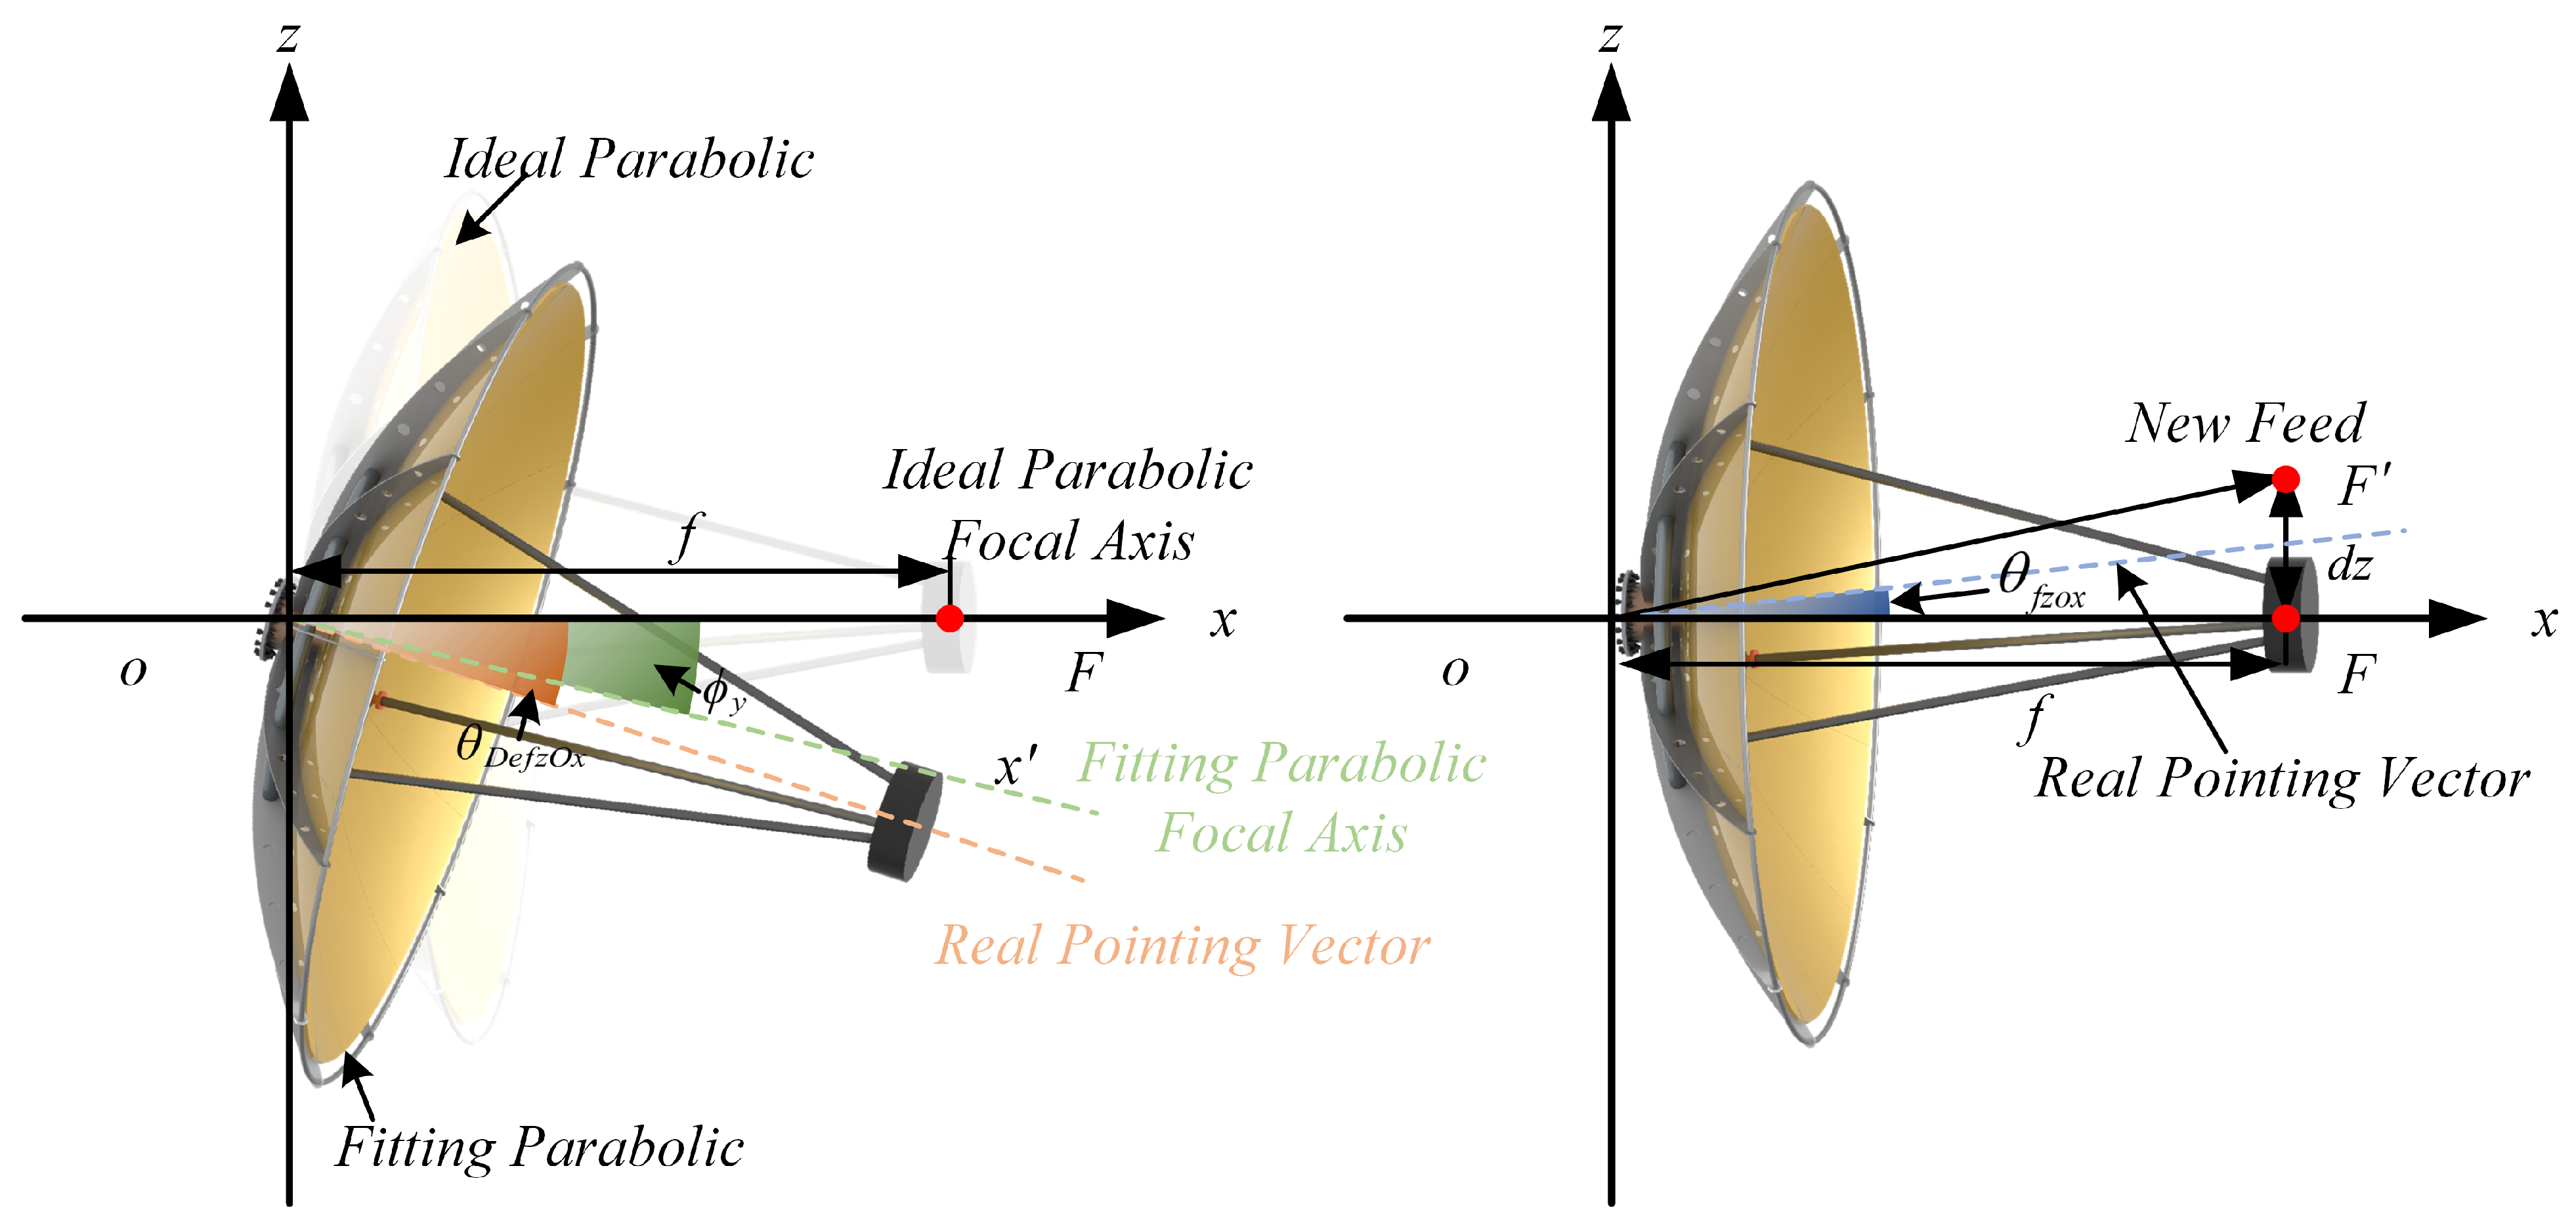
The Err II arises from the deformation of the reflector and the feed lateral displacement perpendicular to the focal axis, which has been researched by Zhang et al. [4] and Mei et al. [24]. The pointing error resulting from reflector deformation in the z O x plane is illustrated in Figure 4.
As illustrated in Figure 4, the x-axis represents the focal axis of the ideal reflector, while x denotes the focal axis of the best-fitting reflector of the deformed reflector. O is the apex. The pointing error in the zOx plane is given as follows:
θ D e f z O x = ( 1 + K w ) ϕ y
Similarly, the pointing error in the zOy plane is given as follows:
θ D e f y O x = ( 1 + K w ) ϕ z
where K w is the beam deviation factor [25], and ϕ y and ϕ z represent the rotational angles of fitting parabolic relative to the ideal parabolic around the y-axis and z-axis, respectively.
The pointing error caused by feed lateral displacement is shown in Figure 4. The pointing error in the z O x plane and the y O x plane is given as follows:
θ f z O x = d z · K w f
θ f y O x = d y · K w f
where d y and d z are the feed lateral displacement in the focal plane along the y -axis and z -axis, respectively.
The pointing error resulting from reflector deformation and the feed lateral displacement is defined as the angular deviation between the v r _ II and the ideal pointing vector v i _ II projected on the y O x and z O x plane. The pointing errors in the y O x and z O x planes are given as follows:
θ R e f y O x = θ D e f y O x + θ f y O x
θ R e f z O x = θ D e f z O x + θ f z O x
The transformation matrix between Σ R e f and Σ A is given as Equation (14).
T R e f A = R o t x ( 0 ) · R o t y ( θ R e f z O x ) · R o t z ( θ R e f y O x ) = T R e f A ( Err II )
where the x axis is the focal axis and the rotation angle around it is 0, the θ R e f z O x is the rotation angle around the y-axis, and the θ R e f y O x is the rotation angle around the z-axis.
The transformation matrix containing the first and second types of errors is given in Equation (15).
T R e f I ( Err I , Err II ) = T 2 I ( Err I 2 I ) · T 3 2 ( Err I 3 2 ) · T A n 1 ( Err I A n 1 ) · T R e f A ( θ R e f y O x , θ R e f z O x ) = T A I ( Err I ) · T R e f A ( Err II )
where Err II = [ θ R e f y O x , θ R e f z O x ] .
The ideal pointing vector v ideal is the focal vector as both error vectors Err I and Err II are 0 . The v ideal in the inertia coordinate system is as follows:
v ideal = T R e f I ( 0 , 0 ) · f
where f is the focal vector of antenna in Σ R e f .
The real pointing vector v real is the deviation from the ideal pointing vector v ideal influenced by the Err I and Err II , which is given as follows:
v real = T R e f I ( Err I , Err II ) · f
The pointing error θ considers two types of errors and is given in Equation (18).
θ = acos ( v real · v ideal | | v real | | · | | v ideal | | )

3. Theoretical Foundation of GSA-PEM Integrated Framework

In Section 2, a mathematical model was developed to describe the antenna pointing performance in the presence of the uncertain parameters. The first step in evaluating the pointing performance under the effect of multiple uncertain parameters is to determine the sensitivity of the antenna pointing performance to each uncertain parameter. The sensitivity analysis is an effective way to solve this problem. In this section, the Sobol sensitivity analysis method is performed to evaluate the influence of uncertain parameters on the antenna pointing performance. Sobol sensitivity analysis provides a global, model-independent assessment of input impacts, capturing both main and interaction effects [26]. It is well-suited for complex, nonlinear models and offers clear, quantitative results for decision making and model simplification.
To evaluate the reliability of antenna pointing performance under uncertainty, its statistical moments are needed. The PEM is adopted due to high efficiency, ease of implementation, and suitability for complex or black-box models [19]. Compared to the MCS, the PEM requires far fewer function evaluations, reducing computational cost, which is crucial for expensive models. PEM avoids derivative dependence, enhancing robustness for nonlinear systems. It also eliminates the need for complex sampling or surrogate modeling [27], making it well-suited for rapid reliability and sensitivity analyzes in early-stage engineering. Thus, PEM enables efficient computation of performance moments, supporting fast and practical reliability assessments.

3.1. Sensitivity Analysis of Pointing Performance

The Sobol sensitivity analysis method is employed to evaluate the influence of uncertain parameters on the antenna pointing performance [20]. This approach is suitable for both linear and nonlinear models [17]. The procedure of the Sobol sensitivity analysis method is given below.
Consider the function g ( x ) , which is square integrable within the unit hypercube H n = [ 0 , 1 ] n with the Lebesgue measure d x = d x 1 d x n [28]. The relationship between the input and output can be expressed by Equation (19).
Y = g ( x )
where Y represents the antenna pointing performance and x = [ x 1 , x 2 , , x n ] T denotes the n-dimensional vector of uncertainty inputs. The function g ( · ) describes the mapping from the uncertain parameters to the output (pointing performance). For this study, the uncertain parameters are assumed to be independent. The ANOVA (Analysis of Variance) decomposition [28] of the function g ( x ) is expressed as follows:
Y = g ( x ) = g 0 + s = 1 n i 1 < < i s g i 1 , , i s ( x i 1 , , x i s )
where g 0 represents the mean value of the antenna pointing performance, and is given as follows:
g ( x ) d x = g 0
And
0 1 g i 1 , , i s ( x i 1 , , x i s ) d x i p = 0
where p = 1 , 2 , , s .
Combining Equation (21) to Equation (22), Equation (20) can be rewritten as Equation (23).
g ( x ) = g 0 + i g i ( x i ) + i < j g i j ( x i , x j ) + + g 1 , 2 , n ( x 1 , x 2 , , x n )
The total variance of antenna pointing performance is given as follows:
D = H n g 2 ( x ) d x g 0 2
The partial variance D i 1 , , i s is given as follows:
D i 1 , , i s = H n g i 1 , , i s 2 ( x i 1 , , x i s ) d x
The relationship between partial variances and total variance is given as follows:
D = s = 1 n i 1 < < i s D i 1 , , i s
The global sensitivity index to measure the effect of parameters is given as follows:
S i 1 , , i s = D i 1 , , i s D
where S i = D i / D is the sensitivity index of the output Y to the individual factor x i , and S i , j = D i , j / D means the sensitivity index of the output Y to the two factors x i and x j . To evaluate the total influence of x i , the total partial variance is given as follows:
D i t o t = < i > D i 1 i n
where the < i > considers all subsets of indices satisfying 1 i 1 < < i s n for 1 s n that one of the indices equals i. The total sensitivity index for x i is then calculated as follows:
S i t o t = D i t o t D
If S i t o t = 0 , the input factor x i does not affect the output Y. This sensitivity index is used to rank the effect of each input parameter x i on the output Y [20]. The total sensitivity index S i t o t is used to evaluate the influence of the uncertain parameters on the output.
While the Sobol framework rigorously defines first-order and total-effect indices via variance decompositions, their direct computation requires evaluating multidimensional integrals, which is hard to deal with for complex and high-dimensional models. Consequently, the sensitivity indices of these complex models are obtained by the Saltelli sampling method in practice, which replaces the intractable integrals with a structured Monte Carlo procedure.
The Saltelli sampling method serves as an efficient Monte Carlo estimator for Sobol’s global sensitivity indices (both first-order and total-effect) by replacing the multidimensional integrals in Equation (21) to Equation (25) with simple sample-based averages [29].
The Saltelli sampling method begins with drawing two independent N × n sample matrices A and B (where N is the number of samples and n is the number of input parameters). If the inputs x i follow arbitrary distributions, one may sample uniform variables u i U ( 0 , 1 ) and set x i = F X i 1 ( u i ) , where F X i 1 is the inverse cumulative distribution function of X i , and if inputs are statistically dependent, one can employ a Rosenblatt or Nataf transform (copula-based) to generate correlated samples. For each input x i , a mixed matrix A B ( i ) is constructed by replacing the ith column of A with that of B. The model y = g ( x ) is then evaluated on A, B and each A B ( i ) , producing output Y A , Y B and Y A B ( i ) . The sample variance computed by Y A is given as Equation (30).
V a r ^ ( Y A ) = 1 N 1 k = 1 N ( Y A ( k ) Y A ¯ ) 2 , Y A ¯ = 1 N k = 1 N Y A ( k )
The first-order index S ^ i and total-effect index S ^ i t o t are then estimated by Equation (31).
S ^ i = 1 N k = 1 N Y B ( k ) ( Y A B ( i ) ( k ) Y A ( k ) ) V a r ^ ( Y A ) , S ^ i t o t = 1 2 N k = 1 N ( Y A B ( i ) ( k ) Y A ( k ) ) 2 V a r ^ ( Y A )
The equations above require only ( n + 2 ) N model evaluations to capture both main effects and all interaction effects without explicit multidimensional integration.

3.2. Point Estimate Method

The next step is to estimate the statistical moments of the antenna pointing performance. Many methods have been proposed to calculate the statistical moments, considering the input uncertainty. The PEM is used to approximate the moments of the pointing performance of the antenna. This method is convenient and effective for analyzing the influence of uncertain parameters on the statistical characteristics of the output [19].
The relationship between the input uncertain parameters and the output can be represented as follows:
Y = g ( x )
where Y denotes the output, g ( · ) represents the relation between the input and output. x = [ x 1 , , x n ] is the input vector. If there is only one input, i.e., x = [ x ] , the moment of Y = g ( x ) is estimated as [30] following equations.
μ g = l = 1 m P l g ( T 1 ( u l ) )
σ g 2 = l = 1 m P l ( g ( T 1 ( u l ) ) μ g ) 2
α k g σ g k = l = 1 m P l ( g ( T 1 ( u l ) ) μ g ) k ,   k > 2
where μ g , σ g , α k g are the mean, standard deviation (SD), the k th dimensionless central moment of Y = g ( x ) , respectively. u 1 , , u l , , u m and P 1 , , P l , , P m are the estimating points and corresponding weights, respectively.
T 1 ( u l ) means the inverse function of the normalized transformation function of the basic variable x with arbitrary distribution, and the corresponding value of x at point u l is x l . If x follows a normal distribution with mean μ x and SD σ x , the x l is given as Equation (36). If x is a non-normal variable with a distribution function F X ( x l ) , the expression F X ( x l ) = Φ ( u l ) for approximate equivalent normalization can be used to obtain x l = T 1 ( u l ) = F X 1 ( Φ ( u l ) ) corresponding to the standard normal point u l , where Φ ( · ) is the distribution function of the standard normal variable [19].
x l = T 1 ( u l ) = μ x + u l σ x
The calculation procedure of u l and P l has been proposed in [19], and the influence of estimating point number m = 5 and m = 7 was also investigated. The values of u l and P l with estimating points number m = 5 and m = 7 are shown in Table 1 and Table 2.
If there are multiple uncertain inputs, i.e., Y = g ( x ) , x = [ x 1 , , x i , , x n ] , the function Y = g ( x ) can be approximated as follows:
Y = g ( x ) g ( x ) = i = 1 n ( g i g μ ) + g μ
g μ = g ( T 1 ( u μ x 1 , , u μ x n ) )
g i = g ( T 1 ( U i ) ) = g ( T 1 ( u μ x 1 , , u i , , u μ x n ) )
where g μ means that all inputs are equal to their mean values, which is a constant. The g i in Equation (39) means only u i is the random variable vector, while the other inputs are equal to their mean value in the standard normal space. The first four central moments of Equation (37) is given as follows:
α 1 g = i = 1 n ( μ g i g μ ) + g μ
α 2 g = σ g = ( i = 1 n σ g i 2 ) 1 2
α 3 g = i = 1 n α 3 g i σ g i 3 / σ g 3
α 4 g = ( i = 1 n α 4 g i σ g i 4 + 6 i = 1 n 1 j > 1 n σ g i 2 σ g j 2 ) / σ g 4
where μ g i , σ g i , α 3 g i , and α 4 g i are the mean, SD, skewness and kurtosis of g i . The moments of g i are shown from Equation (40) to Equation (43), which can be calculated by substituting Equation (38) and Equation (39) into the following Equation (44), Equations (45) and (46) that given as follows:
μ g i = l = 1 m P l g i ( μ x 1 , , x i , l , , μ x n )
σ g i 2 = l = 1 m P l ( g i ( μ x 1 , , x i , l , , μ x n ) μ g ) 2
α k g i σ g i k = l = 1 m P l ( g i ( μ x 1 , , x i , l , , μ x n ) μ g ) k ,   k > 2
For the ith variable, the relation between x i , μ i , σ i and u l shown in Equation (38) becomes the following:
x i , l = μ x i + σ x i u l
where the former subscript i is the number of inputs and the latter one l is the number of sample points, while other inputs are set as their mean value μ x i .
Using the method described in this section, the uncertainty problem of how n uncertain inputs affect the output can be transformed into a deterministic problem requiring a total of k × m × ( n + 1 ) calculations, where k is the order of moment, m is the number of sample points, and n is the number of inputs [30]. The moments obtained above can be used for the reliability analysis.

3.3. Analysis Procedure of GSA-PEM Integrated Framework

This section outlines a structured analysis procedure based on the proposed GSA-PEM Integrated Framework, which combines global sensitivity analysis (GSA) and the point estimate method (PEM) to quantify and evaluate antenna pointing performance under uncertainty. The procedure incorporates system modeling, sensitivity screening, statistical moment estimation, and reliability evaluation, as shown in Figure 5. The analysis process is given below.
  • Define Uncertain Input Parameters and Distributions:
    Identify all relevant uncertain input variables (e.g., structural misalignments, antenna installation error, feed displacement) and assign appropriate probability distributions. The statistical characteristics, such as the mean and SD, are determined based on measurement data or design tolerances.
  • Construct the Kinematic and Pointing Model:
    Develop the satellite kinematic model by sequentially linking adjacent components through rotation matrices as shown in Equation (1) to Equation (4), and assemble the complete transformation matrix according to Equation (5). This provides the structural basis for analyzing pointing behavior.
  • Incorporate System and Antenna Errors:
    Embed the satellite system errors Err I and antenna-specific errors Err II into the transformation chain. The resulting transformation under uncertainty is described in Equation (6), with its components detailed in Equations (7) and (15). The real and ideal pointing vectors, v real and v ideal , are computed using Equation (16) and Equation (17), respectively. The pointing error θ is then defined by Equation (18).
  • Perform Global Sensitivity Analysis (GSA):
    Apply the Sobol method to decompose the output variance based on the model defined in Equation (18), following Equations (20)–(22). The total variance and partial variance are computed using Equation (24) and Equation (25), respectively. The total contribution of each input variable x i is obtained using Equation (28), and the sensitivity indices are calculated by substituting Equation (26) and Equation (28) into Equation (29). For high-dimensional or black-box models, where analytical decomposition is intractable, employ the Saltelli sampling method in conjunction with Monte Carlo simulation. The numerical variance and sensitivity index of x i can then be estimated using Equations (30) and (31). Parameters with negligible sensitivity indices are filtered out at this step.
  • Estimate Statistical Moments Using PEM:
    Approximate the antenna pointing performance function as shown in Equation (32). For single-variable cases, compute the statistical moments using Equations (33)–(35). For multiple-variable input, use Equation (37), where the deterministic central estimate g μ is evaluated via Equation (38). The estimation points for each variable x i are derived using Equation (47), while the corresponding mean, SD, and higher-order moments are computed from Equations (44)–(46). Substituting μ g i , σ g i , and α k g i into Equations (40)–(43) yields the moments of the pointing error.
  • Conduct Reliability Analysis:
    Based on the estimated statistical moments, evaluate the probability that the pointing error remains within a specified tolerance. This reliability metric quantifies the system’s performance robustness under uncertainty and supports decision making in design and risk assessment.

4. Examples and Discussion

Based on the method proposed in the previous section, two examples are analyzed and discussed in this section. These two examples aim to achieve the method efficiency and accuracy validation and to expand the application scenario.
Case I considers a satellite in which the antenna is rigidly fixed to the main body. The sensitivity indices of the uncertain input parameters are evaluated using the Sobol method, and the statistical moment results obtained via the proposed GSA-PEM framework are compared against those from the MCS and ME-FM methods for validation. In Case II, the satellite model incorporates a dual-axis driving mechanism between the main body and the antenna, allowing for variable pointing directions through two rotational degrees of freedom. The sensitivity indices of all inputs are analyzed across a representative imaging region, and the moment-based performance metrics are computed and compared with MCS results. In both cases, the antenna is assumed to be a parabolic reflector with a diameter of 1.0 m, a focal length of 0.5 m, and a depth of 0.125 m, which is a common configuration in space-based communication systems.
These two examples are designed to evaluate the adaptability of the GSA-PEM framework in practical satellite imaging scenarios. Case I represents a relatively simple system where an analytical formulation of the pointing model is tractable, whereas Case II introduces higher complexity due to more uncertain parameters and geometric variability, making analytical derivation difficult. To ensure consistency in the analysis methodology, both cases are studied using numerical simulations rather than closed-form analytical expressions.

4.1. Case I

4.1.1. Kinematic Model and Sensitivity Analysis

Figure 6 shows the satellite model and coordinate systems. The parabolic antenna is fixed on the mainbody. The kinematic parameters are shown in Table 3. The position vector and rotation angle of each coordinate system are relative to the coordinate system above. The coordinate systems are shown in Figure 6.
Table 4 gives the uncertain parameters in Case I.
In Table 4, Δ α , Δ β , and Δ γ are the attitude uncertainty of the satellite in the x-axis, y-axis and z-axis, respectively. Δ A α , Δ A β , and Δ A γ are the assembly errors of the antenna in each axis. ϕ x and ϕ y are the rotation angles caused by reflector deformation of the antenna, as shown in Equations (8) and (9). d x and d y are the feed displacement perpendicular to the focal axis of the antenna, and the pointing error caused by feed lateral displacement are shown in Equations (11) and (10).
The transformation between the reflector coordinate system Σ R e f and the antenna coordinate system Σ A can be derived using Equation (14). The error vector Err I is determined by the uncertain parameters Δ α , Δ β , Δ γ , Δ A α , Δ A β , and Δ A γ , the related transformation matrix is shown in Equation (7). The error vector Err II is determined by the uncertain parameters ϕ x , ϕ y , d x and d y . The related transformation matrix of error vector Err II is defined by Equation (15). By substituting Err I and Err II into Equations (16) and (17), the mathematical expression of pointing performance in Equation (18) can be derived.
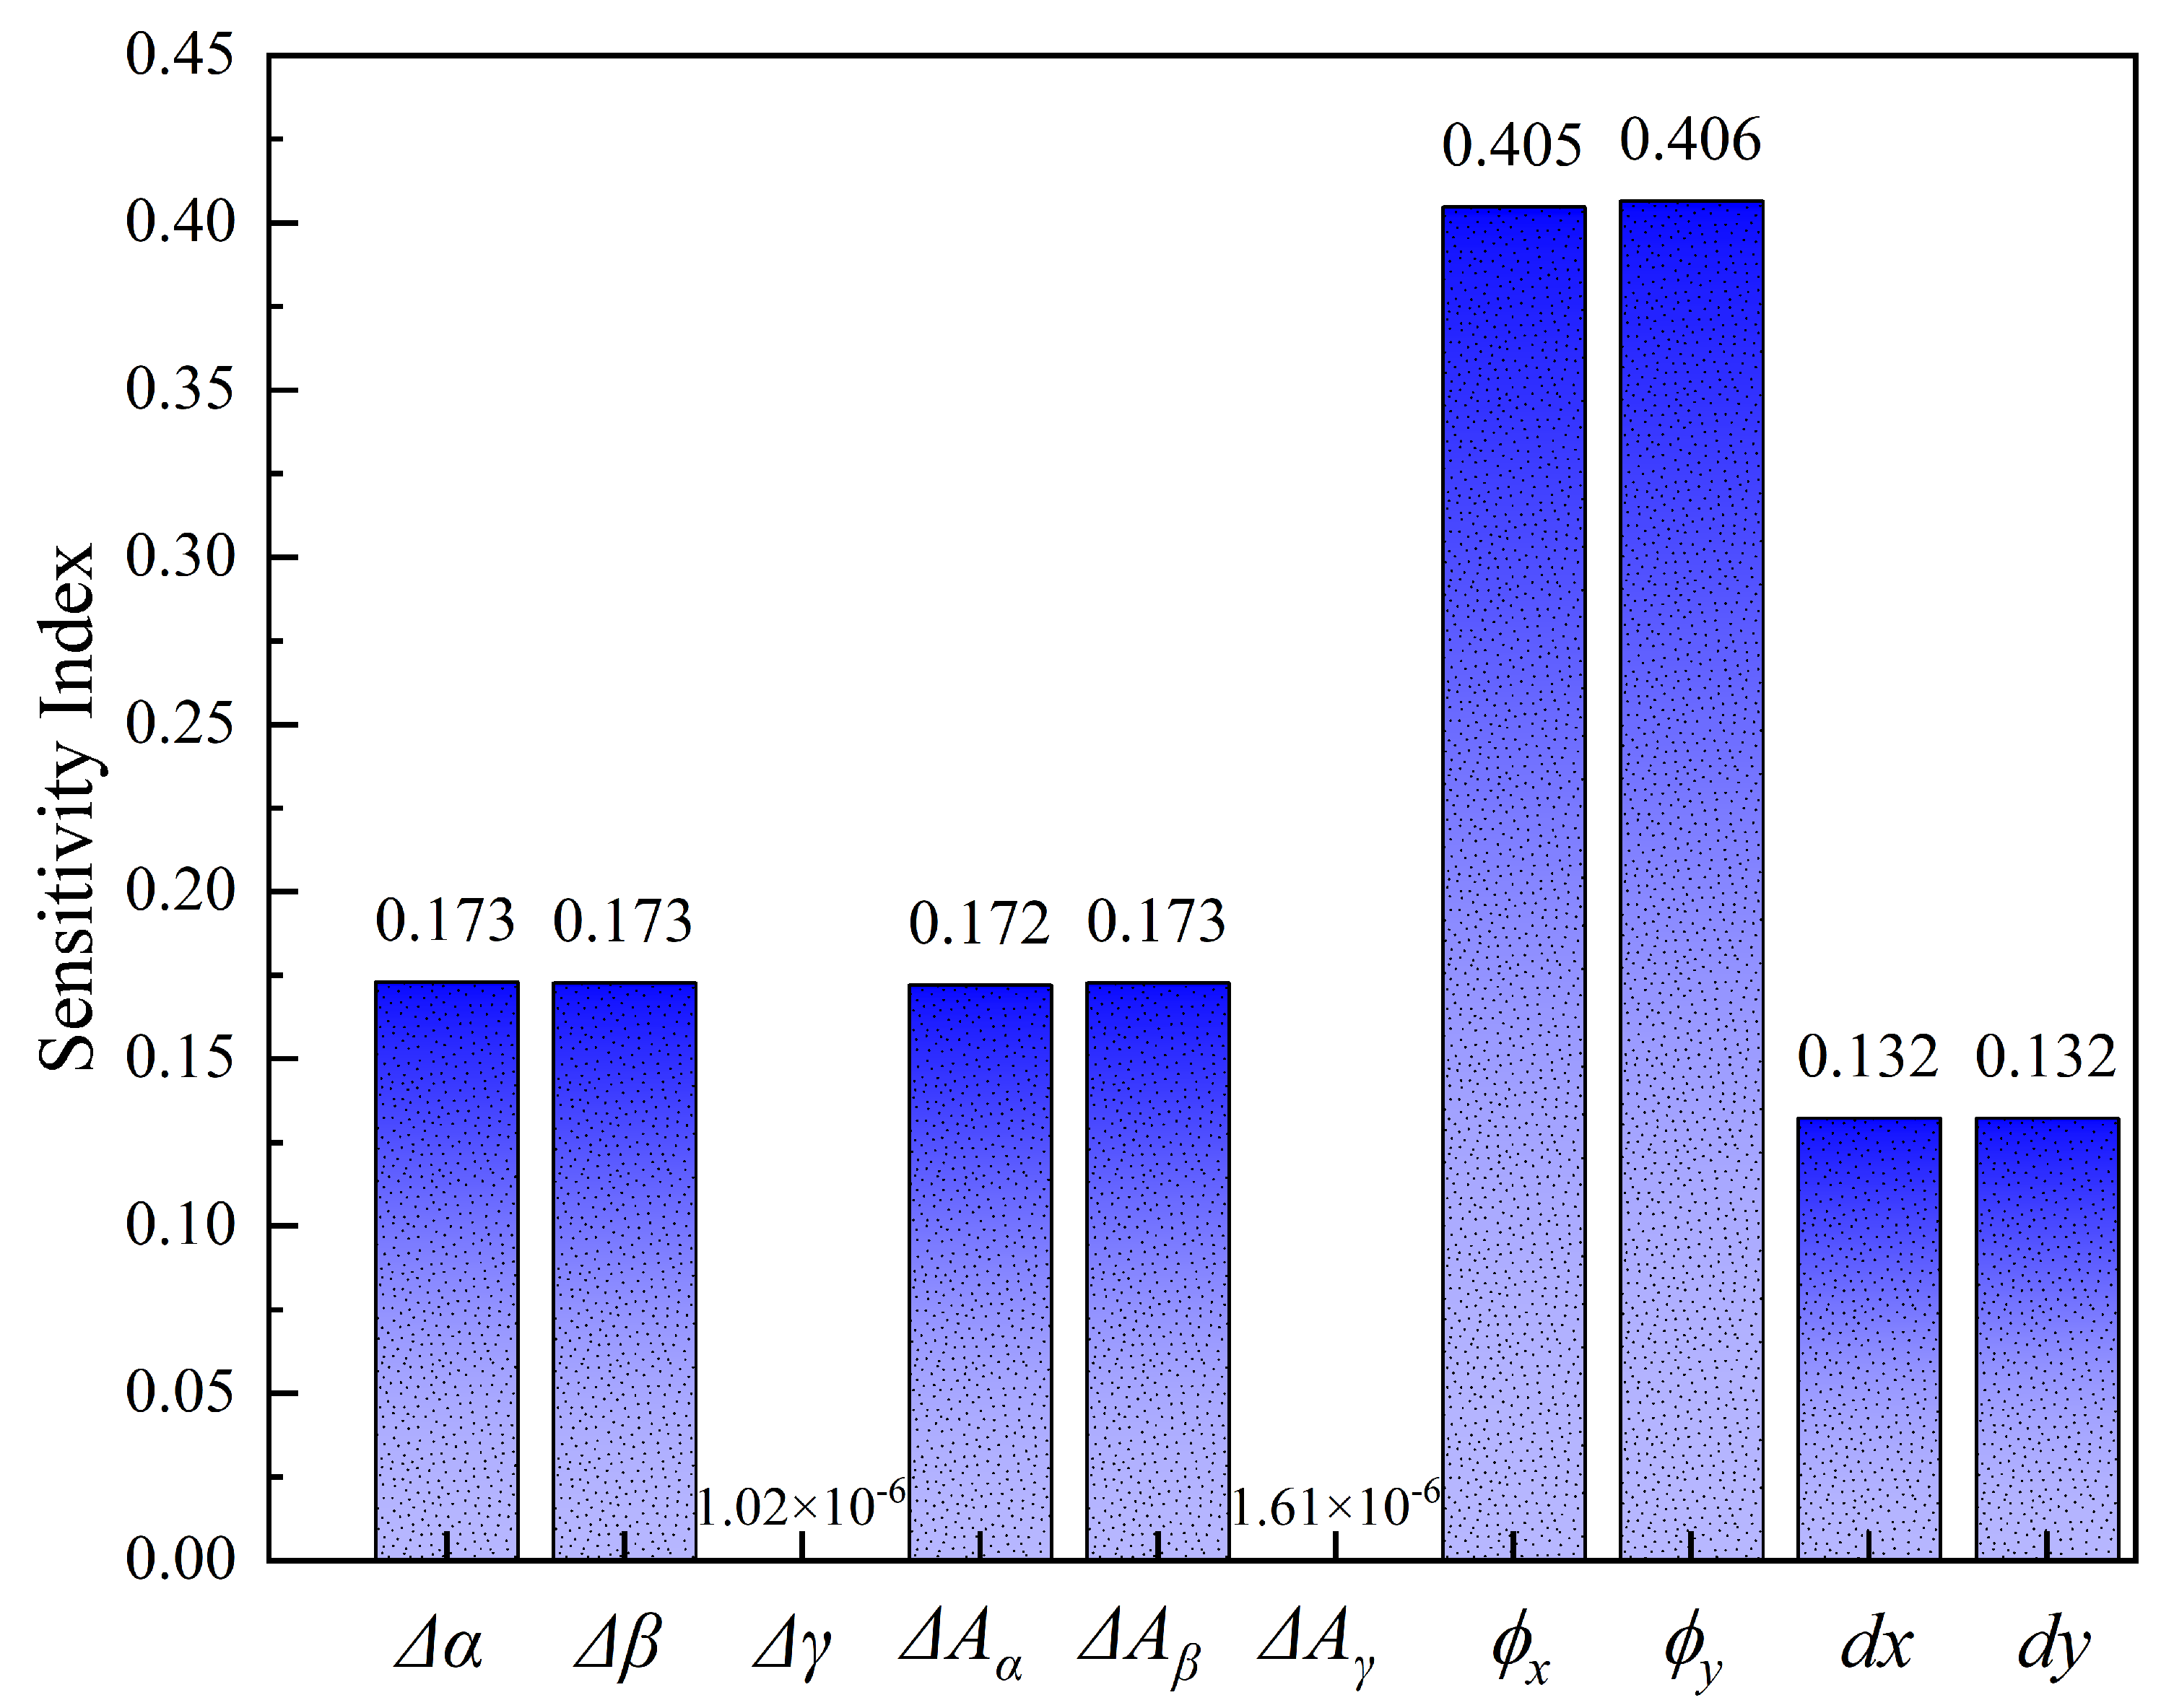
The expression between errors and the antenna pointing performance is obtained above. The sensitivity index of the antenna pointing performance to each uncertain parameter can be derived by substituting the pointing expression into Equation (19) to Equation (29), which is shown in Figure 7.
As illustrated in Figure 7, the sensitivity analysis indicates that the rotations around the focal axis, namely Δ γ and Δ A γ , have no noticeable impact on the antenna pointing performance. The effects of Δ α and Δ β are found to be equivalent to those of Δ A α and Δ A β , suggesting similar influence from both platform and antenna orientation adjustments. The reflector rotations, represented by ϕ x and ϕ y , exhibit a more significant effect on pointing accuracy. In comparison, the translational deviations d x and d y show less influence, as evidenced by their relatively smaller standard deviations. Furthermore, it is observed that factors located closer to the payload tend to have a greater impact on the antenna pointing performance than those situated farther away ( d x and d y are included since their variances are only 1% of the other parameters).
The uncertain attitude angles about the x-axis and y-axis ( Δ α and Δ β ) are both perpendicular to the focal axis and each other, which affects the antenna pointing identically and leads to equal sensitivity indices; likewise, the antenna assembly errors Δ A α and Δ A β have symmetric effects. This symmetry reflects a form of rotational invariance in this model that disturbances symmetric about the focal axes produce equivalent pointing deviations. The slight differences observed in the sensitivity indices are primarily due to numerical rounding and computational precision. The Δ α , Δ β , Δ A α , Δ A β , ϕ x , ϕ y , d x , and d y are chosen for reliability analysis.

4.1.2. Reliability Analysis

The reliability of the antenna pointing performance with uncertain parameters is analyzed by the first and second-order moments. The expression of antenna pointing performance can be approximated by Equation (37). The constant g μ is calculated by substituting the mean value of uncertain parameters shown in Table 4 into Equation (38). The sample points of the ith parameter are given by Equation (47). The moments of each uncertain parameter are given by Equation (44) to Equation (46). The mean and SD of the antenna pointing performance can be calculated by substituting the moments of the ith parameter into Equation (40) into Equation (43).
The first two moments of antenna pointing performance are calculated using the MCS method and the ME-FM method to validate the precision of the GSA-PEM. The ME-FM method is a statistical technique that reconstructs probability density functions by maximizing entropy subject to fractional-order moment constraints [31]. Compared to traditional methods, ME-FM can better capture the characteristics of heavy-tailed or skewed distributions, making it suitable for complex uncertainty propagation problems such as those encountered in antenna pointing performance analysis. The comparison of moments is given in Table 5.
As presented in Table 5, the mean and SD of antenna pointing performance are computed using the GSA-PEM framework with m = 5 and m = 7 sample points, the Monte Carlo Simulation (MCS), and the Maximum Entropy–Fractional Moment (ME-FM) method. The results indicate that GSA-PEM with m = 7 achieves the highest accuracy among the non-MCS methods, with only 2.076% error in the mean and 1.315% in the SD, closely approaching the MCS benchmark. In contrast, ME-FM exhibits larger errors of 2.422% and 1.974%, respectively, while GSA-PEM with m = 5 shows reduced accuracy but still acceptable performance.
In terms of computational cost, the advantage of the GSA-PEM framework is evident: MCS requires 10 6 function evaluations, while GSA-PEM achieves comparable accuracy with only 124 evaluations at m = 7 , and 90 at m = 5 . Although ME-FM is more accurate than GSA-PEM ( m = 5 ) , it is not as accurate as GSA-PEM ( m = 7 ) and requires 300 evaluations. These comparisons demonstrate that the GSA-PEM achieves a favorable trade-off between accuracy and efficiency, especially when using m = 7 . Furthermore, the estimated statistical moments can be used to construct the corresponding Probability Density Function (PDF) and Cumulative Distribution Function (CDF), supporting further reliability analysis.
To validate the distribution of the antenna pointing performance, the p-value are used to determine what probability distribution the antenna pointing performance follows. Table 6 shows the p-values of different distributions. The Q-Q graph of the antenna pointing performance in different distributions is shown in Figure 8.
The p-value and Q-Q graph of the result are shown in Table 6 and Figure 8. The p-value of the Weibull distribution is greater than 0.05, and the antenna pointing performance is verified as most likely to follow the Weibull distribution with k 2 , which can be considered as the Rayleigh distribution. The PDF and CDF of the antenna pointing performance are illustrated below.
The PDF and CDF obtained by the GSA-PEM ( m = 5 and m = 7 ) , the ME-FM method [32] and the MCS method are shown in Figure 9. The blue dot, green dashed line, red solid line and black solid line are the result of the MCS method, the ME-FM method, the GSA-PEM ( m = 7 ) and the GSA-PEM ( m = 5 ), respectively. This figure shows that the PDF and CDF curves of the proposed framework match the result of the MCS method better than the ME-FM. The comparison between two sample points shows that the increase in sample points can make the result more accurate.
The reliability of the antenna pointing performance with different thresholds is analyzed. The thresholds for antenna pointing performance are 0.2°, 0.4°, 0.6°, 0.8° and 1°. The antenna pointing performance reliability results are shown in Table 7.
Table 7 shows the reliability results of the three methods with different thresholds. As the threshold increases, the reliability of these methods also increases. For each threshold, the reliability of the GSA-PEM is closer to the result of the MCS method than the ME-FM method. As the sample points change from m = 5 to m = 7 , the accuracy of reliability has a large increase.
The tail probabilities of different m are investigated from the CDF curves in Figure 9. Considering the situation with probability larger than 99%, the tail errors of m = 5 and m = 7 with the MCS are 8.751% and 1.652%. The results show that increasing the number of sample points can decrease the tail error of PEM estimation.

4.2. Case II

The satellite model and coordinate system of Case II are shown in Figure 10. In this model, the pointing direction is influenced by θ 1 and θ 2 , the rotation angles of the two motors. The antenna pointing performance considering uncertainty inputs is investigated in the imaging range composed of θ 1 and θ 2 .
Then, by using the method proposed in the previous section, a numerical model is established by the sorted out parameters. This model combines the uncertain parameters and the antenna pointing performance to analyze the distribution characteristics of antenna pointing performance in the imaging space.
The accuracy of the proposed framework is validated by comparing the statistical moments with those obtained by the MCS method. Furthermore, based on the computed statistical moments, the reliability of the antenna pointing performance within the imaging space is analyzed and compared with the results of MCS to confirm the precision of the reliability calculations.

4.2.1. Kinematic Model and Sensitivity Analysis

The satellite model with a dual-axis driving mechanism and its coordinated systems is shown in Figure 10. It contains a mainbody and an antenna, and a dual-axis driving mechanism between these two parts. The kinematic parameters of the satellite are provided in Table 8. The position vector and rotation angle in the ith row are relative to the coordinate system in the i 1 row.
To analyze the sensitivity index in the imaging area, the rotation angle of two shafts denoted as θ 1 and θ 2 are considered in the real and ideal pointing vector. By using Equation (7) and Equation (15), the transformation matrices that contain Err I and Err II are obtained. The two pointing vectors in Equation (16) and Equation (17) become v ideal = T R e f I ( θ 1 , θ 2 , 0 , 0 ) and v real = T R e f I ( θ 1 , θ 2 , Err I , Err II ) . The antenna pointing performance considering the uncertain parameters can be derived by Equation (18).
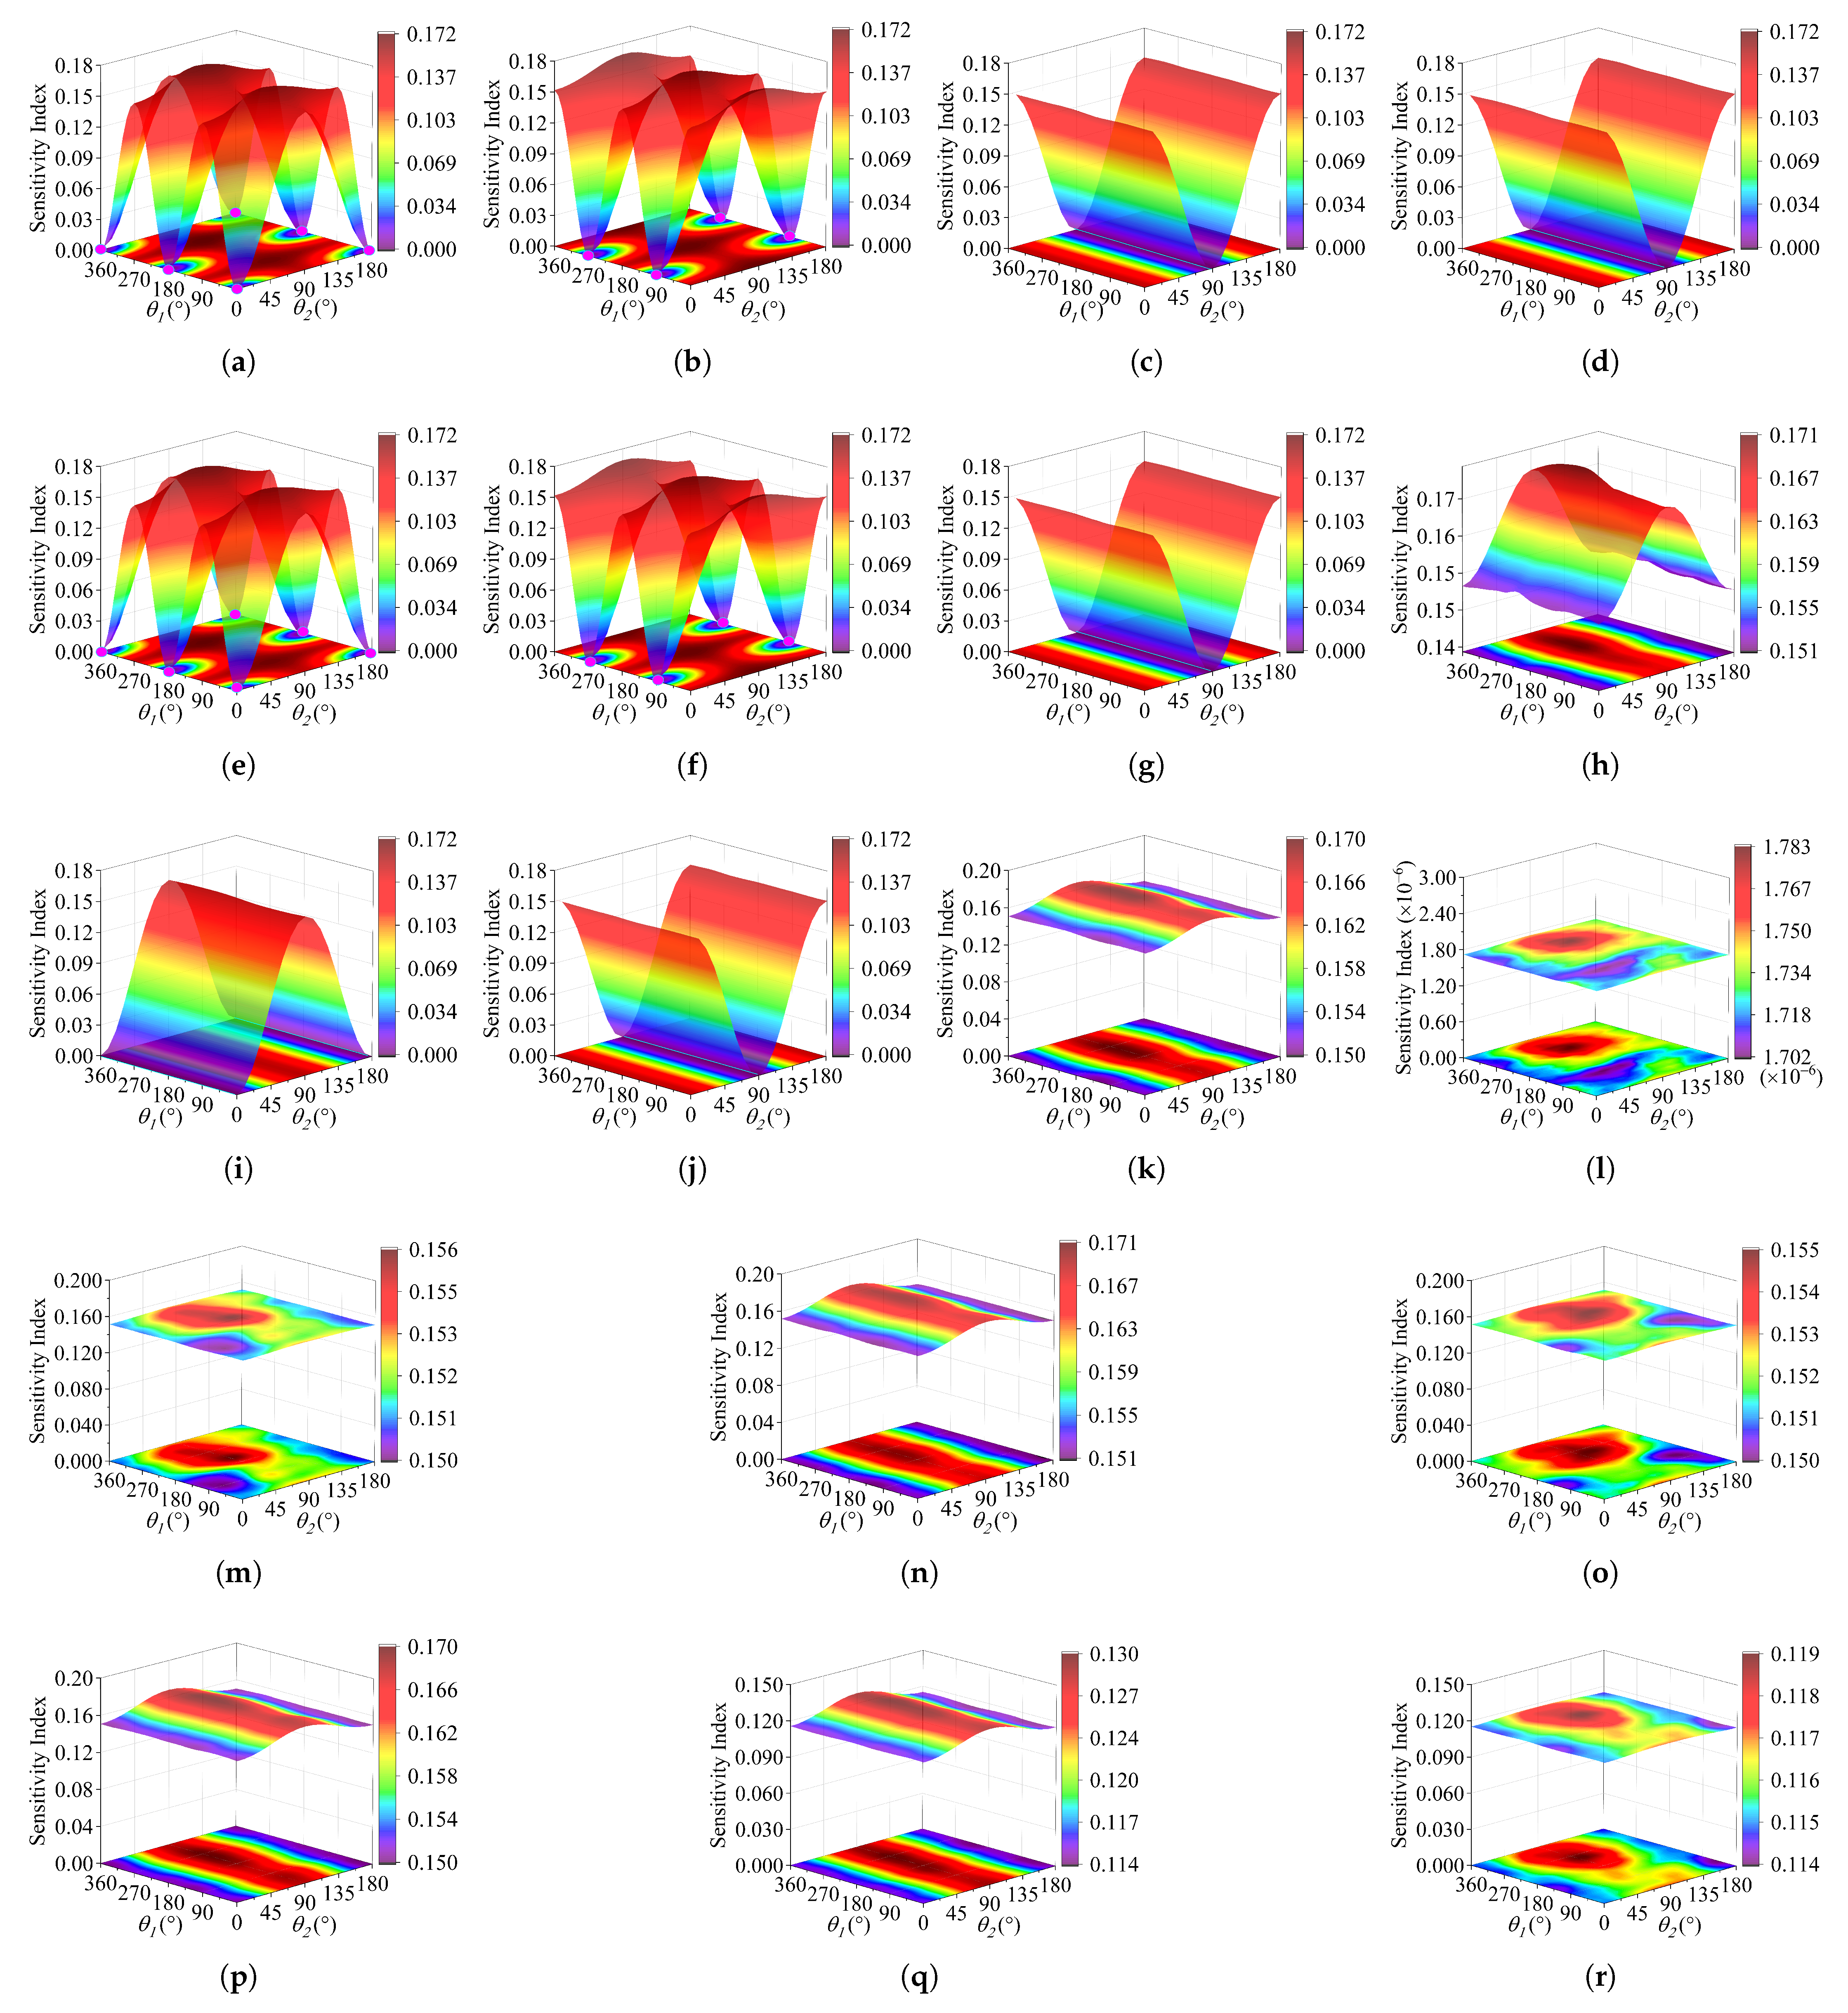
Table 9 gives the probability distribution of uncertain parameters. The sensitivity index of each uncertain parameter can be quantified by decomposing the antenna pointing performance expression through Equation (23). The total partial variance of each parameter is given by Equation (28), and the total variance is expressed by Equation (26). The total sensitivity index of each uncertain parameter in the imaging area is calculated by Equation (29). The results are shown in Figure 11.
As shown in Figure 11, the sensitivity indices of the antenna pointing performance are illustrated for various uncertain parameters within the imaging area. These parameters can be categorized by the comparison between the trend of these figures in the imaging area, as shown in Table 10.
These uncertain parameters are categorized into several types by their trends in the imaging area, shown in the Table above. Detailed descriptions of these types are given as follows:
  • Type 1: This type includes uncertain parameters whose sensitivity indices feature multiple zero points within the imaging area. These zero points in the figures are marked in magenta. This type further divided into two subtypes:
    Subtype 1.1: This subtype contains Δ α , Δ θ 1 α . There are six zero points in the sensitivity figures. The surface of the sensitivity index exhibits symmetry at θ 1 = 180 and θ 2 = 90 . Along the θ 1 axis, the surface exhibits periodic variations with a period of 180 .
    Subtype 1.2: This subtype contains Δ β , Δ θ 1 β . There are four zero points in these figures. Same as the Type 1.1, it shows symmetry in the θ 1 = 180 and θ 2 = 90 . It also has periodicity along the θ 1 axis and shows a phase difference of π / 2 in the θ 1 axis compared with the Type 1.1.
  • Type 2: In this type, the sensitivity surfaces of uncertain parameters have a line equal to zero. These zero lines are marked in green. The surfaces change along the θ 2 axis are more significant than the θ 1 axis. It is divided into two subtypes:
    Subtype 2.1:  Δ γ , Δ θ 1 , Δ θ 1 γ , Δ θ 2 β are contained in this subtype. The sensitivity parameters in this type are shown as a V shape along the θ 1 , while the two remains steady. The minimum value is located at θ 2 = 90 , and the maximum value is obtained at θ 2 = 0 and θ 2 = 180 .
    Subtype 2.2:  Δ θ 2 α is in this subtype. The sensitivity index in this type is shown like an A shape along the θ 1 , while θ 2 remains steady. The minimum value is located in θ 2 = 0 and θ 2 = 180 while the maximum value is obtained in θ 2 = 90 .
  • Type 3: This type contains Δ θ 2 , Δ θ 2 γ , Δ A γ , Δ A β , ϕ y , ϕ z , d y , d z . Parameters of this type continuously influence the antenna pointing performance. Their sensitivity indices have non-zero minimum points within the imaging area. These indices can only be changed by altering the antenna pointing angles θ 1 and θ 2 .
  • Type 4: Only Δ A α is included in this type, which has no influence on the antenna pointing performance in the imaging area.
As shown in Figure 11, the sensitivity analysis demonstrates that antenna pointing performance is more sensitive to uncertain parameters near the antenna than to those farther away, a finding which exactly matches Case I. The uncertain parameters near the payload always influence the antenna pointing performance, while parameters far away from the antenna have several zero points or lines. Furthermore, the uncertain parameters that rotate around the focal axis do not influence the antenna pointing performance, like Δ A α . The sensitivity results of uncertain parameters in Types 1, 2, and 3 show a higher level of sensitivity than the parameters in Type 4. Type 3 always has an influence on the antenna pointing performance. The sensitivity changes range in the imaging area of Types 1 and 2 are larger than Type 3.

4.2.2. Reliability Analysis

This section analyzes the reliability of antenna pointing performance considering uncertain parameters. As identified in the previous subsection, these parameters were prioritized based on sensitivity indices. The selected key parameters for the reliability analysis of antenna pointing performance are: Δ α , Δ β , Δ γ , Δ θ 1 , Δ θ 2 , Δ ϕ y , Δ ϕ z , d y , and d z . Their distribution parameters are detailed in Table 9. Statistical moments of pointing performance computed via GSA-PEM for each pointing direction are validated against the MCS method. The MCS required 10 6 computations, whereas the proposed framework achieved comparable results with only 140 computations.
By substituting the mean value of each parameter into Equation (38), the constant g μ in Equation (37) is obtained. The sample points x i , l of variable x i are calculated by Equation (47), and the values of u l and P l are shown in Table 2. The mean and SD values of ith parameter are derived by Equations (44) and (45). The mean and SD values of the antenna pointing performance are then calculated by Equations (34) and (35), and the reliability analysis can be carried on.
The reliability of the antenna pointing performance is verified by comparing the first- and second-order moments of pointing performance using the GSA-PEM and the MCS method. The mean and SD in the imaging area of these two methods are shown in Figure 12.
The figures above compare the statistical moments between the GSA-PEM and the MCS method. As shown in Figure 12a,c, the magenta surface represents the result of the GSA-PEM, while the blue surface is the MCS result. The trends of the two methods in both figures within the imaging area are consistent. The GSA-PEM yields slightly higher values at the upper and lower bounds of θ 2 in the imaging area. The mean and SD of the GSA-PEM are the same as those of the MCS method while θ 2 = 90 .
Figure 12b,d show the difference in moments between the two methods. Both figures show that the error of moments changes along the θ 2 axis while remaining steady along the θ 1 axis. The yellow area surrounded by the orange line in the two figures means the error is less than 0.6 % . The minimum error of the mean is located near the θ 2 = 90 , while the maximum error is located near the θ 2 = 0 and θ 2 = 180 . For the SD, the minimum error is located near the θ 2 = 60 to θ 2 = 120 . The maximum error of the SD is the same as the mean, located near the θ 2 = 0 and θ 2 = 180 .
For the calculation cost of these two methods, in the single pointing direction, the GSA-PEM calls the antenna pointing performance function 196 times. In contrast, the MCS method needs 10 6 times, which shows that the GSA-PEM is more efficient than the MCS method.
As shown in Case I and reference [12], the antenna pointing performance follows the Rayleigh distribution (Weibull distribution with shape parameter equal to 2). The PDF and CDF curves of the antenna pointing performance in certain θ 1 and θ 2 are given below.
The comparison between the two methods is shown in Figure 13. Each sub-figure has 4 curves, the solid line is the result of the MCS method, and the dotted-and-dashed line is the result of the GSA-PEM. The two colors blue and red are used to represent the PDF and CDF curves, respectively. These figures demonstrate that the PDF and CDF obtained by the GSA-PEM are the same as the result of the MCS method. This indicates that the proposed framework can effectively quantify the probabilistic characteristics of antenna pointing performance under uncertainty.
The antenna pointing performance reliability with different error thresholds is analyzed. The thresholds of the antenna pointing performance are 0.2°, 0.6°, and 1°. The reliability results of the two methods given by the PDF and CDF are shown in Figure 14.
The reliability results of the antenna pointing performance with different thresholds are shown in Figure 14. Reliability results with different thresholds are shown in Figure 14a–c, respectively. It can be found that the reliability results of both methods have the same trend in the imaging area. The reliability along the θ 1 axis remains unchanged while it changes along the θ 2 axis like an A shape.
The reliability along the θ 1 axis remains unchanged, while it changes along the θ 2 axis.To analyze the reliability of the antenna pointing performance, the surfaces are projected on the θ 2 O z plane (z is the reliability axis), as shown in Figure 14d–f. The reliability results of both GSA-PEM and the MCS method can be found to have the safest location near θ 2 = 90 for each threshold, and the most unsafe locations are located in θ 2 = 0 and θ 2 = 180 .
The reliability errors between the two methods are shown in Figure 14g–i. The errors of these two methods can be found to be shown as an A shape along the θ 2 axis. The most accurate position is located between θ 2 = 60 and θ 2 = 120 with reliability error near 0 % . The maximum error occurs in θ 2 = 0 and θ 2 = 180 , and decreases from 2.3 % , 0.71 % , and 0.056 % as the threshold increases.
The reliability results indicate that the GSA-PEM can provide a proper estimation of the antenna pointing performance for different types of satellites with multiple uncertain parameters. The GSA-PEM enables quantification of antenna pointing performance variations within the imaging area, providing an effective approach to evaluate the antenna pointing performance.
5. Conclusions

The GSA-PEM Integrated Framework proposed in this study provides an efficient and comprehensive approach for quantifying the impact of multi-source uncertainty on antenna pointing performance. By combining system modeling, global sensitivity analysis, probabilistic moment estimation, and reliability assessment, the framework addresses key limitations of conventional methods, offering a balanced solution in terms of computational cost, accuracy, and generalizability. It enables low-cost acquisition of high-precision statistical metrics, identification of dominant uncertainty contributors, and quantification of reliability, making it well-suited for satellite pointing performance evaluation and robust design.
Two validation cases of increasing complexity were conducted to verify the framework’s accuracy and applicability. In Case I, where the antenna is rigidly mounted on the satellite mainbody, the pointing uncertainty in a single direction was analyzed using MCS, ME-FM, and the GSA-PEM framework. Compared with MCS results, the GSA-PEM achieved smaller errors in mean and SD (2.076% and 1.315%, respectively) than ME-FM, while requiring significantly fewer model evaluations. Additionally, Q-Q plots and p-values confirmed that the pointing error follows a Weibull distribution, and the probability density (PDF) and cumulative distribution (CDF) functions were accurately captured by all methods. Reliability assessments across multiple thresholds showed that the GSA-PEM framework consistently outperformed ME-FM in estimation accuracy, with reliability errors as low as 0.202%.
Case II introduced a more complex satellite structure with dual-axis hinges between the antenna and main body, requiring evaluation of pointing performance across a spatial region. Sensitivity analysis revealed spatial variation in parameter influence, and uncertain parameters were categorized into four types based on their sensitivity patterns. Notably, parameters located closer to the antenna exhibited consistently high influence across all pointing directions, while those farther away demonstrated region-specific or negligible sensitivity. This spatial insight offers practical guidance for uncertainty mitigation through targeted parameter control and optimal pointing strategies. Within the imaging region, the GSA-PEM results closely matched MCS outputs, with mean and SD errors under 2.5% and localized discrepancies approaching zero.
These findings confirm the accuracy, robustness, and adaptability of the GSA-PEM Integrated Framework for analyzing satellite antenna pointing uncertainty under various structural and operational conditions. Moreover, the framework not only contributes methodological advancements by integrating sensitivity screening and efficient uncertainty propagation but also provides practical tools to support satellite design optimization, fault-tolerant control, and reliability-driven mission planning.
Although the current case studies effectively demonstrate the performance of the GSA-PEM Integrated Framework under representative configurations, they are only a limited subset of possible disturbances. To improve generalizability and robustness across diverse application scenarios, future research will extend validation efforts to include a broader range of disturbance environments, satellite architectures, and antenna configurations. These efforts will involve both enhanced numerical simulations and hardware-in-the-loop experiments to better capture the complexity of real mission conditions and to support practical integration in aerospace engineering applications.
Based on the efficiency and spatial uncertainty analysis capabilities of the GSA-PEM framework, future extensions will also focus on incorporating multi-physics coupling effects, such as thermal, electromagnetic, and structural interactions, as well as modeling uncertainty propagation under component degradation or fault conditions. These developments aim to enhance the framework’s practical value in complex satellite systems and further support its application in robust mission planning, system design optimization, and fault-tolerant control.

Author Contributions

Conceptualization, S.T.; Methodology, S.T.; Software, S.T.; Validation, S.T.; Formal analysis, S.T., N.Z., C.W. and J.G.; Investigation, S.T. and N.Z.; Writing—original draft, S.T.; Writing—review & editing, S.T., N.Z., C.W. and J.G.; Supervision, N.Z., Y.S. and J.G.; Project administration, S.T., Y.S. and J.G.; Funding acquisition, J.G. All authors have read and agreed to the published version of the manuscript.

Funding

This work is supported by the National Natural Science Foundation of China under grant number 62373122.

Data Availability Statement

The data are unavailable due to privacy and ethical restrictions.

Conflicts of Interest

The authors declare no conflicts of interest.

References

  1. Ding, W.; Li, X.; Yang, H.; An, J.; Zhang, Z. Utilizing statistical information for interval analysis: A method for analyzing the interval uncertainty of line-of-sight measurement error of space-borne observation platforms. IEEE Access 2020, 8, 67868–67886. [Google Scholar] [CrossRef]
  2. Li, Q.; Zhang, J.; Yu, M.; Shi, C.; Dou, Y.; Guo, H.; Liu, R. Accuracy Analysis and Synthesis of Planar Mechanism for Antenna Based on Screw Theory and Geometric Coordination. Actuators 2025, 14, 293. [Google Scholar] [CrossRef]
  3. Zhao, H.; Li, S.; Jiang, T.; Hong, Y.; Ma, Z. Modeling and digital calibration for the mirror normal pointing error of the 2D scanning reflector. Aerosp. Sci. Technol. 2023, 62, 2642–2650. [Google Scholar] [CrossRef] [PubMed]
  4. Zhang, J.; Huang, J.; Zhao, P.; Liang, W.; Zhang, Y.; Wang, C. A pointing error analysis model for large reflector antennas under wind disturbance. Proc. Inst. Mech. Eng. Part C-J. Eng. Mech. Eng. Sci. 2019, 233, 1939–1951. [Google Scholar] [CrossRef]
  5. Sanfedino, F.; Thiebaud, G.; Alazard, D.; Guercio, N.; Deslaef, N. Advances in fine line-of-sight control for large space flexible structures. Aerosp. Sci. Technol. 2022, 130, 107961. [Google Scholar] [CrossRef]
  6. Xu, Q.; Zhang, J.; Wang, Z.Y.; Pan, H.Z. Analysis and compensation of the reflector antenna pointing error under wind disturbance. Res. Astron. Astrophys. 2021, 21, 150. [Google Scholar] [CrossRef]
  7. Li, H.; Shi, M.; Liu, H. Research on the Antidisturbance Method of CMG Gimbal Servo System with Parameter Uncertainty and Nonlinear Disturbances. IEEE-ASME Trans. Mechatron. 2024, 29, 4286–4296. [Google Scholar] [CrossRef]
  8. Sattar, M.; Alzaid, M.; Junejo, N.U.R.; Malik, R.A.; Tanveer, M.; Latif, M. Solar Array Drive Assembly Disturbance Modeling, Jitter Analysis and Validation Tests for Precision Space-Based Operations. J. Vib. Eng. Technol. 2023, 11, 2069–2080. [Google Scholar] [CrossRef]
  9. Huang, J.; Li, X.Y.; Xi, J. On-orbit imager installation angles estimation and compensation based on time-series prediction method for GEO optical satellite. Opt. Quantum Electron. 2024, 56, 1172. [Google Scholar] [CrossRef]
  10. Hughes, R. Monte-Carlo Analysis of Satellite Beam Pointing Errors. J. Guid. Control Dyn. 1992, 15, 35–39. [Google Scholar] [CrossRef]
  11. Huang, B.; Li, Z.H.; Tian, X.Z.; Yang, L.; Zhang, P.J.; Chen, B. Modeling and correction of pointing error of space-borne optical imager. Optik 2021, 247, 167998. [Google Scholar] [CrossRef]
  12. Zhang, F.; Han, J.; Ruan, P. Beam pointing analysis and a novel coarse pointing assembly design in space laser communication. Optik 2019, 189, 130–147. [Google Scholar] [CrossRef]
  13. Fan, Z.; U, X.; Yang, Y.; Yang, K.; Sun, K.; Sun, Q.; Sun, W. Approach for predicting and adjusting the pointing accuracy of opto-mechanical systems considering multi-source uncertainty. Opt. Express 2024, 32, 23916–23931. [Google Scholar] [CrossRef]
  14. Garcia-Luis, U.; Gomez-San-Juan, A.M.; Navarro-Medina, F.; Ulloa-Sande, C.; Ynigo-Rivera, A.; Pelaez-Santos, A.E. Optimizing Space Telescopes’ Thermal Performance through Uncertainty Analysis: Identification of Critical Parameters and Shaping Test Strategy Development. Aerospace 2024, 11, 231. [Google Scholar] [CrossRef]
  15. Garcia-Luis, U.; Gomez-San-Juan, A.M.; Navarro-Medina, F.; Santos, A.E.P.; Fernandez, P.G.D.C.; Ynigo-Rivera, A.; Aguado-Agelet, F. Evaluation of the thermo-elastic response of space telescopes using uncertainty assessment. Acta Astronaut. 2024, 219, 300–317. [Google Scholar] [CrossRef]
  16. Bersilla, J.; Takarics, B.; Vanek, B.; Guo, J. Parameter Uncertainty Analysis in Precise Pointing Control of Flexible Spacecraft. IFAC-Pap. 2022, 55, 241–246. [Google Scholar] [CrossRef]
  17. Qian, H.M.; Zhang, H.; Huang, T.; Huang, H.Z.; Wang, K. Accuracy analysis of satellite antenna panel expansion based on BP neural network. Qual. Reliab. Eng. Int. 2023, 39, 1878–1888. [Google Scholar] [CrossRef]
  18. Jiang, J.Y.; Wu, B.; Zhou, T. Fractional-Order Active Disturbance Rejection Controller Design for Large Radio Telescope Antenna. Int. J. Antennas Propag. 2022, 2022, 1481169. [Google Scholar] [CrossRef]
  19. Zhao, Y.; Ono, T. New point estimates for probability moments. J. Eng. Mech.-ASCE 2000, 126, 433–436. [Google Scholar] [CrossRef]
  20. Sobol, I.M.; Kucherenko, S. Derivative based global sensitivity measures and their link with global sensitivity indices. Math. Comput. Simul. 2009, 79, 3009–3017. [Google Scholar] [CrossRef]
  21. Pandey, M.D.; Zhang, X. System reliability analysis of the robotic manipulator with random joint clearances. Mech. Mach. Theory 2012, 58, 137–152. [Google Scholar] [CrossRef]
  22. Zhang, L. Development and Prospect of Chinese Lunar Relay Communication Satellite. Space Sci. Technol. 2021, 2021, 3471608. [Google Scholar] [CrossRef]
  23. LockheedMartin. Available online: https://www.lockheedmartin.com/content/dam/lockheed-martin/space/photo/gps/GPSIIIF_Sat.png (accessed on 21 April 2025).
  24. Mei, G.; Xiang, B.; Wang, N.; Wang, Z. Correction method of antenna pointing error caused by the main reflector deformation. Chin. J. Astron. Astrophys. 2021, 45, 236–251. [Google Scholar]
  25. Lo, Y. On the beam deviation factor of a parabolic reflector. IEEE T Antenn Propag. 1960, 8, 347–349. [Google Scholar] [CrossRef]
  26. Basha, N.S.; Leifsson, L.; Bloebaum, C.L. Identifying key parameters impacting cost in large-scale complex space programs using simulation-based global sensitivity analysis. Syst. Eng. 2023, 26, 291–304. [Google Scholar] [CrossRef]
  27. Ding, J.; Wang, C.; Wu, H. Accuracy analysis of a parallel positioning mechanism with actuation redundancy. J. Mech. Sci. Technol. 2019, 33, 403–412. [Google Scholar] [CrossRef]
  28. Sobol, I. Global sensitivity indices for nonlinear mathematical models and their Monte Carlo estimates. Math. Comput. Simul. 2001, 55, 271–280. [Google Scholar] [CrossRef]
  29. Saltelli, A.; Ratto, M.; Andres, T.; Campolongo, F.; Cariboni, J.; Gatelli, D.; Saisana, M.; Tarantola, S. Global Sensitivity Analysis: The Primer; John Wiley & Sons: Hoboken, NJ, USA, 2008. [Google Scholar]
  30. Zhao, Y.G.; Ono, T. Moment methods for structural reliability. Struct. Saf. 2001, 23, 47–75. [Google Scholar] [CrossRef]
  31. Novi Inverardi, P.L.; Tagliani, A. Maximum entropy density estimation from fractional moments. Commun. Stat.-Theory Methods 2003, 32, 327–345. [Google Scholar] [CrossRef]
  32. Zhang, X.; Low, Y.M.; Koh, C.G. Maximum entropy distribution with fractional moments for reliability analysis. Struct. Saf. 2020, 83, 101904. [Google Scholar] [CrossRef]
Figure 1. Two typical satellite configurations. (a) Payload fixed on the mainbody (QueQiao) [22]. (b) Payload connected by joints with mainbody (GPS IIIF) [23].
Aerospace 12 00720 g001
Figure 2. Rotation order of coordinate system transformation.
Aerospace 12 00720 g002
Figure 3. Combination of pointing errors from two sources.
Aerospace 12 00720 g003
Figure 4. Pointing error caused by reflector deformation and feed lateral displacement.
Aerospace 12 00720 g004
Figure 5. Analyzing diagram of the GSA-PEM Integrated Framework.
Aerospace 12 00720 g005
Figure 6. Satellite model and coordinate system of Case I.
Aerospace 12 00720 g006
Figure 7. Sensitivity index of uncertain parameters.
Aerospace 12 00720 g007
Figure 8. Q-Q plot of Case I about different distributions. (a) Weibull distribution. (b) Exponential distribution. (c) Gamma distribution. (d) Normal distribution.
Aerospace 12 00720 g008
Figure 9. PDF and CDF comparison of Case I. (a) PDF comparison of three methods. (b) CDF comparison of three methods.
Aerospace 12 00720 g009
Figure 10. Satellite model and coordinate system of Case II.
Aerospace 12 00720 g010
Figure 11. Sensitivity index of the pointing performance to uncertain parameters. (a) Sensitivity of Δ α . (b) Sensitivity of Δ β . (c) Sensitivity of Δ γ . (d) Sensitivity of Δ θ 1 . (e) Sensitivity of Δ θ 1 α . (f) Sensitivity of Δ θ 1 β . (g) Sensitivity of Δ θ 1 γ . (h) Sensitivity of Δ θ 2 . (i) Sensitivity of Δ θ 2 α . (j) Sensitivity of Δ θ 2 β . (k) Sensitivity of Δ θ 2 γ . (l) Sensitivity of Δ A α . (m) Sensitivity of Δ A β . (n) Sensitivity of Δ A γ . (o) Sensitivity of ϕ y . (p) Sensitivity of ϕ z . (q) Sensitivity of d y . (r) Sensitivity of d z .
Aerospace 12 00720 g011
Figure 12. Moments comparison between MCS and the GSA-PEM. (a) Mean value of the MCS method and the GSA-PEM. (b) The absolute error of the mean between two methods. (c) SD value of the MCS method and the GSA-PEM. (d) The absolute error of the SD between the two methods.
Aerospace 12 00720 g012
Figure 13. The PDF and CDF comparison between MCS and the GSA-PEM in the sampling points. (a) θ 1 = 0 and θ 2 = 0 . (b) θ 1 = 180 and θ 2 = 0 . (c) θ 1 = 360 and θ 2 = 0 . (d) θ 1 = 0 and θ 2 = 90 . (e) θ 1 = 180 and θ 2 = 90 . (f) θ 1 = 360 and θ 2 = 90 . (g) θ 1 = 0 and θ 2 = 180 . (h) θ 1 = 180 and θ 2 = 180 . (i) θ 1 = 360 and θ 2 = 180 .
Aerospace 12 00720 g013
Figure 14. Reliability analysis results of two methods. (a) Reliability result with threshold = 0.2°. (b) Reliability result with threshold = 0.6°. (c) Reliability result with threshold = 1.0°. (d) Projection of reliability with threshold = 0.2° on θ 1 O z plane. (e) Projection of reliability with threshold = 0.6° on θ 1 O z plane. (f) Projection of reliability with threshold = 1.0° on θ 1 O z plane. (g) Error of reliability with threshold = 0.2°. (h) Error of reliability with threshold = 0.6° between two methods. (i) Error of reliability with threshold = 1.0° between two methods.
Aerospace 12 00720 g014
Table 1. Estimating points u l and corresponding weights P l of m = 5 .
u l Value P l Value
u 1 0 P 1 8 / 15
u 2 = u 3 1.3556 P 2 = P 3 0.2221
u 4 = u 5 2.8570 P 4 = P 5 1.1257 × 10 2
Table 2. Estimating points u l and corresponding weights P l of m = 7 .
u l Value P l Value
u 1 0 P 1 16 / 35
u 2 = u 3 1.1544 P 2 = P 3 0.2401
u 4 = u 5 2.3668 P 4 = P 5 3.0757 × 10 2
u 6 = u 7 3.0757 P 6 = P 7 5.4826 × 10 4
Table 3. Kinematic parameters of Case I.
Coordinate SystemRelative Position Vector (m) Relative Rotation Angle ( )
Σ I //
Σ B (0,0,0)(0,0,0)
Σ A (0,0,0.5)(0,0,0)
Σ R e f (0,0,0)(0,0,0)
Table 4. Uncertain parameters in Case I.
Uncertain ParametersDistributionMean ( μ )SD ( σ )
Δ α Normal 0 ( ) 0.1 ( )
Δ β Normal 0 ( ) 0.1 ( )
Δ γ Normal 0 ( ) 0.1 ( )
Δ A α Normal 0 ( ) 0.1 ( )
Δ A β Normal 0 ( ) 0.1 ( )
Δ A γ Normal 0 ( ) 0.1 ( )
ϕ x Normal 0 ( ) 0.1 ( )
ϕ y Normal 0 ( ) 0.1 ( )
d x Normal 0 ( m ) 0.001 ( m )
d y Normal 0 ( m ) 0.001 ( m )
Table 5. Statistical moments of Case I.
MomentsMethods
MCSGSA-PEM (m = 5)GSA-PEM (m = 7)ME-FM
Mean (°)0.2890.3330.2950.296
Error (%)/ 14.187 2.076 2.422
SD (°)0.1520.1740.1540.155
Error (%)/ 14.474 1.315 1.974
Table 6. p-value verification of Case I.
Distributionp-ValueParameters
Normal<0.005μ: 0.289; σ: 0.152
Gamma<0.005σ: 3.139; θ: 0.092
Exponential<0.003λ: 0.288
Weibull>0.25k: 2.014 λ: 0.325
Table 7. Reliability results of Case I.
Thresholds (°)Methods
MCSGSA-PEM (m = 5) (Error)GSA-PEM (m = 7) (Error)ME-FM (Error)
0.20.1720.131 (23.837%)0.165 (4.069%)0.165 (4.069%)
0.40.5280.432 (18.182%)0.516 (2.272%)0.512 (3.030%)
0.60.8160.719 (11.887%)0.802 (1.716%)0.800 (1.961%)
0.80.9510.896 (5.783%)0.944 (0.736%)0.943 (0.841%)
10.9910.972 (1.917%)0.989 (0.202%)0.989 (0.202%)
Table 8. Kinematic parameters of satellite components of Case II.
Coordinate SystemRelative Position Vector (m)Relative Rotation Angle (°)
Σ I //
Σ B ( 0 , 0 , 0 ) ( 0 , 0 , 0 )
Σ 1 ( 0 , 0 , 0.5 ) ( 0 , 0 , 0 )
Σ 2 ( 0 , 0 , 1 ) ( π / 2 , π , 0 )
Σ A ( 1 , 0 , 0 ) ( 0 , 0 , 0 )
Σ R e f ( 0 , 0 , 0 ) ( 0 , 0 , 0 )
Table 9. Distribution of chosen uncertain parameters.
Uncertain ParametersDistributionMean ( μ )SD ( σ )
Δ α Normal 0 ( ) 0.1 ( )
Δ β Normal 0 ( ) 0.1 ( )
Δ γ Normal 0 ( ) 0.1 ( )
Δ θ 1 Normal 0 ( ) 0.1 ( )
Δ θ 1 α Normal 0 ( ) 0.1 ( )
Δ θ 1 β Normal 0 ( ) 0.1 ( )
Δ θ 1 γ Normal 0 ( ) 0.1 ( )
Δ θ 2 Normal 0 ( ) 0.1 ( )
Δ θ 2 α Normal 0 ( ) 0.1 ( )
Δ θ 2 β Normal 0 ( ) 0.1 ( )
Δ θ 2 γ Normal 0 ( ) 0.1 ( )
Δ A α Normal 0 ( ) 0.1 ( )
Δ A β Normal 0 ( ) 0.1 ( )
Δ A γ Normal 0 ( ) 0.1 ( )
ϕ y Normal 0 ( ) 0.1 ( )
ϕ z Normal 0 ( ) 0.1 ( )
d y Normal 0 ( m ) 0.001 ( m )
d z Normal 0 ( m ) 0.001 ( m )
Table 10. Types of sensitivity parameters.
TypeSubtypeUncertain Parameters
11.1 Δ α , Δ θ 1 α
1.2 Δ β , Δ θ 1 β
22.1 Δ γ , Δ θ 1 , Δ θ 1 γ , Δ θ 2 β
2.2 Δ θ 2 α
3/ Δ θ 2 , Δ θ 2 γ , Δ A γ
Δ A β ϕ y ϕ z d y , d z
4/ Δ A α
Disclaimer/Publisher’s Note: The statements, opinions and data contained in all publications are solely those of the individual author(s) and contributor(s) and not of MDPI and/or the editor(s). MDPI and/or the editor(s) disclaim responsibility for any injury to people or property resulting from any ideas, methods, instructions or products referred to in the content.