Article

Vertiport Location Selection and Optimization for Urban Air Mobility in Complex Urban Scenes

1
College of Civil Aviation, Nanjing University of Aeronautics and Astronautics, Nanjing 211106, China
2
State Key Laboratory of Air Traffic Management Systems, Nanjing 211106, China
3
Department of Aviation and Technology, College of Engineering, San Jose State University, One Washington Square, San Jose, CA 95192-0061, USA
*
Author to whom correspondence should be addressed.
Aerospace 2025, 12(8), 709; https://doi.org/10.3390/aerospace12080709
Submission received: 22 June 2025 / Revised: 4 August 2025 / Accepted: 5 August 2025 / Published: 10 August 2025
(This article belongs to the Special Issue Operational Requirements for Urban Air Traffic Management)

Abstract

Vertiports, as dedicated facilities for electric vertical takeoff and landing (eVTOL) aircraft, are essential to ensure the efficiency and sustainability of Urban Air Mobility (UAM). However, UAM infrastructure site selection has become increasingly complex due to limited land availability, complex spatial conditions, and the need to balance multiple objectives. Focusing on passenger-carrying UAM operations, this study proposes a systematic framework for vertiport site selection. First, key factors are classified into high, medium, and low levels across the safety, economic, and social dimensions, forming a modular evaluation system. A GIS-based spatial screening process is developed to identify potential vertiport locations. Subsequently, a variable representing the level of demand satisfaction is incorporated into a progressive coverage model specifically designed for vertiport site optimization. A hybrid algorithm is designed to solve the model. Using Shenzhen as a case study, the proposed approach is validated through real-world data. The results show that vertiport size and spatial requirements significantly influence the selection of suitable land types. High economic constraints may cause facility over-concentration, while setting standards aligned with regional functions better supports equitable access. Locating vertiports in high-demand areas enhances demand satisfaction levels, and both service capacity and range strongly influence overall system performance. These findings provide practical insights for future vertiport planning, promoting the efficient use of urban resources and supporting the successful implementation and sustainability of UAM.

1. Introduction

With the continuous growth of the global population and the accelerating pace of urbanization, urban agglomeration has become a major trend in urban spatial development [1]. The ongoing expansion of urban areas and the functional differentiation of city zones have reduced the accessibility of urban transportation systems and significantly increased residents’ travel times. Meanwhile, the growing demand for urban travel has placed immense pressure on existing transportation infrastructure, resulting in frequent overloading [2]. As a response to these trends, Urban Air Mobility (UAM), an emerging transportation mode based on advanced aviation technologies such as eVTOL aircraft, is widely regarded as a promising solution to alleviate pressure on urban ground transportation [3]. Passenger-carrying UAM operations, particularly on-demand air taxi services, have the potential to reduce travel time, improve accessibility, and alleviate congestion by complementing existing multimodal urban transport systems. These services are especially appealing to high-income, time-sensitive user groups—such as business travelers and urban professionals—who value speed and convenience over cost. By targeting such segments, UAM offers a clear value proposition in the early stages of deployment.
Despite its potential, the advancement of UAM faces significant challenges—particularly in ground infrastructure development, which is essential for supporting eVTOL operations and ensuring seamless passenger connectivity. In its Concept of Operations (ConOps) for UAM, NASA highlights that the planning and construction of vertiports is a critical element for the large-scale deployment of UAM. The limited availability of vertiports has been identified as the second major constraint to system expansion [4,5]. The European Single Sky Air Traffic Management Research (SESAR) program provides detailed guidance on the operational processes, airspace structure, and flight regulations for vertiports in its U-space Concept of Operations (Version 4). It asserts that vertiports are not only foundational physical supports for UAM operations but also core hubs ensuring the safety, efficiency, and sustainability of low-altitude urban travel [6]. The European Union Aviation Safety Agency (EASA), in its Guidebook for Urban Air Mobility Integration, discusses vertiport design and operational standards, emphasizing that the lack of ground infrastructure is one of the greatest challenges to UAM implementation in metropolitan areas [7]. Similarly, Uber Elevate, in its white paper, also identifies the absence of ground infrastructure as one of the primary challenges to UAM operations [8]. As a key component of the UAM system, ground infrastructure has become a focal point of academic research. Various studies have proposed different definitions for UAM ground facilities based on aircraft capacity and functionality, including terms such as “aerodrome” [9], “airpark” [10], “vertiport” [11], “skyport” [12], and “vertibase” [13]. In this paper, the term “vertiport” is used to refer to UAM ground infrastructure designed to support eVTOL operations.
To date, large-scale UAM operations have not been implemented globally, and most research on vertiport siting remains conceptual. Studies on site selection primarily focus on identifying influencing factors and addressing location optimization problems [14].
Existing research outlines the various constraints and considerations in vertiport site selection. Among these, aviation-related factors such as airspace availability, flight path clearance, and meteorological conditions are widely regarded as primary constraints [15,16]. In addition, site- and infrastructure-related factors, including vertiport layout, infrastructure readiness, and land availability, are considered critical [17,18]. Traffic-related factors such as congestion and accessibility [19,20,21], noise impacts [22,23], social dimensions [24,25] like equity and public acceptance [26], regulatory and political support [27], as well as market-driven factors including demand and cost [28,29], also play important roles in site evaluation.
Multi-Criteria Decision-Making (MCDM) methods, grounded in the identified influencing factors, have become essential tools for addressing vertiport location problems. Mercan et al. [30] used the Best–Worst Method to evaluate site selection based on criteria such as vertiport layout, aircraft features, safety, traffic congestion, meteorological conditions, cost, consumer acceptance, and airspace management. Preis et al. [31] conducted an in-depth analysis of 69 site selection factors using expert analysis, classifying them into five groups: physical space, building obstacles, community acceptance, traffic accessibility, and other considerations. They explored the interrelationships and impact levels of these factors in site selection. Feldhoff et al. [32] combined the Analytic Hierarchy Process (AHP) and the Delphi method to develop a site evaluation system based on criteria such as passenger accessibility, physical obstacles, noise, scalability, applicability, and strategic availability, and determined the corresponding weights. Geographic Information Systems (GISs) are widely used in vertiport location analysis, particularly for comparing spatial data and managing multi-factor overlay problems. Fadhil et al. [33] utilized a GIS to integrate and visualize spatial data for suitability analysis based on an established site selection criteria framework. Brunelli et al. [34] integrated geographic, traffic, demographic, and socioeconomic data to build an analytical framework that combined GIS and digital twin models. Using Bologna, Italy, as a case study, this framework was applied to vertiport site selection for UAM. Clustering and optimization algorithms have also been employed to identify suitable vertiport locations. Lim et al. [35] applied the K-means algorithm to cluster commuter data in Seoul and identify high-potential vertiport candidates. Rajendran et al. [36] used a constrained clustering approach to analyze taxi passenger data in New York City and incorporated the Multimodal Transportation-based Warm Start (MTWS) technique to determine optimal locations. Guo et al. [37] evaluate multiple clustering algorithms for vertiport siting and find that data-driven methods like K-means++ outperform expert-based approaches in terms of travel time savings, accessibility, and equity. This highlights the importance of operational factors such as turnaround time and fare sensitivity in enhancing the performance and fairness of UAM networks.
Other studies have approached vertiport location problems as facility location models, with many researchers modeling and solving these problems using optimization and simulation methods. Rath et al. [38] modeled the UAM city–airport connection scenario as a single-assignment p-hub median problem, incorporating passenger mode choice and elastic demand constraints. The model aimed to maximize passenger volume and total revenue, and it was solved using a greedy heuristic algorithm. Using New York City as a case study, the research analyzed travel data from 149 taxi zones to three major airports (JFK, EWR, LGA), evaluating passenger distribution and potential demand under different skyport layouts based on over 20 million airport-related trips. Shin et al. [39] considered path intersections between air taxis, which could cause route interference, scheduling complexity, and collision risks. A hub location problem model was proposed that included air traffic congestion factors, and a genetic algorithm-based heuristic was developed to address large-scale real-world applications. Kitthamkesorn et al. [40] proposed a UAM network design model based on the multi-assignment incomplete p-hub location problem, integrating the “perception bound” concept from the eUnit behavior model to capture passengers’ biased perceptions of travel costs. The model offered three optimization objectives: revenue maximization, profit maximization, and profit maximization with pricing strategies. Jiang et al. [41] modeled the vertiport location problem as a covering optimization problem, constructing a comprehensive demand index using multi-source data. The objective was to maximize the weighted demand covered within the eVTOL service area, with Beijing serving as the case study. By integrating spatial data and GIS-based visualization, high-suitability locations were identified. Wu et al. [42] proposes a multi-objective optimization framework for vertiport siting that integrates land use compatibility, capacity constraints, and phased development. By balancing sustainability, accessibility, and cost, it provides a practical tool for long-term, adaptable UAM infrastructure planning. Jin et al. [43] addressed uncertainties in passenger mode choice by integrating UAM service coverage with demand fluctuations. They proposed a two-stage robust optimization model with budget uncertainty sets to maximize demand coverage under worst-case scenarios. The model employed a multinomial logit framework to capture choices among air taxis, regular taxis, and premium taxis, reflecting heterogeneous sensitivity to time value. It linked the vertiport site selection with passenger behavior and was solved via Mixed-Integer Linear Programming. Willey et al. [44] model vertiport location as an enhanced single-allocation p-center problem, using subgraph isomorphism techniques to ensure network structure and enable transit-style transfers. Heuristic algorithms address the NP-hard nature, with empirical analysis in three U.S. cities showing that regional demand patterns affect layout, revealing trade-offs between efficiency and robustness.
However, MCDM methods suffer from strong subjectivity, as indicator weights heavily depend on expert judgment, reducing their effectiveness in complex, demand-driven site selection problems [45]. Clustering algorithms, while useful for capturing spatial patterns, struggle to model multi-objective, constraint-coupled location tasks independently [46]. Traditional HLP models are typically based on static, highly centralized network assumptions that emphasize pre-established hub–radiation connection structures. These models struggle to adapt to the dynamic, multi-node collaboration and multi-layered operations of UAM systems, leading to structural limitations [14,41,47].
This paper formulates the vertiport location as a typical Facility Location Problem (FLP). Rather than relying on traditional indicator weighting, a grading-based evaluation framework is employed, reducing subjectivity, avoiding weight assignment controversies, and enhancing adaptability across diverse urban settings. This indicator system identifies suitable vertiport candidates, generating a refined set of sites as the input for the location model. The second stage constructs an optimization model to determine final locations. This study adopts an improved progressive coverage model that allocates limited facilities to maximize coverage and equity in high-demand, resource-limited settings. Following this framework, the paper proposes a vertiport location strategy that optimizes layout and improves the efficiency and equity of UAM systems.
The remainder of this study is organized as follows: Section 2 outlines the problem statement and method overview. Section 3 describes the development of a Modular Grading-based Evaluation Index System for candidate locations. Section 4 introduces the PCM-DSL site selection model. Section 5 presents an empirical study using Shenzhen as a case study to validate the proposed approach. Section 6 concludes the paper and suggests directions for future research.

2. Problem Statement and Method Overview

2.1. Problem Statement

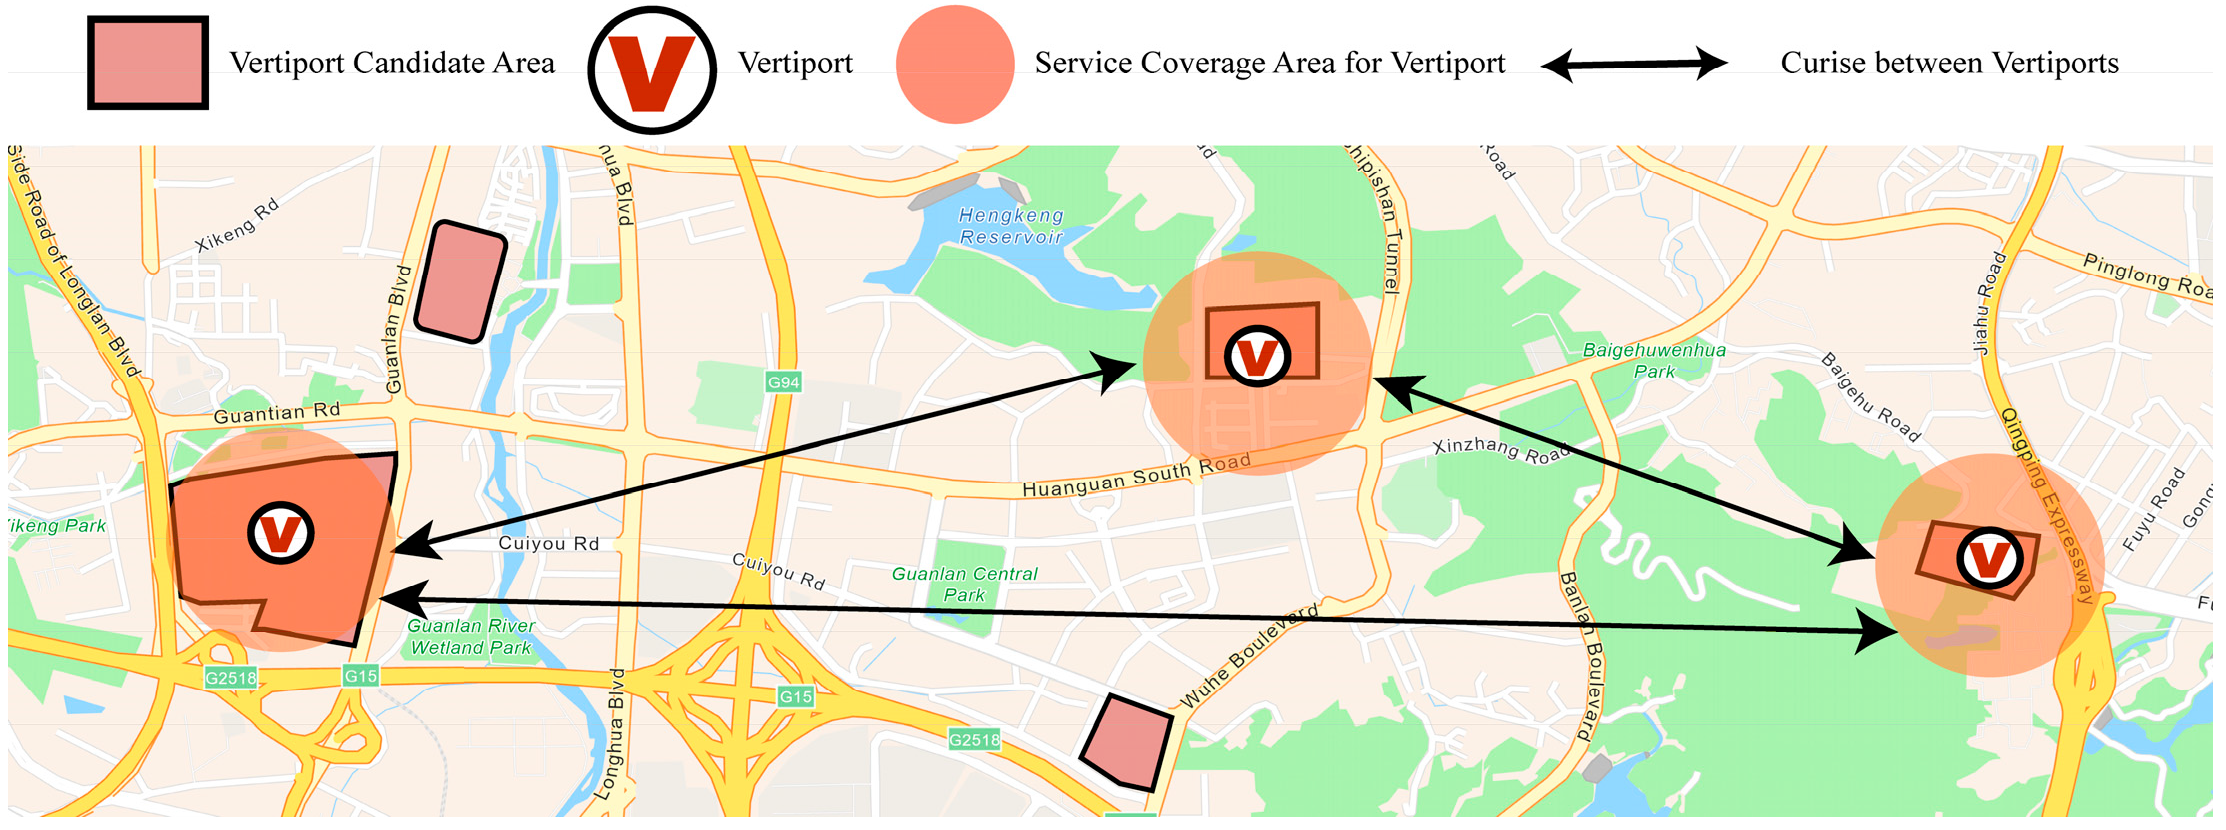
The service process of passenger-carrying UAM operations (see Figure 1) typically consists of the following steps: passengers first walk to or use ground transportation to access the nearest departure vertiport (Vertiport 1); they then board an eVTOL to travel to a vertiport near their destination (Vertiport 2); finally, they complete the last segment of the journey via walking or ground transport. As the origin and destination nodes in the UAM service chain, vertiports play a pivotal role in shaping the overall travel experience, as their spatial distribution directly affects system accessibility, travel convenience, and equity of service coverage.
Urban land resources are extremely competitive, especially in core urban areas where land prices are high. Therefore, vertiport site selection must account for existing building structures and infrastructure conditions to optimize land use efficiency. In urban environments, the dense concentration of buildings, varied ground conditions, and complex airspace further increase the difficulty of site selection. In the context of commercial operations, selecting vertiport sites requires balancing multiple factors, including economic efficiency, demand, cost, environmental impact, and safety [48]. As a result, the central challenge lies in identifying appropriate vertiport locations within complex urban systems, which centers on two core issues:
(1)
How can suitable vertiport locations be identified in complex urban areas?
Given the three-dimensional operational characteristics of eVTOLs, the complex urban airspace structure poses a significant challenge for site selection. This difficulty is further exacerbated by the multitude of influencing factors—including population density, land use patterns, transportation accessibility, safety regulations, and environmental constraints—as well as their intricate interdependencies and the inherent difficulty in evaluating their individual and combined impacts.
Moreover, significant spatial and socioeconomic differences exist across cities, further complicating the development of a universally applicable evaluation framework. A key methodological consideration is the design of an indicator system that is both structured and flexible—adaptable to local contexts while ensuring consistency and comparability across diverse urban settings.
(2)
How can optimal vertiport locations be selected to effectively meet urban demand?
Urban demand for vertiport services is often spatially uneven—typically concentrated in high-density commercial zones and underserved in peripheral or residential areas—leading to distributional imbalances that complicate planning and resource allocation. A central challenge lies in quantifying the extent to which demand is met across different regions. To enable a more accurate assessment, it is essential to adopt demand satisfaction indicators that reflect both the intensity and spatial distribution of service coverage. Such indicators are critical to ensure that vertiport infrastructure is not only optimally located but also equitably accessible and sustainable in the long term.
As shown in Figure 2, identifying suitable candidate sites within three-dimensional urban environments requires the processing of complex spatial information, including terrain, land use, surrounding buildings, and transportation networks. Subsequently, to establish an efficient UAM network, the most suitable vertiport locations are selected from these sites, ensuring a rational layout of aerial infrastructure and a high service coverage efficiency.

2.2. Method Overview

In response to the challenges outlined in Section 2.1, this paper proposes a systematic, data-driven approach to vertiport site selection. The research framework, illustrated in Figure 3, consists of two core components:
(1)
Vertiport Screening Based on a Modular Grading Evaluation Index System
Key factors influencing vertiport site selection are identified through a comprehensive analysis of social, safety, and economic factors. Appropriate evaluation indicators are selected based on data availability. Drawing on a literature review and expert consultation, the indicators are categorized into high, medium, and low levels, with clear criteria defined for each. This classification forms the basis of a modular and hierarchical evaluation framework for vertiport screening. Using the established indicators, a spatial screening workflow is developed using a GIS and Python. Spatial analysis is then conducted to identify candidate sites that meet the predefined criteria.
(2)
Vertiport Determination Based on a PCM-DSL Optimization Model
A demand satisfaction variable is introduced into the traditional Progressive Coverage Model (PCM) framework, resulting in the enhanced PCM-DSL model. The model is formulated to maximize overall demand satisfaction in vertiport deployment, subject to constraints on the number of facilities and their service capacities. A hybrid genetic algorithm (GA) is developed to solve the site selection problem and determine the optimal layout of vertiports.
In summary, the proposed framework combines qualitative spatial screening with quantitative optimization modeling, offering a practical and scalable solution for strategic vertiport deployment in complex urban environments.

3. A Modular Grading Evaluation Index System

Due to the complexity of urban environments, identifying suitable vertiport sites is challenging. To support optimization, an initial screening is required. This section draws on the literature and expert inputs to identify key siting factors and develops a modular evaluation system to systematically screen potential locations.

3.1. Key Evaluation Criteria for Vertiports

According to the literature, vertiport siting and operations involve not only economic factors but also require a comprehensive evaluation of broader societal impacts. In addition, the operation of eVTOL aircraft imposes strict safety requirements on vertiport design and management [7]. As illustrated in Figure 4, this study proposes site selection criteria from three key perspectives: social impact, safety requirements, and economic viability.

3.1.1. Social Attributes

As a mode of transportation, safety is the top priority, while economic viability is essential for sustainable development. As an increasingly scarce public resource, urban land plays a vital role in shaping the interests of urban residents. Therefore, vertiport site selection must consider the broader societal impacts of such infrastructure, with particular emphasis on regional development balance and public acceptance. These considerations include the following aspects:
(1)
Land Use Compatibility
Land supply is typically influenced by factors such as urban planning, land ownership, and regulatory policies. Urban areas are generally divided into residential, commercial, industrial, and other functional zones. These zoning regulations directly affect the feasibility of infrastructure development, including vertiports [49]. In this study, land is categorized into six types: residential, commercial, industrial, agricultural, transportation, and public administration/service land. Among these, agricultural land, nature reserves, and ecologically sensitive areas are considered to have low suitability for vertiport construction.
(2)
Social Equity
As a novel mode of transportation, UAM must emphasize social equity to ensure the fair distribution of resources across urban areas. Site selection should balance high-demand zones with underserved neighborhoods, enabling all social groups to benefit from UAM services and avoiding the inequality caused by spatial disparities.
Points of Interest (POIs) are locations that attract activity and shape pedestrian and traffic flows, reflecting the functional characteristics of urban areas [50,51]. Analyzing their types, quantities, and spatial distribution provides valuable insights for promoting equity in UAM site selection. This study classifies POIs into six categories: (1) transportation hubs, including metro stations, high-speed rail stations, major bus terminals, and airports; (2) commercial services, such as large shopping malls, supermarkets, central business districts (CBDs), and hotels; (3) public facilities, including hospitals, schools, and government service centers; (4) leisure and entertainment, such as major tourist attractions, museums, cultural heritage sites, and exhibition centers; (5) residential areas, including densely populated housing zones and residential communities; and (6) industrial zones, such as high-tech parks, logistics centers, and manufacturing bases.
(3)
Government Policies
Government policies significantly influence vertiport location decisions. Certain areas may be designated as restricted zones due to safety or other considerations, including proximity to critical government facilities and military zones [52]. These typically include government buildings and critical infrastructure, military zones, areas with high concentrations of children (e.g., primary and secondary schools), and hazardous sites such as gas stations, which usually require a safety buffer of 30 to 100 m.
(4)
Transport Access Conditions
As a three-dimensional transportation node, a vertiport must be integrated with major ground transportation infrastructure to enable efficient multimodal connectivity [53]. Key urban transportation hubs—such as metro stations, high-speed rail stations, and airports—should be located within the operational coverage area of the vertiport.

3.1.2. Safety Attributes

Safety is a primary concern in UAM site selection, and vertiport siting must meet strict operational safety requirements. Key considerations mainly focus on two factors:
(1)
Airport space requirements
As UAM is still in its early stages of development, the design parameters of ground infrastructure largely rely on assumptions and projections regarding the performance of eVTOL aircraft. The operational characteristics of eVTOL vehicles—such as noise level, charging duration, and battery replacement capability—also play a critical role in the planning and design of vertiports. Table 1 highlights several representative eVTOL models currently in development. Range varies widely, from 15 km to over 250 km, directly influencing the maximum coverage radius of each vertiport and the viability of inter-district or city-to-suburb connections. Noise levels during takeoff and landing typically range between 60 and 75 dB, significantly lower than conventional helicopters (85–100 dB), but still requiring noise buffer zones in residential or sensitive areas. Charging duration (30–90 min) provides a key input for determining site capacity and scheduling windows, contributing to more robust and spatially distributed UAM network design.
Among these, the D-value [54] serves as a key reference indicator. It refers to the maximum overall dimension of a helicopter during rotor rotation and is an essential basis for designing safety buffer zones. Since most eVTOL aircraft are still under development, their D-values vary significantly across different prototypes. As shown in Table 1, current eVTOL models range from small, single-passenger designs such as the EHang 216, with an estimated D-value of approximately 5.6 m, to larger multi-passenger aircraft like the Lilium Jet or Beta ALIA-250, with estimated D-values exceeding 15.24 m (50 feet). To accommodate this variation and ensure applicability across a broad range of vehicle types, we adopt a conservative D-value of 16 m in this study.
Currently, the regulations for vertiports are still in the early stages of development. They are primarily based on guidelines issued by authoritative organizations such as EASA [55], FAA [11], and ICAO [56], and often reference helicopter airport design standards. As illustrated in Figure 5a, the simplest form of a vertiport may consist solely of a basic pad, comprising three key subareas: the Touchdown and Liftoff Area (TLOF) for landing and takeoff, the Final Approach and Takeoff Area (FATO) surrounding the TLOF to facilitate approach and departure maneuvers, and the Safety Area (SA), which serves as a buffer zone to accommodate potential deviations during operations. More complex vertiport layouts may additionally include energy supply systems, parking stands, and maintenance facilities to support continuous eVTOL operations (see Figure 5b). Figure 5c illustrates that larger vertiports—enabled by more generous land availability—can accommodate a broader range of functions. They are typically composed of two main areas: the Aircraft Operations Area, which includes the basic pad and its supporting infrastructure, and the Passenger Handling Area, which offers services such as check-in, waiting lounges, and ground transportation connections to support seamless multimodal integration.
There is significant variation in the academic research on vertiport design. Seeley [57,58,59] proposed a conceptual “Pocket Airpark” for single VTOL operations measuring 550 × 325 ft . Uber Elevate [8] recommended minimum diameters of 50 ft for the TLOF, 75 ft for the FATO, and 125 ft for the Safety Area. Alexander et al. [60] proposed a hexagonal TLOF (45 ft), FATO (70 ft), and Safety Area (100 ft), while Syed et al. [61] suggested slightly smaller dimensions of 43 ft, 65 ft, and 95 ft, respectively. EASA [54] recommended designing the SA to measure 2 D × 2 D, where D refers to the D-value, based on the wingspan and length of the eVTOL. FAA [11] suggested minimum sizes of 1 D for TLOF, 1.5 D for FATO, and a minimum width of 3 D for the SA. ICAO [56], as the authority responsible for developing and regulating global aviation, recommended minimum dimensions of 0.83 D for TLOF, 1 D for the FATO, and at least 0.25 D for the SA. Table 2 summarizes these key design parameters for eVTOL ground infrastructure.
(2)
Airport space requirements
To operate in complex urban environments, next-generation VTOL aircraft must feature advanced vertical takeoff and landing capabilities while ensuring adequate obstacle clearance. As such, detailed airspace analysis is essential in early site selection, as it critically influences the feasibility and spatial layout of vertiport deployment.
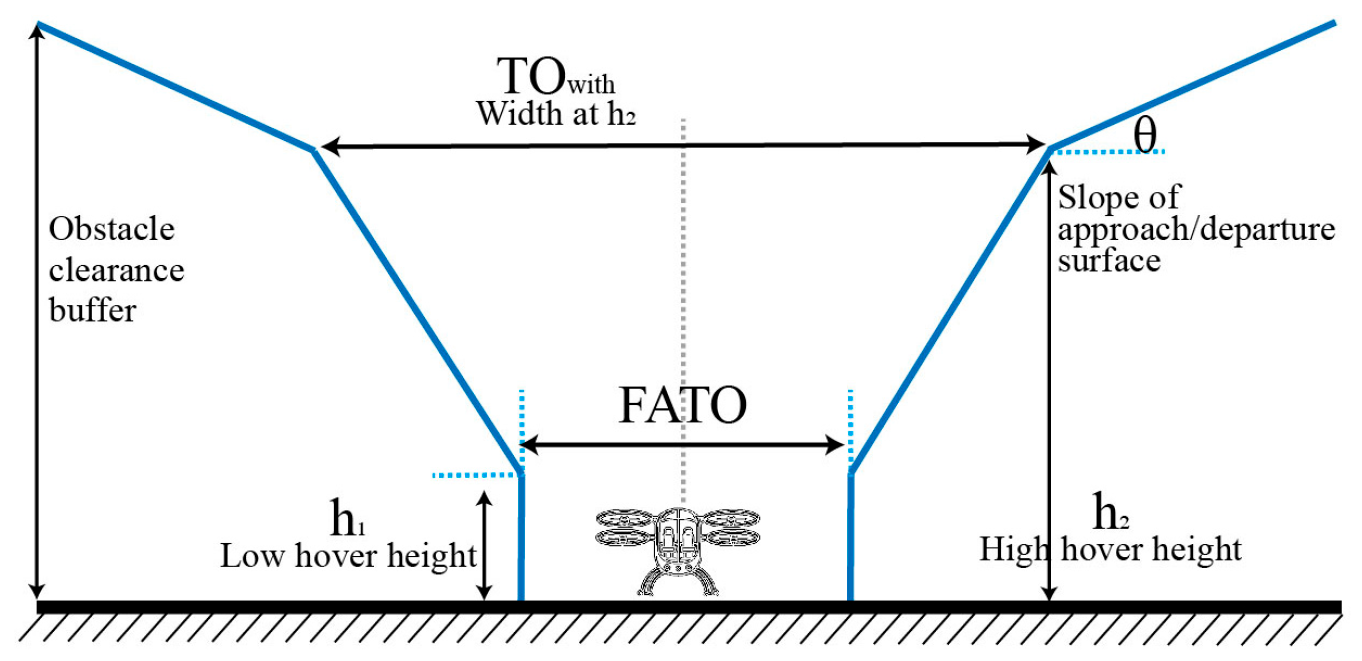
The FAA [64] specifies that the approach surface begins at each end of the vertiport’s primary surface, matches its width, and extends 4000 feet at an 8:1 slope. EASA [55] provides more detailed VTOL requirements, including at least two takeoff/climb paths per aircraft with a minimum of 135° separation. The approach surface typically shares the same slope and length. The Safety Area is defined by enlarging the FATO and ensuring a 1D clearance at a given aircraft height to maintain obstacle separation during takeoff and landing (see Figure 6).
Based on EASA regulations, this study defines three representative types of takeoff and landing procedures by configuring different flight path settings: a single approach/departure direction (Type 1), dual-directional paths (Type 2), and a fully unobstructed omnidirectional surface with the highest clearance requirements (Type 3). The corresponding technical specifications and regulatory criteria for each type are summarized in Table 3.

3.1.3. Economic Attributes

Economic factors have long played a significant role in site selection and planning. The success of UAM depends on developing a customer base willing to pay for its services. This study focuses on two primary economic considerations:
(1)
Population Density
Population density refers to the number of residents living in a specific area. High population density indicates a larger pool of potential users, making it possible to utilize UAM resources more efficiently by locating vertiports in these areas [65]. Johnson et al. [66] used population data to estimate the number of potential customers in UAM infrastructure site selection. Similarly, Gonzalez et al. [50] proposed that population density serves as a proxy for potential demand.
This study divides travel demand into four categories: residential-, work-, leisure-, and mobility-related activities, and estimates the potential demand for each. By analyzing the population density associated with each category, future UAM demand in urban areas can be projected.
(2)
Average Rental Prices
In the early stages of UAM operations, the cost of travel is expected to be high. High-income individuals tend to have greater mobility needs and a higher willingness to pay, directly influencing their demand for and adoption of UAM services. Uber [8] estimates that UAM service costs will exceed those of its current UberX offering. Syed et al. [61] evaluated income levels using the number of individuals earning over USD 100,000 annually or households earning more than USD 200,000 annually. High-income areas are more likely to be able to afford the initial cost burden of UAM, increasing passenger willingness to pay.
Given the limited availability of income data, studies often use more accessible indicators such as housing rental prices as a proxy for income levels. Straubinger et al. [67] suggested that housing value can reflect residents’ ability to pay. In high-income areas with elevated property values, a larger proportion of residents are expected to afford the high initial costs of UAM services. Commuting and business activities also serve as key drivers of UAM travel [68]. According to Fadhil [33], commercial rental prices can act as a proxy for corporate travel budgets and indirectly indicate business travel intensity, making them a useful measure of business activity.
This study uses publicly available data on average residential and commercial rental prices across urban districts to assess the feasibility of UAM services, providing a basis for vertiport site selection.

3.2. Modular Grading Evaluation Index System

In the current vertiport site selection evaluations, methods such as the Analytic Hierarchy Process are widely used. These approaches rely on fixed quantitative weights, representing a static evaluation model. This limits adaptability, making it difficult to respond to changing priorities or environmental conditions [69].
Building on the key indicators introduced in Section 3.1, this study categorizes the evaluation criteria into three dimensions: safety, social feasibility, and economic feasibility. Each is classified into high, medium, and low levels (see Table 4) based on a literature review and expert consultation. Experts in urban planning, transport engineering, and UAM operations provided input on the relevance of each criterion under different urban conditions.
The proposed Modular Grading Evaluation Index System (MGEIS) enables a flexible combination of dimensions according to specific urban contexts. Its structured design supports scalable, adaptable assessments aligned with evolving urban and technological conditions—offering a practical tool for UAM site selection.

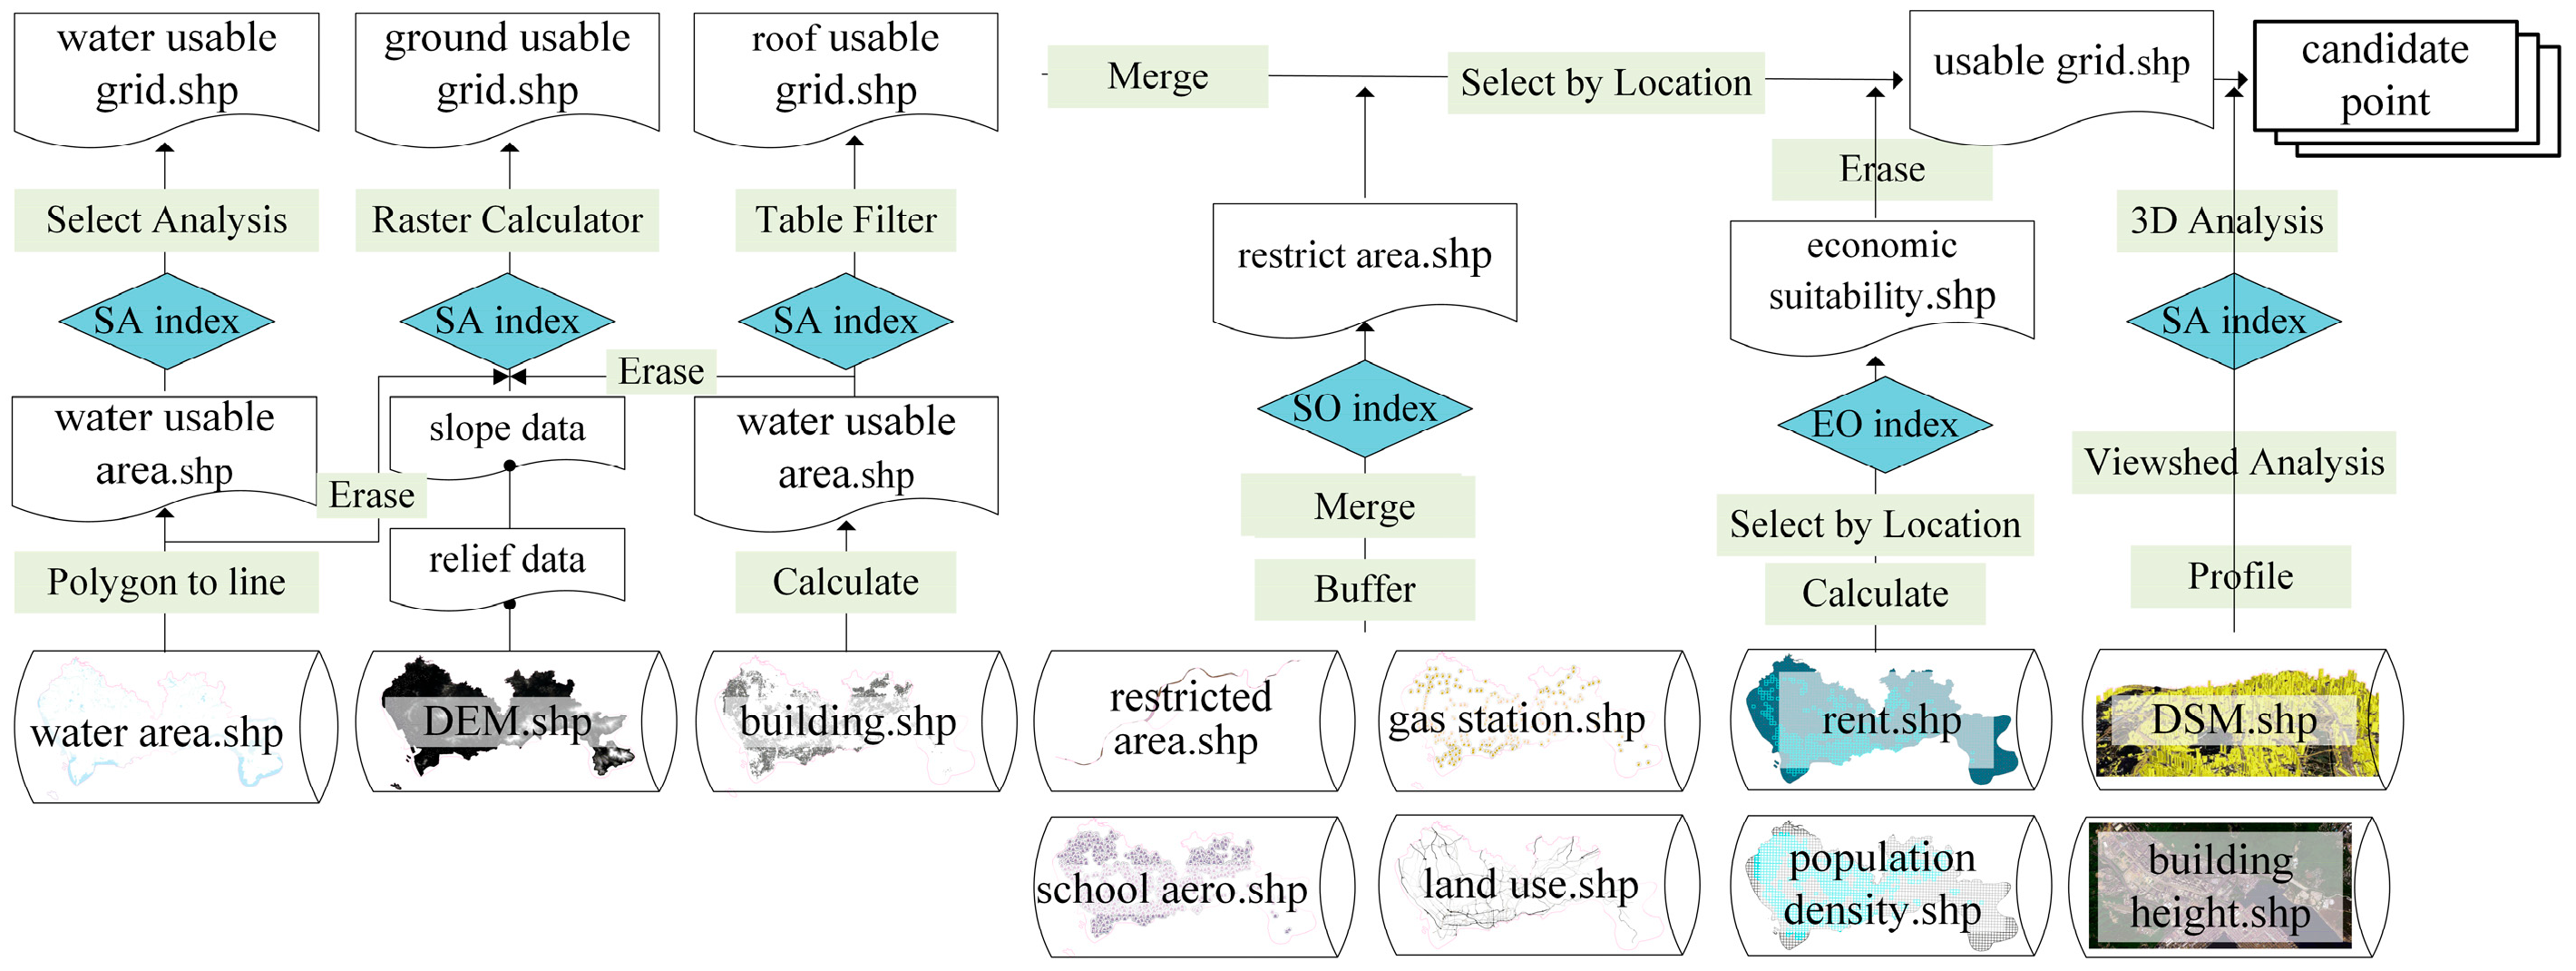
3.3. ArcGIS-Based Solution for Candidate Vertiport Selection

This study develops a vertiport candidate screening workflow using ArcGIS Pro (version 2022), integrated with Python(version 3.10.8) scripting, as illustrated in Figure 7.
Specifically, in the analysis of the takeoff and landing airspace, 3D spatial analysis is conducted to accurately assess potential obstacle interference. In the urban environment, a three-dimensional obstacle model is generated using building height data and terrain elevation. This model is then compared spatially with the vertiport’s approach and departure surfaces. If any intersections are detected, the candidate vertiport is considered infeasible in that direction. The detailed evaluation process is illustrated in Figure 8.
Figure 8a illustrates the 3D assessment of a candidate vertiport that satisfies all 2D selection criteria. By constructing a three-dimensional representation of the takeoff and landing airspace, it becomes clear that the approach/departure path intersects with obstacles, rendering the site infeasible in that direction. Figure 8b shows the rotation of the 3D model to evaluate alternative orientations until a viable, obstacle-free path is identified. Figure 8c presents a feasible candidate vertiport along with its compliant 3D airspace visualization. The obstacle surface evaluation procedure is detailed in the pseudocode of Algorithm 1.
Algorithm 1. Candidate site filtering based on 3D airspace constraints.
Data: shapefiles of 2D usable grid V2D, shapefiles of building M, shapefiles of mountains DSM, airspace requirements of Type 1
Result: locations satisfying 3D airspace requirements V3D
V 3 D  
for   l in V2D:
//Construct the pre-check 3D clearance volume
base _ volume     construct_cuboid(center, base_length, base_height)
 //Build First volume with base cuboid, Second volume trapezoidal frustum
top _ volume     construct_frustum(center, bottom_length, top_length, top_height)
forward _ slope   construct_extension(
     base_surface = left_boundary (top_volume), width, height, angle)
 //Construct Forward Slopes
obstacle _ volume   merge_volumes(base_volume, top_volume, forward_slope)
 //Combine both volumes to form the total clearance volume
 ORI ← 0
 for deg in range (361):
 //Loop through 0–360° to detect any building or terrain obstructions.
  rotated_volume ← rotate(obstacle_volume, r)
  if (NOT intersects(rotated_volume, BM)) AND
   (NOT intersects(rotated_volume, DSM)) then:
    ORI ← 1
    Break
 End For
 If ORI = 1 then:
  Append candidate l to V3D
End For
Return V3D

4. A PCM-DSL Optimization Model

Based on the preliminary screening in Section 3, a large number of candidate vertiport locations can be identified—often numbering in the hundreds or even thousands. However, due to the high costs of construction and maintenance, and the early-stage development of UAM with uncertain demand, developing all sites is impractical. From a resource optimization and cost-control perspective, further refinement of the site selection process is essential.

4.1. Model Assumptions

The construction of the model is based on the following assumptions:
Assumption 1. 
The locations of demand points and their corresponding demand quantities within the city are known.
Assumption 2. 
A demand point may be fully, partially, or not at all satisfied.
Assumption 3. 
Demand can be served by multiple vertiports but must not be double-counted.
Assumption 4. 
The number of vertiports is limited, and each has a finite service capacity.
Assumption 5. 
The construction of a vertiport requires a minimum threshold of potential demand to be met.
Assumption 6. 
Each vertiport has a defined service radius within which it can serve demand points.
Assumption 7. 
To ensure air route safety, a minimum safe construction distance must be maintained between vertiports.

4.2. Notation List

Table 5 presents the notations and their descriptions used in this study, ensuring clarity and consistency in the formulation of the optimization model.

4.3. Progressive Coverage Model (PCM) Incorporating Demand Satisfaction Level (DSL)

The proposed model identifies the optimal vertiport layout in complex urban environments by combining spatial feasibility screening with demand-driven optimization. An optimization framework selects a subset of candidate sites to maximize demand satisfaction under constraints such as facility capacity and service coverage. Building on the progressive coverage model (PCM), the proposed PCM-DSL model introduces a service satisfaction variable, p i j , to quantify how well facility j meets the demand i . This enhancement enables a more precise assessment of both demand fulfillment and vertiport utilization.
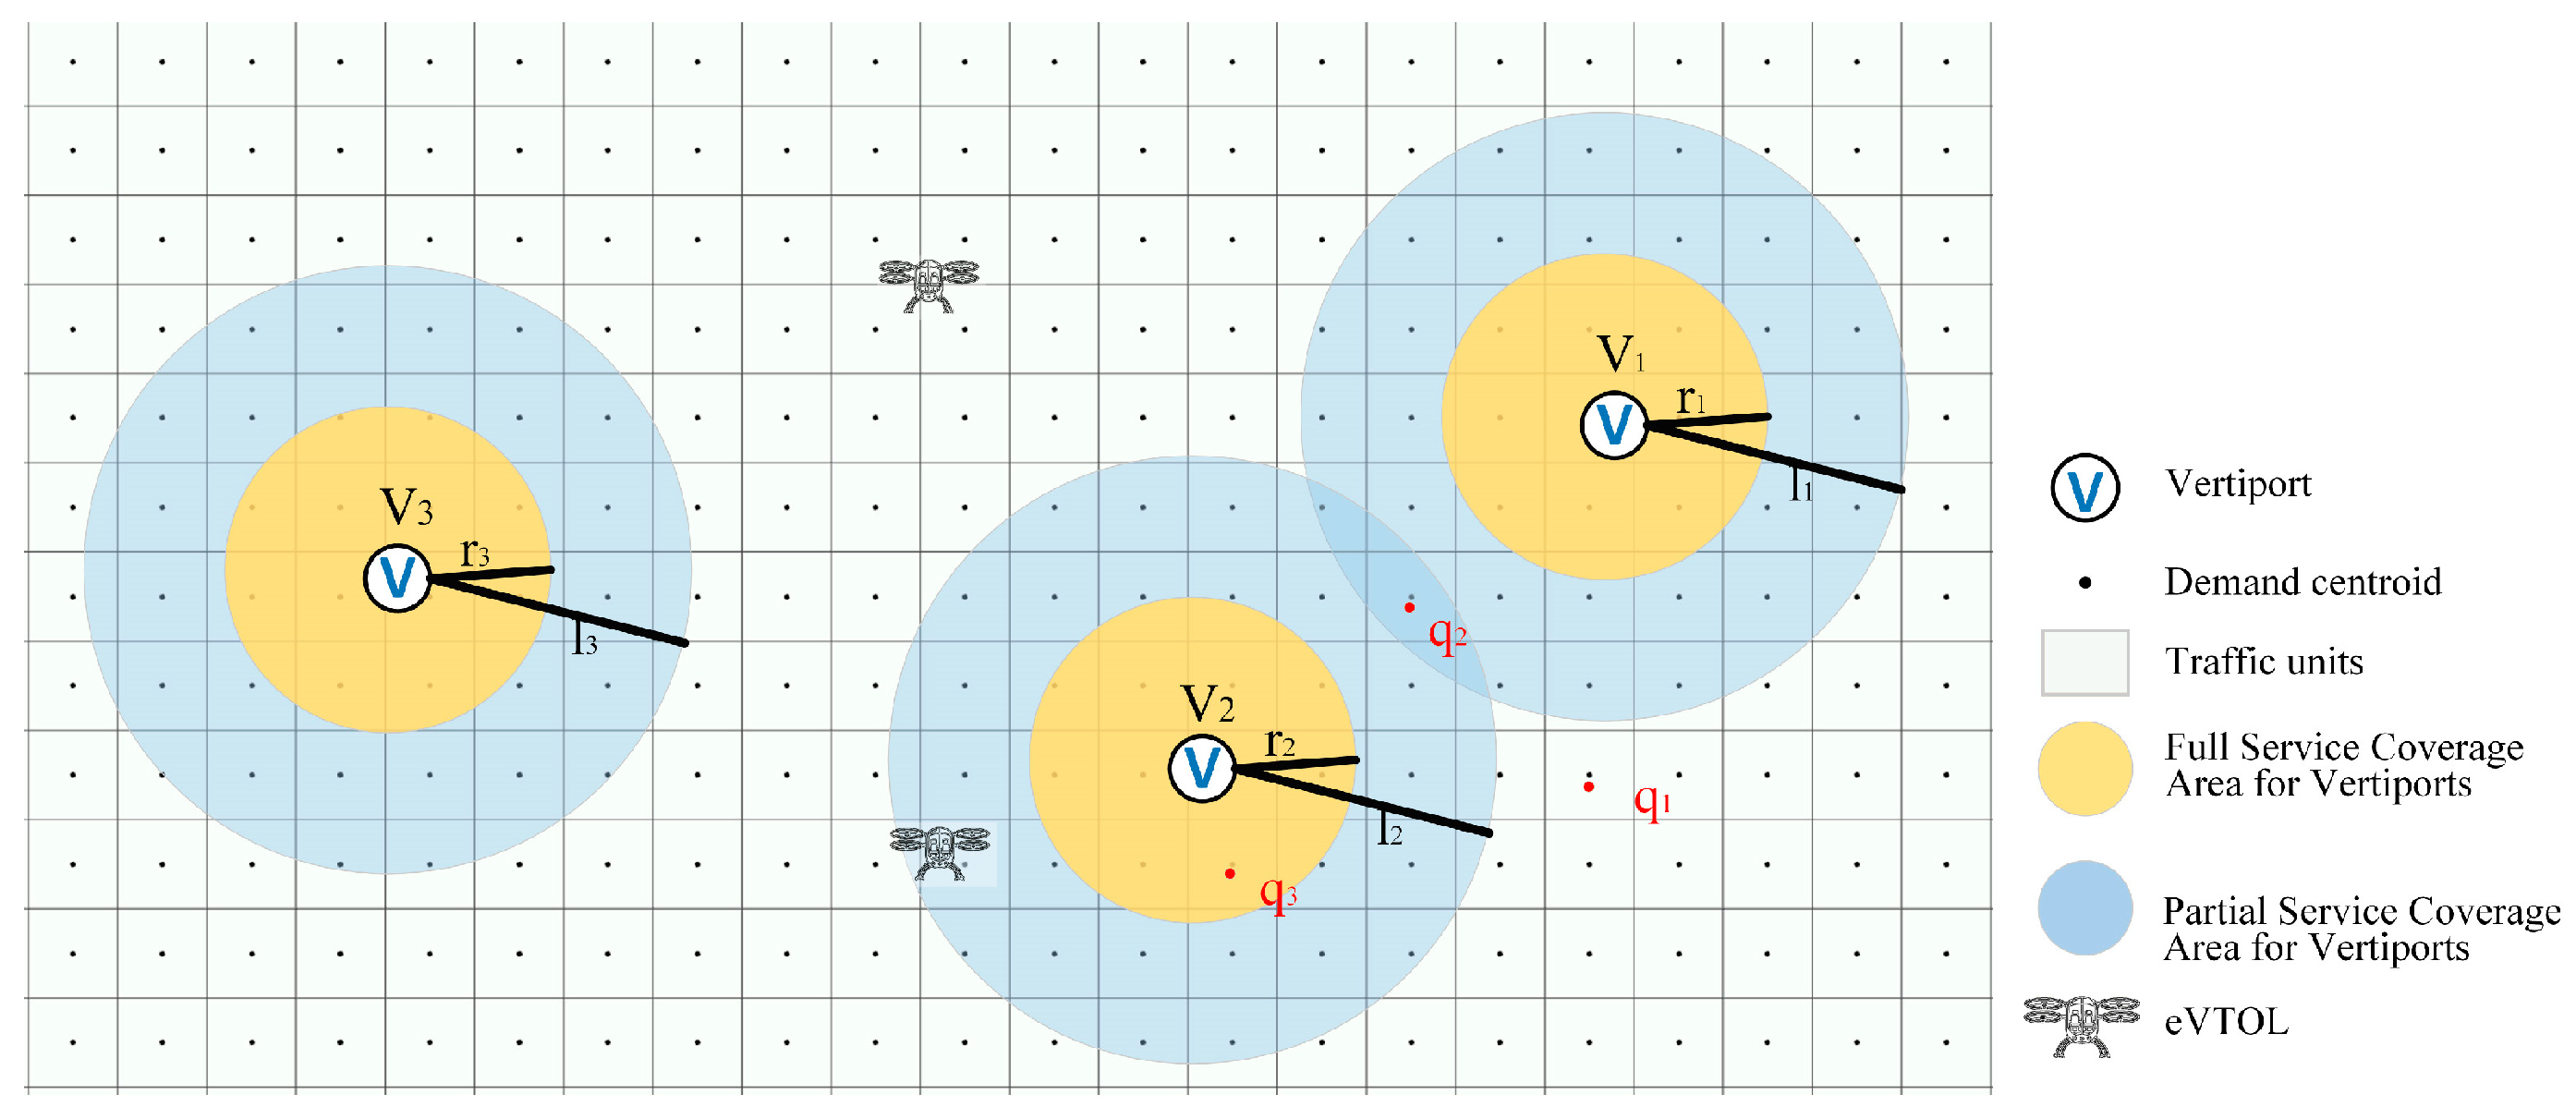
As illustrated in Figure 9, the city is divided into finer-grained traffic analysis zones. Each zone represents a travel demand node i   i N , and   q i denotes the corresponding demand quantity. Each vertiport j   j V is associated with a service area consisting of two concentric zones: a full-service radius r j , within which all demand is fully satisfied (illustrated by the yellow circle), and a partial-service radius l j , where demand is only partially satisfied (shown as the blue circle). A demand node is considered serviceable only when it falls within a vertiport’s service area. The probability that vertiport j serves demand node i , denoted f i j , is defined by a piecewise-linear function. This function, shown in Equation (1), relates service probability to the distance d i j between the demand node and the facility.
f i j ( d i j ) = 1 d i j r j α e β d i j r j d i j l j , i N , j V 0 l j d i j
where α and β are the coefficients of the function f i j .
Unlike traditional binary coverage models that assume full service within a fixed threshold, the proposed model adopts a continuous representation of service. This introduces p i j   p i j [ 0,1 ] to represent the level of demand satisfaction, based on factors such as distance, facility capacity, and overlapping coverage constraints. As shown in Equation (2), the objective of the model is to maximize the total satisfied demand across all locations.
The model is subject to the following constraints, which ensure the feasibility and practicality of vertiport deployment decisions:
M a x   Z = i N j V q i p i j
(1)
Facility Selection Constraint
As shown in Equation (3), the number of selected vertiport locations must not exceed a predefined upper limit H, reflecting budgetary or strategic planning restrictions:
j V x j H
(2)
Minimum Separation Distance Constraint
In consideration of takeoff and landing safety, a minimum distance C must be maintained between any two vertiports, as shown in Equation (4).
d jk ( x j + x k ) C ,   j ,   k V ,   j k
(3)
Capacity Constraint
Each vertiport cannot be established if the total potential demand allocated to it is less than a predefined minimum service requirement a j . This ensures that facilities are only constructed at locations with sufficient service justification.
The total satisfied demand assigned to a constructed vertiport must not exceed its maximum workload capacity b j , reflecting operational and infrastructure limits.
a j i R q i p i j , j V
i R q i p i j b j , j V
(4)
Service Feasibility Constraint
The demand satisfaction level P i j is meaningful only if the corresponding vertiport j is established and its value lies within the service coverage f i j .
p i j f i j x j , i N ,   j V
(5)
Demand Allocation Constraint
Each demand node is allowed to be served by multiple vertiports. However, to avoid redundant service, the total level of satisfaction assigned to any demand node must not exceed 100% of its demand. As shown in Equation (8):
j R p i j 1 , i N
(6)
Facility Selection Variable
Each candidate vertiport j is associated with a binary decision variable   x j , which indicates whether a vertiport is constructed at that location.
x j { 0 , 1 } , j V
(7)
Demand Satisfaction Level Variable
P i j represents the demand satisfaction level at which demand i is served by vertiport j .
p i j [ 0 , 1 ] , i N ,   j N

4.4. Hybrid Heuristic Method for Vertiport Optimization

4.4.1. Structure of the Hybrid Optimization Algorithm

Given the large number of demand points and candidate vertiport locations in urban areas, solving the site selection problem solely through exact optimization is computationally intensive. To address this, a hybrid strategy is proposed that integrates a greedy algorithm, a genetic algorithm (GA), and Pyomo-based exact optimization using the Gurobi solver.
The framework leverages the strengths of both heuristic and mathematical programming approaches. A greedy algorithm is first used to generate an initial feasible population based on proximity and demand priorities. A genetic algorithm then evolves this population to explore the solution space and identify promising subsets of facility locations. For the GA-generated solution, a Pyomo model refines demand allocation ( P i j ) using Gurobi 11.0.3, ensuring local optimality under service satisfaction and capacity constraints.
This approach balances computational efficiency and solution quality, making it well-suited for large-scale urban vertiport site selection. The detailed procedure is outlined in Algorithm 2.
Algorithm 2. Hybrid GA–greedy–Pyomo optimization for vertiport site selection.
Input: Demand data, candidate vertiport data, vertiport parameters, PopulationSize, MaxGenerations, MutationRate, number of facilities to select.
Output: the subset of vertiport locations, demand allocation matrix.
 //Step 1: Greedy Initialization
 Initialize empty population P ← ∅
 for k = 1 to PopulationSize do
  Generate initial solution S k using greedy heuristic:
   -
Select H candidate sites with the highest local demand coverage
   -
Set x j = 1 for selected sites; x j = 0 otherwise
  Add S k to population P
 end for
 //Step 2: Genetic Algorithm Evolution
 for generation = 1 to MaxGenerations do
  for each solution S in population P do
   Fix x j from S
   Solve the Pyomo model with fixed x j using Gurobi to optimize P i j
   Evaluate fitness(S) = total satisfied demand based on P i j
  end for
  Select parents based on fitness (e.g., tournament or roulette selection)
  Apply crossover and mutation to generate offspring
  Update population by replacing worst-performing solutions
 end for
 //Step 3: Local Refinement
 Select the best solution S_best from the final population
 Fix x j from S_best
 Re-optimize P i j using Pyomo and Gurobi with fixed x j
 Return final selected x j and optimized P i j

4.4.2. Algorithm Performance Verification

To evaluate the performance of the improved hybrid greedy–GA + Pyomo algorithm, numerical experiments were conducted using Gurobi results as the benchmark. A pure genetic algorithm (GA) was also implemented for comparison. The evaluation focused on three aspects—solution efficiency, quality, and spatial uniformity—measured by computation time, deviation from the optimal solution, and demand allocation uniformity across selected vertiports.
All computations were performed on a personal computer (Lenovo Group Limited, China) equipped with an Intel Core i7 3.61 GHz CPU and 32 GB of RAM. Optimization was carried out using Gurobi 11.0.3, while the heuristic algorithm was implemented in Python 3.10. The specific parameter settings are as follows:
(1)
The greedy factor was set to 1. We set the number of iterations Gen to 500, the population size N to 100, the crossover probability Pc to 0.8, and the mutation probability Pm to 1. A two-point crossover operator was adopted to exchange segments of binary chromosomes representing facility selections.
(2)
According to the recommendations of Eiselt et al. [71,72], the α value in the service coverage function was set to 0.75, and β was set to 0.12.
(3)
Following Rajendran et al. [36], the complete service distance was set to 1600 m, and the maximum service distance was set to 3000 m.
(4)
The minimum distance between vertiports was set to 500 m [11].
(5)
According to the recommendations of Brunelli et al. [18,73], the minimum service capacity for each vertiport was set to 120, with a maximum service capacity of 12,000.
(6)
The number of vertiports, denoted as H, was varied from 10 to 100 in increments of 10.
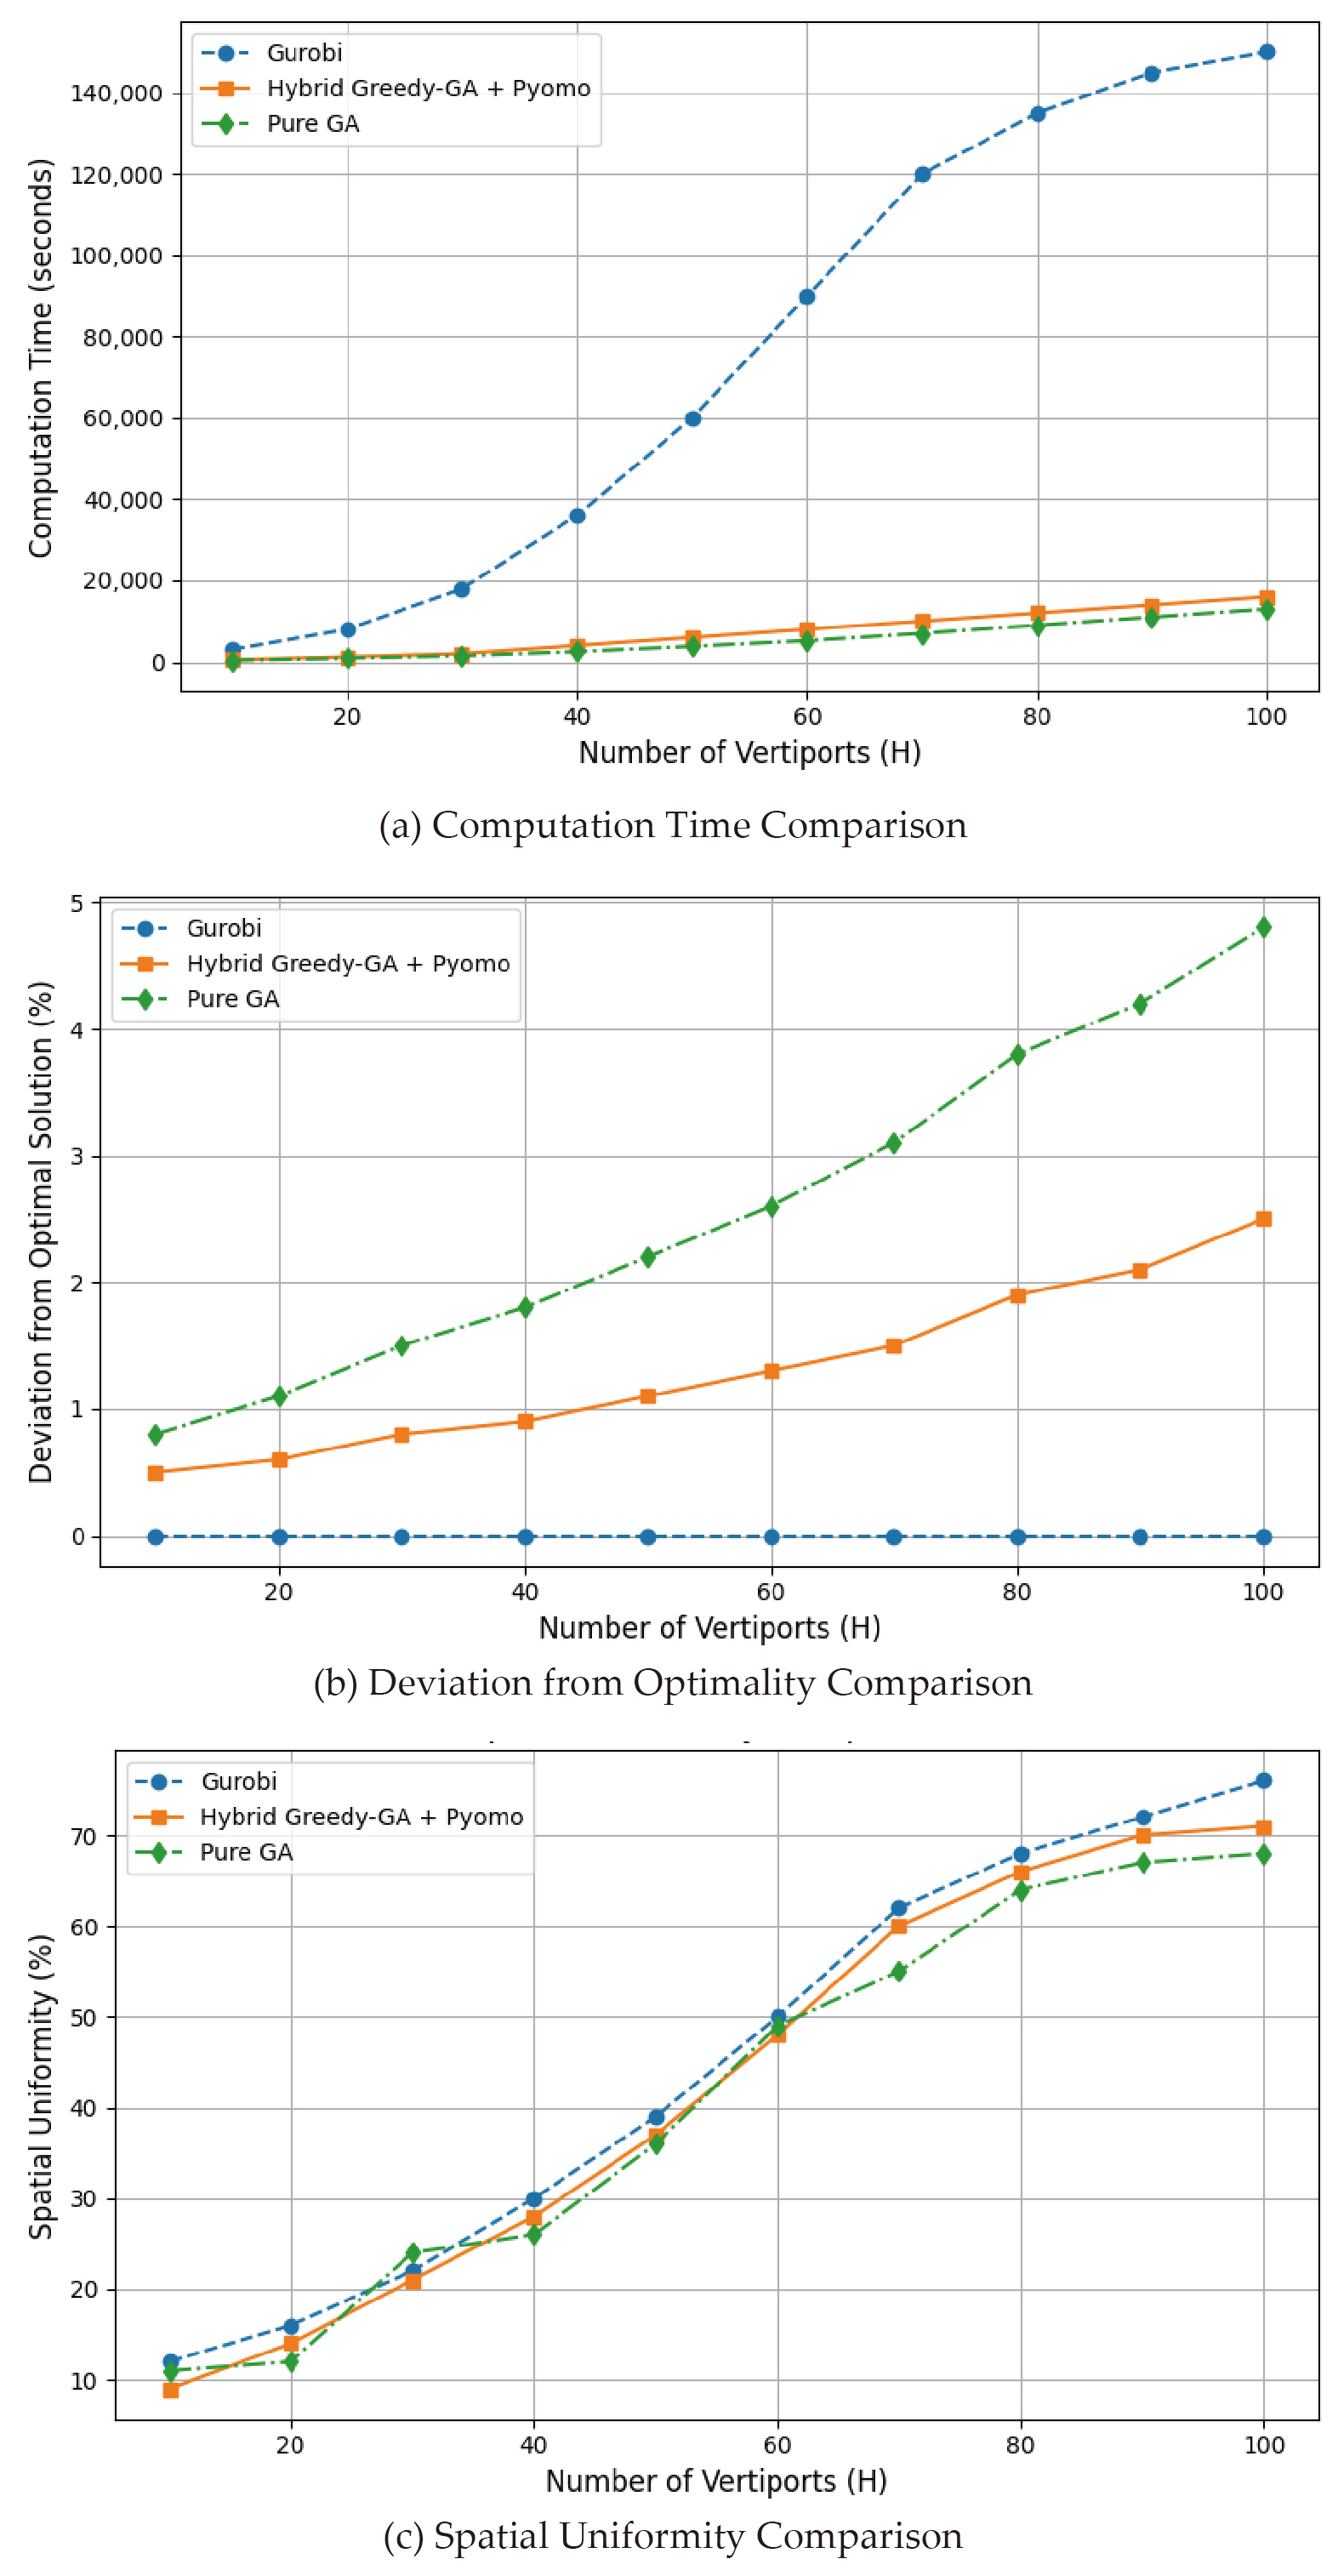
As shown in Figure 10a,b, the hybrid greedy–GA + Pyomo algorithm significantly reduces computation time compared to the exact solver Gurobi 11.0.3, while maintaining near-optimal solution quality—with deviations remaining below 2.5% even as problem size increases. Notably, Figure 10c also illustrates that, in terms of spatial uniformity, the pure GA performs the worst, exhibiting higher spatial clustering and less equitable distribution of selected sites compared to the other approaches.
By contrast, the Hybrid approach strikes a strong balance between computational efficiency and solution robustness. It produces spatially balanced vertiport layouts comparable to those generated by Gurobi 11.0.3, while avoiding the inconsistency and spatial bias often observed in purely heuristic methods. In summary, the hybrid greedy–GA + Pyomo algorithm emerges as a scalable, accurate, and practically viable method for large-scale vertiport site selection—effectively bridging the gap between exact optimization and heuristic flexibility.

5. Case Study

To validate the effectiveness of the proposed vertiport site selection methodology, this chapter presents a case study in Shenzhen. Based on the evaluation index system developed in Section 3, a set of candidate vertiport locations is first identified. Multi-dimensional travel demand data are then integrated to represent Urban Air Mobility needs. The PCM-DSL optimization model introduced in Section 4 is subsequently applied to determine the optimal spatial layout of vertiports.
To evaluate the model’s robustness, sensitivity analyses are conducted by adjusting key parameters. This allows an examination of how variations in indicator combinations and parameter settings affect the final site selection outcomes, thereby demonstrating the stability and adaptability of the proposed approach.

5.1. Study Area and Data

5.1.1. Study Area Selection

Located in southern China (as shown in Figure 11), Shenzhen spans a total area of approximately 1997.47 square kilometers and has a population exceeding 17 million, making it one of the most densely populated cities in the country. In 2024, Shenzhen ranked among the top three cities in China in terms of annual household income, with an average exceeding 800,000 yuan, indicating a substantial consumer market [74].
Furthermore, Shenzhen has launched several UAM pilot projects, including eVTOL air taxi test flights and drone-based logistics systems. These initiatives provide valuable real-world scenarios and data to support the implementation and advancement of UAM in urban settings.

5.1.2. Database Building

The data utilized in this study were primarily obtained from publicly available sources, such as government websites and statistical yearbooks. Table 6 summarizes the data and their respective sources.
To ensure realistic and application-oriented modeling, the database incorporates representative technical specifications of eVTOL vehicles as reference parameters. These include cruise speed (typically ranging from 100 to 320 km/h), range (15 to 250 km), passenger capacity (1 to 6 seats), charging duration (30 to 90 min), noise level (60 to 75 dB during takeoff and landing), and maximum takeoff weight (360 kg to over 3000 kg), drawn from widely reported data on currently leading eVTOL models. These parameters are used to define service coverage limits, infrastructure design requirements, and operational constraints in the spatial database and subsequent optimization modeling.
Notably, UAM demand plays a critical role in determining vertiport locations. Coppola et al. [75,76] combined stated preference (SP) and revealed preference (RP) data and employed discrete choice models—including logit and hybrid choice models—to forecast potential UAM demand based on individual socioeconomic and behavioral factors. Qu et al. [77] proposed a UAM demand forecasting approach based on the four-step travel demand model, with a key enhancement in the modal split stage using a nested logit model to estimate future UAM adoption. This logit-based framework allows for mode choice prediction despite the absence of observed UAM usage data, providing a practical solution for early-stage planning. Ahmed et al. [78] developed a data-driven framework for UAM demand prediction using deep learning models, including LSTM, GRU, and Transformer architectures.
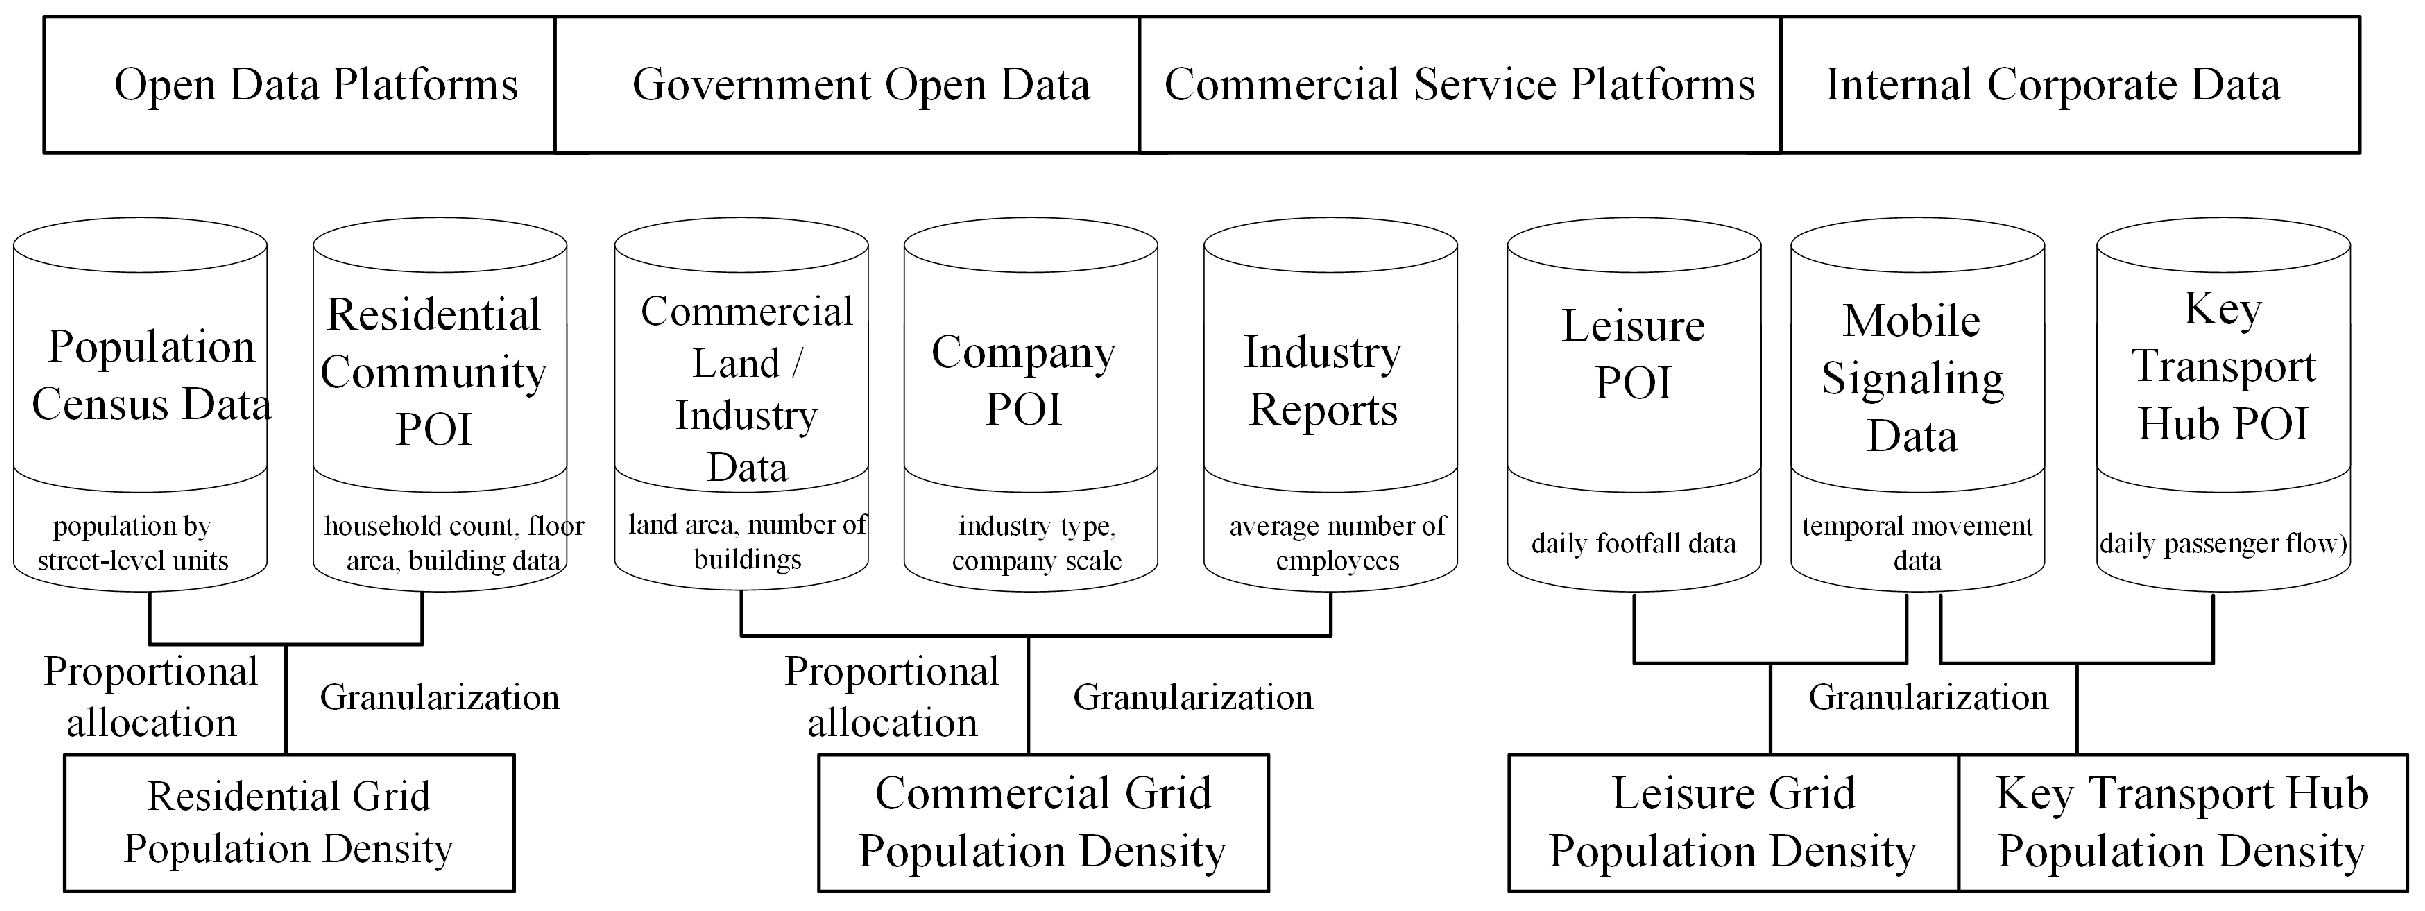
However, given that UAM is still in its early stages and lacks real-world operational data, this study focuses on estimating potential demand based on demographic, socioeconomic, and spatial accessibility factors. Key variables include population density, income level, employment density, and POI distribution. UAM demand is assumed to originate from four primary types of human activity: residential-, occupational-, recreational-, and transport-related travel. As illustrated in Figure 12, demand is assessed by analyzing population distribution and functional land use across urban areas.
In this study, street-level demographic data from the 2020 census are first mapped to administrative subdistricts. Residential travel demand is then disaggregated to the grid level using the spatial distribution of residential communities. Business travel demand is estimated from enterprise-related data, including company POIs, industry reports, and statistical sources. Leisure and transport-related travel demand are derived from relevant POI categories, such as commercial, entertainment, and transport hubs.
These static indicators are then combined with dynamic mobility data extracted from mobile signaling records. Both datasets are aligned to a uniform grid system to enable the joint analysis of potential and actual travel patterns. Trip purposes are inferred based on the temporal and spatial features of the OD flows. The integrated dataset supports demand modeling, attraction analysis, and the generation of high-resolution travel heatmaps. Figure 13 shows the resulting heatmap, with origin and destination intensities aggregated at the grid level.

5.2. Preliminary Screening of Candidate Vertiport Locations

Building on the Modular Grading Evaluation Index System developed in Section 3, this section conducts a screening analysis of candidate vertiport locations by incorporating the spatial characteristics of Shenzhen. By applying various combinations of evaluation indicators and adjusting grading levels, the analysis examines how changes in the index system affect site selection outcomes.

5.2.1. Customizing the Evaluation Index System for Shenzhen

In the early stages of UAM development, implementation efforts face considerable complexity and uncertainty. To address the demands of early pilot projects, this study adopts high-standard criteria across three key dimensions—safety, social feasibility, and economic viability—to construct a preliminary evaluation index system for vertiport site screening. The detailed index system is presented in Table 7.
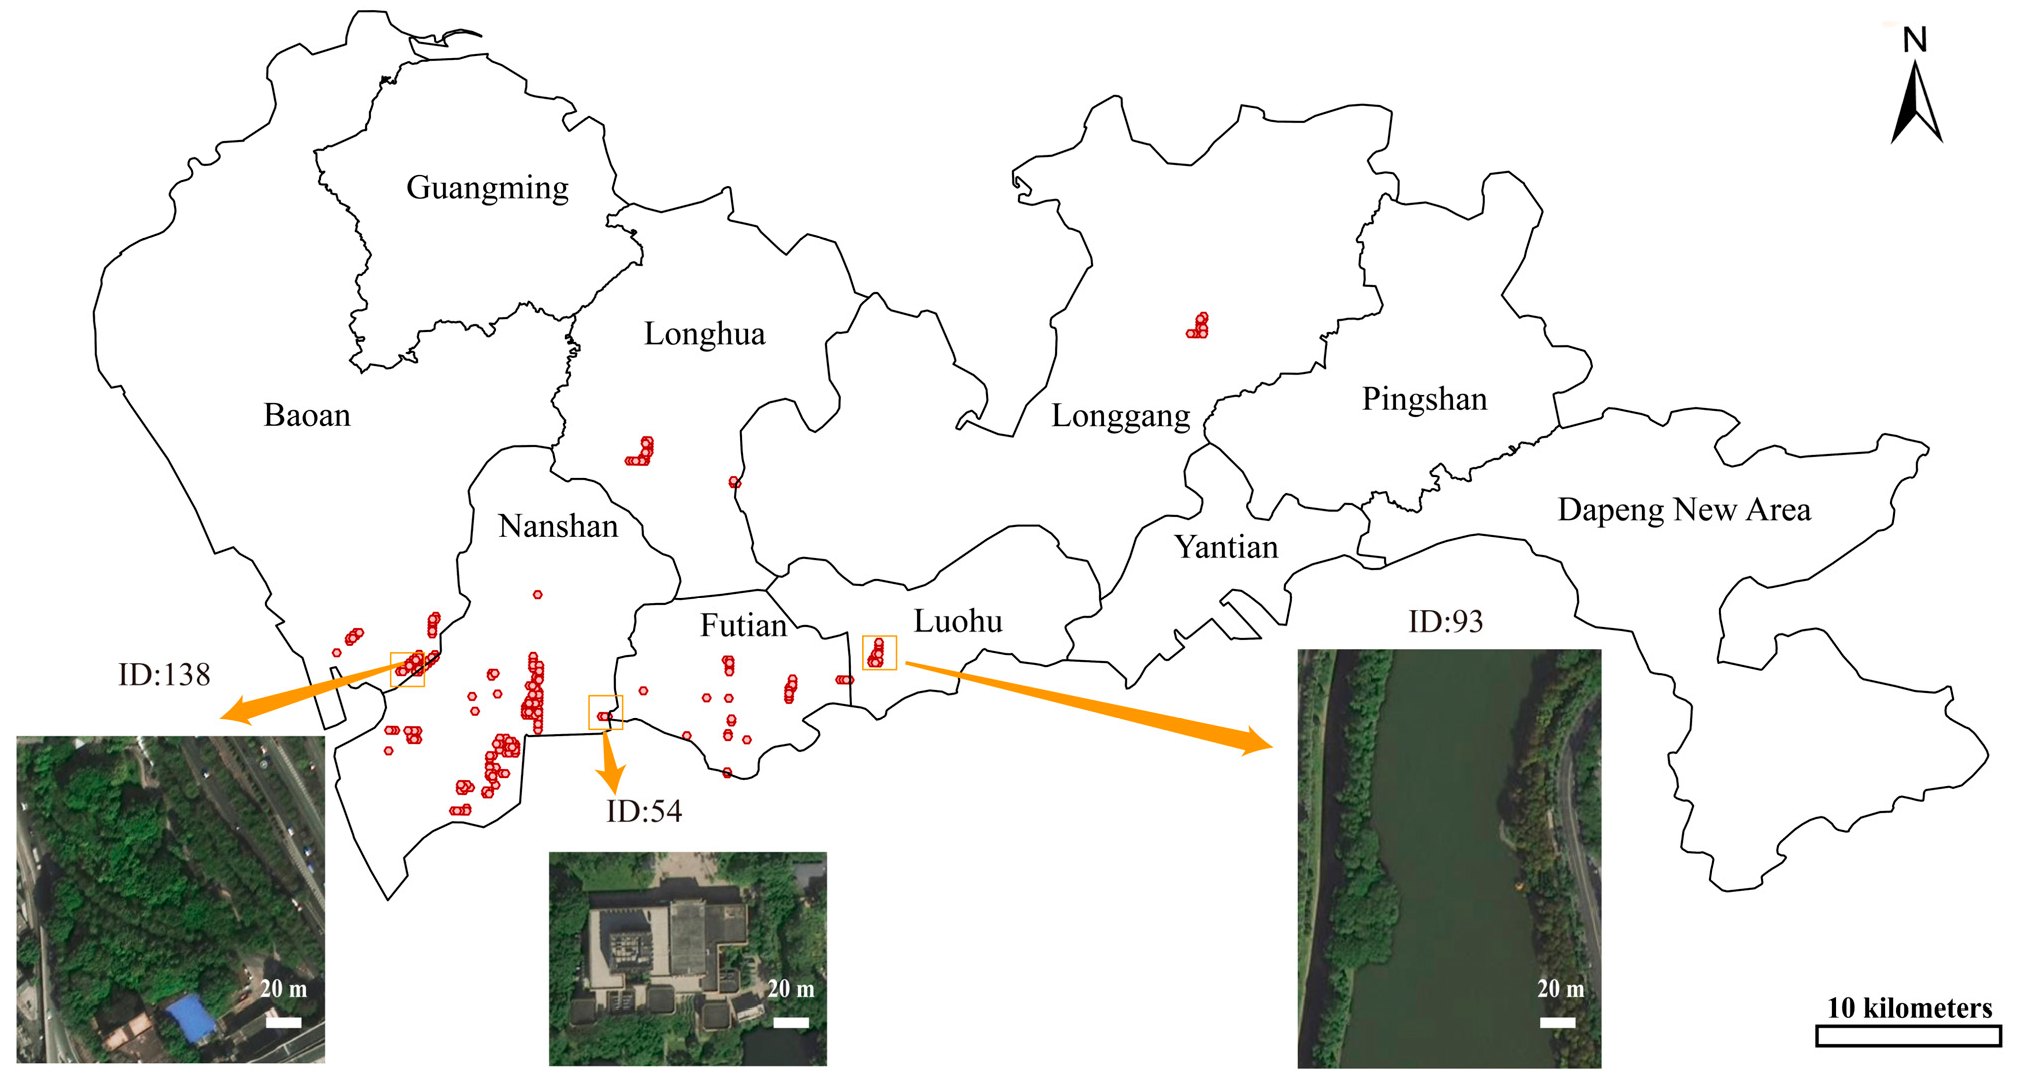
Based on the screening process described in Section 3.3, a total of 212 candidate sites remain under the high-standard scenario (see Figure 14). Notably, these sites are overwhelmingly concentrated in Shenzhen’s economically advanced districts, reflecting the strong spatial correlation between UAM suitability and urban economic intensity. Among them, Nanshan District alone accounts for 55% of the total, reflecting its role as a high-tech and innovation hub, home to major technology firms, and research institutions, and the Qianhai Free Trade Zone. Bao’an District and Longhua District together contribute an additional 24%, both known for their robust industrial bases, logistics infrastructure, and dense residential clusters. The observed spatial pattern highlights how urban economic structure and functional intensity significantly influence the distribution of feasible vertiport sites.
Further analysis, as illustrated in Figure 14, suggests that rooftops of existing commercial- or mixed-use buildings (e.g., ID 54) represent feasible options for vertiport deployment within dense urban cores. Additionally, areas such as green corridors along elevated transport infrastructure (e.g., ID 138) and parcels adjacent to rivers or waterfronts (e.g., ID 93), which typically offer sufficient vertical clearance, are also promising due to reduced spatial constraints and improved accessibility for eVTOL operations. However, their relatively distant locations from key residential and employment zones present significant challenges for practical and equitable implementation.

5.2.2. Sensitivity to Evaluation Grade Adjustments

As shown in Figure 15, the Modular Grading Evaluation Index System introduced in Section 3 is organized around three core modules: social feasibility, safety, and economic feasibility. To reflect both the interdependence and independence of indicators, each module includes three grading levels—high, medium, and low. In practice, decision-makers can flexibly combine grading levels across modules based on a city’s specific characteristics. This design accommodates diverse policy priorities during the early stages of UAM development and the functional heterogeneity of urban areas. Its modular and flexible structure enables the scientifically grounded and adaptive evaluation of candidate vertiport locations.
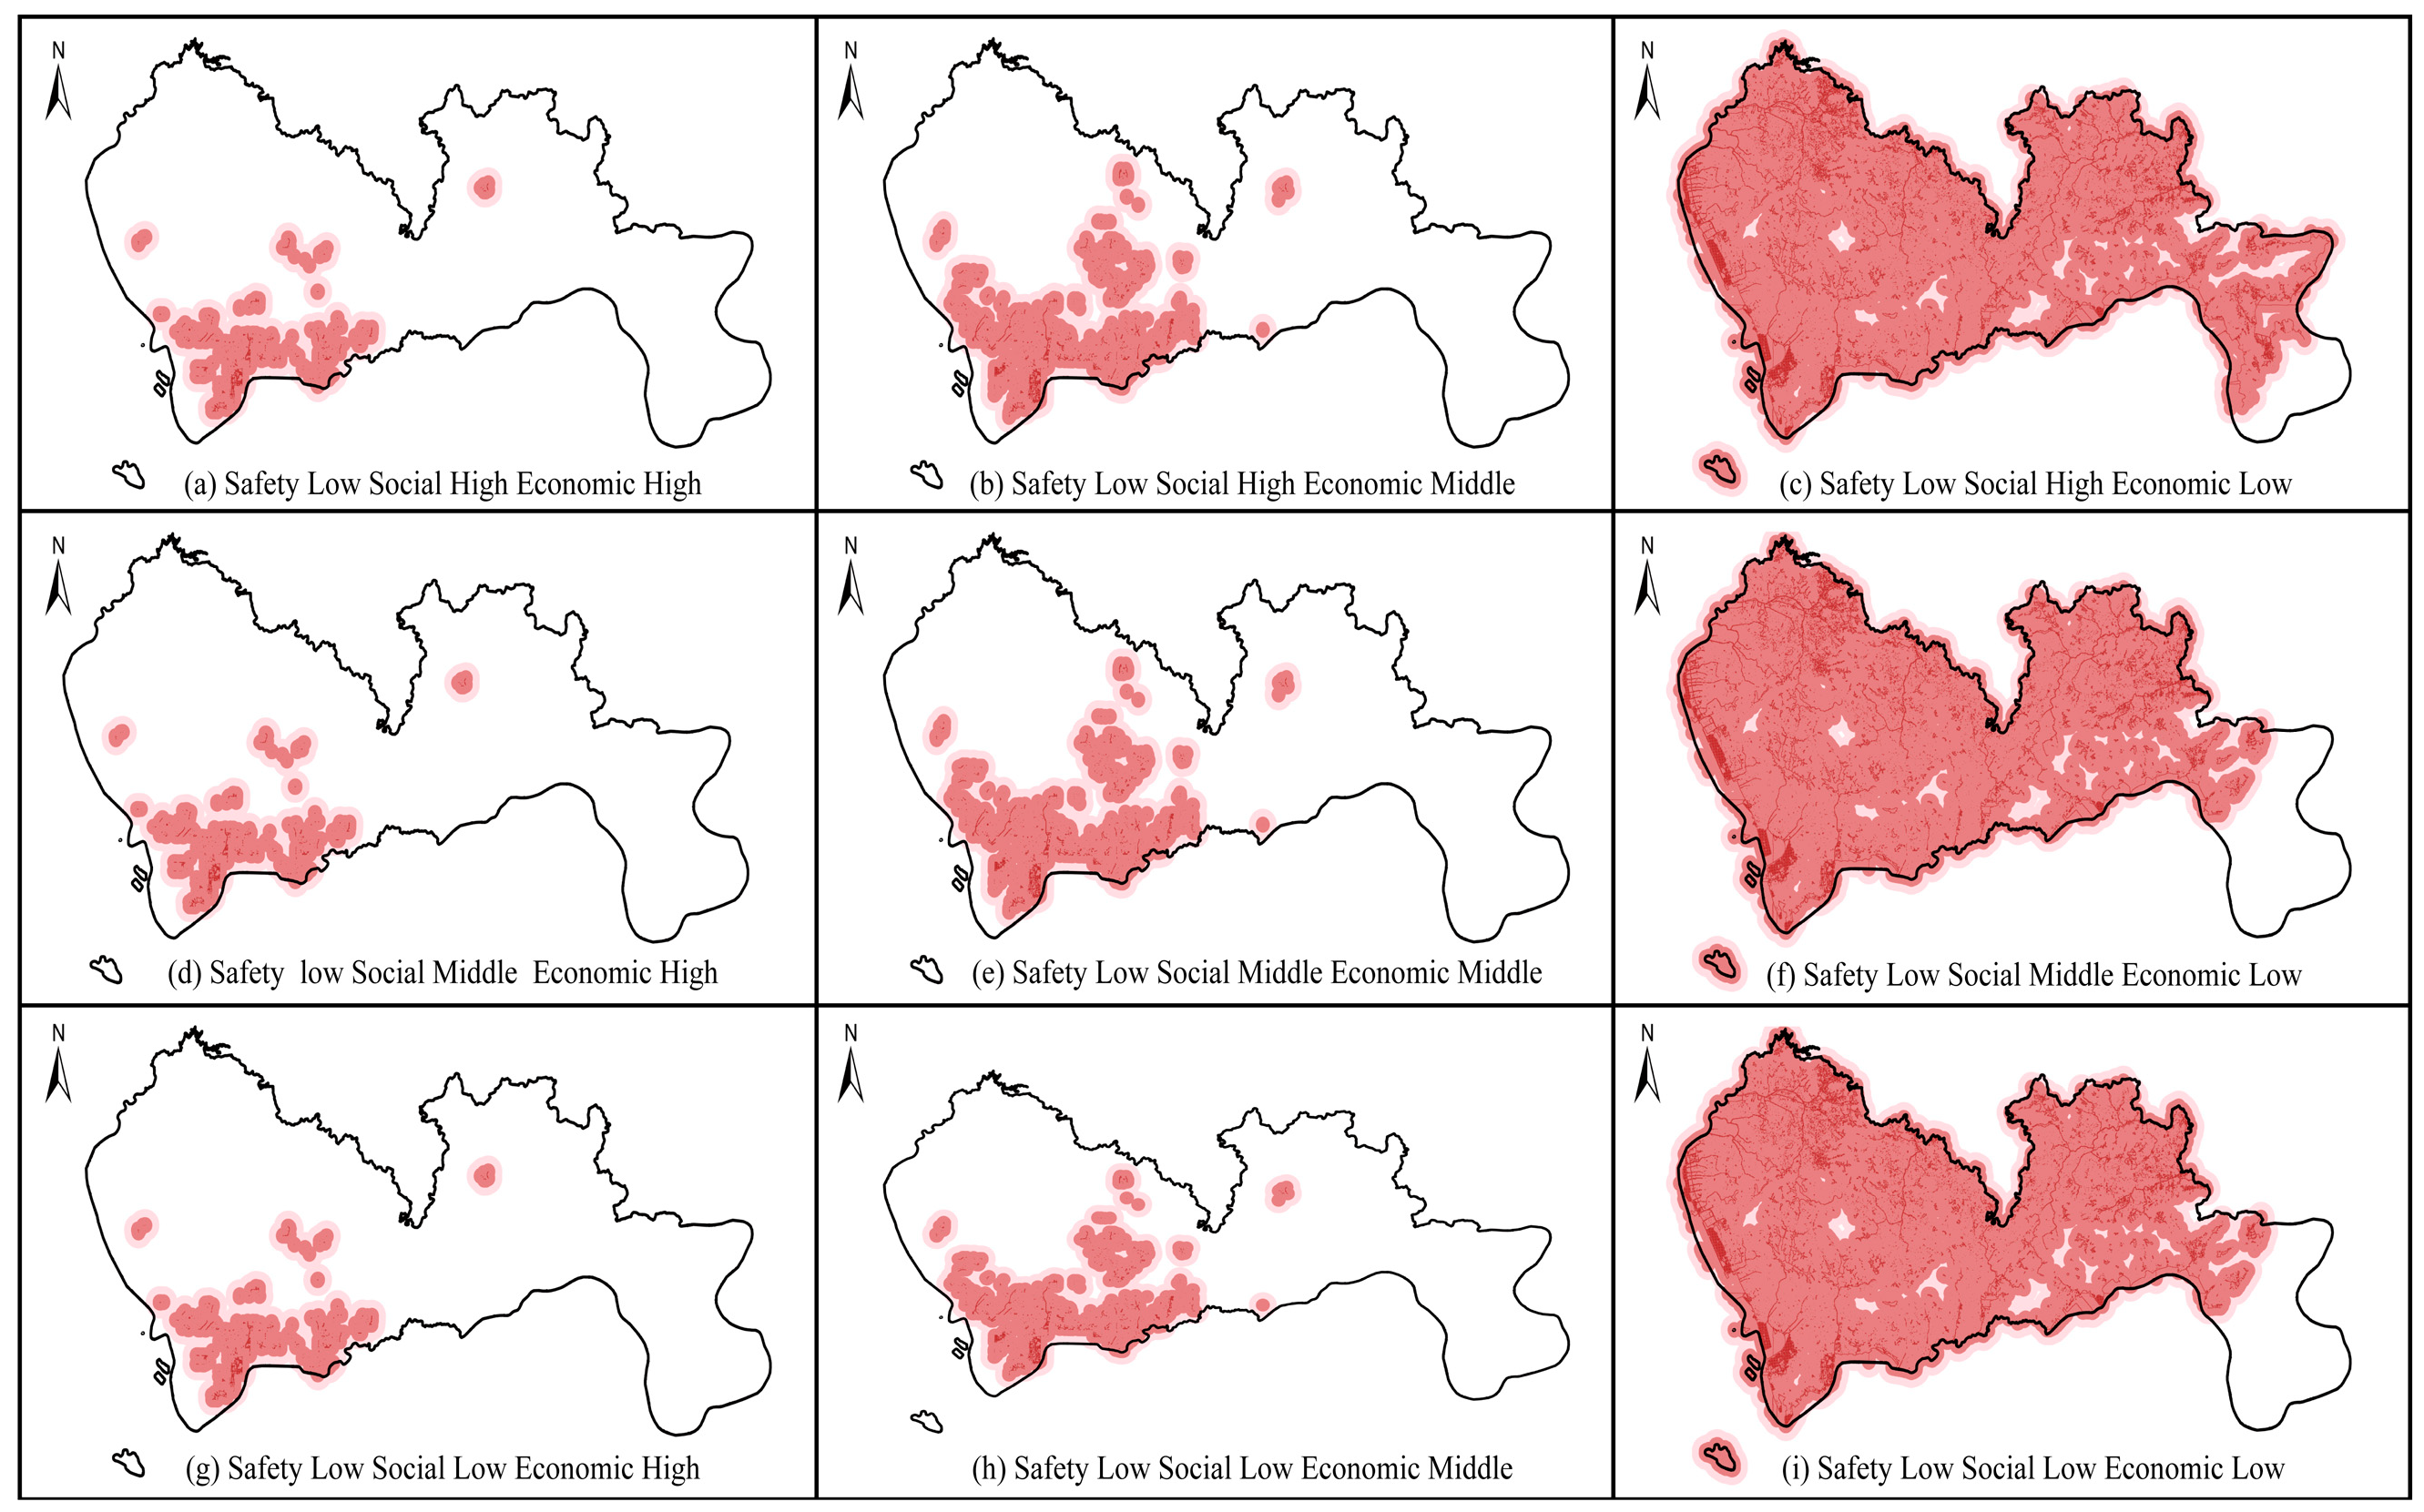
This study applies nine grading configurations across the evaluation modules to assess their impact on vertiport site selection. As shown in Figure 16, results vary notably under different module-level settings. Under low safety requirements, both the location and service coverage of candidate vertiports differ significantly depending on social and economic criteria. These differences highlight the sensitivity of site selection outcomes to changes in the evaluation index system.
(1)
Safety Criteria. A comparison between Figure 14 and Figure 16a shows that safety-related indicators significantly influence the spatial distribution of candidate vertiport sites. Requirements such as helipad area and takeoff/landing procedures impose critical constraints. Under high safety standards, sites are limited to low-obstruction areas—such as water bodies, greenbelts, and transportation buffers—and are typically distant from dense residential, commercial, and office zones. In contrast, when safety requirements are relaxed, rooftops become viable locations, leading to a substantial increase in candidate sites and a shift toward areas with high human activity.
(2)
Economic Feasibility Criteria. A comparison of Figure 16a–c indicates that economic criteria strongly influence site selection outcomes. As economic thresholds decrease from high to medium and low, the number of candidate sites increases significantly, along with an expansion in overall service coverage. Under low economic constraints, candidate sites extend across nearly the entire study area, underscoring the regulatory role of economic feasibility in early-stage vertiport deployment.
(3)
Social Feasibility Criteria. Figure 16a,d,g show that social criteria also impact site selection. Shenzhen’s spatial heterogeneity—driven by topography and uneven functional zoning—produces varied suitability across districts. For example, Nanshan and Futian emphasize innovation, finance, and tourism; Luohu centers on traditional commerce; while Bao’an and Longgang focus on manufacturing and logistics, coupled with large residential populations. These functional distinctions shape how social criteria constrain candidate site distribution.
Further analysis reveals that under medium- and high-level configurations, candidate sites are predominantly concentrated in the southwestern part of the city. In contrast, other areas contribute few or no feasible sites due to limited infrastructure and lower economic development. These spatial disparities highlight the influence of urban function, development intensity, and land availability on vertiport site suitability. Moreover, stricter evaluation criteria further amplify this spatial concentration trend.

5.2.3. Region-Specific Evaluation Based on Urban Functional Zoning

Given Shenzhen’s large size, population, and subregional differences in geography, society, and transport demand, the evaluation model from Section 3.3 is further refined. At the subdistrict level, Shenzhen’s 74 subdistricts are classified into four functional zone types based on their dominant characteristics: 14 business districts, 23 manufacturing zones, 18 recreational areas, and 19 residential neighborhoods.
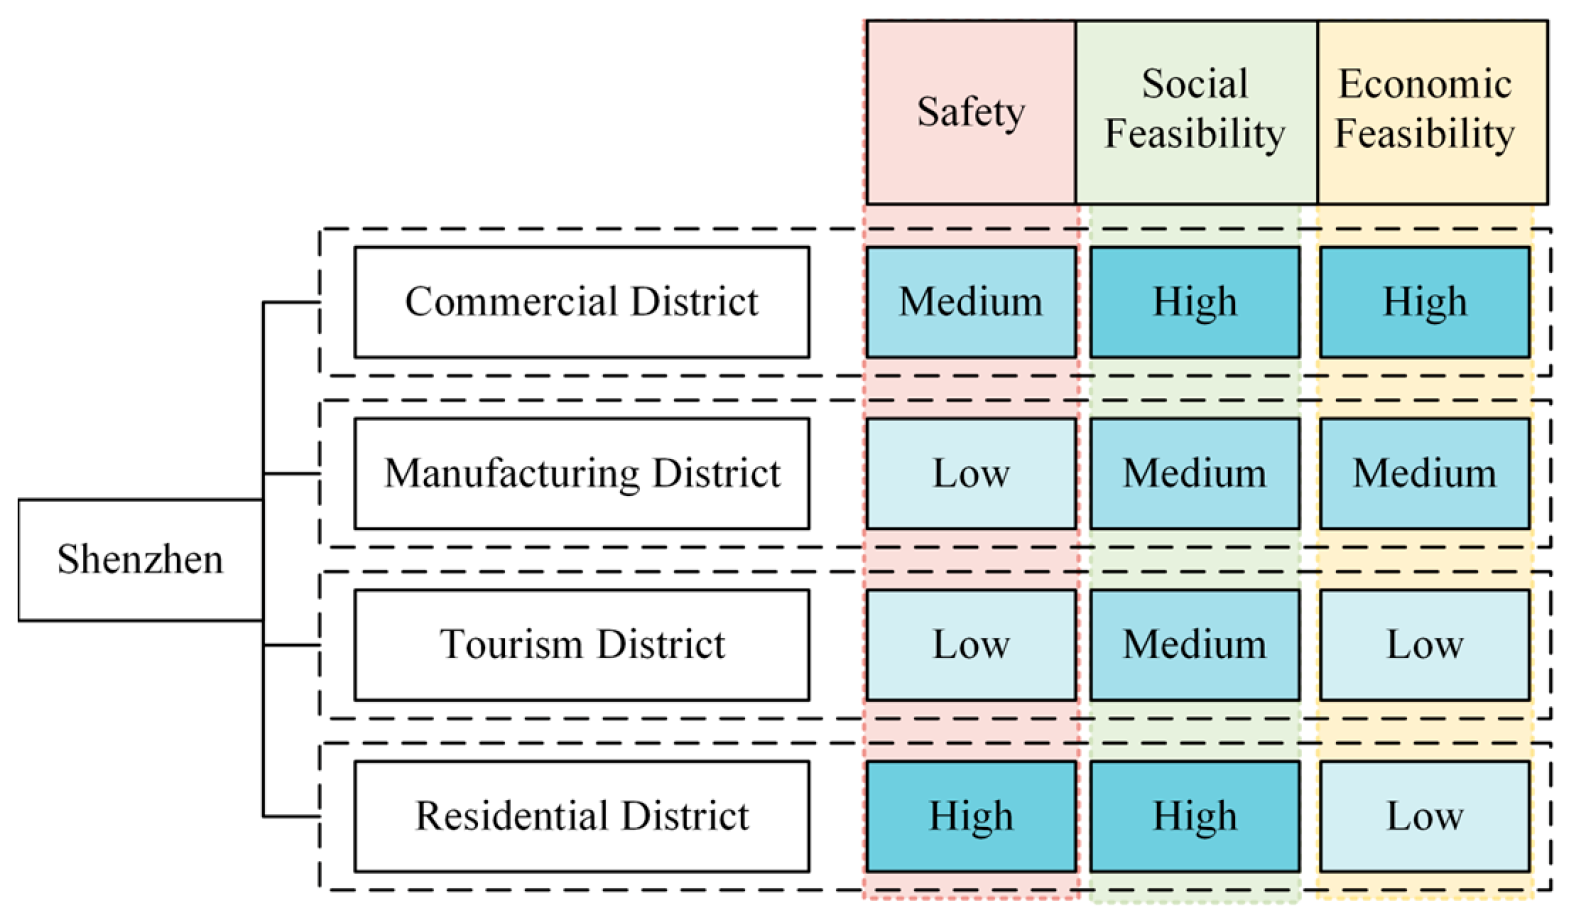
Grading levels for each category are tailored to local conditions with input from domain experts, enhancing the model’s adaptability and precision (see Figure 17). Commercial districts, where available land is limited, prioritize economic considerations and are evaluated with medium safety, high social feasibility, and high economic feasibility standards. Residential districts emphasize safety and social feasibility, thus adopting high safety and social standards but lower economic constraints. Tourism areas, with relatively low population density, apply lower economic and social thresholds. Manufacturing zones, also with lower residential density, focus primarily on social and economic factors, with reduced safety requirements.
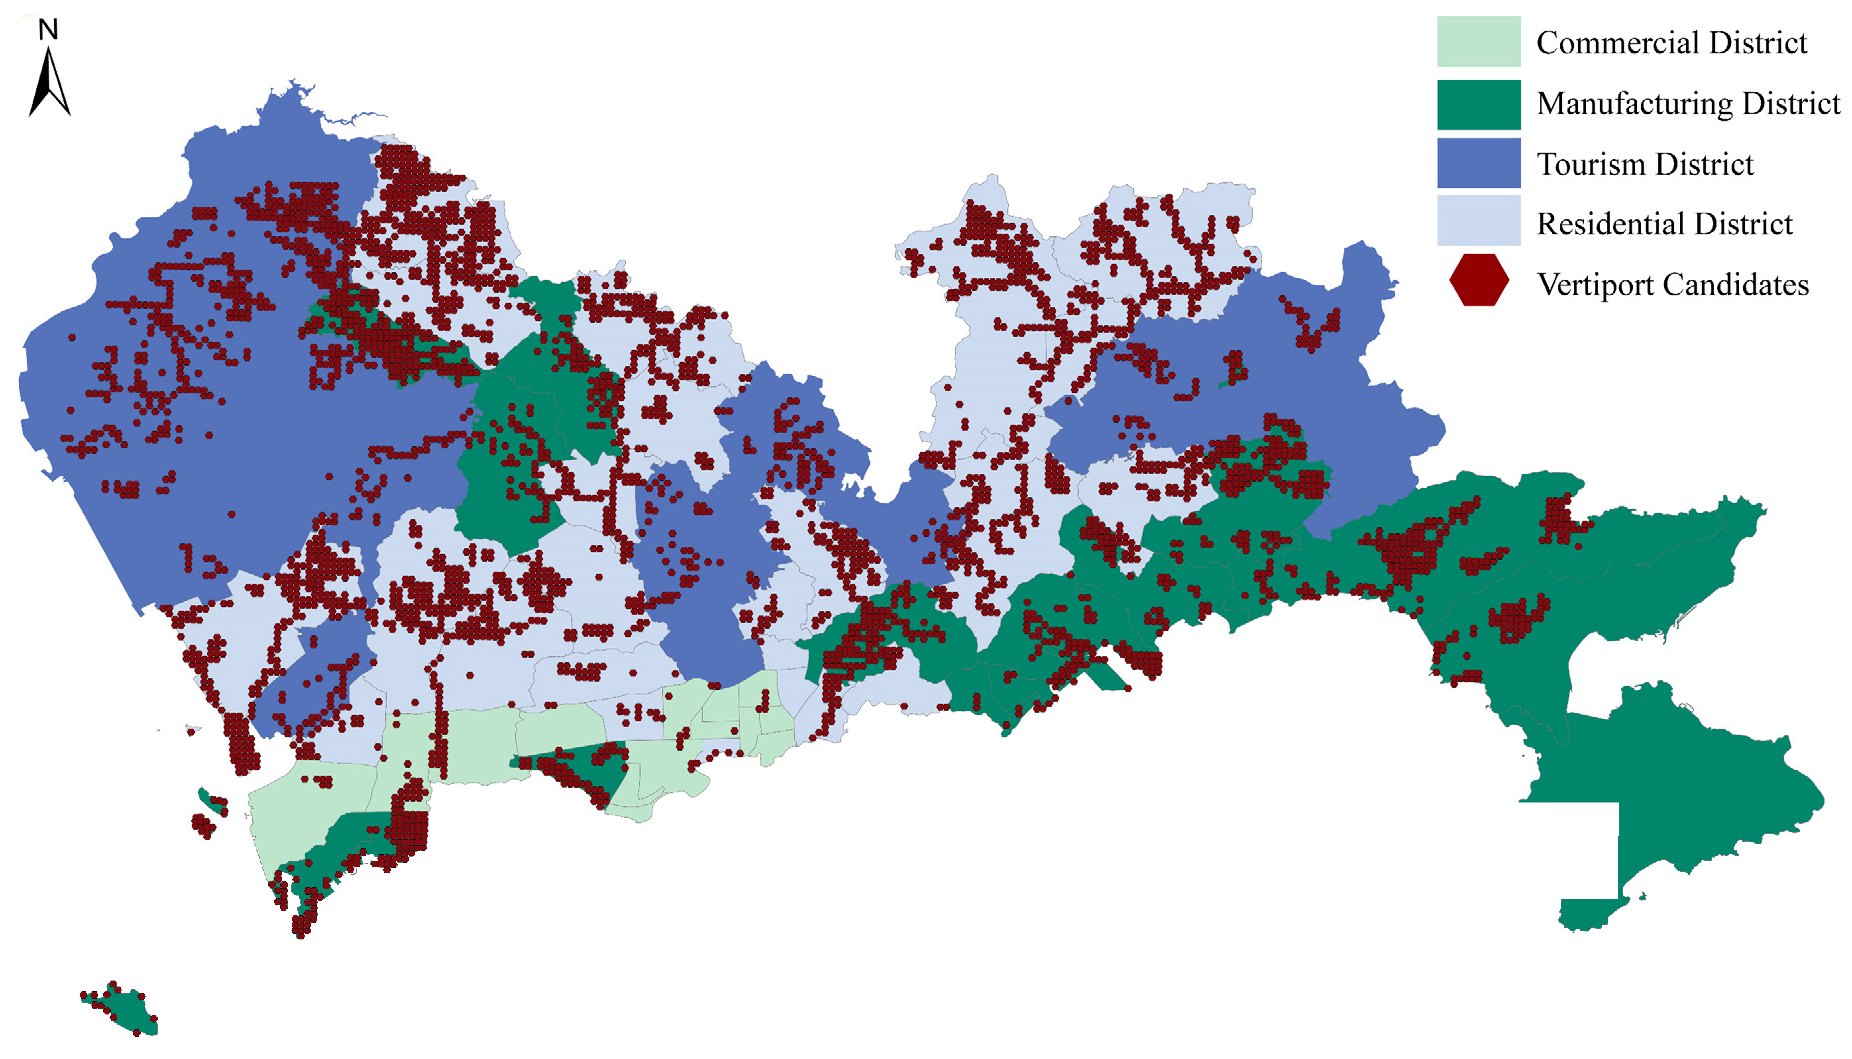
Following the implementation of this context-sensitive evaluation index system, a more refined preliminary analysis of vertiport site selection was conducted. As shown in Figure 18, a total of 3977 candidate vertiport locations were identified. Compared to previous approaches, the functional zoning-based index system produces a more balanced spatial distribution, reducing excessive clustering and improving both the rationality and adaptability of the site selection outcomes. Based on these candidate vertiport locations, subsequent stages of vertiport confirmation and final site selection can now be carried out.

5.3. Final Determination of Vertiport Locations

Given the limited availability of resources and the necessity for their efficient allocation, the initially identified candidate points were further refined using the optimization method proposed in Section 4.
Using Shenzhen as a case study, a total of 3977 candidate locations were selected based on the analysis in Section 5.2.3, along with 2370 corresponding demand points. Due to the large scale of the problem, traditional exact solvers were no longer computationally feasible for achieving optimal solutions. Therefore, only heuristic algorithms were employed to explore this scenario. The parameter settings used in this case study differed from those in Section 4.4.2 and were adjusted as follows:
(1)
The number of iterations (Gen) was set to 700 to ensure sufficient evolutionary depth for convergence.
(2)
The population size (N) was increased to 150 to enhance diversity in the solution space.
(3)
The mutation probability (Pm) was adjusted to 0.7, balancing exploration and the preservation of high-quality genetic structures.

5.3.1. Comparison of the Results of Three Location Strategies

To explore the effects of different numbers of vertiports on overall facility performance, the number of vertiports (H) was varied from 10 to 250 in increments of 10 to cover a wider range of facility deployment scenarios.
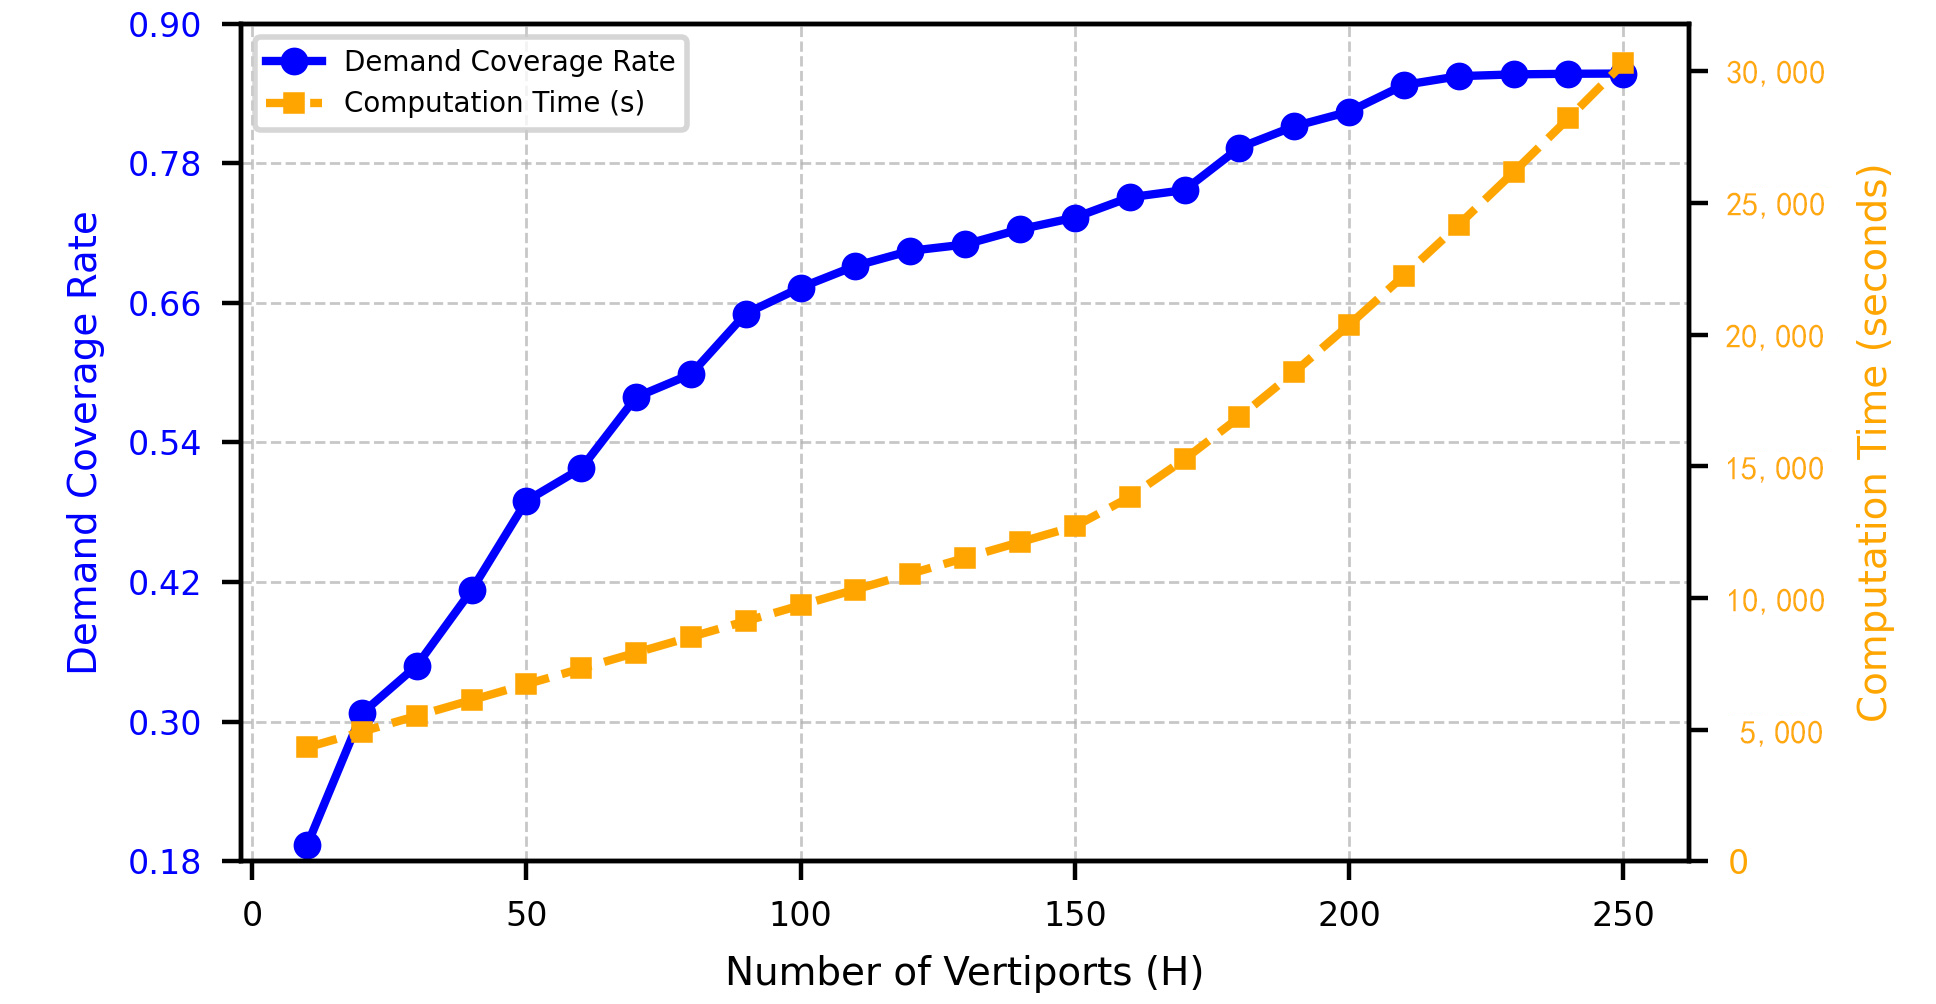
Figure 19 illustrates how the number of vertiports affects demand coverage and computation time. The coverage rate demonstrates a clear pattern of diminishing returns. From H = 10 to H = 100, it increases rapidly—from 0.19 to 0.67—indicating high marginal gains in early deployment. Between H = 110 and H = 200, the growth slows, and marginal improvements decline. For example, coverage increases by only 0.09 from H = 150 to H = 200, compared to 0.47 in the initial phase. After H = 210, gains become minimal, with total improvement under 1.3% and several increments below 0.05%, suggesting a saturation point. Thus, deploying more than 220 vertiports yields limited benefits. A practical range of H = 180–210 may offer the best trade-off between coverage and infrastructure cost.
In contrast, computation time follows a markedly different trend. When the number of vertiports is small, computation remains relatively fast. However, it grows gradually at first and then increases sharply beyond H = 150. After H = 200, solving the problem may take several days, reflecting a steep rise in computational burden. This nonlinear increase highlights the growing complexity of larger problem instances and underscores the importance of balancing solution quality with algorithmic scalability.

5.3.2. Final Location Scheme

When the number of vertiports (H) exceeds 120, the demand satisfaction rate surpasses 70%, indicating that the majority of travel needs are effectively met. As H continues to increase beyond this threshold, the growth in satisfaction becomes progressively marginal—rising only from 0.7046 to 0.857 between H = 120 and H = 250—suggesting a diminishing return effect in service coverage.
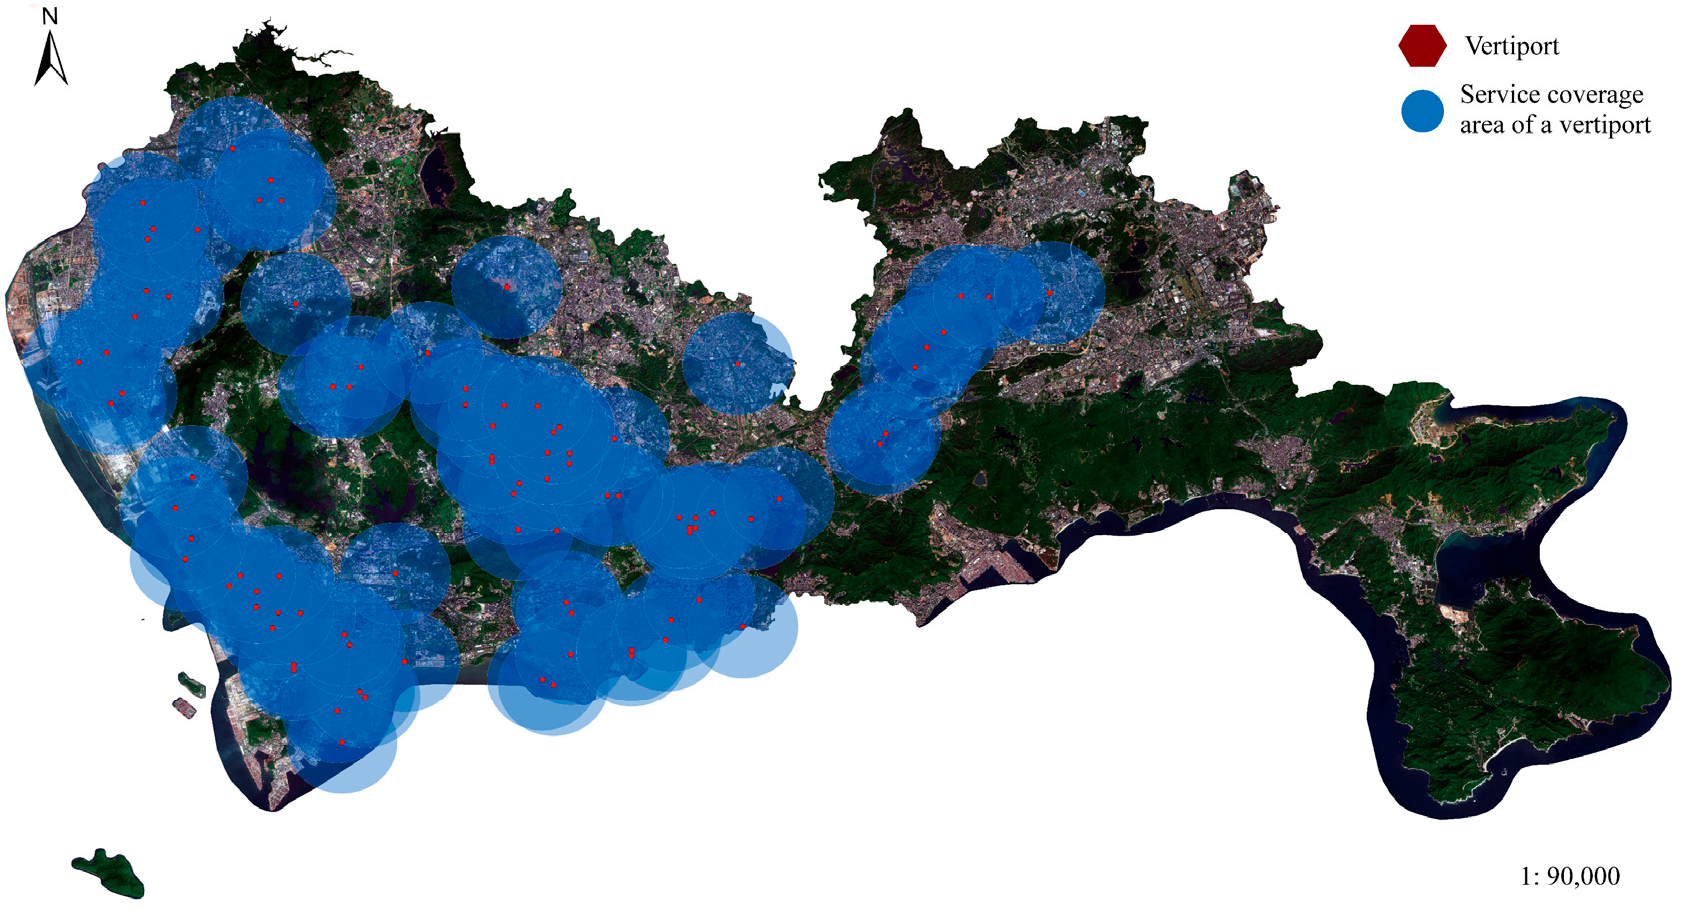
Spatially, the selected vertiports are concentrated in central and western Shenzhen, particularly along major transport corridors in Nanshan and Futian, reinforcing their roles as key service hubs. This spatial distribution closely aligns with areas of high population density and urban activity. Most vertiports are located in or near densely populated residential and commercial districts such as Futian, Luohu, Bao’an, and Nanshan. These districts not only support large populations but also serve as economic and transportation centers, thereby generating substantial demand for Urban Air Mobility (UAM) services.
In contrast, the southeastern region—primarily Dapeng New District and parts of Yantian—contains few or no vertiport sites, mainly due to the low population density, environmental constraints, and limited urban infrastructure (As shown in Figure 20).
Figure 20. Final location scheme.
Aerospace 12 00709 g020
To further evaluate the effectiveness of the service allocation, the statistical distribution of the demand satisfaction degree variable p i j was analyzed. This variable quantifies the extent to which demand point i is served by facility   j , with values ranging from 0 (no service) to 1 (full service).
The descriptive statistics are summarized as follows: the maximum value of p i j is 1.000, the minimum is 0.123, and the mean value is 0.653, indicating that, on average, demand points are satisfied to a moderate-to-high degree. The median value further supports this observation, aligning closely with the mean.
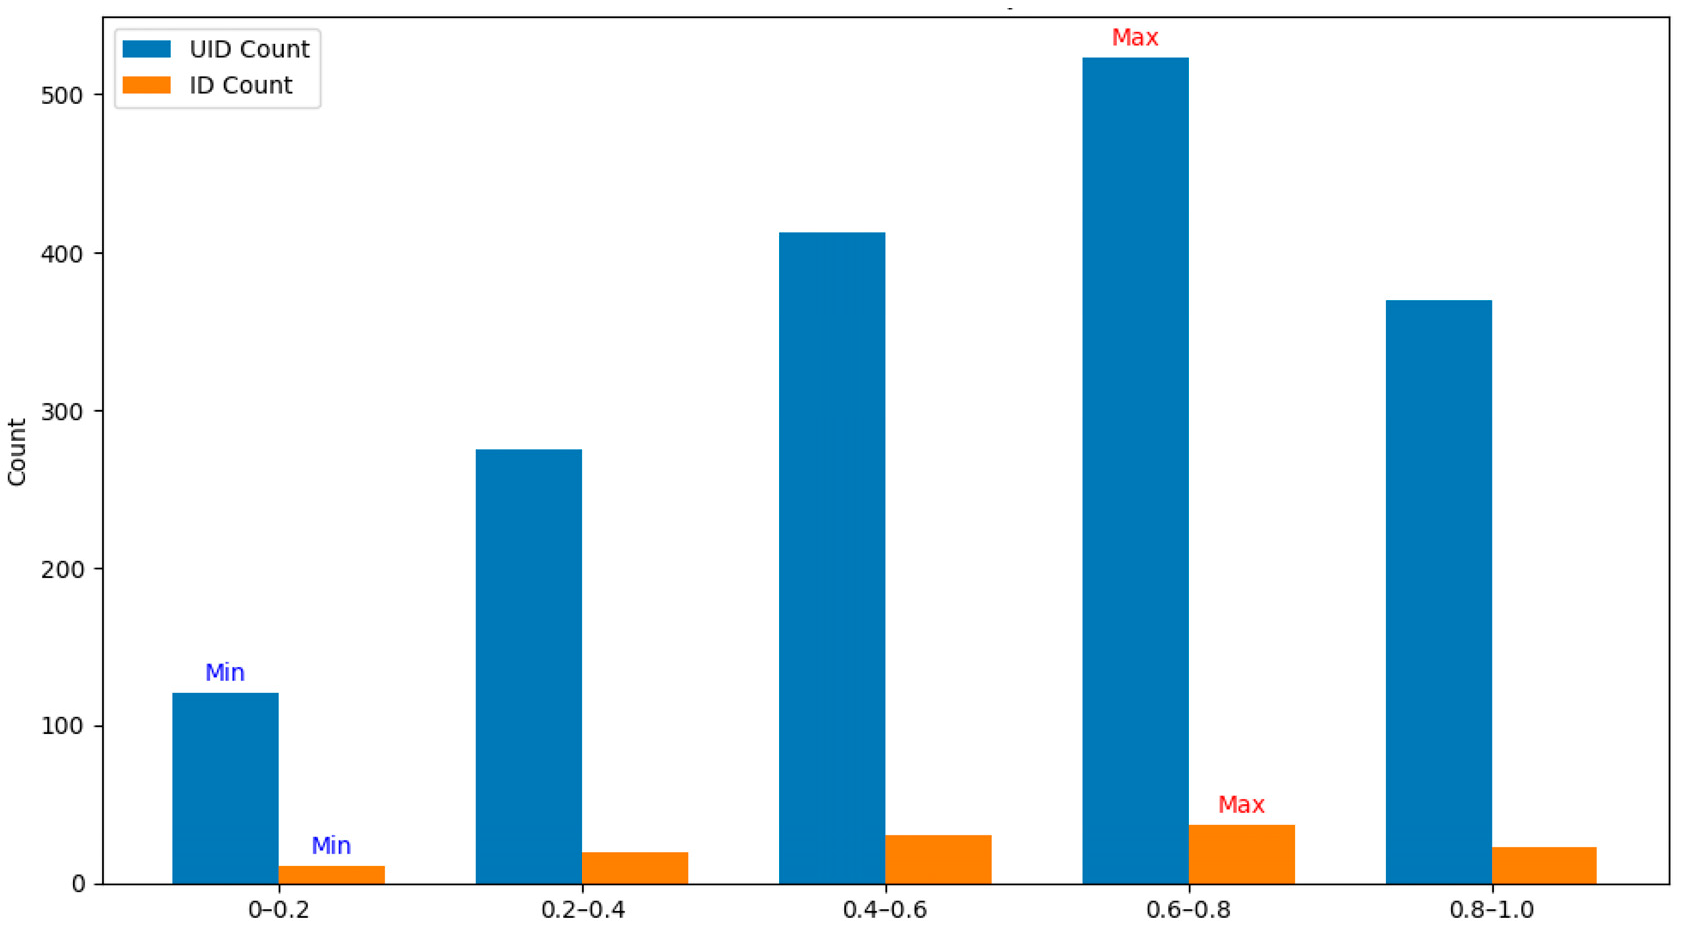
To better understand the distribution of p i j values, as shown in Figure 21, the data were grouped into five equal-width intervals: [0–0.2), [0.2–0.4), [0.4–0.6), [0.6–0.8), and [0.8–1.0]. As shown in Figure 21, the interval [0.6–0.8) contains the largest number of non-zero entries, covering the highest number of both unique demand points (ID) and facilities (UID). This suggests that the majority of assignments lie in a range of partial but substantial service levels, rather than being fully or poorly served.
The interval [0–0.2) contains the lowest number of links, reflecting the rarity of very low satisfaction levels. In contrast, a non-negligible proportion of p i j values lie within the [0.8–1.0) range, indicating that full or near-full service is still achievable under certain configurations.
These results highlight a balanced service strategy where demand is distributed across multiple facilities without over-concentration. The distribution also confirms the model’s capacity to provide broad and efficient coverage while respecting capacity and spatial constraints.

5.3.3. Sensitivity Analysis

(1)
Impact of travel demand
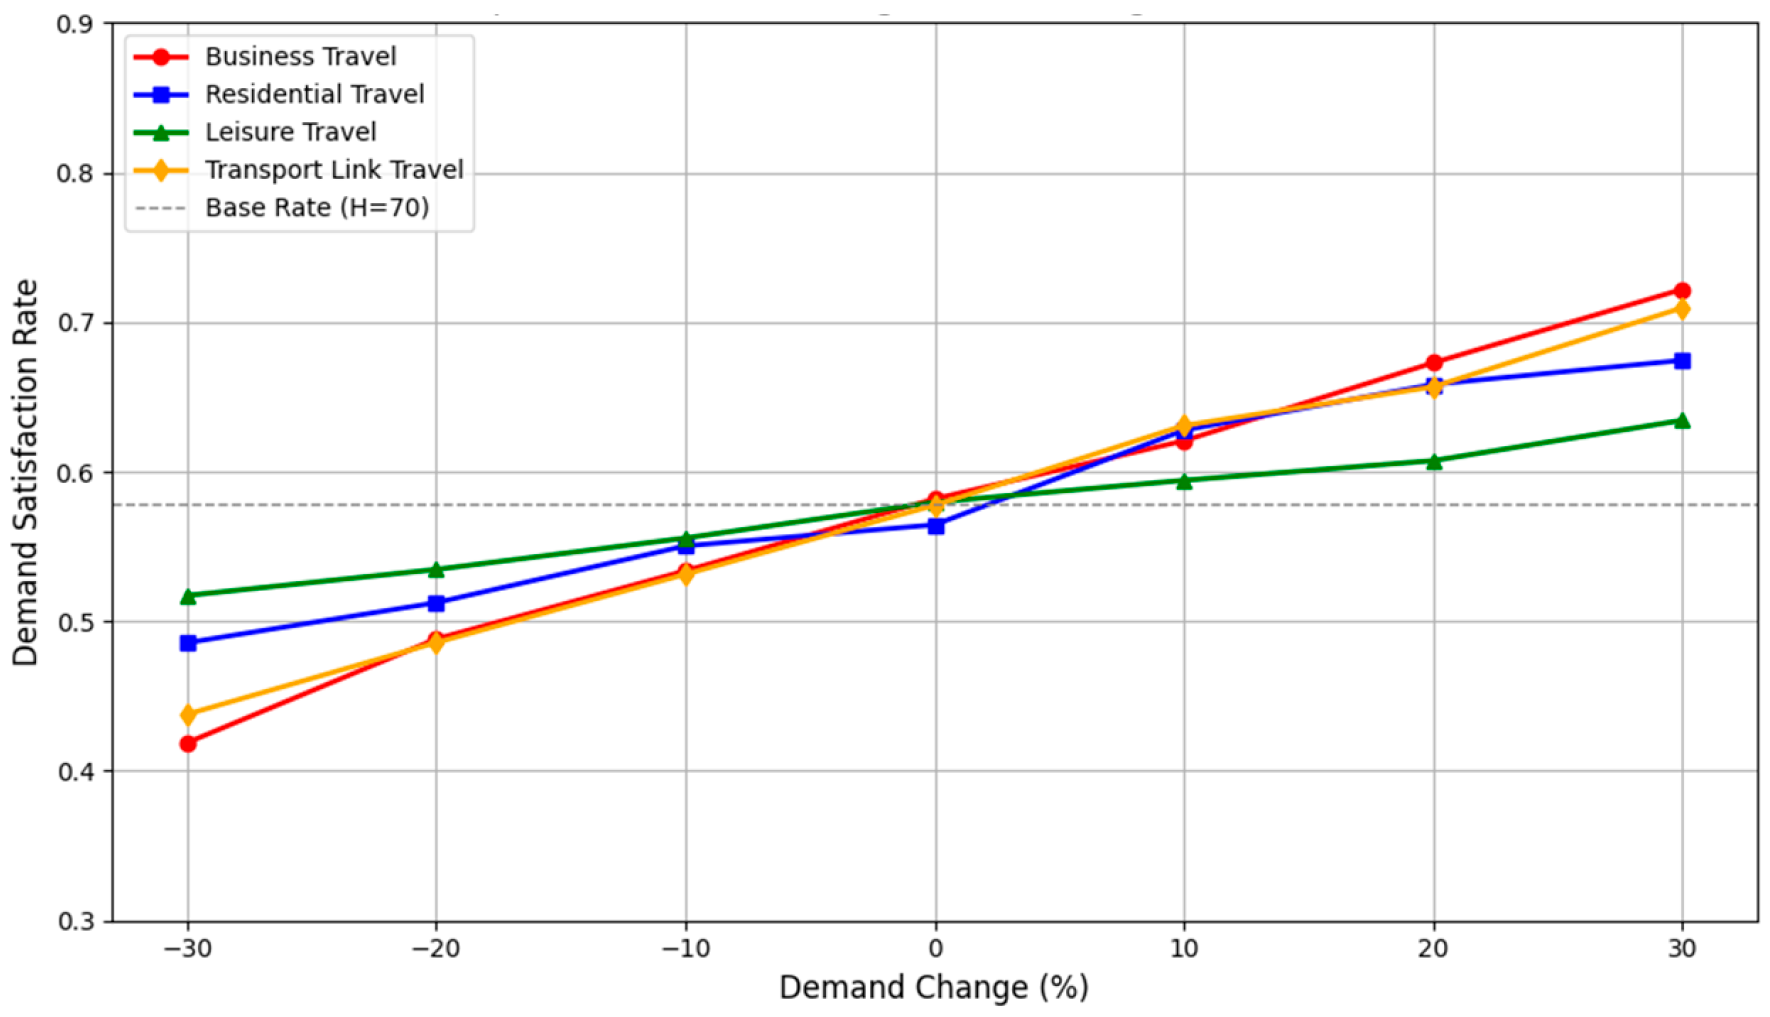
Figure 22 illustrates the variation in demand satisfaction rates (i.e., coverage ratios) for different travel purposes as total demand changes, with the number of deployed vertiports fixed at H = 70. All four travel categories—business, residential, leisure, and transport link—exhibit a consistent directional trend: as total demand increases, coverage improves; conversely, a decrease in demand results in lower coverage. This reflects a positive correlation between demand volume and service performance, indicating that higher demand levels enhance the system’s ability to satisfy spatially distributed needs.
Among the categories, business travel (red line) shows the lowest baseline coverage, approximately 0.42, but responds most strongly to demand increases, reaching about 0.72 at +30%, indicating high sensitivity. Residential travel (blue line) starts from a moderate level near 0.48 and rises steadily to around 0.68. Leisure travel (green line) exhibits the highest baseline coverage at approximately 0.52 and the smallest overall change, suggesting stable performance with low sensitivity to demand variation. Transport link travel (orange line) begins slightly below residential travel and demonstrates a steeper upward trend, similar to that of business travel.
The total demand curve reflects composite behavior, stabilizing around 70% at the baseline and reaching up to 78% when demand increases by 30%. Importantly, all curves exhibit diminishing marginal returns: as demand exceeds baseline levels, coverage increases at a decreasing rate, implying that vertiport capacity and coverage area constraints limit further improvements.
(2)
Impact of Maximum Vertiport Capacity
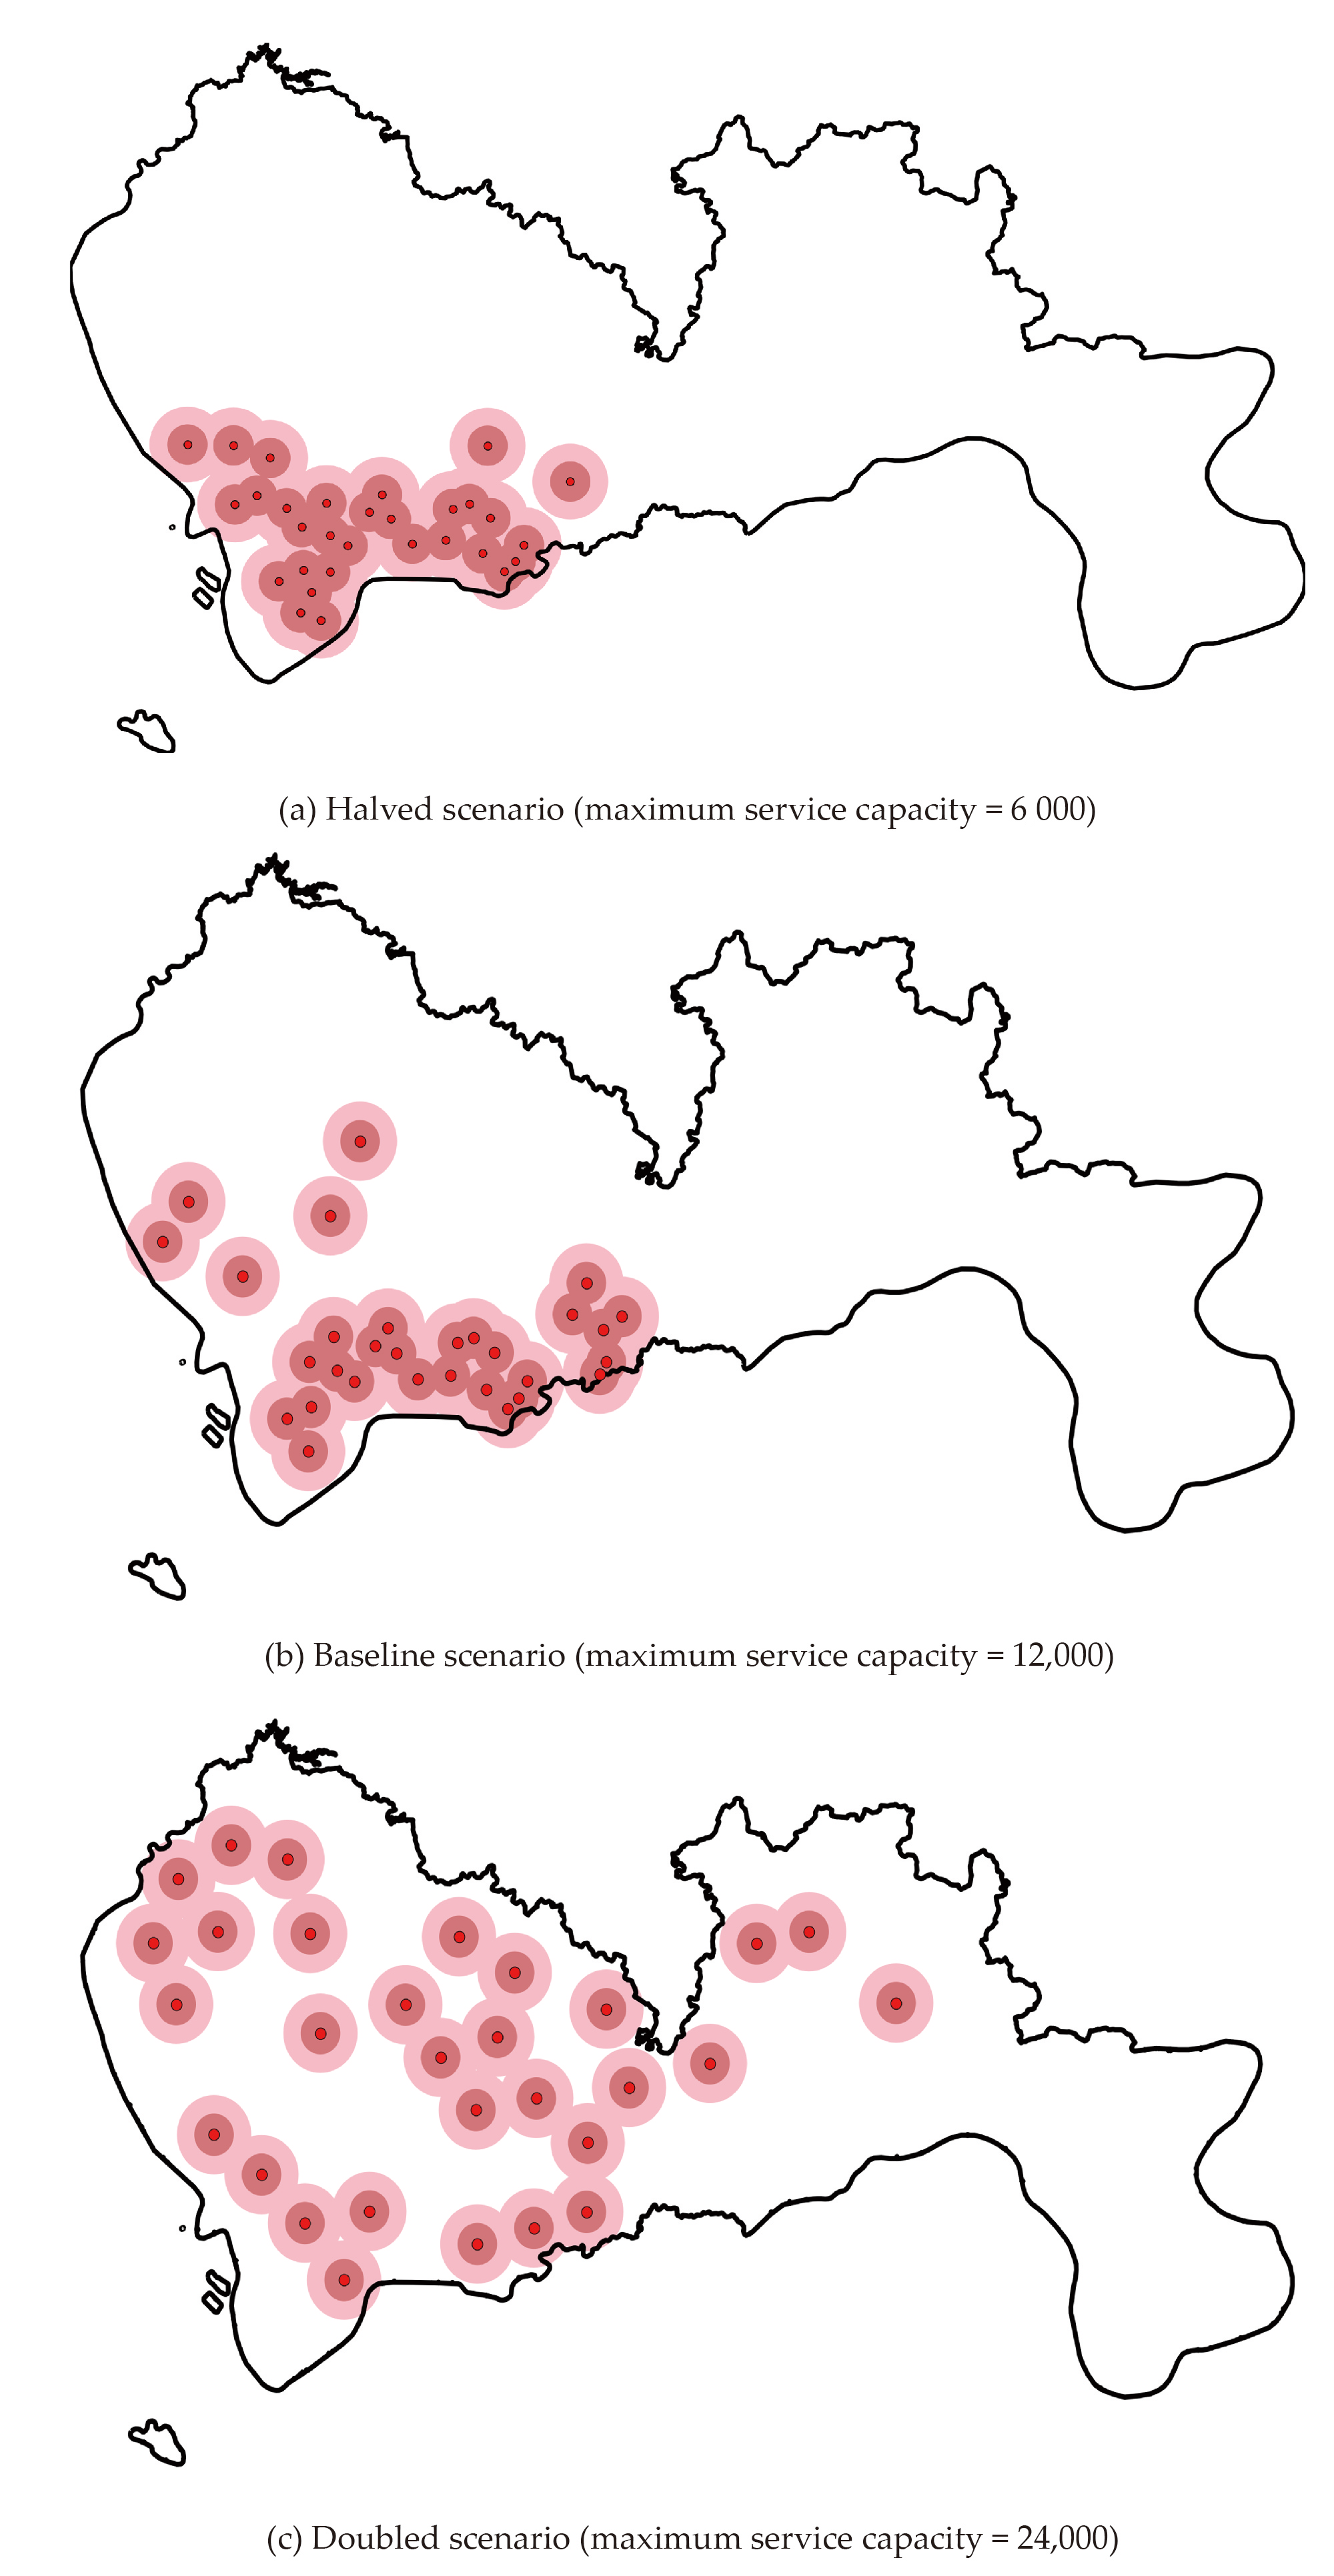
A sensitivity analysis was conducted with the number of vertiports fixed at H = 30 to evaluate how variations in maximum service capacity affect the spatial configuration and coverage performance of the network.
As shown in Figure 23, variations in the maximum vertiport capacity significantly affect spatial deployment outcomes. The points in the figure represent the locations of the vertiports, while the red circles indicate the service areas of the vertiports. Figure 23b depicts the baseline scenario where the maximum capacity is set to 12,000 passengers, resulting in a moderately dispersed layout concentrated in key demand areas. When the capacity is halved (Figure 23a), the model places a greater number of vertiports in high-demand clusters to compensate for limited service capability, leading to increased spatial concentration. Conversely, doubling the capacity (Figure 23c) enables each facility to serve a larger surrounding area, thereby reducing the need for dense deployments in central zones and promoting a more geographically balanced configuration.
These results demonstrate that increasing maximum capacity enhances both individual facility efficiency and overall coverage. However, the analysis also indicates the presence of a capacity saturation point—beyond which further expansion yields limited spatial benefit. This finding is critical for infrastructure planning, as it underscores the need to balance investment costs, operational efficiency, and spatial equity in vertiport network design.
(3)
Impact of Vertiport Service Radius
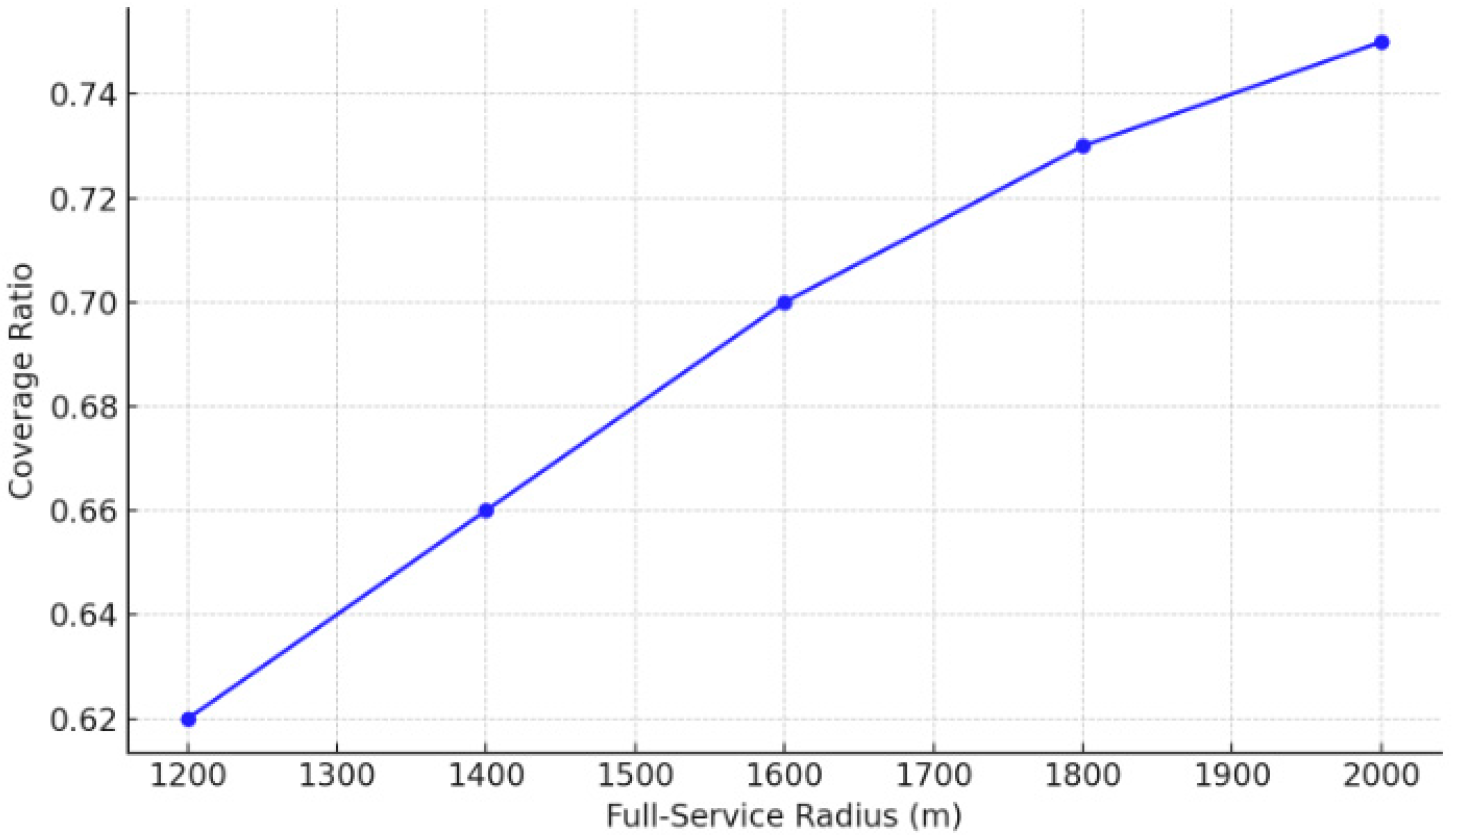
As shown in Figure 24, a sensitivity analysis was conducted to investigate the effect of the vertiport service range on optimization outcomes by varying the full-service radius r j while keeping the number of facilities fixed at H = 120. The results indicate that the service radius significantly influences both coverage performance and spatial deployment patterns. A smaller radius restricts each vertiport to nearby demand nodes, resulting in a more clustered layout and requiring higher facility density in urban cores to maintain acceptable coverage. In contrast, increasing the service radius expands the serviceable area per vertiport, enhancing overall coverage and enabling a more dispersed spatial configuration.
However, the analysis reveals diminishing returns: beyond a certain threshold, further increases in the service radius produce only marginal improvements in coverage. Moreover, excessively large radii may reduce spatial granularity, introduce overlapping service zones, and lead to inefficiencies in demand allocation and local accessibility. These findings highlight the importance of carefully calibrating vertiport service parameters based on urban morphology, population density, and airspace constraints.

6. Conclusions

Cities exhibit substantial inter-city disparities in economic development, primary industries, and spatial structures, while their intra-city environments feature intense land competition, complex transit networks, heterogeneous community acceptance, physical obstacles to takeoff and landing, and challenges in reconciling multiple stakeholders.
To address these complexities, this paper proposes a systematic planning framework for locating UAM vertiports. First, we develop a modular, grading evaluation index system to identify candidate sites, ensuring the site-selection process is robust, systematic, and adaptable. Next, we introduce a progressive coverage model incorporating service satisfaction variable to improve UAM demand coverage while reflecting the decay in user acceptance with distance. We then design an improved genetic algorithm-based heuristic, enhanced by a special point set method. We select the optimal configuration and conduct sensitivity analyses to evaluate the effects of vertiport quantity, travel demand, vertiport capacity, and service radius on outcomes, yielding actionable recommendations for planners. Although Shenzhen serves as a case study, the methodology is broadly applicable to other metropolitan areas.
The preliminary experiments and sensitivity analyses conducted in this study offer several important insights into how operational parameters influence vertiport site selection outcomes. The key findings are summarized as follows:
Safety criteria exert a strong influence on vertiport land use feasibility. In regions with intense land competition, applying uniform safety standards may limit viable sites, suggesting a need for adaptive safety thresholds.
Overemphasis on economic indicators alone often results in excessive clustering of vertiports in high-value areas, which may reduce service equity and limit spatial reach.
Dividing the city into functional zones and applying differentiated evaluation indicators enhances spatial equity and leads to a more balanced vertiport distribution, thereby improving overall coverage.
While siting facilities in high-demand areas boosts coverage, it may also lead to overlapping service zones and redundancy, reducing layout efficiency.
A vertiport’s maximum service capacity significantly affects how closely facilities are clustered. Larger capacities allow for broader coverage and more dispersed deployments, whereas lower capacities require more densely packed sites.
Despite the promising results achieved in this study, several limitations remain. The current demand estimation framework is primarily data-driven, relying on spatial indicators and aggregate proxies without explicitly incorporating user behavioral preferences. As a result, it may fall short in accurately capturing individual-level decision-making. In the context of emerging transport modes such as Urban Air Mobility , users’ perceptions, acceptance levels, and attitudes toward novel air-based services are critical factors shaping actual adoption patterns. To address these limitations, future research will focus on incorporating behaviorally calibrated demand modeling approaches, such as survey-informed choice modeling and simulation-based behavioral forecasting, to more accurately capture user preferences, acceptance levels, and mode adoption dynamics.
Moreover, the current framework does not account for temporal fluctuations in demand and considers coverage as the sole optimization objective, omitting key factors such as infrastructure costs, congestion mitigation, and operational efficiency. Future work should explore the integration of dynamic demand modeling, pricing strategies, and real-time ground traffic conditions to better capture spatiotemporal demand variability and support more tactical-level UAM planning and system design.

Author Contributions

Conceptualization, Y.L., W.W. (Wenbin Wei) and W.Z.; Methodology, Y.L. and W.W. (Wenbin Wei); Investigation, Y.L., W.W. (Weiwei Wu). and W.Z.; Data curation, Y.L. and W.W. (Weiwei Wu).; Supervision, Y.L. and W.Z.; Validation, Y.L. and H.J.; Writing—original draft preparation, Y.L. and W.Z.; Writing—review and editing, Y.L. and W.Z. All authors have read and agreed to the published version of the manuscript.

Funding

This work was supported by the Postgraduate Research & Practice Innovation Program of Jiangsu Province (No. KYCX24_0598).

Institutional Review Board Statement

Not applicable.

Informed Consent Statement

Not applicable.

Data Availability Statement

This study did not report any data.

Conflicts of Interest

The authors declare no conflicts of interest.

References

  1. Huang, M.; Zhao, S. Tracing trajectories and co-evolution of metropolitan urbanization in the United States, Europe, and China. Sci. Total Environ. 2024, 945, 173894. [Google Scholar] [CrossRef]
  2. Lieberthal, E.B.; Serok, N.; Duan, J.; Zeng, G.; Havlin, S. Addressing the urban congestion challenge based on traffic bottlenecks. Philos. Trans. A 2024, 382, 20240095. [Google Scholar] [CrossRef]
  3. Straubinger, A.; Rothfeld, R.; Shamiyeh, M.; Büchter, K.D.; Kaiser, J.; Plötner, K.O. An overview of current research and developments in urban air mobility–Setting the scene for UAM introduction. J. Air Transp. Manag. 2020, 87, 101852. [Google Scholar] [CrossRef]
  4. Ellis, K.K.; Krois, P.; Koelling, J.; Prinzel, L.J.; Davies, M.; Mah, R. A Concept of Operations (ConOps) of an in-time aviation safety management system (IASMS) for Advanced Air Mobility (AAM). In Proceedings of the AIAA SciTech 2021 Forum, Nashville, TN, USA, 11–15 January 2021; p. 1978. [Google Scholar]
  5. Hill, B.P.; DeCarme, D.; Metcalfe, M.; Griffin, C.; Wiggins, S.; Metts, C.; Bastedo, B.; Patterson, M.D.; Mendonca, N.L. Uam Vision Concept of Operations (Conops) Uam Maturity Level (Uml) 4; NASA Technical Reports Server: Washington, DC, USA, 2020. [Google Scholar]
  6. Undertaking, S.J. U-space Concept of Operations, 4th ed.; Single European Sky ATM Research (SESAR) JU: Brussels, Belgium, 2023. [Google Scholar]
  7. Stjernberg, J.; Durnford, P.; van Egmond, P.; Krivohlavek, J.; Martijnse-Hartikka, R.; Solbø, S.A.; Wachter, F.; Wigler, K. Guidebook for Urban Air Mobility Integration–AiRMOUR Deliverable 6.4; Grano: Helsinki, Finland, 2023. [Google Scholar]
  8. Holden, J.; Goel, N. Fast-Forwarding to a Future of on-Demand Urban Air Transportation; Uber Technologies, Inc.: San Francisco, CA, USA, 2016. [Google Scholar]
  9. Schuchardt, B.I.; Becker, D.; Becker, R.-G.; End, A.; Gerz, T.; Meller, F.; Metz, I.C.; Niklaß, M.; Pak, H.; Schier-Morgenthal, S. Urban air mobility research at the DLR German aerospace center–getting the HorizonUAM project started. In Proceedings of the AIAA Aviation 2021 Forum, Washington, DC, USA, 2–6 August 2021; p. 3197. [Google Scholar]
  10. Seeley, B.A. Regional Sky Transit IV: Pocket Airpark Design Constraints. In Proceedings of the 17th AIAA Aviation Technology, Integration, and Operations Conference, Denver, CO, USA, 5–9 June 2017; p. 3440. [Google Scholar]
  11. FAA. Advisory Circular 150/5390-3—Vertiport Design (Cancelled). Available online: https://www.faa.gov/documentLibrary/media/advisory_circular/150-5390-3/150_5390_3.PDF (accessed on 1 April 2025).
  12. Skyports Infrastructure. Landing Infrastructure. Available online: https://skyports.net/landing-infrastructure/ (accessed on 1 April 2025).
  13. Johnston, T.; Riedel, R.; Sahdev, S. To Take off, Flying Vehicles First Need Places to Land; McKinsey Center for Future Mobility: New York, USA, 2020; pp. 2–8. [Google Scholar]
  14. Brunelli, M.; Ditta, C.C.; Postorino, M.N. New infrastructures for Urban Air Mobility systems: A systematic review on vertiport location and capacity. J. Air Transp. Manag. 2023, 112, 102460. [Google Scholar] [CrossRef]
  15. Murça, M.C.R. Identification and prediction of urban airspace availability for emerging air mobility operations. Transp. Res. Part C Emerg. Technol. 2021, 131, 103274. [Google Scholar] [CrossRef]
  16. Song, K.; Yeo, H.; Moon, J.-H. Approach control concepts and optimal vertiport airspace design for urban air mobility (UAM) operation. Int. J. Aeronaut. Space Sci. 2021, 22, 982–994. [Google Scholar] [CrossRef]
  17. Taylor, M.; Saldanli, A.; Park, A. Design of a vertiport design tool. In Proceedings of the 2020 Integrated Communications Navigation and Surveillance Conference (ICNS), Herndon, VA, USA, 8–10 September 2020; pp. 2A2-1–2A2-12. [Google Scholar]
  18. Vascik, P.D.; Hansman, R.J. Development of vertiport capacity envelopes and analysis of their sensitivity to topological and operational factors. In Proceedings of the AIAA SciTech 2019 Forum, San Diego, CA, USA, 7–11 January 2019; p. 0526. [Google Scholar]
  19. Fu, M.; Antoniou, C.; Rothfeld, R.; Straubinger, A. Modelling mode choice including urban air mobility–a case-study of Munich. Transp. Res. Procedia 2019, 41, 45–47. [Google Scholar] [CrossRef]
  20. So, J.J.; Chae, M.; Hong, J.; Youm, J.; Kim, S.H.; Kim, J. Integrated mobility hub location selection for sustainable urban mobility. Sustain. Cities Soc. 2023, 99, 104950. [Google Scholar] [CrossRef]
  21. Tuchen, S. Multimodal transportation operational scenario and conceptual data model for integration with UAM. In Proceedings of the 2020 Integrated Communications Navigation and Surveillance Conference (ICNS), Herndon, VA, USA, 8–10 September 2020; pp. 2C1-1–2C1-15. [Google Scholar]
  22. Lee, S. Prediction of urban air mobility multirotor VTOL broadband noise using UCD-QuietFly. J. Am. Helicopter Soc. 2021, 66, 1–13. [Google Scholar] [CrossRef]
  23. Rimjha, M.; Trani, A.; Hotle, S. Urban air mobility: Preliminary noise analysis of commuter operations. In Proceedings of the AIAA Aviation 2021 Forum, Washington, DC, USA, 2–6 August 2021; p. 3204. [Google Scholar]
  24. Babetto, L.; Kirste, A.; Deng, J.; Husemann, M.; Stumpf, E. Adoption of the Urban Air Mobility System: Analysis of technical, legal and social aspects from a European perspective. J. Air Transp. Res. Soc. 2023, 1, 152–174. [Google Scholar] [CrossRef]
  25. Al Haddad, C.; Chaniotakis, E.; Straubinger, A.; Plötner, K.; Antoniou, C. Factors affecting the adoption and use of urban air mobility. Transp. Res. Part A Policy Pract. 2020, 132, 696–712. [Google Scholar] [CrossRef]
  26. Chancey, E.T.; Politowicz, M.S. Public trust and acceptance for concepts of remotely operated Urban Air Mobility transportation. In Proceedings of the Proceedings of the Human Factors and Ergonomics Society Annual Meeting, Online, 5–9 October 2020; pp. 1044–1048. [Google Scholar]
  27. Gao, Z.; Yu, Y.; Wei, Q.; Topcu, U.; Clarke, J.-P. Noise-aware and equitable urban air traffic management: An optimization approach. Transp. Res. Part C Emerg. Technol. 2024, 165, 104740. [Google Scholar] [CrossRef]
  28. Goyal, R.; Reiche, C.; Fernando, C.; Serrao, J.; Kimmel, S.; Cohen, A.; Shaheen, S. Urban Air Mobility (UAM) Market Study; NASA Urban Air Mobility: Washington, DC, USA, 2018. [Google Scholar]
  29. Zhao, Y.; Feng, T. Commuter choice of UAM-friendly neighborhoods. Transp. Res. Part A Policy Pract. 2025, 192, 104338. [Google Scholar] [CrossRef]
  30. Mercan, T.; Yavas, V.; Can, D.; Mercan, Y. Vertiport location selection criteria for urban air mobility. J. Air Transp. Manag. 2025, 124, 102760. [Google Scholar] [CrossRef]
  31. Preis, L. Quick sizing, throughput estimating and layout planning for VTOL aerodromes–a methodology for vertiport design. In Proceedings of the AIAA Aviation 2021 Forum, Washington, DC, USA, 2–6 August 2021; p. 2372. [Google Scholar]
  32. Feldhoff, E.; Soares Roque, G. Determining infrastructure requirements for an air taxi service at Cologne Bonn Airport. CEAS Aeronaut. J. 2021, 12, 821–833. [Google Scholar] [CrossRef]
  33. Fadhil, D.N. A GIS-Based Analysis for Selecting Ground Infrastructure Locations for Urban Air Mobility. Master’s Thesis, Technical University of Munich, Munich, Germany, 2018. [Google Scholar]
  34. Brunelli, M.; Ditta, C.C.; Postorino, M.N. A framework to develop urban aerial networks by using a digital twin approach. Drones 2022, 6, 387. [Google Scholar] [CrossRef]
  35. Lim, E.; Hwang, H. The selection of vertiport location for on-demand mobility and its application to Seoul metro area. Int. J. Aeronaut. Space Sci. 2019, 20, 260–272. [Google Scholar] [CrossRef]
  36. Rajendran, S.; Zack, J. Insights on strategic air taxi network infrastructure locations using an iterative constrained clustering approach. Transp. Res. Part E Logist. Transp. Rev. 2019, 128, 470–505. [Google Scholar] [CrossRef]
  37. Guo, T.; Wu, H.; Zame, S.I.; Antoniou, C. Data-driven vertiport siting: A comparative analysis of clustering methods for Urban Air Mobility. J. Urban Mobil. 2025, 7, 100117. [Google Scholar] [CrossRef]
  38. Rath, S.; Chow, J.Y. Air taxi skyport location problem with single-allocation choice-constrained elastic demand for airport access. J. Air Transp. Manag. 2022, 105, 102294. [Google Scholar] [CrossRef]
  39. Shin, H.; Lee, T.; Lee, H.-R. Skyport location problem for urban air mobility system. Comput. Oper. Res. 2022, 138, 105611. [Google Scholar] [CrossRef]
  40. Kitthamkesorn, S.; Chen, A. Maximum capture problem for urban air mobility network design. Transp. Res. Part E Logist. Transp. Rev. 2024, 187, 103569. [Google Scholar] [CrossRef]
  41. Jiang, Y.; Li, Z.; Wang, Y.; Xue, Q. Vertiport location for eVTOL considering multidimensional demand of urban air mobility: An application in Beijing. Transp. Res. Part A Policy Pract. 2025, 192, 104353. [Google Scholar] [CrossRef]
  42. Wu, H.; Zame, S.I.; Guo, T.; Lu, Q.-L.; Antoniou, C. A sustainable multi-objective framework for multi-phased, capacitated vertiport siting with land use integration. Commun. Transp. Res. 2025, 5, 100186. [Google Scholar] [CrossRef]
  43. Jin, Z.; Ng, K.K.; Zhang, C. Robust optimisation for vertiport location problem considering travel mode choice behaviour in urban air mobility systems. J. Air Transp. Res. Soc. 2024, 2, 100006. [Google Scholar] [CrossRef]
  44. Willey, L.C.; Salmon, J.L. A method for urban air mobility network design using hub location and subgraph isomorphism. Transp. Res. Part C Emerg. Technol. 2021, 125, 102997. [Google Scholar] [CrossRef]
  45. Yap, J.Y.L.; Ho, C.C.; Ting, C.-Y. A systematic review of the applications of multi-criteria decision-making methods in site selection problems. Built Environ. Proj. Asset Manag. 2019, 9, 548–563. [Google Scholar] [CrossRef]
  46. Hancer, E.; Xue, B.; Zhang, M. A survey on feature selection approaches for clustering. Artif. Intell. Rev. 2020, 53, 4519–4545. [Google Scholar] [CrossRef]
  47. Schweiger, K.; Preis, L. Urban Air Mobility: Systematic Review of Scientific Publications and Regulations for Vertiport Design and Operations. Drones 2022, 6, 179. [Google Scholar] [CrossRef]
  48. Pelegrín, M.; d’Ambrosio, C.; Delmas, R.; Hamadi, Y. Urban air mobility: From complex tactical conflict resolution to network design and fairness insights. Optim. Methods Softw. 2023, 38, 1311–1343. [Google Scholar] [CrossRef]
  49. Chamberlain, B.; Samavatekbatan, A.; Park, H.; Gholami, S.; Lee, D.H.; Uddin, K.; Hall, K. Feasibility of Vertiport Siting and Land Use Planning: A Guide for the Process of Planning UAV/UAM Vertiport Locations; Utah. Dept. of Transportation. Division of Research: Salt Lake City, UT, USA, 2025. [Google Scholar]
  50. Gonzalez, C.J.D. Rooftop-Place Suitability Analysis for Urban Air Mobility Hubs: A Gis and Neural Network Approach. Master’s Thesis, Universidade NOVA de Lisboa, Lisbon, Portugal, 2020. [Google Scholar]
  51. Long, Q.; Ma, J.; Jiang, F.; Webster, C.J. Demand analysis in urban air mobility: A literature review. J. Air Transp. Manag. 2023, 112, 102436. [Google Scholar] [CrossRef]
  52. Mendonca, N.; Murphy, J.; Patterson, M.D.; Alexander, R.; Juarex, G.; Harper, C. Advanced air mobility vertiport considerations: A list and overview. In Proceedings of the AIAA Aviation 2022 Forum, Chicago, IL, USA, 27 June–1 July 2022; p. 4073. [Google Scholar]
  53. Rahman, B.; Bridgelall, R.; Habib, M.F.; Motuba, D. Integrating urban air mobility into a public transit system: A GIS-based approach to identify candidate locations for vertiports. Vehicles 2023, 5, 1803–1817. [Google Scholar] [CrossRef]
  54. EASA. Second Publication of Proposed Means of Compliance with the Special Condition VTOL. Available online: https://www.easa.europa.eu/downloads/128938/en (accessed on 1 April 2025).
  55. EASA. Vertiports Prototype Technical Specifications for the Design of VFR Vertiports for Operation with Manned VTOL-Capable Aircraft Certified in the Enhanced Category (PTS-VPT-DSN). Available online: https://www.easa.europa.eu/downloads/136259/en (accessed on 1 April 2025).
  56. ICAO. Annex 14-Aerodromes-Volume II-Heliports; ICAO: Montreal, QC, Canada, 2013. [Google Scholar]
  57. Seeley, B.A. Regional Sky Transit II. In Proceedings of the 16th AIAA Aviation Technology, Integration, and Operations Conference, Washington, DC, USA, 13–17 June 2016. [Google Scholar] [CrossRef]
  58. Seeley, B.A. Regional Sky Transit III: The Primacy of Noise. In Proceedings of the 55th AIAA Aerospace Sciences Meeting, Grapevine, TX, USA, 9–13 January 2017; pp. 1–30. [Google Scholar] [CrossRef]
  59. Seeley, B.A. Regional Sky Transit. In Proceedings of the 15th AIAA Aviation Technology, Integration, and Operations Conference, Dallas, TX, USA, 22-26 June 2015; pp. 1–14. [Google Scholar] [CrossRef]
  60. Elevate Summit. Vertiport Infrastructure Development [Video File]. 2017. Available online: https://www.youtube.com/watch?v=k3nP0F5Mzw8 (accessed on 1 April 2025).
  61. Syed, N.; Rye, M.; Ade, M.; Trani, A.; Hinze, N.; Swingle, H.; Smith, J.C.; Dollyhigh, S.; Marien, T. Preliminary considerations for ODM air traffic management based on analysis of commuter passenger demand and travel patterns for the Silicon Valley Region of California. In Proceedings of the 17th AIAA Aviation Technology, Integration, and Operations Conference, Denver, CO, USA, 5–9 June 2017; p. 3082. [Google Scholar]
  62. Vascik, P.D.; Hansman, R.J. Evaluation of key operational constraints affecting on-demand mobility for aviation in the Los Angeles basin: Ground infrastructure, air traffic control and noise. In Proceedings of the 17th AIAA Aviation Technology, Integration, and Operations Conference, Denver, CO, USA, 5–9 June 2017; p. 3084. [Google Scholar]
  63. Antcliff, K.R.; Moore, M.D.; Goodrich, K.H. Silicon valley as an early adopter for on-demand civil VTOL operations. In Proceedings of the 16th AIAA Aviation Technology, Integration, and Operations Conference, Washington, DC, USA, 13–17 June 2016; p. 3466. [Google Scholar]
  64. FAA. Concepts of Operations, Foundational Principles, Roles and Responsibilities, Scenarios and Operational Threads, Unmanned Aircraft Systems (UAS) Traffic Management (UTM) Concept of Operations, V2.0 ed; FAA: Washington, DC, USA, 2020. [Google Scholar]
  65. Smerk, G.M. Urban Transit: Operations, Planning and Economics. Transp. J. 2006, 45, 74–76. [Google Scholar] [CrossRef]
  66. Johnson, C. Key Factors in Vertiport Site Selection for Megapolitan Regions. Ph.D. Thesis, The Ohio State University, Columbus, OH, USA, 2023. [Google Scholar]
  67. Fu, M.; Straubinger, A.; Schaumeier, J. Scenario-based demand assessment of urban air mobility in the greater munich area. J. Air Transp. 2022, 30, 125–136. [Google Scholar] [CrossRef]
  68. Li, J.; Yang, R.; Li, C.; Zhou, Y.; Huang, L. Initial Research on The Vertiport for The Urban Air Mobility. In Proceedings of the Proceedings of the 2nd International Conference on Information, Control and Automation (ICICA 2022), Chongqing, China, 2–4 December 2022. [Google Scholar]
  69. Wei, W.; Rohrmeier, K.; Martinez, T.; Winans, M.; Park, H. Land Use Analysis on Vertiports Based on a Case Study of the San Francisco Bay Area; Mineta Transportation Institute: San Jose, VA, USA, 2023. [Google Scholar]
  70. FAA. Engineering Brief No. 105A, Vertiport Design. 2024. Available online: https://www.faa.gov/airports/engineering/engineering_briefs/drafts (accessed on 1 April 2025).
  71. Xu, J.; Murray, A.T.; Church, R.L.; Wei, R. Service allocation equity in location coverage analytics. Eur. J. Oper. Res. 2023, 305, 21–37. [Google Scholar] [CrossRef]
  72. Eiselt, H.; Marianov, V. Gradual location set covering with service quality. Socio-Econ. Plan. Sci. 2009, 43, 121–130. [Google Scholar] [CrossRef]
  73. Rimjha, M.; Trani, A. Urban air mobility: Factors affecting vertiport capacity. In Proceedings of the 2021 Integrated Communications Navigation and Surveillance Conference (ICNS), Online, 20–22 April 2021; pp. 1–14. [Google Scholar]
  74. Shenzhen Bureau of Statistics. Shenzhen Statistical Yearbook (2024); China Statistics Press: Beijing, China, 2024. [Google Scholar]
  75. Coppola, P.; De Fabiis, F.; Silvestri, F. Urban Air Mobility demand forecasting: Modeling evidence from the case study of Milan (Italy). Eur. Transp. Res. Rev. 2025, 17, 2. [Google Scholar] [CrossRef]
  76. Coppola, P.; Fabiis, F.D.; Silvestri, F. Urban Air Mobility Passengers’ Profiling: Evidence from Milan Airports, Italy. Transp. Res. Rec. 2025, 2679, 129–141. [Google Scholar] [CrossRef]
  77. Qu, W.; Huang, J.; Li, C.; Liao, X. A demand forecasting model for urban air mobility in Chengdu, China. Green Energy Intell. Transp. 2024, 3, 100173. [Google Scholar] [CrossRef]
  78. Ahmed, F.; Memon, M.A.; Rajab, K.; Alshahrani, H.; Abdalla, M.E.; Rajab, A.; Houe, R.; Shaikh, A. Demand prediction for urban air mobility using deep learning. PeerJ Comput. Sci. 2024, 10, e1946. [Google Scholar] [CrossRef]
Figure 1. Passenger-carrying UAM service process.
Aerospace 12 00709 g001
Figure 2. Illustrative diagram of vertiport location selection.
Aerospace 12 00709 g002
Figure 3. Schematic of the site selection methodology.
Aerospace 12 00709 g003
Figure 4. Vertiport selection criteria.
Aerospace 12 00709 g004
Figure 5. Examples of vertiport layouts.
Aerospace 12 00709 g005
Figure 6. Vertical takeoff and landing procedure parameters according to EASA (PTS-VPT-DSN).
Aerospace 12 00709 g006
Figure 7. Workflow for vertiport candidate site screening using ArcGIS Pro.
Aerospace 12 00709 g007
Figure 8. Three-dimensional spatial analysis for assessing potential VTOL sites.
Aerospace 12 00709 g008
Figure 9. Illustrative diagram of PCM-DSL optimization model.
Aerospace 12 00709 g009
Figure 10. Comparison of algorithm performance.
Aerospace 12 00709 g010
Figure 11. Study area of Shenzhen.
Aerospace 12 00709 g011
Figure 12. Framework for UAM travel demand data acquisition.
Aerospace 12 00709 g012
Figure 13. UAM demand heatmap.
Aerospace 12 00709 g013
Figure 14. High-standard screening results of vertiport candidate sites. Note: Inset images are not drawn to the same scale as the main map.
Aerospace 12 00709 g014
Figure 15. Schematic diagram of Modular Grading Evaluation Index System.
Aerospace 12 00709 g015
Figure 16. Candidate vertiport screening results (low safety scenario).
Aerospace 12 00709 g016
Figure 17. Comprehensive evaluation framework for different urban functional zones.
Aerospace 12 00709 g017
Figure 18. Candidate vertiport sites identified based on functional zoning criteria.
Aerospace 12 00709 g018
Figure 19. Demand satisfaction and computation time vs. number of vertiports.
Aerospace 12 00709 g019
Figure 21. Statistical distribution of the demand satisfaction level variable p i j .
Aerospace 12 00709 g021
Figure 22. Coverage ratio under varying demand levels by trip type (H = 70).
Aerospace 12 00709 g022
Figure 23. Sensitivity analysis of maximum vertiport capacity (H = 30).
Aerospace 12 00709 g023
Figure 24. Sensitivity analysis of vertiport service radius (H = 120).
Aerospace 12 00709 g024
Table 1. Physical characteristics of representative eVTOL vehicles.
eVTOL VehicleSpan (m)Cruise Speed (km/h)Range
(km)
Max Takeoff Weight (kg)CapacityNoise Level (dBA)Charging Time (min)Manufacturer
Airbus Vahana6.2520050815 1-seaterAirbus (USA)
Lilium Jet1028025031756-seater~45Lilium GmbH (Germany)
Joby S413.1322241.418154-seater~45.2–65Joby Aviation (USA)
SkyDrive SD-034100155002-seaterSkyDrive Inc. (Japan)
Vertical Aerospace VA13.52411614504-seater~50~60Vertical Aerospace Ltd. (UK)
EHang 2165.6100353601-seater~70–85~40–120EHang Holdings Ltd. (China)
Volocopter 2X9.15102274502-seater~65~40–120Volocopter GmbH (Germany)
Archer Aviation Maker12.21506014972-seater~45Archer Aviation Inc. (USA)
Beta Technologies ALIA-25015.2427025031754-seater~70~50–60Beta Technologies Inc. (USA)
Aurora eVTOL8180807902-seater~50Aurora Flight Sciences (USA)
Table 2. Minimum vertiport dimensions proposed in previous studies.
ConceptTLOFFATOSA
Seeley (2017b) [58]  550 × 325 ft
Uber Elevate (2016) [8]50 × 50 ft 75 × 75 ft 125 ft
Alexander and Syms (2017) [60]45 × 45 ft70 × 70 ft100 ft
Vascik et al. (2017) [62]50 × 50 ft  
Syed et al. (2017) [61]43 × 43 ft 65 × 65 ft95 ft 
Antcliff et al. (2016) [63]50 × 50 ft100 × 100 ft125 ft
EASA [54]  2 D × 2 D
FAA [11]1 D × 1 D1.5 D × 1.5 D3 D × 3 D
ICAO [56]0.83 D1 D1.25 D
Note: D refers to the D-value—the maximum overall dimension of the aircraft. A value without the symbol “×” represents a diameter, while a value containing “×” denotes the side length of a square.
Table 3. VTOL procedures according to EASA (PTS-VPT-DSN).
ParameterShort DescriptionValue
Type 1Type 2Type 3
h1Low hover height3 m (10’)3 m (10’)3 m (10’)
h2High hover height30.5 m (100’)30.5 m (100’)30.5 m (100’)
TOwidthWidth at h24 D4 D5 D
FATOwidthWidth of the FATO2 D2 D2.83 D
θSlope of approach/departure surface12.5%12.5%12.5%
Schematic diagramAerospace 12 00709 i001Aerospace 12 00709 i002Aerospace 12 00709 i003
Note: D refers to the D-value—the maximum overall dimension of the aircraft.
Table 4. Modular Grading Evaluation Index System for vertiport site selection.
CategoryIndexHigh PriorityMedium PriorityLow Priority
SafetyAirport Space Requirements5 D × 5 D [70]250 ft × 250 ft [69]3 D × 3 D [70]
Airspace RequirementsType 3Type 2Type 1
Transport Access ConditionA minimum range
covering at least 1
A maximum range covering at least 1 
Social
Feasibility
Land Use CompatibilityResidential-, commercial-, and public-use areasExcluding natural reserves and ecologically sensitive areasExcluding natural reserves and ecologically sensitive areas
Social Equity10 km to at
least avg + POI (each type)
1 km to at
least avg + POI (at least one type)
 
Local RegulationsGovernment and military restricted areasGovernment and military restricted areasMilitary restricted areas
School zonesSchool zones (excluding universities) 
A minimum distance of 100 m from fuel stationsA minimum distance of 50 m from fuel stationsA minimum distance of 50 m from fuel stations
Economic
Feasibility
Inhabitant DensityThe top 25%The top 50% 
Average House RentThe top 25%The top 50% 
Office Rent PriceThe top 25%The top 50% 
Note: D refers to the D-value—the maximum overall dimension of the aircraft. avg + POI (each type): the number of POIs in each category exceeds the average of that category across all sites. avg + POI (at least one type): the number of POIs in at least one category exceeds the average of that category across all sites.
Table 5. List of notations.
TypeNotationDescription
Sets N Set   of   demand   points ,   N = 1 , 2 , i , n
V Set   of   candidate   vertiport   locations ,   V = 1 , 2 , j , k , m
Parameters q i Demand   at   point     i
d i j Distance   from   point     i   to   point   j
r j The   full - service   radius   of   candidate   vertiport   j
l j Maximum   service   range   of   candidate   vertiport   j
f i j Coverage   probability   of   vertiport   j   for   demand   i
α , β Coefficient   of   coverage   probability   f i j
H Maximum number of vertiports that can be constructed
a j Minimum   workload   threshold   required   for   selecting   vertiport   j
b j Maximum   workload   capacity   of   vertiport   j
CA minimum separation distance between any two vertiports
Decision Variables x j Binary decision variable: 1 if a vertiport is constructed at location j, 0 otherwise
p i j The   demand   satisfaction   level   of   vertiport     j   for   demand   point   i , in the range [0,1]
Table 6. Data description and sources.
DataDescriptionSource
Basic Geographic Datacity administrative boundaries, road networks, building distributions, restricted development zones, digital elevation model, land cover classification dataOpen-access websites
Points of Interest (POIs)shopping centers, universities, hospitals, gas stations, high-speed rail stations, airports, ports, office buildings, business centers, residential areas, tourist attractionsPublic websites
Mobile Signaling Datacaptures spatiotemporal movement patterns of usersInternal corporate data
Socioeconomic Datapopulation density, median household rent, and office rental pricesShenzhen Statistical Yearbook
Table 7. Evaluation indicators for high-standard UAM site selection.
CategoryIndexDetails
Safety
(High Priority)
Airport Space Requirements5 D × 5 D
Airspace RequirementsType 3
Social
Feasibility
(High Priority)
Transport Access ConditionA minimum range covering at least 1
Land Use CompatibilityResidential-, commercial-, and public-use areas
Social Equity10 km to at least avg + POI (each type)
Local RegulationsGovernment and military restricted areas
School zones
A minimum distance of 100 m from fuel stations
Economic
Feasibility
(High Priority)
Inhabitant DensityThe top 25%
Average House RentThe top 25%
Office Rent PriceThe top 25%
Note: D refers to the D-value—the maximum overall dimension of the aircraft. ‘avg + POI’ indicates a value greater than the average POI.
Disclaimer/Publisher’s Note: The statements, opinions and data contained in all publications are solely those of the individual author(s) and contributor(s) and not of MDPI and/or the editor(s). MDPI and/or the editor(s) disclaim responsibility for any injury to people or property resulting from any ideas, methods, instructions or products referred to in the content.