1. Introduction
Safety has been an integral part of every sector of aviation since its inception, and it concerns not only the actual execution of a flight but also all activities directly or indirectly related to aircraft operations.
It is important to recognise that no human-made system, including air transport, can guarantee absolute safety. Common public perceptions often mistake safety for a complete absence of accidents, perfect human performance, or full compliance with regulations. However, such conditions are not realistically achievable in everyday operations.
Accidents, technical failures, and human errors can never be entirely prevented. Between 2009 and 2023, the overall pattern of aviation accidents and fatalities across the European Union remained consistent, with most fatalities occurring in general aviation, particularly among small aircraft with a maximum take-off mass below 2250 kg. Annual fluctuations were observed, such as a spike in 2015 due to a major commercial crash in France. However, countries like France and Germany consistently reported the highest numbers of fatalities, whereas many other member states experienced significantly fewer incidents. Incorporating these comparative statistics situates the Slovak data within the broader European context and provides a meaningful basis for international comparison [
1]. Even with strong safety measures, risks remain. Therefore, safety in aviation is understood as maintaining risks at an acceptable level, not eliminating them completely. According to the International Civil Aviation Organisation (ICAO, 2013), safety is a state in which the risk of injury or damage is reduced and kept at or below an acceptable level through continuous hazard identification and risk management [
2].
The main objective of the paper is to examine aviation accidents and incidents in Slovakia with a focus on identifying and analysing their causal factors. Using a dataset of 209 final reports issued by the Transport Authority of Slovakia from the years 2009 to 2023, a subset of 155 cases was selected for detailed analysis. These cases involved certified aircraft, including airplanes over and under 600 kg, gliders, and helicopters (Reports related to sports aviation equipment such as paragliders, hang gliders, and balloons were excluded to maintain a consistent scope and data quality.).
The paper aims to explore the relationship between various contributing factors and the severity of outcomes. In total, 155 aviation events involving 171 aircraft and 320 individuals were examined. When applied to a categorical outcome that describes injury severity, a multinomial logistic regression model serves both explanatory and predictive purposes [
3]. From an explanatory standpoint, it quantifies how specific predictors, such as aircraft type, flight phase, type of operation, or participating causal factors, influence the relative likelihood of each severity level, offering significant insight into risk factors associated with more serious outcomes. From a predictive perspective, the model can estimate the probability of each severity category based on a new set of conditions, supporting decision-making in safety assessment, risk profiling, or emergency preparedness. In both cases, the model aids in translating complex multivariate relationships into actionable understanding and forecasting.
2. Literature Overview
This section provides an overview of the most relevant studies on aviation accident causation. Only research focused on factors influencing aviation accidents and their consequences within Slovakia and the broader Central European region has been included.
Zavila, Chmelík and Dopaterová (2016) [
4] have conducted a study dealing with statistics on aviation accidents, focusing on fires in military aircraft in Czechoslovakia and the Czech Republic from 1948 to 2015. It offers a comprehensive, previously unpublished overview of air disasters, crashes, and their causes, categorised by aircraft type.
The study of Vajdová et al. (2020) was focused on the analysis of aviation accidents in a specific area in order to identify the input parameters for further assessment of the impact of aviation emergencies [
5].
Bobek and Novák Sedláčková (2022) [
6] conducted a study exploring how aviation accidents have influenced civil aviation legislation in Slovak and Czech Republics. The study presents a detailed analysis of selected air accidents that occurred in these countries, focusing on years 2016 to 2020. Based on this analysis, it categorises the most common causes of accidents. The main objective was to identify legislative measures and reforms proposed or implemented to prevent similar incidents in the future. The paper concludes by addressing upcoming legislative changes in Slovak civil aviation. Novák Sedláčková, Bobek, and Kurdel (2024) presented a detailed analysis of the most common causes of air accidents in Czech and Slovak Republics in the past few years in order to develop a draft aviation safety plan for Slovak Republic that aligns with both national and international safety standards [
7].
Several studies conducted by Andrejiova are closely aligned with the scope of this paper. Andrejiova et al. (2021) [
8] is a study focused on civil aviation occurrences in Slovakia between 2000 and 2019—a period with a notable increase in incident frequency. Based on the results, incidents represented the largest proportion of the total share of aviation accidents. For their research, a Pareto analysis was employed in order to highlight key categories—wildlife strikes, technical failures of aviation technology, and unauthorised airspace penetration. Results showed that commercial aircrafts older than 14 years and total aircraft movements were linked to a small increase in civil aviation incidents. Another significant study conducted by Andrejiova (2022) [
9] deals with the civil aviation occurrences in Slovakia from 2011 to 2020. With the selected statistical methods, different categories of civil aviation accidents, incidents, serious incidents, and ground incidents were analysed. The analysis showed that the number of Civil Aviation Occurrences (CAOs) in Slovak Republic remained stable until 2018, when it rose by 34%. CAOs peaked in 2019 at 347, then dropped by 57% in 2020, likely due to the COVID-19 pandemic and reduced air traffic. Over the 10-year period, CAO trends were mostly steady, while incidents—making up 94% of all occurrences in the past five years—showed a decline.
The analysis of the legislative framework concerning aviation safety, along with the identification of causal factors contributing to safety incidents and accidents, was addressed in the study by Mikula et al. (2021) [
10]. This paper examines how various authors have engaged with selected EU legislative acts that mandate the collection, evaluation, processing, and storage of occurrences in civil aviation, as well as methodologies aimed at uncovering contributing factors to incidents and accidents.
The authors Materna et al. (2023) [
11] have addressed key factors behind aviation accidents in the Slovak Republic, emphasising human error as the primary cause. Based on an analysis of 101 accidents and 48 serious incidents from 2009 to 2022, and using the HFACS framework, the study found that human error contributed to 77% of cases. Authors Materna et al. (2018) [
12] also conducted a study focusing on the analysis of risks in aviation. The main objective of the study was to identify and classify hazards resulting from air transport, with the risk areas divided into those associated with human activity (intentional and unintentional), technical, organisational, environmental, and other factors.
The paper of Jarošová and Janošková (2023) [
13] analysed aviation accidents, incidents, and serious incidents where weather factors contributed to their occurrence. It highlights the ongoing impact of adverse weather on aviation despite technological advances. Official reports from the Czech and Slovak Republics’ investigation authorities were used for statistical analysis of aviation incidents in both countries.
4. Results
To investigate the determinants of injury severity in flight accidents, we developed a multinomial LR model with a four-level outcome variable for injury severity, which includes the levels none, minor, serious, and fatal injury. The model incorporates a range of predictive factors outlined in previous sections, such as aircraft type, operation type, and flight phase. Additionally, we included causal factors categorised into human factors, technical factors, meteorological influences, and vis major (uncontrollable natural forces). The LR model estimates the probability of each injury severity level based on these predictors, with “none” serving as the reference category. For each factor with multiple categories (operation type, flight phase, and aircraft type), one category was used as the reference category and not included in the models, specifically operation type—other, aircraft type—more than 600 kg MTOW, and flight phase—other.
A multinomial LR creates a partial model for each category of the outcome variable. Therefore, we divided the resulting LR model into three separate tables for better readability.
Table 5,
Table 6 and
Table 7 present the regression coefficients and their statistical significance for each level of the outcome variable, highlighting the most influential variables contributing to increased injury severity. The first column, B, contains the estimated regression coefficient values. The last column, labelled Exp(B), presents the transformed values of the coefficients that can be used to interpret the influence of individual explanatory factors on the occurrence of specific injury severity. If the coefficient is very low, we present it in scientific format rather than as a number with two decimal places. All interpretations of these transformed coefficients are made under the ceteris paribus assumption, meaning that all parameters of an accident are fixed except for the one being interpreted. Furthermore, the column labelled Sig. displays the
p-values of the tests for the statistical significance of individual predictors in the model and should be used to identify the influential factors for a particular level of injury severity. If the
p-value is very low, we list only the information that it is lower than the chosen significance level of 0.05.
Table 5 presents the LR model for minor injuries. The values of Sig. that are lower than the significance level of 0.05 used in this study are highlighted in bold, indicating that these explanatory factors are statistically significant for this specific type of injury severity.
For minor injuries, the following factors were found to be statistically significant:
Operation type—competition (B = 10.77; p-value < 0.05) significantly increases the odds of minor injuries by over 47 thousand times compared to the odds of no injury occurring.
Operation type—training (B = −5.39; p-value = 0.037) significantly decreases the odds of minor injury occurrence to 0.01 times (i.e., 100 times) compared to the odds of no injury occurring.
All types of aircraft significantly increase the odds of minor injury compared to the odds of no injury. Specifically, a glider (B = 5.74; p-value = 0.001) raises the odds of minor injury by approximately 311 times, a helicopter (B = 8.44; p-value < 0.05) increases it by around 4608 times, and an aircraft with less than 600 kg MTOW (B = 6.93; p-value < 0.05) significantly increases it by approximately 1019 times, all in comparison to the occurrence of no injury.
Flight phase—the approach, en-route, and take-off phases all significantly heighten the odds of minor injury compared to accidents without injury. Specifically, the approach phase (B = 13.08; p-value < 0.05) increases the odds of minor injury by more than 476 thousand times, the en-route phase raises it by 682 times, and take-off raises it by more than 29 thousand times, when compared to the odds of accident without injury.
Human factor—training (B = 5.69; p-value = 0.009) raises the odds of minor injury by nearly 295 times compared to the odds of no injury occurring.
Technical factor—other (B = 10.71; p-value < 0.05) increases the odds of minor injury by almost 45 thousand times compared to the odds of no injury occurring.
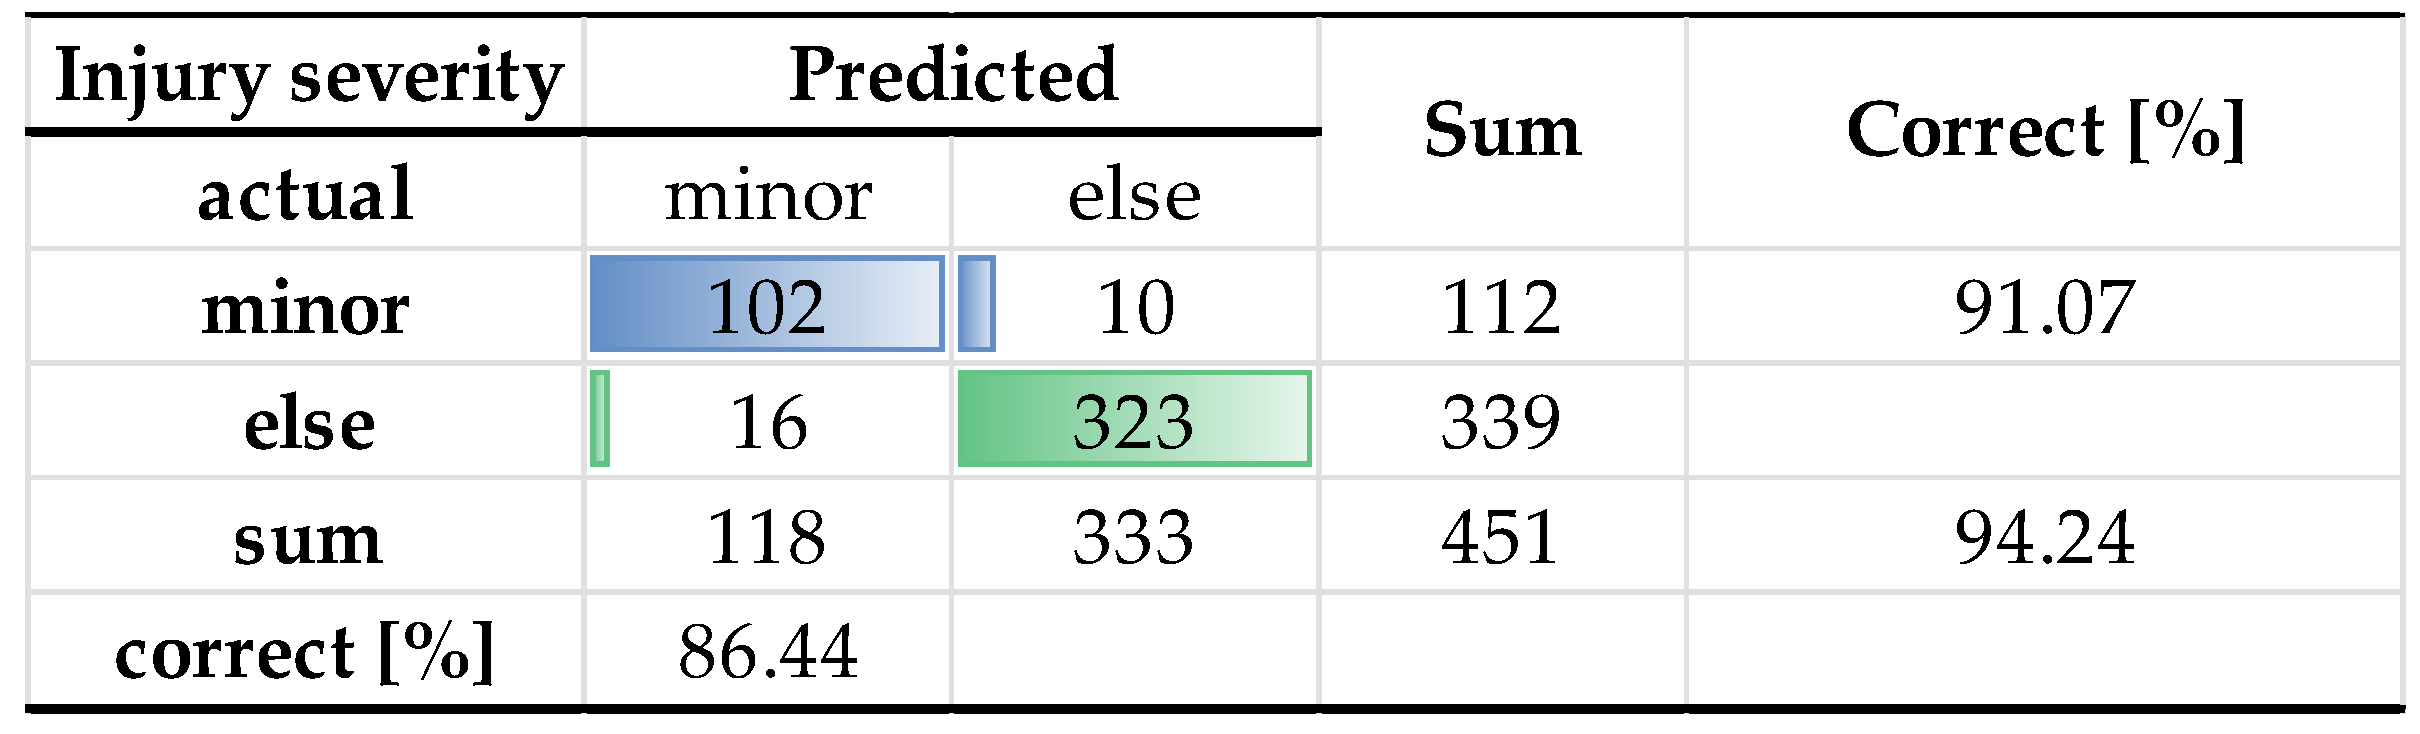
Figure 1 presents a partial summed confusion matrix for this category of injury severity. This table is intended for a partial evaluation of the LR model predictions for this category of the outcome variable. It will also be utilised for a comprehensive assessment of the entire model through micro and macro averaging, as described in the methodology section.
According to this figure, the sensitivity of the created model for this category of injury severity is slightly over 91%. This means that among the accidents where a minor injury has occurred, the model correctly identifies 91% of these instances as involving a minor injury. The model’s precision is slightly above 86%, indicating that if the model predicts an accident as involving a minor injury, it is correct in 86% of cases.
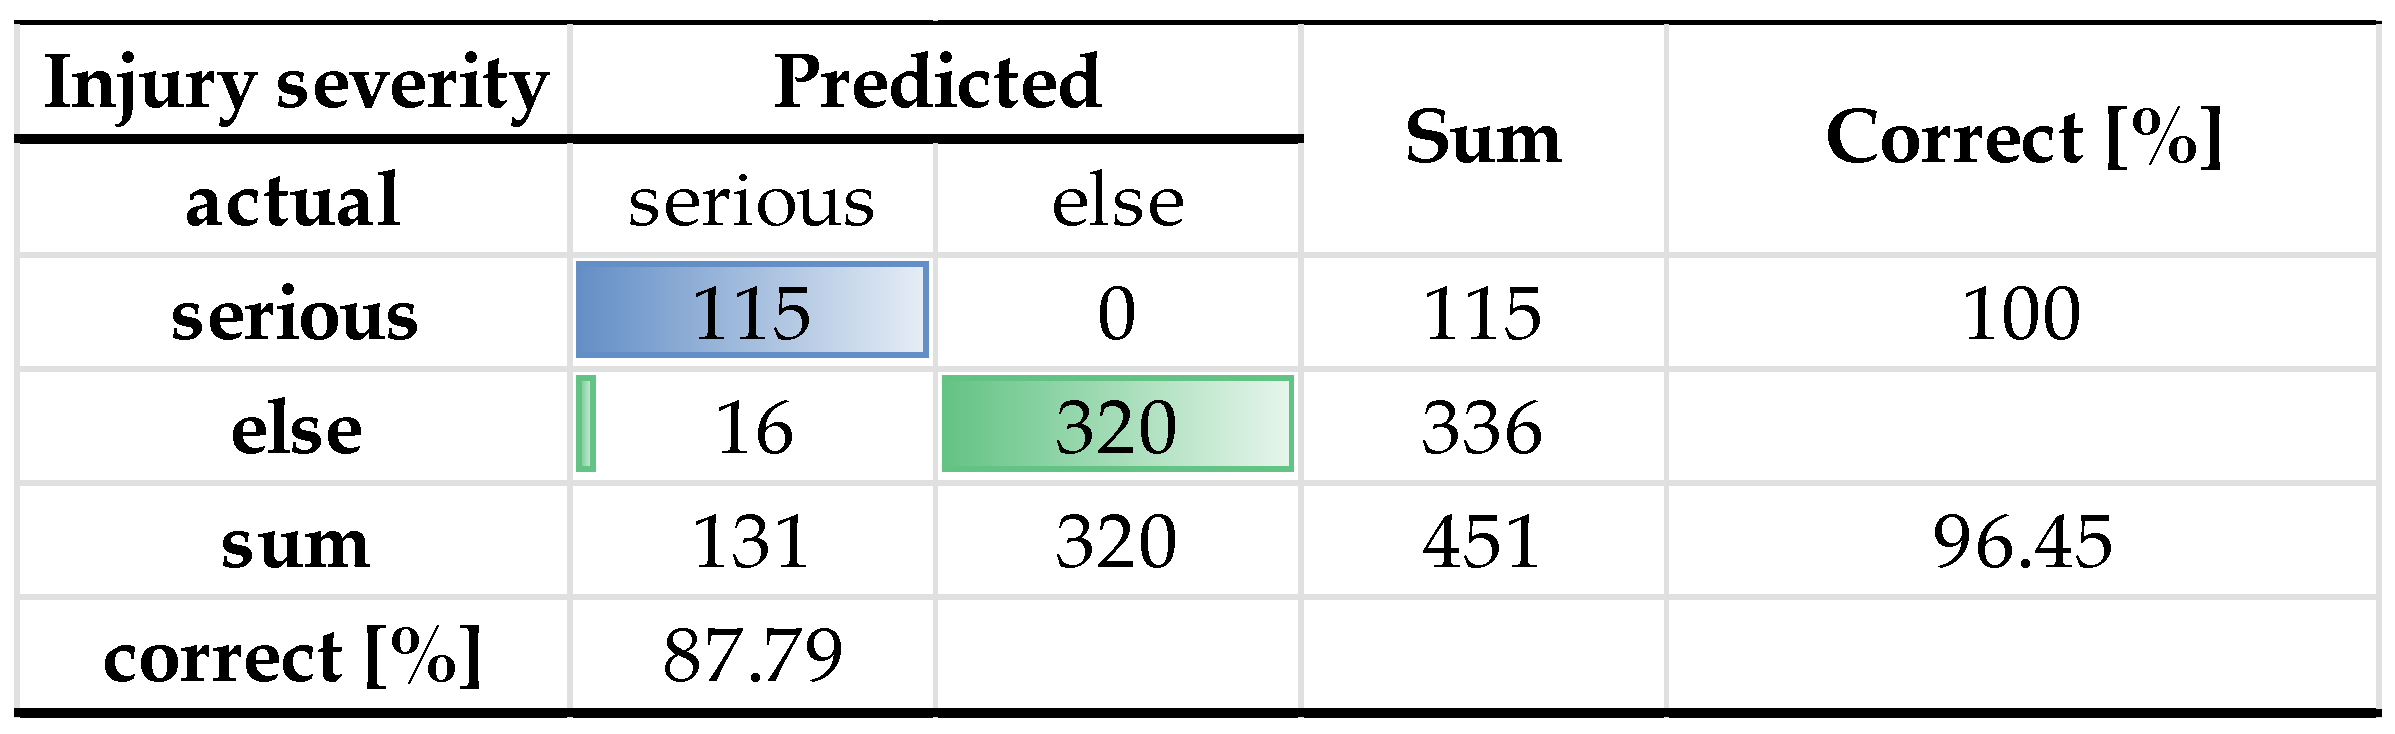
Table 6 presents the partial LR model for the category of injury severity: serious. The variables that yield a significant result in the test of their statistical significance in the model have their
p-values marked in bold.
For the accidents and incidents with a serious injury, the following factors were significant.
Aircraft type—glider (B = 5.24; p-value = 0.007) significantly increases the odds of serious injury occurrence by nearly 189 times compared to the odds of no injury in accidents with the same parameters.
Flight phase—take-off (B = 4.52; p-value = 0.001) raises the odds of serious injury by 92 times when compared to accidents without injury.
Human factor—error (B = 3.75; p-value = 0.012) increases the odds of serious injury by just over 42 times compared to accidents without injuries.
Technical factor—maintenance (B = 6.85; p-value = 0.004) increases the odds of serious injury by slightly more than 942 times compared to accidents without injury.
Flight phase_ascent, circling (B = −4.50; p-value = 0.058) has a p-value very close to the chosen significance level, thus we can mention it too with caution. This flight phase reduces the odds of a serious accident to a 0.01 multiple (i.e., 100 times lower odds) compared to accidents without injury.
Figure 2 displays the partial summed confusion matrix for this category of the outcome variable.
According to the evaluation measures in
Figure 2, the sensitivity of the LR model for this category of injury severity is 100%. Thus, all accidents involving serious injury are correctly identified by the model. Among the accidents that the model predicted as serious injuries, nearly 88% are indeed those with serious injuries. Finally,
Table 7 presents the partial LR model for fatal injuries. The statistically significant variables have their
p-values marked in bold.
For a fatal injury, the following factors have proven to be statistically significant:
Flight phase—en-route (B = 1.78; p-value = 0.026) increases the odds of a fatal accident by nearly six times, compared to accidents without injury.
Flight phase—landing (B = −4.67; p-value = < 0.05) significantly decreases the odds of fatal injury to a 0.01 multiple (i.e., 100-fold decrease), compared to accidents without injury.
Human factor—error (B = 3.19; p-value = < 0.05) raises the odds of fatal injury by more than 24 times, compared to accidents without injury.
Human factor—violation (B = 2.04; p-value = < 0.05) raises the odds of fatal injury by more than 34 times, compared to accidents without injury.
Human factor—other (B = 2.19; p-value = 0.004) increases the odds of fatal accidents by nearly nine times, compared to accidents without injuries. This category of human causation factors includes organisation, communication, health conditions, and fatigue.
Technical factor—maintenance (B = 3.54; p-value = 0.011) raises the odds of fatal injury by more than 34 times, compared to accidents without injury.
Meteorological factor (B = 1.42; p-value = 0.042) increases the odds of fatal injury by slightly over four times, compared to accidents without injury.
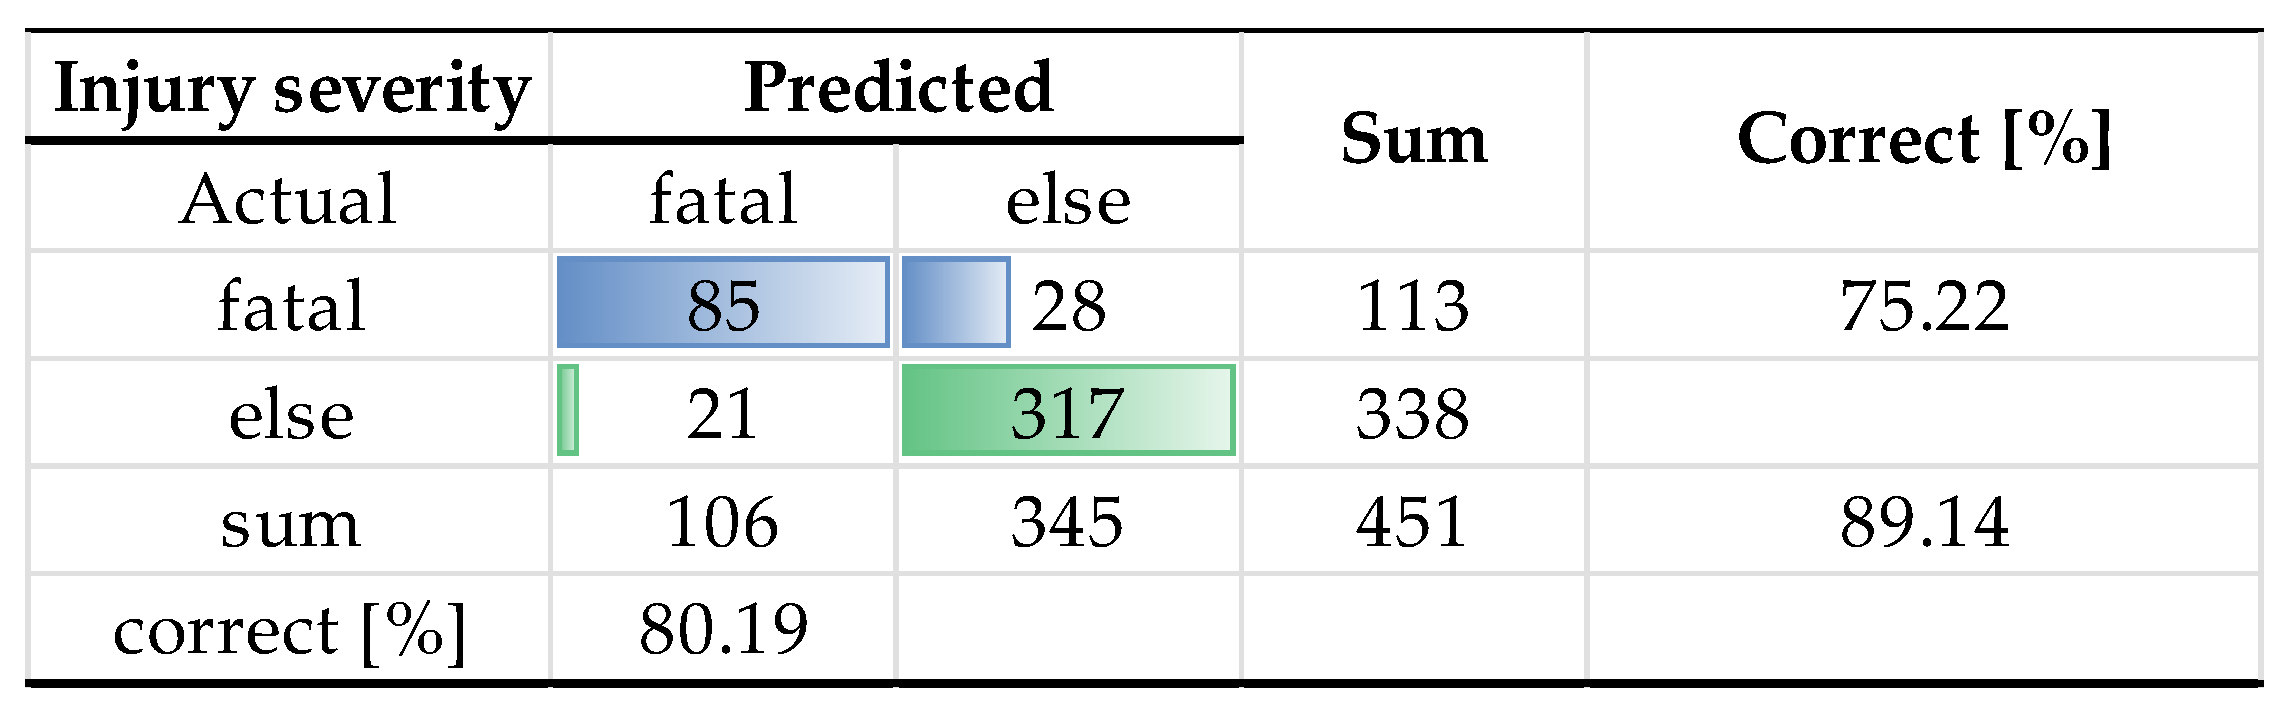
Figure 3 presents a confusion matrix for this category of the outcome variable.
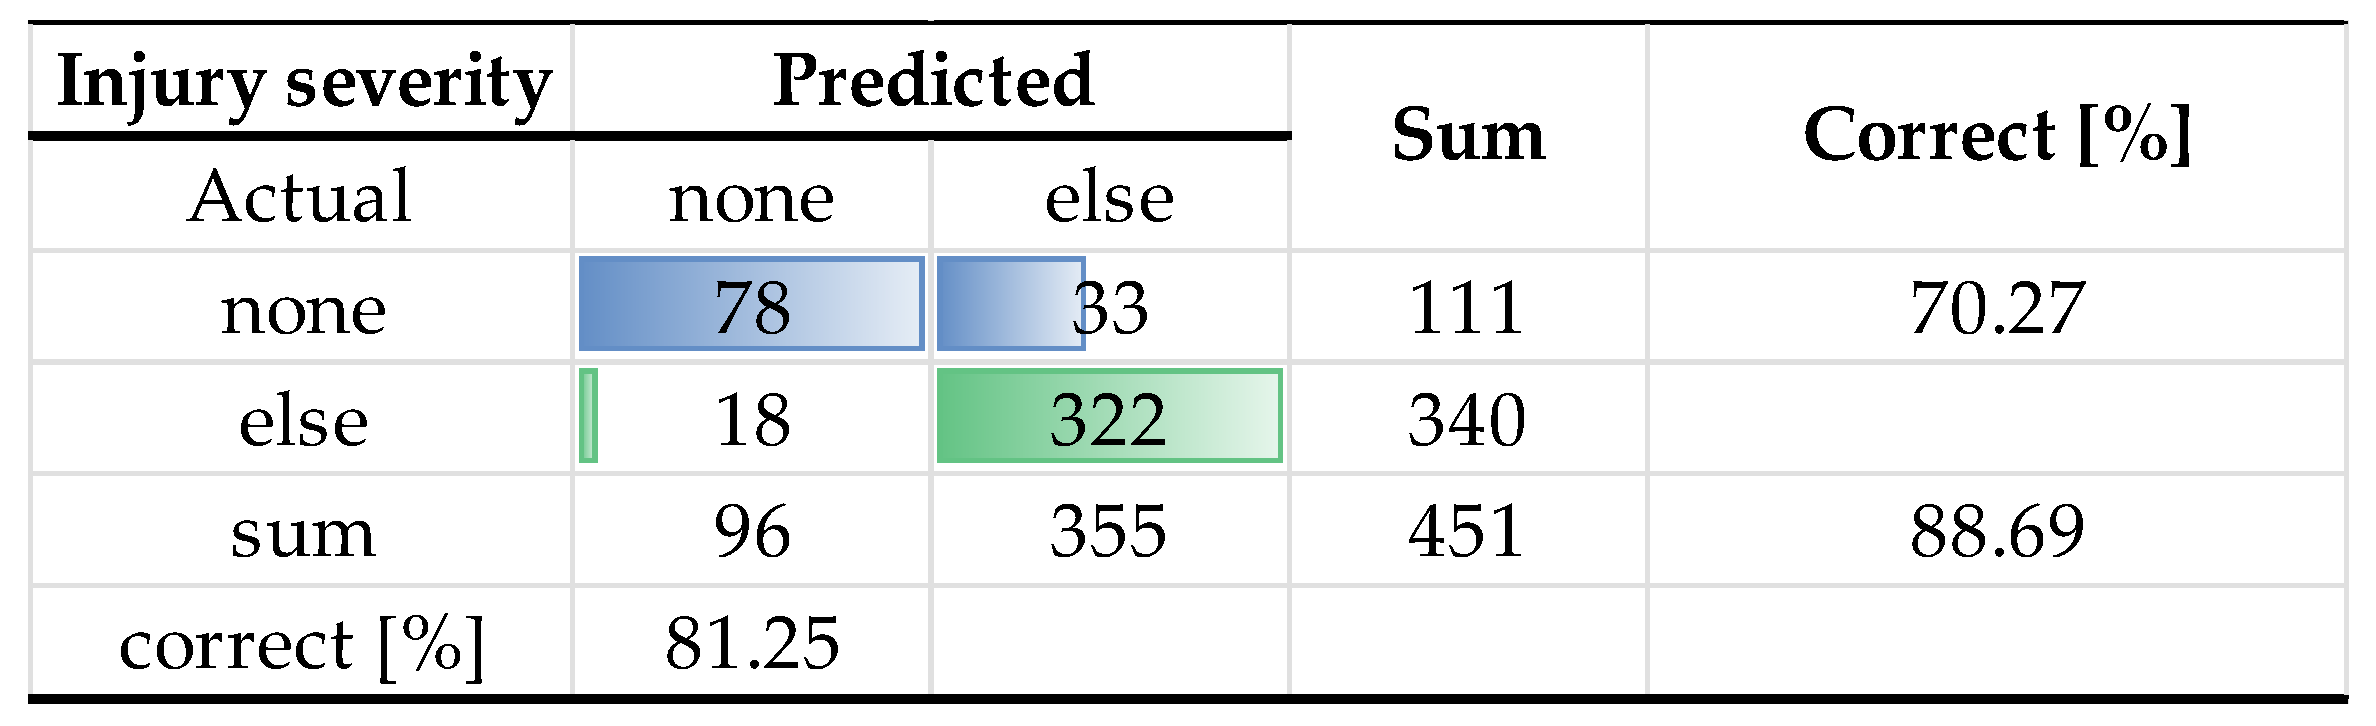
Among the accidents with fatal injuries, over 75% were correctly classified in this group. Of the incidents classified as fatal, slightly more than 80% were indeed fatal. Lastly, the confusion matrix for the reference category of injury severity “none”, which was not incorporated in the model, is presented in
Figure 4.
In this category of the outcome variable, the sensitivity exceeds 70%, while the precision is 81%. This indicates that among the accidents without injury, the model accurately identifies 70% of them. Furthermore, of all accidents predicted to be without injury, 81% are correctly identified.
Finally,
Table 8 summarises the partial evaluation measures and presents the overall evaluation measures (macro and micro averages) for the complete model encompassing all four categories of the outcome variable.
Sensitivity in identifying the correct category of the outcome variable and the precision of the predictions both average approximately 84%. This means that the model correctly identifies the four levels of accident severity in 84% of accidents on average, and when the model predicts a particular accident severity, these predictions are correct in 84% of cases. The model’s average accuracy is slightly above 92%, indicating that this ratio of the model’s predictions is correct across all categories. Moreover, the Nagelkerke R-squared for this LR model is at 0.928, indicating a sufficient ability of the model to explain the pseudo-variability of the accident severity as the outcome variable.
5. Discussion
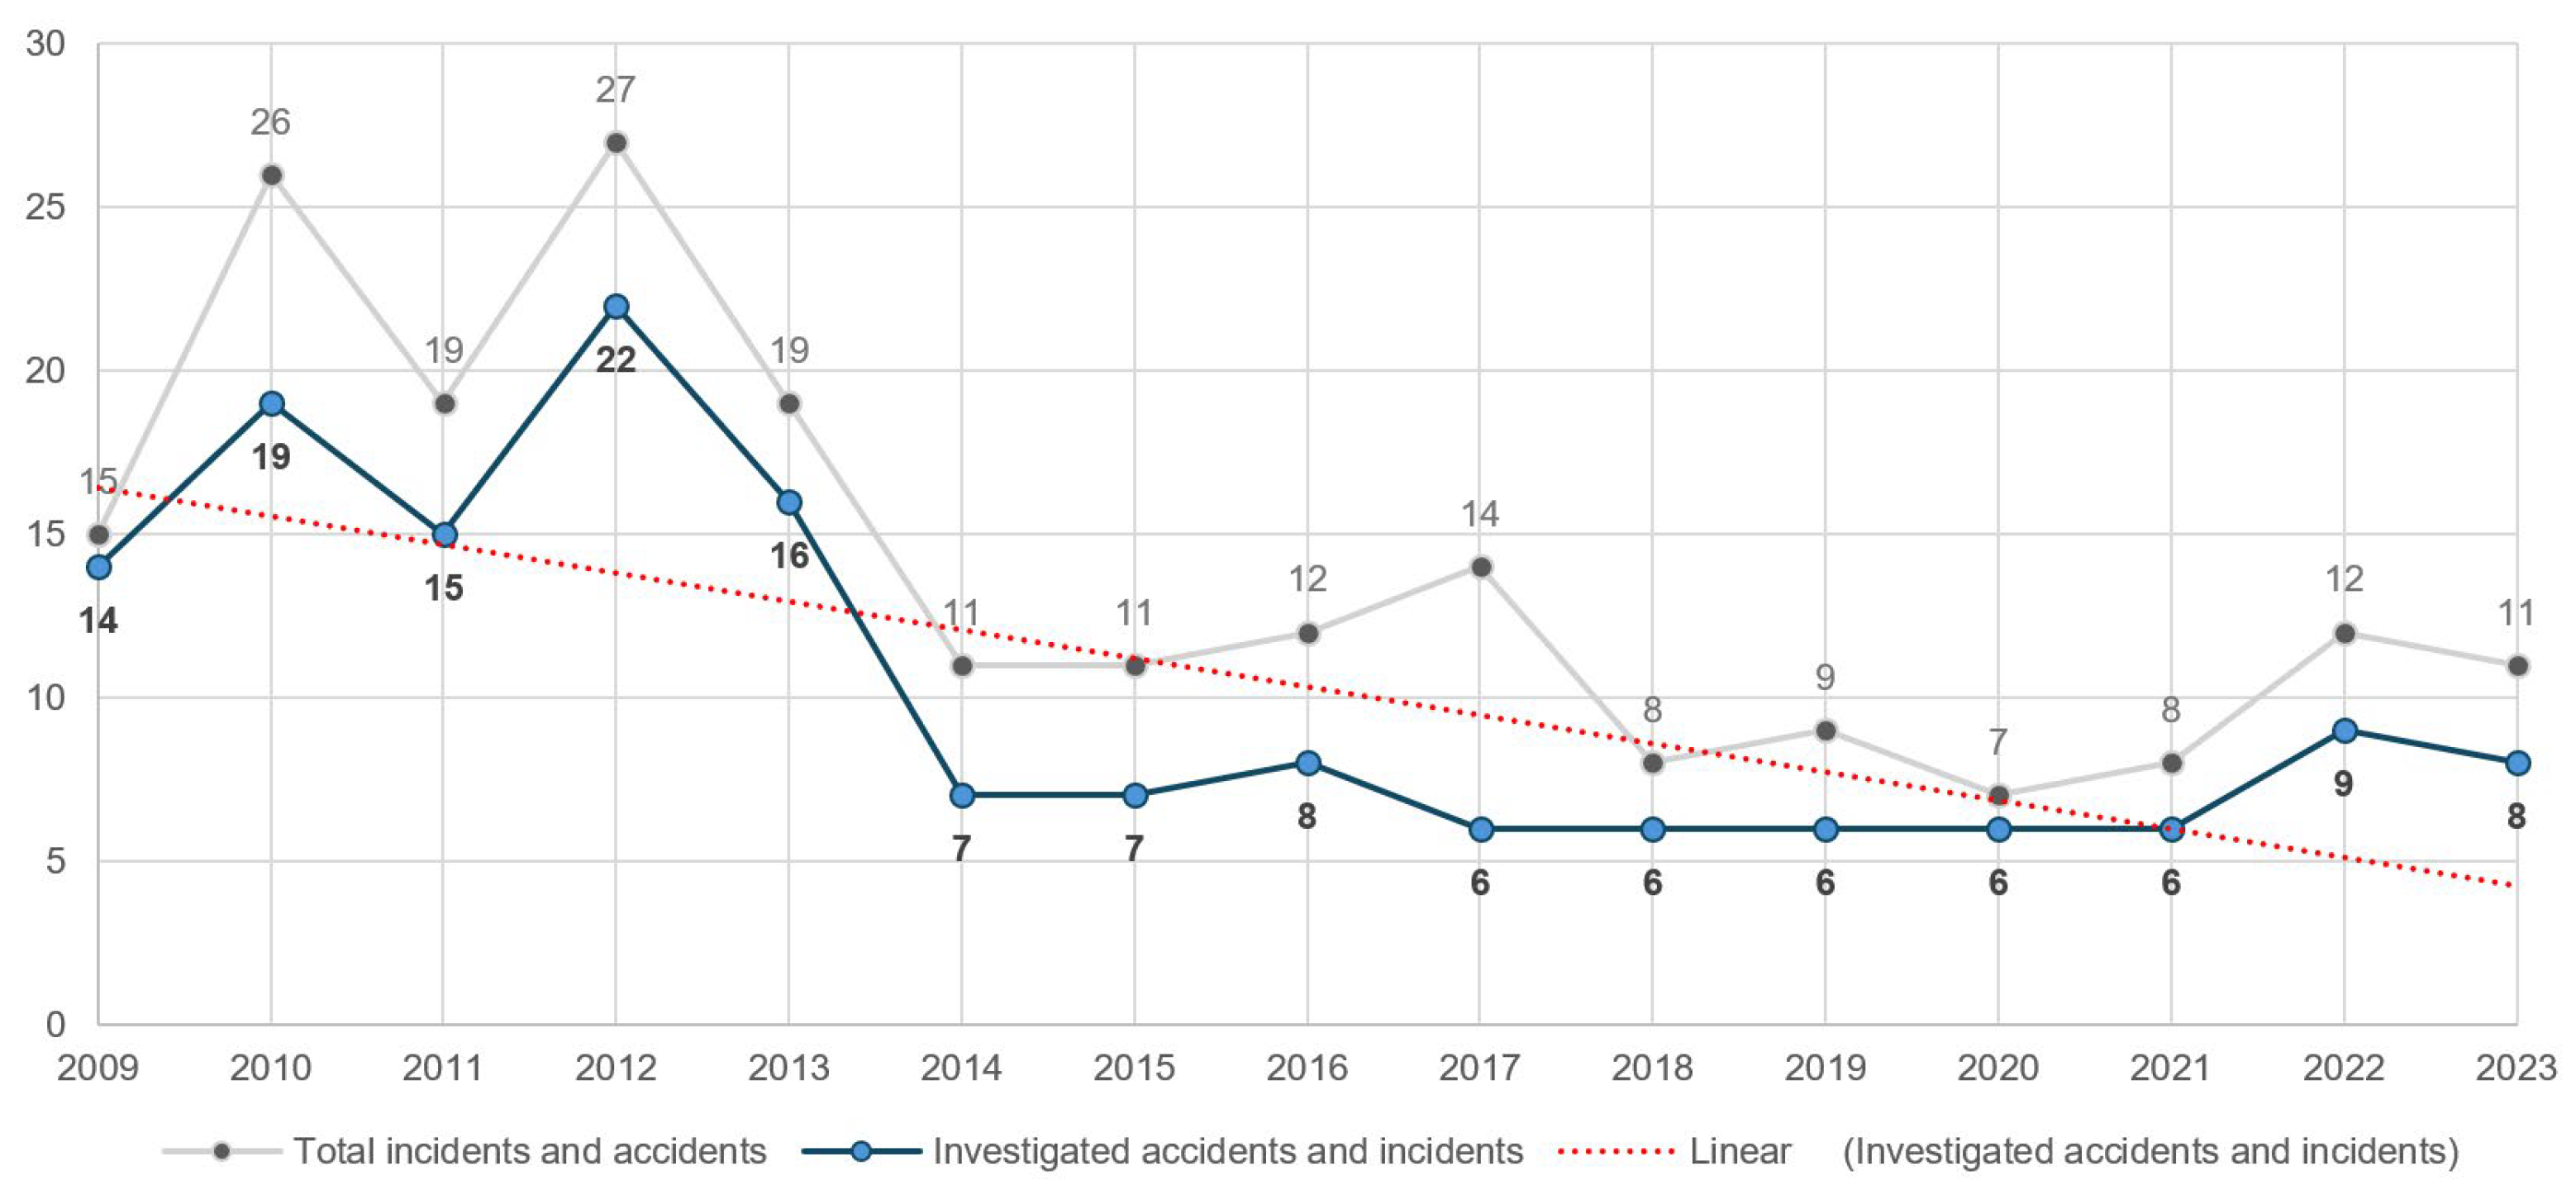
A key finding from the 155 analysed cases (2009–2023) is a generally decreasing or stagnant trend in the number of aviation accidents and incidents over the years. A significant decline was observed between 2009–2013 (average of 17 accidents/year) and 2014–2021 (average of 6.5 accidents/year). A slight increase was noted in 2022 and 2023 (average of 7.5/year), yet the overall trend remains downward, as showed in
Figure 5.
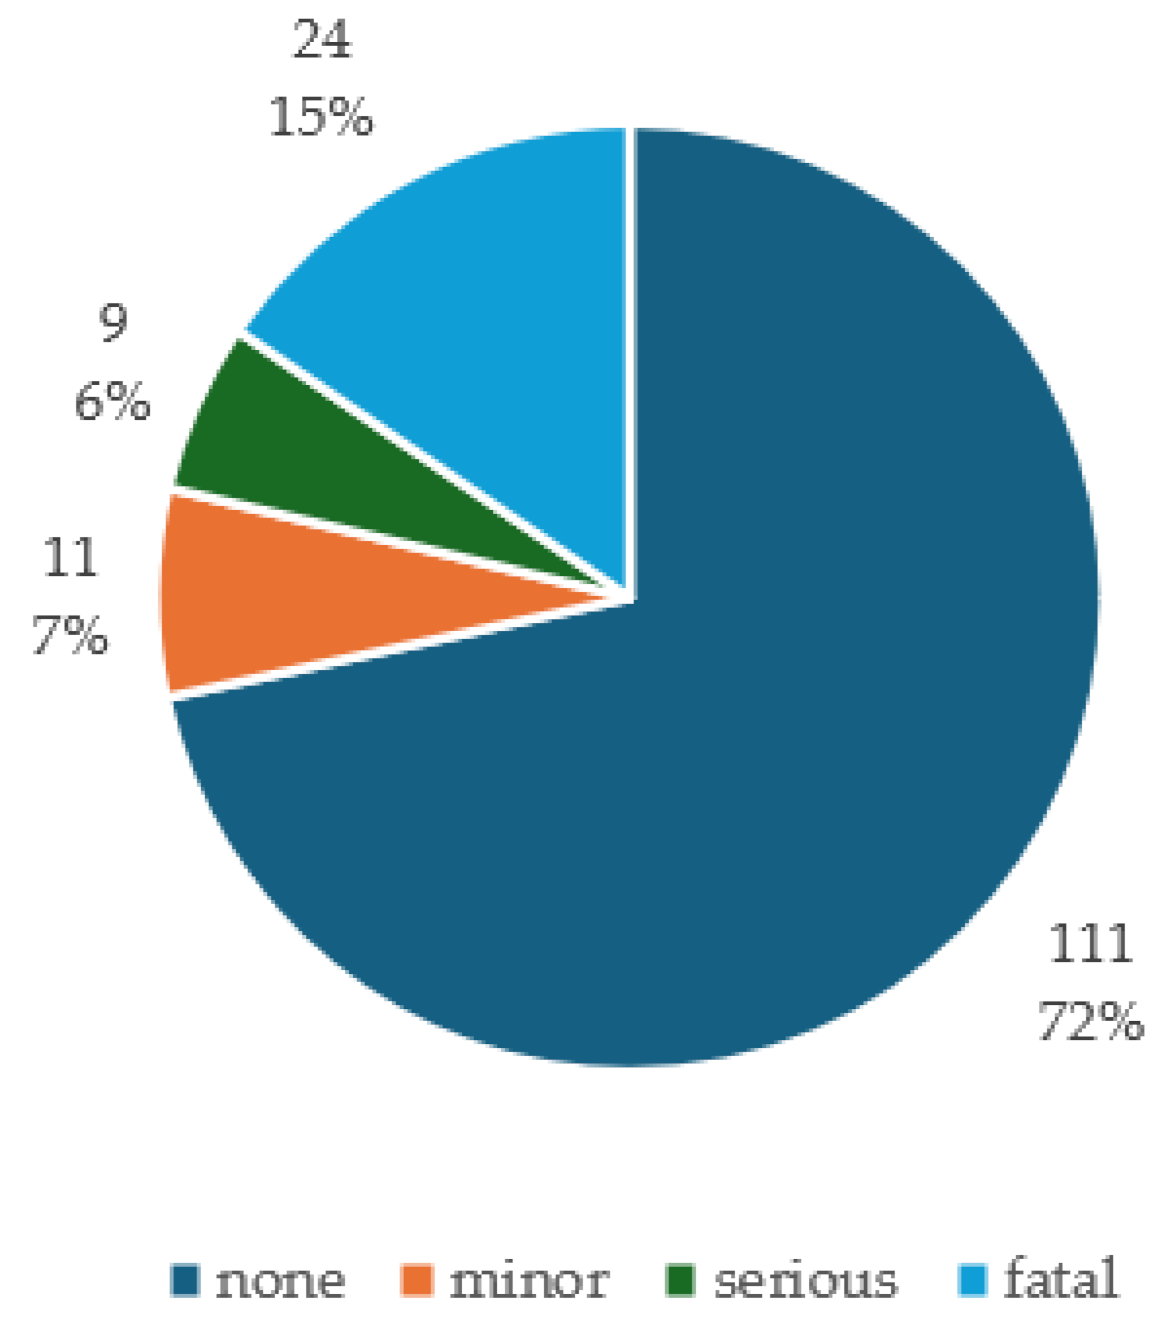
Regarding the human factor, 320 people were involved in the analysed accidents. Of these, 235 (73%) were uninjured, while 85 (27%) suffered injuries—19 minor (6%), 12 serious (4%), and 54 fatal (17%). Fatal accidents accounted for approximately 15% of all accidents, while 69% of accidents involved no injuries. Notably, the number of fatalities did not decrease in proportion to the declining number of accidents, with increases noticed in 2015 and the last three years of the analysis.
In terms of aircraft damage, 171 aircraft were involved in 155 accidents (due to multi-aircraft incidents). No damage occurred in only 16% of cases, while complete destruction affected 30% of aircraft. Serious and minor damage was observed in 27% of cases. Thus, while 85% of accidents led to damage or destruction, only 31% involved injuries or fatalities. Aircraft over 600 kg were involved in 39% of cases, followed by gliders (32%), aircraft under 600 kg (21%), and helicopters (8%). Despite being the least frequent, helicopters showed a high destruction rate (nine out of 14 involved helicopters were destroyed).
When analysing accidents according to flight type, non-commercial operations accounted for 61% of incidents, flight training for 18%, and competition flights for 17%. Professional operations, including commercial and special-purpose flights, made up less than 13% of all accidents. However, these less frequent operations were considered highly risky, often resulting in fatalities and total loss of aircraft.
A multinomial logistic regression (LR) model was developed with four outcome categories: no injury, minor, serious, and fatal. The model incorporated various predictors including aircraft type, flight phase, type of operation, and causal factors (human, technical, meteorological, and vis major). With a Nagelkerke R2 of 0.928, the model showed a strong explanatory power, and evaluation metrics confirmed its robustness, achieving an average precision and sensitivity of 84% and overall classification accuracy exceeding 92%.
The results show that aircraft type is a critical determinant of injury severity. In particular, gliders raised the odds of serious injury nearly 189 times (p = 0.007) and minor injury over 311 times (p = 0.001), relative to accidents with no injury. Helicopters and aircraft under 600 kg also significantly increased the risk of minor injuries (by 4608 and 1019 times, respectively), though they did not significantly influence fatality odds. Interestingly, no aircraft type was statistically associated with increased fatal injury risk.
Flight phase was also a significant determinant. The take-off phase increased the odds of minor (p < 0.001) and serious injuries (p = 0.001) by 92 times. The en-route phase emerged as the only phase significantly associated with fatal injuries, increasing the odds nearly sixfold (p = 0.026). Oppositely, landing was associated with a significantly lower probability of fatal injury (Exp(B) = 0.01, p < 0.05). This points to the fact that even though landing incidents are frequent, they are less likely to result in fatalities.
Human factor had the strongest impact across all injury severity levels of accidents. Human error significantly increased the odds of both serious (Exp(B) = 42.35, p = 0.012) and fatal injuries (Exp(B) = 24.4, p < 0.05). Violations of standard procedures further amplified fatal injury risk (Exp(B) = 7.7, p < 0.05), and other human-related causes such as communication issues or medical problems also raised the odds nearly ninefold (p = 0.004). For minor injuries, human-related training deficiencies increased the odds by 295 times (p = 0.009), suggesting that gaps in preparedness play a role even in less severe outcomes.
Technical factors, particularly maintenance-related failures, significantly influenced both serious and fatal injuries. Maintenance issues increased the odds of serious injury by over 942 times (p = 0.004) and fatal injury by 34 times (p = 0.011). Technical issues categorised as “other” had an extremely strong association with minor injuries (Exp(B) ≈ 44,796, p < 0.05). This means that certain unspecified technical problems can lead to non-lethal but still impactful incidents.
Meteorological conditions were not influential in predicting minor or serious injuries but did increase the odds of fatal injury by four times (p = 0.042). This suggests that while bad weather may not lead to injuries in every case, it significantly worsens outcomes when accidents do occur.
Type of operation also played a role. Competition flights were strongly associated with minor injuries (Exp(B) ≈ 47,000, p < 0.05), reflecting their higher exposure to risk without necessarily leading to fatal outcomes. Interestingly, flight training was associated with a lower likelihood of minor injuries (p = 0.037), possibly due to stricter oversight and safer operational environments.
The confusion matrices revealed strong performance across all categories. The model predicted serious injuries with 100% sensitivity and 88% precision. For fatal injuries, sensitivity was over 75%, and precision was just above 80%, suggesting solid predictive capability even in the most severe category. For accidents without injury, the model achieved 70% sensitivity and 81% precision.
In summary, the research confirms that injury severity in aviation accidents is not random but closely tied to identified variables. Human error, technical maintenance, flight phase, and aircraft type are key drivers. Notably, fatal accidents are most strongly linked to human factor, especially error, and technical maintenance issues, especially during cruise (en-route) phases and under poor weather conditions. These findings present the necessity for stricter oversight of technical maintenance, enhanced pilot training, and more stringent procedures during high-risk flight phases.
Limitations of Research
Despite the fact that a large sample of final reports on aviation accidents and incidents was examined, it is possible to identify several limitations of this research, as well as suggestions and possibilities for its future direction.
First, although all injuries reported in the final investigation reports fell into one of the four examined categories, the damage to aircraft was not always categorized into one of the four selected categories in the final reports. In some cases, only a description of the extent of the aircraft damage or damage to its individual components was provided. Accidents or incidents described in this way were categorized in this study according to the author’s own judgment.
A similar issue arose in the labelling of flight phases during which the accidents or incidents occurred. This can be attributed to the fact that the observation period spans 15 years, during which the method of recording and report structure changed over time, and each investigator might have labelled the flight phase slightly differently. For example, “cruise flight” and “en route flight” were merged in this work. Some reports also simply used the term “landing”, even in cases of unplanned or forced landings due to, for example, engine failure or an error in the landing approach, such as a piloting error when flying gliders. If a final report stated the phase as “final approach and landing”, both phases—“approach” and “landing”—were assigned to the accident. In such cases, the author’s assessments were again subjective, which is why a standardized framework for categorizing all flight phases based on clearly defined rules should be created in the future.
Another limitation may appear to be the selection of only a small number of causal factors that contributed to the accidents and incidents studied. There are, in fact, methods that significantly broaden the range of possible causal factors. One such method is HFACS (Human Factors Analysis and Classification System), which, however, only analyses human factors. The causal factors selected for analysis in this work were initially chosen from the broader range of HFACS factors based on assumptions about their occurrence (e.g., error or violation). While it is true that, according to the research, human factor failures were present in more than 80% of the studied accidents and incidents, they do not cover all safety failures. Therefore, the selection of causal factors was gradually expanded based on information obtained from the final investigation reports (e.g., technical failures, meteorological conditions, or vis major). The full HFACS method could not be applied because it does not encompass all causal factors found in the accidents and incidents. Another reason why the research did not rely solely on the HFACS method was the effort to obtain information about other operational parameters, such as aircraft type, flight phase, flight rules, etc., which HFACS does not examine. The listing of causal factors in final reports was also often inconsistent, which complicated the final classification.
The chosen research methodology could also be criticised for not examining in detail the accidents and incidents of sport flying devices, such as parachutes, hang gliders, balloons, etc. In this case, it was a deliberate decision, given the focus of the author’s institution, which educates future professionals in the field of aviation. One could argue that “non-commercial aviation” belongs to this category, but it was only analysed in the case of aircraft up to and above 600 kg, helicopters, and gliders that can be used for other activities, either commercial or for training purposes. These also fall under substantially different requirements for crew, certification, and maintenance compared to sport aircraft. In the future, it would be possible to assess the safety of sport aircraft operations and compare it with the operations analysed in this paper.
Another limitation of our research is the potential for omitted variable bias. While our model includes key predictors such as aircraft type, operation type, and causal factors, other potentially influential variables, such as pilot experience, maintenance history, or weather conditions, were not available in the dataset; therefore, they have not been included in the model. The absence of these variables may reduce the model’s ability to explain variations in injury severity and lead to the omitted variable bias in our model. These factors are likely to be correlated with both the predictors in the current model (e.g., operation type or human error) and the outcome variable (injury severity), potentially leading to over- or underestimation of the effects of included variables. For instance, pilot inexperience may increase the likelihood of human error, which in turn could elevate the risk of more severe injuries during an accident. Similarly, weather severity could, in interaction with flight phase and aircraft type, influence outcomes. In future studies, we recommend incorporating such variables where data availability allows. Doing so would not only improve the explanatory power of the model but also enhance its utility for safety interventions.
Furthermore, the logistic regression framework assumes a linear relationship between the predictors and the outcome, which may oversimplify the underlying relationships among the factors causing flight accidents. In reality, the relationship should be nonlinear and more complex, with possible interactions among the predictors. Incorporating interaction effects between predictors could provide a deeper understanding of how combinations of factors, such as flight phase and weather conditions, or aircraft type and operational type, contribute to injury severity in aviation accidents. While logistic regression permits the inclusion of interaction terms, doing so would significantly increase the model’s complexity and might risk overfitting, especially given the sample size and the number of categorical variables involved. Therefore, the careful selection of interaction terms, based on theoretical justification or exploratory analysis, is essential to balance model interpretability and predictive performance. It would also be possible to employ alternative modelling techniques, such as decision trees, which naturally incorporate interaction effects and may provide a more flexible way to uncover such patterns without explicitly specifying interactions.
Finally, our study should be criticised for its country-specific focus, as it is based on data from aviation accidents and incidents in Slovakia over a 17-year period. However, the findings may provide valuable insights for other countries with similar general aviation environments, especially regarding the high rate of accidents involving private individuals operating outside organisational frameworks. Nevertheless, applying the results directly should take into account each country’s unique regulatory, operational, and cultural context.
Nevertheless, despite these limitations, our model achieved a high prediction accuracy. Finally, to achieve sufficient sample sizes and statistical power, we combined several subcategories of aircraft type and operation type into broader groups. While this was necessary to avoid unstable estimates from poorly represented subgroups, it may have obscured potential differences between them, thereby prioritising the model’s generality but reducing its specificity.
6. Conclusions
In this section, the outcomes of a detailed statistical analysis aimed at identifying the key determinants of injury severity in aviation accidents and incidents in Slovakia are presented. Based on a dataset of 155 final reports collected between 2009 and 2023, the paper employed a multinomial logistic regression (LR) model to examine how various explanatory variables—such as aircraft type, flight phase, type of operation, and contributing causal factors—influence the severity of outcomes.
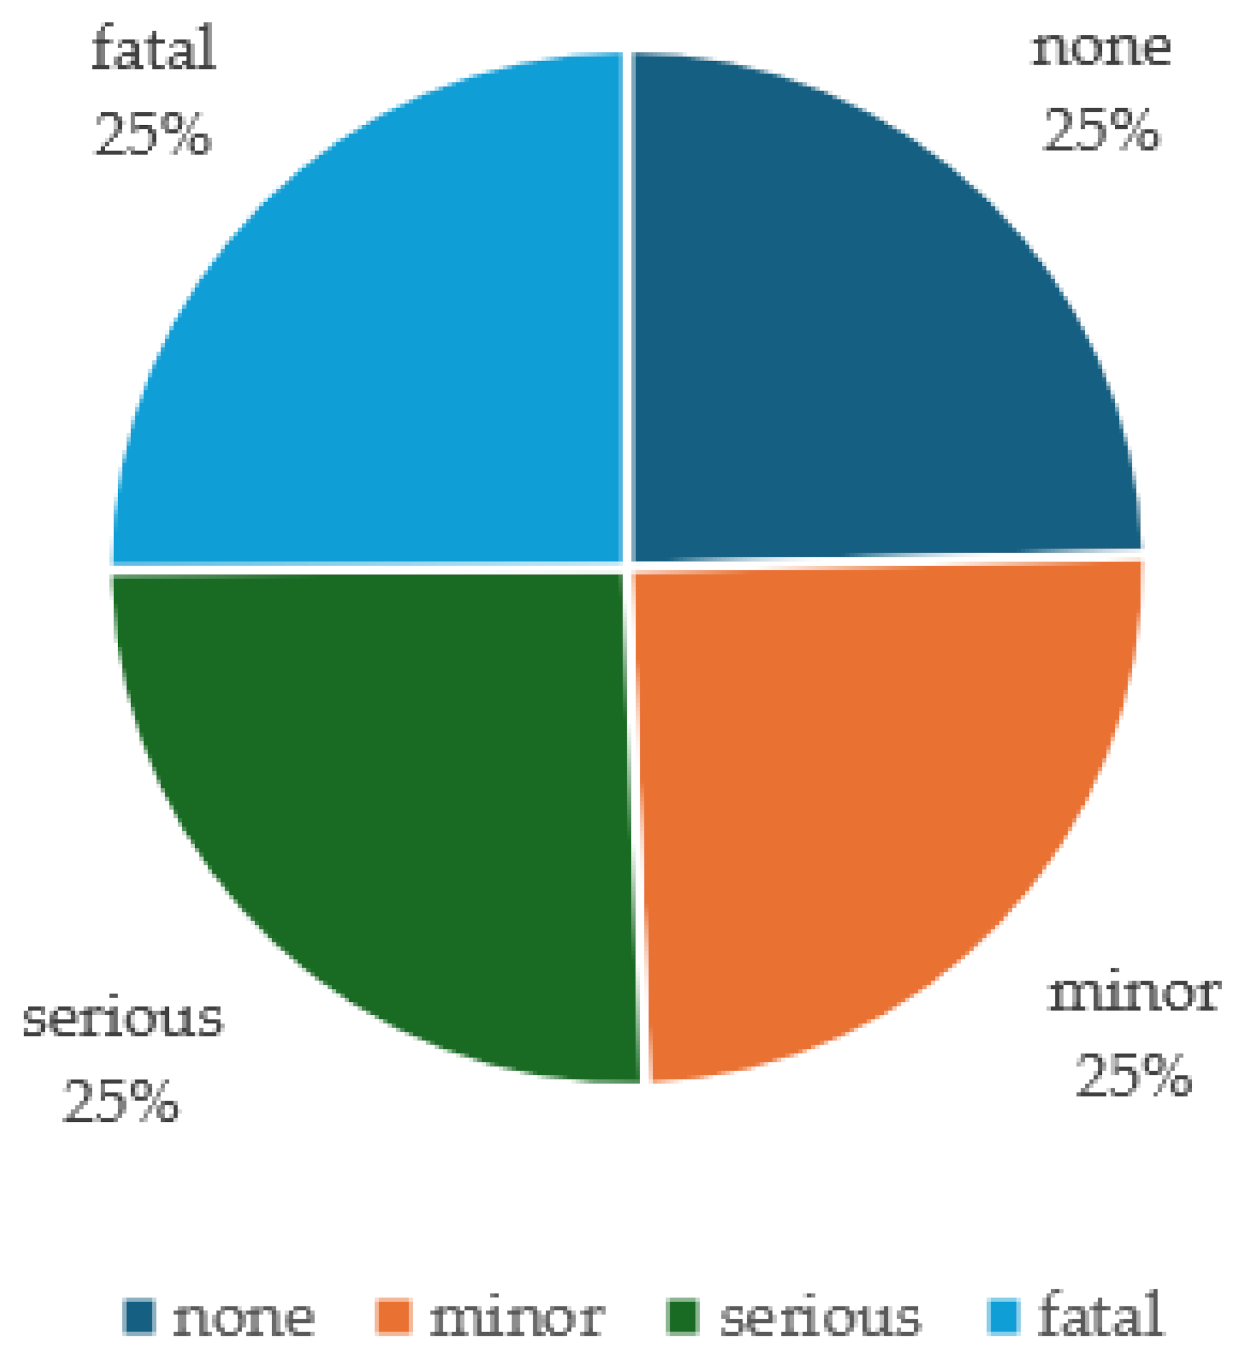
Given the categorical nature of the dependent variable (injury severity: none, minor, serious, fatal), the multinomial LR allowed for simultaneous comparison across multiple outcome levels. To address imbalances in the dataset, especially the underrepresentation of more severe cases, a weighting technique was applied to equalize the frequency of all injury categories during model training. The evaluation of the model’s performance using confusion matrices and classification metrics confirmed its high predictive accuracy and robustness.
The model’s outputs are presented in three stages, each corresponding to a different injury level: minor, serious, and fatal, while using “no injury” as the reference category. By interpreting regression coefficients, odds ratios, and significance levels, the results offer insight into which flight parameters and human or technical issues are most associated with various degrees of injury severity in aviation events across Slovakia.
First, we highlight the strong performance of the model. The multinomial logistic regression model achieved high predictive accuracy (92%) and strong sensitivity/precision (~84%) across all injury severity categories. The model explains 93% of the variance in injury severity (Nagelkerke R2 = 0.928).
Secondly, the most influential variables were identified and analysed. Human factors were the dominant cause, significantly increasing the risk of both serious and fatal injuries. Human error raised the odds of fatal injury by 24× and serious injury by 42×. Violations and other human causes (e.g., communication or health issues) also significantly increased fatality risk. Technical maintenance issues had a severe impact and increased the risk of serious injury by 942× and fatal injury by 34×. Unspecified technical issues (categorised as “other”) were strongly linked to minor injuries.
Thirdly, the analysis highlighted the flight phase as a critical period in which the likelihood of incidents or accidents is significantly higher. Take-off was the most dangerous phase for non-fatal injuries, raising the odds of serious injury by 92×. En-route flight was the only phase associated with increased fatal injury risk (6×). Landing significantly decreased the likelihood of fatal injuries.
Furthermore, the type of aircraft was shown to play a significant role in the occurrence and nature of incidents. Gliders increased the risk of both minor and serious injuries (311×). Helicopters and aircraft under 600 kg significantly increased the odds of minor injuries but were not linked to fatalities.
Another analysed category was the type of operation. Research showed that competition flying significantly increased the risk of minor injuries. On the other hand, training was associated with a reduced risk of minor injuries.
And finally, the research on weather conditions showed that meteorological factors were not significant for non-fatal injuries but raised the odds of fatal injury by 4×.
These findings highlight that injury severity in aviation is strongly driven by human error, technical maintenance failures, and the flight phase during which the accident occurs. Risk is especially elevated in en-route and take-off phases and with gliders or poorly maintained aircraft.


