Article

Research on the Automatic Multi-Label Classification of Flight Instructor Comments Based on Transformer and Graph Neural Networks

1
Faculty of Science, Civil Aviation Flight University of China, Chengdu 641419, China
2
Guanghan Flight College, Civil Aviation Flight University of China, Guanghan 618307, China
*
Author to whom correspondence should be addressed.
Aerospace 2025, 12(5), 407; https://doi.org/10.3390/aerospace12050407 (registering DOI)
Submission received: 23 March 2025 / Revised: 21 April 2025 / Accepted: 1 May 2025 / Published: 4 May 2025
(This article belongs to the Special Issue New Trends in Aviation Development 2024–2025)

Abstract

:
With the rapid advancement of the civil aviation sector and the concurrent expansion of pilot training programs, a pressing need arises for more efficient assessment methodologies during the pilot training process. Traditional written evaluations conducted by flight instructors are often marred by subjectivity and inefficiency, rendering them inadequate to satisfy the stringent demands of Competency-Based Training and Assessment (CBTA) frameworks. To address this challenge, this study presents a novel multi-label classification model that seamlessly integrates RoBERTa, a robust language model, with Graph Convolutional Networks (GCNs). By simultaneously modeling text features and label interdependencies, this model enables the automated, multi-dimensional classification of instructor evaluations. It incorporates a dynamic weight fusion strategy, which intelligently adjusts the output weights of RoBERTa and GCNs based on label correlations. Additionally, it introduces a label co-occurrence graph convolution layer, designed to capture intricate higher-order dependencies among labels. This study is based on a real-world dataset comprising 1078 evaluations and 158 labels, covering six major dimensions, including operational capabilities and communication skills. To provide context for the improvement, the proposed RoBERTa + GCN model is compared with key baseline models, such as BERT and LSTM. The results show that the RoBERTa + GCN model achieves an F1 score of 0.9737, representing an average improvement of 4.73% over these traditional methods. This approach enhances the consistency and efficiency of flight training assessments and provides new insights into integrating natural language processing and graph neural networks, demonstrating broad application prospects.

1. Introduction

The training and evaluation of pilots have always been an important part of the healthy development and safe flight of the civil aviation industry [1,2]. Competency-Based Training and Assessment (CBTA) is different from traditional pilot training as it not only focuses on the pilot’s manual skills but also comprehensively evaluates multiple dimensions such as operational ability, communication ability, decision-making ability, emergency response ability, teamwork ability, and professional knowledge [3,4]. This comprehensive approach aims to cultivate pilots capable of managing complex flight environments and unexpected scenarios, and to enhance flight safety and training quality.
Although CBTA has made significant breakthroughs in evaluation dimensions, the current evaluation method relies mainly on written comments from flight instructors. Although this evaluation method is intuitive, it also has significant limitations. Firstly, flight instructors are prone to being influenced by their personal experiences, emotions, and biases when writing comments, which may result in a high degree of subjectivity in the assessment results. Moreover, there could be significant differences in the comments given by different flight instructors for the same student, thus affecting the consistency and fairness of the assessment. Secondly, CBTA demands a comprehensive and multi-dimensional assessment of pilots, involving multiple interrelated competency indicators. Traditional manual assessment methods find it difficult to comprehensively and systematically analyze the relationships among these dimensions, potentially leading to one-sided or incomplete assessment results. Furthermore, with the continuous expansion of the training scale, flight instructors are confronted with the assessment tasks of a larger number of students. Manually processing a large number of written comments is not only time-consuming and labor-intensive but may also compromise the assessment quality and even result in missing opportunities to adjust training plans in a timely manner.
Therefore, it is particularly important to conduct multi-dimensional automatic classification of flight instructors’ comments. With the development of machine learning technology, multi-label classification methods have been widely applied in multiple fields, such as text classification, image annotation, and medical diagnosis [5,6,7,8,9,10,11]. Unlike traditional single-label classification tasks, multi-label classification tasks require each sample to belong to multiple categories simultaneously, making them more challenging and presenting more complex challenges [12,13,14,15,16].
Since the introduction of the Transformer model, it has achieved revolutionary advancements in the field of natural language processing (NLP) due to its outstanding performance. This is especially true for pre-trained models such as Bidirectional Encoder Representations from Transformers (BERT) and Robustly optimized BERT approach (RoBERTa) [17,18]. For example, Tan et al. [19] proposed a RoBERTa-LSTM hybrid model for sentiment analysis. To tackle the challenges of lexical diversity, dataset imbalance, and long-range dependencies in this domain, the model first uses GloVe word embeddings for data augmentation to address the dataset imbalance issue. Subsequently, it enhances sentiment analysis performance by leveraging RoBERTa’s word embedding generation capability alongside LSTM’s ability to capture long-range dependencies. Talaat [20] proposed a hybrid model integrating BERT with BiLSTM and BiGRU for sentiment analysis. Compared with other models, this hybrid model achieves higher accuracy, but emojis can influence its performance. Kula et al. [21] created eight hybrid architectures using the Flair library based on BERT and its derivative architectures, covering two categories: DRE (based on BERT and RNN) and TDE (based on BERT/RoBERTa and pooling layers). The study found that extending training time and optimizing preprocessing strategies could enhance model performance. Tsani et al. [22] proposed an ensemble model that combines BERT and RoBERTa based on the collected social media text data. By incorporating the back-translation data augmentation method, this model is applied to social media personality prediction and can effectively improve prediction performance. Semary et al. [23] proposed a RoBERTa-based hybrid model by integrating the strengths of Graph Neural Network (CNN) and LSTM and utilizing the SMOTE technique to address the imbalance issue in the Twitter dataset. Jamjoom et al. [24] focused on the issue of cyberbullying detection in social media and proposed the RoBERTaNET model, which integrates RoBERTa and GloVe features. They compared this model with various machine learning and deep learning algorithms and found that its performance surpassed that of other models.
Graph Neural Networks (GNNs), as effective tools for processing graph-structured data, can capture relational information between nodes through graph structures, which is particularly crucial when modeling dependencies among labels [25,26,27,28,29,30]. Wang et al. [31] proposed a unified model called GCN-LPA, which combines Graph Convolutional Networks (GCNs) and Label Propagation Algorithm (LPA). This model allows edge weights to be learnable and utilizes LPA to assist GCN in optimizing edge weights. Through experiments on semi-supervised node classification and knowledge graph recommendation, it has been verified that the performance of this model surpasses that of baseline models. Vu et al. [32] proposed a multi-label text classification model named LR-GCN based on GCNs. This model effectively enhances classification performance by exploring label correlations and semantics. Yu et al. [33] proposed a Multi-Granularity Graph Convolutional Neural Network (MG-GCN) based on object relationships, utilizing attention mechanisms and multiple object difference matrices. This model effectively addresses complex multi-label classification problems in information systems. Khemani et al. [34] explored specific GNN models such as GCNs, GraphSAGE, and Graph Attention Networks (GATs). They provided a comprehensive overview highlighting that GNN models exhibit significant advantages in processing graph-structured data and are widely applied across numerous domains.
In summary, although existing studies have attempted to integrate Transformers and GNNs in multi-label classification, there are still some shortcomings. For example, some studies rely on simple co-occurrence statistics for label graph construction, failing to fully leverage the semantic information of labels. Furthermore, existing fusion strategies are often relatively simple and fail to fully exploit the respective advantages of the Transformer and GNNs.

2. Data and Models

This paper presents a new multi-label classification model that integrates the Transformer encoder (RoBERTa) and Graph Convolutional Network (GCN) to realize automatic multi-dimensional classification of written feedback from flight instructors. This encompasses data collection and preprocessing, the design of model architecture, the model training procedure, and the configuration of evaluation metrics.

2.1. Data Collection and Preprocessing

The dataset is sourced from a particular department of our university and consists of 1078 written assessments from flight instructors regarding their students. Each evaluation is associated with 2–10 dimensional behavioral indicator labels. As depicted in Figure 1, an exemplary assessment reads, “This student did not perform the pre-flight takeoff brief, had a high taxiing speed, was unclear about taxiing interval requirements, used non-standard radio communication terminology, and had incorrect ADF Morse code listening procedures”. The complete evaluation system consists of 158 label points and 47 labels, which cover six main dimensions: FPM (Flight Path Management), COM (Communication), PRO (Execution of Procedures and Compliance with Regulations), PSD (Problem Solving and Decision Making), SAW (Situational Awareness and Information Management), and KNO (Application of Knowledge). These six dimensions represent the core competencies required for pilots during training and assessment. The labels are determined and defined by the Civil Aviation Administration of China (CAAC) based on expert knowledge in aviation training and performance evaluation. The labels reflect key competencies and behaviors that are essential for safe and effective flight operations. Detailed information about these six dimensions, including the number of labels and the specific areas they assess, is presented in Table 1. Table 2 illustrates the details of the FPM dimension, which includes 7 labels such as “Accurate and gentle manual control of the aircraft” and “Monitor and detect deviations from the desired aircraft trajectory”. Each of these labels corresponds to specific flight behaviors or skills required for effective flight path management. The entire flight evaluation process is divided into 10 stages, each corresponding to a set of operational points and associated label points. For instance, Table 3 shows the detailed description of the stages, and Table 4 lists the Execute Engine Start stage, which includes 9 label points across multiple dimensions. These label points are defined and discussed by flight experts to ensure they comprehensively capture the necessary skills and competencies.
To ensure the availability of the data and the effectiveness of model training, a series of preprocessing steps was carried out on the raw data. Data preprocessing consists of three steps.
(1)
Text cleaning was performed to ensure the availability of the data. Punctuation marks, numbers, and other non-textual elements in the comments were systematically removed using regular expressions (for example, “Flight altitude 3000, stable operation” was cleaned to “Flight altitude stable operation”), thereby effectively minimizing noise interference. Additionally, the text format was converted to lowercase for uniformity, and stop words were eliminated. Traditional stop word lists (such as “的” and “了” in Chinese) accounted for approximately 15% (for instance, “In an emergency situation” was cleaned to “Emergency situation” by removing contextually equivalent stop words). Considering the specificity of the aviation field, critical negative words such as “not” and “none” (the English equivalents to “不” and “无” in the context of negation) were retained (for example, “not” in “Improper operation”) to avoid semantic distortion caused by excessive cleaning. This process not only ensured text consistency but also laid a robust foundation for subsequent feature extraction.
(2)
Label processing was conducted. The main objective of label processing was to eliminate ambiguity and adapt to the model input format. Initially, labels were standardized with unified naming conventions (for example, “Skilled operation” was changed to “Operation skilled”) to prevent duplicate labels arising from case or spelling variations (for instance, “Operation error” and “Operational mistake” being recognized as distinct labels). Then, the MultiLabelBinarizer was utilized to convert labels into a binary matrix format, where each row represented a sample, each column corresponded to a label, with a value of 1 indicating the presence of the label and 0 indicating its absence.
(3)
Data partitioning was executed. The dataset was divided into training, validation, and test sets according to an 8:1:1 ratio, ensuring that the label distribution in each subset accurately reflected the overall dataset distribution. Additionally, a five-fold cross-validation strategy was applied to further evaluate the model’s generalization capability and stability.

2.2. Model Architecture

The multi-label classification model put forward in this paper comprises two essential components: Transformer Encoder (RoBERTa) and Graph Neural Networks. By integrating the formidable text representation ability of the Transformer architecture and the strength of GCNs in capturing intricate inter-dependencies between labels, the efficient processing of multi-label classification tasks is accomplished.
The overall architecture of the model is presented in Figure 2. The model primarily consists of the following eight core components.
(1)
The text input module receives the written feedback from flight instructors as raw data. The input text undergoes tokenization using RoBERTa’s tokenizer, which generates word-level input representations in the form of vocabulary IDs (input_ids) and their corresponding attention masks (attention_mask). Subsequently, the tokenized text input is fed into the Transformer encoder, specifically the RoBERTa Encoder, which extracts the embedding vector (hCLS) of the [CLS] token in the sequence through multiple layers of self-attention mechanisms and feedforward neural networks, this vector serves as the semantic representation of the entire comment, as demonstrated in Equation (1).
h C L S = RoBERTa Tokenize X
where X is the input remark and hCLS is the embedding vector of [CLS] tags.
(2)
The initial label prediction part converts the hCLS extracted by the RoBERTa encoder into initial label logits (Ztransformer) through a fully connected layer, as illustrated in Equation (2).
Z t r a n s f o r m e r = W T h C L S + b T
where WT and bT are the weights and biases of the fully connected layer, respectively.
(3)
The label embedding section assigns an embedding vector of a fixed dimension to each behavioral indicator label, generating a label embedding matrix (E) through the embedding layer, as illustrated in Equation (3).
E = Embedding L
where L is the set of labels.
(4)
The GCN module employs the label embedding matrix and the adjacency matrix (A) constructed based on the co-occurrence relationships among labels to capture high-order dependencies among labels through multi-layer graph convolutional operations. In particular, the GCN comprises three graph convolutional layers, with hidden dimensions of 128, 64, and equivalent to the number of labels in each layer, as illustrated in Equation (4).
H ( l + 1 ) = σ D 1 / 2 A D 1 / 2 H ( l ) W ( l )
where A represents the adjacency matrix of the label graph, D is the degree matrix, H(l) denotes the node representation at the l th layer, W(l) is the weight matrix at the l th layer, and σ is the activation function (ReLU).
For example, the label co-occurrence matrix for the top 5 labels can be represented as shown in Figure 3.
This co-occurrence matrix illustrates the frequency of co-occurrence between the top five labels in the dataset. For instance, Label 1 and Label 2 have a co-occurrence frequency of 0.25, indicating that these two labels appear together in the same sample with this frequency. This matrix is then used to build the adjacency matrix for the graph, where edges are formed between labels with a high co-occurrence frequency (above a certain threshold).
The GCN leverages this adjacency matrix and the label embedding matrix to learn the dependencies between labels. The high-order dependencies are captured through the graph convolutional layers, which process the label embeddings in each layer and propagate information through the graph, enabling the model to improve label prediction accuracy.
(5)
The label representations output by the GCN are passed through a fully connected layer to generate the label logits (ZGCN) produced by the GCN, as illustrated in Equation (5).
Z G C N = H ( 3 ) W ( 3 ) + b ( 3 )
where W(3) and b(3) represent the weights and biases of the fully connected layer in the third layer of the GCN, respectively.
(6)
The fusion strategy section performs element-wise addition of the initial label logits (Ztransformer) generated by RoBERTa and the label logits (ZGCN) generated by the GCN to obtain the final label logits (Zfinal), as illustrated in Equation (6).
Z f i n a l = Z t r a n s f o r m e r + Z G C N
(7)
The Sigmoid activation function converts the fused label logits (Zfinal) into probability values, as illustrated in Equation (7).
P = σ Z f i n a l
where σ ( x ) = 1 1 + e x .
(8)
Thresholding converts the probability values into binary label prediction results (Y) based on a set threshold (0.5), as illustrated in Equation (8).
Y = 1 if   P i 0.5 0 otherwise

2.3. Model Training

This section is subdivided by subheadings. It should offer a succinct and accurate description of the experimental results, their interpretation, and the conclusions that can be drawn from the experiments. The specific content is shown in Table 5.
The Binary Cross-Entropy Loss with Logits (BCEWithLogitsLoss) is utilized, suitable for multi-label classification tasks. This loss function integrates the Sigmoid activation function with binary cross-entropy, allowing it to independently handle the prediction probabilities for each label. Specifically, its definition is presented as illustrated in Equation (9).
L = 1 N i = 1 N j = 1 L y i j log ( σ ( z i j ) ) + ( 1 y i j ) log ( 1 σ ( z i j ) )
where N is the number of samples, L is the number of labels, yij is the jth label of the ith sample, taking a value of 0 or 1, zij is the corresponding label logits, and σ(zij) is the Sigmoid activation function.
The training process includes data loading, forward propagation, loss calculation, backpropagation, and parameter updates. As depicted in Figure 4, which presents the model training flowchart for this particular model, a total of 5 training epochs are carried out. After each training epoch, the model’s performance is assessed on the validation set, and the optimal model parameters are saved according to the F1 score.
Throughout the model training process, this paper systematically documented and visualized the variation curves of the loss function and F1 score, as depicted in Figure 5.
As depicted in Figure 5, as the number of training epochs increases, the training loss gradually declines, indicating that the model is continuously learning and undergoing optimization, and the prediction error is progressively diminishing. The F1 score on the validation set steadily ascends, suggesting that the model’s performance in the multi-label classification task is improving. The convergence of the loss function and the improvement in the F1 score indicate that the model has effectively captured the intricate relationships between text features and labels, and no substantial overfitting phenomenon has emerged during the training process.

2.4. Model Evaluation

To comprehensively measure the model’s performance in multi-label classification tasks, four metrics are used: average accuracy, average precision, average recall, and average F1 score.
Average accuracy measures the overall proportion of correct predictions made by the model across all labels. It reflects the model’s comprehensive performance in multi-label classification tasks by calculating the accuracy for each label and taking the average, as illustrated in Equation (10).
Average   Accuracy = 1 L j = 1 L T P j + T N j T P j + T N j + F P j + F N j
Average precision is calculated by taking the average after computing the precision for each label. Precision represents the proportion of true positive instances among those predicted as positive by the model, reflecting the model’s ability to avoid false positives, as illustrated in Equation (11).
Average   Precision = 1 L j = 1 L T P j T P j + F P j
Average recall is calculated by taking the average after computing the recall for each label. Recall represents the proportion of true positive instances the model can correctly identify, reflecting the model’s ability to avoid false negatives, as illustrated in Equation (12).
Average   Recall = 1 L j = 1 L T P j T P j + F N j
The average F1 score is the harmonic mean of precision and recall, which comprehensively considers the model’s performance in avoiding false positives and false negatives. By taking the average of the F1 scores for each label, it provides a balanced, comprehensive metric that takes into account both precision and recall, as illustrated in Equation (13).
Average   F 1   Score = 1 L j = 1 L 2 × T P j 2 × T P j + F P j + F N j
where L is the total number of labels, representing the number of all different labels in the classification task. TPj is the true positive for the jth label, representing the number of instances correctly predicted as positive. TNj is the true negative for the jth label, representing the number of instances correctly predicted as negative. FPj is the false positive for the jth label, representing the number of instances incorrectly predicted as positive. FNj is the false negative for the jth label, representing the number of instances incorrectly predicted as negative.
The evaluation metrics mentioned above enable a comprehensive assessment of the model’s performance in multi-label classification tasks. Average accuracy provides an overall measure of prediction correctness. Average precision and average recall evaluate the model’s ability to minimize false positives and false negatives, respectively. The average F1 score combines these two dimensions to provide a balanced evaluation of performance.

3. Results and Discussion

To conduct a thorough evaluation of the efficacy the effectiveness of the new model, this paper chooses a diverse range of commonly utilized multi-label classification models as baseline models for comparative analysis. These baseline models encompass both machine learning-based models and conventional deep learning-based multi-label classification models to verify the advantages of the proposed model from different perspectives. The selected baseline models comprise BR (Binary Relevance), CC (Classifier Chains), LP (Label Powerset), RF (Random Forest), LSTM (Long Short Term Memory), and BERT (Bidirectional Encoder Representation from Transformers).

3.1. Comparison of Results

In order to systematically compare and analyze the performance of various models in multi-label classification tasks, this paper employs a five-fold cross-validation approach to ensure the reliability and stability of the evaluation results. Specifically, Table 4 summarizes the core principles, hyperparameter configurations, and training procedures for each benchmark model, while Table 6 presents the average performance of evaluation metrics for each model on the test set.
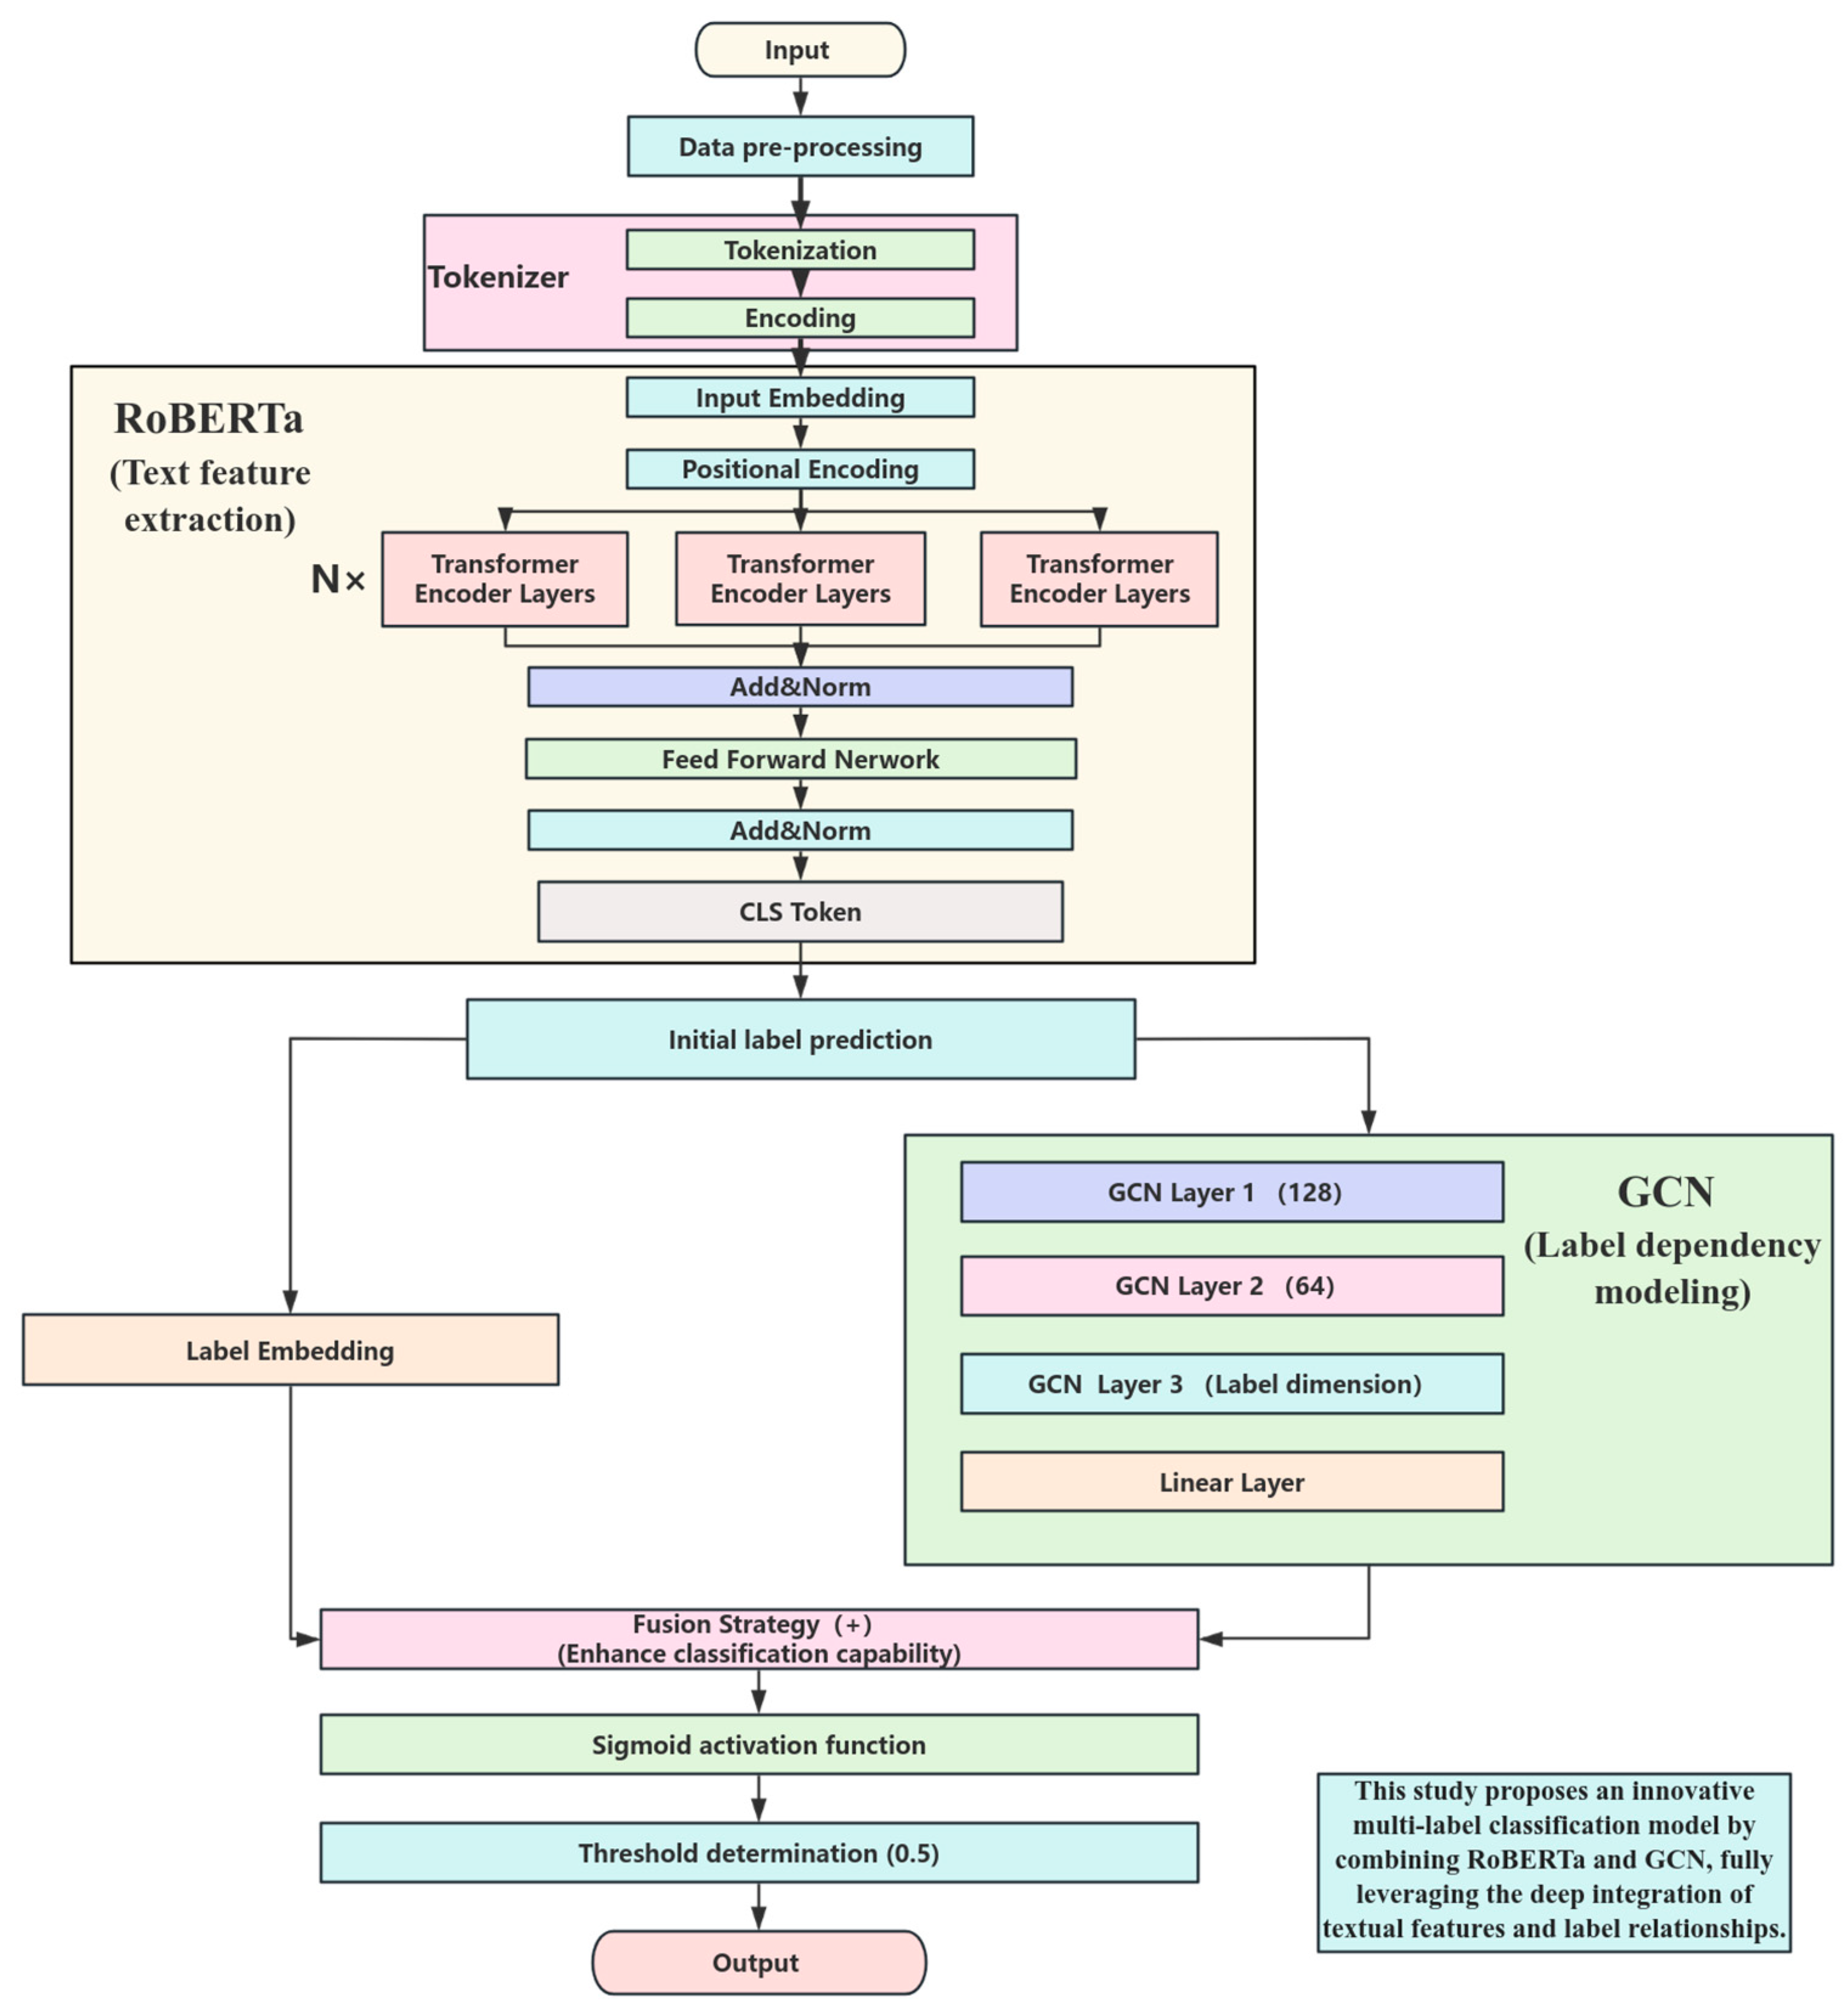
Table 7 shows that deep learning approaches based on pre-trained Transformer models (such as RoBERTa and BERT) have significant advantages in multi-label classification tasks. Specifically, when these models are combined with Graph Convolutional Networks to model the intricate relationships between labels, the model’s performance is further improved. In comparison, although traditional machine learning methods perform satisfactorily on certain metrics, their overall classification performance and generalization capabilities are inferior to those of deep learning methods. The RoBERTa + GCN model, by integrating text features with label relationships, fully capitalizes on the strengths of both, not only taking the lead in accuracy and F1 score but also excelling in handling multi-label dependencies. This attests to the effectiveness and practical value of the model in the automatic classification task of flight instructor comments.
In terms of selecting text processing models, the training times per epoch of RoBERTa and BERT were compared as a reference. The performance in training time between the two is similar (RoBERTa: 11.25 s, 11.09 s, 11.3 s, 11.25 s, and 11.31 s; BERT: 11.25 s, 11.32 s, 11.23 s, 11.28 s, and 11.32 s). The choice to choose RoBERTa over BERT is primarily based on the following reasons. From the experimental results, the RoBERTa model outperforms BERT across all evaluation metrics, particularly demonstrating higher performance in accuracy and F1 score. RoBERTa employs more optimized strategies and larger datasets during its pre-training process, which endows it with better generalization capabilities and robustness when handling natural language tasks. In automatically classifying flight instructor comments, this advantage translates into higher classification performance and more stable model behavior. Considering the comprehensive requirements for accuracy and efficiency in practical applications, selecting RoBERTa as the text processing model is a more suitable choice.
Based on the experimental results outlined above, the RoBERTa + GCN model exhibits superiority over all other baseline models across every evaluation metric. It particularly stands out in terms of average accuracy (0.8702), average precision (0.9854), average recall (0.9623), and average F1 score (0.9737). These findings highlight the model’s high effectiveness and robustness in handling the multi-label classification task of flight instructor comments.
Based on the comparative analysis of the experimental data, both the RoBERTa and RoBERTa + GCN models show substantial enhancements in performance, particularly in metrics such as accuracy, precision, recall, and F1 score.
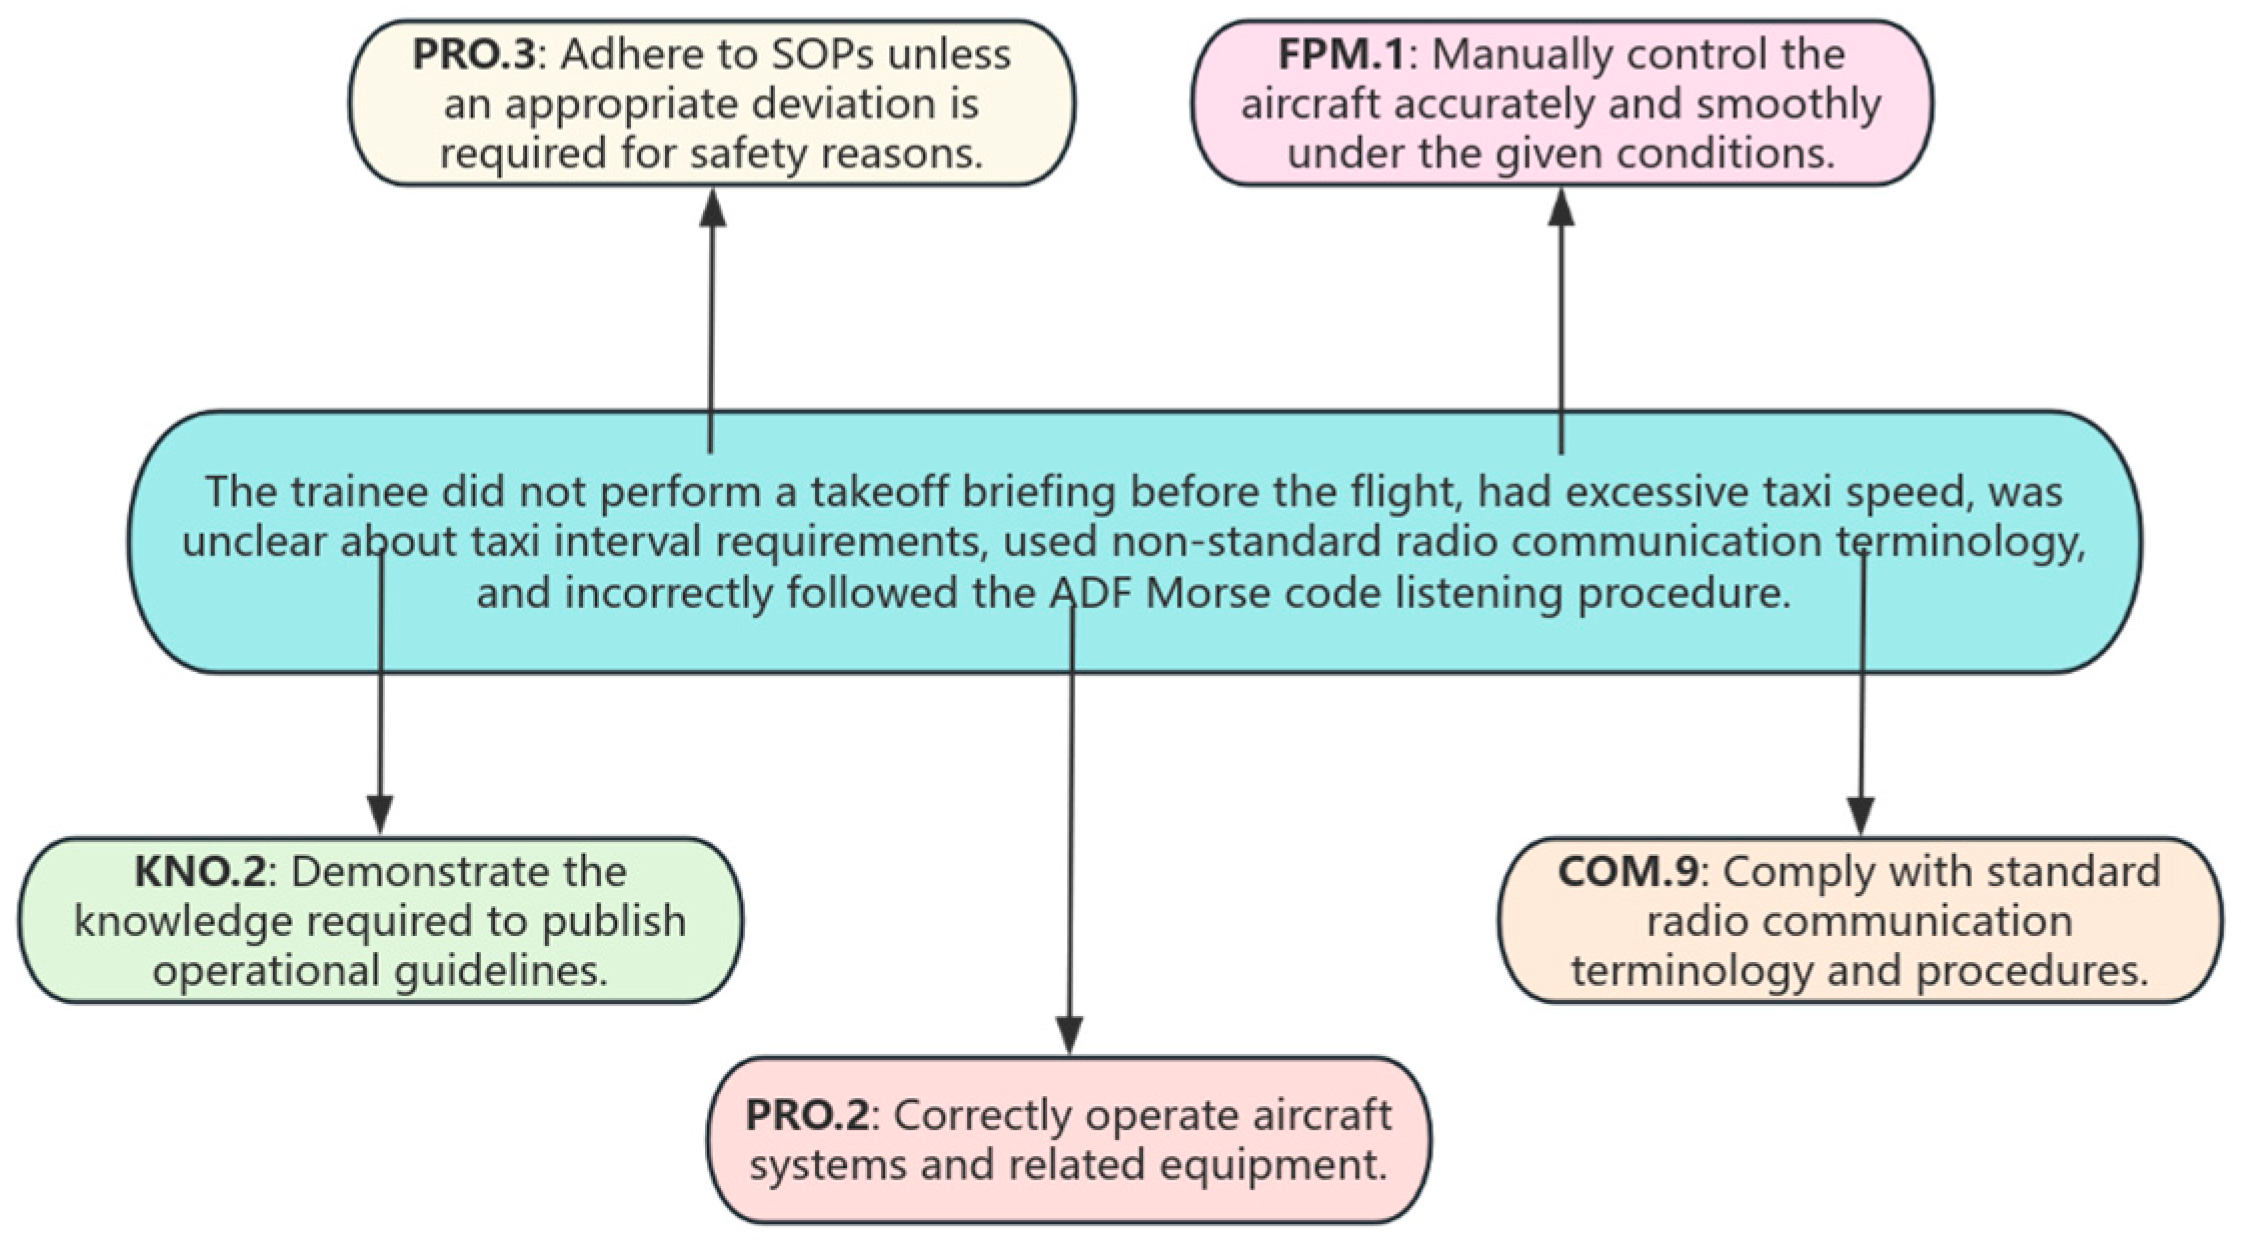
(1) Enhanced Text Feature Extraction Capability, RoBERTa, as a pre-trained Transformer model, boasts robust contextual understanding and semantic representation capabilities. During the experiments, RoBERTa attained an accuracy of 0.8108, a precision of 0.98, a recall of 0.9418, and an F1 score of 0.9605. In contrast, other models such as BERT (accuracy: 0.7931, precision: 0.9759, recall: 0.9397, F1 score: 0.9574) and LSTM (accuracy: 0.6782, precision: 0.9281, recall: 0.9038, F1 score: 0.9157) exhibited relatively weaker performance on these metrics. By undergoing pre-training on large-scale corpora, RoBERTa can generate high-quality text embeddings. These embeddings can capture subtle differences and complex semantics within the comments. For example, it can precisely understand the distinct dimensional behaviors expressed in comments like “high taxiing speed” versus “unclear taxiing interval requirements”, thus improving its performance in classification tasks.
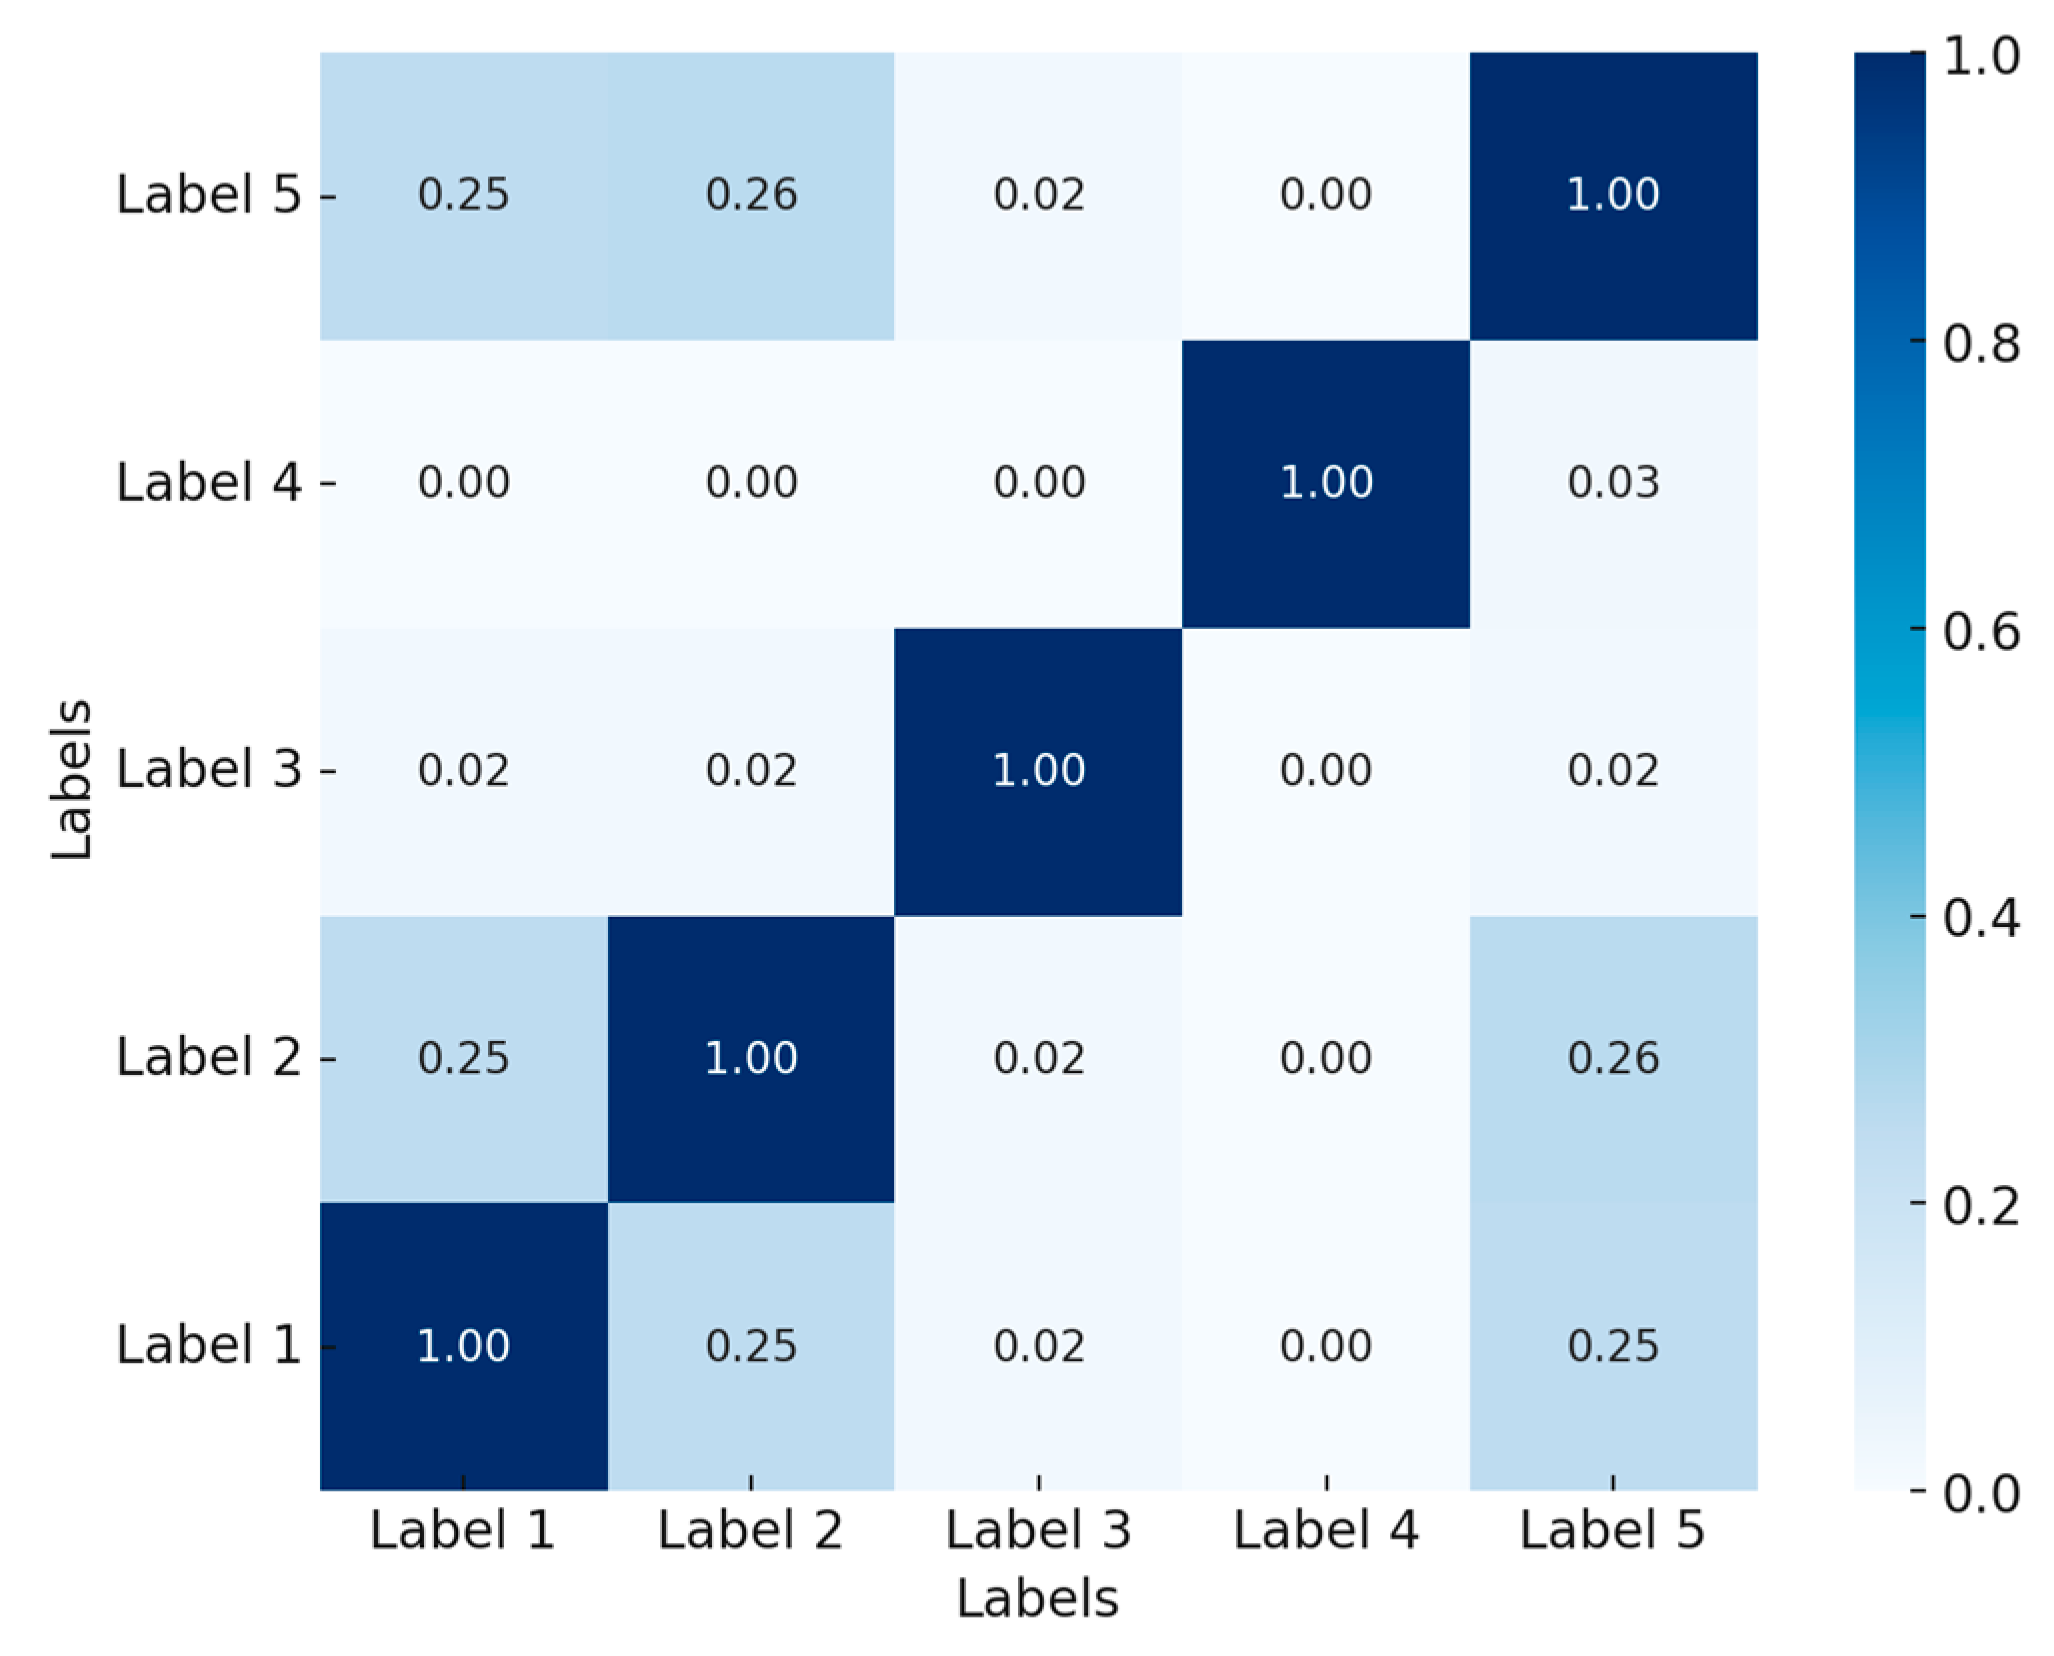
(2) Optimization of Label Relationship Modeling. After incorporating the GCN module, the RoBERTa + GCN model efficiently captures higher-order dependency information among labels by constructing an optimized label graph. The GCN module strengthens the model’s ability to model relationships between labels, which is evident in the performance metrics. The RoBERTa + GCN model achieved an accuracy of 0.8702, a precision of 0.9854, a recall of 0.9623, and an F1 score of 0.9737, all significantly higher than the performance of RoBERTa when used in isolation. Particularly in scenarios where there are co-occurrence and dependency relationships between labels (such as the association between operational capabilities and decision-making abilities in flight instructor comments), the GCN can effectively capture these hidden relationships. This, in turn, further enhances the classification accuracy and the overall performance of the model.
(3) Effectiveness of the Fusion Strategy. The fusion strategy put forward in this paper, which entails element-wise addition of the initial label logits produced by RoBERTa and the label logits generated by GCN, exhibits significant advantages in the RoBERTa + GCN model. This fusion strategy is succinct and efficient, not only elevating prediction accuracy but also enhancing the model’s stability and generalization capabilities. In the experiments, the RoBERTa + GCN model surpassed other models across all metrics. There were particularly notable enhancements in the F1 score (0.9737) and recall (0.9623). This suggests that by combining text feature extraction and label relationship modeling, the model can capitalize on the strengths of both, achieving a more comprehensive classification capability.

3.2. Analysis of Model Performance

To better demonstrate the specific performance of the model on each label, we calculated the precision, recall, F1 score, and support data for each label, and randomly selected 10 labels to present the results, as shown in Table 8.
Based on the experimental results, we analyzed the performance of the RoBERTa + GCN model across various label dimensions, particularly focusing on the impact of data volume on model performance. The data presented in the tables indicate that labels with larger data volumes (such as COM.1, COM.9, and FPM.2) generally exhibit better performance, whereas labels with smaller data volumes (such as FPM.1 and FPM.3) show a certain degree of performance degradation.
For labels with abundant data, the model can fully learn the features and patterns associated with those labels, resulting in outstanding performance. For instance, both COM.1 and COM.9 achieve perfect scores of 1.00 in precision, recall, and F1 score, demonstrating exceptional classification capabilities. Similarly, FPM.2 attains a precision of 0.99, a recall of 1.00, and an F1 score of 1.00, reflecting high accuracy and comprehensiveness.
However, labels with limited data suffer from performance deficiencies. For example, FPM.1 has a precision and recall of 0.75 each, with an F1 score of 0.75. Although the model can recognize this label, the small sample size prevents the model from fully learning the label’s characteristics during training, leading to inferior classification performance compared to labels with larger data volumes. FPM.3 achieves a precision of 1.00 but a recall of only 0.57, resulting in an F1 score of 0.73, which reveals the model’s inadequacy in handling this label.
In summary, the volume of data directly influences the model’s performance across different labels. A larger data volume improves classification precision and recall, particularly in helping the model effectively learn the complex relationships between labels. Conversely, labels with limited data result in poorer recognition performance, especially evident in the gaps in recall and F1 score.

3.3. Ablation Experiments

Through ablation experiments, specific model components can be selectively eliminated to assess the influence of these alterations on model performance, identifying which modules are crucial to overall effectiveness. This study carries out ablation experiments from three perspectives.
(1)
Transformer Baseline Model: Employing only a pre-trained Transformer encoder (RoBERTa) for multi-label classification, excluding the GCN module.
(2)
Transformer with Fusion Strategy: Adding a fully connected layer after the output of the Transformer encoder (RoBERTa) for label prediction, without integrating the GCN module.
(3)
Full Transformer + GCN Model: Integrating both the Transformer encoder (RoBERTa) and the GCN module for multi-label classification.
The experimental results are presented in Table 9.
Analyzing Table 9, it becomes apparent that as the model complexity increases, there is a general uptrend in performance metrics. Specifically, when employing only the Transformer encoder (RoBERTa) for classification, the F1 score is 0.8108. This indicates that the model’s performance is somewhat deficient when dealing with imbalanced labels or certain low-frequency labels. By introducing a straightforward fusion strategy on top of the Transformer encoder (RoBERTa), which further refines label prediction through an additional linear layer, the average accuracy improves to 0.8553, the average precision slightly increases to 0.9855, the average recall improves to 0.9556, and the average F1 score reaches 0.9703. This implies that the simple fusion strategy effectively enhances the model’s ability to capture relationships between labels to some extent. The Transformer + GCN model, building upon the previous model, further incorporates a Graph GCN module to model the complex relationships between labels. This enables further improvement in classification performance through information interaction between labels. The average accuracy further improves to 0.8702, the average precision remains at 0.9854, the average recall ascends to 0.9623, and the average F1 score reaches 0.9737.
The ablation experiment results clearly show that the gradual incorporation of model components (from RoBERTa to RoBERTa + FC, and then to RoBERTa + GCN) significantly boosts the model’s performance. This reveals the following key points:
(1)
The fusion strategy proves to be highly effective. By adding a simple fully connected layer (FC) on top of RoBERTa, it enhances the model’s performance. The average F1 value of RoBERTa + FC reaches 0.9703, representing a substantial improvement compared to the 0.9605 of RoBERTa alone. RoBERTa + FC achieves an average precision of 0.8553, an average recall of 0.9556, and an average precision of 0.9855. This shows that the simple fully connected layer (FC) efficiently combines the features extracted by the Transformer through linear transformation and addition operations, which enhances the model’s ability to understand and predict the relationship between labels. The proposed fusion strategy avoids the computational overhead caused by complex fusion while maintaining the performance improvement of the model. This undeniably verifies its effectiveness.
To further validate the fusion strategy, an Ablation Study was conducted to compare the performance of RoBERTa + FC and RoBERTa + GCN. The results show that while both strategies provide improvements over the baseline model, RoBERTa + GCN outperforms RoBERTa + FC, particularly in terms of capturing high-order label dependencies. This comparison emphasizes the advantages of incorporating the GCN module, further highlighting the effectiveness of the fusion strategy.
(2)
After introducing the GCN module, the average precision of the RoBERTa + GCN model is further improved to 0.8702, and the average recall rate is improved to 0.9623. Compared with RoBERTa and RoBERTa + FC, the GCN module exhibits distinct advantages in improving the model performance. Through the multi-layer graph convolution operation, GCN effectively captures the high-order dependencies among labels and enhances the classification ability of the model in comprehending the complex relationships in multi-label tasks. By modeling the complex relationships between labels, the GCN module improves the adaptability of the model to the diversity of label combinations. Consequently, this leads to an improvement in the classification performance.

4. Conclusions and Future Perspectives

4.1. Conclusions

This section summarizes the research presented in this paper and draws three main conclusions based on the experimental results and discussions.
(1) Construction of a More Precise Label Graph. By integrating label semantic information with co-occurrence relationships, we took into account both co-occurrence frequency and semantic similarity. Incorporating semantic embeddings enabled the label graph to assimilate the semantic information of the labels themselves, enhancing the richness and accuracy of label representations and aiding the GCN in comprehensively capturing the complex dependency relationships among labels.
(2) Effective Fusion Strategy. Our fusion strategy, which entails element-wise addition of the initial label logits produced by the Transformer and GCN, is concise and efficient. When compared with other complex fusion methods, it improves performance while maintaining computational efficiency. This makes it highly suitable for large-scale datasets and extremely versatile for various other multi-label classification tasks.
(3) Excellent Performance of the RoBERTa + GCN model. The RoBERTa + GCN model exhibited exceptional performance in the automatic classification task of flight instructor comments, achieving an average F1 score of 0.9737, significantly surpassing that of traditional methods and single models. This indicates that integrating the Transformer and GCN can effectively merge text features with label relationships, thereby substantially improving classification performance.

4.2. Limitations

This study also has certain limitations. Firstly, the dataset used contains only 1078 samples, which is relatively small, and this may affect the model’s performance on some minority labels, particularly those with lower recall and F1 scores. Secondly, the dataset originates from a single institution, which may introduce a certain degree of sample bias and limit the model’s generalizability. As the dataset continues to accumulate, especially with an increase in sample size and diversification of data, the training effectiveness of the model will be further improved, and its accuracy and generalization ability will be significantly enhanced. Therefore, future research can further improve the model’s performance across different domains and tasks by expanding the scale and diversity of the dataset.

4.3. Future Perspectives

To further enhance the performance and practicality of the model, future research can consider the following directions:
(1) Dynamic Label Graph Construction: Future research should focus on methods to automatically update and optimize the label graph in response to dynamic label set changes, improving the model’s adaptability and flexibility. This could involve dynamically adjusting label relationships based on context or real-time data. To evaluate the adaptability of the dynamic label graph, we propose the following metrics: Label Relationship Consistency Metric, which measures the similarity between the original and updated label relationship matrices, ensuring essential label connections are maintained; Model Performance Stability Metric, which tracks performance changes (e.g., accuracy or F1 score) before and after updates, indicating how well the model adapts; and Update Efficiency Metric, which measures the time taken to update the label graph in response to label set changes, with shorter times reflecting better adaptability.
(2) Model Compression and Acceleration: Utilize knowledge distillation techniques to transfer the knowledge of the complex RoBERTa + GCN model to a more lightweight student model, reducing the model’s computational overhead and improving inference efficiency. Furthermore, apply model pruning and quantization techniques to reduce the number of model parameters and computational complexity. As a result, the model becomes more adaptable for deployment in resource-constrained environments.
(3) Ethical Considerations: It is important to address potential ethical concerns related to the automated assessments performed by the model, particularly regarding biases that may arise. Future research should focus on identifying and mitigating any biases in the labeling process or model predictions, ensuring fairness and reducing the risk of perpetuating discriminatory patterns in the assessments.

Author Contributions

H.X. and Y.Z. jointly conceptualized the research methodology and drafted the initial manuscript. Z.L. and H.H. conducted critical validation of the experimental results. M.W. performed meticulous editing on the final version of the paper. All authors have read and agreed to the published version of the manuscript.

Funding

This research was funded by the Civil Aviation Flight Technology and Flight Safety Engineering Technology Research Center Project (FZ2022ZZ05, GY2024-52E, GY2024-60E), Sichuan Science and Technology Program (2023ZYD0010), the Fundamental Research Funds for the Central Universities (PHD2023-056), National Student Innovation and Entrepreneurship Training Program Funded Projects (S202410624270, S202410624239), and the National Natural Science Foundation of China General Project (12371301).

Data Availability Statement

The raw data supporting the conclusions of this article will be made available by the authors upon request.

Conflicts of Interest

The authors declare no conflicts of interest.

References

  1. Xu, H.; Kong, Y.; Huang, H.; Liang, A.; Zhao, Y. Research on Recommendation of Core Competencies and Behavioral Indicators of Pilots Based on Collaborative Filtering. Aerospace 2024, 12, 9. [Google Scholar] [CrossRef]
  2. Zhao, Y.; Liang, Z.; Huang, H.; Liang, A.; Xu, H. Study on the factors affecting flight training for trainee pilots. Adv. Aeronaut. Sci. Eng. China 2025, 16, 79–85. [Google Scholar]
  3. AC-121-FS-138 R1; Evidence-Based Training (EBT) Implementation Method. Civil Aviation Administration of China: Beijing, China, 2023.
  4. Doc-9995; Evidence-Based Training Manual. International Civil Aviation Organization: Montreal, QC, Canada, 2013.
  5. Wu, G.; Zheng, R.; Tian, Y.; Liu, D. Joint ranking SVM and binary relevance with robust low-rank learning for multi-label classification. Neural Netw. 2020, 122, 24–39. [Google Scholar] [CrossRef] [PubMed]
  6. Rastogi, R.; Mortaza, S. Multi-label classification with missing labels using label correlation and robust structural learning. Knowl.-Based Syst. 2021, 229, 107336. [Google Scholar] [CrossRef]
  7. Tarekegn, A.N.; Giacobini, M.; Michalak, K. A review of methods for imbalanced multi-label classification. Pattern Recogn. 2021, 118, 107965. [Google Scholar] [CrossRef]
  8. Zhou, H.; Wang, Y.; Zhang, D. Research Progress of Multi-Label Feature Selection. Comp. Eng. Appl. China 2022, 58, 52–67. [Google Scholar]
  9. Li, D.; Yang, Y.; Meng, X.; Zhang, X.; Song, C.; Zhao, Y. Review on Multi-lable Classification. J. Front. Comput. Sci. Technol. China 2023, 17, 2529–2542. [Google Scholar]
  10. Wu, Y.; Guo, G.; Gao, H. ELM: A novel ensemble learning method for multi-target regression and multi-label classification problems. Appl. Intell. 2024, 54, 7674–7695. [Google Scholar] [CrossRef]
  11. Wu, Z.; Wang, Y.; Yu, H. Hierarchical Multi-label Text Classification Method Based on Multi-scale Feature Extraction. J. Zhengzhou Univ. (Nat. Sci. Ed.) China 2025, 57, 24–30. [Google Scholar]
  12. Bogatinovski, J.; Todorovski, L.; Džeroski, S.; Kocev, D. Comprehensive comparative study of multi-label classification methods. Expert Sys. Appl. 2022, 203, 117215. [Google Scholar] [CrossRef]
  13. Zaki, F.; Afifi, F.; Abd Razak, S.; Gani, A.; Anuar, N.B. GRAIN: Granular multi-label encrypted traffic classification using classifier chain. Comput. Netw. 2022, 213, 109084. [Google Scholar] [CrossRef]
  14. Loza Mencía, E.; Kulessa, M.; Bohlender, S.; Fürnkranz, J. Tree-based dynamic classifier chains. Mach. Learn. 2023, 112, 4129–4165. [Google Scholar] [CrossRef]
  15. Arslan, M.; Cruz, C. Business text classification with imbalanced data and moderately large label spaces for digital transformation. Appl. Netw. Sci. 2024, 9, 11. [Google Scholar] [CrossRef]
  16. Zhang, X.; Liu, Y.; Luo, B.; Pan, L. Computational power of tissue P systems for generating control languages. Inform. Sci. 2014, 278, 285–297. [Google Scholar] [CrossRef]
  17. Wang, C.; Dong, Q.; Sui, Z.; Zhan, W.; Chang, B.; Wang, H. Quality evaluation of public NLP dataset. J. Chin. Inf. Process. China 2023, 37, 26–40. [Google Scholar]
  18. He, X.; Zhou, J.; Chen, D. Overview of deep learning models in natural language processing. Comp. Appl. Softw. China 2025, 42, 1–19. [Google Scholar]
  19. Tan, K.L.; Lee, C.P.; Anbananthen, K.S.M.; Lim, K.M. RoBERTa-LSTM: A hybrid model for sentiment analysis with transformer and recurrent neural network. IEEE Access 2022, 10, 21517–21525. [Google Scholar] [CrossRef]
  20. Talaat, A.S. Sentiment analysis classification system using hybrid BERT models. J. Big Data 2023, 10, 110. [Google Scholar] [CrossRef]
  21. Kula, S.; Kozik, R.; Choraś, M. Implementation of the BERT-derived architectures to tackle disinformation challenges. Neural Comput. Appl. 2022, 34, 20449–20461. [Google Scholar] [CrossRef]
  22. Tsani, E.F.; Suhartono, D. Personality identification from social media using ensemble BERT and RoBERTa. Informatica 2023, 47, 537–544. [Google Scholar] [CrossRef]
  23. Semary, N.A.; Ahmed, W.; Amin, K.; Pławiak, P.; Hammad, M. Improving sentiment classification using a RoBERTa-based hybrid model. Front. Hum. Neurosci. 2023, 17, 1292010. [Google Scholar] [CrossRef] [PubMed]
  24. Jamjoom, A.A.; Karamti, H.; Umer, M.; Alsubai, S.; Kim, T.H.; Ashraf, I. Robertanet: Enhanced roberta transformer based model for cyberbullying detection with glove features. IEEE Access 2024, 12, 58950–58959. [Google Scholar] [CrossRef]
  25. Wu, S.; Sun, F.; Zhang, W.; Xie, X.; Cui, B. Graph neural networks in recommender systems: A survey. ACM Comput. Surv. 2022, 55, 1–37. [Google Scholar] [CrossRef]
  26. Wu, B.; Liang, X.; Zhang, S.; Xu, R. Advances and Applicationsin Graph Neural Network. Chinese J. Comput. China 2022, 45, 35–68. [Google Scholar]
  27. Kosasih, E.E.; Brintrup, A. A machine learning approach for predicting hidden links in supply chain with graph neural networks. Int. J. Prod. Res. 2022, 60, 5380–5393. [Google Scholar] [CrossRef]
  28. Zhang, L.; Yang, H.; Wu, X. Air Traffic Complexity Evaluation with Hierarchical Graph Representation Learning. Aerospace 2023, 10, 352. [Google Scholar] [CrossRef]
  29. Chen, J.; Wang, Y.; Zeng, M.; Xiang, Z.; Hou, B.; Tong, Y.; Mengshoel, O.; Ren, Y. Customizing graph neural networks using path reweighting. Inform. Sci. 2024, 674, 120681. [Google Scholar] [CrossRef]
  30. Ji, S.; Wei, Y.; Dai, Q.; Gao, Y. Efficient hypergraph neural network on million-level data. Sci. Sin. Inform. China 2024, 54, 853–871. [Google Scholar]
  31. Wang, H.; Leskovec, J. Combining graph convolutional neural networks and label propagation. ACM Trans. Inform. Syst. 2021, 40, 73. [Google Scholar] [CrossRef]
  32. Vu, H.T.; Nguyen, M.T.; Nguyen, V.C.; Pham, M.H.; Nguyen, V.Q.; Nguyen, V.H. Label-representative graph convolutional network for multi-label text classification. Appl. Intell. 2023, 53, 14759–14774. [Google Scholar] [CrossRef]
  33. Yu, B.; Xie, H.; Cai, M.; Ding, W. MG-GCN: Multi-granularity graph convolutional neural network for multi-label classification in multi-label information system. IEEE Trans. Emerg. Top. Comput. Intell. 2023, 8, 288–299. [Google Scholar] [CrossRef]
  34. Khemani, B.; Patil, S.; Kotecha, K.; Tanwar, S. A review of graph neural networks: Concepts, architectures, techniques, challenges, datasets, applications, and future directions. J. Big Data 2024, 11, 18. [Google Scholar] [CrossRef]
Figure 1. Schematic diagram of comment tags.
Aerospace 12 00407 g001
Figure 2. Multi-label classification model based on RoBERTa and GCNs.
Aerospace 12 00407 g002
Figure 3. Label co-occurrence matrix (top 5 labels).
Aerospace 12 00407 g003
Figure 4. Model Training Flowchart.
Aerospace 12 00407 g004
Figure 5. The change curve of the loss function and F1 score during the training process.
Aerospace 12 00407 g005
Table 1. Dimension details.
Dimension NameDescriptionLabel PointsLabels
FPMFlight Path Management—Manual Flight547
COMCommunication1610
PROExecution of Procedures and Compliance with Regulations317
PSDProblem Solving and Decision Making159
SAWSituational Awareness and Information Management327
KNOApplication of Knowledge107
Table 2. FPM details.
LabelDescription
FPM.1Accurate and gentle manual control of the aircraft as appropriate to the prevailing conditions
FPM.2Monitor and detect deviations from the desired aircraft trajectory and take appropriate action
FPM.3The relationship between the attitude, speed, and thrust of the aircraft is used to manually control the aircraft by navigation signals or visual information
FPM.4Ability to safely manage flight trajectories for optimal operational performance
FPM.5Manually maintaining the desired trajectory while managing other tasks and disturbances
FPM.6Ability to properly use the fly-tube and guidance system
FPM.7Effectively monitor the flight guidance system, including switching on and automatic mode transitions
Table 3. Stage details.
Stage NumberDescription
1Execute engine start
2Perform taxiing
3Perform takeoff and climb
4Perform visual arrival and departure
5Perform a large slope hover
6Perform low-speed flight
7Perform power-free stall
8Perform emergency approach and landing (simulation)
9Execute takeoff and landing routes
10Perform a go-around
Table 4. Execute engine start details.
Label PointsKey PointsDimensionDescription
1Request, receive, and confirm regulatory clearancePRO.2Timely application of relevant operational guidelines, procedures, and techniques
2Request, receive, and confirm regulatory clearanceCOM.9Use and comprehend non-verbal communication in a manner consistent with organizational and social culture
3Request, receive, and confirm regulatory clearanceKNO.3Demonstrate knowledge of the natural environment, air traffic environment, including air routes, weather, airports, and operational infrastructure
4Execute the engine start procedureSAW.2Monitor and evaluate the energy status of the aircraft as well as the desired flight trajectory
5Execute the engine start procedureKNO.1Demonstrate a working knowledge of constraints and systems and their interactions
6Execute the engine start procedureCOM.7Use progressive communication to resolve obvious disagreements
7Execute the engine start procedurePSD.3Identify and verify what went wrong and why
8Execute the engine start procedurePRO.4Correct operation of aircraft systems and related equipment
9Complete the corresponding checklist.PRO.3Follow SOP unless appropriate deviation is required for safety reasons
Table 5. Key hyperparameter settings.
HyperparameterValue
Batch Size16
Learning Rate2.00 × 10−5
Weight Decay0.01
Number of Epochs5
Gradient Clipping Norm1
Prediction Threshold0.5
GCN Hidden Dimensions128, 64, 32
Table 6. Table of hyperparameter configuration.
ModelCore PrincipleHyperparameter ConfigurationTraining Process Description
BRTreats multi-label as multiple binary classification tasksClassifier: Logistic Regression, Learning Rate: 0.01, Batch Size: 32, Loss Function: Cross-EntropyEach label is trained independently without label dependencies.
CCLabel prediction depends on previous labels’ predictionsClassifier: SVM (Linear Kernel), Learning Rate: 0.01, Batch Size: 32Labels are trained sequentially, with each classifier depending on the previous one’s output.
LPTreats label combinations as multi-class categoriesClassifier: Random Forest, Number of Trees: 100, Max Tree Depth: 10, Loss Function: Cross-EntropyConverts a multi-label problem to a multi-class for training.
RFEnsemble method with decision treesNumber of Trees: 100, Max Tree Depth: 10, Split Criterion: Gini IndexUses TF-IDF to convert text to numerical features, trained with OneVsRestClassifier.
LSTMRNN for capturing long-term dependenciesHidden Units: 128, Learning Rate: 0.001, Batch Size: 64, Dropout: 0.5Trained using Adam optimizer and cross-entropy loss.
BERTPre-trained transformer for context-aware understanding of textLearning Rate: 2 × 10⁻⁵, Batch Size: 16, Max Sequence Length: 512Fine-tuned for multi-label classification with binary cross-entropy loss.
Table 7. Table of average evaluation indicators for each model.
ModelAverage AccuracyAverage PrecisionAverage RecallAverage F1
BR0.76070.98350.90110.9405
CC0.65740.9170.88760.902
LP0.6620.92490.89020.9072
RF0.65280.91570.88760.9014
RoBERTa0.81080.980.94180.9605
LSTM0.67820.92810.90380.9157
BERT0.79310.97590.93970.9574
RoBERTa + GCN0.87020.98540.96230.9737
Table 8. Classification performance table for each label.
LabelPrecisionRecallF1 ScoreSupport
COM.11.001.001.0037
COM.20.990.970.98134
COM.91.001.001.0037
FPM.10.750.750.754
FPM.20.991.001.00100
FPM.31.000.570.737
PRO.20.971.000.9886
PRO.31.000.950.9796
SAW.10.941.000.9777
SAW.30.951.000.9737
Table 9. Results of the ablation experiment table.
ModelAverage AccuracyAverage PrecisionAverage RecallAverage F1
RoBERTa0.81080.980.94180.9605
RoBERTa + FC0.85530.98550.95560.9703
RoBERTa + GCN0.87020.98540.96230.9737
Disclaimer/Publisher’s Note: The statements, opinions and data contained in all publications are solely those of the individual author(s) and contributor(s) and not of MDPI and/or the editor(s). MDPI and/or the editor(s) disclaim responsibility for any injury to people or property resulting from any ideas, methods, instructions or products referred to in the content.

