Abstract
Departure punctuality (KPI01) and ATFM slot adherence (KPI03) have been emphasized by the International Civil Aviation Organization as key performance indicators (KPIs) in the Global Air Navigation Plan. To address the inherent conflict between these two objectives in departure scheduling, a multi-objective optimization model is proposed that aims to simultaneously enhance departure punctuality, ATFM slot adherence, and taxiing efficiency. A simulated annealing algorithm based on a resource transmission mechanism was developed to solve the model effectively. Based on full-scale operational data from Nanjing Lukou International Airport in June 2023, the empirical results confirm the model’s effectiveness in two primary dimensions: (1) Significant improvement in taxiing efficiency: The average unimpeded taxi-out time was reduced by 6.4% (from 17.2 to 16.1 min). The number of flights with taxi-out times exceeding 30 min decreased by 58%. For representative taxi routes (e.g., stand 118 to runway 6), the excess taxi-out time was reduced by 82.3% (from 5.61 to 1.10 min). (2) Enhanced operational punctuality: Departure punctuality improved by 10.7% (from 67.9% to 78.7%), while ATFM slot adherence increased by 31.2% (from 64.6% to 95.8%). This study presents an innovative departure scheduling approach and offers a practical framework for improving collaborative operational efficiency among airports, air traffic management units, and airlines.
1. Introduction
Airports, as critical nodes within the air transportation network, play a pivotal role in shaping both flight punctuality and airspace utilization efficiency. In the Global Air Navigation Plan (GANP) [1], a series of key performance indicators (KPIs) have been defined by the International Civil Aviation Organization (ICAO) to evaluate airport operational performance. Among these, departure punctuality (KPI 01), additional taxi-out time (KPI 02), and ATFM (air traffic flow management) slot adherence (KPI 03) are recognized as essential metrics for assessing surface efficiency and congestion. These indicators evaluate airport ground operation orderliness, surface performance, and airspace coordination from multiple perspectives, serving as critical benchmarks for measuring the degree of operational collaboration among stakeholders. In this study, these three KPIs are treated as core optimization objectives to formulate a departure scheduling model aligned with global performance frameworks.
Within airport operations, departure punctuality indicates whether a flight pushes back on time relative to its scheduled off-block time (SOBT) and serves as a primary metric for ground scheduling efficiency. In contrast, ATFM slot adherence measures whether a flight takes off within its controlled time window, functioning as a key indicator of air traffic flow management performance. These two KPIs, respectively, reflect the performance of ground-side and airspace-side operations and are inherently interdependent.
In practice, operational conflicts often arise between these objectives. Prioritizing departure punctuality requires pushback to occur as close to the SOBT as possible, which may result in taxiway congestion and increased surface conflicts, ultimately diminishing ATFM slot adherence. Conversely, ensuring ATFM slot compliance necessitates pushback closer to the calculated off-block time (COBT), potentially causing longer ground holding times and underutilization of stand resources. Excessive taxi-out times and queuing further intensify scheduling uncertainty, creating a vicious cycle of inefficiency. This dilemma stems fundamentally from the absence of systematic optimization mechanisms capable of balancing airspace flow constraints with surface scheduling needs. As Space–Air–Ground Integrated Networks (SAGINs) evolve, collaborative surface–airspace scheduling has become a cornerstone of next-generation air traffic operations [2]. The joint optimization of departure punctuality and ATFM slot adherence represents a practical realization of this paradigm at the airport management level.
Traditional pushback scheduling approaches are typically based on static rules or fixed timetables and often fail to account for inter-flight taxiing interference, dynamic surface routing, or real-time variations in flow management strategies. Consequently, they lack the ability to coordinate departure punctuality, ATFM slot adherence, and taxi-out time effectively. To address these limitations, this study is centered on three key research objectives:
- To formulate a multi-objective pushback scheduling optimization model that simultaneously enhances departure punctuality, ATFM slot adherence, and taxiing efficiency;
- To design a robust and practical scheduling algorithm that ensures feasibility, stability, and convergence under realistic operational constraints;
- To conduct empirical validation using full-scale operational data to assess the model’s effectiveness in complex surface environments and its ability to coordinate surface and airspace operations.
This research seeks to bridge the current gap between surface and airspace scheduling, aiming to enhance airport operational efficiency and improve flow management coordination. The remainder of this paper is structured as follows: Section 2 reviews the relevant literature; Section 3 introduces the model formulation and solution methodology; Section 4 presents experimental results and comparative analysis; and Section 5 summarizes key findings, discusses limitations, and suggests future research directions.
Additionally, several critical time points are involved in the departure process, including SOBT, TOBT, COBT, CTOT, and AOBT. For clarity, Table 1 defines these terms, and Figure 1 provides a schematic of their temporal relationships.

Table 1.
Definitions and characteristics of key departure time points.
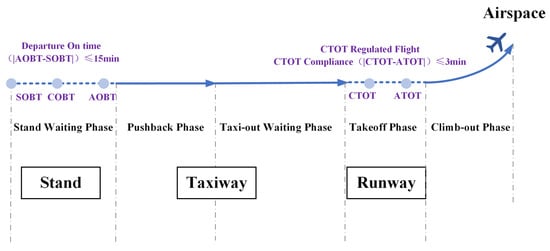
Figure 1.
Schematic of key departure time points.
2. Literature Review
This section provides a review of research progress related to departure punctuality and pushback control. The existing literature primarily focuses on optimizing departure punctuality through surface resource allocation and procedural management, while studies on ATFM slot adherence tend to emphasize en-route air traffic flow management, such as congestion prediction and takeoff slot allocation. However, surface pushback control, which serves as a critical link between ground operations and airspace flow, remains underexplored in the context of integrated optimization with ATFM constraints.
2.1. Research on Improving Departure Punctuality
The variability in departure punctuality arises from the dynamic coupling of multiple factors. Early studies focus on analyzing individual factors. Wu et al. develop a stochastic model to examine aircraft turnaround and departure punctuality, identifying turnaround time, arrival punctuality, and ground service efficiency as key determinants [4]. Röhner and Peer constructed a statistical model at Frankfurt Airport to diagnose and predict departure punctuality, using multivariate linear regression with autoregressive terms and regression tree corrections [5]. Liu et al. investigated the effect of significant weather events on flight punctuality. They proposed targeted strategies based on statistical patterns of disruptive weather [6]. Jiang et al. applied data mining techniques across regional airports, concluding that weather, airline scheduling, and policy enforcement play dominant roles in shaping departure punctuality [7].
Optimization approaches for improving departure punctuality generally fall into two categories: single-objective static models and multi-objective dynamic frameworks. Zhao et al. proposed a nonlinear programming model that adjusts pushback timing to maximize punctuality [8], while Wang introduced refined control strategies for Shenzhen Airport (one of China’s top five airports by annual passenger throughput, a major hub with over 900 daily movements) to achieve similar objectives [9]. Other researchers apply management theories such as Total Quality Management (TQM) and process control to analyze airport operations and recommend surface management improvements. For instance, Wang Bo advocated same-direction parking to reduce taxi time [10], and Wang Rongbi suggested process reengineering and alert-based coordination platforms at Haikou Meilan Airport (a major gateway in Hainan Province, China, with 400–500 daily flight operations) [11].
More recent studies emphasize collaborative decision making (CDM) and integrated planning tools. De Jonge et al. introduced the Outbound Punctuality Sequencer, which aligns the preferences of airlines, ATC, and airport authorities for proactive scheduling [12]. Loth et al. proposed a Performance-Based Airport Management (PBAM) framework that treats departure punctuality as a core metric to coordinate efficiency and resource utilization [13].
2.2. Research on Pushback Time Optimization
The optimization of aircraft pushback time plays a crucial role in improving airport surface operational efficiency. Existing research primarily focuses on two dimensions: pushback rate control and pushback time scheduling.
2.2.1. Pushback Rate Control
In addition, pushback rate control has emerged as a key lever for managing surface congestion. Initial efforts rely on empirical adjustments based on surveillance data. For instance, Burgain et al. demonstrated an 18% reduction in taxi-related emissions through pushback control under moderate runway utilization [14]. At Boston Logan Airport (a major airport in the Northeastern United States, averaging 1200 daily movements), predictive strategies using 15 min throughput forecasts have been shown to improve both efficiency and controller acceptance [15,16,17]. However, most of these strategies neglect ATFM slot adherence, potentially leading to misalignment between scheduled and actual takeoff times.
To address operational uncertainty, McFarlane and Balakrishnan developed a stochastic dynamic programming model at LaGuardia Airport (a key civil aviation hub in the New York metropolitan area, with around 1000 daily flights) that minimizes taxi delays under randomness [18]. Zhu et al. further incorporated carbon efficiency objectives and established a multivariate regression-driven pushback rate control framework at Shanghai Hongqiao Airport, achieving simultaneous optimization of taxi time and carbon emissions [19].
2.2.2. Pushback Time Scheduling
Accurate scheduling of pushback times is essential for minimizing fuel burn and mitigating delay propagation. Most models in this domain adopt stochastic or optimization-based approaches. Mori pioneered the application of Monte Carlo reinforcement learning and tabu search to allocate Target Start Approval Times (TSATs), demonstrating significant fuel and delay savings [20,21,22,23]. Coupe et al. introduced a MILP model to ensure conflict-free taxiing [24], while Kwasiborska focused on optimizing pushback sequences to reduce taxiway queuing [25]. More recently, Desai et al. proposed a penalty-based pushback control strategy at Beijing Capital International Airport (one of the busiest airports in China, with daily movements exceeding 1700), dynamically adjusting pushback times in response to congestion levels. While the model reduces total operational costs by 22%, it does not consider real-time coordination with ATFM slot constraints, limiting its applicability in controlled airspace environments [26].
In recent years, numerous studies have sought to integrate multiple optimization techniques into hybrid intelligent frameworks to enhance both the efficiency and diversity of airport scheduling solutions. However, such hybrid models continue to encounter several limitations. On one hand, they tend to heavily depend on domain-specific knowledge and problem-oriented structures, thereby restricting their scalability and generalizability across different airport environments and operational contexts [27]. On the other hand, the collaborative mechanisms and convergence stability of these algorithm combinations remain underexplored, both in terms of theoretical analysis and empirical validation [28]. While some studies have adopted hybrid strategies—such as combining Non-dominated Sorting Genetic Algorithm II (NSGA-II), which uses fast non-dominated sorting and crowding distance to maintain solution diversity, with simulated annealing for multi-objective or local search tasks—their performance remains insufficient under complex airport-specific constraints, including pushback separation, ATFM slot coordination, and resource conflicts [29]. Therefore, the development of hybrid optimization approaches that are structurally generalizable, operationally interpretable, and capable of delivering reliable performance in multi-objective, constraint-intensive environments remains an urgent research priority.
In addition, several critical challenges persist within the existing body of research:
- Limited model adaptability: Most existing models have been developed using static constraints or historical rules, which renders them less effective in accommodating real-time disruptions such as dynamic CTOT changes or adverse weather conditions.
- Lack of multi-objective coordination mechanisms: Many algorithms are designed to optimize a single performance metric (e.g., taxi-out time or departure punctuality), while neglecting inherent trade-offs among punctuality, ATFM slot adherence, and resource utilization efficiency.
- Scalability constraints of algorithms: Traditional heuristic methods (e.g., tabu search, hill climbing) often encounter computational bottlenecks in large-scale flight scheduling scenarios, whereas emerging machine learning-based methods (e.g., reinforcement learning) remain limited in terms of interpretability and practical applicability within operational airport environments.
As a result, designing optimization strategies that exhibit robust performance, structural universality, and transparent decision logic under multi-objective, high-constraint scenarios continues to be a central research direction in airport departure scheduling.
3. Methodology
3.1. Problem Description
The problem of pushback scheduling optimization in airport surface operations is addressed in this study, with the aim of reconciling the trade-off between departure punctuality and taxi-out efficiency. A multi-objective optimization approach is adopted to enhance the airport’s overall operational performance. Several key conflicts are encountered in current pushback scheduling operations:
- Schedule deviation conflict: The deviation between the AOBT and the SOBT, expressed as |AOBT − SOBT|, has a negative impact on departure punctuality. Excessive deviations not only affect the punctuality of the current flight but also disrupt the sequencing of subsequent flights, thereby exacerbating surface resource congestion.
- Takeoff control conflict: A mismatch between the ATOT and the CTOT, represented as |ATOT − CTOT|, results in decreased ATFM slot adherence. Arriving too early or too late at the runway entry point may disrupt air traffic flow management, causing disorder in subsequent departure sequences and reducing overall operational efficiency.
- Taxiing efficiency conflict: Intensified competition for stand and runway resources leads to increased taxiway conflicts, significantly extending additional taxi-out time. The coordination of multiple resources, including stands, taxiways, and runways, is required in surface operations. Under high-traffic conditions, mismatches between stand release timing and runway availability may result in taxi route conflicts, forcing aircraft to detour or wait, thus increasing additional taxi-out time.
3.2. Model Architecture
3.2.1. Variable Definitions
The notation used in this study is listed in Table 2.
Table 2.
Variables and their definitions.
3.2.2. Objective Functions
- Maximizing Departure Punctuality
Departure punctuality refers to the percentage of on-time departing flights among all departures at the airport. A flight is considered on time if the absolute deviation between its AOBT and SOBT is within a permissible threshold, typically 15 min (|AOBT − SOBT| ≤ 15 min).
Thus, the departure punctuality objective is defined as follows:
represents the pushback time (AOBT) of aircraft . denotes the scheduled off-block time (SOBT) for aircraft at stand .
- 2.
- Maximizing ATFM Slot Adherence
Since not all departing flights are assigned a CTOT, an indicator variable is introduced to identify flights subject to CTOT constraints:
ATFM slot adherence refers to the extent to which an aircraft’s ATOT complies with its assigned CTOT, specifically whether the departure occurs within the designated tolerance window. According to the Operational Rules for air traffic flow management in Civil Aviation of China issued by the Civil Aviation Administration of China (CAAC) in November 2020, CTOT tolerance levels are classified into two categories. Type I tolerance applies to capacity-based flow control measures and permits a deviation of –5 to +10 min. Type II tolerance applies to spacing-based control measures and defines a tighter window of –3 to +3 min [3]. As this study focuses on fine-grained pushback scheduling in high-density operational scenarios, the coordination of inter-flight separation is of heightened operational significance. Therefore, Type II tolerance is adopted to evaluate ATFM slot adherence, offering a more stringent and accurate reflection of the model’s effectiveness in balancing traffic demand.
Thus, the maximizing ATFM Slot Adherence is defined as:
is the actual takeoff time (ATOT) of aircraft on runway , is the corresponding calculated takeoff time (CTOT).
- 3.
- Minimizing Taxi Time
In this study, taxi-out time is defined as the interval between an aircraft’s ATOT and its pushback time. As the scheduling model employs unimpeded taxi-out time—excluding runway queues and delay factors—the goal of minimizing taxi-out time effectively corresponds to minimizing extra taxi-out time, namely reducing conflicts and delays under ideal taxiing conditions.
A multi-objective weighted method is used to construct the optimization objective function, jointly accounting for departure punctuality, ATFM slot adherence, and taxi-out efficiency. As the three performance metrics differ in scale and unit, taxi-out time is normalized to avoid dimensional bias. The normalization is defined as:
The term denotes the total taxi-out time across all flights. The values = 80,000 s and = 10,000 s are set as the estimated upper and lower bounds of the total taxi-out time based on historical data, corresponding to conditions of severe surface congestion and unimpeded operations, respectively.
This normalization does not alter the direction or validity of the optimization process, serving purely for objective scaling purposes.
The Entropy Weight Method is applied to determine the relative importance of each objective function. This method assigns weights based on the degree of variability in each objective, thereby reducing subjectivity in the optimization process. Detailed formulations and procedures are provided in Appendix A. The computed weights are as follows: = 0.31, = 0.44, = 0.25.
3.2.3. Constraints
- Estimation of Unimpeded Taxi-Out Time
To ensure that the model inputs for taxi-out time are both realistic and operationally meaningful, unimpeded taxi-out time is used to exclude the influence of surface congestion and highlight the intrinsic impact of resource allocation on taxiing efficiency.
The estimation follows the standard method proposed by the Performance Review Unit (PRU) of EUROCONTROL [30], which identifies representative low taxi-out durations from historical flight data to reflect the pure traversal time of a taxi route. The calculation procedure is as follows (Figure 2):

Figure 2.
Algorithm workflow for estimating unimpeded taxi-out time.
- Data Cleaning
Flights involving de-icing procedures and helicopters are excluded. Then, after computing actual taxi-out times, records with taxi-out durations less than 0 or greater than 2 h are removed to ensure data reliability. The dataset used is described in detail in Section 4.1.
- Clustering by Stand–Runway Combination
Flights are grouped based on their stand and assigned runway. Each stand–runway pair is assumed to follow a similar taxi route and, thus, share comparable unimpeded taxi times. For each airport, flights are categorized by identical combinations.
- Calculation of Unimpeded Taxi-Out Time
For each stand–runway pair, the 10th percentile of actual taxi-out times is computed to represent the unimpeded taxi-out time. This low percentile effectively filters out delays caused by peak-hour congestion. To ensure the robustness of the estimation, any group with fewer than 10 total flights, or fewer than 10 flights below the 10th percentile, is excluded from the final estimation.
- 2.
- Stand Conflict Constraint
To prevent pushback conflicts at adjacent stands, a stand-level separation constraint is incorporated: for any pair of conflicting flights, their actual off-block times must be separated by a minimum time interval:
denotes the minimum allowable interval defined in accordance with airport operational regulations.
- 3.
- Runway Release Interval Constraint
To ensure proper separation during runway entry, both the route-based separation and the wake turbulence category-based separation are enforced. The runway entry time of aircraft and its corresponding release separation are defined accordingly.
Runway Entry Time Constraint:
The aircraft entry runway moment is defined as follows:
The runway entry time depends on the aircraft’s arrival time at the runway , the previous aircraft’s runway entry time , runway occupancy time , and separation requirement . If the runway is free or the arriving aircraft reaches the runway after the required separation has passed, then ; otherwise, aircraft i must wait, and the runway entry time becomes .
The release separation time is determined by the maximum of route-based and type-based separation requirements:
- Route-based separation is imposed when flights share the same Standard Instrument Departure (SID) or fall within designated directional categories, as outlined in the parameter settings.
- Type-based separation is applied between sequential flights based on their aircraft-type combinations. The specific separation times follow the tower’s operational guidelines and will be detailed later in Section 4.
- 4.
- CTOT Time Window Constraint
ATFM slot adherence is maintained by ensuring that the actual takeoff time , calculated as the sum of the runway entry time and the runway occupancy time , falls within the allowed CTOT window:
The occupancy time is defined as the time during which an aircraft exclusively occupies the runway—from crossing the stop bar at the runway holding point to the moment the main landing gear lifts off. Influencing factors include aircraft type, weather conditions, surface state, payload, and pilot behavior. To balance model simplicity with operational realism, occupancy time is categorized by aircraft type, using airport-standard classification rules (Section 4).
In summary, the proposed multi-objective optimization model determines the departure sequence based on aircraft pushback timing. The objective is to simultaneously minimize taxi-out time and departure delay, subject to key constraints, including stand conflict avoidance (Equation (7)), runway release separation (Equations (8) and (10)), arrival time at runway holding point (Equation (8)), and CTOT time window adherence (Equation (11)). Together, these constraints define the feasible solution space for the departure scheduling problem.
3.3. Algorithm Design and Solution Approach
Figure 3 illustrates the overall departure scheduling optimization process based on the resource transmission mechanism. The process begins with the input of the original flight schedule, followed by feasible time window generation and preliminary conflict detection. Subsequently, a feasible initial solution is constructed by incorporating taxi route constraints and CTOT time window limitations. This solution is then passed to a metaheuristic optimization algorithm—either simulated annealing (SA) or Genetic Algorithm (GA)—for iterative refinement. During each iteration, the global resource status is updated, and any arising conflicts are resolved accordingly. Ultimately, a high-quality scheduling solution that satisfies multiple operational constraints is produced.

Figure 3.
Overall scheduling optimization process.
3.3.1. Algorithm Design
The algorithm design consists of three main components: data preprocessing, feasible solution generation, and conflict resolution.
- Input and Resource Initialization
The input parameter set includes the following:
: set of departing aircraft; : set of stands; : set of runways; : scheduled off-block time (SOBT) for aircraft at stand ; : calculated takeoff time (CTOT) of aircraft on runway ; : calculated off-block time (COBT) of aircraft on runway ; : runway occupancy time of aircraft on runway ; : unimpeded taxi-out time from stand to runway ;
- 2.
- Feasible Solution Generation
Step 1: Computation of Feasible Pushback Time at Stand
For each flight , the feasible pushback time window is defined as:
For CTOT-constrained flights: strictly within ±10 min of the COBT.
For flights without CTOT: extended to within 15 min after the SOBT.
Time conflicts are further detected against the stand occupancy schedule and unavailable time slots are removed.
Step 2: Estimation of Feasible Runway Entry Time
By adding the average unimpeded taxi time to the feasible stand pushback window, the initial feasible runway entry window is derived:
Step 3: Runway Entry Conflict Resolution
For each runway entry point , conflict-free time slots are generated according to the following rules:
- Time discretization: The window is discretized based on the required runway separation interval .
- Conflict detection: Time slots that overlap with previously scheduled flights are excluded.
- Priority reassignment: In conflict scenarios, flights with CTOT constraints are prioritized in reassigning time slots.
Step 4: Determination of Actual Pushback Time at Stand
Based on the final allocated runway queue arrival time, the aircraft’s actual pushback time is determined by back-propagating from the runway to the stand, ensuring it falls within the predefined feasible window and complies with the CTOT window and required taxi-out duration.
Step 5: Update of Stand Occupancy Schedule
For active stands, the actual departure time is recorded and used for subsequent conflict detection.
For pushback-prohibited stands, additional buffer constraints are added to adjacent stands in the schedule.
The stand occupancy table is updated as follows: ←.
3.3.2. Algorithm Optimization
To address the departure scheduling problem under CTOT time window constraints and runway conflict restrictions, both SA and GA are developed based on the resource transmission framework. These algorithms employ flight task permutations (i.e., departure sequences) as heuristic encodings. By dynamically updating global resource occupancy status, spatiotemporal conflicts in scheduling plans are effectively constrained, thereby enabling the efficient resolution of taxi path scheduling tasks.
The simulated annealing algorithm is inspired by the physical annealing process, allowing for the occasional acceptance of suboptimal solutions to escape local optima and gradually converging toward a global optimum. In contrast, the Genetic Algorithm is inspired by natural selection and operates through selection, crossover, and mutation mechanisms to iteratively improve population fitness. Both approaches represent classical stochastic heuristic methods and are well suited for solving complex, constraint-intensive optimization problems in the airport surface operation domain.
- Resource Propagation Mechanism
During taxi-out scheduling, each departure task exhibits staged occupancy and transition behavior on the taxiway network, i.e., each aircraft temporarily occupies a taxi segment and propagates its status forward along the intended route (Figure 4). To maintain conflict-free paths, the global resource state table is updated in real time after each task is scheduled. This table records the specific taxiway segments occupied by each task, along with their associated time windows. When subsequent tasks are assigned their routes and timing, the latest global resource status must be referenced for conflict detection and resolution. This mechanism ensures that no overlapping time usage occurs on the same taxi segment, thereby guaranteeing path-level feasibility throughout the scheduling process.

Figure 4.
Sequential scheduling workflow in the resource propagation mechanism.
- 2.
- Task Sequencing and Solution Representation
The scheduling solution is represented as an ordered sequence of departure tasks, with each task corresponding to the pushback and taxi-out process of a specific aircraft. During each iteration of the algorithm, the following steps are executed in sequence based on the current task order:
- Assign an initial pushback time for each task;
- Estimate the runway entry time using the unimpeded taxi-out time;
- Check whether CTOT window constraints and runway conflict conditions are satisfied;
- If any conflict is detected, perform backtracking is triggered or the pushback time is adjusted;
- Upon successful scheduling, update the global resource occupancy table.
Both algorithms adopt a multi-objective performance evaluation framework—integrating average taxi-out time, ATFM slot adherence, and departure punctuality—to guide the search process toward the Pareto-optimal frontier.
- 3.
- Overall Algorithm Structure
Both the simulated annealing (SA) and Genetic Algorithm (GA) frameworks follow a unified three-phase structure, as outlined in Table 3.
Table 3.
Overall algorithm structure and key operations.
The parameter settings for both algorithms are listed in Table 4. A pseudocode for the implementation is provided in Appendix B.
Table 4.
Parameter settings for SA and GA.
In summary, both SA and GA are built upon a consistent resource modeling logic and task sequencing scheme. By dynamically maintaining the global resource occupancy state, both algorithms effectively resolve conflicts in taxi-out paths and time windows, enabling feasible and efficient scheduling solutions for complex airport surface operations. Their optimization performance is quantitatively evaluated in Section 4.2.
4. Experimental Results
4.1. Dataset Description
4.1.1. Airport Operational Parameters
The dataset utilized in this study consists of complete departure flight records from Nanjing Lukou International Airport (ICAO code: NKG) for June 2023. As a key 4F-class international hub in East China, NKG handles over 500 flights daily and features a complex multi-runway configuration with refined apron management. These characteristics make it an ideal environment for validating the proposed model under realistic and operationally demanding conditions.
- (1)
- Apron Control Zone Division
According to the operational regulations at NKG, the apron is divided into five control areas, as illustrated in Figure 5. During aircraft pushback operations, stand conflict within the same control area must be avoided. In accordance with airport guidelines, the minimum pushback interval time () is set at 6 min.
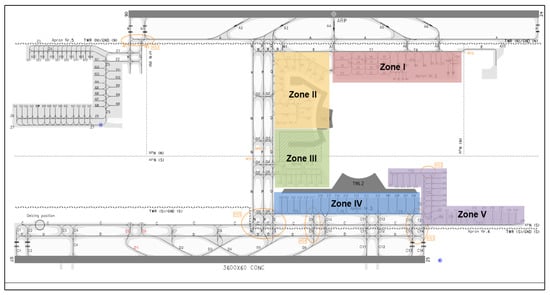
Figure 5.
Apron control zones.
- (2)
- Rules for Release Separation Settings
The release separation between consecutive departing aircraft is determined by both their departure direction and wake turbulence category. The larger of the two values is adopted as the effective release separation constraint in the scheduling model.
- Route-Based Separation
At NKG, if two consecutive flights follow the same departure route (i.e., pass through the same waypoints such as HFE, ESBAG, OF, CJ), a 3 min interval is required. However, if a flight departing via HFE is followed by another flight heading to FYG, IKUBA, or IRNOL, the interval increases to 6 min. A 2 min interval is applied for flights with different departure routes. The departure directions and associated waypoints are illustrated in Figure 6.
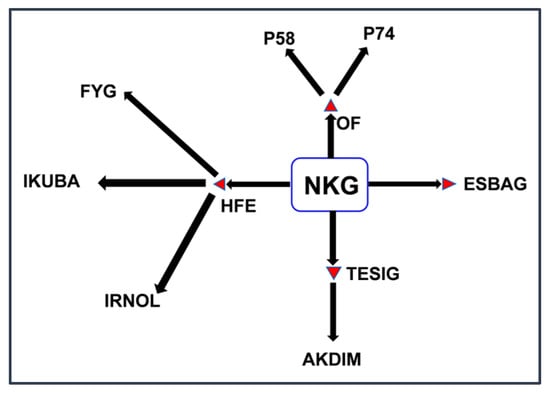
Figure 6.
Departure directions at NKG.
- Type-Based Separation
According to the tower operation manual at NKG, the minimum time separations required for various combinations of leading and following aircraft types are presented in Table 5.
Table 5.
Required release intervals based on aircraft type (unit: seconds).
In this study, runway occupancy time is also determined based on aircraft-type classification, aligned with NKG’s actual operational standards. The classification rules and corresponding time values are detailed in Table 6.
Table 6.
Runway occupancy time requirements by aircraft type (unit: seconds).
It should be noted that light aircraft are not currently operated at NKG, and corresponding flight data are not included in the original dataset. As a result, runway occupancy times for this category were not recorded during data collection and are consequently excluded from the model.
4.1.2. Data Composition and Preprocessing
The dataset includes 7658 departure flights operated at NKG during June 2023. The raw data were obtained from the Airport Collaborative Decision Making (A-CDM) system and Air Traffic Control Automation systems. Key fields cover basic flight parameters and taxi-out performance metrics, as listed in Table 7. A three-stage preprocessing procedure was implemented to ensure data quality:
Table 7.
Sample records of departure flight operations at NKG.
- Outlier removal: Flights with taxi-out times exceeding 120 min were filtered out, following ICAO standards.
- Data normalization: Time formats and measurement units were standardized across heterogeneous sources.
- Feature engineering: Free-flow taxi-out times for each stand–runway pair were computed using the methodology developed by the Performance Review Unit (PRU), serving as critical inputs for optimization.
4.1.3. Spatiotemporal Characteristics of Departure Flow
Figure 7 presents the spatiotemporal distribution of departure flows on the four runways (06, 07, 24, and 25) at NKG during June 2023. The analysis reveals significant spatiotemporal heterogeneity in departure operations.
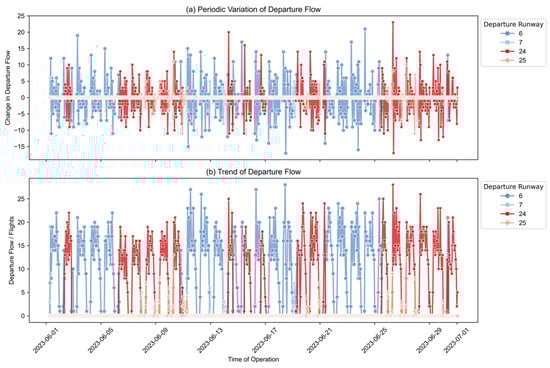
Figure 7.
Periodic variation and trend in departure flow at NKG.
Runways 06 and 24 accounted for 78.6% of departures and were designated as the primary operational channels. In contrast, Runways 07 and 25 were utilized as auxiliary runways, primarily to accommodate overflow during peak hours. Daily departure volumes followed a triple-peak pattern, occurring in the morning (08:00–09:00), midday (11:00–12:00), and evening (18:00–19:00). This non-uniform distribution of demand posed considerable challenges for dynamically adapting surface resource allocations.
4.1.4. Distribution of CTOT-Constrained Flights
The spatiotemporal distribution of flights subject to CTOT restrictions has a direct influence on the effectiveness of airport surface scheduling strategies. As shown in Figure 8, the proportion of CTOT-constrained flights exhibits substantial hourly variation.

Figure 8.
Hourly distribution of CTOT-constrained flights.
Between 09:00 and 21:00, this proportion remained consistently above 60%, with a peak value of 70.9% during the evening rush hour (18:00–19:00). This indicates the intensified implementation of airspace flow management measures during peak periods, requiring more than two-thirds of departures to strictly comply with their assigned CTOT windows. Such operational environments impose dual challenges on the scheduling model: ensuring that CTOT flights depart within ±3 min of their designated slots while minimizing cascading delays for non-CTOT flights due to surface congestion. Notably, during CTOT-intensive periods, such as evening peaks, spatiotemporal reallocation of surface resources is required to sustain overall departure efficiency.
4.1.5. Statistical Analysis of Unimpeded Taxi Time
The unimpeded taxi-out time for each stand–runway origin–destination (OD) pair was computed to support the model input requirements of the proposed departure scheduling optimization framework.
Figure 9 illustrates heatmaps of unimpeded taxi-out time (upper panel) and the corresponding number of flight samples (lower panel) for OD pairs across Regions I–IV. The results reveal a clear spatial gradient in unimpeded taxi-out time across the regions. In general, as the region index increases from I to IV, the average distance to the runway becomes longer, resulting in a corresponding increase in unimpeded taxi-out time. This pattern is particularly evident for departures toward Runways 06 and 24. Notably, some OD pairs with a large number of flight samples do not exhibit a proportional increase in unimpeded taxi-out time. This observation implies that taxi-out time is primarily governed by the geometric characteristics of taxi routes rather than traffic frequency. These findings validate the use of unimpeded taxi-out time—after removing operational disturbances—as a stable and intrinsic measure of taxiing efficiency for different OD pairs.
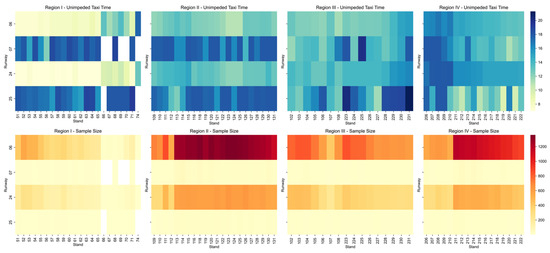
Figure 9.
Heatmaps of unimpeded taxi time and flight sample count for different stand–runway OD pairs.
4.2. Performance Evaluation
To evaluate the effectiveness and applicability of the proposed multi-objective departure scheduling model, in this section, we conduct a multi-dimensional performance analysis. Key metrics include departure punctuality, ATFM slot adherence, and taxi-out efficiency. Additionally, it examines the distribution of pushback time adjustments and deviations from target times to assess the model’s flexibility and responsiveness under scheduling and capacity constraints.
4.2.1. Algorithm Comparison and Analysis
To assess the effectiveness of different intelligent optimization algorithms for the proposed multi-objective taxi-out scheduling model, comparative experiments were conducted using SA and GA. As real-world departure delays may be influenced by external and unpredictable factors, such as arrival delays, passenger boarding fluctuations, or equipment malfunctions, these conditions are difficult to replicate accurately in a simulation environment.
To ensure fairness and reproducibility, the First-Come, First-Served (FCFS) scheduling rule is introduced as a unified non-optimized baseline. All scheduling scenarios are simulated under consistent constraints and operational assumptions to provide an equitable and repeatable evaluation framework.
All three strategies—FCFS, SA, and GA—are executed under identical modeling environments and constraint conditions. A unified set of performance metrics is employed to evaluate the results across four key dimensions: solution quality, convergence speed, solution stability, and computational complexity.
- Solution Quality Comparison
Table 8 presents the scheduling simulation results of FCFS, SA, and GA using actual flight operations data from NKG on a day in June 2023.
Table 8.
Performance comparison of SA and GA algorithms.
The SA algorithm consistently outperforms the GA across all key performance indicators. SA achieves superior performance in both departure punctuality (78.69%) and ATFM slot adherence (95.78%), exceeding the results of the GA (75.43% and 94.12%, respectively). This demonstrates the SA algorithm’s enhanced capability to coordinate departure sequencing with CTOT constraints while maintaining solution stability. Moreover, SA achieves a shorter average taxi-out time (16.10 min versus 16.47 min), highlighting its advantage in balancing conflicting optimization objectives.
- 2.
- Convergence Speed Analysis
Figure 10 presents the convergence trajectories of both algorithms during a representative simulation conducted for departure flights scheduled between 09:00 and 12:00 on 10 June 2023. The fitness value of the objective function was plotted against the number of iterations.
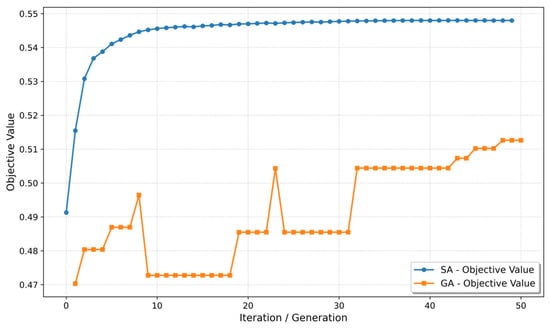
Figure 10.
Convergence trend of objective value during iterations.
The results indicate that SA converged more rapidly in the initial stages, reaching near-optimal solutions within the first ten iterations. A temperature control mechanism allows SA to temporarily accept suboptimal solutions, thereby enabling gradual improvement and increasing the likelihood of escaping local optima, ultimately approaching the global optimum. In contrast, the GA demonstrated a stepwise improvement trend with slower convergence and multiple stagnation phases. This behavior reflects GA’s limited local search capability and its dependence on the quality of the initial population. The best fitness value achieved by GA stabilized at approximately 0.510, which is notably lower than the final value of 0.548 obtained by SA, confirming the superiority of SA in both search efficiency and optimization capability.
- 3.
- Solution Stability Analysis
The solution stability analysis is based on repeated simulation runs using the same flight dataset and model constraints but with different random seeds for generating initial solutions or populations. This approach allows for the evaluation of each algorithm’s robustness and convergence consistency under stochastic disturbances. The focus of this analysis is to assess internal robustness, rather than generalizability, across varying operational scenarios.
To further validate consistency and stability, both SA and GA were executed independently 10 times for the same scheduling window (09:00–12:00 on June 10). The results are summarized in Table 9.
Table 9.
Key performance statistics of SA and GA.
The findings reveal that SA exhibited significantly lower standard deviations across all key performance indicators, indicating stronger convergence stability and reduced outcome variability. Furthermore, SA showed less sensitivity to initial solution quality, suggesting superior internal robustness. In particular, with respect to ATFM slot adherence and departure punctuality—two critical indicators of scheduling reliability—SA achieved markedly lower standard deviations (0.9 and 1.2, respectively) compared to GA (2.7 and 2.3, respectively).
- 4.
- Computational Complexity Analysis
To evaluate the computational efficiency and scalability of the proposed algorithms in realistic airport scheduling environments, this section analyzes both the time and space complexity of the SA and GA approaches, highlighting their differences in resource consumption and computational behavior.
- Simulated Annealing (SA)
In each iteration, SA perturbs the current flight sequence by swapping two flight positions, generating a neighborhood of size . For each perturbed sequence, taxi route reallocation and constraint validation are performed, which incur a cost of , where is the number of flights in the scheduling period. Let denote the maximum number of iterations. The total time complexity can be approximated as:
Space Complexity: The algorithm stores essential flight data and sequencing information in space. Additionally, it maintains the dynamic occupation status of ground resources (e.g., taxiways, stands, runway entry points), incurring a memory cost of , where is the number of nodes in the airport surface graph. The total space complexity is:
- Genetic Algorithm (GA)
Time Complexity: GA operates via a population-based evolutionary process involving selection, crossover, and mutation. Let denote the population size and the number of iterations. Initial population generation costs , fitness evaluation per generation , elitist sorting takes , and crossover and mutation operations add another . The per-iteration complexity is approximately:
Space Complexity: GA stores the schedules and fitness values for all individuals: occupying . Fitness values for each individual require , and time occupancy data for taxiway nodes remain . Thus, the total space complexity is:
While GA demonstrates strong global exploration capabilities in generic combinatorial optimization problems, it exhibits two key limitations when applied to the constrained and dynamic nature of the taxi-out scheduling model: Premature convergence: the complex interdependence between ground and airside resources often leads GA to converge early, with insufficient population diversity. Weak local exploitation: due to the finely grained CTOT constraints and narrow feasible regions, GA lacks effective mechanisms for fine-tuned local adjustments. In contrast, SA, with its single-point neighborhood search and gradual cooling process, is more adept at navigating complex solution landscapes. It exhibits higher robustness, better stability, and greater adaptability in handling conflicting objectives and tightly coupled scheduling constraints, making it a more suitable approach for the targeted problem.
Therefore, the evaluation and analysis results presented in Section 4.2.2, Section 4.2.3, Section 4.2.4, Section 4.2.5 and Section 4.2.6 are based exclusively on SA to ensure clarity and analytical focus.
4.2.2. Departure Punctuality
Figure 11 illustrates the improvement in departure punctuality achieved using the SA algorithm. The experimental results show that the average departure punctuality rate increased from a baseline of 67.98% to 78.69%, an absolute gain of 10.71 percentage points. Moreover, the standard deviation decreased from 7.2% to 4.7%, indicating enhanced robustness under dynamic disturbances.
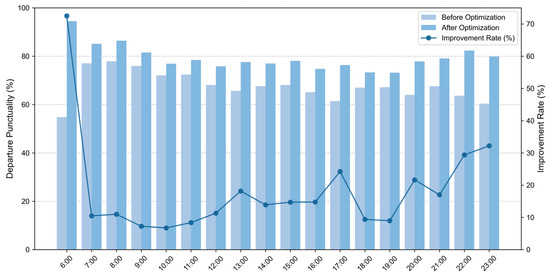
Figure 11.
Hourly departure punctuality before and after optimization over the month.
Midday Peak (11:00–13:00): Punctuality rates increase by 8.38% at 11:00, 11.32% at 12:00, and 18.18% at 13:00. Evening Peak (17:00–19:00): At 17:00—when the proportion of CTOT-constrained flights exceeds 60%—the punctuality rate improves significantly from 61.47% to 76.36% (↑24.23%), maintaining strong on-time performance. Other Periods (14:00–16:00, 20:00–21:00): Improvements generally range between 13% and 21%, further validating the model’s capability to coordinate multiple conflicting objectives in complex scheduling scenarios.
4.2.3. ATFM Slot Adherence
As shown in Figure 12, the proposed model significantly enhances ATFM slot adherence: the average slot adherence rate improved from 64.59% to 95.78%, a gain of 31.19 percentage points. The standard deviation was reduced from 6.7% to 1.8%, indicating more stable and predictable performance. The proportion of CTOT violations dropped from 35.41% to 4.22%, demonstrating improved synchronization between ground operations and airspace flow constraints.

Figure 12.
Hourly ATFM slot adherence before and after optimization over the month.
Early Morning Off-Peak (06:00–08:00): During this period, flight density is relatively low, and airspace capacity is more flexible, allowing for broader adjustment of time slots. The ATFM slot adherence rate surges from 14.29% to 100% between 06:00 and 07:00 and increases by 32.65% from 07:00 to 08:00. The model leverages a Slot Preemption Strategy (SPS) to prioritize runway usage for CTOT-constrained flights, effectively eliminating time window mismatches inherent in the traditional First-Come, First-Served (FCFS) policy. Daytime Peak Periods (09:00–21:00): ATFM slot adherence improves by 31.1% during the midday peak and by 34.8% during the evening peak, confirming the model’s robustness, even under high CTOT coverage rates (up to 70.9%).
4.2.4. Taxiing Efficiency
Figure 13 presents the optimized characteristics of taxi-out time distributions. The average taxi-out time was reduced from 17.2 min to 16.1 min, representing a 6.4% decrease. The peak density shifts from the 17–18 min range to 14–15 min, suggesting that the model effectively coordinates pushback scheduling to reduce stand holding delays. The sharper kernel density curve (with kurtosis increasing from 2.1 to 3.4) further confirms a more concentrated taxi-out distribution.

Figure 13.
Density plot of taxi time before and after optimization.
Figure 14 illustrates the model’s performance in reducing additional taxi-out time for the 15 most frequent stand–runway pairings. Key observations include the following: Average reductions ranged from 55.2% to 82.3%. For example, in the 118–6 pairing, additional taxi-out time was reduced from 5.61 to 1.10 min, reflecting significant alleviation of surface congestion through optimized pushback timing. Some pairings (e.g., 125–6) experienced increased standard deviation (from 2.87 to 5.93 min), highlighting the limitations of static routing strategies under peak traffic conditions and suggesting potential for further improvements through dynamic taxiway allocation.
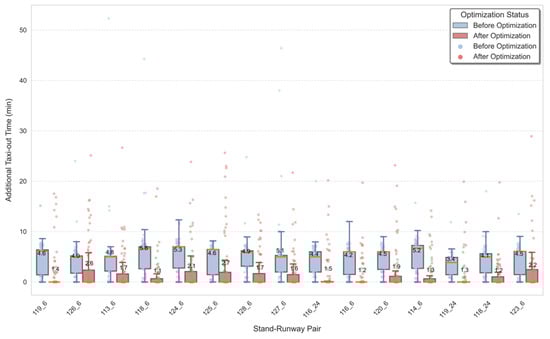
Figure 14.
Changes in additional taxi-out time by stand–runway combination.
4.2.5. Distribution of Pushback Time Deviations
Figure 15 presents the distribution of departure time adjustments, where the vertical axis represents the percentage change relative to the total number of flights. Four deviation intervals are defined: [0–3), [3–5), [5–10), and [10, +∞) minutes. This classification provides a systematic evaluation of how well the optimization model coordinates flight pushback times.
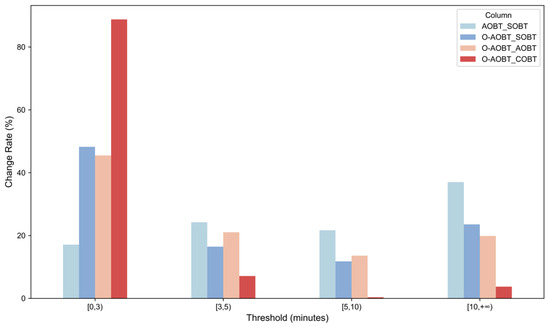
Figure 15.
Deviation rate of pushback times.
- Suppression of Scheduled Deviations
The deviation between AOBT and SOBT was found to exhibit a strongly right-skewed distribution under the baseline scheduling approach. Specifically, 37.01% of flights deviated by more than 10 min, and 21.68% fell within the 5–10 min range (mean: 24.66 min; standard deviation: 49.92 min), suggesting a substantial execution bias. After optimization, the distribution of AOBT–SOBT deviations exhibited a notable structural shift: Suppression of large deviations: the proportion of flights with deviations ≥10 min decreases by 13.46 percentage points to 23.55%. Reduction in medium deviations: the 5–10 min range drops by 9.90 percentage points to 11.78%.
- 2.
- Improvement in Operational Coordination
After optimization, the distribution of deviations between the optimized AOBT and actual AOBT revealed that 19.87% of flights deviated by more than 10 min, while 45.48% fell within the 0–3 min range. This suggested a systematic reconstruction of pushback timing: minor deviations were minimized through refined scheduling, while substantial adjustments (≥10 min) were selectively applied to specific flights. This approach demonstrated the model’s ability to balance global optimization with local adaptability.
- 3.
- Enhancement of Takeoff Synchronization
The coordination between optimized AOBT and COBT improved significantly, with 88.78% of flights maintained within a 0–3 min deviation range and only 3.75% exceeding 10 min. This distribution indicated that, by treating the CTOT as a core constraint and accurately controlling pushback windows, the model facilitated dynamic alignment between taxi-out durations and scheduled takeoff times. This, in turn, contributed directly to the marked improvement in ATFM slot adherence (from 62.2% to 95.9%).
Overall, the optimization model significantly reduces the average deviation between AOBT and SOBT. However, the reduction in temporal variability remains relatively modest. The deviation between the optimized AOBT and the actual AOBT remains minimal and exhibits low volatility, indicating that the model adjusts off-block times in alignment with actual operational conditions. Furthermore, the deviation between the optimized AOBT and COBT is negligible and highly stable, demonstrating effective coordination of aircraft pushback with calculated takeoff times.
Owing to its modular architecture and high adaptability, the model can be seamlessly integrated into airport surface automation systems or digital twin platforms, enabling real-time adaptive scheduling and supporting intelligent decision making in smart airport operations.
4.2.6. Distribution of Pushback Time Differences
Table 10 presents the statistical distribution of pushback time deviations. The experimental results show that the on-time pushback rate (zero deviation) increases from 1.97% to 34.39%, indicating that the model significantly enhances schedule execution accuracy through SOBT-based constraints. Simultaneously, the early pushback rate decreased from 58.32% to 25.99%, indicating a shift from conservatively scheduled operations based on operational experience to precise scheduling guided by data-driven optimization. This reduction in premature pushback effectively reduces stand idle time and enhances overall airside operational efficiency.
Table 10.
Statistics of pushback time deviations.
Regarding delayed pushback, the model exhibits characteristics of multi-objective dynamic optimization. The delay rate between optimized AOBT and SOBT decreases by 0.1%, while the delay rate between optimized AOBT and actual AOBT rises to 69.14%. This apparent contradiction highlights the model’s prioritization strategy: to meet rigid CTOT constraints, certain flights are intentionally delayed to better synchronize taxi-out and takeoff slots. This strategy is further supported by the deviation distribution between optimized AOBT and COBT—68.14% of flights are advanced, suggesting that earlier pushback provides buffer time for taxiing and ensures an ATFM slot adherence rate of 95.8%.
Figure 16 illustrates the frequency distribution of pushback time deviations. The original AOBT–SOBT distribution shows a right-skewed long-tail shape, with a central tendency in the negative range, reflecting prevalent early pushbacks. After optimization, the distribution shifts significantly to the right and becomes more concentrated around 0 min, with a substantial reduction in the proportion of long-tail delays. This evolution confirms the model’s effectiveness in suppressing extreme deviations by dynamically anchoring SOBT. The deviation between optimized AOBT and actual AOBT shows that 69.14% of flights are delayed, with a median of 3 min and interquartile range (IQR) of 0–10 min, indicating a moderate and controlled adjustment strategy. This limited correction ensures operational continuity while providing necessary temporal elasticity for COBT coordination. The deviation between optimized AOBT and COBT exhibits an ultra-narrow distribution band (−10 to +10 min), with 88.18% of flights within 3 min and a standard deviation of only 5.07 min. This confirms the model’s strict compliance with COBT constraints, achieving a precision level exceeding the CAAC’s 3 min CTOT threshold.
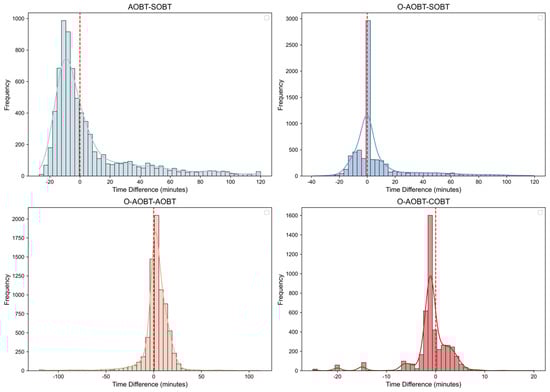
Figure 16.
Frequency distribution of pushback time deviations.
In conclusion, this section validates the model’s optimization performance in complex operational scenarios through multidimensional data analysis.
The results demonstrate that the dynamic pushback scheduling strategy significantly improves both departure punctuality and ATFM slot adherence while suppressing extreme taxi-out delays, thereby providing theoretical and practical support for intelligent airside scheduling.
5. Conclusions and Discussion
5.1. Main Findings
This study investigates the problem of departure pushback scheduling optimization in airport surface operations by formulating a multi-objective model that seeks to maximize departure punctuality and ATFM slot adherence while minimizing taxi-out time. A solution framework incorporating SA and GA is proposed and empirically validated using full-scale operational data from NKG in June 2023. The key findings are summarized as follows:
- Improved taxiing efficiency: The model dynamically coordinates pushback timing and taxiway resource allocation, leading to a 6.4% reduction in average taxi-out time (from 17.2 to 16.1 min). For high-congestion stand–runway combinations (e.g., 118_6), tail-end taxi-out delays are reduced by up to 82.3% (from 5.61 to 1.10 min). Additionally, the number of flights with taxi-out times exceeding 30 min is reduced by 58%.
- Enhanced ATFM slot adherence and departure punctuality: By integrating CTOT window constraints into the sequencing process and prioritizing CTOT-compliant flights, the model mitigates resource-induced mismatches. As a result, ATFM slot adherence improves from 64.6% to 95.8%, and departure punctuality increases by 10.7%, validating the model’s effectiveness in improving on-time operational performance.
- Improved Airport–Airspace Coordination: By aligning pushback times precisely with CTOT constraints, the model enhances surface operation efficiency and airspace flow reliability. This supports collaborative decision making among airports, air traffic control (ATC) units, and airline stakeholders.
5.2. Model Advantages
- Capability for Multi-Objective Coordination: Unlike conventional single-objective optimization approaches, the proposed model employs the Entropy Weight Method to assign relative importance to multiple objectives. This enables the model to balance schedule stability, airspace coordination, and resource efficiency, offering flexibility under conflicting operational demands.
- Robustness under high-traffic conditions: The model maintains high computational efficiency and scheduling performance during traffic-saturated conditions with limited taxiway availability. During peak evening periods—when CTOT-constrained flights account for 70.9% of departures—it achieves 73.21% departure punctuality and 91.56% ATFM slot adherence, demonstrating high robustness across diverse operational scenarios.
- Algorithm Performance Stability and Scalability: The SA algorithm consistently outperforms the GA in terms of solution quality, convergence speed, and stability. It demonstrates superior capability in optimizing both ATFM slot adherence and departure punctuality, offering a more dependable computational foundation for real-world scheduling applications.
5.3. Limitations
Despite its promising results, several limitations of the proposed model merit further investigation:
- Limited flexibility in taxi routing strategy: Although the model includes real-time conflict detection and time window adjustments within a global resource propagation framework, it currently relies on predefined shortest taxi paths derived from Performance Review Unit-based unimpeded route evaluations. The scheduling framework does not yet support multi-path selection or adaptive rerouting.
- Insufficient weight sensitivity analysis: The model employs a static weighting scheme using the Entropy Weight Method but does not explore sensitivity under alternative configurations. This may limit responsiveness to fluctuating operational priorities. Future research could explore dynamic objective weighting to enable adaptive optimization focus under changing conditions.
- Limited Generalizability Across Airports: As the model is calibrated using NKG-specific operational data, its direct applicability to airports with differing taxiway structures or control policies may be limited. Broader generalization would require reconfiguration of taxi time estimations, path structures, and constraint parameters.
- Limited Adaptability to Disruptive Scenarios: The dataset primarily reflects typical weather conditions (e.g., clear, cloudy, rainy), while more severe events, such as thunderstorms or dense fog, were not covered. These scenarios may impact aircraft behavior and CTOT effectiveness, challenging the model’s stability and adaptability under non-routine conditions.
5.4. Practical Implications
The proposed multi-objective departure scheduling model, supported by real-world operational data and intelligent optimization algorithms, offers a deployable solution to simultaneously improve punctuality, ATFM slot compliance, and taxiing efficiency. The practical implications are as follows:
- Support for Operational Pushback Planning: The model generates optimized pushback sequences that provide actionable scheduling insights for Airport Operations Centers and tower controllers. These insights help formulate conflict-free, time-sensitive departure plans, especially during peak hours, enhancing tactical responsiveness and decision quality.
- Improved Air–Ground Coordination: By incorporating ATFM slot adherence as a core optimization criterion, the model significantly reduces CTOT violations and supports more synchronized collaboration with ATFM systems. This helps minimize mismatches caused by surface delays and contributes to improved en-route traffic stability.
- Integration into Surface Automation and Digital Twin Platforms: Due to its modular and adaptable architecture, the model can be embedded into airport surface automation systems or digital twin environments to facilitate real-time adaptive scheduling, supporting intelligent and data-driven decision making in smart airport operations.
5.5. Future Research Directions
In light of this study’s findings and current limitations, future research can be extended in the following directions:
- Integration of dynamic taxi route optimization mechanisms: Building upon the existing framework, a dynamic taxi path optimization module can be incorporated. By leveraging mixed-integer programming (MIP) or multi-agent deep reinforcement learning (MADRL), a responsive scheduling system capable of real-time routing and rescheduling can be developed, enabling joint optimization of task sequencing and route assignment.
- Adaptive Objective Weighting: A dynamic weighting mechanism for objectives may be introduced based on real-time operational status or strategic priorities (e.g., punctuality versus resource utilization). This would enhance the model’s adaptability and interpretability across diverse airport scheduling scenarios.
- Enhanced Robustness Under Abnormal Conditions: To improve resilience and generalization, a suite of simulated test cases representing extreme operational scenarios can be designed using a multi-scenario simulation platform. Robust optimization techniques and uncertainty modeling can then be employed to enhance performance under dynamic and uncertain conditions.
In summary, the proposed multi-objective departure scheduling optimization framework effectively integrates timeliness, operational efficiency, and airspace coordination. It provides a theoretically sound and practically viable solution to support intelligent airport traffic control and scheduling. The model exhibits strong potential for real-world applications and offers a robust foundation for future methodological advancements.
Author Contributions
Conceptualization, Z.Z. and S.Z.; methodology, S.Z.; software, S.Z.; validation, S.Z.; formal analysis, S.Z.; investigation, S.Z. and Y.Z.; resources, J.L.; data curation, S.Z.; writing—original draft preparation, S.Z.; writing—review and editing, Z.Z. and Y.Z.; visualization, S.Z. and Y.Z.; supervision, Z.Z.; project administration, Z.Z.; funding acquisition, Z.Z. All authors have read and agreed to the published version of the manuscript.
Funding
This research was funded by the National Natural Science Foundation of China, Grant No. 52472345. The APC was funded by the same grant.
Data Availability Statement
The data that support the findings of this study are not publicly available due to confidentiality agreements with the airport authority. These data contain sensitive operational information related to real-world airport surface movements and cannot be shared publicly for privacy and security reasons.
Acknowledgments
This work was supported by the National Natural Science Foundation of China under Grant No. 52472345, titled “Multi-domain Coupling Evolution Mechanism and Robust Control Methods for Surface Operations at Large Hub Airports.” This project focuses on the multi-domain coupling characteristics of airport surface operations and aims to investigate the evolution mechanisms and develop robust control strategies to enhance operational efficiency and stability.
Conflicts of Interest
Author Jie Leng was employed by the company Eastern Airports Group Co., Ltd. The remaining authors declare that the research was conducted in the absence of any commercial or financial relationships that could be construed as a potential conflict of interest.
Appendix A
Entropy Weight Method for Indicator Weighting Calculation
To objectively determine the weights of performance indicators in the multi-objective optimization model—namely, departure punctuality rate, ATFM slot adherence rate, and average taxi-out time—this study employs the Entropy Weight Method (EWM). This method quantifies the amount of information provided by each indicator across multiple daily samples, thereby avoiding subjective bias and enhancing the scientific rigor of the evaluation.
- Indicators and Data Structure
The input data consist of daily operational statistics, including the following:
- Departure Punctuality;
- ATFM Slot Adherence;
- Average Taxi-out Time.
Each indicator is first aggregated using weighted averages based on the number of relevant flights per day. Subsequently, min–max normalization is applied to ensure comparability.
- 2.
- Entropy Weight Method Procedure
Step 1: Normalization: For each indicator value (indicator on day ), min–max normalization is performed:
For benefit-type indicators (the larger, the better):
For cost-type indicators (the smaller, the better, e.g., taxi-out time):
Step 2: Construct the normalized proportion matrix
Step 3: Calculate the information entropy for each indicator:
Step 4: Compute the entropy weight for each indicator:
Appendix B
Appendix B.1. Resource-Propagated Simulated Annealing
| Input: |
| Task set |
| : Initial temperature |
| : Final temperature |
| : Cooling coefficient |
| : Maximum iterations |
| : Global resource table |
| : list of unfinished tasks |
| Output: |
| : Best objective value |
| : Best schedule |
| : Number of tasks |
| 1: // Initialization phase |
| 2: ← |
| 3: ← // List of task IDs |
| 4: // Mapping from ID to index |
| 5: // Initial order (indices) |
| 6: // Convert to task ID order |
| 7: // Generate initial schedule |
| 8: // Copy of resource table |
| 9: |
| 10: |
| 11: |
| 12: |
| 13: |
| 14: |
| 15: |
| 16: // Current temperature |
| 17: iteration counter |
| 18: // Counter for no improvement |
| 19: |
| 20: // ========== Main loop ========== |
| 21: while do |
| 22: |
| 23: |
| 24: // Neighborhood search: traverse all task pairs |
| 25: for do |
| 26: for do |
| 27: // Generate new schedule |
| 28: |
| 29: |
| 30: |
| 31: // Evaluation of new solutions |
| 32: |
| 33: |
| 34: |
| 35: |
| 36: // Acceptance criterion |
| 37: |
| 38: if then |
| 39: |
| 40: |
| 41: |
| 42: |
| 43: // Update global best |
| 44: if then |
| 45: best_ObjectiveValue ← new_ObjectiveValue |
| 46: best_schedule ← new_schedule |
| 47: best_order ← new_order |
| 48: no_improve_count ← 0 |
| 49: improved ← true |
| 50: end if |
| 51: end if |
| 52: end for |
| 53: end for |
| 54: |
| 55: // Early stopping condition |
| 56: if not improved then |
| 57: 1 |
| 58: if then |
| 59: break |
| 60: end if |
| 61: end if |
| 62: |
| 63: // Cooling |
| 64: |
| 65: |
| 66: end while |
| 67: |
| 68: return |
Appendix B.2. Resource-Propagated Genetic Algorithm
| Input: : Task set : population size : maximum generations crossover probability : mutation probability : early stopping patience Output: : Best fitness best scheduling order |
| 1: // Initialize population |
| 2: |
| 3: for to do |
| 4: Random permutation of indices |
| 5: // Convert to task ID order |
| 6: |
| 7: // Evaluate individual |
| 8: |
| 9: |
| 10: if feasible then |
| 11: |
| 12: else |
| 13: |
| 14: end if |
| 15: |
| 16: end for |
| 17: |
| 18: // Record the best individual |
| 19: |
| 20: |
| 21: |
| 22: |
| 23: |
| 24: // Evolution loop |
| 25: for to do |
| 26: |
| 27: |
| 28: // Elitism: preserve top 10% |
| 29: |
| 30: |
| 31: |
| 32: // Selection: rank-based roulette wheel selection |
| 33: Ascending by fitness (min to max) |
| 34: // Rank weights |
| 35: |
| 36: |
| 37: |
| 38: while do |
| 39: // Select parents |
| 40: |
| 41: |
| 42: |
| 43: // Crossover |
| 44: if then |
| 45: |
| 46: else |
| 47: |
| 48: |
| 49: end if |
| 50: |
| 51: // Mutation (adaptive probability) |
| 52: // Adaptive decay |
| 53: if then |
| 54: |
| 55: // Reverse subsequence |
| 56: end if |
| 57: if then |
| 58: |
| 59: |
| 60: end if |
| 61: |
| 62: // Evaluate children |
| 63: for do |
| 64: |
| 65: |
| 66: |
| 67: if then |
| 68: |
| 69: else |
| 70: |
| 71: end if |
| 72: |
| 73: end for |
| 74: end while |
| 75: |
| 76: |
| 77: |
| 78: |
| 79: // Update global best |
| 80: if then |
| 81: |
| 82: |
| 83: |
| 84: else |
| 85: |
| 86: end if |
| 87: |
| 88: // Early stopping condition |
| 89: if then |
| 90: break |
| 91: end if |
| 92: end for |
| 93: |
| 94: return |
References
- ICAO. 2016–2030 Global Air Navigation Plan; International Civil Aviation Organization: Montréal, QC, Canada, 2016. [Google Scholar]
- Sun, G.; Wang, Y.; Yu, H.; Guizani, M. Proportional fairness-aware task scheduling in space-air-ground integrated networks. IEEE Trans. Serv. Comput. 2024, 17, 4125–4137. [Google Scholar] [CrossRef]
- Air Traffic Management Bureau, CAAC (ATMB). Operational Rules for Air Traffic Flow Management in Civil Aviation of China; Air Traffic Management Bureau, CAAC (ATMB): Beijing, China, 2020.
- Wu, C.-L.; Caves, R.E. Flight schedule punctuality control and management: A stochastic approach. Transp. Plan. Technol. 2003, 26, 313–330. [Google Scholar] [CrossRef]
- Röhner, P. Modelling of Punctuality at Frankfurt Airport; Gottfried Wilhelm Leibniz Universität Hannover, Faculty of Mathematics and Physics: Hannover, Germany, 2009. [Google Scholar]
- Liu, L.; Tian, F.; Li, L. Impact of Severe Weather on Flight Punctuality at Shenyang Taoxian International Airport. China Sci. Technol. Inf. 2012, 18, 109–110. [Google Scholar]
- Jiang, B.; Peng, Y.; Zhao, Z. Analysis of Departure Flight Punctuality Characteristics in Regional Multi-Airport Systems. Aeronaut. Comput. Technol. 2018, 48, 79–82. [Google Scholar]
- Zhao, Y.; Jiang, S.; Xiao, D. Strategies to Enhance Flight Regularity Based on Pushback Time Optimization. Compr. Transp. 2018, 40, 22–24, 115. [Google Scholar]
- Wang, Y. Research on Improving Departure Punctuality Rate of Shenzhen Airport’s Originating Flights. Master’s Thesis, Huazhong University of Science and Technology, Wuhan, China, 2019. [Google Scholar]
- Wang, B. Research on Strategies to Enhance Flight Punctuality Rate at Kunming Changshui International Airport. Master’s Thesis, Yunnan University, Kunming, China, 2020. [Google Scholar]
- Wang, R. Research on Strategies to Improve Flight Punctuality Rate at Hainan Airlines’ Haikou Meilan Airport. Master’s Thesis, Hainan University, Haikou, China, 2020. [Google Scholar]
- de Jonge, H.; Tuinstra, E.; Seljée, R. Outbound punctuality sequencing by collaborative departure planning. In Proceedings of the 6th USA/Europe ATM 2005 Seminar, Baltimore, MD, USA, 27–30 June 2005. [Google Scholar]
- Loth, S.; Helm, S.M. Punctuality as KPI for Performance Based Airport Management. In Proceedings of the 15th AIAA Aviation Technology, Integration, and Operations Conference, Dallas, TX, USA, 22–26 June 2015. [Google Scholar]
- Burgain, P.; Pinon, O.J.; Feron, E.; Clarke, J.P.; Mavris, D.N. Optimizing Pushback Decisions to Valuate Airport Surface Surveillance Information. IEEE Trans. Intell. Transp. Syst. 2012, 13, 180–192. [Google Scholar] [CrossRef]
- Simaiakis, I.; Khadilkar, H.; Balakrishnan, H.; Reynolds, T.G.; Hansman, R.J. Demonstration of reduced airport congestion through pushback rate control. Transp. Res. Part A Policy Pract. 2014, 66, 251–267. [Google Scholar] [CrossRef]
- Simaiakis, I.; Sandberg, M.; Balakrishnan, H.; Hansman, R.J. Design, testing and evaluation of a pushback rate control strategy. In Proceedings of the 5th International Conference on Research in Air Transportation, Berkeley, CA, USA, 22–25 May 2012. [Google Scholar]
- Sandberg, M.; Simaiakis, I.; Balakrishnan, H.; Reynolds, T.G.; Hansman, R.J. A Decision support tool for the pushback rate control of airport departures. IEEE Trans. Hum.-Mach. Syst. 2014, 44, 416–421. [Google Scholar]
- McFarlane, P.; Balakrishnan, H. Optimal control of airport pushbacks in the presence of uncertainties. In Proceedings of the 2016 American Control Conference (ACC), Boston, MA, USA, 6–8 July 2016. [Google Scholar]
- Zhu, X.; Li, N.; Sun, Y.; Zhang, H.; Wang, K.; Tsai, S.B. A Study on the Strategy for Departure Aircraft Pushback Control from the Perspective of Reducing Carbon Emissions. Energies 2018, 11, 2473. [Google Scholar] [CrossRef]
- Mori, R. Optimal pushback time with existing uncertainties at busy airport. In Proceedings of the 29th Congress of the ICAS, St. Petersburg, Russia, 7–12 September 2014. [Google Scholar]
- Mori, R. Improvement of Pushback Time Assignment Algorithm via Stochastic Optimization. In Proceedings of the 5th SESAR Innovation Days, Bologna, Italy, 1–3 December 2015; pp. 171–178. [Google Scholar]
- Mori, R. Improvement of Pushback Time Assignment Under Uncertainties. In Proceedings of the 30th Congress of the International Council of the Aeronautical Sciences, Paper ICAS, Daejeon, Republic of Korea, 25–30 September 2016. [Google Scholar]
- Mori, R. Development of a Pushback Time Assignment Algorithm Considering Uncertainty. J. Air Transp. 2017, 25, 51–60. [Google Scholar] [CrossRef]
- Coupe, J.; Milutinovic, D.; Malik, W.; Jung, Y.C. Optimization of push back time windows that ensure conflict free ramp area aircraft trajectories. In Proceedings of the 15th AIAA Aviation Technology, Integration, and Operations Conference, Dallas, TX, USA, 22–26 June 2015. [Google Scholar]
- Kwasiborska, A. Development of an Algorithm for Determining the Aircraft Pushback Sequence. Acta Polytech. Hung. 2021, 18, 157–173. [Google Scholar] [CrossRef]
- Desai, J.; Lian, G.; Srivathsan, S. Dynamic departure pushback control at airports: Part A—Linear penalty—Based algorithms and policies. Nav. Res. Logist. (NRL) 2024, 71, 960–975. [Google Scholar] [CrossRef]
- Zhang, M.; Huang, Q.; Liu, S.; Li, H. Multi-objective optimization of aircraft taxiing on the airport surface with consideration to taxiing conflicts and the airport environment. Sustainability 2019, 11, 6728. [Google Scholar] [CrossRef]
- Wei, M.; Yang, S.; Wu, W.; Sun, B. A multi-objective fuzzy optimization model for multi-type aircraft flight scheduling problem. Transport 2024, 39, 313–322. [Google Scholar] [CrossRef]
- Xu, Z.T.; Li, Y.J.; Zuo, H.F.; Xu, T.Z.; Wang, Q.; Yu, W.W.; Yan, H.S.; Liu, B.; Chen, T.; Zhou, M.H. Ground Handling Process Optimization Model Linked to Flight Delay Prediction Results. IEEE Access 2024, 12, 114838–114857. [Google Scholar] [CrossRef]
- Mesón-Mancha, S. Additional Taxi-Out Time Performance Indicator Document; Eurocontrol: Brussels, Belgium, 2023. [Google Scholar]
Disclaimer/Publisher’s Note: The statements, opinions and data contained in all publications are solely those of the individual author(s) and contributor(s) and not of MDPI and/or the editor(s). MDPI and/or the editor(s) disclaim responsibility for any injury to people or property resulting from any ideas, methods, instructions or products referred to in the content. |
© 2025 by the authors. Licensee MDPI, Basel, Switzerland. This article is an open access article distributed under the terms and conditions of the Creative Commons Attribution (CC BY) license (https://creativecommons.org/licenses/by/4.0/).