Article

Technology Roadmap Methodology and Tool Upgrades to Support Strategic Decision in Space Exploration

1
Department of Mechanical and Aerospace Engineering, Politecnico di Torino, Corso Duca degli Abruzzi 24, 10129 Torino, Italy
2
Department of Management and Production Engineering, Politecnico di Torino, Corso Duca degli Abruzzi 24, 10129 Torino, Italy
*
Author to whom correspondence should be addressed.
Aerospace 2025, 12(8), 682; https://doi.org/10.3390/aerospace12080682 (registering DOI)
Submission received: 11 June 2025 / Revised: 26 July 2025 / Accepted: 29 July 2025 / Published: 30 July 2025
(This article belongs to the Section Astronautics & Space Science)

Abstract

Technological roadmaps are essential tools for managing and planning complex projects, especially in the rapidly evolving field of space exploration. Defined as dynamic schedules, they support strategic and long-term planning while coordinating current and future objectives with particular technology solutions. Currently, the available methodologies are mostly built on experts’ opinions and in just few cases, methodologies and tools have been developed to support the decision makers with a rational approach. In any case, all the available approaches are meant to draw “ideal” maturation plans. Therefore, it is deemed essential to develop an integrate new algorithms able to decision guidelines on “non-nominal” scenarios. In this context, Politecnico di Torino, in collaboration with the European Space Agency (ESA) and Thales Alenia Space–Italia, developed the Technology Roadmapping Strategy (TRIS), a multi-step process designed to create robust and data-driven roadmaps. However, one of the main concerns with its initial implementation was that TRIS did not account for time and budget estimates specific to the space exploration environment, nor was it capable of generating alternative development paths under constrained conditions. This paper discloses two main significant updates to TRIS methodology: (1) improved time and budget estimation to better reflect the specific challenges of space exploration scenarios and (2) the capability of generating alternative roadmaps, i.e., alternative technological maturation paths in resource-constrained scenarios, balancing financial and temporal limitations. The application of the developed routines to available case studies confirms the tool’s ability to provide consistent planning outputs across multiple scenarios without exceeding 20% deviation from expert-based judgements available as reference. The results demonstrate the potential of the enhanced methodology in supporting strategic decision making in early-phase mission planning, ensuring adaptability to changing conditions, optimized use of time and financial resources, as well as guaranteeing an improved flexibility of the tool. By integrating data-driven prioritization, uncertainty modeling, and resource-constrained planning, TRIS equips mission planners with reliable tools to navigate the complexities of space exploration projects. This methodology ensures that roadmaps remain adaptable to changing conditions and optimized for real-world challenges, supporting the sustainable advancement of space exploration initiatives.

1. Introduction

Although the average individual rarely interacts directly with space, almost all aspects of modern economies connect to it [1]. The space economy, which encompasses all activities and resources that contribute to human progress through the exploration, research, understanding, management, and utilization of space [2], is forecast to achieve USD 1.8 trillion by 2035 in an increasingly connected and mobile world, impacting and creating value for nearly all industries on Earth and providing solutions to many of the world’s greatest challenges [3]. In this context, the space exploration sector has the potential to boost future economic growth and scientific progress [4], but it comes at a time of increasing global income and wealth inequality and unprecedented climate-driven disruption [5,6,7,8]. Research on mechanisms to encourage innovation and dynamism in space while ensuring equitable economic benefits can help identify positive pathways for space exploration.
To realize this vision, global exploration initiatives are increasingly bringing together stakeholders, from space agencies to private enterprises, in collaborative efforts to tackle the challenges of expanding human presence beyond Earth [9,10]. These efforts demand cutting-edge systems and mission architectures, capable of supporting diverse exploration objectives, whether advancing scientific knowledge, establishing orbital infrastructures, or enabling resource utilization. The complexity of planning such missions requires balancing time constraints, cost considerations, and varying levels of technological readiness, factors that can differ greatly depending on the priorities of each stakeholder.
In this context, technological roadmaps, defined as dynamic timetables created to support near and far future long-term and strategic planning while concurrently matching short and long-term goals with particular technological solutions, are crucial for overseeing and planning complex space exploration projects. Despite their crucial role in supporting strategic decisions, technology roadmaps are usually drafted on the basis of expert opinions [11]. However, by introducing subjective biases, political and personal interests can compromise the efficacy of this process and result in conclusions that may not have specific technical justification. To address the pressing need of encouraging science- and technology-based decisions, since 2015 Politecnico di Torino has been developing a methodology named TRIS (Technology Roadmapping Strategy) to support the generation and update of technology roadmap in the space domain. This methodology and tool is meant to support the identification of enabling technologies along with the activities required to pursue technology development, operational capabilities (i.e., high-level functionalities), and building blocks (i.e., space systems, subsystems, equipment, and components), on the basis of a well-defined performance target [11]. While several roadmapping approaches in the literature are totally or partially based on experts’ opinion [12,13,14,15,16,17], TRIS integrates expert knowledge within a rational, objective, and traceable framework. TRIS highlights possible incremental paths towards the final goal thanks to the exploitation of expert knowledge, which forms the foundation for the required inputs, in combination with common System Engineering tools and processes and ad hoc developed tools [18,19,20,21,22,23,24,25,26,27]. In fact, even though the approach is built on rational, objective, and traceable methodology, developed along years of several research activities, expert knowledge remains central in guiding the tool process, defining inputs, validating assumptions, and ensuring alignment with real-world mission needs and constraints. TRIS has been successfully applied to variety of case studies including space exploration, hypersonic transportation, and (re)-entry supporting experts during brainstorming session leading to strategic decisions [20,28,29,30,31,32]. However, one of the major shortcomings of TRIS remains the time and budget allocation. In this ramping-up space economy era, it is extremely important to provide valuable evidence- and technology-based support to strategic decisions and policy making. Additionally, assessing the impact of real-world constraints such as limited budgets and tight timelines has become a critical aspect of roadmap planning. These factors can significantly influence project decisions onto the final planning. Therefore, this paper introduces the following key enhancements to TRIS methodology and tool:
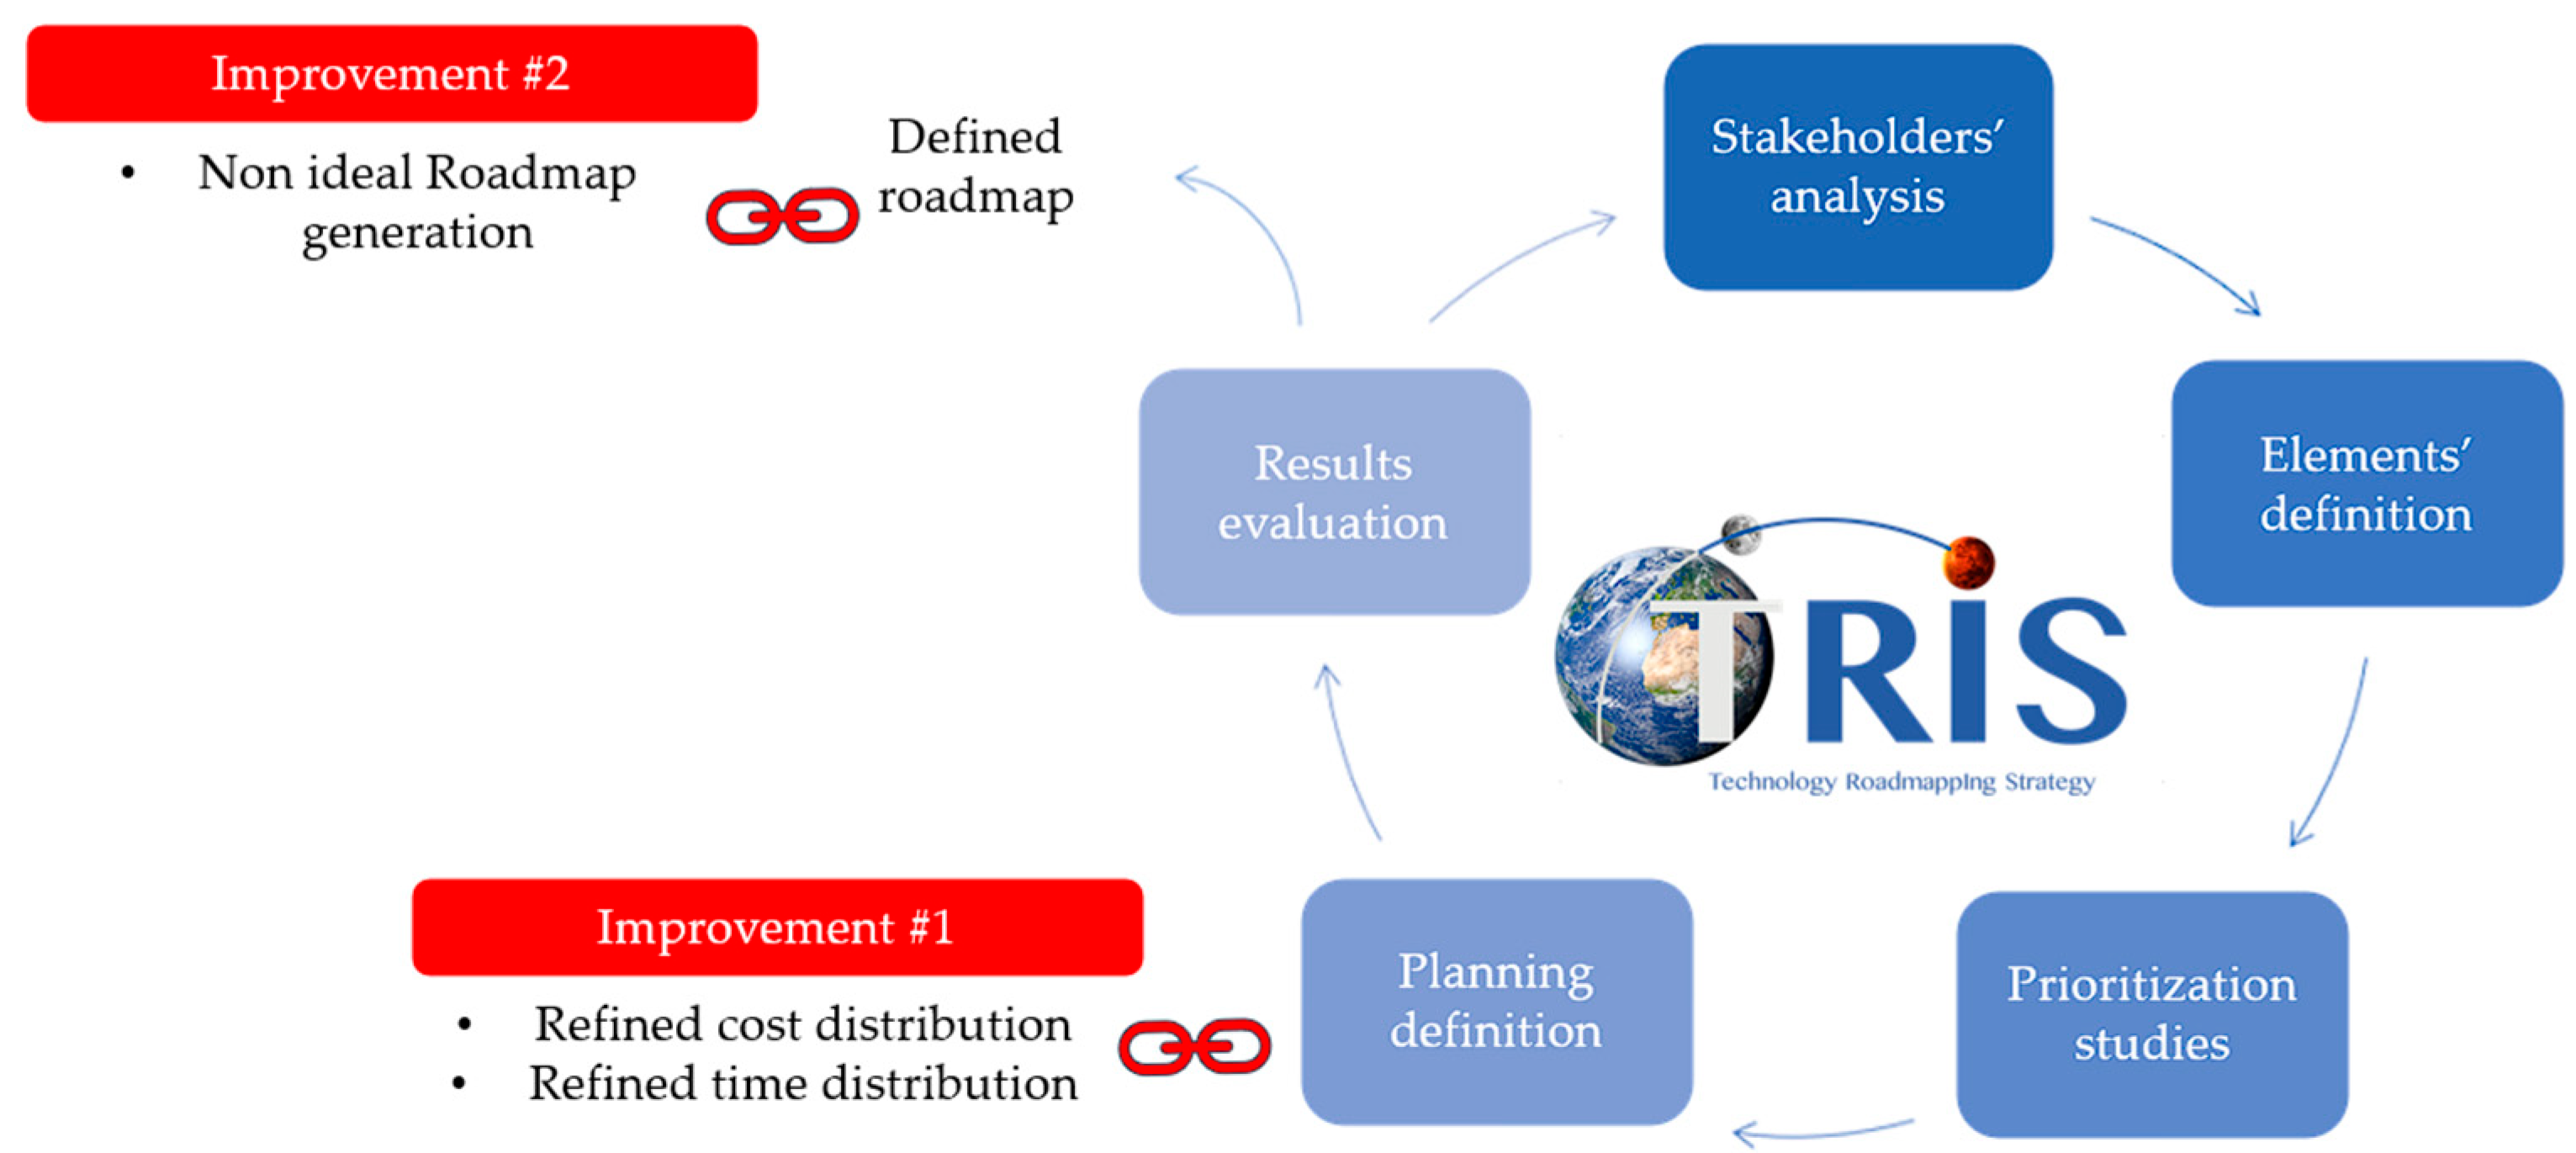
  • Improved Cost and Time Distribution: Time and budget resource estimation has been improved to better suit space exploration with a focus on the evolving scenario of lunar exploration; see Section 3.1 and Section 3.2.
  • Non-Ideal Roadmaps Generation: Development of alternative technology roadmaps to be followed in cases of constrained situations, taking into account both time and financial limitations; see Section 3.3.

2. Technology Roadmap Methodology

2.1. Technology Roadmapping Background

According to the methodology implemented in TRIS, a technology roadmap is the outcome of complex and interconnected activities that aim to identify, prioritize, select, and integrate elements belonging to the following categories (referred to as technology roadmap pillars):
  • Operational Capabilities (OCs): High-level functions responding to a mission statement.
  • Technologies: defined as “the technical know-how that is required for the design, manufacture and test of a space product, including all related processes” [33]. A set of technologies within a specific technical area constitutes a Technology Domain (TD), such as Propulsion, Structures and Mechanisms, or Thermal.
  • Building Blocks (BBs): Physical elements that combine several technologies to achieve specific functions (OCs), such as a technology flight demonstrator.
  • Mission Concepts (MCs) or Activities (ACs): A series of research, development, and testing activities, demonstrative missions, intended to increase the readiness level of each technology, or BB, such as wind tunnel tests (AC) or flight missions carried out by a demonstrator (MC).
As depicted in Figure 1, the TRIS methodology consists of five sequential steps. The flowchart presented is the result of several years of study and iterative development, during which TRIS has demonstrated effectiveness in supporting ESA’s technology initiatives for hypersonic and re-entry space transportation systems [19], as well as in applications within space exploration [22,34,35,36].
The first step involves identifying and categorizing all stakeholders involved in the process, as well as collecting their needs [37,38,39,40]. The second step, Elements Definition, focuses on defining and characterizing the key technological elements, or pillars, relevant to the roadmap [41]. The third step, Prioritization Study, aims to rank the technologies based on the needs previously expressed by the stakeholders [42]. The fourth step, Planning Definition, organizes the prioritized list of technologies and MCs along a timeline [43]. Since integration among technologies is a critical aspect of space systems, reproducing this integration during the Planning Definition phase is essential for identifying economically viable development paths. To achieve this, new methods for allocating budget and time resources are introduced to enhance the accuracy of the planning algorithm. Finally, the Results Evaluation step serves as a synthesis of the entire roadmapping process supporting the analysis of out-of-nominal conditions and the generation of non-ideal roadmaps.

2.2. TRIS Limitation and Proposed Modification

Despite the strengths of the original TRIS methodology, several limitations have been identified that constrain its applicability in complex, dynamic, and resource-limited development contexts. First, the estimation of time and budget resources was derived from limited historical datasets and simplified assumptions, reducing both the accuracy and the adaptability of the tool across different technological domains. Second, the original implementation was primarily designed to produce “ideal” roadmaps, assuming unconstrained environments, thus overlooking real-world limitations such as fixed budgets, strict development timelines, or competing technological priorities.
To address these limitations, the present work introduces two major upgrades to the TRIS methodology. These enhancements focus primarily on the final steps of the process, in particular on the Planning Definition and Results Evaluation steps, where decision making depends critically on accurate forecasting and scenario flexibility.
The first major upgrade introduces a robust, data-driven algorithm for estimating time and budget requirements across TRL transitions. This enhancement builds upon a significantly expanded and diversified dataset and applies trimmed statistical techniques to mitigate the impact of outliers. As a result, the tool can now provide more reliable and domain-sensitive forecasts for technology maturation.
In addition, the tool has been restructured to allow greater planning flexibility. In its earlier version, as described in [18,19], TRIS required a fixed analysis period with a common target date for all technologies to reach the same TRL, reflecting a system-wide readiness approach. The updated version removes this limitation by enabling de-coupled analysis: each technology can now be assigned independent start and end dates, supporting multiple TRL transitions over custom timeframes. This allows for both tailored technology development trajectories and continued support for integrated system-level analyses.
The second major upgrade introduces a new functionality to simulate non-ideal or resource-constrained roadmaps. This feature enables users to assess how technological maturity may evolve under strict budgetary or temporal limitations, offering a practical means to evaluate trade-offs and optimize development paths in realistic programmatic conditions.
These modifications, thoroughly described in Section 3, significantly enhance the tool’s usability and decision-support value for strategic planning in space exploration missions.

3. Technology Roadmap Improvements

The subsequent sections outline recent enhancements to the TRIS tool, which is the primary focus of this paper. Section 3.1 presents the updated distribution of budget and time across various TRL transits, while Section 3.2 details the comparison between the new and the old distribution applied to a database of technologies. Section 3.3 describes the improvement made to the Results Evaluation process.

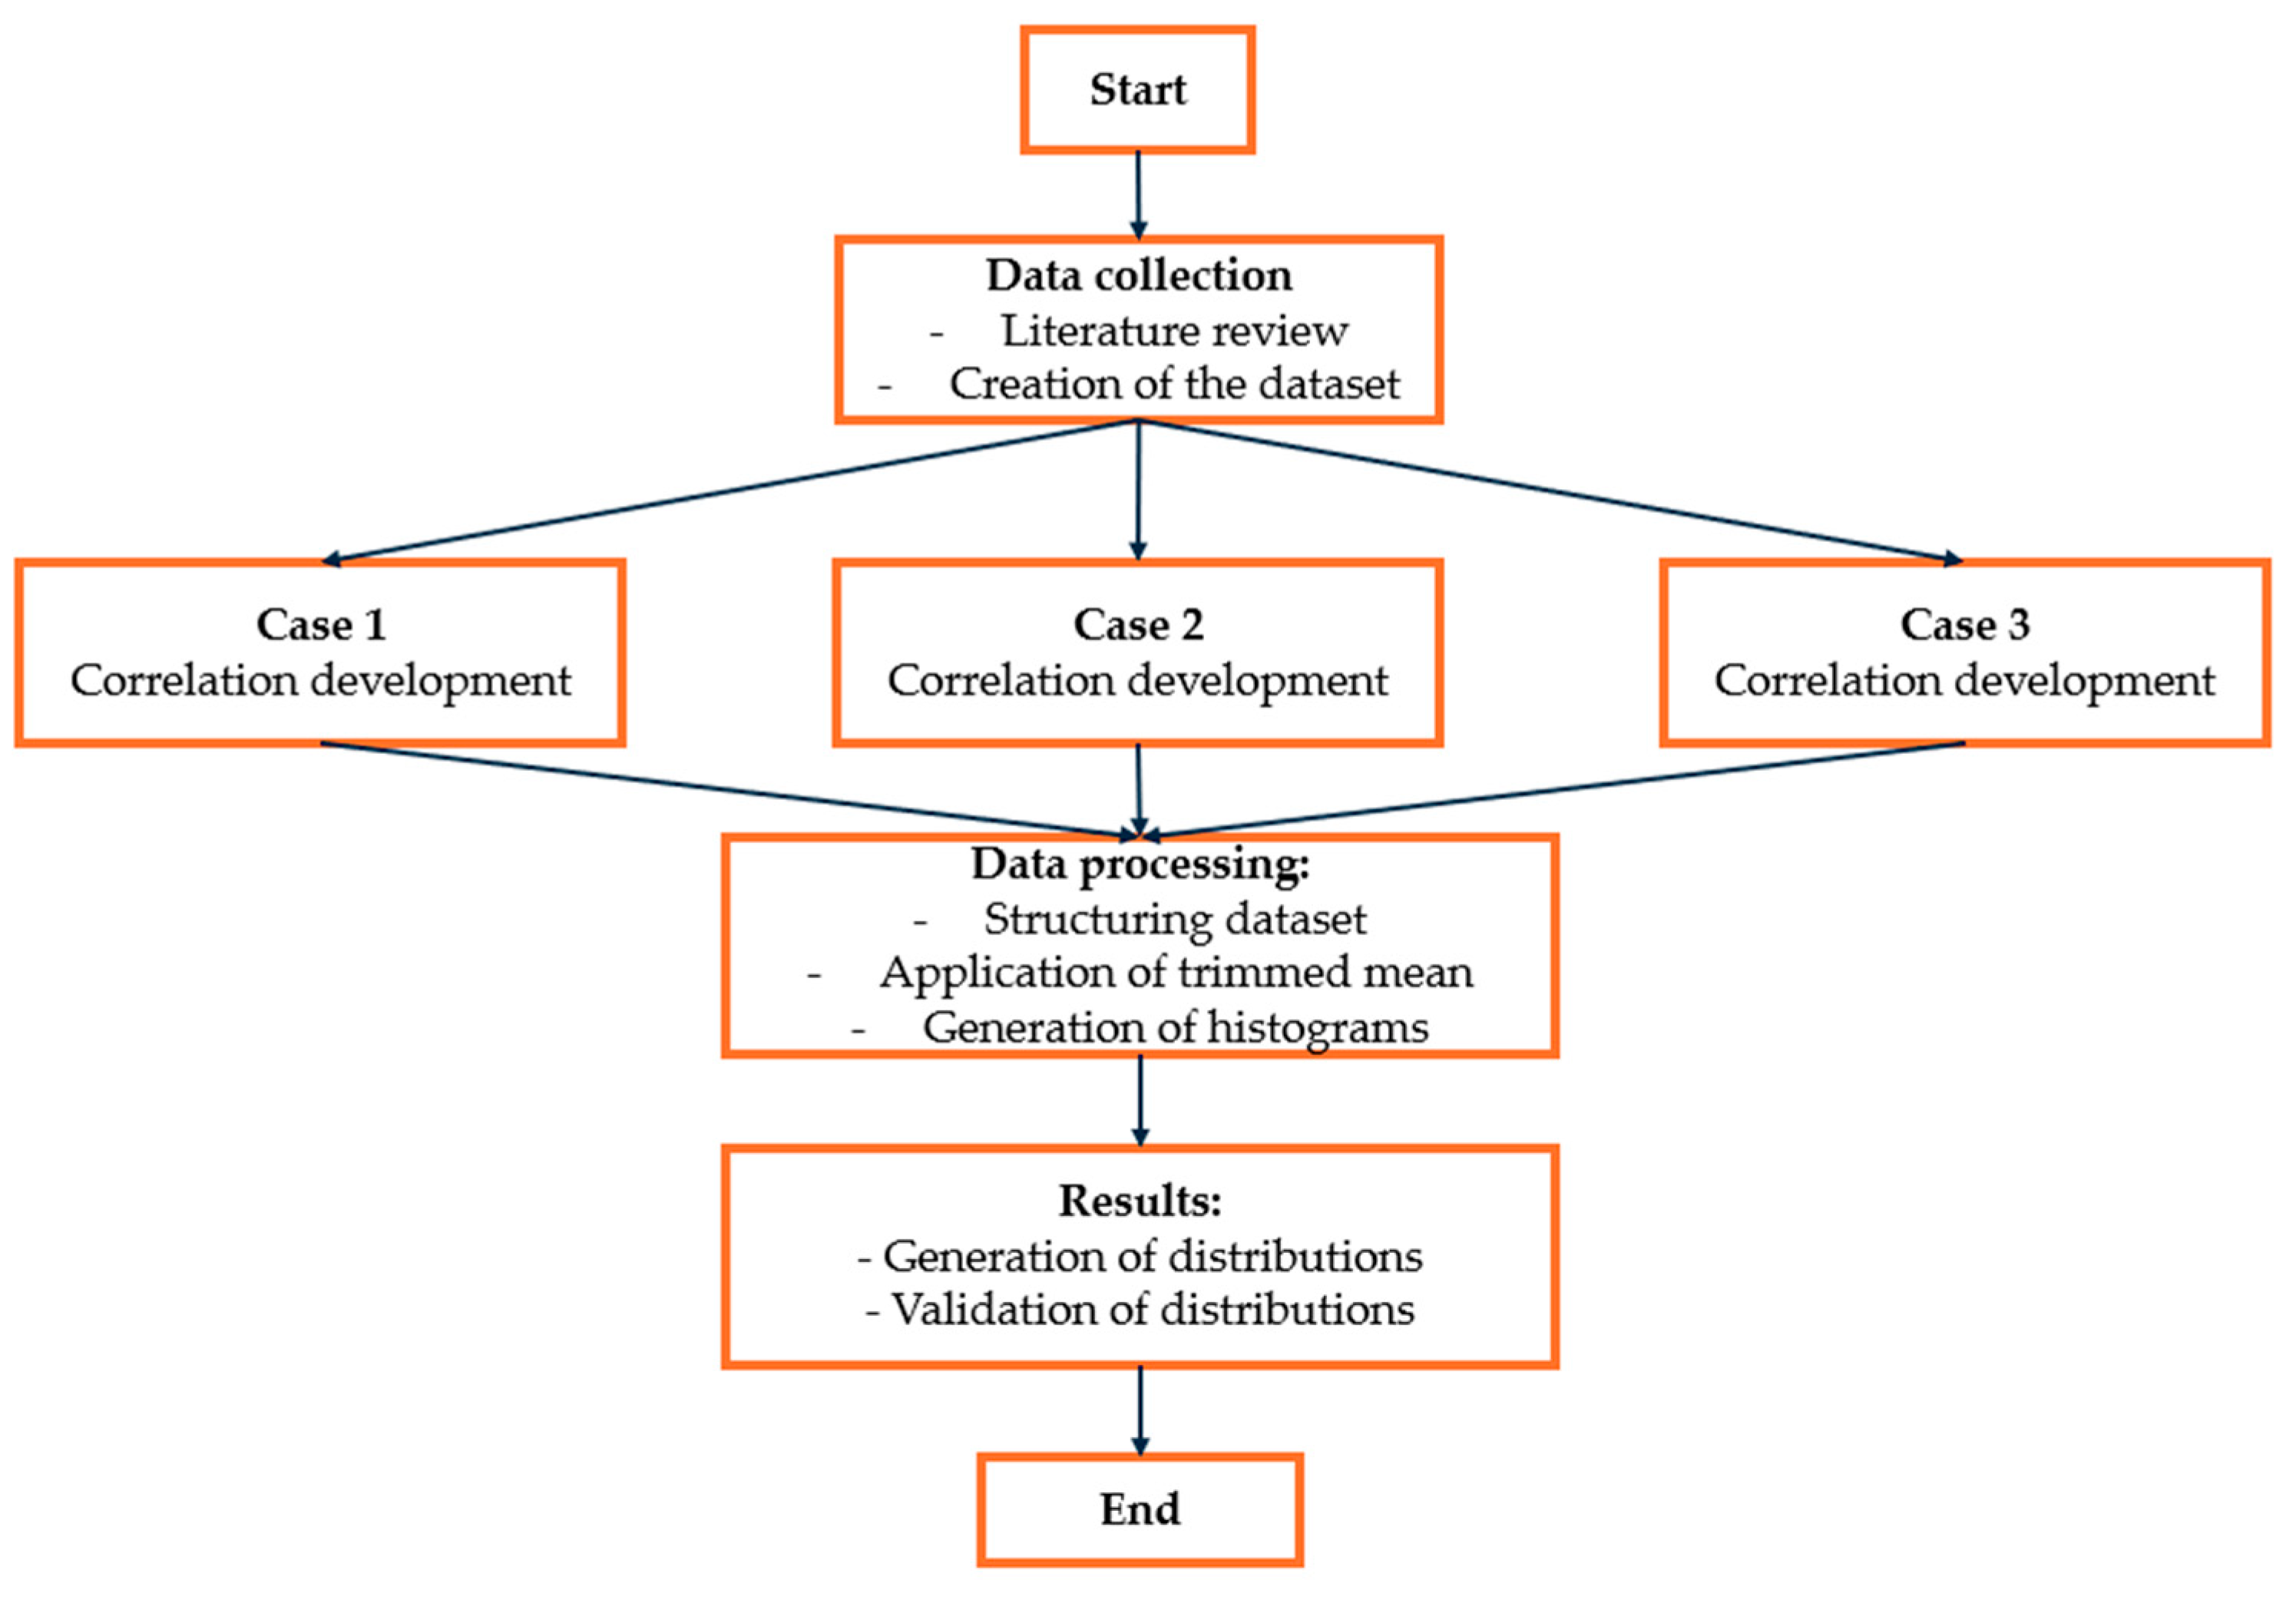
3.1. Cost and Time Distribution

The first major update to TRIS methodology and tool consists in an updated and upgraded estimation algorithm for time and budget resources prediction to more accurately address the evolving requirements of space exploration missions, as depicted in Figure 2.
As explained in Section 2.2, to allow TRIS providing predictions on cost and time resources needed to complete the maturation of each enabling technology, it is essential to build robust mathematical correlations between cost and TRL as well as time and TRL. Looking back to the historical development of TRIS, the first cost and time correlations were built upon very scarce literature data coupled with predominantly expert suggestions [19]. Then, a second budget distribution curve was defined using a semi-empirical model, tailored on the Space Shuttle program data. Then, it was possible to complement this cost-TRL correlation with data from the FESTIP program [44] (a European program for hypersonic technology development) and from the Sänger project [43]. However, to increase the robustness of the methodology and especially to understand the data variability depending on the considered technological domain, an extensive data collection phase, including a review of various literature sources [45,46,47,48,49,50,51], has been conducted. This resulted in a comprehensive dataset that includes detailed information on space exploration technologies, their associated costs, and timelines for different TRL transits, spanning from TRL 1 to TRL 9, and for different technological domains. Please notice that the dataset includes not only unitary TRL transits, but also data about non-unitary transits (e.g., a direct jump from TRL 1 to TRL 3). In these cases, non-unitary TRL transitions have been split into unitary transits based on the budget and time distribution presented in [18,52].
Once the collection of data was completed, based on the collected information, time, and budget allocated for the different TRL transits have been derived. To ensure robustness and reduce the influence of outliers, trimmed values were utilized in this calculation. The use of trimmed values involves excluding a certain percentage of the smallest and largest data points, focusing the analysis on the central portion of the dataset. This approach minimizes the impact of extreme values that might skew the results, such as unusually high or low budgets or timelines driven by atypical projects or anomalies in data collection.
By relying on trimmed values, the derived means more accurately reflect the typical trends for time and budget allocation across TRL transits, providing a stable and representative baseline for further analysis. This method ensures that the subsequent roadmap development and decision-making processes are informed by reliable, central tendencies rather than being disproportionately influenced by outliers.
Finally, it was possible to derive mathematical correlations between cost and TRL as well as time and TRL for various subsystems including Attitude and Orbital Control Systems, Avionics, Electrical Power Systems, Structure, Thermal Control, Propulsion, and Others.
Considering the heterogeneous nature of the retrieved data, three different correlation strategies have been adopted:
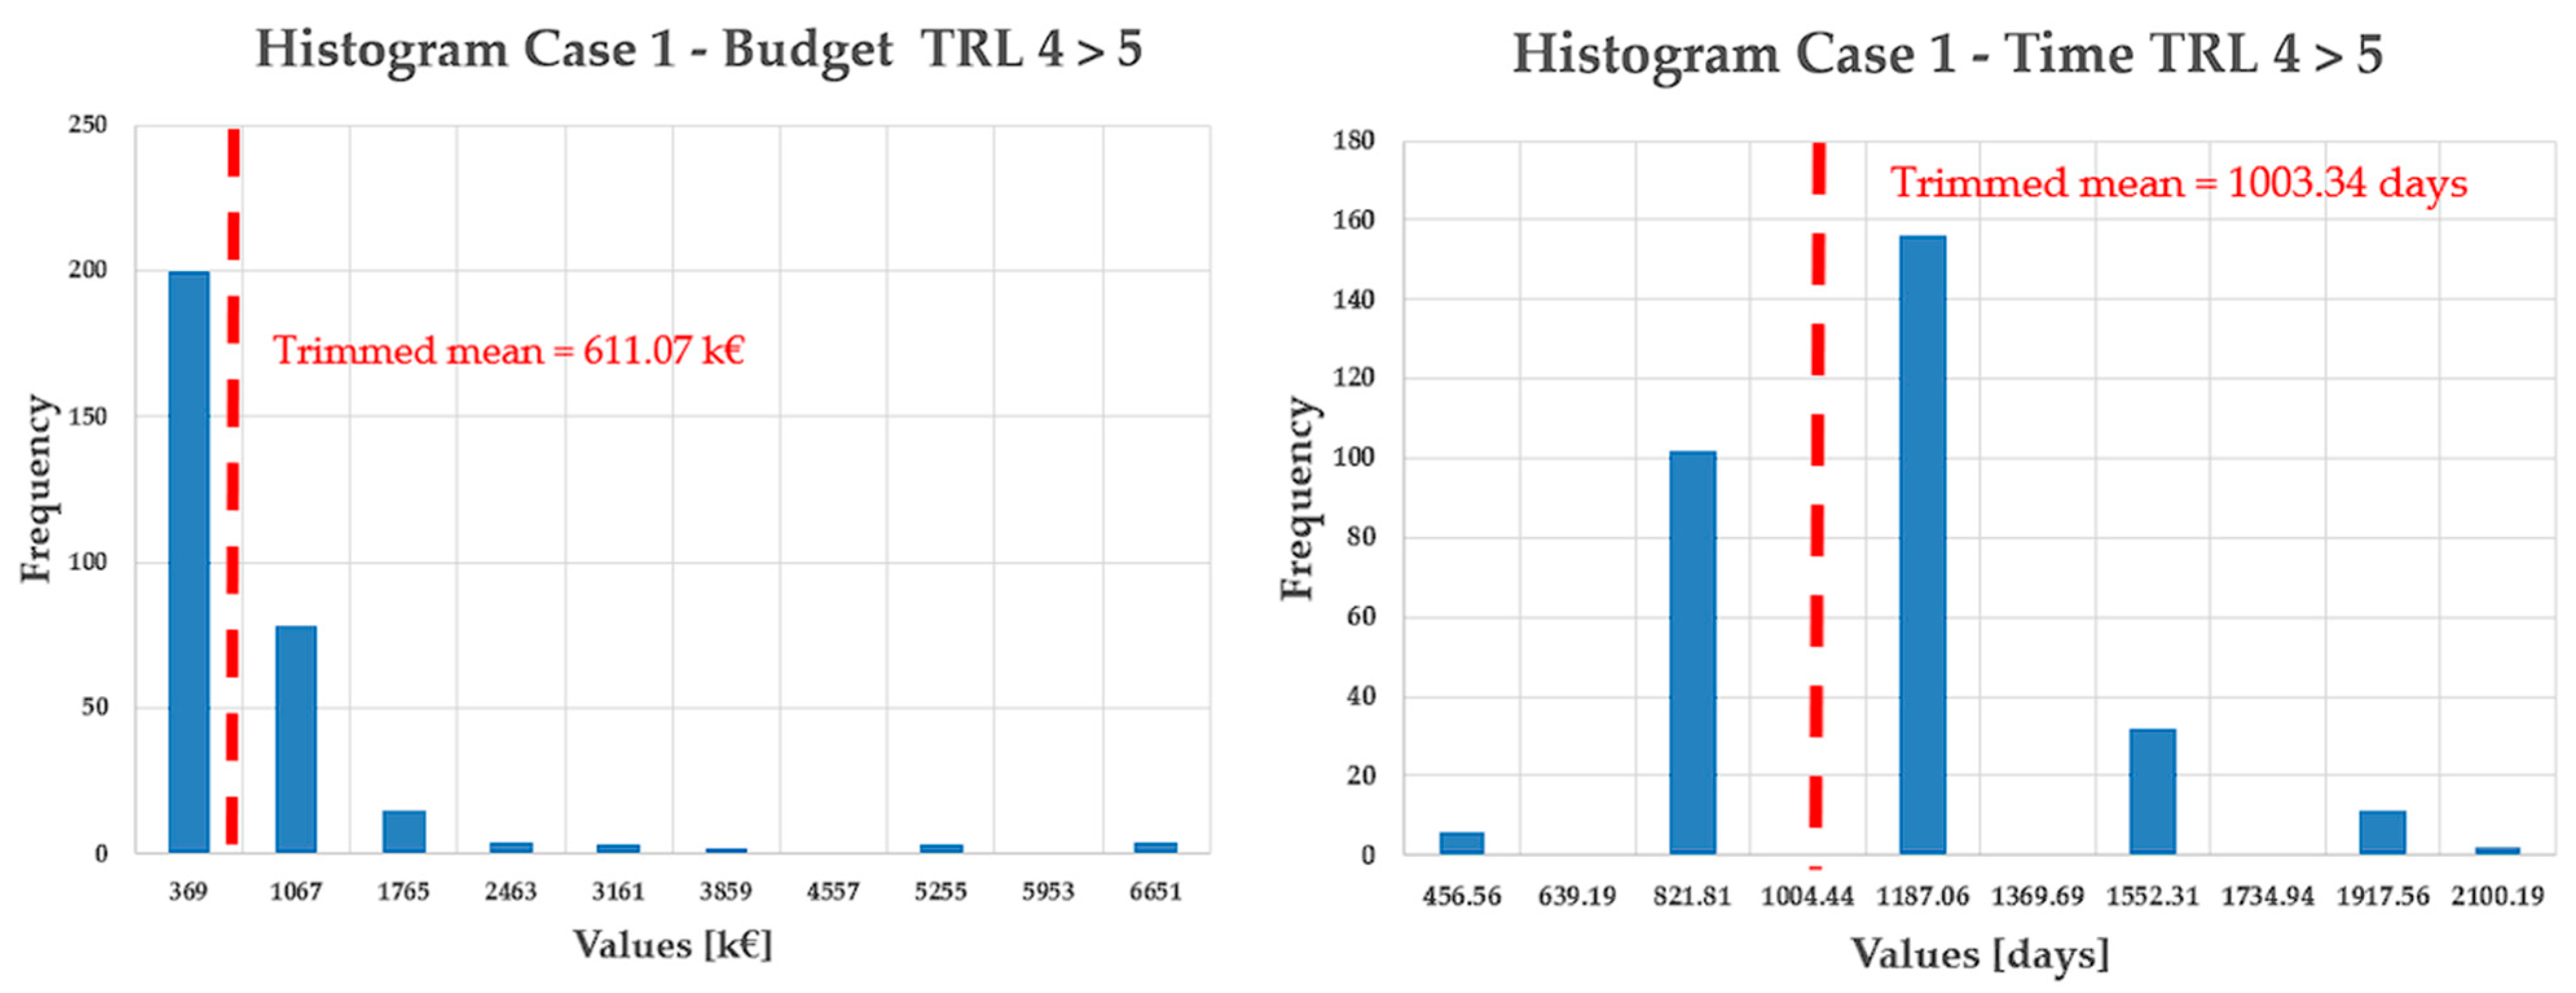
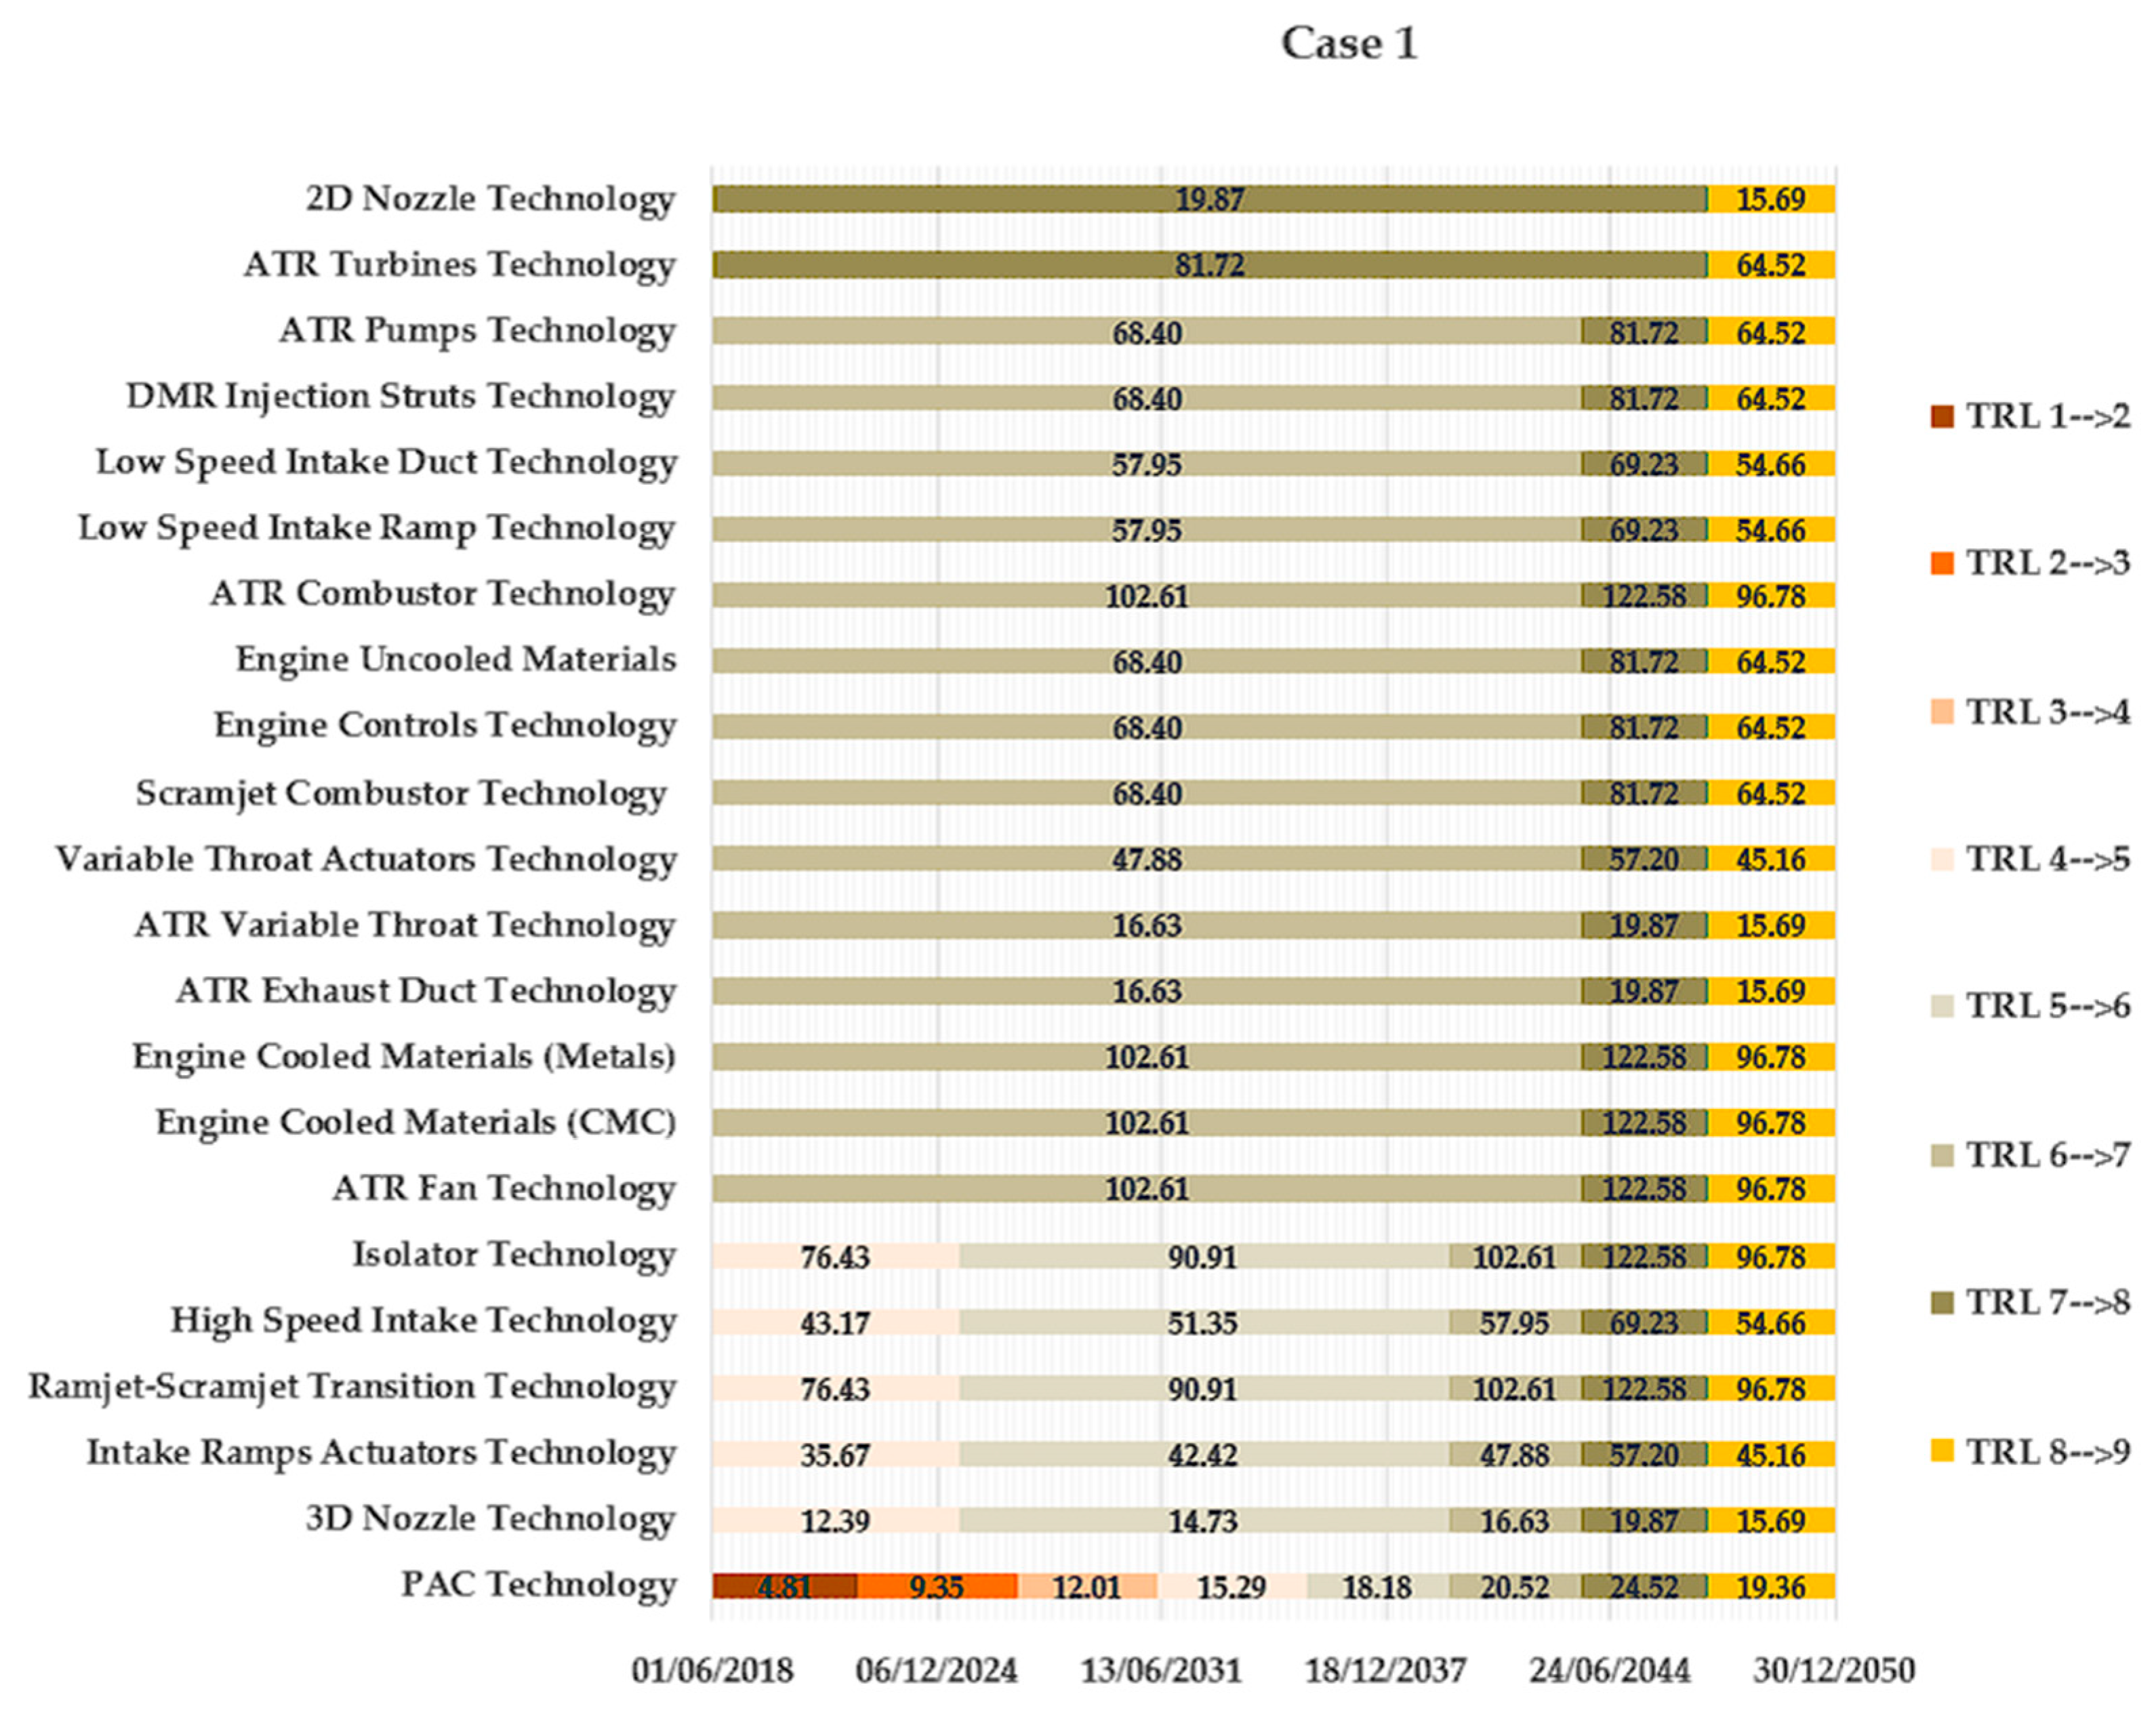
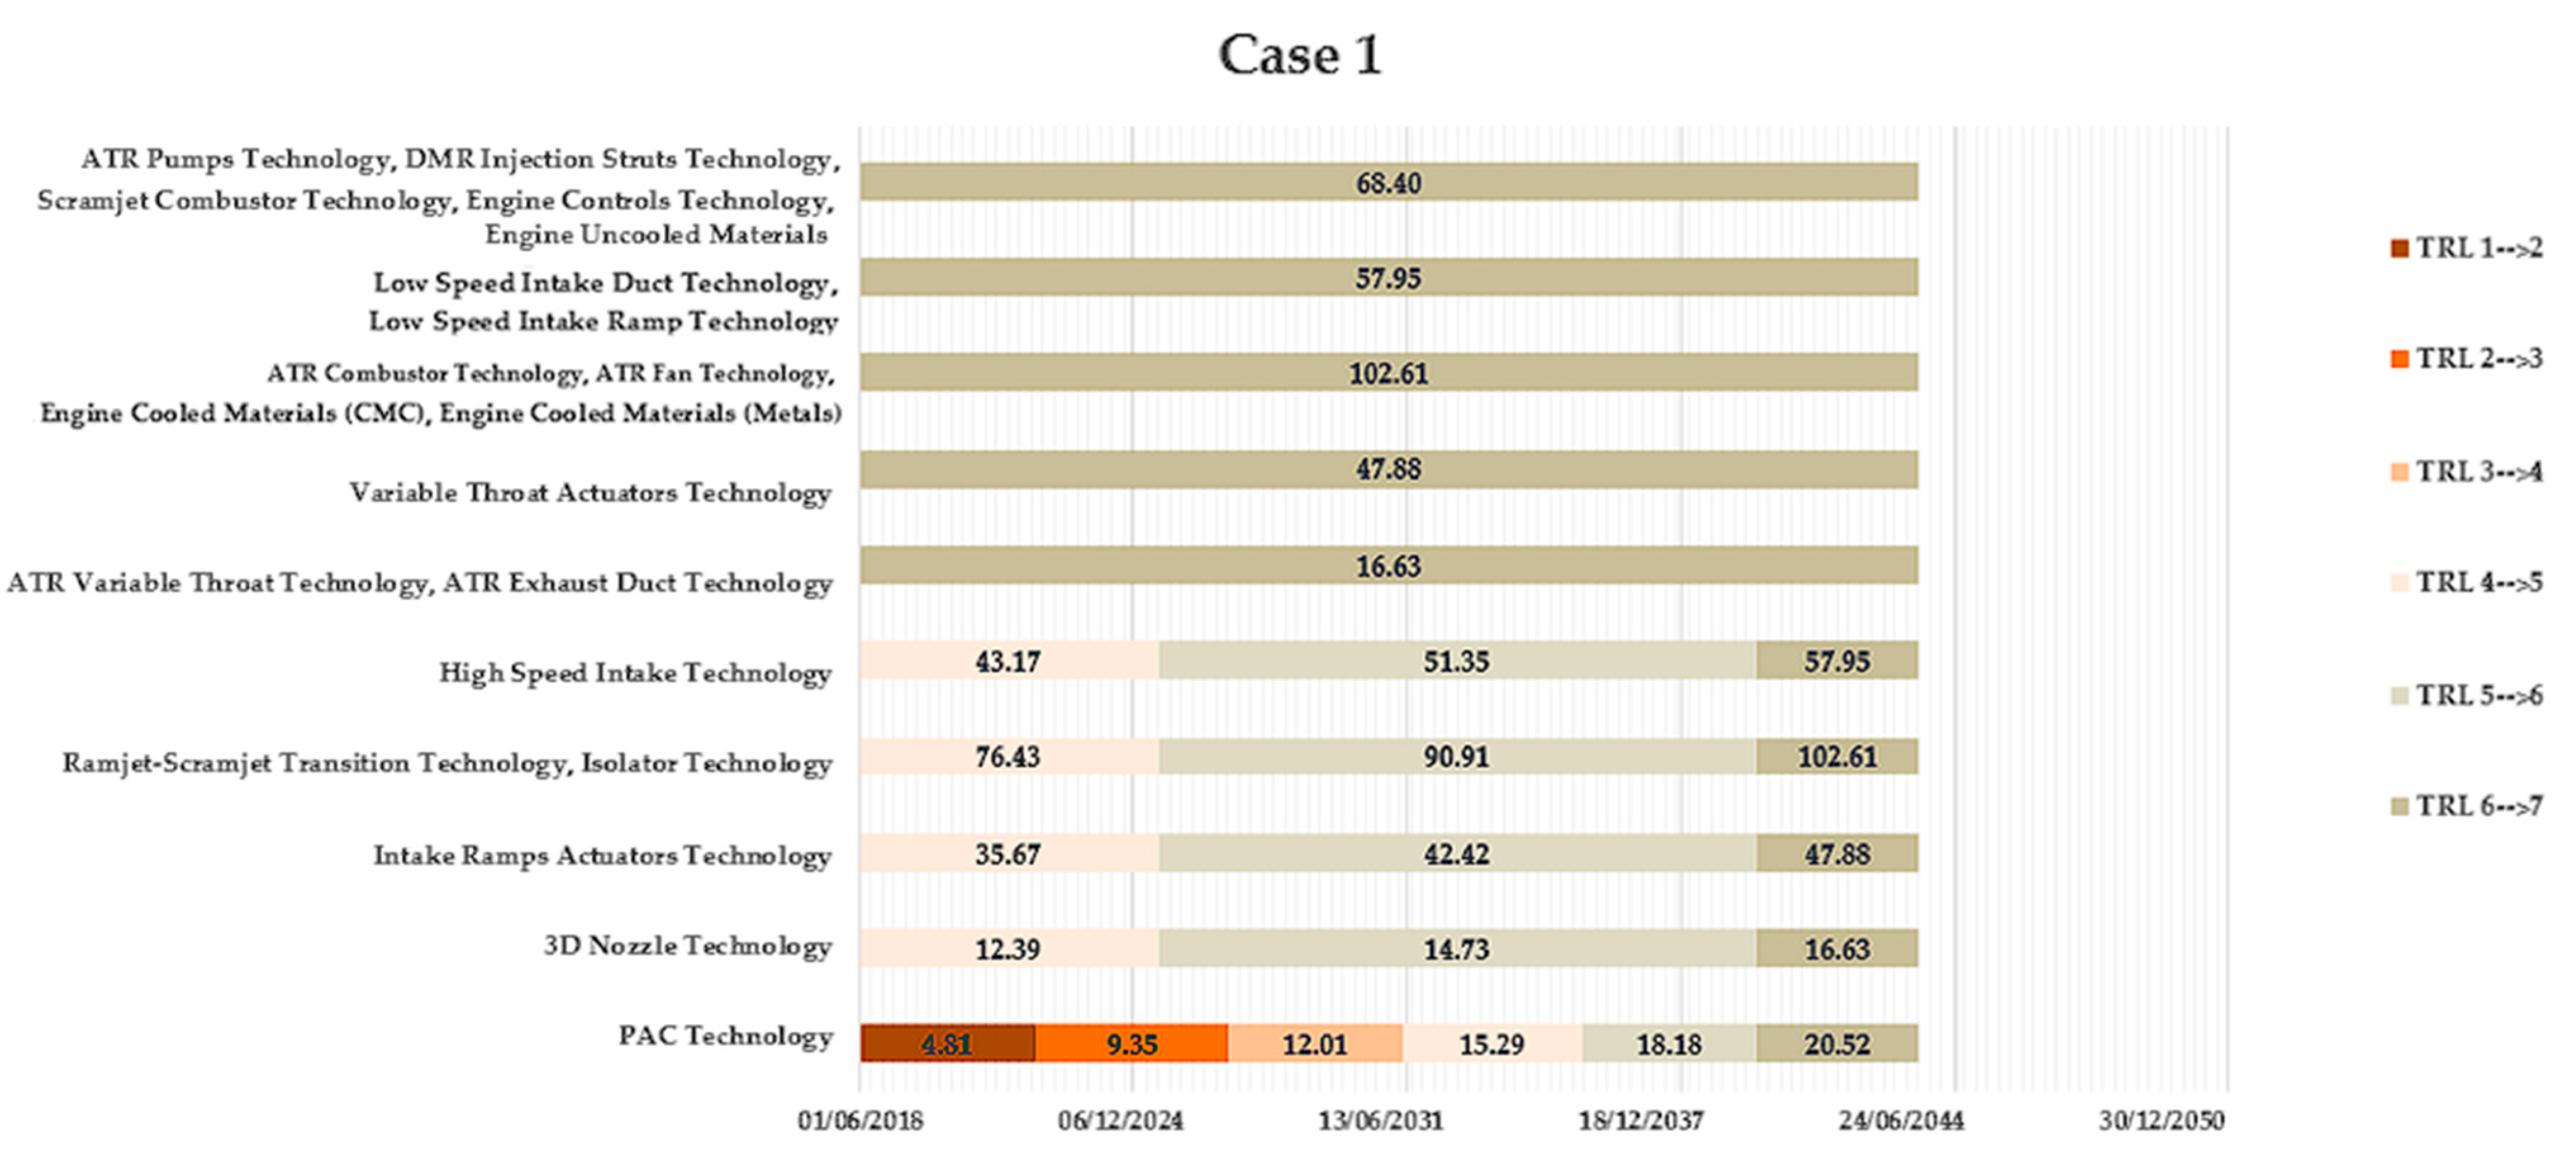
  • Case 1: Focused only on single-unit TRL transitions. This approach examined how costs and time are distributed when transitioning from one TRL to the next, providing a basic understanding of resource allocation for individual transitions. For example, a generic technology transitioning from TRL 4 to TRL 5 required a budget of 611.07 k EUR and 1003.34 days (note that these values correspond to the trimmed values detailed in Figure 3).
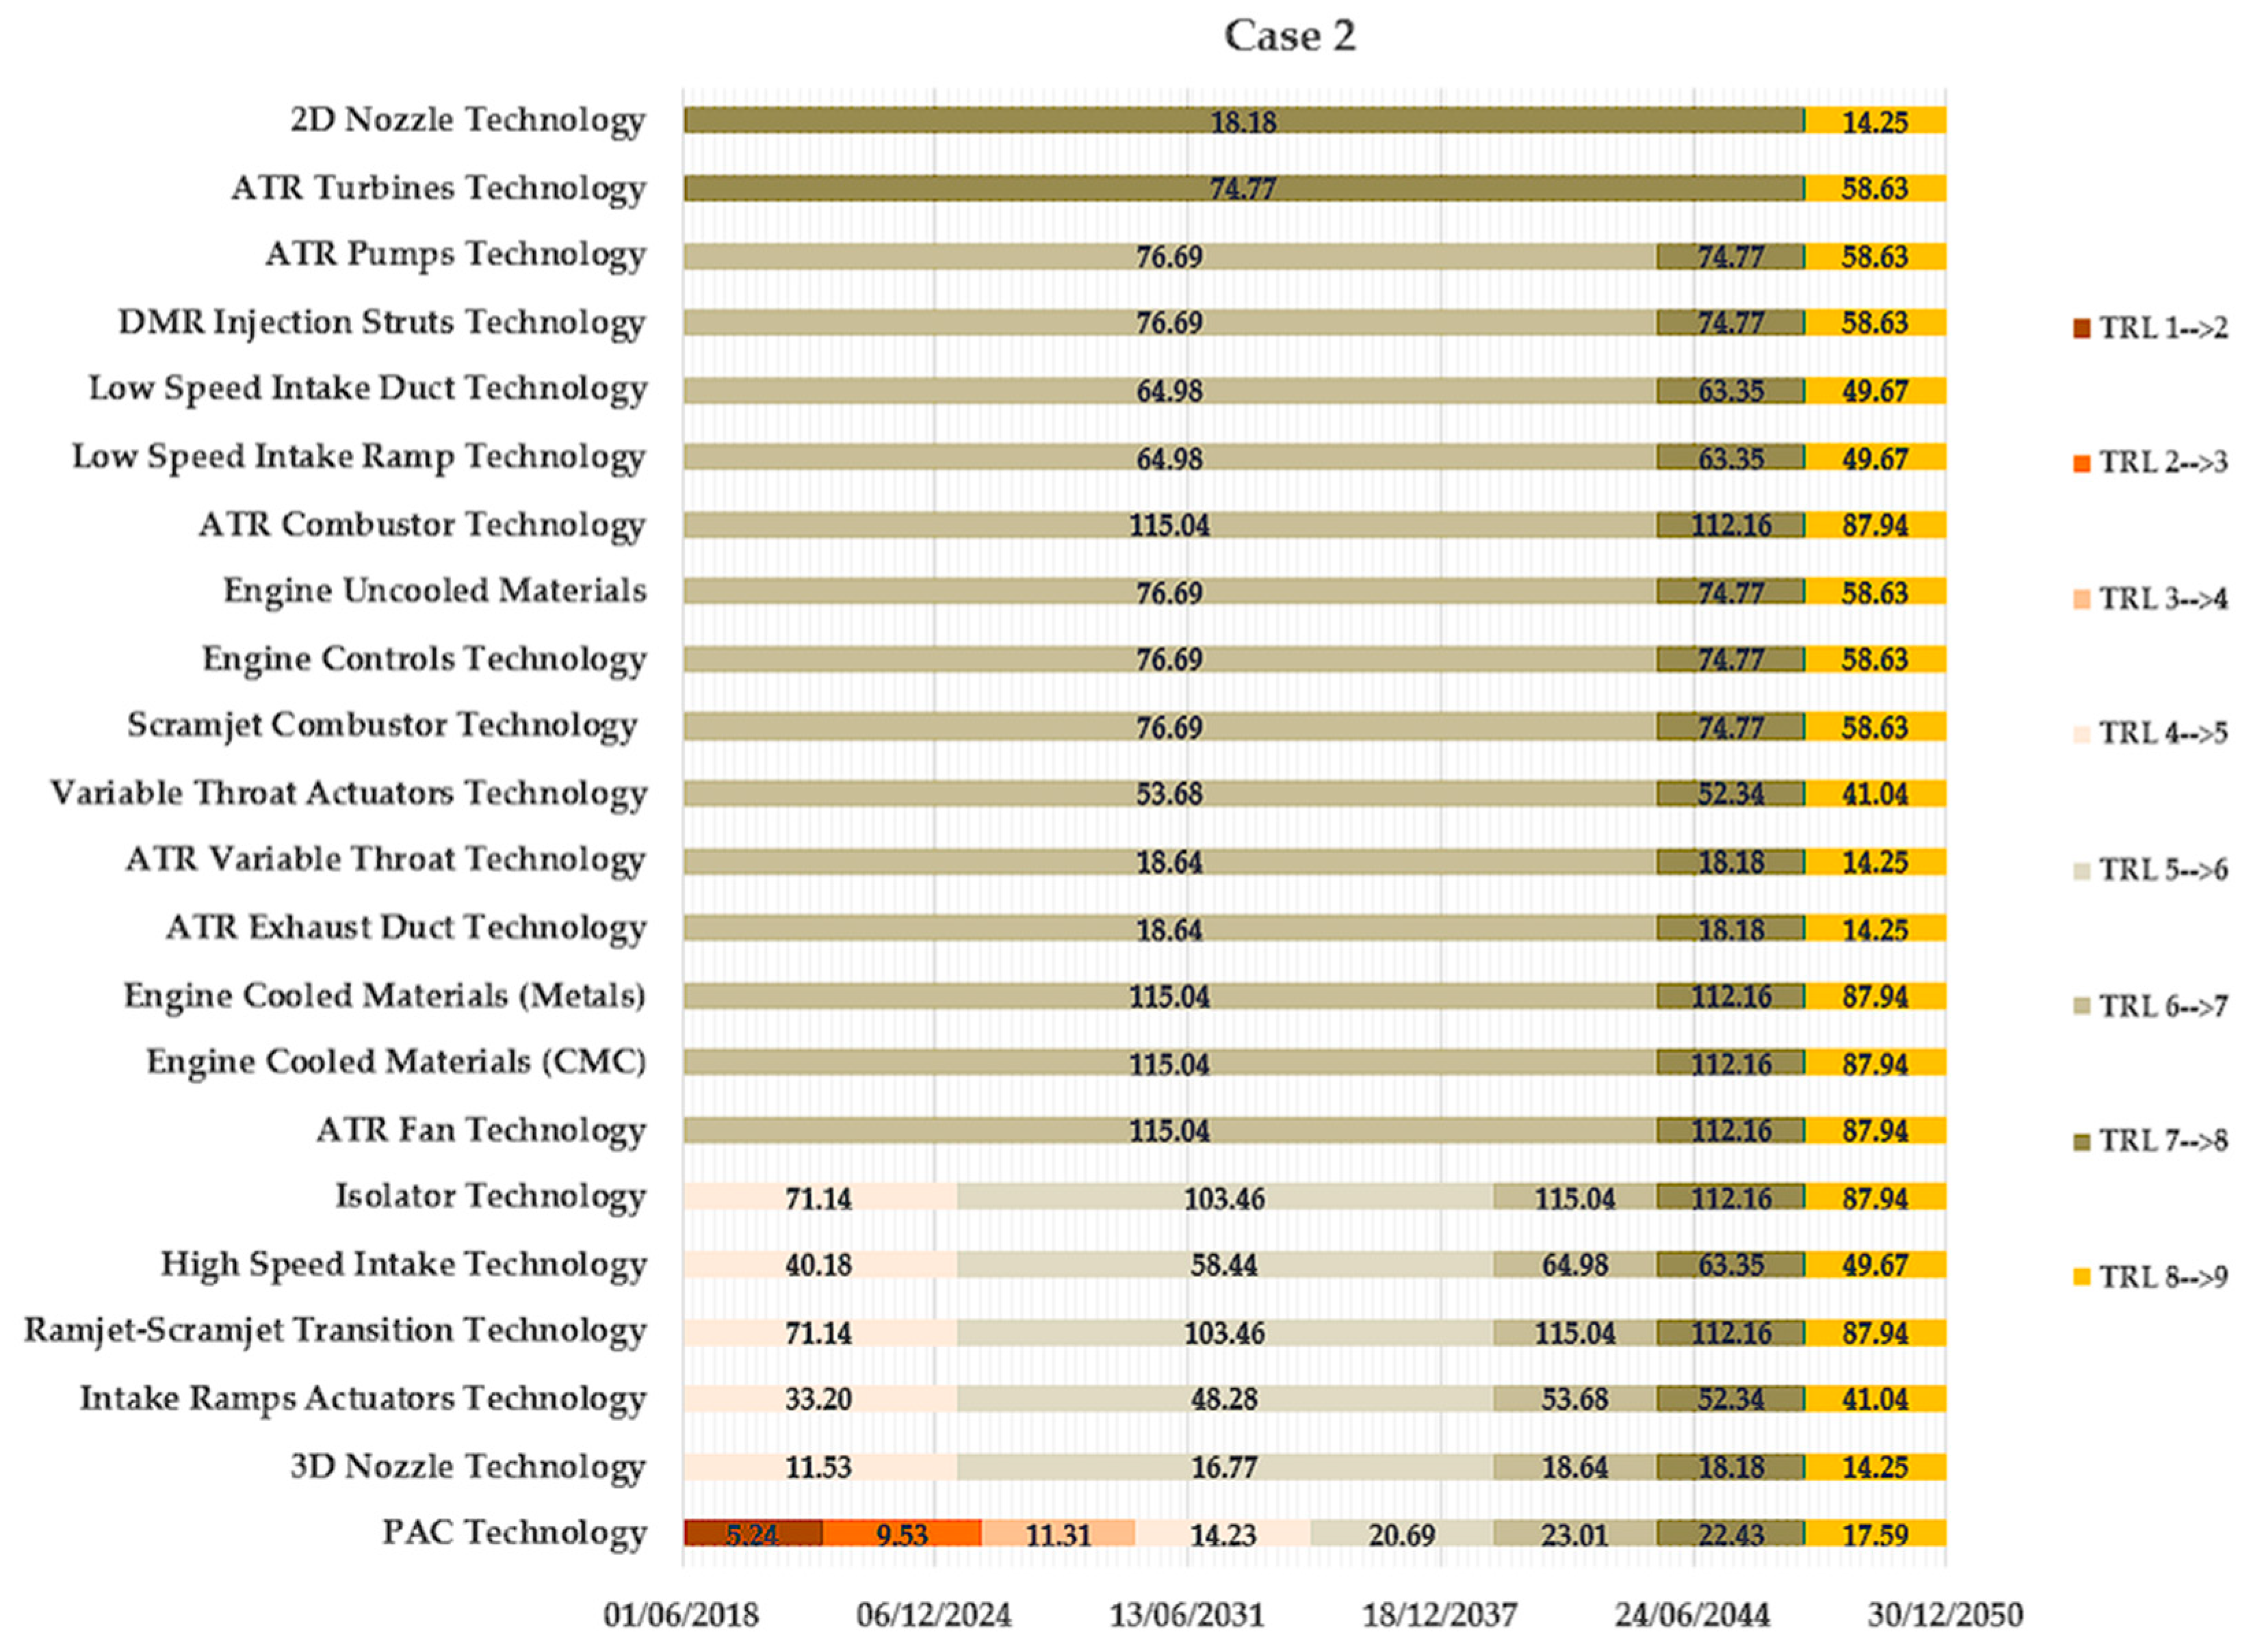
  • Case 2: Prior distribution [18,52] has been used to re-distribute cost and time across non-unitary TRL transitions. As already mentioned, this approach allows increasing the dataset injecting data resulting from splitting non-unitary TRL transition into multiple unitary TRL transitions. For instance, a generic technology transitioning from TRL 2 to TRL 4 with a budget of 200 k EUR and 730 days was split into two transitions. The transition from TRL 2 to TRL 3 was allocated 90 k EUR and 446 days, while the transition from TRL 3 to TRL 4 received 111 k EUR and 284 days, based on the distribution in Refs. [18,52].
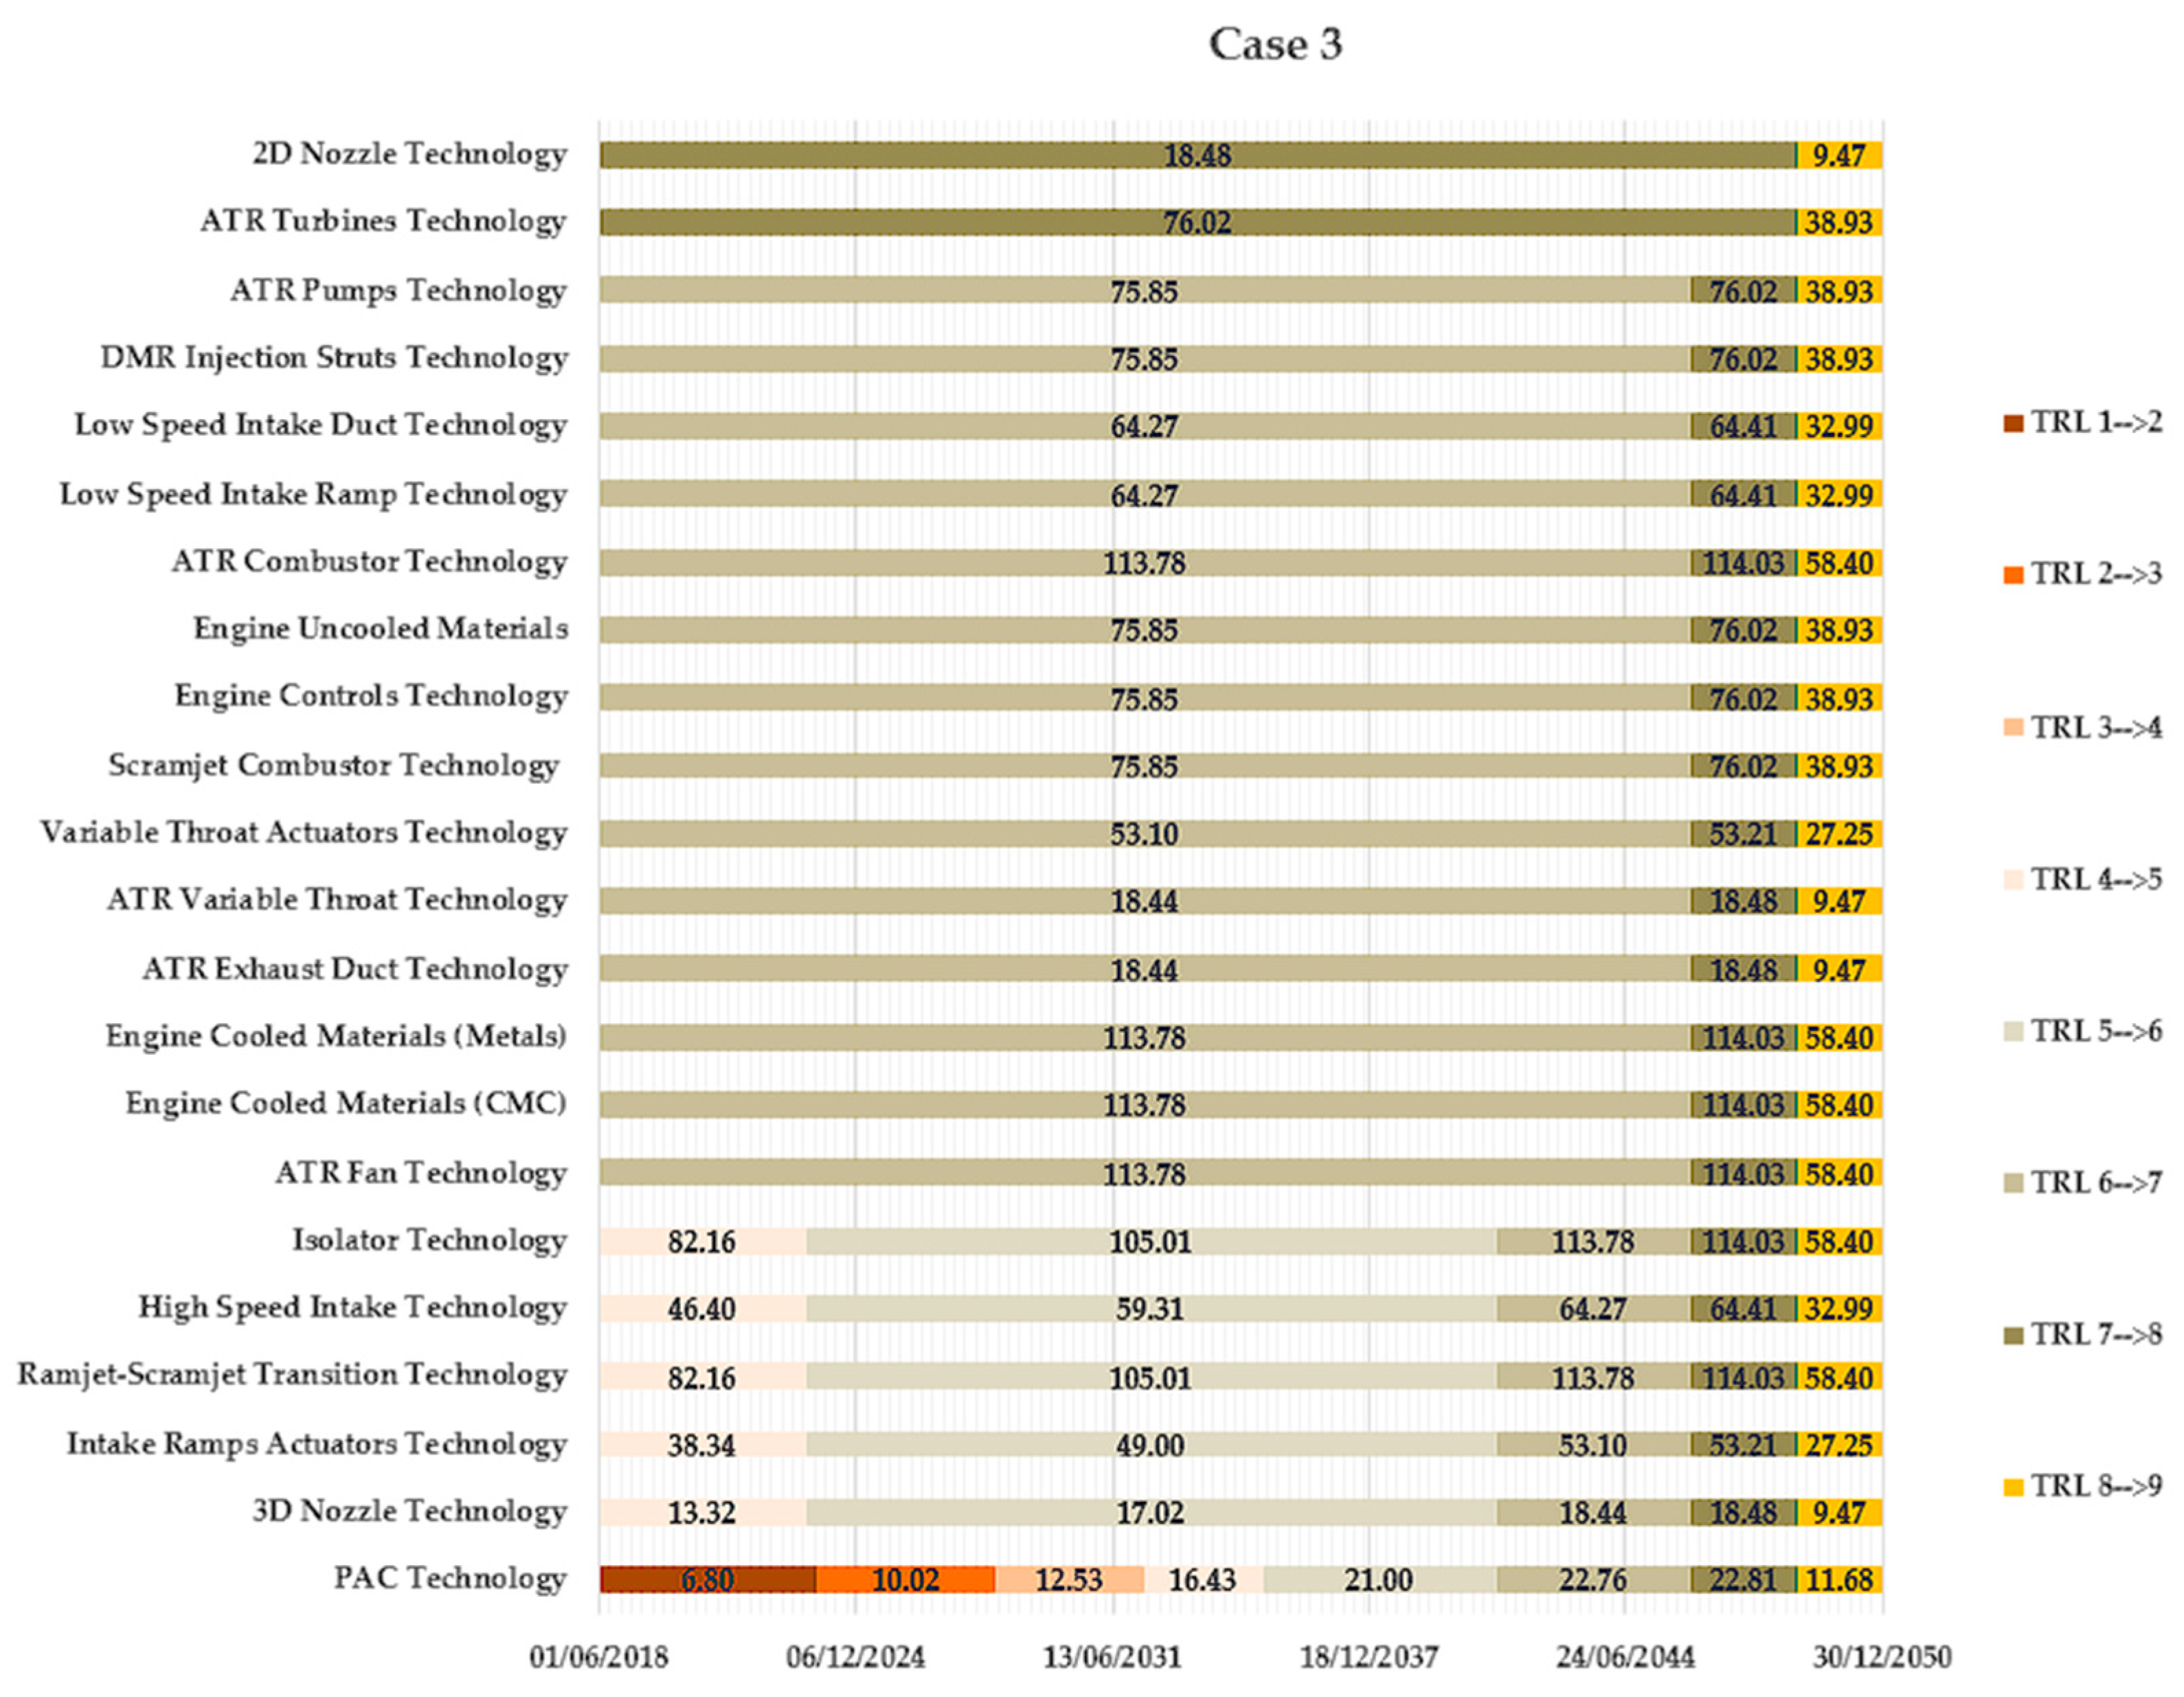
  • Case 3: The unitary distribution (from Case 1) has been used to distribute cost and time across non-unitary TRL transitions (in the same way as Case 2).
Please note that in the case some data about specific TRL transit related to a specific technology domain were not available, the mean value taken from the “TOTAL” distribution was used.
Figure 4 provide visual representations of the various distributions created by considering the entire range of technologies mentioned above. The previous distribution models (both for budget and time) are shown for comparison [18,52]. For clarity, Figure 4 depicts, respectively, budget and time distribution for Case 1, Case 2, Case 3, and Prior distribution based on experts’ opinion, allowing the reader to clearly compare the distributions with each other.
The analysis of these figures reveals significant insights. For budget distribution, the updated model shows that the trends are similar to those in the previous version of the tool, identified as ‘Prior distribution’. This indicates that the general cost allocation approach remains consistent. As already highlighted in [18], great part of development costs of space related technology is related to TRL transits from 6 to 7 and from 7 to 8, when flight demonstrators are designed, produced, and tested. This behavior is clearly confirmed by the data presented in Table 1, which shows the budget distribution across TRL transitions for each of the three cases analyzed. In addition, this is also reported in [53,54,55], where it is highlighted that the biggest part of the budget dedicated to the development of a technology will be between TRL 6 to TRL 8.
As can be noticed, time distributions demonstrate a notable change with respect to the old regression independently from the strategy adopted to cluster and elaborate available data (i.e., case 1, case 2, or case 3). Table 2 presents a breakdown of the time distribution percentages, and it is evident that the new data suggests an almost linear relationship between time and TRL. This can be explained considering that the methodology disclosed in this paper evaluates individual technologies independently, while old algorithms were based on aggregated data, where technologies were already integrated in system-wide development processes. For instance, while gathering data from the Space Shuttle program, in the old trend, non-linear behavior can be led back to some integration effects. It is usual that some of the most mature technologies had to be frozen in their development until the others were mature enough to proceed with their integration and test. Conversely, the non-aggregated data used in this paper show that, once a technology reaches a specific TRL, it can ideally continue advancing without “waiting” for other technologies, resulting in a more linear progression in development timelines. Therefore, thanks to this improvement, TRIS is now capable of replicating both the system and technology development processes thanks to different routines.

3.2. Distribution Validation

To validate the distribution obtained and thoroughly described in Section 3.1, an independent dataset has been utilized. This dataset, which belongs to an ESA proprietary database and was provided to PoliTo as part of a GSTP contract [30], mainly relies on expert assessments. Table 3 presents a summary of the percentage differences resulting from the application of time and cost distributions. In this validation process, the total distributions for both three cases were used. It is important to note that, concerning cost data, only aggregate values were available, without specific breakdowns for individual TRL transitions. The comparison was performed by applying the previously established distribution, already validated by experts, to the CaC (Cost at Completion) model.
Even though a portion of the percentage differences exceeds 5%, they remain within a 20% range, which is considered acceptable given the nature and intended use of the methodology. This suggests that the methodology provides a reasonable approximation of technological development patterns. Moreover, it is important to highlight that the roadmapping methodology presented in this paper is primarily intended for use in the early stages of a project. Rather than serving as an absolute predictive tool, it is designed as a support system to assist stakeholders in making informed decisions and evaluating potential development pathways. Additionally, one of the strengths of the methodology lies in its iterative and updatable nature: as more data becomes available throughout the project lifecycle, the roadmap can be refined accordingly, thereby progressively reducing uncertainty and improving accuracy. The results presented in this paper confirm the reliability of the proposed approach, reinforcing its value as a tool for early-stage project planning. While refinements could further enhance its accuracy, the methodology already offers a structured framework to evaluate technological and financial feasibility with reasonable confidence.

3.3. Post-Results Evaluation

The final enhancement focuses on generating alternative technology roadmaps tailored to realistic scenarios where budgetary and time constraints are critical. This functionality is crucial for navigating the complexities of space mission design, which often involve tight financial and temporal limitations. By incorporating advanced algorithms such as Monte Carlo Tree Search (MCTS) and Markov Decision Process (MDP), the tool provides robust, data-driven solutions for optimizing mission planning under uncertainty. These two algorithms were selected for their strong suitability to problems involving uncertainty and constrained resources, as they not only optimize decision-making outcomes but also rely on probabilistic reasoning, unlike deterministic planning methods.
MCTS is a simulation-based search method well-known for its efficiency in tackling complex decision-making challenges in uncertain and dynamic environments. This algorithm operates by constructing a tree-like structure where each node represents a potential action, and branches illustrate the possible outcomes of these actions [56]. The strength of MCTS lies in its ability to iteratively simulate and evaluate the value associated with different action sequences, enabling a well-structured exploration of a wide array of potential decision paths [56,57,58]. By balancing exploration (searching new options) and exploitation (selecting the best-known paths), MCTS ultimately identifies the most promising strategies from a vast solution space.
In a TRIS context, MCTS can efficiently analyze various planning strategies and explore the best routes to achieve specific objectives. For instance, if the target is to reach TRL 6 for a wide range of technologies when constrained by budgetary and time constraints, MCTS can simulate different strategies by considering all the possible combinations, providing diverse paths that meet the mission’s goals while optimizing time and resource use. The algorithm’s capability to explore and evaluate complex action sequences is particularly valuable in scenarios with numerous interdependent variables, where manual planning would be insufficient or inefficient.
Complementing MCTS, the Markov Decision Process (MDP) serves as a key modeling framework for sequential decision making under uncertainty. MDP models decision problems as a series of states and actions, linked by probabilistic transitions and associated rewards. By defining the dynamics of state transitions mathematically, MDP provides a rigorous foundation for evaluating long-term strategies. In this setup, each decision not only has an immediate effect but also influences future states, requiring planners to consider both immediate outcomes and long-term repercussions. A distinctive feature of MDPs is that the next state depends only on the current state and the selected action, not on the path taken to reach that state, making it well suited for modeling the progressive maturation of technologies across TRLs.
The integration of MCTS and MDP forms a powerful, dynamic decision-making system. MCTS acts as the exploratory engine, simulating possible action sequences and building a decision tree, while MDP provides a probabilistic assessment of state transitions, guiding the evaluation of potential actions. The two algorithms work synergistically: MCTS explores various strategies and MDP evaluates them within a structured, probabilistic framework, offering a comprehensive approach to optimizing decisions in uncertain environments. This dynamic collaboration is commonly employed in domains where strategic decision making is paramount, such as robotics, gaming, and autonomous systems, but also in aerospace mission design [57].
Within TRIS, MCTS and MDP are seamlessly integrated to guide the exploration and optimization of decision paths. Users can interact with the tool to specify budgetary and temporal limitations, after which the algorithms work together to explore a wide range of scenarios. The resulting alternative roadmaps are presented in a table and Gantt charts format, displaying key metrics such as cost and timeline. This structured output enables users to compare different strategies and select the most feasible roadmap that aligns with project objectives.
This enhancement equips mission planners with a practical and powerful tool for scenario analysis and decision making. By visualizing multiple paths and their associated outcomes, planners can make more informed choices, balancing risks and opportunities. The integration of MCTS and MDP provides a comprehensive framework that not only identifies optimal strategies but also offers insights into the trade-offs between cost, time, and mission success. As a result, TRIS supports strategic planning with a level of precision and adaptability previously unattainable, ultimately contributing to more efficient and reliable space mission designs.

4. Case Study

This section aims at describing the application of the upgraded TRIS methodology in the framework of different projects, e.g., assessing the potential of a high-speed transport vehicle to reach TRL 6 by 2036 with respect to key technological, societal and economical aspects. In particular, to appreciate the improvements to the tool, a simulation using STRATOFLY as a case study has been produced, as was performed in [18].

STRATOFLY

This section describes the application of the enhanced TRIS methodology within the H2020 STRATOFLY project to evaluate the feasibility of achieving TRL 6 for a high-speed transport vehicle by 2035, considering technological, societal, and economic factors.
The STRATOFLY MR3 vehicle, derived from the LAPCAT MR2.4 concept, features a waverider design with a dorsal-mounted propulsion system. It uses six Air Turbo-Rocket engines for supersonic speeds and a Dual-Mode Ramjet for hypersonic travel. The project emphasizes the importance of advancing the propulsion technologies, detailed in Table 4, to meet the TRL 6 goal by 2035, as their development is critical to the vehicle’s success.
To thoroughly assess the robustness and flexibility of the upgraded TRIS methodology, three separate simulations were performed. Each simulation leveraged one of the three different distribution strategies developed and discussed in Section 3.1 (Case 1, Case 2, and Case 3). This approach allowed the methodology to be tested under varying assumptions of cost and time allocation across TRL transitions.
By running simulations with each of these strategies, it was possible to evaluate the sensitivity of the roadmap outcomes to different modeling assumptions. The resulting plannings were compared with the analysis performed in [18].
As can be seen from Figure 5, Figure 6, and Figure 7, which represent, respectively, the Techs planning by applying the case 1, case 2, and case 3 distribution, the results obtained are in line with what were the expectation of the project (i.e., TRL 6 by 2036, TRL 7 by 2043, and TRL 8 by 2047). It is also worth noting that the values displayed inside the bars in the figures represent the TRL transition costs in million euros (M EUR). Moreover, Table 5 provides a comparative overview of the results obtained through the new simulations versus the original simulation presented in [18]. Specifically, the table summarizes the predicted dates for each TRL transition across all four simulation strategies (i.e., Original, Case 1, Case 2, and Case 3) for each TRL interval. This comprehensive comparison enables a direct assessment of how the new distribution models affect the expected timing of technology maturation.
From the data presented, it is evident that while minor variations in the predicted dates do exist, particularly in the mid to high TRL intervals, the overall roadmap trends remain consistent across all cases. These differences highlight the enhanced model’s flexibility in adjusting for different data clustering strategies without compromising the roadmap’s validity.
Importantly, Case 3 consistently yields results closest to the original simulation in the higher TRL transitions, indicating that its underlying assumptions best replicate the system-level roadmap derived from expert-informed logic in the earlier study. Meanwhile, Case 2 and Case 1 show slightly more conservative or optimistic estimates depending on the specific TRL range.
As detailed in Section 3.3, a post-results analysis module has been defined and implemented within the TRIS methodology. The purpose of this analysis is to generate alternative “out-of-nominal” or “non-ideal” roadmaps in scenarios where critical constraints such as limited cost and time resources are imposed on the technology development plan. This functionality serves a dual purpose. On the one hand, it enables users to explore feasible roadmaps that identify which technologies can realistically evolve within the defined constraints. On the other hand, it offers a means of verifying whether specific time and budget constraints can be met within a given roadmap structure.
Figure 8 illustrates the results of this analysis for a test case in which two constraints were set: all technologies must reach TRL 7 by 4 October 2043 and the total allowable cost is EUR 11,837 million [18]. As shown in Figure 8, the analysis confirms that both constraints are satisfied, indicating that the development plan remains feasible under the specified limitations.

5. Conclusions

This paper presents a novel methodology aimed at improving the generation and updating of technology roadmaps by: (1) improving time and budget resources estimation routines to better capture the peculiarities of the advancing lunar exploration scenarios and (2) developing and implementing algorithms supporting the generation of alternative non-ideal technology roadmaps for constrained budget scenarios, with time and financial limitations.
The enhanced time and budget distribution make possible the improvement of the planning routines for better fitting the space exploration scenario. By developing and applying various analytical methods, including unitary and non-unitary distributions for TRL transits, the tool provides a more accurate assessment of resource requirements. Validation against an independent expert-based ESA dataset showed that deviations between estimated and reference values remained within 20%, confirming the robustness of the approach since the early-stage assessments. This capability is crucial for managing complex space missions where budget and schedule constraints are crucial.
Eventually, the implementation of MCTS and MDP algorithms enables the generation of alternative technology roadmaps within constrained budgets and timelines. This methodology demonstrated the ability to generate mission-consistent development schedule capable to meet specific cost and time targets such as reaching TRL 7 by 2043 within a budget of EUR 11.837 million, as confirmed in the STRATOFLY case study. Moreover, this combination enhances the tool’s ability to identify optimal or near-optimal solutions for complex aerospace missions.
The advancements presented in this paper have broad implications for future aerospace missions. By providing a more structured and data-driven approach to technology roadmapping and schedule evaluation, the toolset enables stakeholders to make more informed decisions, optimize resource allocation, and better manage risks.
While the toolset has demonstrated promising capabilities, several areas for future research and development exist:
  • Refinement of Algorithms: Continued refinement and testing of the algorithms, including AI ones, could improve their performance and applicability to a broader range of aerospace mission scenarios.
  • Integration with Additional Systems: Exploring the integration of the toolset with other aerospace systems and tools could provide additional insights and enhance its utility across various stages of mission planning and execution.
In conclusion, the proposed methodology and toolset offer a comprehensive solution for advancing aerospace mission design. Although no results have been presented in this paper, the authors are envisioning to validate the methodology developed on a wide set of case studies including lunar lander, crew vehicles, and habitable modules. The ongoing refinement and expansion of these capabilities will continue to drive innovation and efficiency in the aerospace industry.

Author Contributions

Conceptualization, G.N., R.F. and N.V.; methodology, G.N. and R.F.; software, G.N.; validation, G.N.; resources, N.V.; writing—original draft preparation, G.N.; writing—review and editing, R.F. and N.V.; supervision, R.F. and N.V.; project administration, N.V.; funding acquisition, N.V. All authors have read and agreed to the published version of the manuscript.

Funding

This research received no external funding.

Data Availability Statement

The data presented in this study are available on request from the corresponding author due to confidentiality.

Conflicts of Interest

The authors declare no conflicts of interest.

Abbreviations

The following abbreviations are used in this manuscript:
ACActivity
BBBuilding Block
CaCCost at Completion
OCOperational Capability
MCMission Concept
MCTSMonte Carlo Tree Search
MDPMarkov Decision Process
TATechnology Area
TRISTechnology Roadmapping Strategy
TRLTechnology Readiness Level

References

  1. Corrado, L.; Cropper, M.; Rao, A. Space exploration and economic growth: New issues and horizons. Proc. Natl. Acad. Sci. USA 2023, 120, e2221341120. [Google Scholar] [CrossRef] [PubMed]
  2. Available online: https://www.oecd.org/en/topics/policy-issues/space-economy.html (accessed on 10 June 2025).
  3. McKinsey & Company. Space: The $1.8 Trillion Opportunity for Global Economic Growth, Insight Report. 2024. Available online: https://www.mckinsey.com/industries/aerospace-and-defense/our-insights/space-the-1-point-8-trillion-dollar-opportunity-for-global-economic-growth (accessed on 10 June 2025).
  4. MacDonald, A.C. The Long Space Age: The Economic Origins of Space Exploration from Colonial America to the Cold War; Yale University Press: New Haven, CT, USA, 2017. [Google Scholar]
  5. The World Bank. Poverty and Shared Prosperity 2022: Correcting Course. 2022. Available online: https://www.worldbank.org/en/publication/poverty-and-shared-prosperity (accessed on 10 June 2025).
  6. Moore, F.C.; Diaz, D.B. Temperature impacts on economic growth warrant stringent mitigation policy. Nat. Clim. Change 2015, 5, 127–131. [Google Scholar] [CrossRef]
  7. Coronese, M.; Lamperti, F.; Keller, K.; Chiaromonte, F.; Roventini, A. Evidence for sharp increase in the economic damages of extreme natural disasters. Proc. Natl. Acad. Sci. USA 2019, 116, 21450–21455. [Google Scholar] [CrossRef] [PubMed]
  8. Ginn, W. Climate disasters and the macroeconomy: Does state-dependence matter? Evidence for the US. Econ. Disaster Clim. Change 2022, 6, 141–161. [Google Scholar] [CrossRef]
  9. ISECG. The Global Exploration Roadmap. 2018. Available online: https://www.globalspaceexploration.org/?page_id=1371 (accessed on 10 June 2025).
  10. ESA. Terrae Novae 2030+ Strategy Roadmap. 2022. Available online: https://destination-orbite.net/documentations/Terrae_Novae_2030+strategy_roadmap.pdf (accessed on 10 June 2025).
  11. Carvalho, M.; Fleury, A.; Lopes, A. An overview of the literature on technology roadmapping (TRM): Contributions and trends. Technol. Forecast. Soc. Change 2013, 80, 1418–1437. [Google Scholar] [CrossRef]
  12. Abe, H. The Innovation Support Technology (IST) Approach: Integrating Business Modeling and Roadmapping Methods. In Technology Roadmapping for Strategy and Innovation; Moehrle, M., Isenmann, R., Phaal, R., Eds.; Springer: Berlin/Heidelberg, Germany, 2013; pp. 173–188. [Google Scholar]
  13. Geschka, H.; Hahnenwald, H. Scenario-Based Exploratory Technology Roadmaps—A Method for the Exploration of Technical Trends. In Technology Roadmapping for Strategy and Innovation; Moehrle, M., Isenmann, R., Phaal, R., Eds.; Springer: Berlin/Heidelberg, Germany, 2013; pp. 123–136. [Google Scholar]
  14. Kanama, D. Development of Technology Foresight: Integration of Technology Roadmapping and the Delphi Method. In Technology Roadmapping for Strategy and Innovation; Moehrle, M., Isenmann, R., Phaal, R., Eds.; Springer: Berlin/Heidelberg, Germany, 2013; pp. 151–171. [Google Scholar]
  15. Moehrle, M. TRIZ-based technology roadmapping. In Technology Roadmapping for Strategy and Innovation. Charting Route to Success; Moehrle, M., Isenmann, R., Phaal, R., Eds.; Springer: Berlin/Heidelberg, Germany, 2013; pp. 137–150. [Google Scholar]
  16. Phaal, R.; Farrukh, C.; Probert, D. Fast-Start Roadmapping Workshop Approaches. In Technology Roadmapping for Strategy and Innovation; Moehrle, M., Isenmann, R., Phaal, R., Eds.; Springer: Berlin/Heidelberg, Germany, 2013; pp. 91–106. [Google Scholar]
  17. Knoll, D.; Golkar, A.; De Weck, O. A concurrent design approach for model-based technology roadmapping. In Proceedings of the 12th Annual IEEE International Systems Conference, SysCon 2018—Proceedings, Vancouver, BC, Canada, 23–26 April 2018; pp. 1–6. [Google Scholar]
  18. Viola, N.; Fusaro, R.; Vercella, V. Technology Roadmapping Methodology for Future Hypersonic Transportation Systems. Acta Astronaut. 2022, 195, 430–444. [Google Scholar] [CrossRef]
  19. Viola, N.; Fusaro, R.; Vercella, V.; Saccoccia, G. Technology RoadmappIng Strategy, TRIS: Methodology and tool for technology roadmaps for hypersonic and re-entry space transportation systems. Acta Astronaut. 2020, 170, 609–622. [Google Scholar] [CrossRef]
  20. Narducci, G.; Governale, G.; Viola, N.; Rimani, J.; Fusaro, R.; Ferretto, D.; Chiusano, S.; Fiori, A. Microlauncher design, cost estimation and technology roadmaps. In Proceedings of the 2nd International Conference on Flight Vehicles, Aerothermodynamics and Re-entry Missions Engineering, Heilbronn, Germany, 19–23 June 2022. [Google Scholar]
  21. Governale, G.; Rimani, J.; Narducci, G.; Viola, N.; Fusaro, R. Rapid prototyping for Martian space systems. In Proceedings of the Moving to Mars: 2022 International Workshop on Technology Development for Mars Human Exploration, Montreal, QC, Canada, 17–18 November 2022. [Google Scholar]
  22. Aleina, S.C.; Viola, N.; Fusaro, R.; Saccoccia, G. Approach to technology prioritization in support of moon initiatives in the framework of ESA exploration technology roadmaps. Acta Astronaut. 2017, 139, 42–53. [Google Scholar] [CrossRef]
  23. Aleina, S.C.; Fusaro, R.; Viola, N.; Longo, J.; Saccoccia, G. Technology roadmaps derivation methodology for European hypersonic and re-entry space transportation systems. In Proceedings of the 21st AIAA International Space Planes and Hypersonics Technologies Conference Hypersonics, Xiamen, China, 6–9 March 2017; pp. 1–16. [Google Scholar] [CrossRef]
  24. Aleina, S.C.; Viola, N.; Fusaro, R.; Longo, J.; Saccoccia, G. Basis for a methodology for roadmaps generation for hypersonic and re-entry space transportation systems. Technol. Forecast. Soc. Change 2018, 128, 208–225. [Google Scholar] [CrossRef]
  25. Viola, N.; Alenia, S.C.; Fusaro, R.; Vercella, V.; Saccoccia, G. Space systems engineering tools for technology roadmapping activities: TrIS, technology roadmapping strategy, and HyDat, database on hypersonic transportation systems. In Proceedings of the International Astronautical Congress (IAC), Bremen, Germany, 1–5 October 2018. [Google Scholar]
  26. Alenia, S.C.; Fusaro, R.; Viola, N.; Rimani, J.; Longo, J.; Saccoccia, G. Comprehensive methodology for technology roadmaps generation and update for the European Hypersonic and Re-entry space transportation scenario. In Proceedings of the 68th International Astronautical Congress (IAC), Adelaide, Australia, 25–29 September 2017. [Google Scholar]
  27. Viola, N.; Alenia, S.C.; Fusaro, R.; Saccoccia, G.; Longo, G. Technology roadmaps preparation for European hypersonic and re-entry space transportation systems. In Proceedings of the 67th International Astronautical Congress 2016—IAC 2016, Guadalajara, Mexico, 26–30 September 2016. [Google Scholar]
  28. Narducci, G.; Fusaro, R.; Rimani, J.; Viola, N.; Grizzaffi, L.; Sindoni, E. Definition of Architectures & Technologies for Sustainable Human Exploration of the Moon. In Proceedings of the International Astronautical Congress (IAC), Baku, Azerbaijan, 5 October 2023. [Google Scholar]
  29. Narducci, G.; Viola, N.; Fusaro, R.; Governale, G.; Rimani, J.; Ferretto, D. iDREAM: A multidisciplinary methodology and integrated toolset for flight vehicle engineering. In Proceedings of the 3rd International Congress of PhD Students in Aerospace Science and Engineering, Bertinoro, Italy, 16–19 April 2023. [Google Scholar]
  30. Fusaro, R.; Viola, N.; Narducci, G.; Governale, G.; Rimani, J.; Ferretto, D.; Chiusano, S.; Fiori, A. iDREAM: A multidisciplinary methodology and integrated toolset for flight vehicle engineering. In Proceedings of the 73rd International Astronautical Congress, Paris, France, 18–22 September 2022. [Google Scholar]
  31. Fusaro, R.; Aleina, S.; Viola, N.; Longo, J.; Saccoccia, G. Database on hypersonic transportation systems: A versatile support for the technology roadmap generation and conceptual design activities. In Proceedings of the 21st AIAA International Space Planes and Hypersonics Technologies Conference, Hypersonics 2017, Xiamen, China, 6–9 March 2017. [Google Scholar]
  32. Viscio, M.; Viola, N.; Fusaro, R.; Basso, V. Methodology for requirements definition of complex space missions and systems. Acta Astronaut. 2015, 114, 79–92. [Google Scholar] [CrossRef]
  33. ESA. ESA Technology Tree version 4.1; ESA Communicatio-ESTEC: Noordwijk, The Netherlands, 2023. [Google Scholar]
  34. Aleina, S.C.; Viola, N.; Fusaro, R.; Saccoccia, G.; Vercella, V. Using the ESA exploration technology roadmaps in support of new mission concepts and technology prioritization. Acta Astronaut. 2019, 154, 170–176. [Google Scholar] [CrossRef]
  35. Aleina, S.C.; Viola, N.; Fusaro, R.; Saccoccia, G. Effective methodology to derive strategic decisions from ESA exploration technology roadmaps. Acta Astronaut. 2016, 126, 316–324. [Google Scholar] [CrossRef]
  36. Aleina, S.C.; Levrino, L.; Viola, N.; Fusaro, R.; Saccoccia, G. The importance of technology roadmaps for a successful future in space exploration. In Proceedings of the 9th IAA Symposium on the Future of Space Exploration, Torino, Italy, 7–9 July 2015. [Google Scholar]
  37. INCOSE. Systems Engineering Handbook: A Guide for System Life Cycle Processes and Activities, 4th ed.; Wiley: Hoboken, NJ, USA, 2015. [Google Scholar]
  38. Fusaro, R.; Viola, N.; Fenoglio, F.; Santoro, F. Conceptual design of a crewed reusable space transportation system aimed at parabolic flights: Stakeholder analysis, mission concept selection, and spacecraft architecture definition. CEAS Space J. 2017, 9, 5–34. [Google Scholar] [CrossRef]
  39. Larson, W.J. Human Space Flight: Mission Analysis and Design; McGraw-Hill College: New York, NY, USA, 1999. [Google Scholar]
  40. Hovland, I. Successful Communication: A Toolkit for Researcher and Civil Society Organizations, 2nd ed.; Overseas Development Institute: London, UK, 2014; pp. 250–263. [Google Scholar]
  41. ESA-ESTEC. ESA Generic Product Tree. 2011. Available online: https://esastar-emr.sso.esa.int/Account/DownloadCompetencesFile?fileType=P (accessed on 10 June 2025).
  42. Shishko, R. NASA Systems Engineering Handbook; NASA: Washington, DC, USA, 2007.
  43. Sacher, P. The Engineering Design of Engine/Airframe Integration for the Sänger Fully Reusable Space Transportation System. High Speed Propuls. Engine Des, Integr. Therm. Manag. RTO-EN-AVT. 2010, pp. 16-1–16-32. Available online: https://apps.dtic.mil/sti/tr/pdf/ADA592434.pdf (accessed on 10 June 2025).
  44. Bowcutt, K. Hypersonic Technology Status and Development Roadmap. Presentation to AIAA HyTASP Program Committee. 2003. Available online: https://engineering.purdue.edu/~aae519/hypersonics-news/TFAB HyTASP-dec03.pdf (accessed on 28 July 2025).
  45. ESA. Exploration Technology Compendium for 2021: European Exploration Envelope Programme (E3P); ESA: January 2022. Available online: https://esamultimedia.esa.int/docs/business_with_esa/Exploration_Technology_Compendium_2021_public.pdf (accessed on 10 June 2025).
  46. ESA-ESTEC. GSTP Element 1 “Develop” Compendium 2019: Advanced Manufacturing; ESA-ESTEC: Noordwijk, The Netherlands, 2019. [Google Scholar]
  47. ESA-ESTEC. GSTP Element 1 “Develop” Compendium 2019: Artificial Intelligence; ESA-ESTEC: Noordwijk, The Netherlands, 2019. [Google Scholar]
  48. ESA-ESTEC. GSTP Element 1 “Develop” Compendium 2019: Cybersecurity; ESA-ESTEC: Noordwijk, The Netherlands, 2019. [Google Scholar]
  49. ESA-ESTEC. GSTP Element 1 “Develop” Compendium 2019: Generic Technologies; ESA-ESTEC: Noordwijk, The Netherlands, 2019. [Google Scholar]
  50. ESA-ESTEC. GSTP Element 1 “Develop” Compendium 2019: Operations Innovation; ESA-ESTEC: Noordwijk, The Netherlands, 2019. [Google Scholar]
  51. ESA. Science Programme Technology Development Plan: Programme of Work for 2025, 2026 and 2027, and Related Procurement Plan; ESA: Noordwijk, The Netherlands, 2025; Available online: https://sci.esa.int/web/sci-ft/-/47731-european-space-agency-science-programme-technology-development-plan-programme-of-work (accessed on 28 July 2025).
  52. Vercella, V. Cost-Effective and Sustainable Scenarios for Future Reusable Space Transportation and Re-Entry Systems. Ph.D. Thesis, Politecnico di Torino, Turin, Italy, 2023. [Google Scholar]
  53. Mankins, J.C. Technology Readiness Level—A White Paper; NASA: Washington, DC, USA, 1995.
  54. Mankins, J.C. Technology readiness assessments: A retrospective. Acta Astronaut. 2009, 65, 1216–1223. [Google Scholar] [CrossRef]
  55. Mankins, J.C. Technology readiness and risk assessments: A new approach. Acta Astronaut. 2009, 65, 1208–1215. [Google Scholar] [CrossRef]
  56. Świechowski, M.; Godlewski, K.; Sawicki, B.; Mańdziuk, J. Monte Carlo Tree Search: A review of recent modifications and applications. Artif. Intell. Rev. 2023, 56, 2497–2562. [Google Scholar] [CrossRef]
  57. Shen, Y.; Chen, J.; Huang, P.-S.; Guo, Y.; Gao, J. M-Walk: Learning to Walk over Graphs using Monte Carlo Tree Search. In Proceedings of the 32nd Conference on Neural Information Processing Systems (NeurIPS 2018), Montréal, Canada, 2–8 December 2018. [Google Scholar]
  58. Wang, Y.; Sun, M.; Wang, H.; Sun, Y. Research on Knowledge Graph Completion Model Combining Temporal Convolutional Network and Monte Carlo Tree Search. Math. Probl. Eng. 2022, 2022, 2290540. [Google Scholar] [CrossRef]
Figure 1. TRIS flowchart.
Aerospace 12 00682 g001
Figure 2. Collection and creation of time and cost distribution flowchart.
Aerospace 12 00682 g002
Figure 3. Example of trimmed mean values for budget and time allocation on TRL transits.
Aerospace 12 00682 g003
Figure 4. Budget and time distribution.
Aerospace 12 00682 g004
Figure 5. STRATOFLY Techs planning—Case 1.
Aerospace 12 00682 g005
Figure 6. STRATOFLY Techs planning—Case 2.
Aerospace 12 00682 g006
Figure 7. STRATOFLY Techs planning—Case 3.
Aerospace 12 00682 g007
Figure 8. Non-ideal roadmap (Case 1 distribution).
Aerospace 12 00682 g008
Table 1. Budget distributions.
Budget Requested to Achieve the Target TRL as Percentage of the Overall Cost at Completion
TRLTotallAOCSAvionicsEPSOtherPropulsionStructureTCS
Case 123.9%5.6%6.1%4.5%14.7%9.6%3.6%3.3%
37.5%6.5%10.9%8.9%7.9%6.7%7.8%5.2%
49.7%8.9%13.5%11.4%9.4%7.4%12.3%7.7%
512.3%16.4%16.5%13.4%8.3%10.7%9.8%10.3%
614.7%16.5%15.7%9.7%12.4%18.2%13.1%15.6%
716.5%16.4%21.4%10.6%15.1%16.8%16.0%21.1%
819.8%11.1%8.6%23.2%18.0%17.1%20.9%20.6%
915.6%18.5%7.2%18.3%14.2%13.5%16.5%16.3%
Case 224.2%4.8%4.4%2.9%2.2%3.8%6.0%3.8%
37.7%8.4%9.0%6.9%4.6%4.7%8.5%5.8%
49.1%9.6%10.5%9.4%5.6%6.0%10.6%6.7%
511.5%14.5%11.9%12.5%7.5%12.1%14.0%8.2%
616.7%18.2%16.2%12.9%19.5%18.8%24.5%18.9%
718.6%17.6%19.5%13.6%26.5%11.4%23.3%21.9%
818.1%14.6%17.7%29.7%26.2%18.2%6.2%16.8%
914.2%12.2%10.7%12.0%7.9%25.1%6.9%17.7%
Case 325.5%4.8%4.4%3.1%2.4%5.2%6.2%3.8%
38.1%8.1%8.9%7.3%5.0%6.1%8.6%5.7%
410.1%9.8%10.8%10.3%6.4%7.6%11.2%6.9%
513.2%15.5%12.8%13.4%8.3%18.0%14.9%8.6%
616.9%17.5%14.3%12.4%19.6%19.7%22.9%17.1%
718.3%15.2%17.4%13.3%25.1%12.9%22.4%20.1%
818.4%14.5%17.7%31.9%27.7%23.7%6.5%16.8%
99.4%14.4%13.7%8.3%5.5%6.8%7.4%21.1%
Table 2. Time distributions.
Time Requested to Achieve the Target TRL as Percentage of the Overall Time at Completion
TRLTotalAOCSAvionicsEPSOtherPropulsionStructureTCS
Case 12212.9%13.9%14.3%10.7%14.7%15.7%15.3%
3314.1%14.0%15.0%14.6%9.1%11.7%12.5%
4412.6%11.9%14.0%12.7%12.3%14.4%10.0%
5513.2%12.6%13.7%13.5%12.7%13.0%11.8%
6612.7%11.9%12.4%17.0%9.5%12.1%11.2%
7711.9%13.6%11.3%8.0%10.9%12.0%19.1%
8811.2%9.4%10.8%10.7%12.7%10.5%9.9%
9911.4%12.7%8.4%12.7%18.1%10.7%10.1%
Case 22217.0%16.2%17.8%16.1%13.0%15.6%15.5%
3313.9%11.7%15.2%13.1%9.2%13.1%11.6%
4411.5%11.5%11.9%11.3%9.6%12.6%10.0%
559.3%10.8%9.1%9.8%7.2%6.8%9.7%
6618.2%15.3%19.2%17.4%13.6%20.0%17.8%
7715.2%15.5%14.7%12.5%15.3%16.9%17.7%
888.3%9.1%7.2%13.9%15.4%9.7%7.7%
996.7%10.0%4.9%5.9%16.8%5.3%9.9%
Case 32211.2%11.8%14.0%12.1%8.9%10.8%11.5%
3312.6%13.0%15.2%13.6%10.6%13.8%12.3%
4412.2%12.3%13.6%12.3%9.6%14.7%11.6%
5513.9%13.7%14.1%12.9%10.3%13.5%13.5%
6614.4%13.6%13.5%12.4%11.3%13.3%15.6%
7713.0%12.5%11.3%11.1%11.8%11.2%13.9%
8811.7%10.6%9.5%16.2%16.7%12.5%10.2%
9911.1%12.6%8.8%9.4%20.8%10.2%11.4%
Table 3. Time and cost validation.
Time & Cost Validation Percentage Difference
TRL2345678
Case 1Time2.24%11.61%11.34%13.48%11.95%7.13%
Cost −5.42% −15.07%−13.96%−4.33%1.86%
Case 2Time6.14%11.66%11.64%15.12%11.90%7.11%
Cost −5.91% −14.08%−14.99%−7.25%0.52%
Case 3Time2.22%12.18%11.29%13.59%11.72%7.08%
Cost −7.57% −18.25%−19.20%−11.04%−3.73%
Table 4. STRATOFLY propulsion technologies.
IDNameTRLCaC [M EUR]AD2
1Low Speed Intake Ramp Technology6350.274
2Low Speed Intake Duct Technology6350.274
3High Speed Intake Technology4350.275
42D Nozzle Technology7100.511
53D Nozzle Technology4100.515
6ATR Exhaust Duct Technology6100.515
7ATR Variable Throat Technology6100.515
8ATR Fan Technology6620.157
9ATR Turbines Technology7413.432
10ATR Combustor Technology6620.155
11Engine Controls Technology6413.435
12DMR Injection Struts Technology6413.433
13Scramjet Combustor Technology 6413.436
14Ramjet-Scramjet Transition Technology4620.156
15PAC Technology1124.036
16Isolator Technology4620.154
17ATR Pumps Technology6413.432
18Intake Ramps Actuators Technology4289.406
19Variable Throat Actuators Technology6289.406
20Engine Cooled Materials (CMC)6620.157
21Engine Cooled Materials (Metals)6620.157
22Engine Uncooled Materials6413.435
Table 5. Planning comparison.
IDCase[0, 1][1, 2][2, 3][3, 4][4, 5][5, 6][6, 7][7, 8][8, 9]
15ORIGINAL 01/06/201826/03/201926/07/202126/01/202529/08/203201/03/203604/10/204305/04/204730/12/2050
CASE 101/06/201819/08/202224/03/202703/05/203118/08/203506/10/203922/08/204315/04/204731/12/2050
CASE 201/06/201811/12/202324/06/202827/03/203205/04/203510/03/204117/02/204628/10/204831/12/2050
CASE 301/06/201820/01/202223/02/202612/02/203023/08/203429/04/203925/07/204316/05/204731/12/2050
5, 18, 14, 3, 16ORIGINAL 01/06/201815/12/202701/03/203604/10/204305/04/204731/12/2050
CASE 1 01/06/201812/07/202506/10/203922/08/204315/04/204731/12/2050
CASE 2 01/06/201831/08/202310/03/204117/02/204628/10/204831/12/2050
CASE 3 01/06/201824/06/202529/04/203925/07/204316/05/204731/12/2050
8, 20, 21, 6, 7, 19, 13, 3, 11, 22, 10, 16, 1, 2, 12, 4, 17ORIGINAL 01/06/201804/10/204305/04/204731/12/2050
CASE 1 01/06/201822/08/204315/04/204731/12/2050
CASE 2 31/05/201817/02/204628/10/204831/12/2050
CASE 3 01/06/201825/07/204316/05/204731/12/2050
4, 9ORIGINAL 01/06/201805/04/204731/12/2050
CASE 1 01/06/201815/04/204731/12/2050
CASE 2 01/06/201828/10/204831/12/2050
CASE 3 01/06/201816/05/204731/12/2050
Disclaimer/Publisher’s Note: The statements, opinions and data contained in all publications are solely those of the individual author(s) and contributor(s) and not of MDPI and/or the editor(s). MDPI and/or the editor(s) disclaim responsibility for any injury to people or property resulting from any ideas, methods, instructions or products referred to in the content.

