Article

Enhanced Conjunction Assessment in LEO: A Hybrid Monte Carlo and Spline-Based Method Using TLE Data

1
National Research Institute of Astronomy and Geophysics (NRIAG), Cairo 11421, Egypt
2
Keldysh Institute of Applied Mathematics, Russian Academy of Sciences, 125047 Moscow, Russia
3
National Astronomical Observatories, Chinese Academy of Sciences (NAOC), Beijing 100101, China
4
University of Chinese Academy of Sciences, Beijing 101408, China
*
Author to whom correspondence should be addressed.
Aerospace 2025, 12(8), 674; https://doi.org/10.3390/aerospace12080674
Submission received: 24 June 2025 / Revised: 21 July 2025 / Accepted: 24 July 2025 / Published: 28 July 2025
(This article belongs to the Section Astronautics & Space Science)

Abstract

The growing density of space objects in low Earth orbit (LEO), driven by the deployment of large satellite constellations, has elevated the risk of orbital collisions and the need for high-precision conjunction analysis. Traditional methods based on Two-Line Element (TLE) data suffer from limited accuracy and insufficient uncertainty modeling. This study proposes a hybrid collision assessment framework that combines Monte Carlo simulation, spline-based refinement of the time of closest approach (TCA), and a multi-stage deterministic refinement process. The methodology begins with probabilistic sampling of TLE uncertainties, followed by a coarse search for TCA using the SGP4 propagator. A cubic spline interpolation then enhances temporal resolution, and a hierarchical multi-stage refinement computes the final TCA and minimum distance with sub-second and sub-kilometer accuracy. The framework was validated using real-world TLE data from over 2600 debris objects and active satellites. Results demonstrated a reduction in average TCA error to 0.081 s and distance estimation error to 0.688 km. The approach is computationally efficient, with average processing times below one minute per conjunction event using standard hardware. Its compatibility with operational space situational awareness (SSA) systems and scalability for high-volume screening make it suitable for integration into real-time space traffic management workflows.

1. Introduction

The rapid proliferation of artificial satellites and orbital debris in low Earth orbit (LEO) has significantly increased the probability of in-orbit collisions [1]. Mega-constellations such as Starlink and One Web have accelerated congestion in critical orbital regions, raising concerns regarding the long-term sustainability of near-Earth space [2]. While the 750–850 km sun-synchronous orbit (SSO) region remains the most collision-prone zone due to the accumulation of long-lived debris and inactive objects, recent large-scale deployments of mega-constellations such as Starlink (~550 km) and One Web (~1200 km) have substantially increased the number of active satellites across multiple altitude bands in low Earth orbit (LEO). Although these constellations do not operate within the SSO range, their presence contributes to growing orbital congestion and increases the frequency of potential conjunction events. Cross-altitude interactions, influenced by orbital decay, maneuvering activities, and propagation uncertainties, further elevate the complexity of space traffic management across LEO. Increasing solar activity and the rapid growth of mega-constellations have intensified concerns about orbital stability in low Earth orbit (LEO). Periods of heightened geomagnetic activity such as those recorded during solar cycle 25 have caused significant perturbations in satellite orbits due to enhanced atmospheric drag. These disturbances shorten orbital lifetimes and complicate conjunction risk forecasting, particularly for low-mass spacecraft. The dynamic and congested nature of LEO now demands more resilient and adaptive approaches to conjunction assessment that can operate under uncertain and time-varying orbital conditions [3] The total number of tracked space objects in low Earth orbit (LEO) larger than 10 cm, including active satellites, defunct spacecraft, and debris fragments, has surpassed 63,774, as reported by CelesTrak statistical summaries. As of May 2025, over 11,000 of these are active satellites. However, publicly available Two-Line Element (TLE) data [4], which serves as the primary input for this study, encompasses only a subset of these tracked objects. At the time of analysis, approximately 20,314 cataloged objects had valid TLE entries in LEO. This discrepancy with the reported 42,000 objects occurs because not all cataloged debris is assigned or published with corresponding TLEs, as illustrated in Figure 1. The analytical framework of this study relies solely on TLE-available entries, increasing the risk of chain-reaction collisions, known as the Kessler Syndrome [5]. Reliable collision probability estimation is essential for conjunction assessment and mitigation planning [6]. TLE-based approaches remain widely used due to their availability and ease of integration, particularly for academic and civil space situational awareness efforts [7]. However, they are constrained by limited accuracy, infrequent updates, and lack of formal uncertainty representation, which affects conjunction prediction reliability [8]. Two-Line Element sets remain the most widely accessible source for orbital data due to their global availability and ease of integration. However, TLEs suffer from known limitations, including infrequent updates, simplified drag modeling, and a lack of formal covariance information. These constraints limit their predictive accuracy, especially for high-drag or maneuvering objects. Despite this, TLEs are still widely used in civil and academic space situational awareness due to the absence of alternatives for many cataloged objects [9].
Existing collision assessment models often linearize orbital dynamics and assume Gaussian distributed uncertainties. For instance, the widely used Gaussian probability density function (PDF) method by Alfano assumes linear propagation and symmetric error ellipsoids [10], which are not well-suited for non-linear relative motion scenarios [11]. Although Monte Carlo simulations provide improved accuracy by capturing non-linear dynamics through statistical sampling, they typically demand significant computational resources and depend on accurate modeling of initial uncertainty distributions. This trade-off between accuracy and efficiency is well-documented in recent studies [12]. The increasing dynamic complexity of the orbital environment renders static risk models inadequate. Therefore, there is a clear need for adaptive, data-driven, and computationally scalable methods that improve upon traditional techniques. As the frequency of potential conjunctions increases, traditional deterministic or linearized approaches struggle to provide reliable risk assessments. Nonlinear effects, non-Gaussian uncertainty distributions, and limited data availability necessitate the use of hybrid frameworks that combine statistical sampling, high-resolution temporal modeling, and flexible uncertainty representation. Several recent studies have demonstrated the advantages of such data-driven and adaptive approaches in operational conjunction analysis [13].
In response to these challenges, this study proposes a hybrid framework that combines Monte Carlo simulation, spline-based temporal refinement, and a multi-stage TCA estimation process. This approach aims to enhance the precision of collision probability assessments derived from TLE data while maintaining operational feasibility. The framework is validated through extensive real-world testing, demonstrating improved accuracy in both time and distance estimates, along with acceptable computational costs. Section 3 provides validation results utilizing TLE catalogs and benchmarks against empirical collision scenarios, concluding with Section 4.

2. Materials and Methods

This section presents a structured hybrid framework for estimating the time of closest approach (TCA) and collision probability between space objects using TLE data. The methodology comprises four main stages: (1) Monte Carlo-based probabilistic screening, (2) spline-based deterministic refinement of the TCA, (3) multi-stage temporal resolution enhancement, and (4) collision probability estimation.

2.1. Probabilistic Conjunction Screening Using Monte Carlo Simulation

To account for uncertainties inherent in TLE-based orbital data, we initiate the process with a Monte Carlo simulation (see Figure 2). The nominal orbital state vector X T L E = r 0 , v 0 is perturbed by generating N samples from a multivariate distribution representing the TLE uncertainty model [9]:
X ( i ) = X T L E + δ X ( i ) , δ X ( i ) U T L E
where δ X ( i ) represents the perturbed initial state for the i-th Monte Carlo realization, and U T L E is the uncertainty distribution, typically modeled using uniform or Gaussian distributions based on TLE errors.
Each perturbed state is propagated using the SGP4 model to generate position samples across the prediction window. In Figure 2, the X and Y axes represent sample projections of the perturbed orbital state vectors, specifically the radial and along-track components in the local orbital frame, chosen to visualize the spread of the Monte Carlo ensemble in two dominant directions of relative motion. The covariance structure used in this initial simulation assumes a simplified diagonal form with independent Gaussian perturbations in each Cartesian direction. This simplification reflects the absence of formal covariance data in standard TLE products and allows a computationally tractable first-order uncertainty representation. While more sophisticated models (e.g., full covariance matrices derived from sensor error modeling or differential corrections) can improve realism, the adopted approach balances accuracy and efficiency for large-scale screening. For each Monte Carlo sample iii, the propagated trajectory represents a single realization of the perturbed object’s motion based on sampled TLE uncertainties. The second object, typically the conjunction partner, is propagated deterministically using its nominal TLE without perturbation. At each time step within the prediction window, the Euclidean distance is computed between the perturbed position of sample i and the corresponding nominal position of the second object. This yields a time series of distances per sample, from which the minimum separation distance and the corresponding time of closest approach are identified [14].
The collision probability is estimated using
P ^ c ( t ) = 1 N i = 1 N I ( d ( i ) ( t ) < d c )
where d c is the critical collision distance, and I (⋅) is the indicator function.
Equation (2) estimates the collision probability by sampling uncertainties for only one of the two objects, while the other is assumed to follow a deterministic nominal trajectory. This simplification is commonly used in TLE-based conjunction analysis due to the absence of formal covariance data for many cataloged objects and to reduce computational burden. However, it represents a first-order approximation. For more accurate probabilistic assessments, joint uncertainty propagation or sampling for both objects should be considered when covariance information is available.
The TCA used in the Monte Carlo analysis is obtained through a multi-stage temporal refinement process applied to the nominal trajectories of both objects. Once the refined TCA is identified, it is fixed across all samples during the collision probability estimation. Each relative position sample is generated at this reference TCA. While propagating each sample to its own individual TCA could improve accuracy, this approach is computationally intensive and requires full covariance data for both objects. Therefore, using a common TCA is a practical and accepted simplification in TLE-based conjunction analysis.
To better characterize the spatial distribution of the propagated positions, the uncertainty is modeled using a single Gaussian distribution. This representation expresses the relative position uncertainty as a probability density function (PDF) defined by a mean vector and a covariance matrix. The formulation captures the spread and orientation of the uncertainty region and serves as the basis for collision probability estimation in the following expressions.
p r = k = 1 k ω k N ( r ; μ k , Σ k )
where ω k is the weight of the k-th Gaussian component, satisfying k = 1 K ω k = 1 , and μ k is the mean position vector of the k-th component x k y k z k T .
The covariance matrix ( Σ k ) of the k-th component describes the spread and orientation of uncertainty:
k σ x x 2 σ x y σ x z σ y x σ y y 2 σ y z σ z x σ z y σ z z 2
N r , μ k , k
N r , μ k , k = 1 2 π 2 / 3 k 1 / 2 exp 1 2 r μ k T k 1 r μ k
This process identifies time intervals and spatial regions of elevated conjunction risk. These results define the region of interest to be used in the next phase for refined time of closest approach estimation.
In the Monte Carlo method, uncertainty is modeled using a multivariate normal distribution. Samples are generated in the 3D relative position space at the estimated time of closest approach, using a Gaussian distribution with a defined mean vector and covariance matrix. The sampling is performed using the numpy.random.multivariate_normal function, and the resulting vectors represent the relative positions of the secondary object with respect to the primary in the local Radial–Transverse–Normal (RTN) frame. The covariance matrix is assumed based on plausible uncertainty magnitudes, either isotropic or anisotropic, depending on the case. Velocity components and full 12-dimensional orbital states are not sampled explicitly. Instead, the analysis focuses on the positional uncertainty at the time of closest approach. The TCA itself is computed once using a multi-stage refinement on the nominal trajectories and is then held fixed across all samples. Each sample is evaluated at this common reference time to compute the Euclidean separation. This simplified 3D approach reflects common practices when full state covariance is not available and allows for efficient estimation of collision probability from TLE data.

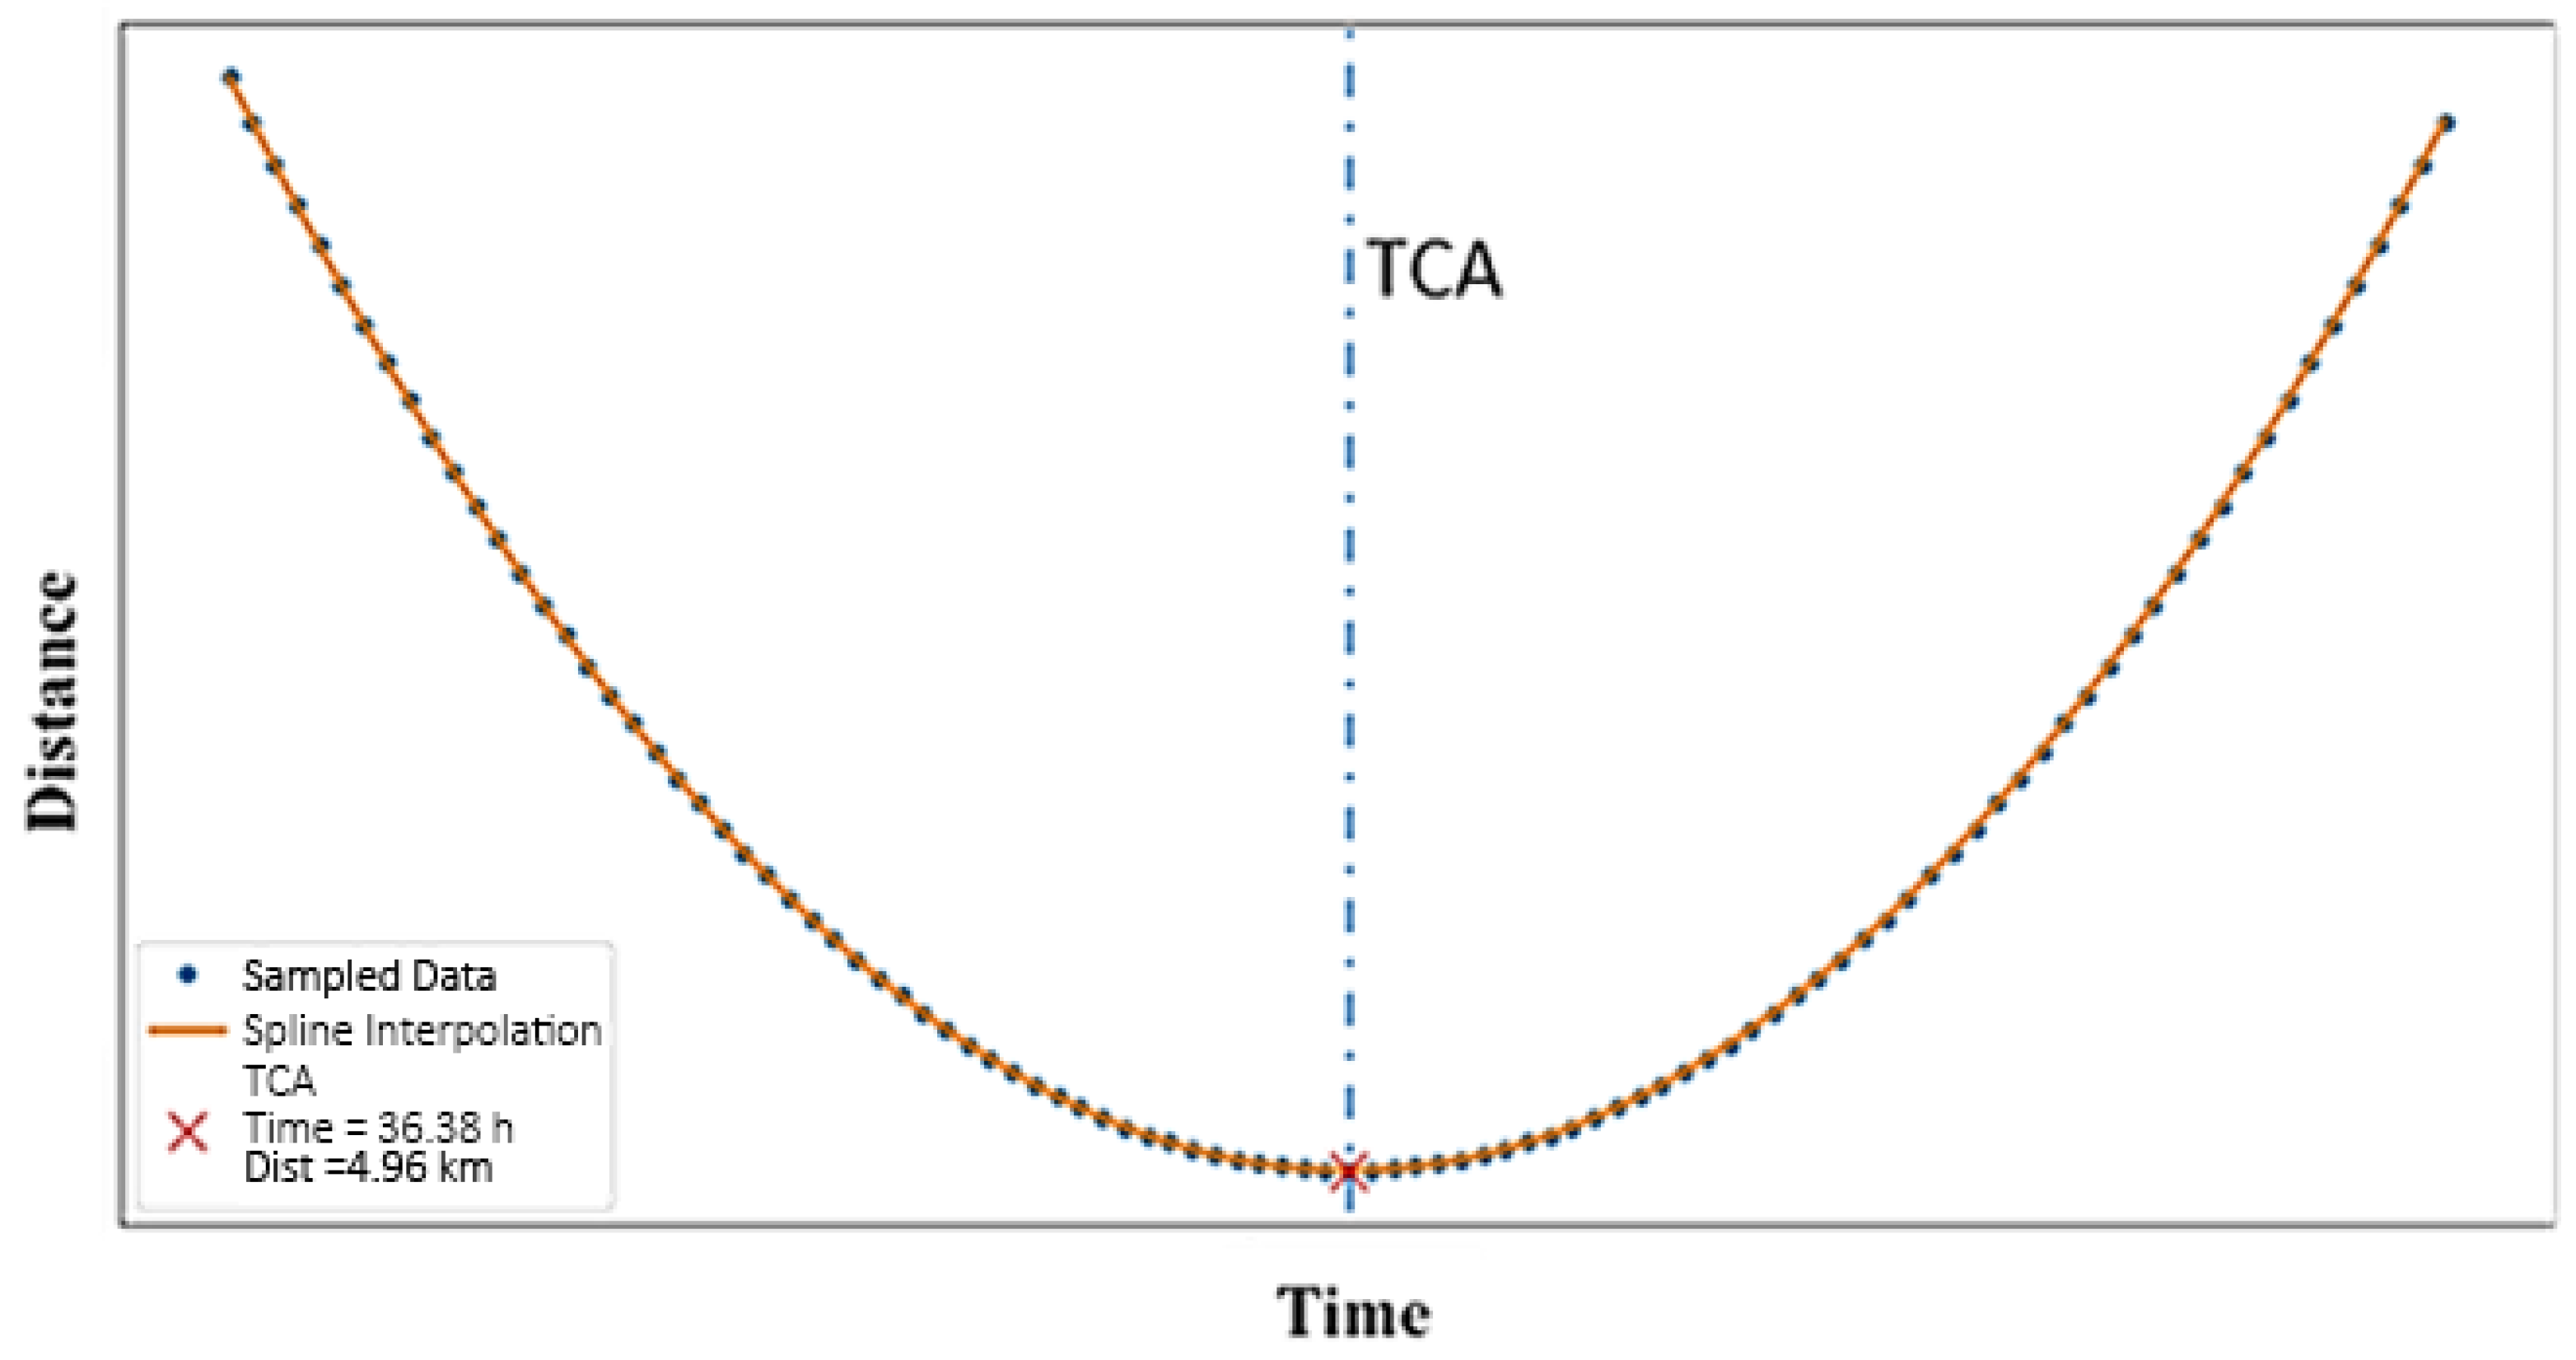
2.2. Spline-Based Deterministic Refinement of TCA

The subsequent step, after identifying a region of interest (ROI) with heightened conjunction risk, involves a deterministic refinement process aimed at precisely estimating the time of closest approach [15]. This process emphasizes the minimum relative distance between the two space objects over time within the ROI (see Figure 3). A smoothing spline is fitted to the discrete distance values computed at sampled time steps [16]. This method reduces the number of required distance evaluations by modeling the distance curve continuously over time. Spline interpolation is preferred over a single high-degree polynomial due to its superior numerical stability and local control properties. High-degree polynomials, especially when fit across broad intervals, are prone to oscillations and sensitivity to data noise (Runge phenomenon) [17]. In contrast, cubic splines provide smooth, piecewise–continuous approximations with continuity in the first and second derivatives, ensuring a stable representation of the distance function across the entire region of interest. Moreover, the spline formulation allows flexible refinement by locally adjusting time resolution without re-fitting a global function. This approach is particularly beneficial when the sampling grid is non-uniform or when multiple local minima may exist within the region. Given a set of discrete time–distance pairs obtained from propagated Monte Carlo samples, the spline interpolation method constructs a smooth curve representing the variation of the Euclidean distance between the two objects [18]. To ensure robustness in detecting potential conjunction events, the refinement procedure is implemented as a three-stage process with progressively narrower temporal windows. The initial 120 h interval with a 30 s step serves as a coarse screening layer to identify candidate close approaches with minimal computational overhead. The second stage refines the estimate by applying a 1 s step over a 10 min window centered on the preliminary time of closest approach, accounting for potential temporal shifts caused by non-linear propagation and TLE uncertainty. The final stage enhances temporal resolution within a 3 s interval using a 0.0001 s step, allowing precise determination of the minimum separation point. This structure ensures a balance between computational efficiency and numerical precision. The refinement targets the global minimum of the distance function d(t), which typically corresponds to the most critical configuration for collision risk assessment. Although multiple local minima may exist, the global minimum provides a consistent and operationally practical basis for probability estimation.
The TCA is then determined as the time corresponding to the minimum point on the interpolated curve. This deterministic refinement improves the temporal resolution of the TCA estimate beyond what is achievable through direct sampling alone while maintaining computational efficiency.
Let r 1 ( t i ) and r 2 ( t i ) be the Earth-Centered Inertial (ECI) position vectors from SGP4 at time t. The relative distance between the two objects at time t is given by
d ( t ) = r 1 ( t ) r 2 ( t )
The objective is to identify the time t T C A that minimizes d ( t ) within the ROI.
t TCA = arg   min t [ t 0 , t f ]   d ( t )
Since the function d ( t ) is discrete and sampled at finite time steps, a cubic spline interpolation is used to construct a smooth, continuous approximation of d ( t ) . Let the discrete time samples be t 0 , t 1 , t 2 , , t n with corresponding distance values d 0 , d 1 , d 2 , , d n . The cubic spline s(t) is defined piecewise over each interval t i , t i + 1 as
s i ( t ) = a i + b i ( t t i ) + c i ( t t i ) 2 + d i ( t t i ) 3
The coefficients a i , b i , c i , d i are computed to ensure continuity of the function and its first and second derivatives across intervals. Once the spline is constructed, the TCA is estimated by solving
t T C A   = arg   min t     [ t 0 , t f ]   s ( t )
where s ( t ) is the interpolated spline function. The minimum is found by evaluating the derivative s ( t ) and solving for its roots, followed by selecting the point corresponding to the global minimum distance. This step improves temporal resolution and reduces the number of required propagation samples.

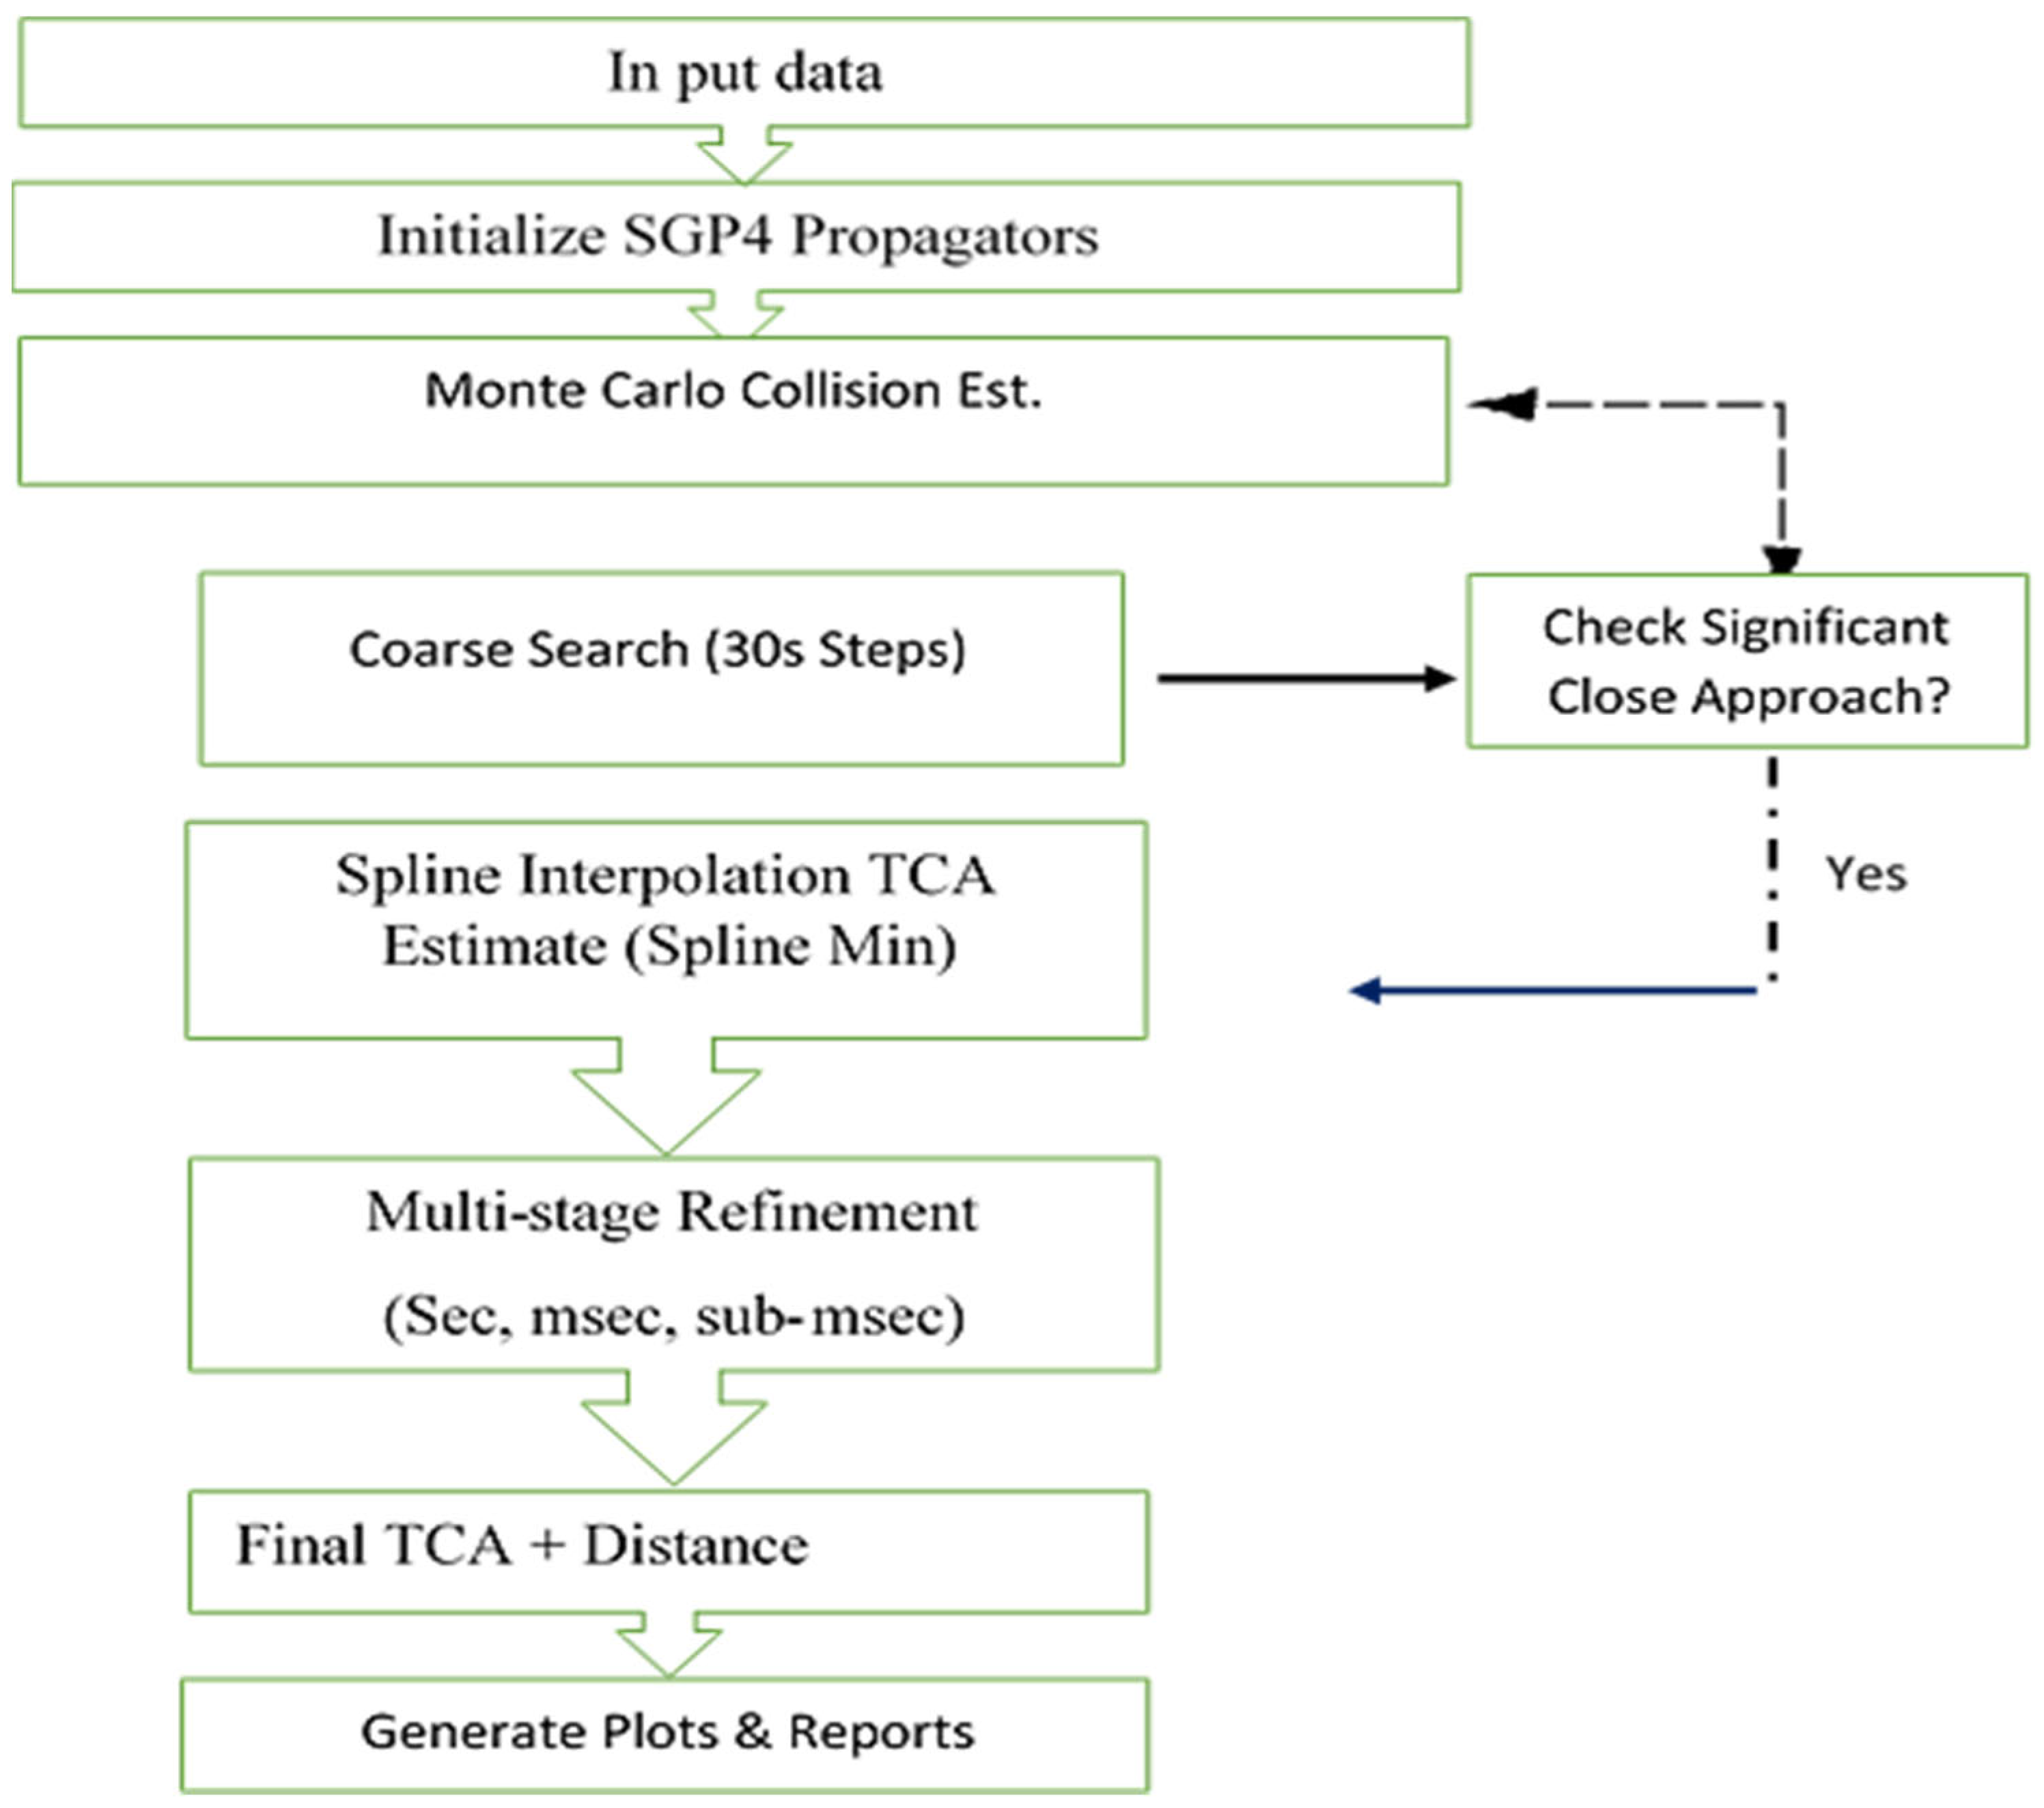
2.3. Multi-Stage Hierarchical Temporal Refinement

We can utilize a hierarchical temporal refinement scheme to calculate the time of closest approach with high accuracy. The procedure involves minimizing the scalar distance function d ( t ) over a search interval. At each stage, we establish a uniform time grid N t 0 , t 1 , t 2 , , t with a fixed step size Δt, evaluate the relative distance d ( t i ) , and identify the global minimum on that grid [19].
t TCA = arg min t i r 2 ( t i ) r 1 ( t i )
Let the initial interval be [ t start , t end ] spanning 120 h with step size Δt = 30 s.
The minimum is computed over
{ t i = t start + i Δ t } i = 0 N
The result from Equation (1), denoted t TCA ( 1 ) is used to define a new interval:
t TCA ( 1 ) 10 mints ,   t TCA ( 1 ) + 10 mints
with Δ t = 1 s   , from which t TCA ( 2 ) is extracted as the global minimum of d(t) as defined in Equation (11). From t TCA ( 2 ) , a final refinement is carried out using
t TCA ( 3 ) 3 s ,   t TCA ( 3 ) + 3 s
with Δt = 0.0001 s. This produces the final time of closest approach t TCA ( 4 ) .
The minimization is performed using brute-force enumeration over uniformly spaced time steps:
  t T C A = argmin ( t τ ) T d ( t )
where τ is the time grid for that stage. Each stage involves brute-force evaluation of the distance function at uniformly spaced time steps, without interpolation or gradient-based optimization, to avoid local minima caused by SGP4’s discrete nature.

2.4. Collision Probability Estimation Model

Using the refined TCA, the collision probability is re-evaluated. The multi-stage refinement procedure described in Section 2.3 is applied to the nominal trajectory derived from the unperturbed TLE. This refined TCA serves as a reference time point for re-evaluating the collision probability across the Monte Carlo ensemble. Individual samples are not subjected to separate multi-stage refinements, as the computational cost would be prohibitive for large sample sizes. Instead, each sample’s position is assessed at the refined TCA to determine whether it falls within the collision threshold, consistent with Equation (17). A sample is classified as a collision if the relative distance is less than a defined threshold D thresh . The probability and standard deviation are estimated as
P c , M C = N col N samples , σ M C = P c , M C 1 P c , M C N samples
where N col is the number of collision samples, N samples is the total number of generated samples, and σ M C is the standard deviation.
The Differential Algebra Monte Carlo (DAMC) method provides an efficient alternative to standard Monte Carlo simulation for estimating collision probability. Unlike traditional Monte Carlo approaches that rely on propagating a large number of individual samples, DAMC uses high-order polynomial expansions to approximate the propagation of uncertainties through nonlinear dynamics. DAMC constructs a Taylor expansion of the propagated state vector x ( t ) with respect to x 0 as follows [20]:
x ( t ) τ d   ( x 0   ) = α d c α   ( x 0   x ¯ ) α  
where x 0   n , τ d   is the differential algebra-based expansion of order d, x ¯ is the nominal state (expansion point), α is a multi-index, and c α   are the polynomial coefficients computed via automatic differentiation.
After constructing this expansion, DAMC evaluates the collision probability by sampling the uncertainty space and applying the polynomial model directly, avoiding numerical integration. For each sample i, the minimum distance d ( i ) is computed efficiently.
The probability of collision is then estimated using
P c D A M C = 1 N i = 1 N I ( d ( i ) < d c )
This expression reflects the standard Monte Carlo estimate, a method particularly effective for large-scale or time-sensitive conjunction assessments that demand rapid and accurate probability estimation.

3. Physical Characterization and Results

This section presents the numerical evaluation and physical validation of the proposed hybrid collision assessment framework. The objective is to assess the method’s effectiveness in accurately estimating the time of closest approach and minimum separation distance between space objects using publicly available TLE data. The analysis also quantifies the framework’s computational performance and suitability for operational deployment. The evaluation integrates three core components Monte Carlo uncertainty sampling, spline-based deterministic refinement, and multi-stage temporal narrowing into a single collision risk estimation pipeline. Performance is assessed through benchmark scenarios involving active satellites and cataloged debris in low Earth orbit. All simulations were conducted using Python 3, with orbit propagation performed via Vallado’s SGP4 model implemented through the sgp4 Python package [21]. Tests were executed on a standard Intel Core i5 machine running Windows10, with an average execution time of approximately 20 s per conjunction case. Subsequent subsections report on screening performance, TCA estimation accuracy, spatial distance error, and collision probability consistency. These results validate the hybrid method’s capacity for reliable and scalable conjunction analysis in real-world applications.

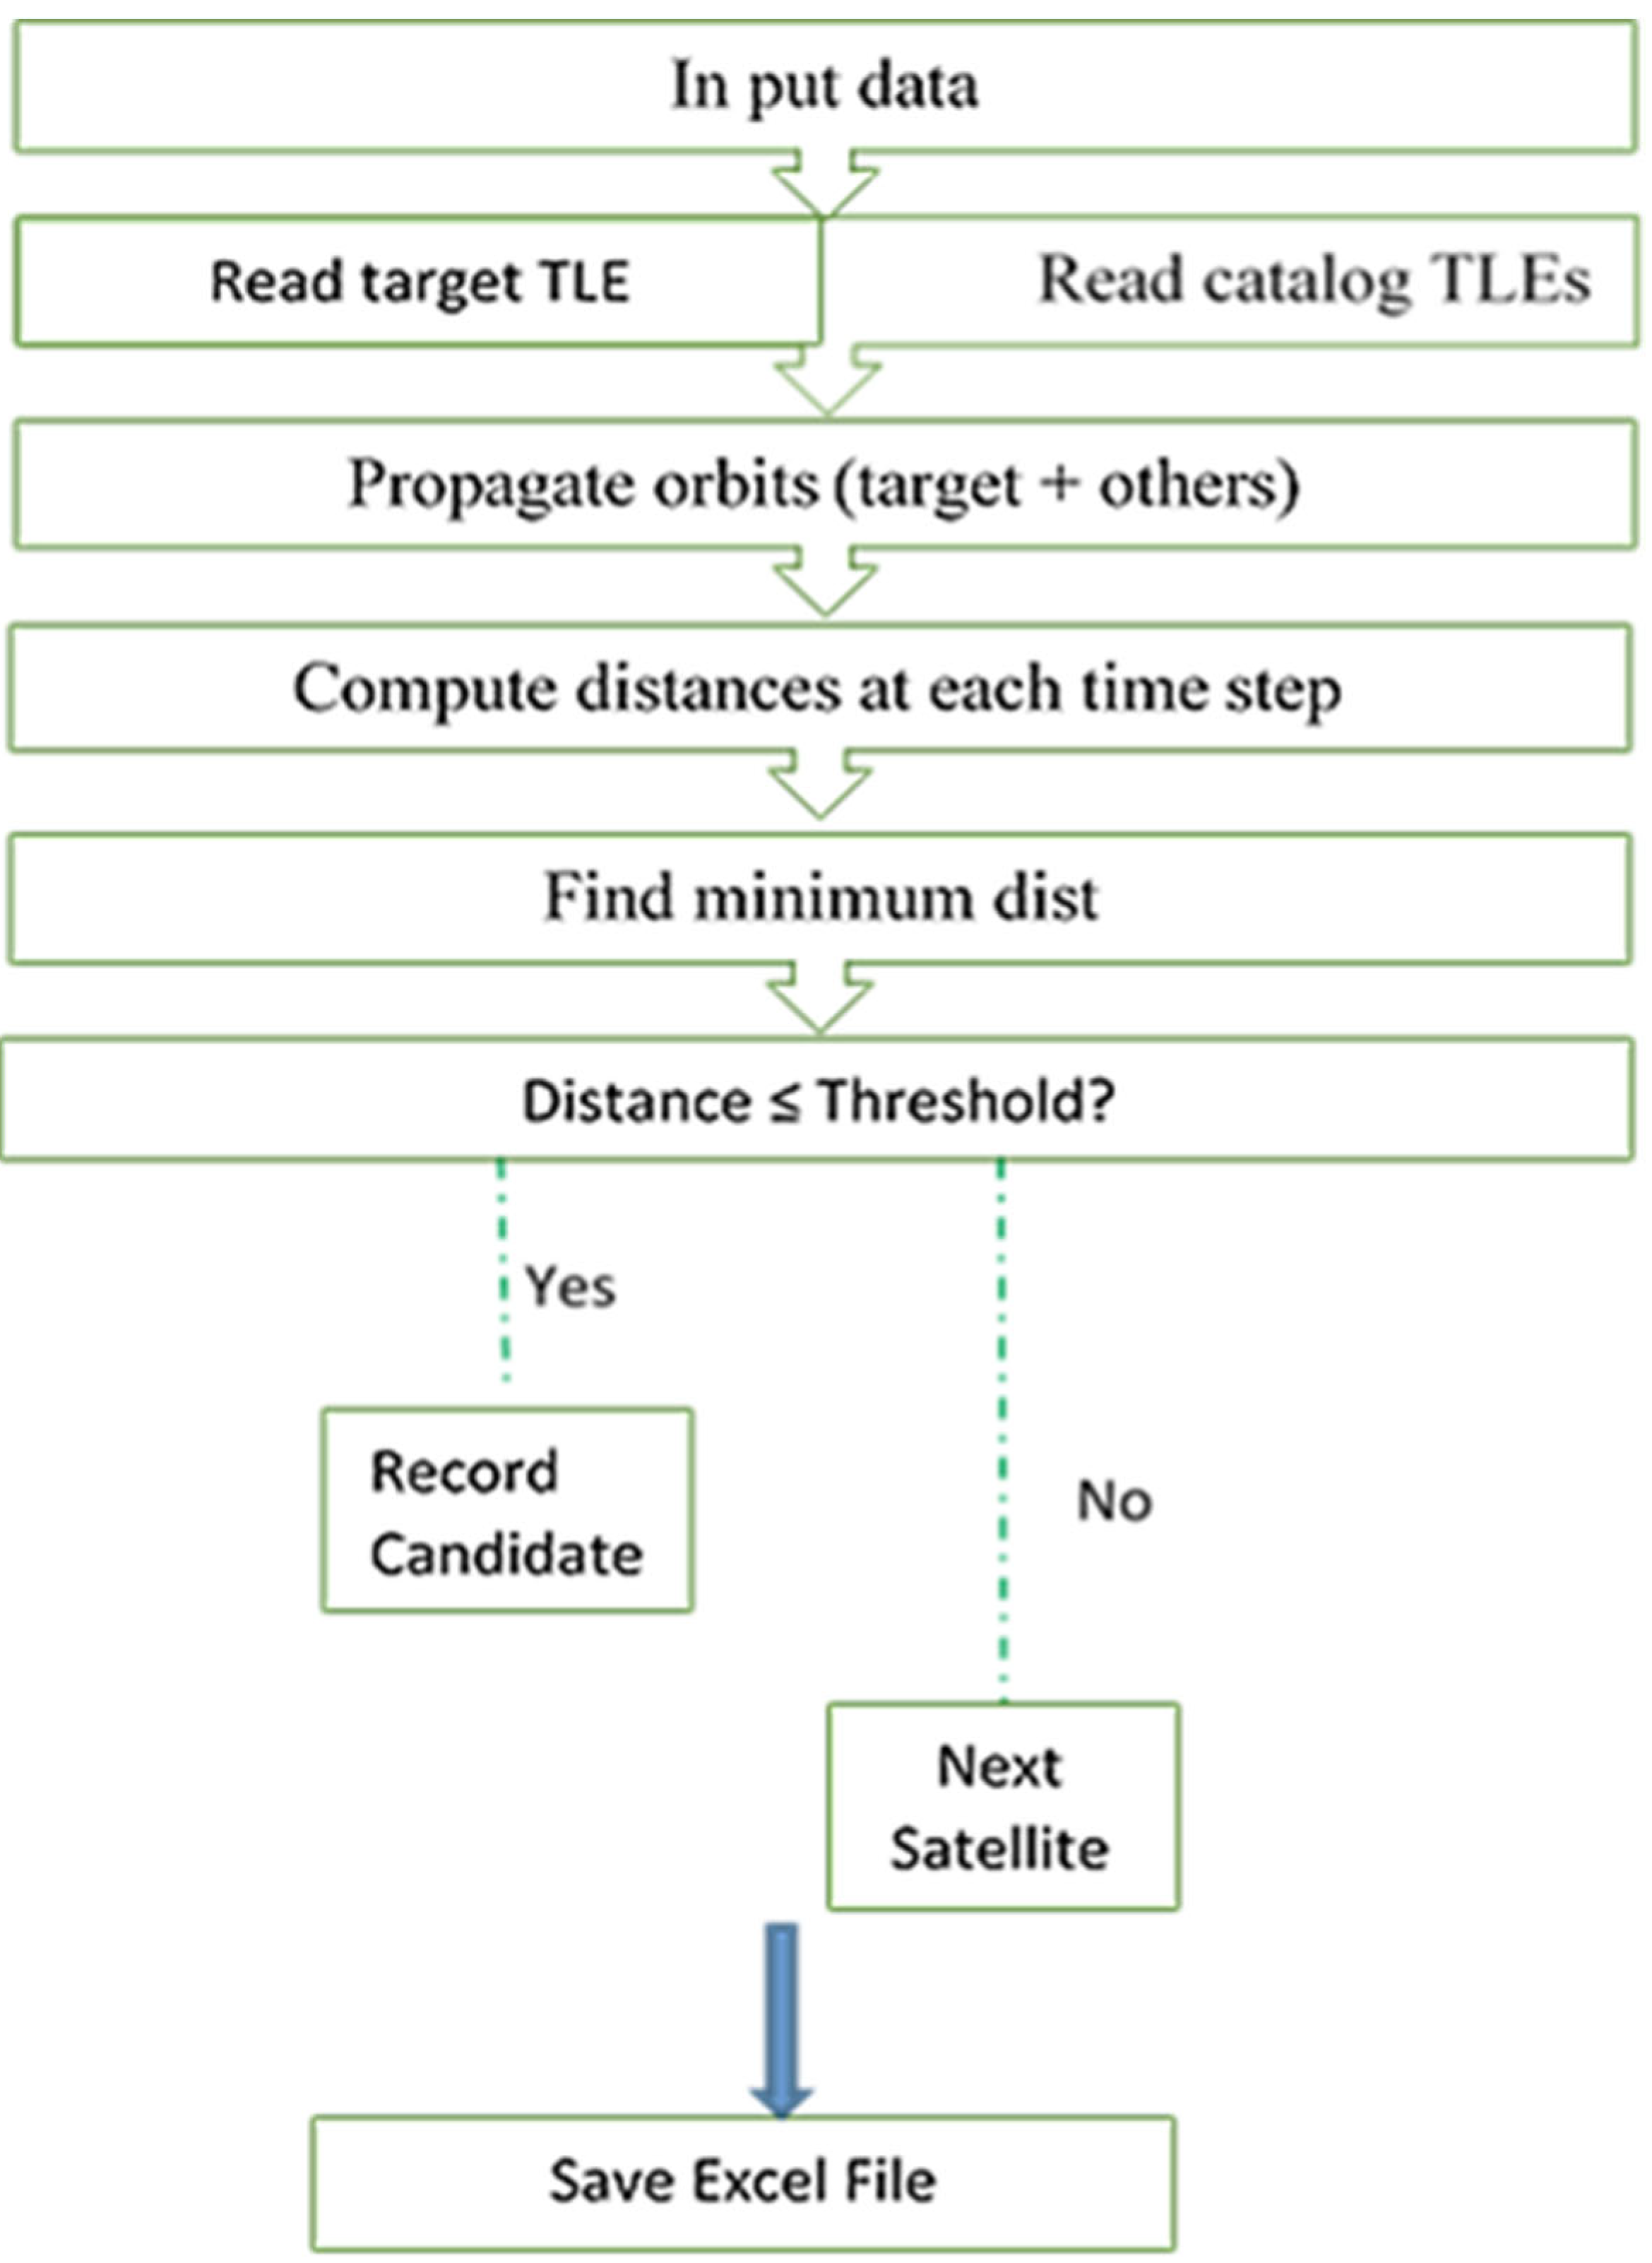
3.1. Initial Conjunction Screening Algorithm

To reduce computational overhead and isolate potential high-risk encounters, an initial conjunction screening algorithm was developed. This process employs a geometric filter to identify candidate objects likely to enter a 50 km proximity threshold with selected Starlink satellites. The threshold is deliberately conservative to maximize detection sensitivity while minimizing the number of cases requiring high-resolution analysis. For this screening, a subset of Starlink satellites with varying orbital inclinations was selected. Each satellite’s orbital elements were compared against a debris catalog of 2644 tracked objects. Any object predicted to pass within the 50 km radial distance was flagged for further refinement. Table 1 presents a subset of Starlink satellites, representing the diverse orbital inclinations within the constellation. These satellites were analyzed against a debris catalog comprising 2644 objects associated with the Iridium 33 and Cosmos-2551 fragmentation events.
For each chosen Starlink satellite, the Euclidean distance to each debris object in the catalog was calculated using coarse SGP4 propagation by the flowchart of the detection algorithm, as shown in Figure 4. To address potential inaccuracies in the initial TLE data and the infrequent updates, a conservative proximity threshold of 50 km was established, ensuring no significant close approaches were overlooked. The values in Table 1 reflect the number of distinct debris objects from the catalog that came within 50 km of each Starlink satellite at least once during the screening period, with each object counted only once per satellite, irrespective of the number of encounters.

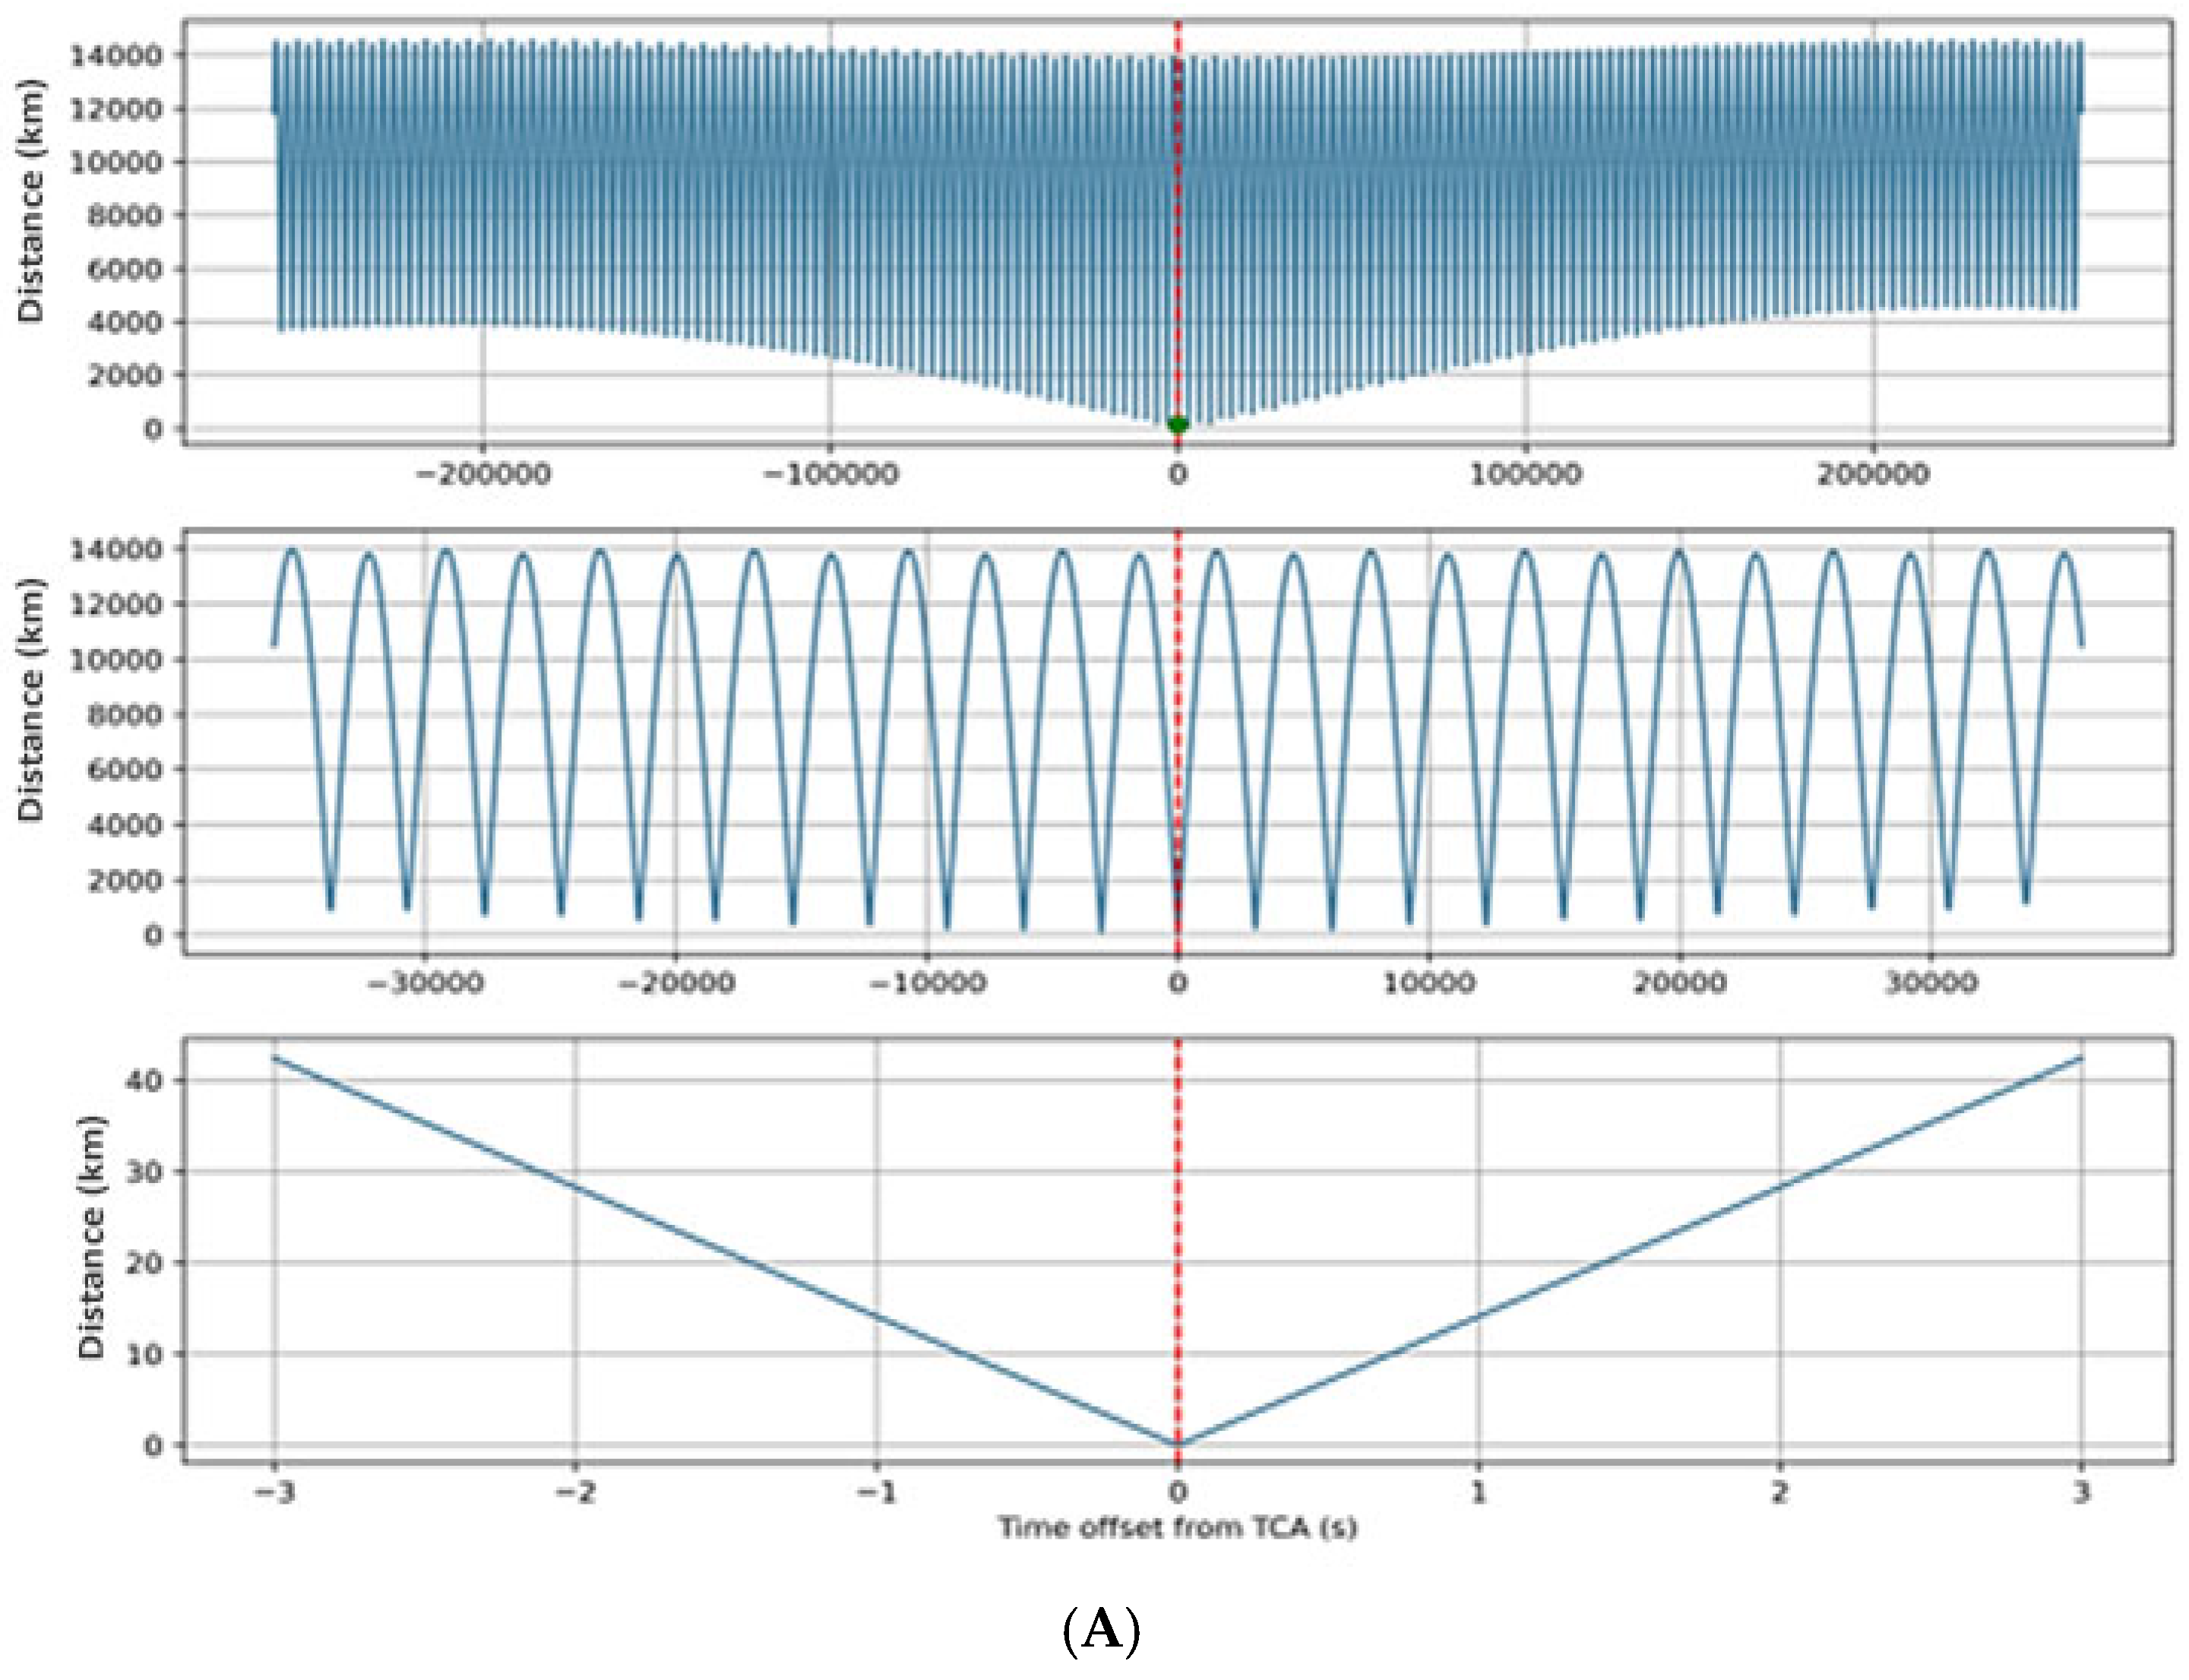
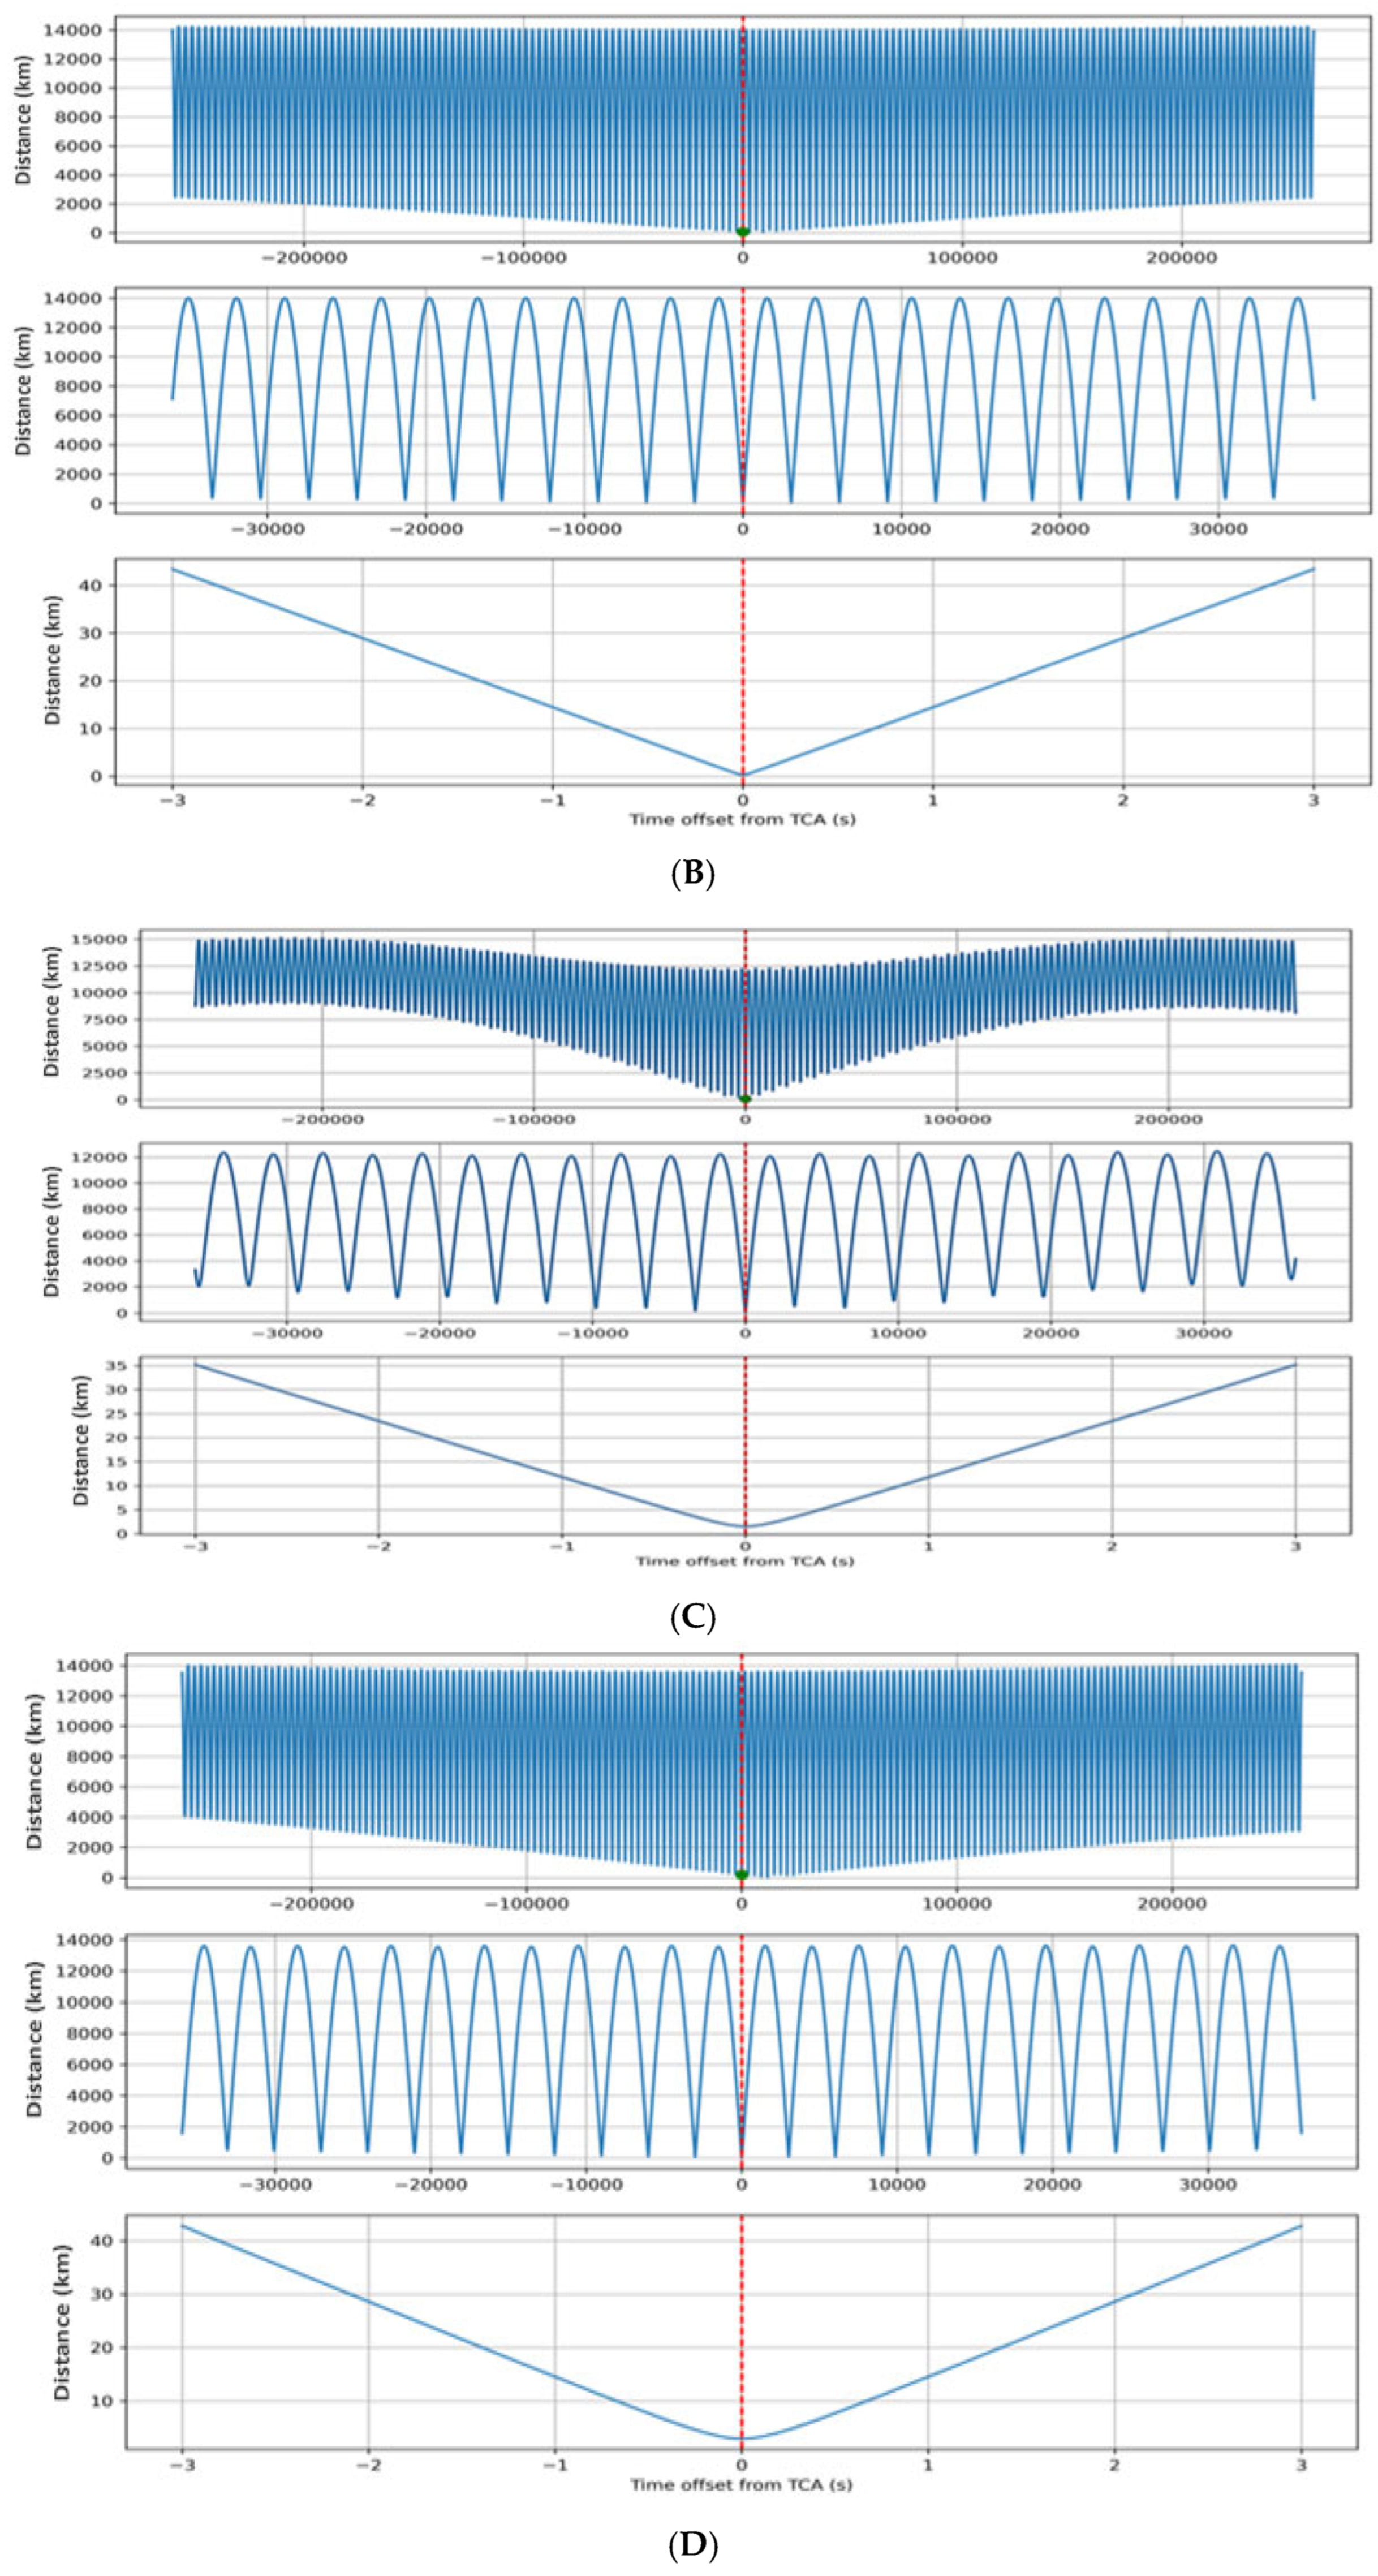
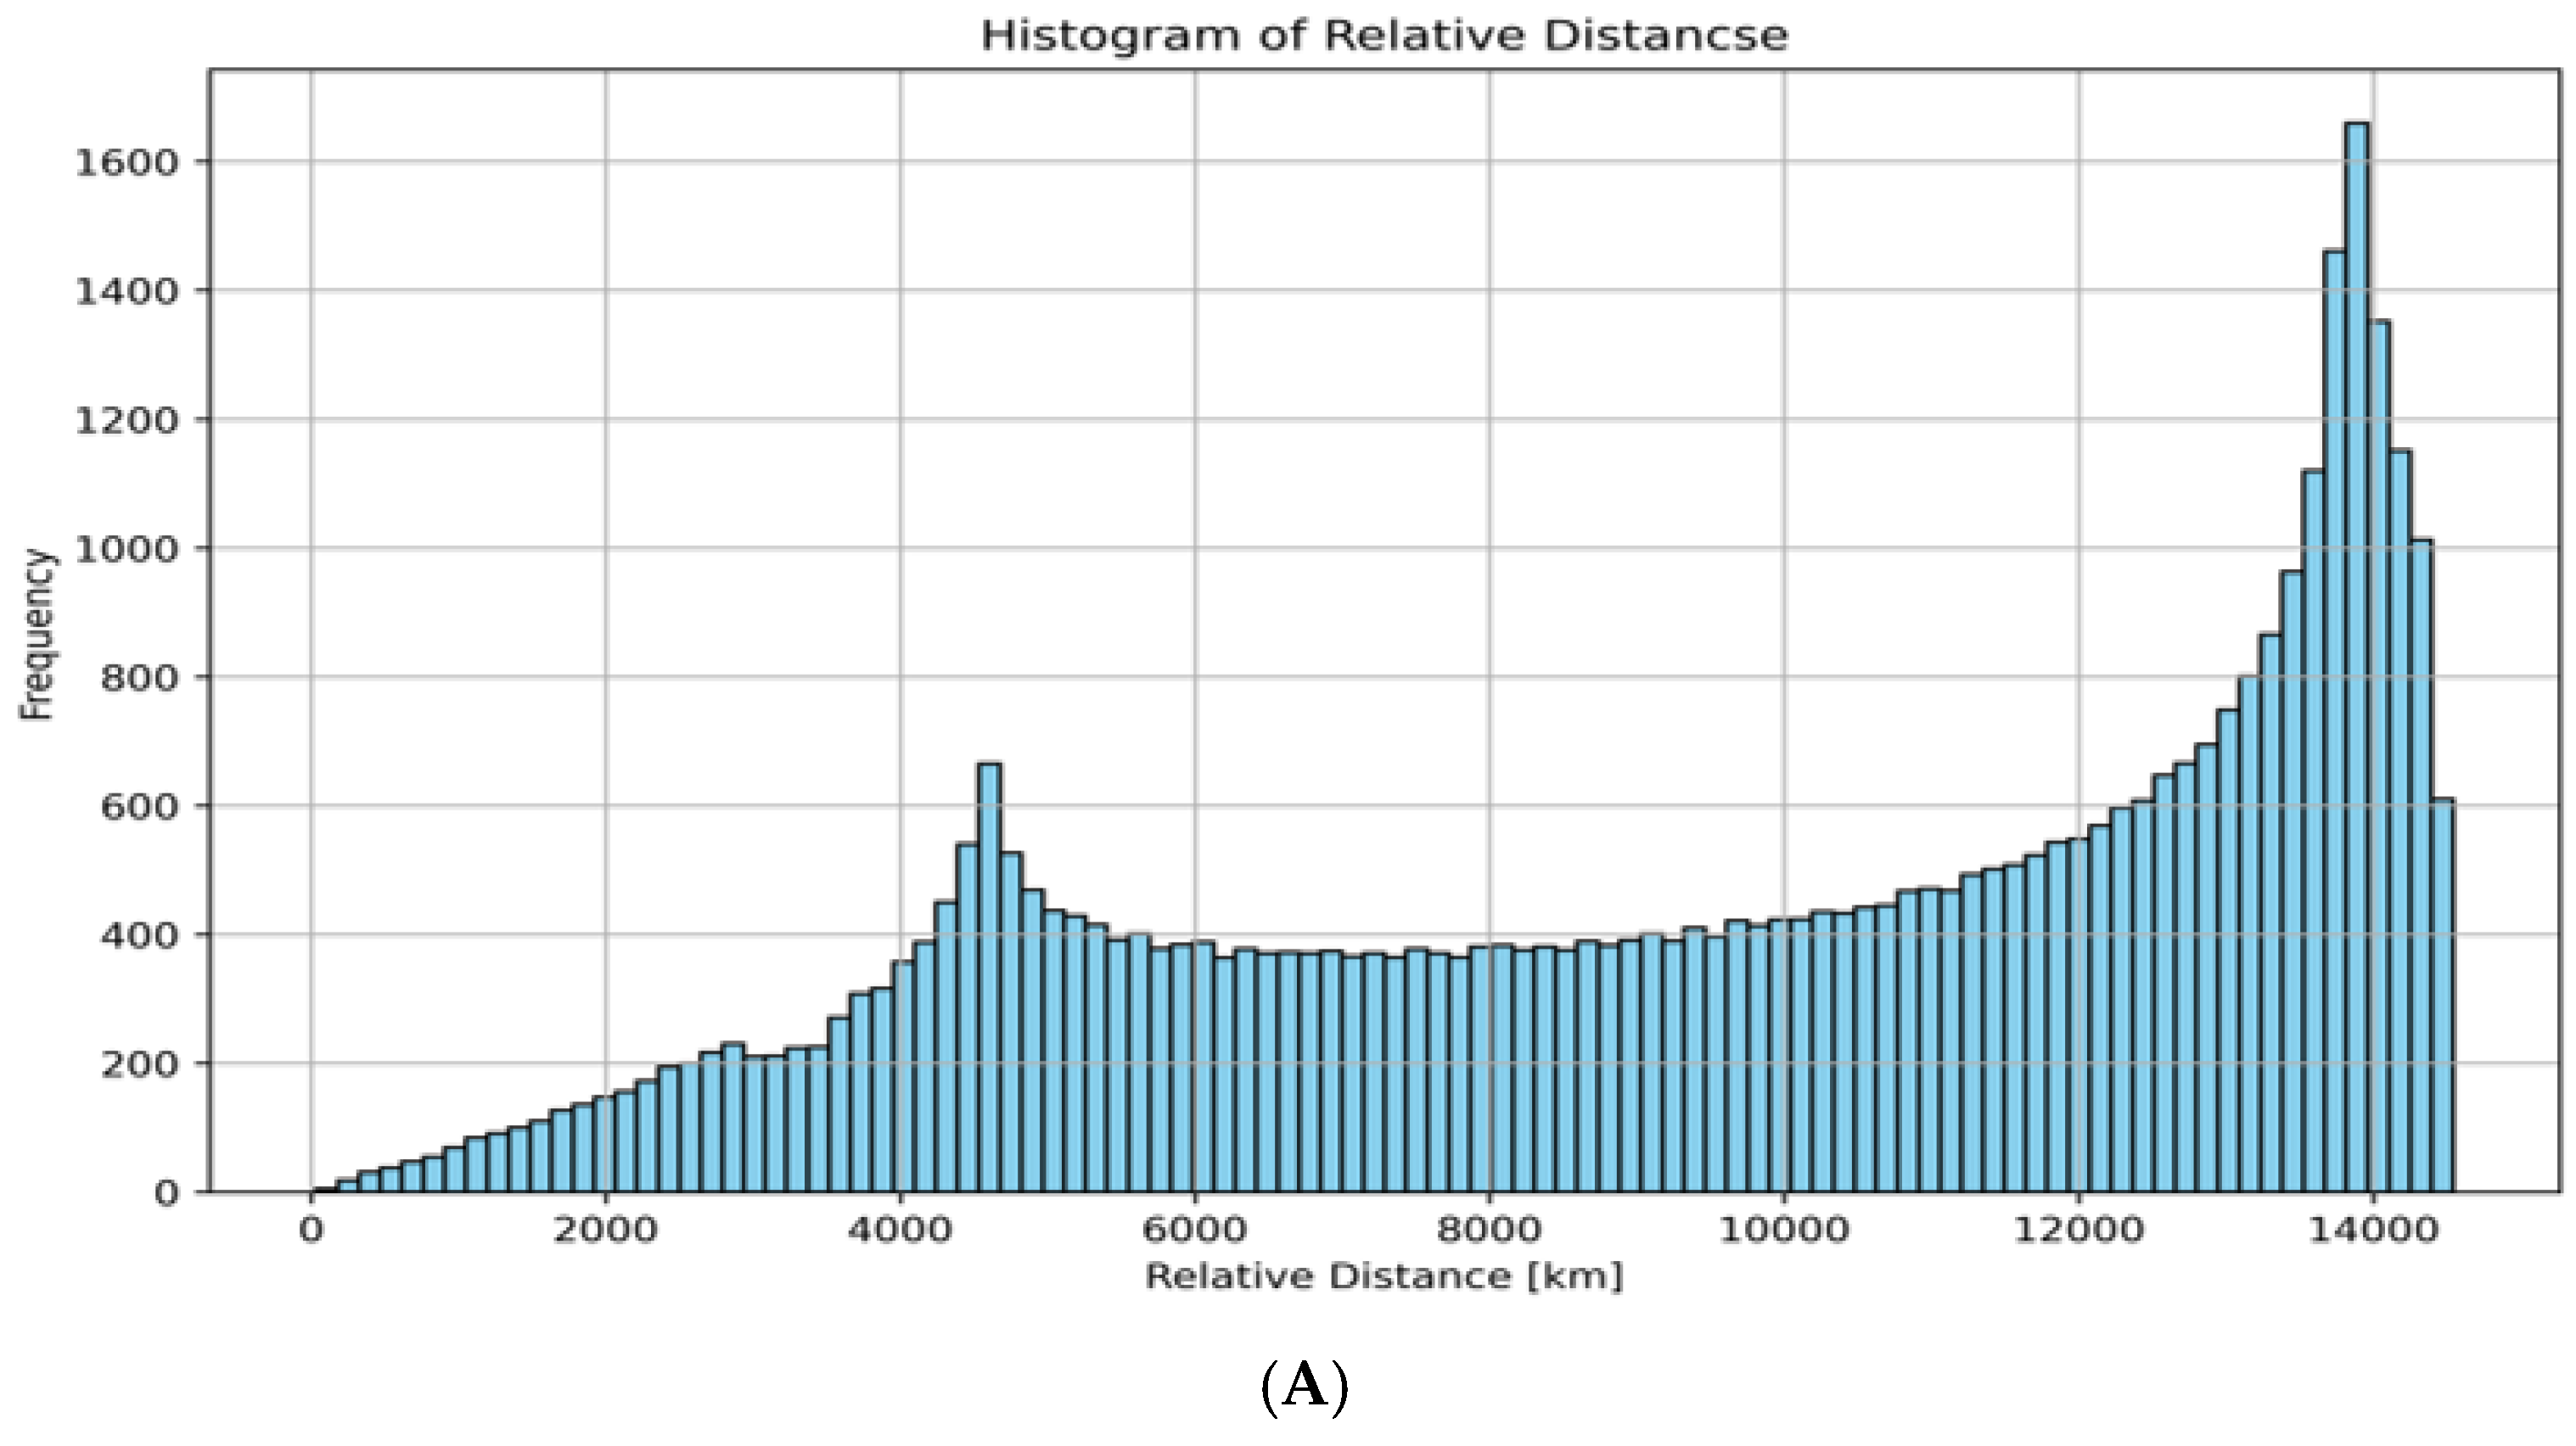
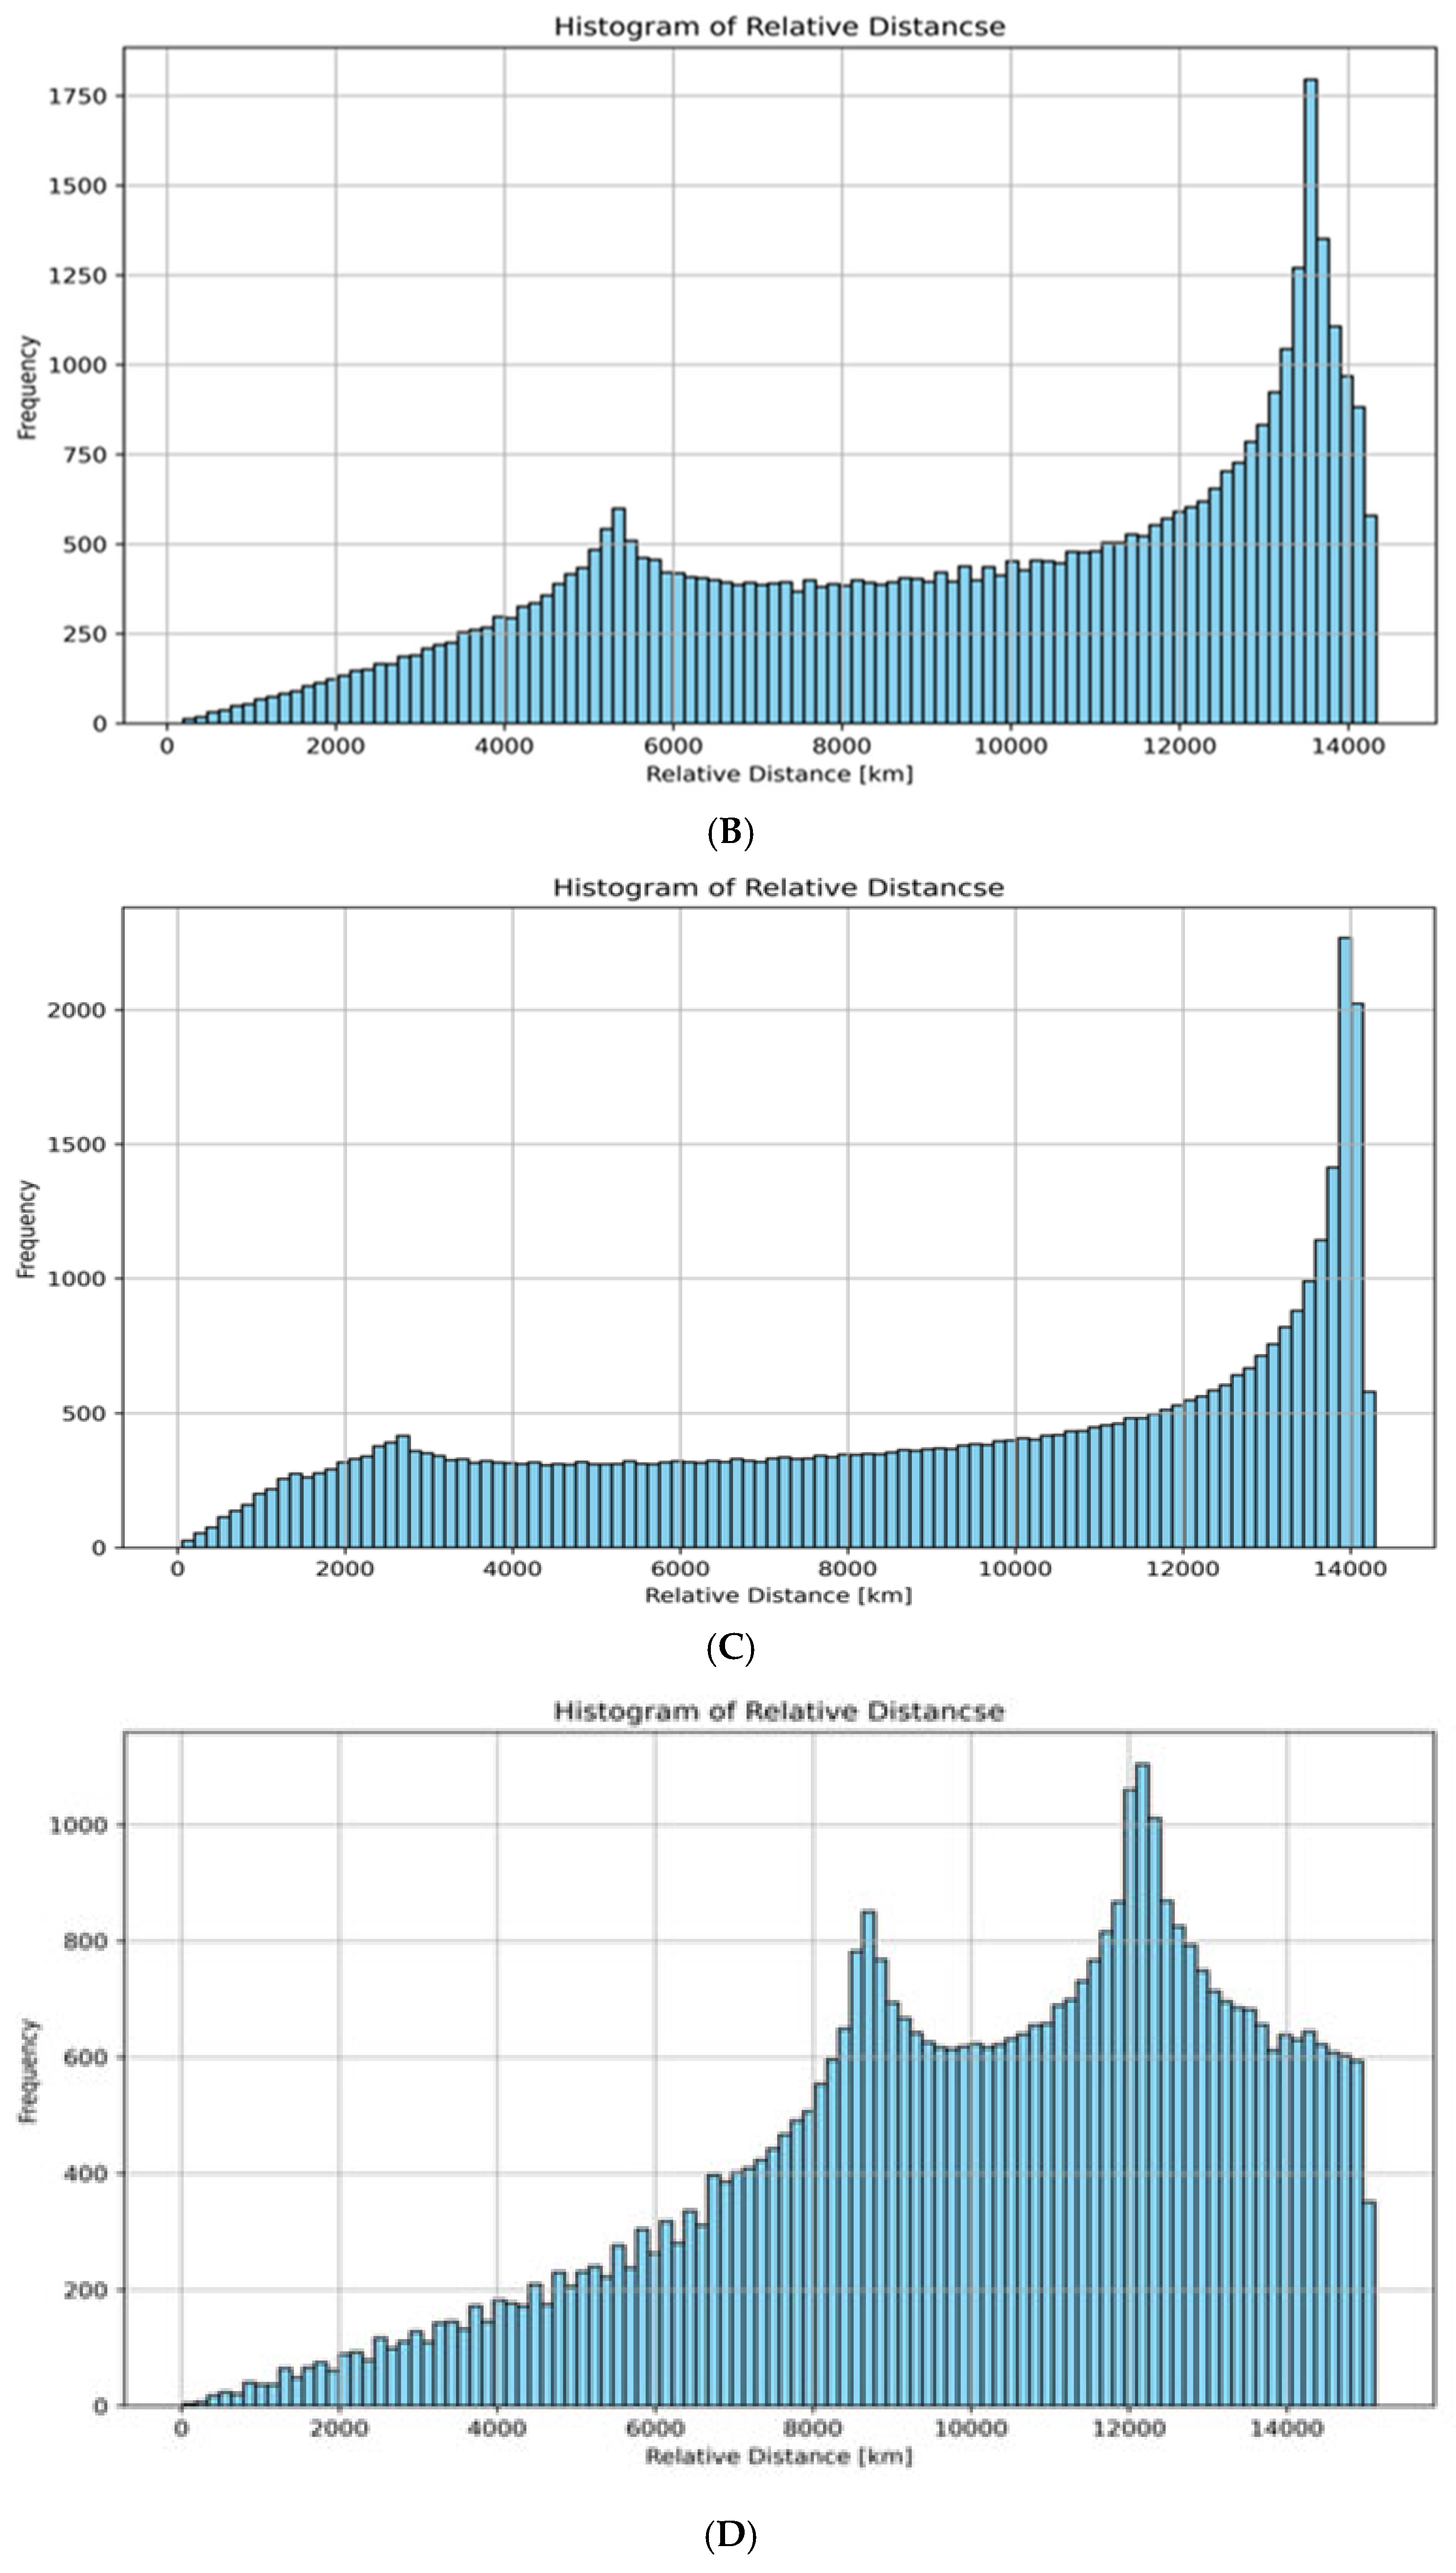
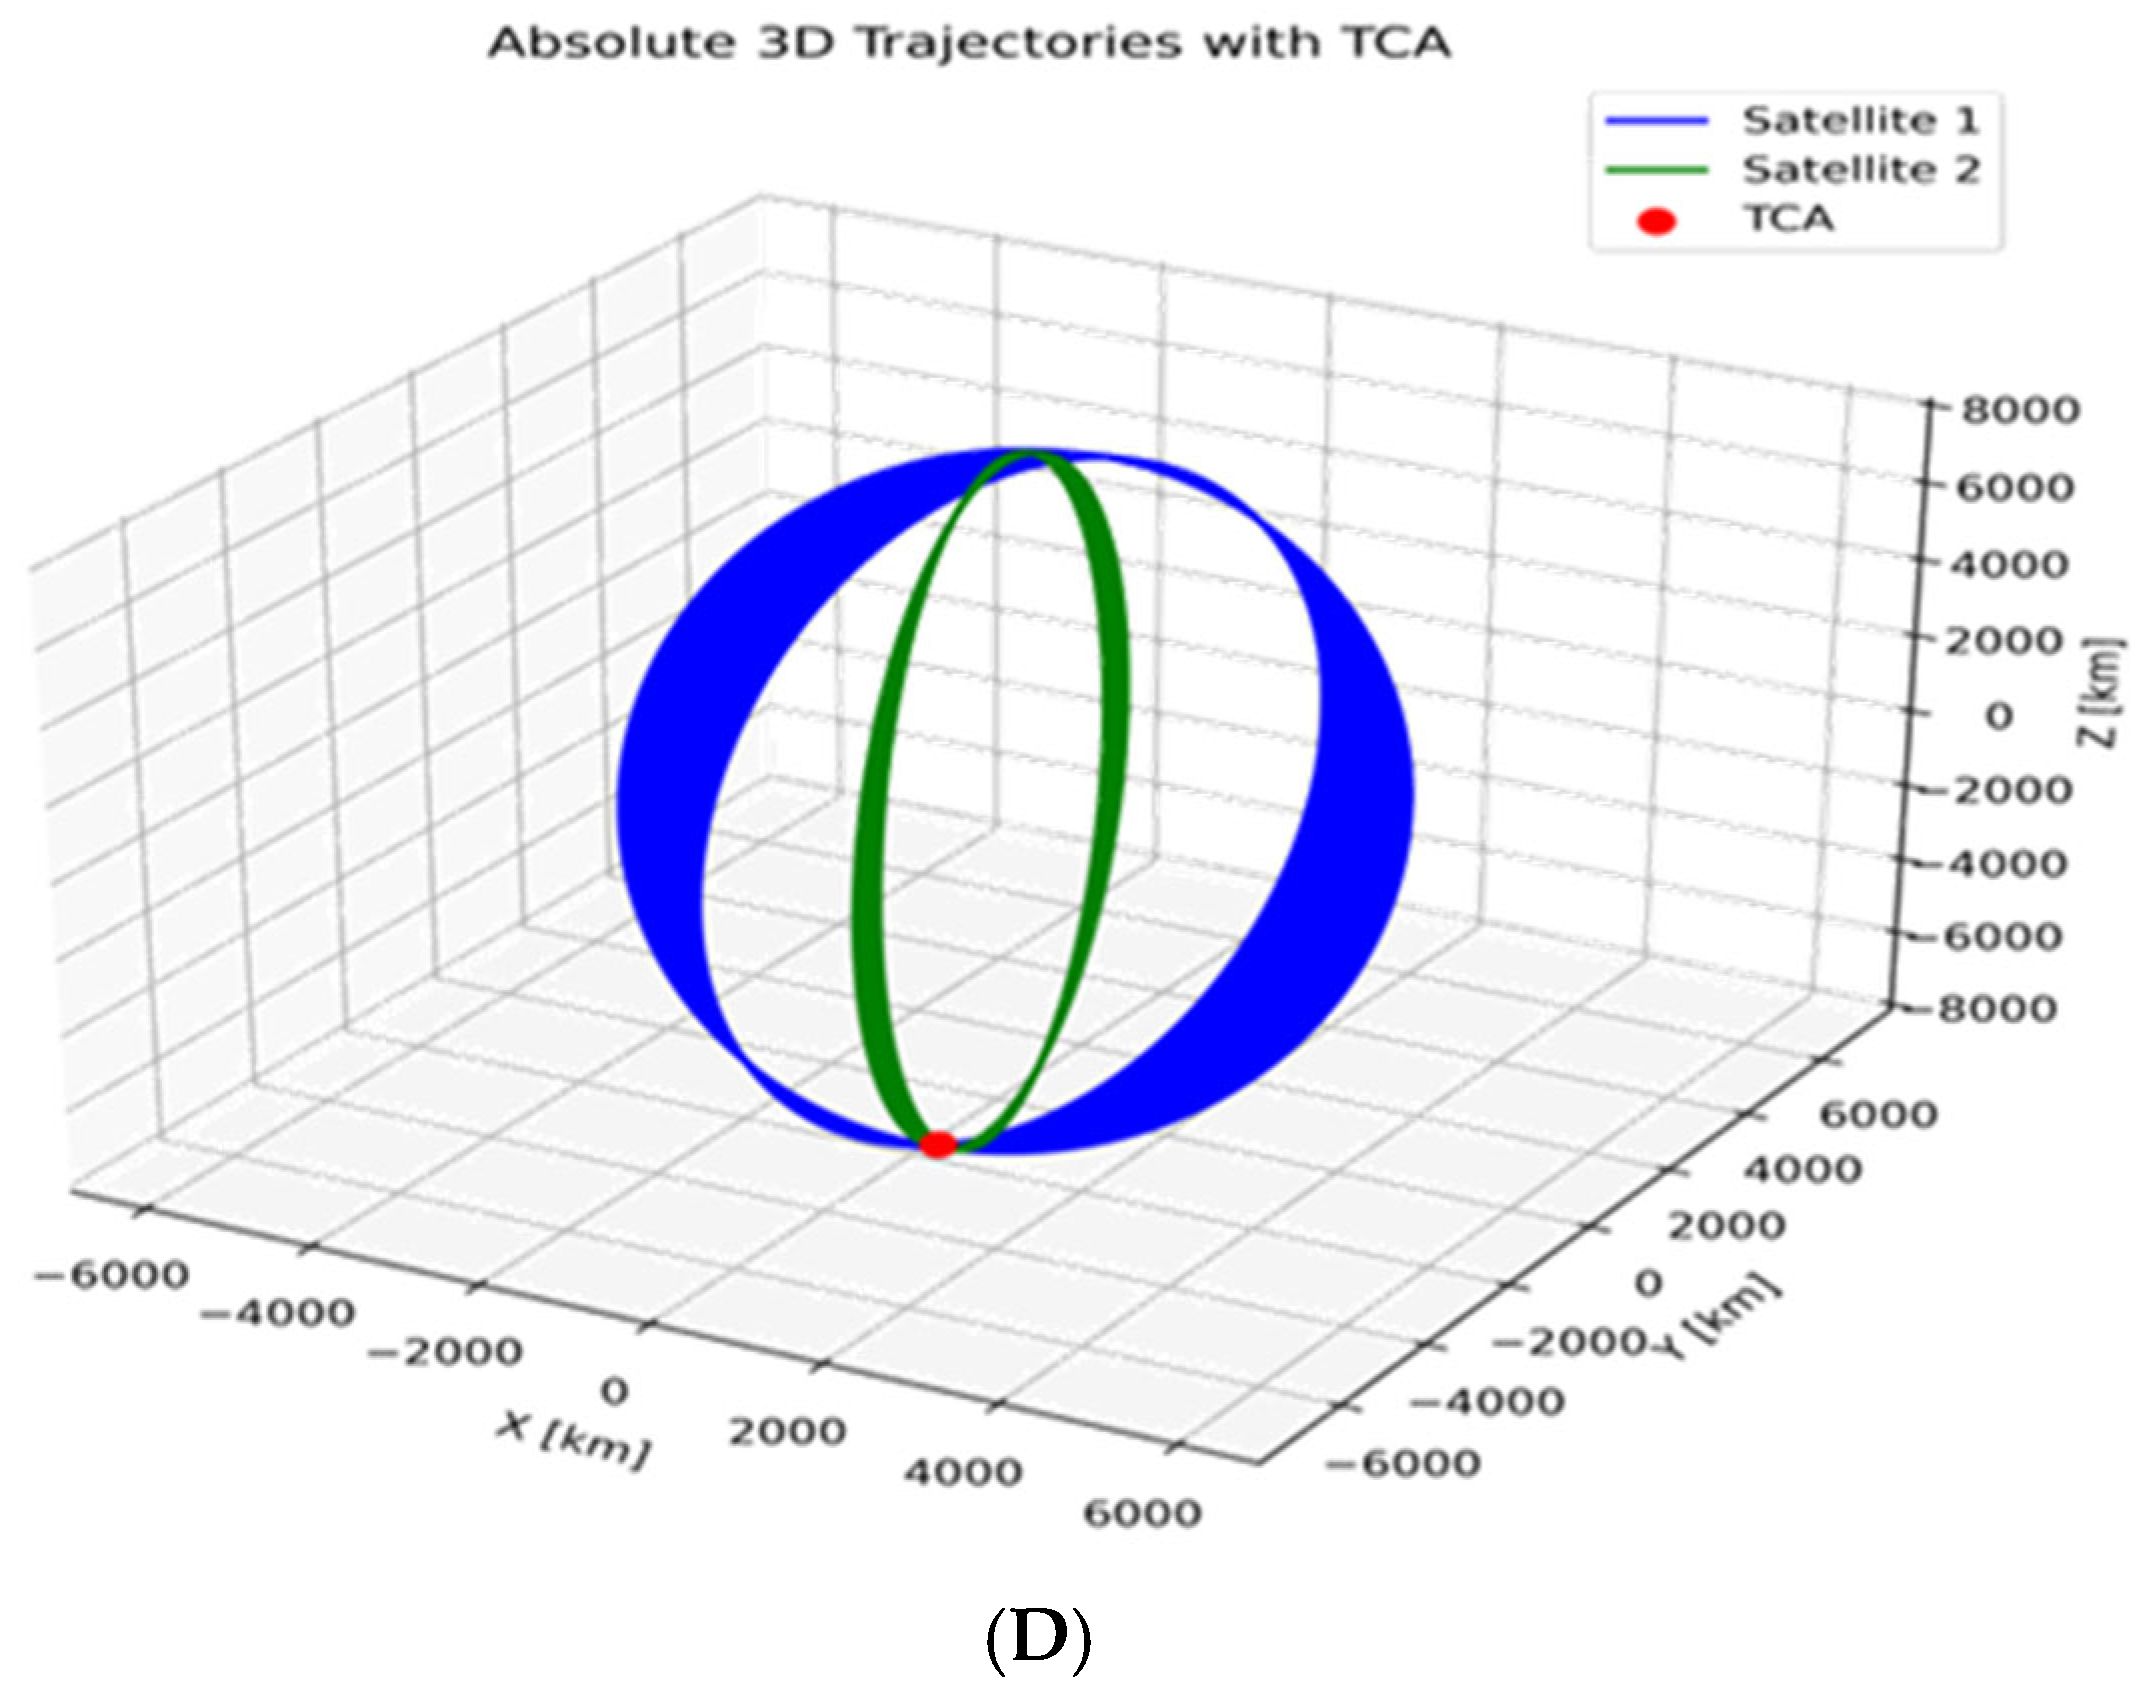
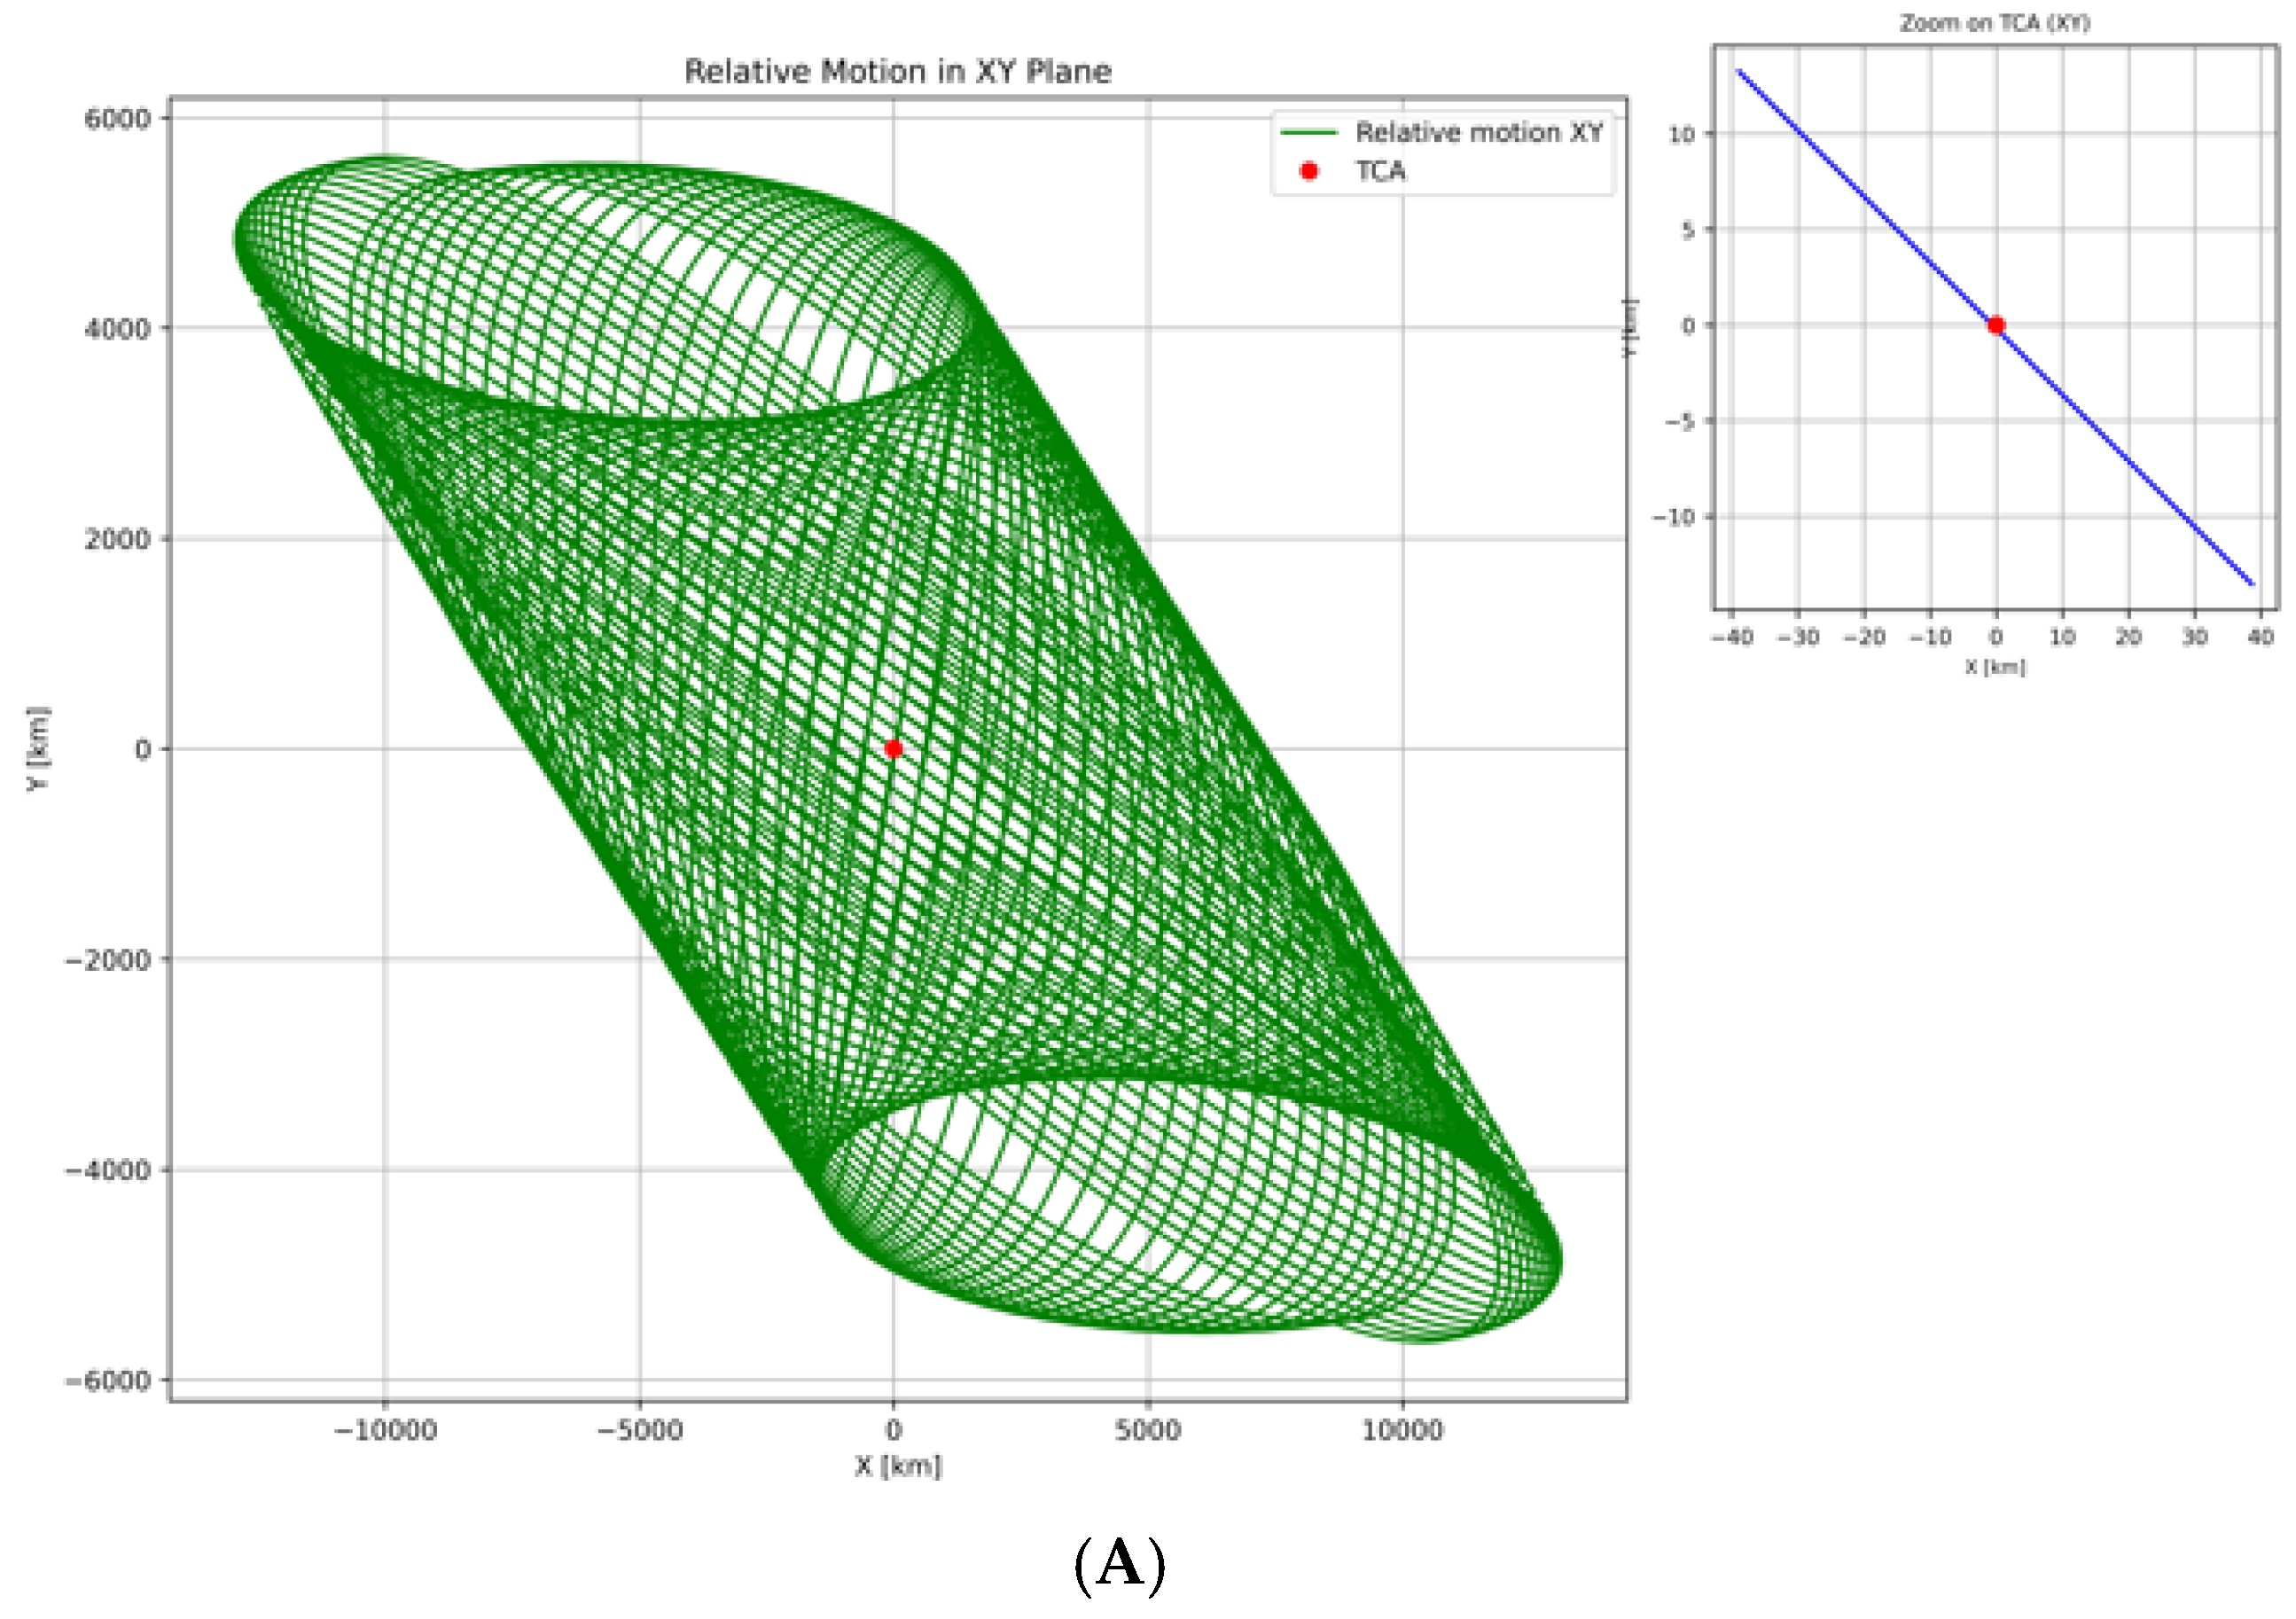
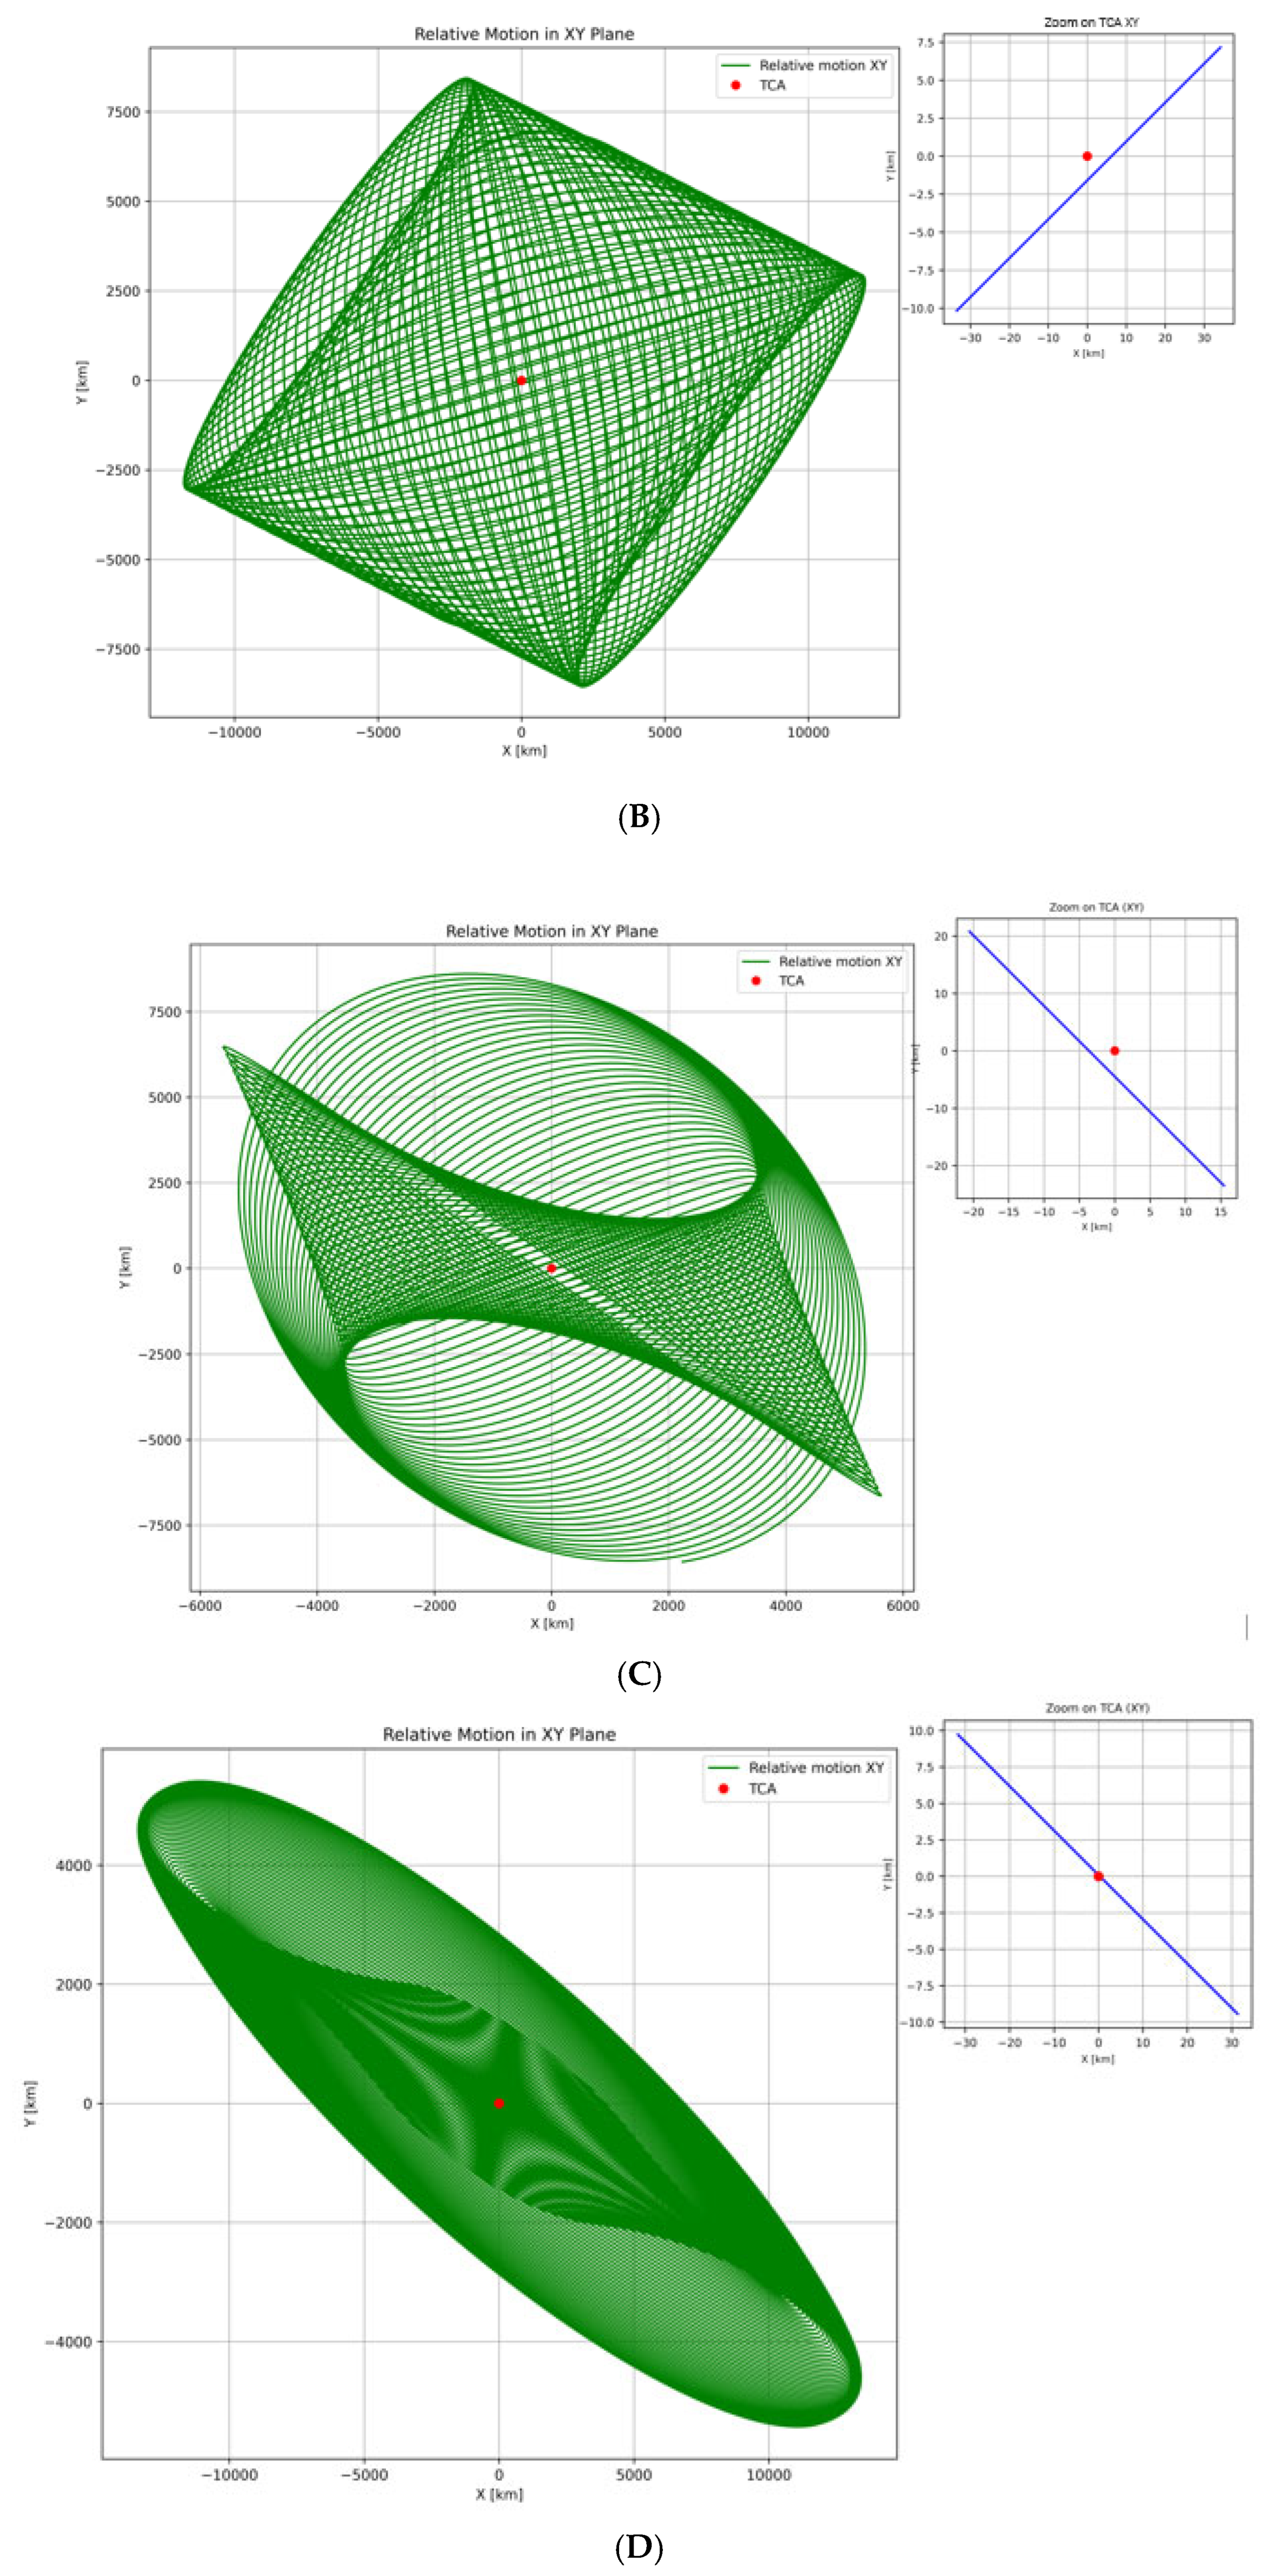
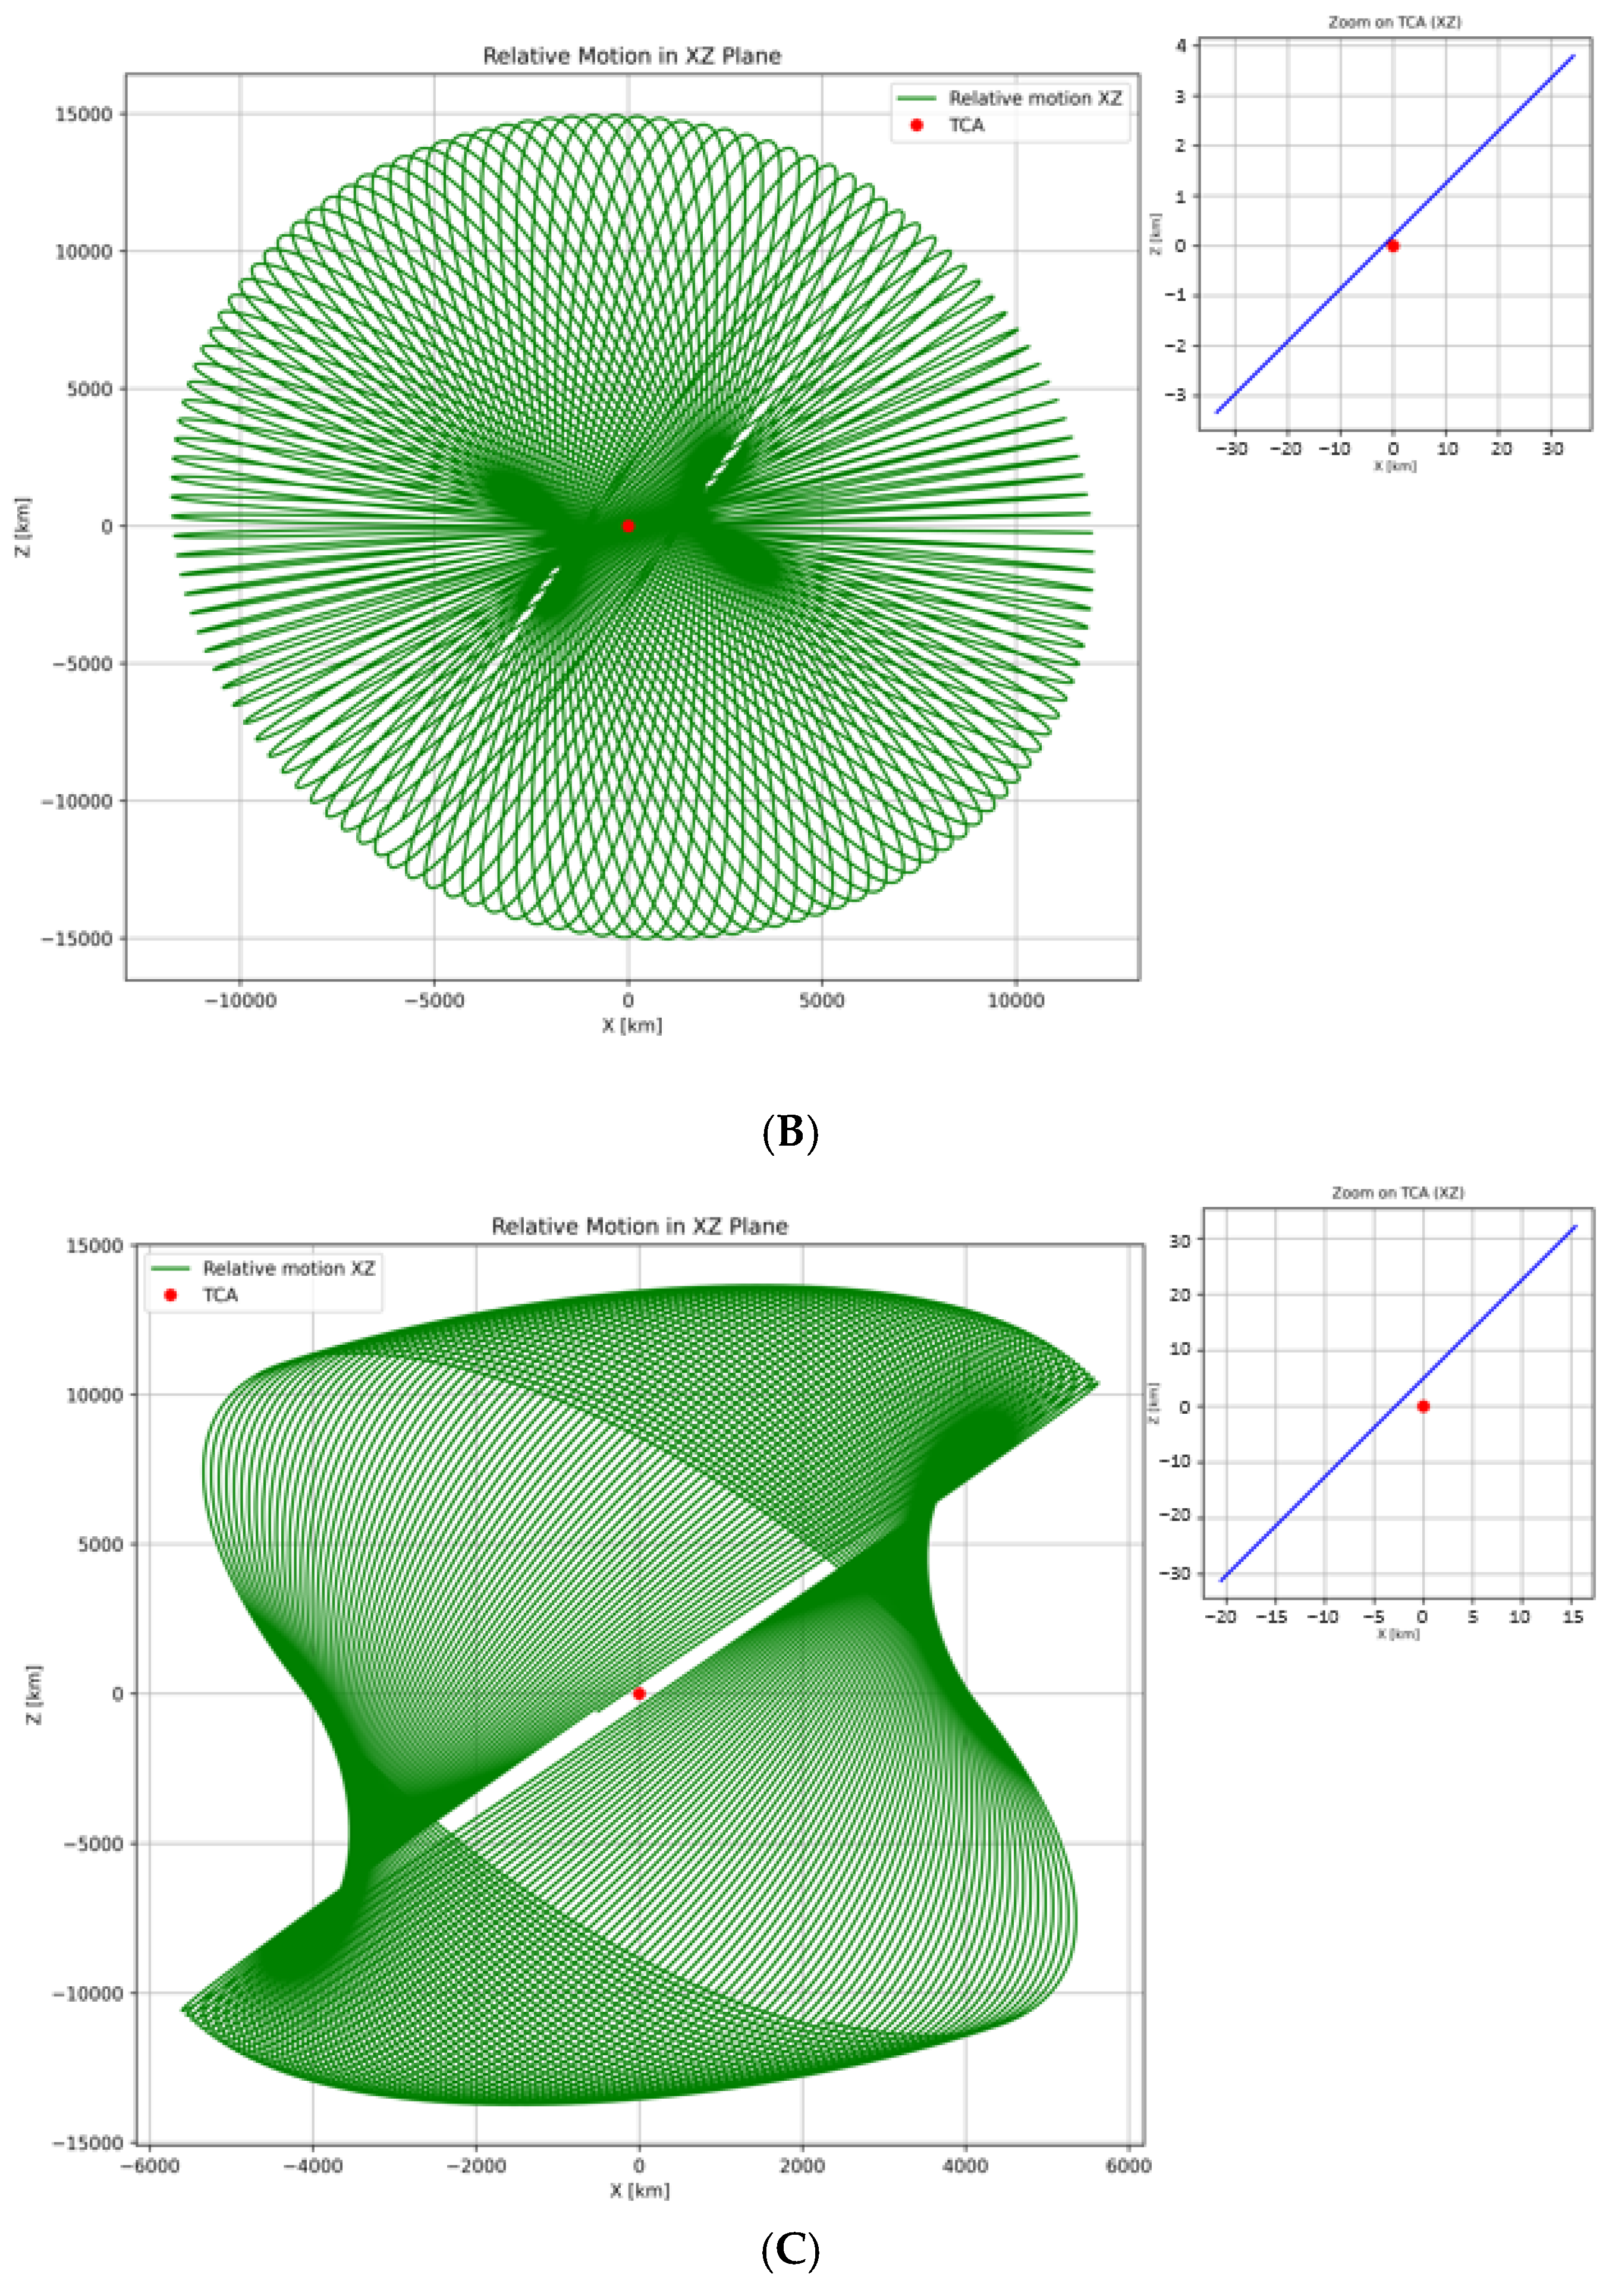
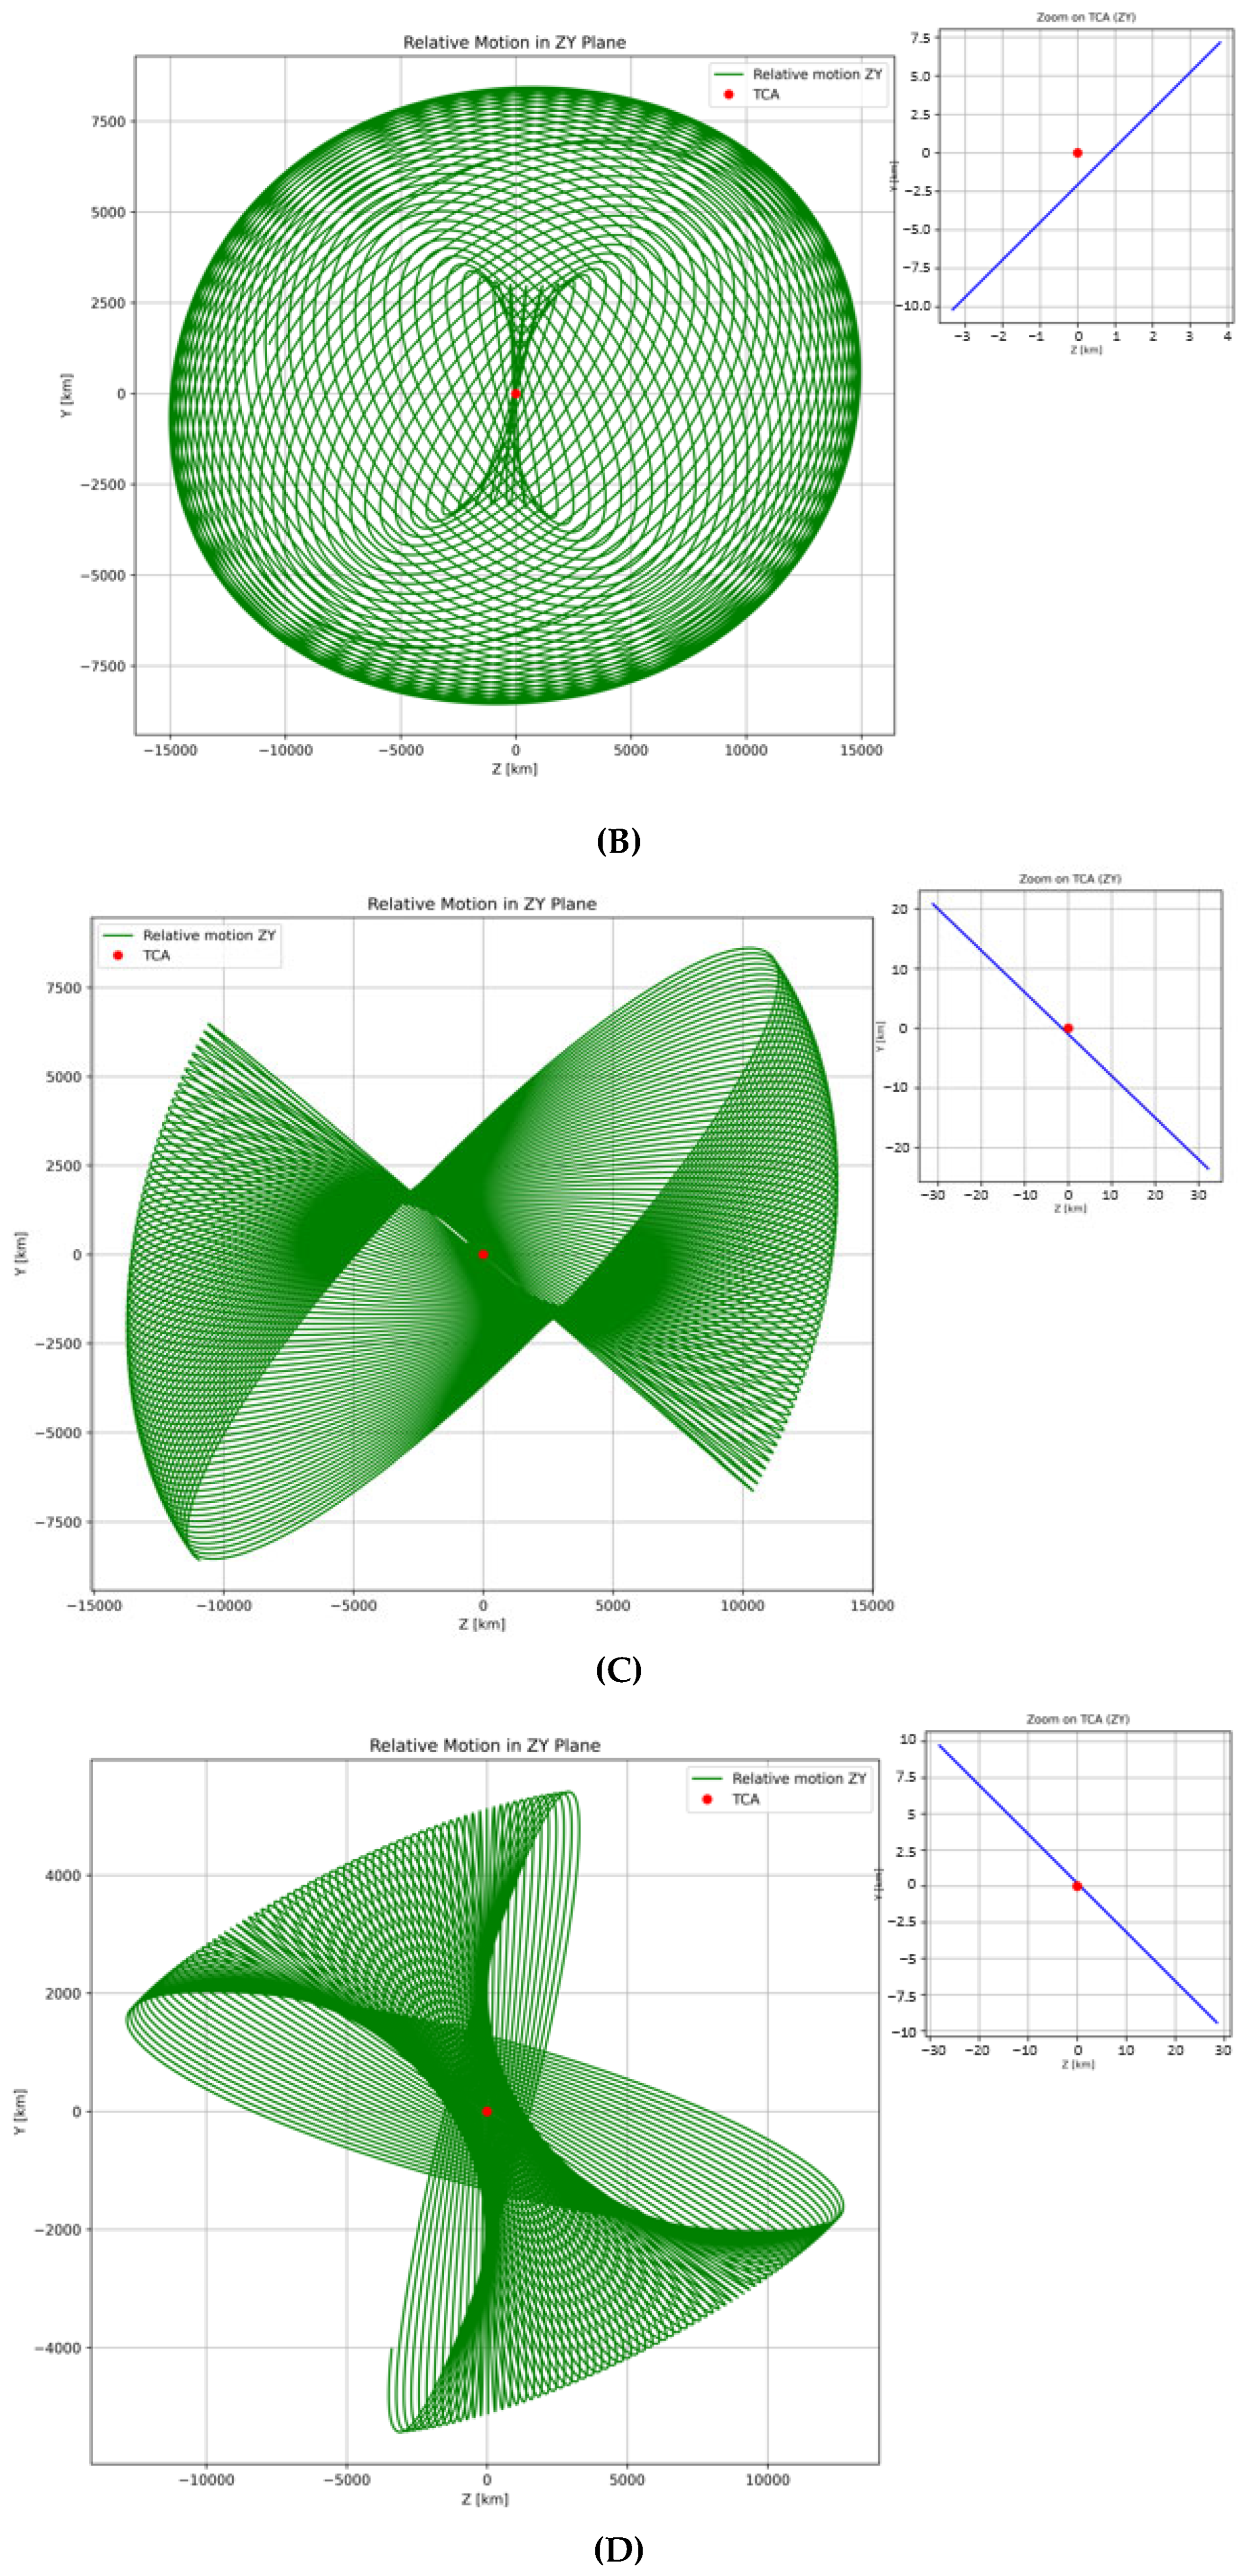
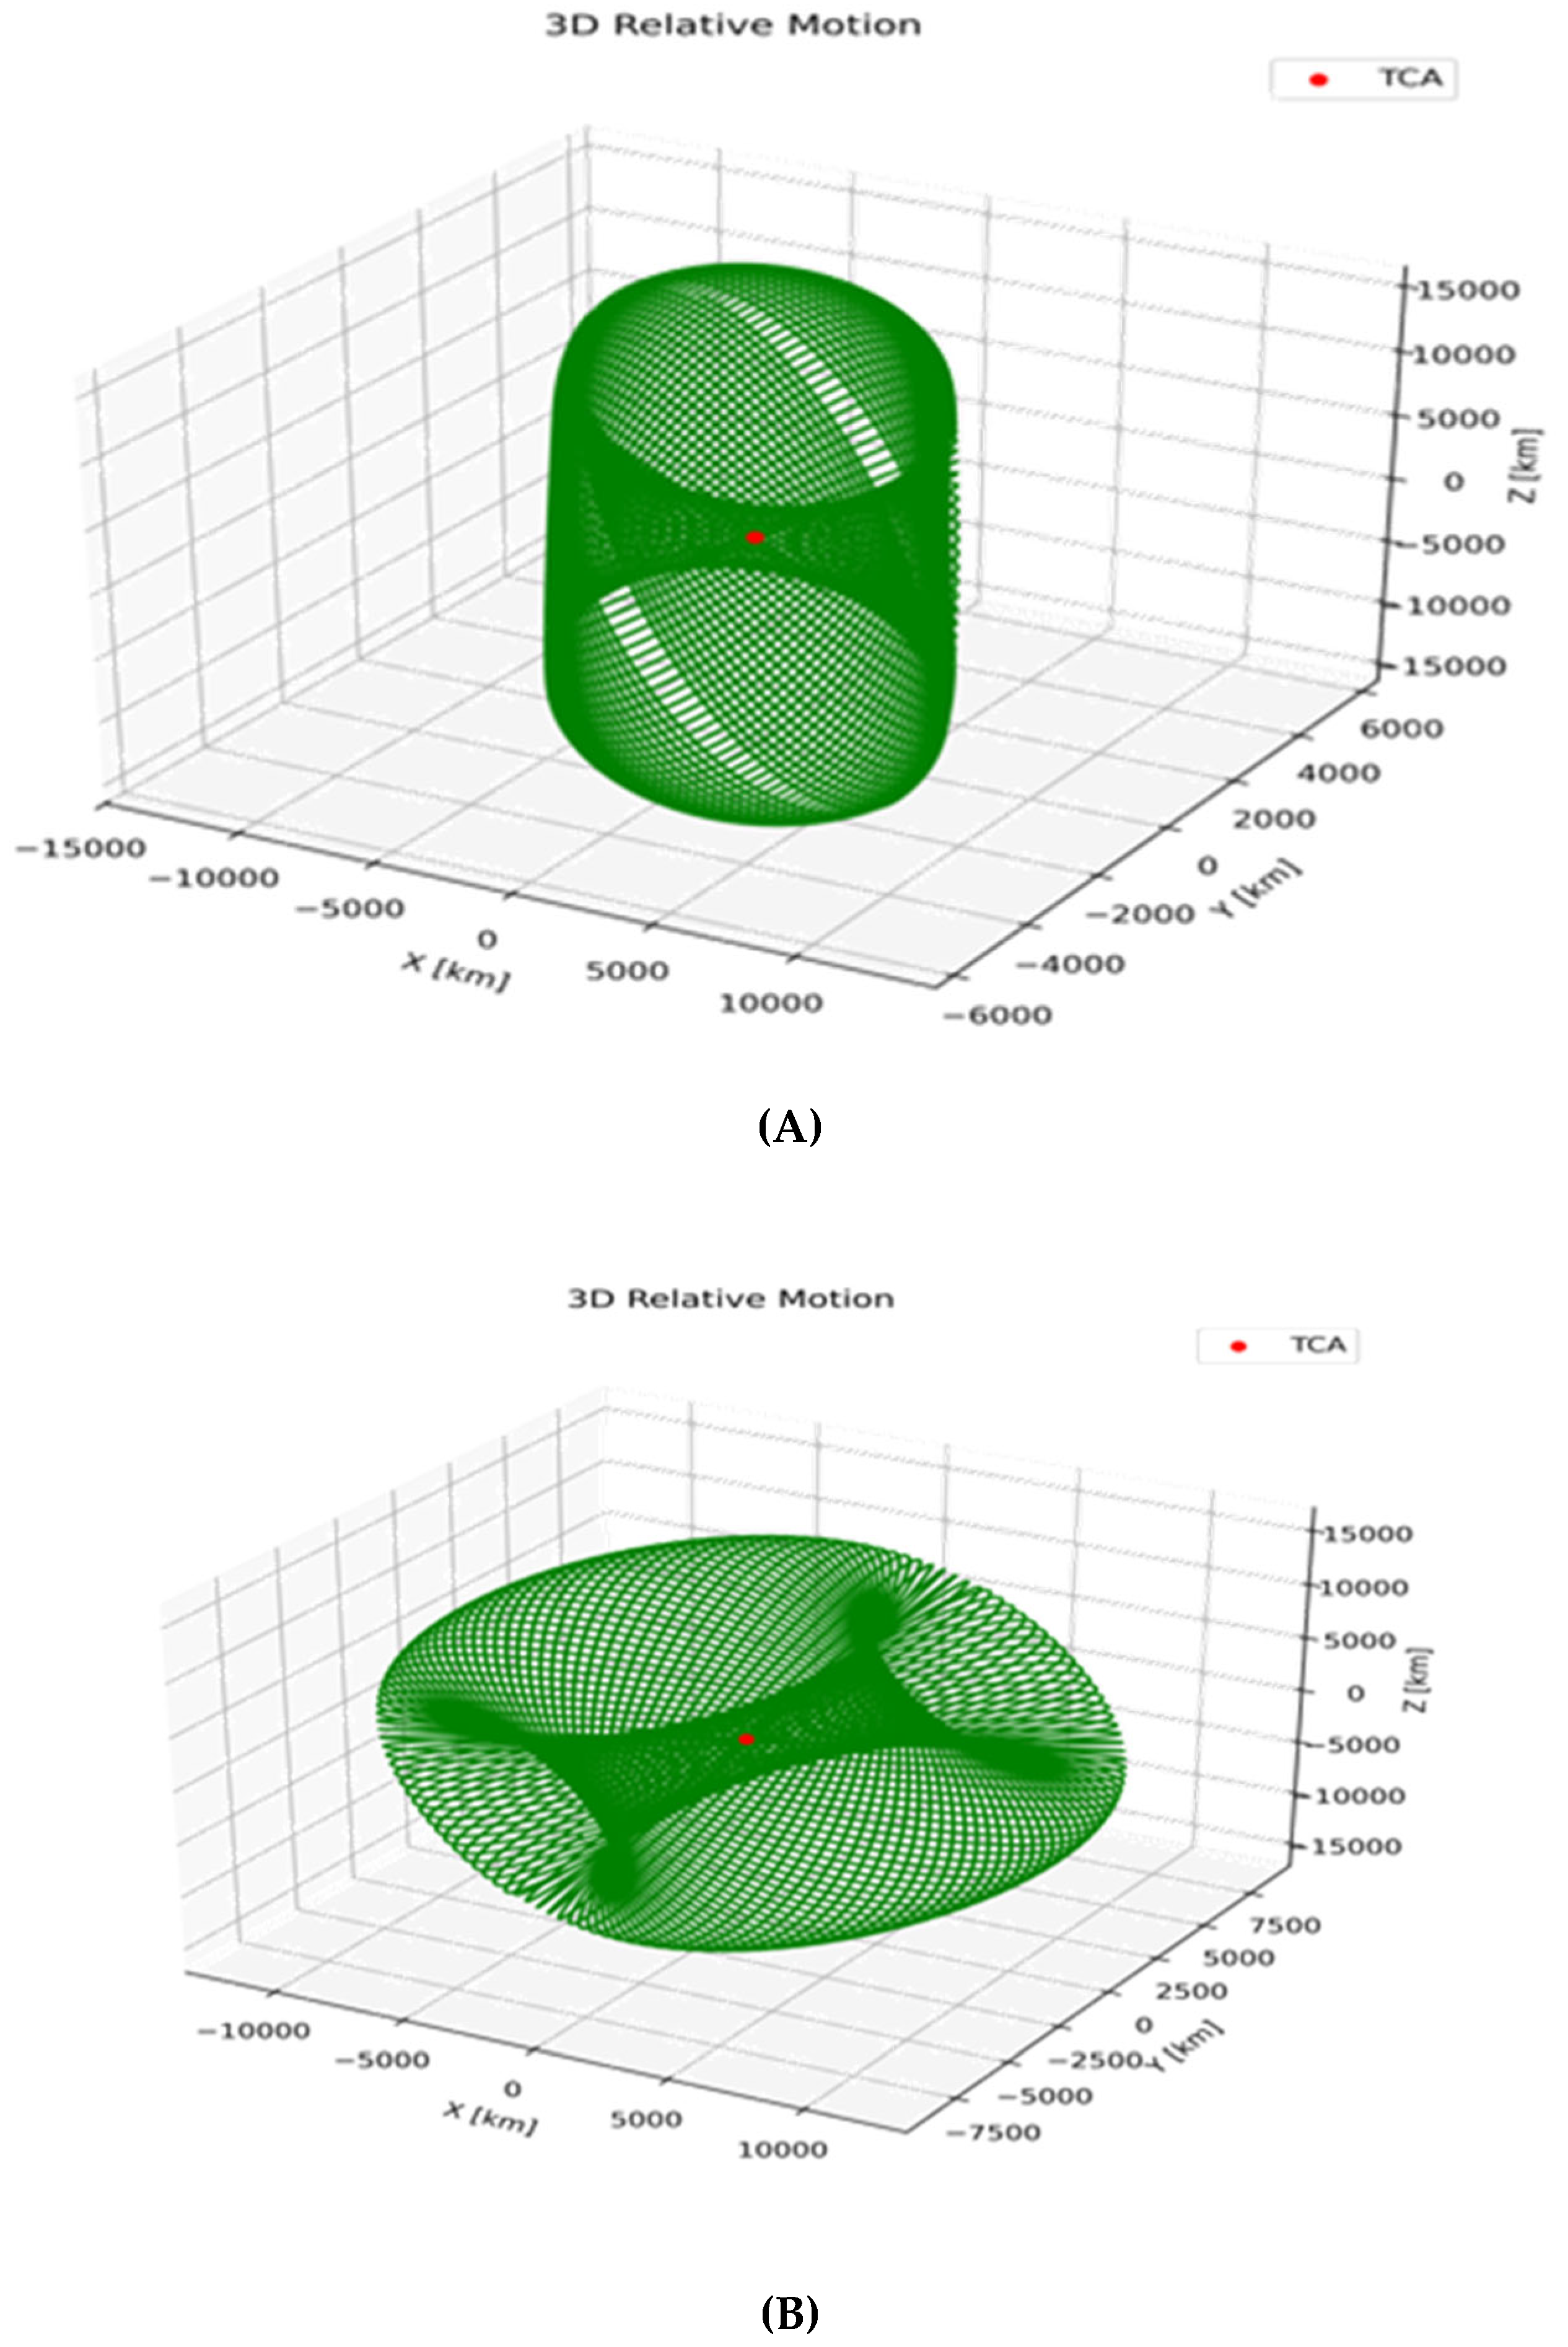
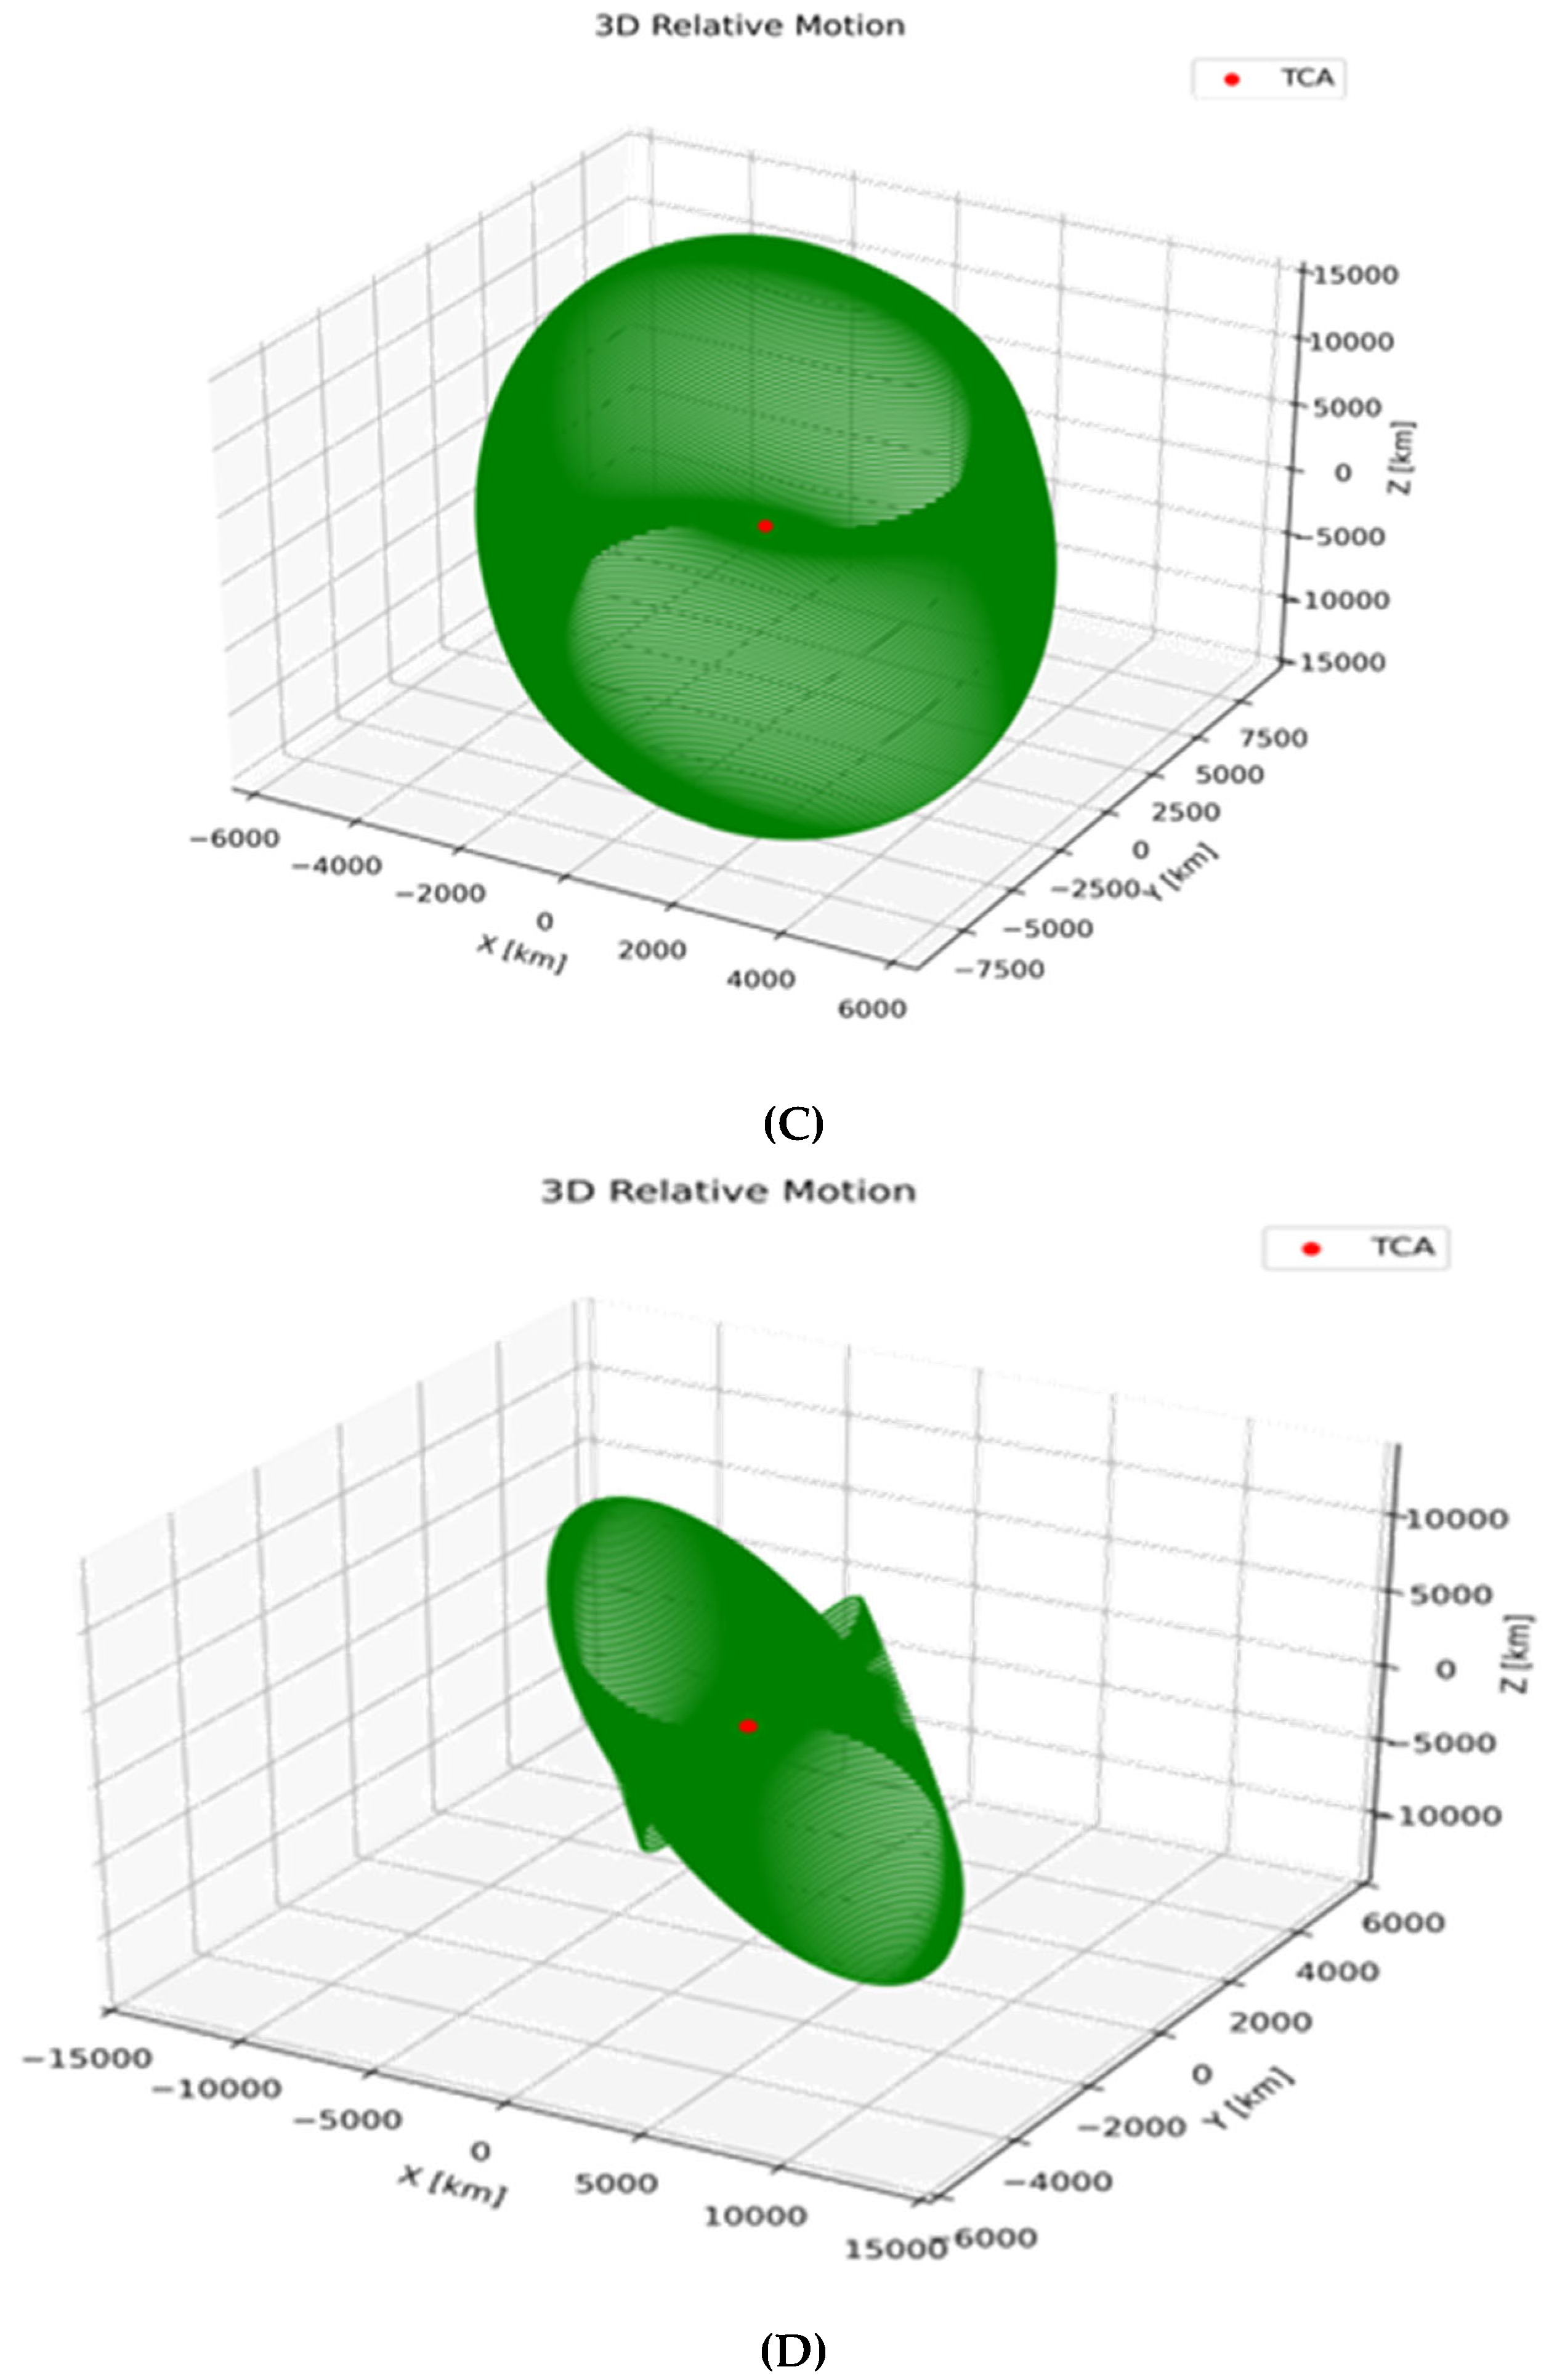
3.2. Case Study Results and Relative Motion Analysis

This section presents the core results from the evaluated conjunction cases, integrating numerical deviations, statistical behavior, and relative motion analysis. Table 2 summarizes the deviations in time of closest approach (TCA) and miss distance across eight selected events. The multi-stage method consistently reduces temporal error, with spatial accuracy varying depending on encounter geometry and object dynamics.
The accuracy of determining the time of closest approach and the corresponding minimum distance depends on precise estimation of satellite and debris orbital states. The evaluation process began by applying the Improved Critical Region Estimation (ICRE) method to identify an approximate TCA within a 120 h prediction window from the TLE epoch, aiming to locate a preliminary point near the expected minimum distance. The next step refined the estimation by narrowing the time interval to 10 min around the TCA estimated by ICRE, enhancing temporal resolution and focusing the search. In the final stage, the multi-stage method applied a 1-millisecond time step over a 3 s window centered on the refined TCA, enabling precise determination of both the TCA and the minimum distance (see Figure 5).
Table 2 presents a detailed comparison between the estimated conjunction results obtained using the proposed multi-stage refinement method and reference values derived from Space-Track data across eight different conjunction cases. For each case, the time of closest approach (TCA) and the minimum separation distance are reported separately for both the proposed method and the comparison data. The deviations in TCA and distance are shown as independent error indicators. No assumption is made that the miss distance deviation results solely from the TCA difference. To account for the difference in the time of epoch between the TLE data and the reference epoch used in the analysis, orbital element propagation was performed to unify the temporal reference frame. This step ensures consistency in the comparison by aligning the orbital states to a common epoch before conjunction assessment.
The proposed method achieved an average TCA deviation of 3.1 × 10 2 seconds, reflecting consistent temporal precision. The use of a final refinement step with temporal resolution down to 7 × 10 3 seconds enables accurate localization of the closest approach within each encounter. Nevertheless, the achievable accuracy remains inherently limited by the quality of the input orbital data, particularly due to the simplified dynamics of the SGP4 propagator, the inherent uncertainty in TLE state vectors, and the absence of formal covariance information. In seven out of eight evaluated cases, the TCA deviation remained below 0.3 s, confirming the effectiveness of the progressive time refinement strategy. The average deviation in minimum separation distance across all cases was 0.688 km. This variability reflects the influence of encounter geometry, numerical sensitivity to propagation conditions, and potential differences between the comparison data source and the TLE-based approach. The results confirm that the structured, multi-stage method enhances the fidelity of temporal estimation, while spatial accuracy remains dependent on orbital dynamics and input fidelity. Figure 6A–D, Figure 7A–D and Figure 8A–D presented in this study illustrate key aspects of conjunction analysis and collision risk estimation using the proposed hybrid methodology. Figure 6A–D visualize the offset in distance over time for four selected conjunction events. These plots confirm that the distance follows a clear curve with a distinct minimum point, validating the need for precise temporal resolution. Figure 7A–D provide histograms of relative distances for the same cases. The distribution of distances is concentrated around the minimum value, reflecting the consistency of close approach estimates and supporting probabilistic modeling. Figure 8A–D show the absolute 3D trajectories of the objects during the conjunctions. The visual trajectories confirm proximity and alignment between objects, supporting the physical plausibility of the predicted encounters. Figure 9A–D, Figure 10A–D and Figure 11A–D illustrate the anticipated relative motion in the XY, XZ, and YZ planes for four conjunction cases. These projections reveal curved, non-planar trajectories that emphasize the geometric complexity of close approaches. While relative motion in such scenarios is governed by non-linear dynamics, the key limitation to linear or Gaussian assumptions arises from the propagation of uncertainty through inherently non-linear transformations. Although small perturbations can maintain approximate Gaussianity under local linearization, significant deviations and extended propagation intervals typically distort the shape of the uncertainty distribution. This behavior underscores the necessity for sampling-based or non-Gaussian models in high-fidelity conjunction assessment. Figure 12A–D combine the three dimensions into a comprehensive 3D representation of relative motion. This visualization captures the entire interaction trajectory between each pair of objects. The 3D paths exhibit curved, non-planar motion, which justifies the application of spline interpolation and brute-force temporal refinement instead of simplified approximations. Together, the figures confirm that the proposed multi-stage refinement approach enhances TCA estimation and aids in practical collision risk assessment.

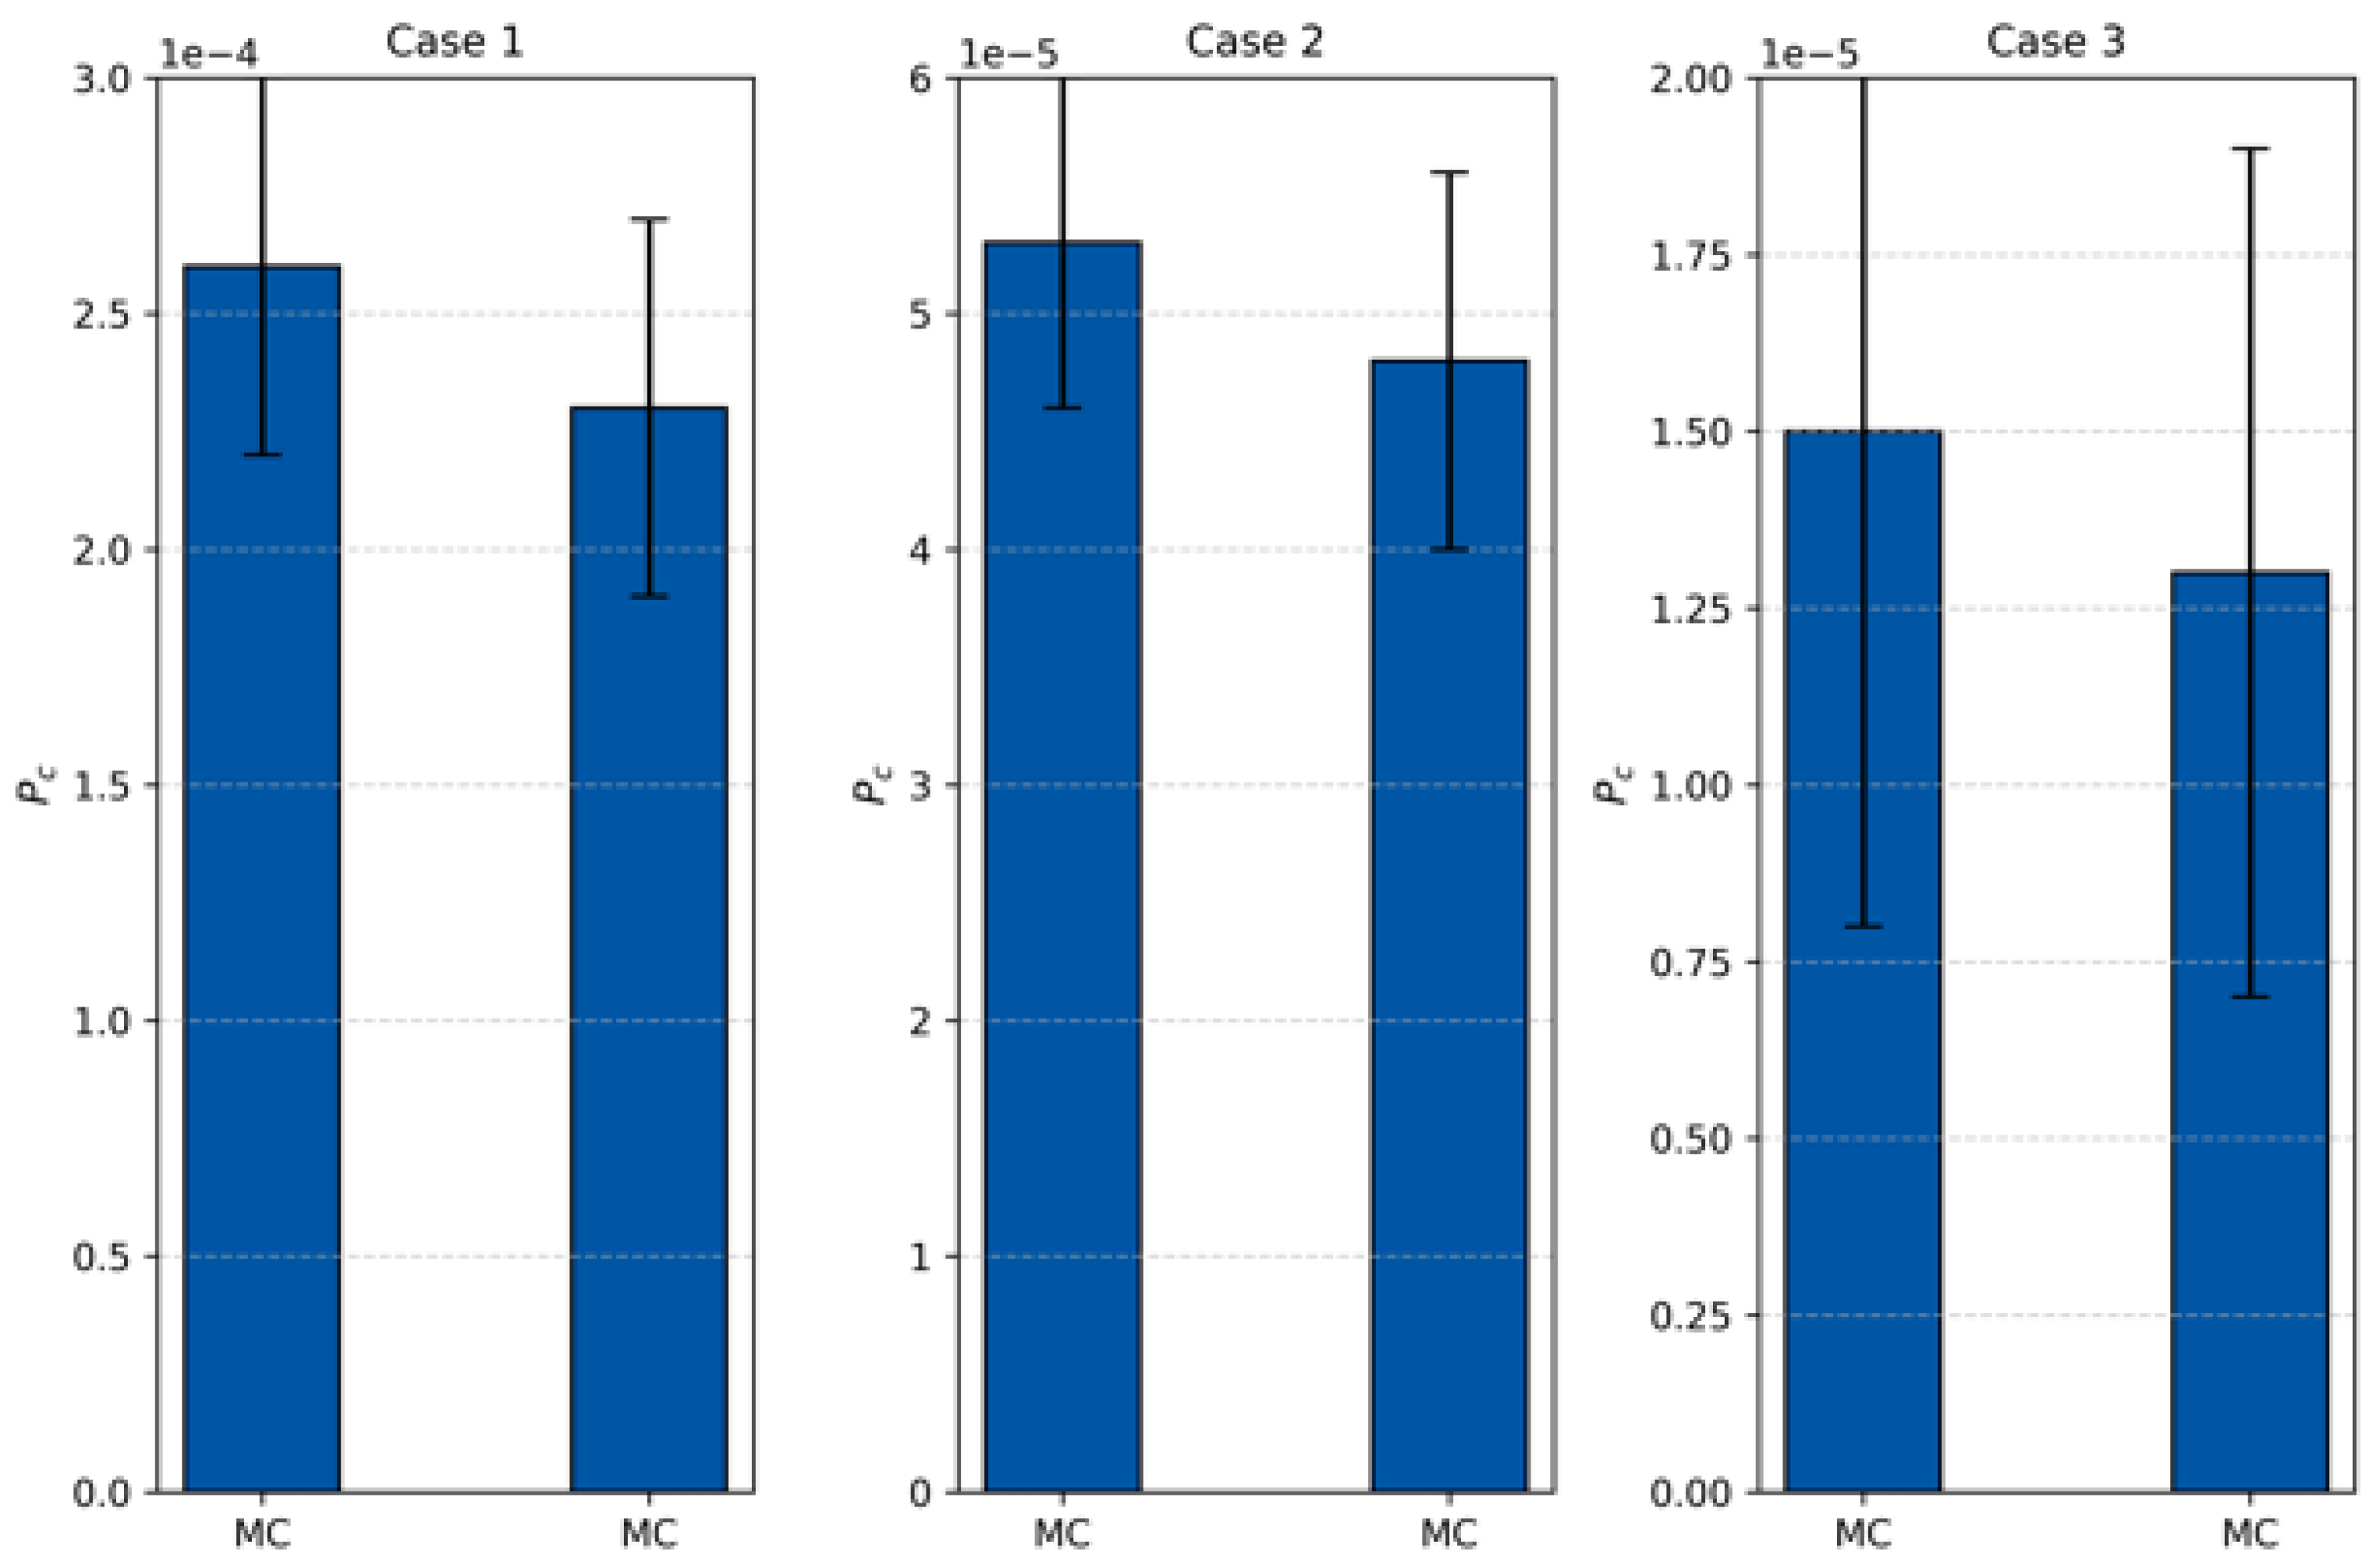
3.3. Collision Probability Estimation

Four representative conjunction cases were selected from Table 2, specifically, the ID numbers” 29798 & 60876, 61278 & 54616, 48826 & 25319, and 41531 & 60251”, to evaluate the accuracy of collision probability estimation using two methods: standard Monte Carlo and Differential Algebra Monte Carlo. The results were compared with reference data obtained from the Space-Track platform. Three test scenarios were defined to examine the performance of both methods under varying initial conditions. The three test cases described in Table 3 were designed as synthetic scenarios to evaluate the performance of collision probability estimation methods under controlled uncertainty configurations. These cases do not directly correspond to the real-world conjunctions listed in Table 2. Instead, they use assumed mean relative positions at the estimated TCA, defined in the local Radial–Transverse–Normal (RTN) frame of the primary object. For example, In Case 1, the mean relative position between the objects was set to [20, 0, 0] meters, with isotropic standard deviations of 50 m in all directions. In Case 2, the mean relative position was increased to [40, 0, 0] meters, and the standard deviations were defined as [100, 80, 60] meters along the x, y, and z axes, respectively. Case 3 involved a mean relative position of [100, 0, 0] meters, with standard deviations of [150, 120, 100] meters along the corresponding axes. In all cases, a uniform collision threshold distance of 5 m was applied. The covariance matrices used in the synthetic test cases are fixed and defined a priori for all Monte Carlo evaluations. They are not adjusted per case to fit reference values but selected to represent typical uncertainty scales consistent with LEO satellite conjunctions derived from TLE data. In the absence of publicly available formal covariance for the involved objects, a diagonal structure is assumed. The same covariance values are applied consistently across all cases to ensure the results’ comparability and avoid any tuning that might bias the probability estimates toward agreement with external references. To model orbital uncertainty in the absence of formal covariance data, a diagonal Gaussian distribution was applied to perturb the initial state vector of the primary object in each conjunction scenario. Standard deviations were set to 0.5 km in the radial direction, 1.0 km along-track, and 0.5 km cross-track, consistent with short-term TLE position errors reported in LEO. Monte Carlo sampling using this distribution revealed that typical variations in the time of closest approach (TCA) remained within ±2 s, with miss distance deviations generally below ±1 km. These values quantify the sensitivity of conjunction geometry to small perturbations in the initial state and justify the probabilistic approach adopted in this study. Table 3 and Figure 13 illustrate the comparison of collision probability estimates using the Monte Carlo (MC) and Differential Algebra Monte Carlo (DAMC) methods for three different cases. Each subplot represents one case, with associated error bars indicating the standard deviation of the computed probabilities. In Case 1 of each conjunction scenario, which represents the closest approach and highest collision risk configuration, the estimated probabilities were the highest among the three tested configurations. The MC method reported average probabilities around 2.45 × 10⁻⁴ with a standard deviation of 1.6 × 10⁻⁵, while DAMC estimates averaged approximately 2.20 × 10⁻⁴ with a lower standard deviation of 1.4 × 10⁻⁵. These estimates aligned closely with the real collision probabilities reported from Space-Track, which ranged from 1.11 × 10⁻⁴ to 2.73 × 10⁻⁴, demonstrating good agreement and validating the methods’ applicability in realistic scenarios.
In Cases 2 and 3, which involved greater mean relative distances and larger standard deviations, the estimated collision probabilities decreased significantly. This inverse relationship between separation distance and collision probability was expected, as increased spatial dispersion reduces the likelihood of intersecting trajectories. In Case 2, the MC method produced probabilities ranging from 5.8 × 10⁻⁵ to 7.3 × 10⁻⁵, while DAMC values ranged from 5.2 × 10⁻⁵ to 6.6 × 10⁻⁵. In Case 3, both methods reported probabilities below 1.5 × 10⁻⁵, confirming the decreasing trend and the low-risk nature of these configurations. The minimum distances at TCA, ranging from 0.20 km to 2.93 km across the studied cases, further contextualize the probability values. Notably, higher collision probabilities in Case 1 are associated with minimum distances below 0.7 km, while cases with minimum distances above 2 km resulted in negligible probabilities. This correspondence reinforces the dependency of collision likelihood on proximity at closest approach. Methods using TLE-only propagation typically exhibit TCA errors above 1–2 s and spatial errors exceeding 1.5 km over multi-day windows [7,8]. Gaussian PDF-based approaches are efficient but often underestimate risk in non-linear encounters due to linear assumptions [10]. Full-scale Monte Carlo methods offer higher accuracy but at the cost of significant runtime, often requiring several minutes per case [12]. Compared to these, our hybrid method achieved sub-second TCA accuracy and kilometer-level spatial resolution in under 1 min per case, using standard hardware and real TLE data. The proposed framework was designed for collision risk assessment in low Earth orbit (LEO) using publicly available TLE data. As such, several assumptions were made to balance modeling fidelity with computational efficiency. TLE-based orbital states: All analyses rely on SGP4-propagated TLEs without access to formal covariance matrices. This limits the ability to model correlated uncertainties and dynamic consistency over extended prediction intervals. The performance is therefore most reliable over short timescales (typically < 5 days from epoch). Simplified perturbation modeling: The use of SGP4 omits higher-order perturbations such as solar radiation pressure, third-body effects, and atmospheric density variations beyond the standard drag model. This may reduce accuracy for objects in highly elliptical orbits or near the upper LEO boundary (>1200 km). Uncertainty distribution: A diagonal Gaussian or uniform distribution was assumed for perturbing the initial TLE-based state. This simplification neglects correlations and may not fully capture the true shape of the uncertainty region, particularly for objects tracked with limited sensor coverage. Single-sided sampling: Only one object in each conjunction pair was sampled probabilistically, while the other followed a deterministic trajectory. This reduces computational cost but may underestimate risk in dual-uncertainty scenarios. The method is best suited for LEO missions involving short-term risk assessment, mega-constellations (e.g., Starlink, One Web) with dense traffic and limited access to high-fidelity ephemerides, and civilian or academic SSA applications relying on open-source data. Its applicability to MEO, GEO, or highly elliptical orbits may require modification of the propagation model and incorporation of formal covariance data. In such cases, high-fidelity numerical integrators and more complex uncertainty models should be considered. Future extensions of this framework will explore adaptive uncertainty propagation, use of precise ephemerides when available, and application in broader orbital regimes beyond LEO. The use of Monte Carlo sampling allows the propagation of a wide range of initial conditions without assuming linear or Gaussian behavior in the relative motion. Spline-based interpolation of the separation distance enables accurate localization of the time of closest approach (TCA), even when the distance function is non-monotonic or exhibits sharp minima. The hierarchical multi-stage refinement performs brute-force evaluation of distances across increasingly narrow time windows. This avoids relying on gradients or local optimization, which can fail in the presence of oscillatory or non-smooth dynamics. Unlike linearized probabilistic models, the method does not assume a fixed structure of the uncertainty region or linearity in the state transition. Therefore, it remains robust when applied to scenarios with significant orbital curvature, non-planar relative trajectories, or non-Gaussian uncertainty dispersion. However, as the propagation model is based on SGP4, its fidelity under highly non-linear perturbations (e.g., high-altitude eccentric orbits with strong third-body effects) remains limited by the underlying propagator. Future integration of high-order force models could further enhance performance in these regimes. The proposed method can be extended to operate on high-fidelity ephemerides and formal covariance data. This would require replacing the SGP4 propagator with high-order numerical integrators and updating the uncertainty sampling process to incorporate full 6D covariance matrices. Such an enhancement would expand the method’s applicability to conjunction scenarios involving high-value or maneuverable assets, and to orbital regimes beyond LEO, such as MEO, GEO, or highly elliptical orbits. While this increase in modeling fidelity is expected to improve accuracy, it would also raise the computational cost per conjunction case. Future studies will aim to evaluate this trade-off by benchmarking the hybrid framework under precise orbital conditions and assessing its suitability for operational deployment within advanced space situational awareness (SSA) systems. Despite the practical advantages of using TLE data, namely, global availability and compatibility with standard propagation models, it remains inherently limited in both accuracy and dynamical representation. The lack of formal covariance information restricts uncertainty modeling, and the empirical nature of the B* drag term prevents the propagation model from responding accurately to rapid changes in the space environment. These constraints become more pronounced during periods of elevated solar activity or in low-altitude orbits where atmospheric drag is highly variable. Moreover, the discrete and delayed nature of TLE updates reduces the reliability of short-term collision predictions, particularly for agile or actively maneuvered satellites. Looking ahead, advancements in space tracking infrastructure are expected to mitigate many of these limitations. The deployment of space-based optical and radar sensors will enable continuous object tracking with higher resolution, while the integration of GNSS-derived ephemerides and the routine sharing of formal covariance data through standardized formats such as CDMs will allow for real-time, uncertainty-aware propagation. These developments would significantly enhance the reliability of conjunction assessments and allow methods like the one proposed here to operate on richer, more responsive datasets with broader applicability across orbital regimes.

4. Conclusions

This study presented a hybrid framework for enhancing the accuracy of collision probability estimation in low Earth orbit, addressing the limitations of traditional TLE-based methods. By integrating Monte Carlo simulations, spline interpolation, and multi-stage temporal refinement, the proposed methodology achieved significant improvements in estimating both the time of closest approach (TCA) and minimum separation distance. Empirical validation using real-world TLE datasets confirmed that the approach consistently reduced TCA errors to below 0.1 s and distance approximation errors to sub-kilometer levels. The framework demonstrated compatibility with standard SSA platforms and maintained computational efficiency, requiring less than one minute per event on conventional hardware. The alignment of the results with authoritative Space-Track data supports the operational viability of the proposed method for large-scale conjunction analysis. The comparative analysis between Monte Carlo and Differential Algebra Monte Carlo techniques further highlighted the latter’s potential to balance computational cost with physical fidelity, especially in high-risk configurations. The findings also underscored the dependence of collision probability on both spatial proximity and uncertainty characterization, reinforcing the necessity of non-linear and data-driven modeling strategies. In light of the increasing congestion in orbital environments, this study recommends the adoption of hybrid, high-precision assessment techniques within operational collision avoidance systems. Future work should explore the extension of this framework to incorporate dynamic force models, real-time sensor fusion, and adaptive uncertainty propagation based on improved observation fidelity. While this study focuses on TLE-based data due to its accessibility and widespread use, the proposed framework is designed to be adaptable to higher-fidelity orbital datasets. If precise ephemerides and covariance matrices are available such as those derived from GPS-based tracking or provided in Conjunction Data Messages (CDMs)—the same methodology can be applied with enhanced reliability. The multi-stage TCA refinement algorithm can be integrated with high-order numerical propagators, and the probabilistic models can utilize formal uncertainty descriptions instead of assumed ones. Incorporating accurate force models and validated covariance data would significantly improve the fidelity of Pc estimates, reduce epistemic uncertainty, and make the method suitable for operational use in high-risk conjunction assessment scenarios. While this study focused on Starlink satellites, the proposed framework is adaptable to satellites of various masses, geometries, and ballistic characteristics. Because the method relies on orbital state uncertainties and relative position sampling rather than on explicit physical parameters such as mass or area, it remains applicable to 1 kg class CubeSats as well as large spacecraft exceeding one metric ton with extended solar arrays. Our proposed method is primarily designed for short-term conjunction analysis based on the current or recently updated TLE data. Therefore, in its current form, the method does not predict sudden orbital perturbations in advance, as it assumes nominal propagation from known orbital states. However, if updated TLEs or precise ephemerides reflecting the disturbance are available, the method can still be applied to assess the updated conjunction risk. To handle such scenarios more effectively, it should also be noted that the framework assumes the availability of valid and timely orbital data and does not explicitly predict sudden orbital perturbations due to space weather events or atmospheric disturbances. While our method remains applicable once updated orbital data are available, it does not account for unmodeled perturbations during the propagation window. Future improvements may also involve integrating empirical atmospheric density models, such as NRLMSISE-00 or JB2008, to enable force-aware orbit propagation. This would allow the framework to better account for variations in orbital decay due to solar activity and enhance the robustness of collision predictions under dynamic space weather conditions.

Author Contributions

Conceptualization: S.K.T., A.M.A. and J.L.; methodology, S.K.T., I.E.M., A.M.A. and J.S.; software, S.K.T. and X.Y.; formal analysis, J.L.; data curation, S.K.T. and J.S.; writing—original draft preparation, S.K.T., A.M.A., I.E.M. and J.L.; writing—review and editing, S.K.T., A.M.A., X.Y. and J.L. All authors have read and agreed to the published version of the manuscript.

Funding

This research received funding from the Research Program for Space Debris and Near-Earth Asteroid Defense (Grant No. KJSP2020010203), supported by China National Space Administration.

Data Availability Statement

Data are contained within the article.

Acknowledgments

This paper is based upon work supported by the Science, Technology & Innovation Funding Authority (STDF), The Egyptian Ministry of Higher Education and Scientific Research, under grant number 48102.

Conflicts of Interest

The authors declare no conflict of interest.

Abbreviations

The following abbreviations are used in this manuscript:
LEOLow Earth Orbit
TLETwo-Line Element
TCATime of Closest Approach
SGP4Simplified General Perturbations Model 4
SSASpace Situational Awareness
SSOSun-Synchronous Orbit
PDFProbability Density Function
RTNRadial–Transverse–Normal
ROIRegion of Interest
ECIEarth-Centered Inertial
DAMCDifferential Algebra Monte Carlo
ICREImproved Critical Region Estimation
MCMonte Carlo

References

  1. Healy, L.M. Close conjunction detection on parallel computer. J. Guid. Control Dyn. 1995, 18, 824–829. [Google Scholar] [CrossRef]
  2. Letizia, F.; Virgili, B.B.; Lemmens, S. Assessment of orbital capacity thresholds through long-term simulations of the debris environment. Adv. Space Res. 2023, 72, 2552–2569. [Google Scholar] [CrossRef]
  3. Berger, T.E.; Dominique, M.; Lucas, G.; Pilinski, M.; Ray, V.; Sewell, R.; Sutton, E.K.; Thayer, J.P.; Thiemann, E. The thermosphere is a drag: The 2022 Starlink incident and the threat of geomagnetic storms to low earth orbit space operations. Space Weather 2023, 21, e2022SW003330. [Google Scholar] [CrossRef]
  4. Kelso, T.S. “Satellite Catalog (SATCAT).” CelesTrak SATCAT Boxscore. Available online: https://celestrak.org/NORAD/documentation/gp-data-formats.php (accessed on 24 May 2025).
  5. Kessler, D.J.; Cour-Palais, B.G. Collision frequency of artificial satellites: The creation of a debris belt. J. Geophys. Res. Space Phys. 1978, 83, 2637–2646. [Google Scholar] [CrossRef]
  6. Abdelaziz, A.M.; Molotov, I.E.; Tealib, S.K. Accurate High-Altitude Orbit Determination Method using Electro-Optical Sensors. Int. J. Math. Phys. 2023, 14, 64–76. [Google Scholar] [CrossRef]
  7. Crawford, D.P.; Vallado, M.D.; Hujsak, D.R.; Kelso, D.T. International best practice for using two line element sets. In Proceedings of the 57th International Astronautical Congress, Valencia, Spain, 2–6 October 2006. [Google Scholar] [CrossRef]
  8. Liu, W.; Wang, R.; Liu, S.; Shi, L.; Gong, J. TLE Prediction Accuracy Improvement and its Application in Collision Warning. Chin. J. Space Sci. 2014, 34, 449. [Google Scholar] [CrossRef]
  9. Alfano, S. Relating position uncertainty to maximum conjunction probability. J. Astronaut. Sci. 2005, 53, 193–205. [Google Scholar] [CrossRef]
  10. Xu, X.-L.; Xiong, Y.-Q. Study on the Orbit Prediction Errors of Space Objects Based on Historical TLE Data. Chin. Astron. Astrophys. 2019, 43, 563–578. [Google Scholar] [CrossRef]
  11. Hoots, F.R.; Schumacher, P.W., Jr.; PWGlover, R.A. History of analytical orbit modeling in the US space surveillance system. J. Guid. Control. Dyn. 2004, 27, 174–185. [Google Scholar] [CrossRef]
  12. Morselli, A.; Armellin, R.; Di Lizia PZazzera, F.B. A high order method for orbital conjunctions analysis: Monte Carlo collision probability computation. Adv. Space Res. 2015, 55, 311–333. [Google Scholar] [CrossRef]
  13. Akella, M.R.; Alfriend, K.T. Probability of collision between space objects. J. Guid. Control Dyn. 2000, 23, 769–772. [Google Scholar] [CrossRef]
  14. Vallado, D.A. Fundamentals of Astrodynamics and Applications; Springer Science & Business Media: Berlin/Heidelberg, Germany, 2013. [Google Scholar]
  15. Ghosh, D.; Sabel, M. Spline-based models for predictiveness curves and surfaces. Stat. Its Interface 2010, 3, 445. [Google Scholar] [CrossRef] [PubMed]
  16. Coffee, B.; Bishop, R.; Cahoy, K. Propagation of CubeSats in LEO using NORAD two line element sets: Accuracy and update frequency. In Proceedings of the AIAA Guidance, Navigation, and Control (GNC) Conference, Boston, MA, USA, 19–22 August 2013; p. 4944. [Google Scholar] [CrossRef]
  17. Yang, W.Y.; Cao, W.; Kim, J.; Park, K.W.; Park, H.H.; Joung, J.; Ro, J.S.; Lee, H.L.; Hong, C.H.; Im, T. Applied Numerical Methods Using MATLAB; John Wiley & Sons: Hoboken, NJ, USA, 2020. [Google Scholar] [CrossRef]
  18. Li, J.S.; Yang, Z.; Luo, Y.Z. A review of space-object collision probability computation methods. Astrodynamics 2022, 6, 95–120. [Google Scholar] [CrossRef]
  19. Changé, P.; Mertz, C. Monte Carlo sampling based imminent collision detection algorithm. In Proceedings of the 2017 4th International Conference on Transportation Information and Safety (ICTIS), Banff, AB, Canada, 8–10 August 2017; pp. 368–376. [Google Scholar] [CrossRef]
  20. Armellin, R.; Di Lizia, P.; Bernelli-Zazzera, F.; Berz, M. Asteroid close encounters characterization using differential algebra: The case of Apophis. Celest. Mech. Dyn. Astronomy 2010, 107, 451–470. [Google Scholar] [CrossRef]
  21. Swierczewski, C.; Verdier, O. pychebfun-Python Chebyshev Functions. GitHub Repository. 2024. Available online: https://github.com/pychebfun/pychebfun (accessed on 15 March 2025).
Figure 1. Historical analysis of cataloged space objects (1957–2025).
Aerospace 12 00674 g001
Figure 2. Monte Carlo sampling for collision estimation.
Aerospace 12 00674 g002
Figure 3. Spline interpolation for closest approach estimation.
Aerospace 12 00674 g003
Figure 4. Flowchart conjunction candidate detection.
Aerospace 12 00674 g004
Figure 5. Flowchart time of closest approach (TCA) estimation.
Aerospace 12 00674 g005
Figure 6. (A) Distance offsets over time for four separate conjunction events: 24 April 2025. (B) Distance offsets over time for four separate conjunction events: 15 May 2025. (C) Distance offsets over time for four separate conjunction events: 23 May 2025. (D) Distance offsets over time for four separate conjunction events: 23 May 2025.
Aerospace 12 00674 g006aAerospace 12 00674 g006b
Figure 7. (A) Relative distance histogram—24 April 2025 conjunction. (B) Relative distance histogram—15 May 2025 conjunction. (C) Relative distance histogram—23 May 2025 conjunction. (D) Relative distance histogram—24 May 2025 conjunction.
Aerospace 12 00674 g007aAerospace 12 00674 g007b
Figure 8. (A) Three-dimensional trajectories during conjunction—24 April 2025. (B) Three-dimensional trajectories during conjunction—15 May 2025. (C) Three-dimensional trajectories during conjunction—23 May 2025. (D) Three-dimensional trajectories during conjunction—24 May 2025.
Aerospace 12 00674 g008aAerospace 12 00674 g008b
Figure 9. (A) Relative motion in XY plane—24 April 2025. (B) Relative motion in XY plane—15 May 2025. (C) Relative motion in XY plane—23 May 2025. (D) Relative motion in XY plane—24 May 2025.
Aerospace 12 00674 g009aAerospace 12 00674 g009b
Figure 10. (A) Relative motion in XZ plane—24 April 2025. (B) Relative motion in XZ plane—15 May 2025. (C) Relative motion in XZ plane—23 May 2025. (D) Relative motion in XZ plane—24 May 2025.
Aerospace 12 00674 g010aAerospace 12 00674 g010bAerospace 12 00674 g010c
Figure 11. (A) Relative motion in ZY plane—24 April 2025. (B) Relative motion in ZY plane—15 May 2025. (C) Relative motion in ZA plane—23 May 2025. (D) Relative motion in ZY plane—24 May 2025.
Aerospace 12 00674 g011aAerospace 12 00674 g011b
Figure 12. (A) Full 3D relative motion—24 April 2025. (B) Full 3D relative motion—15 May 2025. (C) Full 3D relative motion—23 May 2025. (D) Full 3D relative motion—24 May 2025.
Aerospace 12 00674 g012aAerospace 12 00674 g012b
Figure 13. Comparison of collision probability estimates for three conjunction scenarios.
Aerospace 12 00674 g013
Table 1. Close approaches between selected Starlink satellites and space debris on 14 May 2025.
Object AInclination
Degree
No of Detected ObjectObject B
STARLINK-1008435Debris Catalog
(Irdum33—cosmose2551-)
STARLINK-5691546
STARLINK-56177012
STARLINK-4326974
Table 2. Error assessment of time of closest approach (TCA) and miss distance compared to reference data.
AlgorithmTime of EpochTCATCA Deviation from Reference (s)Min Distance, kmMiss Distance Deviation from Reference (km)ID
Comparison data2025-04-25 15:18:46.02025-04-25 18:56:38.532 3.1 × 10 2 0.1760.02629798
&
60876
Multi-stage2025-04-25 18:56:38.5010.202
Comparison data2025-05-14 17:06:12.02025-05-15 22:37:34.909 3 × 10 3 0.4240.16112848
&
32322
Multi-stage2025-05-15 22:37:34.9120.585
Comparison data2025-05-20 07:48:45.02025-05-20 12:00:41.156 7 × 10 3 0.0410.29334159
&
61824
Multi-stage2025-05-20 12:00:41.1630.334
Comparison data2025-05-20 07:48:39.02025-05-20 08:00:03.338 5.5 × 10 2 0.0960.24937615
&
61291
Multi-stage025-05-20 08:00:03.3930.345
Comparison data2025-05-20 07:48:39.02025-05-22 22:16:14.741 5.4 × 10 2 0. 1460.58861278
&
54616
Multi-stage2025-05-22 22:16:14.7950.625
Comparison data2025-05-20 07:47:41.02025-05-23 07:18:52.011 2 × 10 1 0.1301.50548826
&
25319
Multi-stage2025-05-23 07:18:51.8081.635
Comparison data2025-05-20 14:21:58.02025-05-23 01:14:15.634 8 × 10 3 0. 1030.07260698
&
22382
Multi-stage2025-05-23 01:14:15.6420.175
Comparison data2025-05-22 13:20:18.0002025-05-24 06:32:54.222 5.3 × 10 2 0. 0830.21241531
&
60251
Multi-stage2025-05-24 06:32:54.1690.295
Table 3. Numerical comparison of collision probability estimates.
CaseMethodCollision ProbabilityStandard DeviationReal CollisionTACMin Distance (km)
1MC0.0002430.0000160.00011183052025-04-25 18:56:38.5016800.203779
DAMC0.0002190.000014
2MC0.0000610.000008
DAMC0.0000550.000007
3MC0.0000150.000004
DAMC0.0000140.000003
1MC0.0002460.0000160.00016682422025-05-22 22:16:14.7950.6264654
DAMC0.0002210.000014
2MC0.0000730.000009
DAMC0.0000660.000008
3MC0.0000150.000004
DAMC0.0000140.000003
1MC0.0002450.0000160.00022766812025-05-23 07:18:512.9253064
DAMC0.0002200.000014
2MC0.0000660.000008
DAMC0.0000590.000007
3MC0.0000120.000003
DAMC0.0000110.000003
1MC0.0002440.0000160.00027343352025-05-24 06:32:54.1693980.295490267
DAMC0.0002200.000014
2MC0.0000580.000008
DAMC0.0000520.000007
3MC0.0000080.000003
DAMC0.0000070.000003
Disclaimer/Publisher’s Note: The statements, opinions and data contained in all publications are solely those of the individual author(s) and contributor(s) and not of MDPI and/or the editor(s). MDPI and/or the editor(s) disclaim responsibility for any injury to people or property resulting from any ideas, methods, instructions or products referred to in the content.

