Article

Effects of an Integrated Infrared Suppressor on the Infrared and Acoustic Characteristics of Helicopters

by
Zongyao Yang
1,2,
Xinqian Zheng
2,* and
Jingzhou Zhang
3
1
School of Marine Engineering, Jimei University, Xiamen 361021, China
2
School of Vehicle and Mobility, Tsinghua University, Beijing 100084, China
3
College of Energy and Power Engineering, Nanjing University of Aeronautics and Astronautics, Nanjing 210016, China
*
Author to whom correspondence should be addressed.
Aerospace 2025, 12(8), 665; https://doi.org/10.3390/aerospace12080665
Submission received: 22 June 2025 / Revised: 20 July 2025 / Accepted: 24 July 2025 / Published: 26 July 2025

Abstract

To enhance the survivability of armed helicopters in high-threat environments, integrated infrared (IR) suppressors are increasingly adopted to reduce thermal signatures. However, such integration significantly alters the exhaust flow field, which may in turn affect both the infrared and acoustic characteristics of the helicopter. This study investigates the aerodynamic, infrared, and acoustic impacts of an integrated IR suppressor through the comparative analysis of two helicopter configurations: a conventional design and a design equipped with an integrated IR suppressor. Full-scale models are used to analyze flow field and IR radiation characteristics, while scaled models are employed for aeroacoustic simulations. The results show that although the integrated IR suppressor increases flow resistance and reduces entrainment performance within the exhaust mixing duct, it significantly improves the thermal dissipation efficiency of the exhaust plume. The infrared radiation analysis reveals that the integrated suppressor effectively reduces radiation intensity in both the 3~5 μm and 8~14 μm bands, especially under cruise conditions where the exhaust is more efficiently cooled by ambient airflow. Equivalent radiation temperatures calculated along principal axes confirm lower IR signatures for the integrated configuration. Preliminary acoustic analyses suggest that the slit-type nozzle and integrated suppressor layout may also offer potential benefits in jet noise reduction. Overall, the integrated IR suppressor provides a clear advantage in lowering the infrared observability of armed helicopters, with acceptable aerodynamic and acoustic trade-offs. These findings offer valuable guidance for the future development of low-observable helicopter platforms.

1. Introduction

Armed helicopters play a crucial role in modern warfare, being widely used for low-altitude strikes, reconnaissance, early warning, counter-terrorism, and other military operations. Their unique versatility and tactical value underscore their importance on the battlefield. However, as advanced technologies are increasingly integrated into military operations, the survivability of armed helicopters in high-tech combat environments is becoming increasingly threatened. Beyond conventional threats from ground and aerial firepower, these aircraft are now subject to intensive surveillance from infrared, radar, visual, and acoustic detection systems.
Among the countermeasures developed, the retrofitting of infrared (IR) suppressors into helicopter exhaust systems has garnered significant attention from researchers both domestically and internationally. This technology is widely recognized as an effective means of reducing the IR signature of helicopters [1,2]. Studies have shown that, compared to an unmodified exhaust system, the incorporation of an IR suppressor can significantly lower the helicopter’s vulnerability to IR-guided threats [3,4,5,6].
Looking ahead, the development of stealth technologies for helicopters is increasingly focusing on multi-band and multi-domain concealment—requiring compatibility with infrared, radar, visual, and acoustic stealth capabilities [7,8,9]. A notable example is the joint development of the Comanche (RAH-66) helicopter by Boeing and Sikorsky in the United States, which integrates the exhaust system with the rear fuselage as part of its IR suppression strategy [10]. In such designs, the transition geometry of the exhaust mixing ducts becomes considerably more complex—the circular exhaust cross-section from the engine’s power turbine must transition into a narrow exhaust slot along the fuselage side. Furthermore, an air intake slit atop the rear fuselage channels rotor downwash into the interior of the exhaust duct to cool the high-temperature walls, thereby assisting in IR suppression before the exhaust is expelled laterally.
Considerable research has been conducted on similar fuselage-integrated infrared suppressors (IRS). Zhang et al. [11] provide a comprehensive overview of helicopter IR suppression techniques, emphasizing a clear shift toward airframe-integrated designs for improved aerodynamic efficiency and concealment. Tang et al. [12,13] experimentally investigate lobed nozzles combined with curved mixing ducts and slot-shaped exits, demonstrating enhanced entrainment, improved exhaust-air mixing, and significant temperature reductions. Ren et al. [14] employ numerical simulations to evaluate the stealth properties of an IRS embedded within the helicopter rear fuselage, quantifying notable reductions in sideward and aft infrared radiation. Xiao and Tong [15] introduce a parametric method to systematically optimize IRS geometry, establishing quantitative correlations between structural parameters and aerothermal performance. Additionally, Li and Xuan [16] investigate rotor–fuselage interactions in forward flight using coupled aerodynamic and thermal analyses, revealing significant impacts on temperature distributions and consequently on the external IR signature.
Compared to traditional exhaust configurations, this integrated IR suppressor substantially alters the exhaust flow field. These changes affect not only the thermal field but also the distribution of the acoustic field. However, to date, there has been limited comparative analysis between traditional helicopters and those equipped with integrated IR suppressors in terms of IR stealth effectiveness. Moreover, the potential aerodynamic and acoustic penalties introduced by such integrated systems remain insufficiently explored.
Although infrared and acoustic stealth are traditionally treated as separate domains, they are intrinsically linked through the exhaust system. The high-temperature, high-velocity jets responsible for strong IR emissions are also primary sources of jet noise. Therefore, modifications to suppress IR signatures—such as narrowing exhaust outlets or altering mixing geometries—will inevitably influence acoustic behavior. A design that reduces IR visibility by increasing mixing may unintentionally amplify broadband noise through enhanced turbulence or stronger velocity gradients. Conversely, noise-suppression strategies may lead to thermal retention or longer high-temperature jet cores. As such, a coupled IR-acoustic analysis is essential to achieve balanced, multi-spectral stealth optimization.
To address these gaps, this study selects a conventional armed helicopter as a benchmark and compares it against a helicopter equipped with an integrated infrared suppressor. The research analyzes and compares their aerodynamic and infrared radiation characteristics during hover and cruise conditions, and further investigates whether the integration of the IR suppressor exacerbates aeroacoustic interactions between engine exhaust and rotor flow. Full-scale models are employed to evaluate aerodynamic and IR radiation properties, while scaled models are used to simulate the aeroacoustic behavior of the exhaust systems.
Based on the results, the study assesses the advantages of integrated IR suppressors over conventional systems in terms of infrared stealth and jet noise suppression. Design recommendations are proposed for the development of low-IR, low-noise armed helicopters. The findings offer valuable guidance and reference for future stealth helicopter design efforts.

2. Physical and Numerical Modeling

2.1. Aerodynamic and Infrared Radiation Modeling

Figure 1a shows the model of a conventional armed helicopter, hereafter referred to as Model W. Like most armed helicopters, its exhaust system is located beneath the main rotor. The high-temperature gases produced by the engine’s power turbine enter the mixing duct through the main inlet. Using the kinetic energy of the exhaust flow, ambient air is entrained into the duct, where it mixes with the hot gases. The mixed flow is then discharged through oval-shaped exhaust ports located on both sides of the fuselage. However, due to the lack of effective shielding for the exhaust system, the high-temperature components remain exposed, making them susceptible to detection by infrared (IR) sensors.
Figure 1b shows the model of a helicopter equipped with an integrated infrared suppressor, designated Model R. In this configuration, the entire exhaust system is enclosed within the helicopter’s rear fuselage, which features a converging contour with a gradually varying contraction ratio along its axial direction. The system incorporates twin turboshaft-engine nozzles. A baffle plate is installed to divide the internal space of the rear fuselage into two symmetrical chambers, each corresponding to one of the twin exhaust nozzles.
On each side of the rear fuselage, two slot-shaped air inlets are placed on the top surface to direct rotor downwash into the fuselage, enabling the convective cooling of the internal mixing ducts. The front inlet measures 0.641 m in length and 0.101 m in width, while the rear inlet measures 1.75 m in length and 0.101 m in width. The high-temperature gas discharged from each engine nozzle enters the mixing duct, where it mixes with the incoming cooling air. The combined flow is then expelled through a slot-shaped exhaust outlet located on the side of the fuselage, angled at 60° relative to the fuselage axis. Each slot outlet measures 2.7 m in length and 0.245 m in width.
This integrated suppressor is designed with three core considerations in mind: (1) shielding high-temperature components within the rear fuselage to reduce direct infrared exposure; (2) introducing rotor downwash through top-mounted air inlets to enhance convective mixing and cooling of the exhaust stream; and (3) replacing conventional circular exhaust outlets with elongated, slit-shaped nozzles to increase contact with ambient air and promote rapid thermal dispersion. Together, these features contribute to a more effective reduction in infrared signatures while preserving acceptable aerodynamic and acoustic performance.
For clarity and consistency in the subsequent analysis, the conventional armed helicopter without an infrared suppressor is designated as Model W, while the helicopter equipped with an integrated infrared suppressor is referred to as Model R. A comparison of the primary physical parameters of the two models is presented in Table 1. Both models share the same mixing duct inlet dimensions. However, their exhaust outlet geometries differ: Model W features an oval-shaped outlet, whereas Model R employs a slit-shaped outlet. Despite the difference in shape, the total exhaust outlet area is identical in both configurations.
The physical parameters of both models are established based on the configurations of representative rotorcraft platforms—namely, the RAH-66 Comanche and the Z-10 attack helicopter [17,18]. While the geometric and aerodynamic layouts are inspired by these prototypes, some specific dimensions have been adjusted to accommodate computational modeling requirements and ensure parametric comparability.
Figure 2 presents the computational model used for analyzing the aerodynamic and infrared radiation characteristics of the helicopter. A cubic computational domain is defined, with the helicopter positioned at its center. The side length of the domain is set to approximately ten times the rotor diameter, i.e., 150 m, to sufficiently capture the relevant flow field and radiation effects.
In this computational model, four primary flow components are considered as follows: the hot engine exhaust, the forward-flight free-stream, the main rotor downwash, and the tail rotor airflow. Based on this setup, the corresponding boundary conditions are defined as follows.
For each engine nozzle, the inlet is specified as a mass flow inlet, with a mass flow rate of 3.8 kg/s and a temperature of 840 K, producing an approximate exit velocity of 100 m/s, consistent with typical engine exhaust conditions. The exhaust gas is modeled as an ideal mixture, primarily composed of nitrogen (mass fraction: 0.756) and oxygen (mass fraction: 0.244). The ambient air is defined as standard atmospheric pressure and a temperature of 293 K. Its composition includes nitrogen (0.706), carbon dioxide (0.209), and water vapor (0.085) by mass fraction. In the hovering condition, all boundaries of the computational domain are set as pressure outlets. For the forward-flight condition, the inlet boundary (the front face of the domain) is defined as a velocity inlet with a cruise speed of 90 m/s, while all other boundaries remain as pressure outlets.
The main rotor downwash is modeled using an actuator disk approach, consistent with previous studies [19]. The induced velocity vi at the actuator disk is decomposed into two components: a vertical component vi,ver normal to the disk and a tangential component vi,tan parallel to it. These components are given by
v i , v e r = v i cos φ ,   v i , tan = v i sin φ
where φ is the blade incidence angle relative to the actuator disk, set to 8°. The radial distribution of induced velocity is assumed to increase linearly from the rotor center to 80% of the blade radius, then decrease linearly to zero at the blade tip [20].
For the tail rotor, a simplified through-flow model is used, imposing a uniform velocity of 12 m/s directed toward the right side of the fuselage. All helicopter surfaces are treated as zero-thickness solid walls, neglecting internal heat conduction. The wall temperature distribution is governed solely by convection and radiation heat transfer. All solid surfaces are modeled as gray, diffuse emitters with a fixed emissivity of 0.8.
In this study, rotor downwash is incorporated as a steady inflow boundary condition to approximate its influence on the exhaust plume and infrared suppression performance. However, unsteady blade vortex structures are not explicitly modeled, as the focus of this work is on the steady-state thermal and acoustic characteristics of the exhaust system.

2.2. Aeroacoustic Modeling

The mixing duct model shown in Figure 3 is selected to calculate the jet noise of the helicopter. To facilitate the comparison and analysis of the exhaust flow field, a symmetrical treatment is applied to the curved mixing duct used in the integrated infrared suppressor. Considering the accuracy requirements of the mesh size for noise prediction, the model size of the mixing duct is reduced to one-tenth of the original. The mixing duct model for the conventional armed helicopter is named Model W-0, while that for the integrated infrared suppressor is named Model R-0. Model W-0 has the same inlet structure and exhaust nozzle area as Model R-0. The boundary conditions for jet noise calculation are consistent with those used in the aerodynamic simulation, except that the mass flow rate is reduced by a factor of 100, to 0.038 kg/s.
The computational domain for the jet noise calculation is shown in Figure 4. Since the exhaust jet tends to expand as it exits the nozzle, the computational domain is designed to gradually expand along the jet direction in order to reduce the computational grid and shorten the calculation time. The diameter of the mainstream inlet of the mixing duct is defined as Dj = 39 mm, and the length of the computational domain along the flow direction is set to 50 Dj. The upstream width is 20 Dj, and the downstream width is 50 Dj. The small cylindrical surface included in the computational domain is the noise integration surface, which must be able to accurately enclose the majority of the energetic vortex structures of the jet. Since the grid in the computational domain is gradually coarsened toward the outer boundary, an excessive noise integration surface will lead to a decrease in cutoff frequency [21]. Finally, the height of the noise integration surface is determined to be 35 Dj, with an upstream width of 8 Dj, and a downstream width of 20 Dj.
The flow field within the mixing duct is divided using unstructured grids, with a maximum surface grid size of 4 mm. The solid walls are refined to meet the wall grid requirements of the turbulence model. Structured grids are used in the computational domain outside the mixing duct. To ensure the accuracy of the acoustic calculation, at least six grid units are required for each wavelength within the computational frequency range. The speed of sound is denoted by C, and the maximum computational frequency is fmax. The maximum grid size Lmax must satisfy the following requirements:
L max C 6 f max
Since high-frequency sounds are more likely to be dissipated by the atmosphere during transmission, the ICAO has established the noise monitoring frequency range as 20~11,250 Hz in Annex 16: Environmental Protection of the Convention on International Civil Aviation [22]. Therefore, the maximum frequency for noise monitoring in this study is 11,250 Hz, which dictates that the maximum grid size Lmax of the flow field should be less than 5 mm. To ensure mesh independence and meet the requirement that y+ is less than 1 on the wall of the mixing nozzle, multiple grid sets were analyzed in advance. By monitoring the convergence of the ejection coefficient and exhaust temperature distribution, the total number of grids in the entire computational domain were ultimately determined to be approximately 5.2 million.
The rear fuselage models shown in Figure 5 are used to calculate the aeroacoustic characteristics of the helicopter exhaust system under the influence of rotor downwash airflow. The rear fuselage of the conventional armed helicopter is referred to as Model W-1, and the rear fuselage of the helicopter with an integrated infrared suppressor is referred to as Model R-1. The computational domain for the aerodynamic noise calculation of the helicopter exhaust system is defined as shown in Figure 6. Due to the high irregularity of the rear fuselage surface, structured grid division is challenging. Therefore, a rectangular area is defined in the computational domain that precisely encloses the entire rear fuselage model. An unstructured grid is applied to this rectangular zone, while a structured grid is used for the rest of the computational domain. The noise integral surface must accurately surround most of the energetic vortex structures of the fluid, so the selected noise integral surface begins from the rotor plane, gradually widening downward, and spans the entire length of the fuselage. The rotor plane has a diameter of Do = 1.46 m. Accordingly, the length of the computational domain in the flow direction is set to 1.6 Do, with an upstream width of 1.4 Do and a downstream width of 1.6 Do. The noise integration surface is defined as an internal surface. The rotor plane is specified as a velocity boundary, with a velocity distribution identical to that of the helicopter’s main rotor. All other boundaries of the computational domain are set as non-reflecting pressure outlets, with ambient conditions of 101,325 Pa and 293 K. The mainstream inlet of the mixing duct is defined as a mass flow inlet, with the working fluid treated as an ideal gas, a mass flow rate of 0.038 kg/s, and a temperature of 840 K.
In this study, jet noise is analyzed using the Large Eddy Simulation (LES) to compute the unsteady flow field of the mixing duct exhaust jet, coupled with the permeable Ffowcs Williams–Hawkings (FW-H) method to extrapolate the acoustic field.

3. Computational Methodology

The CFD simulations are performed using the commercial software ANSYS Fluent 19.0 [23]. Following the methodology of Pan et al. [24,25], the Shear Stress Transport k-ω (SST k-ω) turbulence model is employed, with the near-wall region treated using standard wall functions.

3.1. Flow Field Simulation

The computation is performed using ANSYS FLUENT 19.0. In the calculation, the governing equations in the CFD method to acquire the flow field and temperature field distribution of the helicopter include the conservation of mass, momentum and energy, the species transport equation, and the radiative heat transfer equation. Those equations are listed as follows:
ρ ν = 0
ρ v v = p + τ
v ρ E + p = λ e f f T j h j J j
ρ v Y j = J j
L r , s s + k α L r , s = k α σ T 4 π
where ρ is the density of the gas, v is the velocity vector, p is the static pressure, τ is the stress tensor, E is the total energy, λ e f f is the effective conductivity, T is the temperature, h j and J j represent enthalpy and diffusion flux for species j, respectively,  Y j is the local mass fraction of species, r is the position vector, s is the direction vector, k α is the absorption coefficient, σ is the Stefan-Boltzmann constant, and L is radiance.
Considering the complex geometry of the helicopter fuselage and the huge size of the computational domain, a hybrid mesh strategy is employed by dividing the domain into three distinct regions: (I) the internal flow region within the exhaust nozzle, (II) the near-field region surrounding the helicopter, and (III) the far-field region enclosing the entire near-field zone. Unstructured meshes are used in both the internal flow and near-field regions to accurately conform to the irregular surfaces. In contrast, structured meshes are applied in the far-field region to improve computational efficiency, as illustrated in Figure 7a. Mesh refinement is applied near the wall boundaries to ensure that the dimensionless wall-normal distance y+ meets the requirements of the turbulence model. Figure 7b shows the values of the ejector coefficient of the left ejector mixing duct of the helicopter in hover under different grid numbers. From the grid independence test, a proper grid number is finally determined by considering both the computational accuracy and computer resource, which is approximately 54 million. The convergence criterion for the CFD computations is set as that all normalized residuals are less than 10−5.
A thermal ground test was carried out using the setup shown in Figure 8a, focusing on the mixing duct of Model R, which was scaled to one-third of the full size. The exhaust flow was supplied by a compressor; it passed through a combustor and then entered the nozzle. The mass flow rate was 0.2 kg/s, and the temperature reached approximately 620 K. A blower was employed to provide a uniform downwash flow at a velocity of 12 m/s. The ambient temperature was approximately 286 K.
Based on the experimental model, a corresponding numerical simulation was also performed. The measured surface temperature image, captured by the IR camera, and the computed surface temperature image are presented in Figure 8b and Figure 8c, respectively. Figure 8d shows a comparison between the simulated exhaust flow temperature and the measured value at a location immediately downstream of the mixing duct outlet. The comparison confirms that the current CFD approach reasonably predicts both the surface and exhaust temperature distributions.

3.2. Infrared Radiation Simulation

The simulation of infrared radiation intensity is performed following the three-dimensional CFD analysis. In this study, the forward-backward ray tracing method is employed to calculate the infrared radiation intensity (I) of the helicopter. The detailed methodology was previously proposed in the authors’ earlier work [26].
In this study, atmospheric transmission effects are not explicitly considered in the infrared radiation calculations. This simplification aligns with the primary objective of evaluating the intrinsic infrared signature of the helicopter and its exhaust plume, independent of environmental transmission influences. Such source-level modeling strategies are widely used in infrared signature research, where the focus is placed on the spatial distribution and intensity of radiation emitted from the platform itself rather than the attenuated signal received by a distant sensor. This approach enables consistent comparisons between different design configurations without introducing uncertainties associated with atmospheric variability.
An infrared radiation intensity test was carried out using the ground-based setup shown in Figure 9a, targeting the rear fuselage of Model R, scaled to one-third of the full size. To ensure accurate emissivity settings, the surface of the rear fuselage was coated with a high-emissivity paint (ε = 0.97). A matte black-painted wooden board was placed behind the model as a shielding background to eliminate interference from ambient infrared radiation. The infrared radiation emitted by the target was measured using a VSR-3 infrared spectrometer positioned 20 m from the model. The red circle in Figure 9a indicates the measurement area, with a diameter of 1.5 m.
Based on the experimental setup, corresponding numerical simulations were conducted. The computational model is shown in Figure 9b. Except for the ground, all boundaries of the computational domain are defined as pressure outlets. In both the experiment and simulation, the mass flow rate at the mixing duct inlet is set to 0.2 kg/s, and three temperature conditions—620 K, 730 K, and 840 K—are investigated to evaluate the thermal radiation characteristics under varying exhaust energy levels. The ambient temperature is maintained at 285 K.
Although the experiment takes place in an indoor corridor with surrounding walls and a ceiling, this configuration is deliberately chosen to shield the test from atmospheric radiation and solar interference during daytime. These structural enclosures function as passive shields rather than active radiative sources. Moreover, the use of a matte black background panel and a narrow spectrometer field of view ensures that only the fuselage surface and exhaust plume significantly contribute to the detected signal. Accordingly, the simplified simulation model—excluding the corridor walls and ceiling—is physically justified. This conservative modeling approach preserves the dominant physical mechanisms of interest and remains consistent with the objectives of the experimental design.
Figure 10 presents the spectral radiation intensity distribution of the integrated infrared suppressor as detected by the spectroradiometer. As shown in Figure 10a, distinct peaks and troughs are observed in the 4.15~4.45 μm range, which result from strong radiation emitted by CO2 in the exhaust plume and strong absorption by CO2 in the ambient air.
Table 2 presents a comparison between the infrared radiation intensities on the rear fuselage sidewall calculated via the forward-backward ray tracing method and the corresponding experimental results. As shown in the table, when the mainstream temperature at the mixing duct increases from 620 K to 730 K, the infrared radiation intensity in the 3~5 μm and 8~14 μm bands increases by approximately 48% and 42%, respectively. When the temperature further rises from 730 K to 840 K, the intensities increase by about 34% and 17%, respectively. These results indicate that infrared radiation in the 8~14 μm band is less sensitive to high temperature.
A comparison between the simulation and experimental data reveals that the numerical predictions are slightly higher than the measured values, which is likely due to the omission of atmospheric absorption effects in the simulation. Moreover, Table 2 shows that the deviation between the simulation and experiment is greater in the 3~5 μm band than in the 8~14 μm band, because radiation in the 3~5 μm band originates mainly from gas emission, which is more susceptible to environmental influences. Overall, the simulation results show good agreement with the experimental data, with a maximum deviation of 5%.

3.3. Jet Noise Simulation

Jet noise simulation is performed by resolving the unsteady compressible flow field and applying the Ffowcs Williams–Hawkings (FW-H) acoustic analogy to predict far-field sound radiation. A steady-state computation is first conducted to obtain the initial flow field, followed by an unsteady simulation. The Large Eddy Simulation (LES) turbulence model, coupled with the Smagorinsky–Lilly subgrid-scale model, is employed for the unsteady analysis. High-order upwind and central difference schemes are used for the convection and diffusion terms, respectively.
According to the Nyquist sampling theorem [27,28], the maximum acoustic frequency fmax in the unsteady simulation is related to the computational time step ∆t by the following expression:
Δ t = 1 2 f max
The maximum noise frequency of interest in this study is 11,250 Hz. Accordingly, the time step for the unsteady calculation is set to 4.4 × 10⁻⁵ s. After 5000 time steps, during which the flow field evolves through more than three flow-through cycles and the global residuals fall below 10−6, the acoustic module is activated to compute noise propagation using the FW-H method. According to the Nyquist sampling theorem, the sampling frequency fs must be greater than twice the maximum frequency fmax to avoid frequency aliasing. Therefore, 23,000 time steps are allocated for the noise calculation phase.
To quantitatively express the acoustic intensity, the Sound Pressure Level (SPL) is used to represent the noise in decibels (dB), and its mathematical definition is
SPL = 10 lg P pa 2 P ref 2 = 20 lg P pa P ref
where the SPL unit is dB, Ppa is the root mean square of the sound pressure, and Pref is the reference sound pressure, typically 2 × 10⁻⁵ Pa in the air. The noise level measured at a specific location is referred to as the Overall Sound Pressure Level (OASPL). It is calculated using the following formula [29]:
OASPL = 20 log 10 SPL 1 20 + 10 SPL 2 20 + + 10 SPL n 20 = 20 log i = 1 n 10 SPL i 20
where subscript i refers to the serial number of different frequency bands, and n is the total number of frequency bands considered.
To ensure the credibility of the adopted jet noise prediction methodology, a benchmark validation case is included. The round jet nozzle case studied experimentally by Jordan et al. [30] and numerically by Andersson et al. [31] is selected to verify the effectiveness of the LES–FW-H approach. The computational model of the round jet nozzle is shown in Figure 11a. Since the exhaust jet tends to expand after exiting the nozzle, the external flow field of the computational domain is designed to be divergent in shape, thereby reducing the computational mesh size and shortening the calculation time. The nozzle has an exit diameter of Dp, an inlet diameter of 3 Dp, where Dp = 50 mm. The inlet diameter at the upstream boundary of the computational domain is 20 Dp, the outlet diameter at the downstream boundary is 40 Dp, and the total axial length is 90 Dp.
Based on the vorticity distribution characteristics of the turbulent jet flow field, the noise integration surface is defined with an upstream diameter of 4 Dp, a downstream diameter of 16 Dp, and a total axial length of 50 Dp. Noise monitoring points are arranged on two concentric circular arcs with radii of 30 Dp and 50 Dp, centered at the nozzle exit. The observation angles are distributed in the range of 30° to 150°, as shown in Figure 11b.
The boundary conditions used in the simulation are consistent with those in references [30,31]. A pressure inlet is set at the nozzle entrance, with a total pressure of Ptotal = 147,152 Pa and a total temperature of Ttotal = 320.4 K. The ambient static pressure is set to Pstatic = 101,325 Pa, and the Mach number at the nozzle exit is approximately 0.75. All outer boundaries of the computational domain are set as non-reflective pressure outlets, with a total temperature of Ttotal = 288 K and a static pressure of Pstatic = 101,325 Pa. The solid wall of the round nozzle is set as a no-slip, adiabatic wall.
Based on the results of Lin Jian et al. [32], the RNG k-ε turbulence model is adopted for the steady-state calculation, and convergence is determined when all residuals fall below 1 × 10⁻⁶. The steady-state result is then used as the initial flow field for unsteady simulation. For the unsteady calculation, the LES turbulence model is employed with the Smagorinsky–Lilly subgrid model. To ensure that the time-marching speed exceeds the speed of physical disturbance propagation, the Courant–Friedrichs–Lewy (CFL) number is maintained below 1. The time step tstep for the unsteady simulation is set to 1 × 10⁻⁶ s, and the maximum number of iterations per time step is 20.
Figure 12 presents the sound pressure level (SPL) spectra at the monitoring angle θ = 60° on the circular arcs located at r = 30 Dp and r = 50 Dp. The simulation results are compared with the experimental data from Jordan et al. [30] and the numerical results from Andersson et al. [31]. In the figure, the black hollow circles represent Jordan’s experimental values, the dashed line denotes the simulation by Andersson, and the solid line represents the present simulation results. It can be observed that the present simulation slightly overpredicts the SPL in the low-frequency range (f < 2500 Hz), while in the high-frequency range (f > 7500 Hz), the SPL decays more rapidly than the experimental data. This discrepancy is mainly attributed to grid resolution, as capturing high-frequency acoustic features requires sufficiently fine mesh spacing.
Figure 13 shows the distribution of overall sound pressure level (OASPL) along the monitoring angle θ on the circular arcs at r = 30 Dp and r = 50 Dp. The simulation results overall agree well with the experimental data, with a maximum deviation of approximately 2 dB occurring in the upstream region of the nozzle. These results validate the feasibility and accuracy of the noise prediction methodology adopted in this study.
Although independent acoustic experiments could not be conducted due to current facility limitations, benchmark validation using the established experimental data provides a reliable reference and enhances the credibility of the simulation results. Future work will focus on developing comprehensive acoustic measurement campaigns under realistic operating conditions to further validate and improve the predictive acoustic model.

4. Results and Discussion

4.1. Analysis of Flow Field

In the hover condition simulation, three types of airflow are considered as follows: hot exhaust flow, main rotor downwash, and tail rotor flow. In the forward flight simulation, an additional airflow component—the forward-flight stream—is introduced, resulting in four interacting flows.
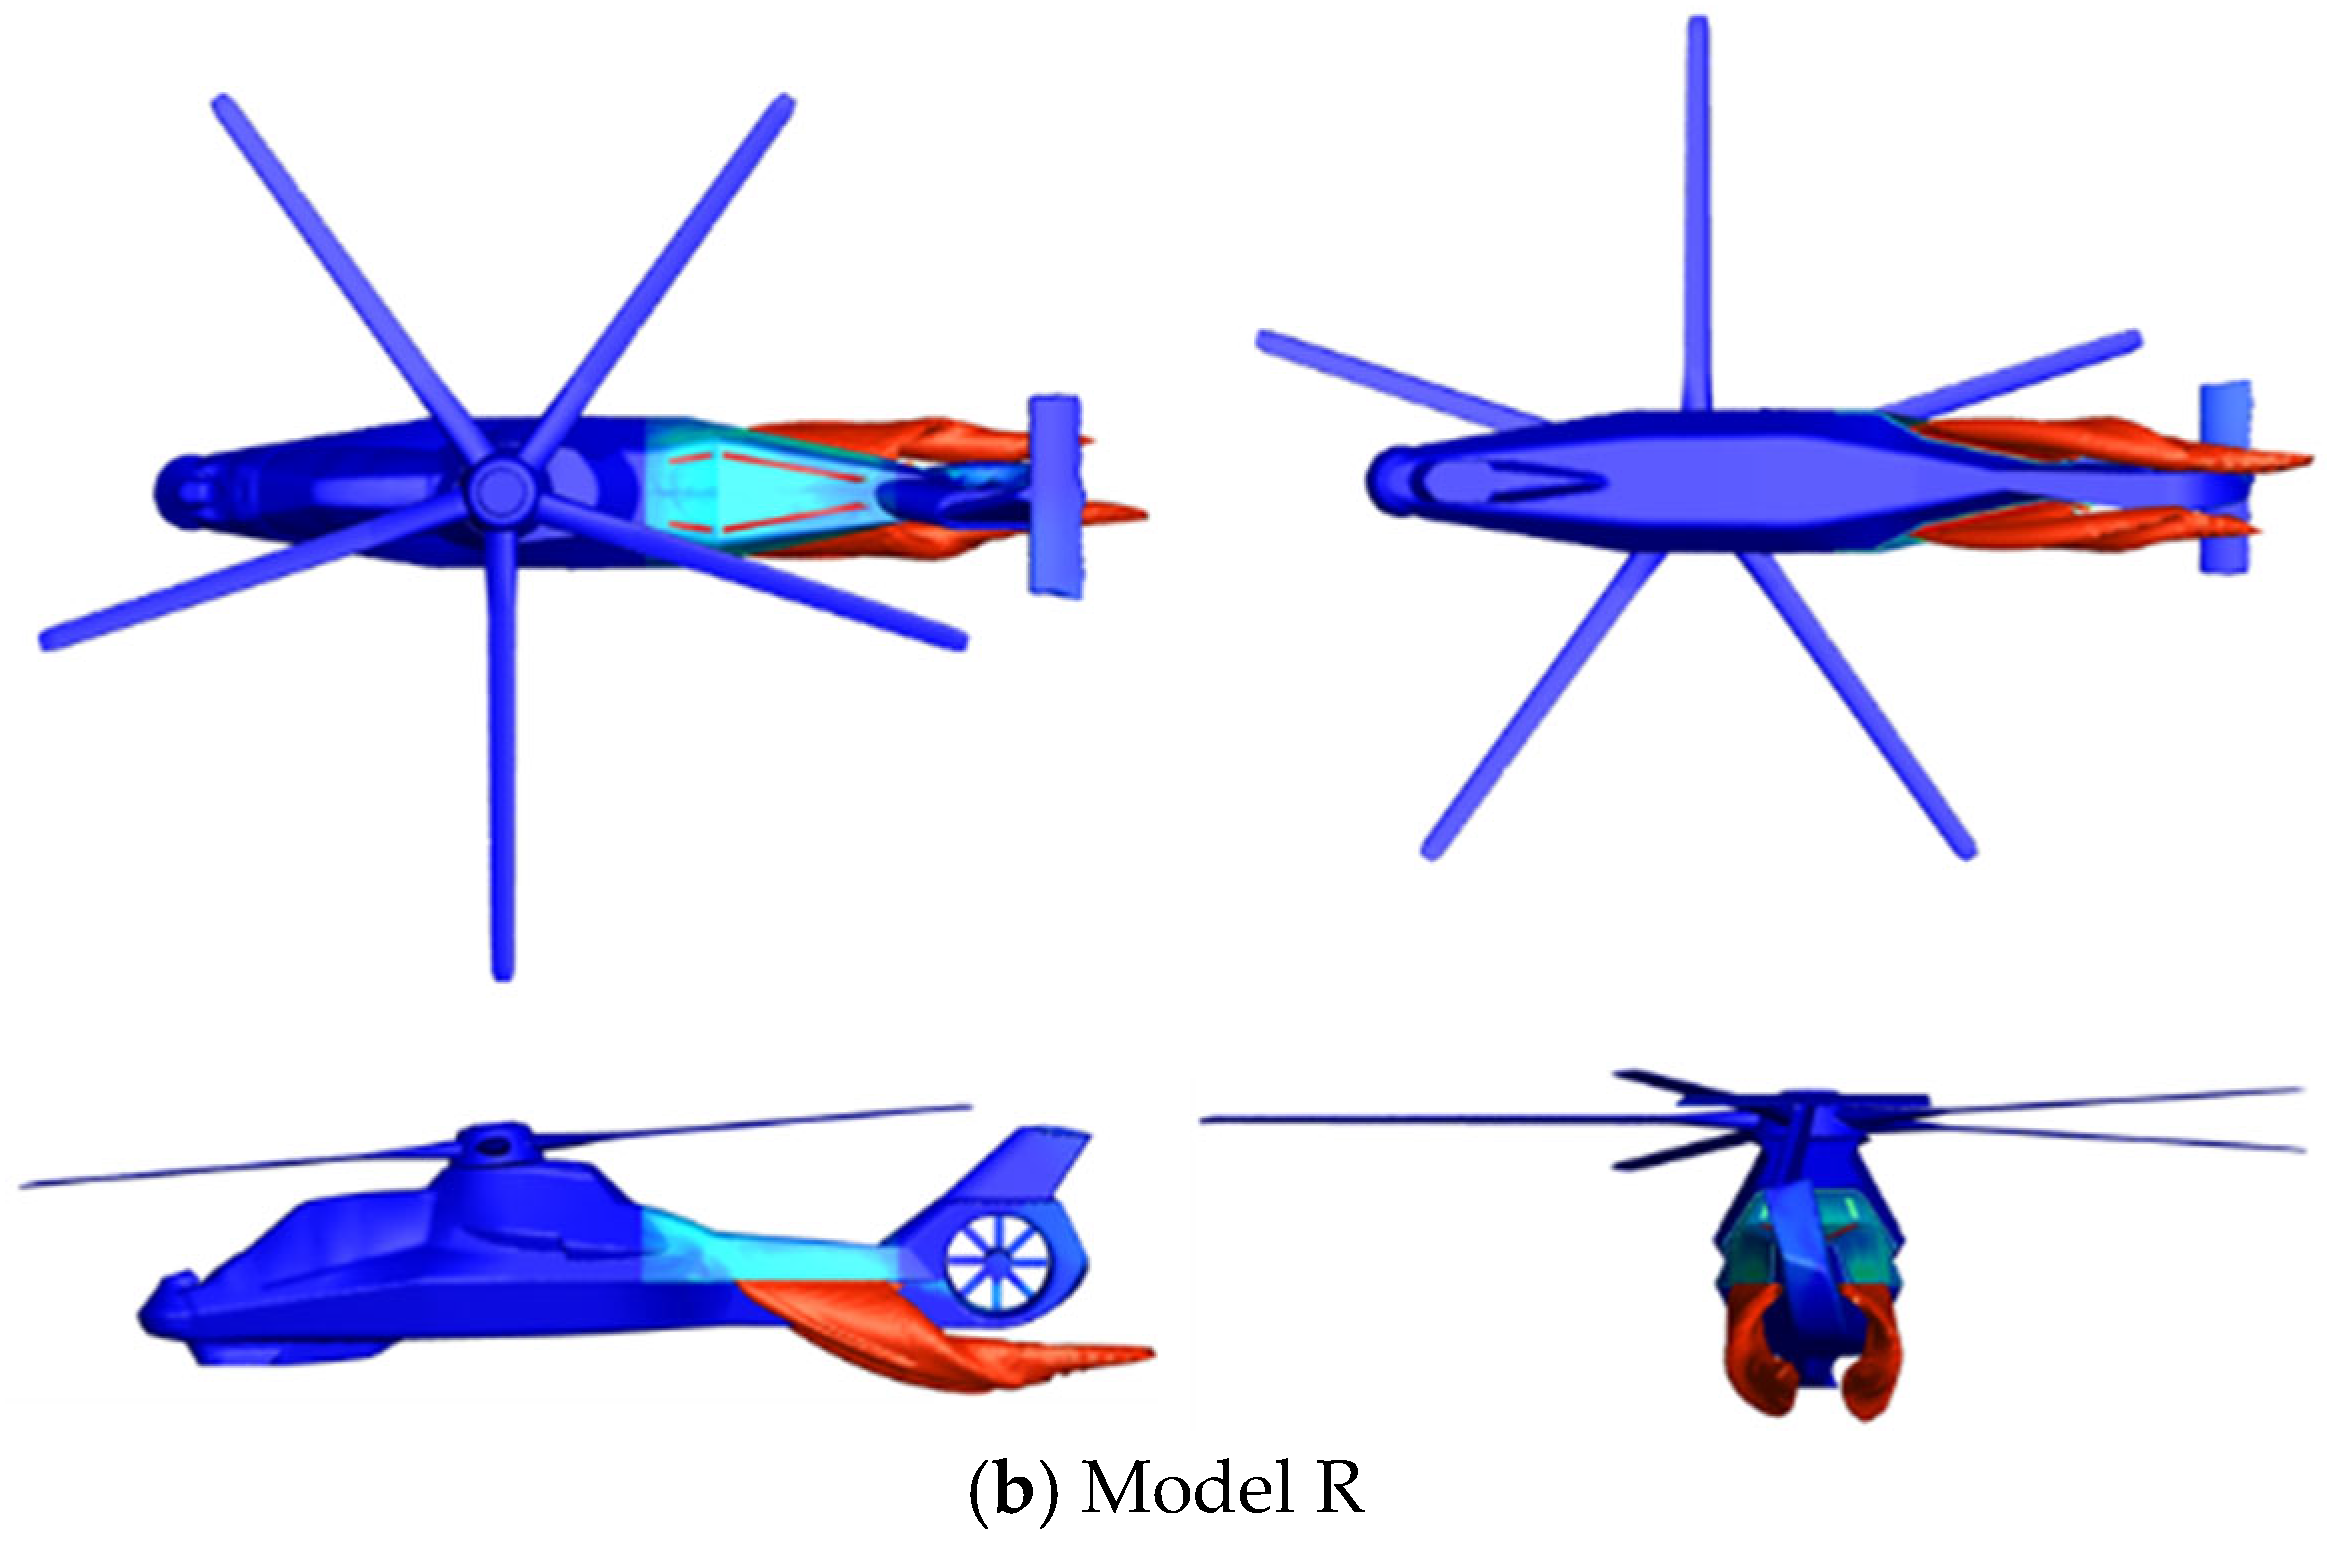
Under hover conditions, as shown in Figure 14, the development of the exhaust plume is significantly influenced by the downward force exerted by the rotor downwash. Due to the tangential component of the induced velocity from the rotor, the streamlines of the exhaust jet from the right nozzle become asymmetric relative to those from the left nozzle. This asymmetry is caused by the clockwise rotation of the main rotor, which induces a swirling motion in the exhaust plume that follows the direction of rotor rotation.
The tail rotor flow is also disturbed by the downwash. After propagating a short distance, it is deflected downward by the rotor wash and directed toward the ground.
Under cruising conditions (flight speed of 90 m/s), as shown in Figure 15, the influence of rotor downwash on the exhaust plume weakens noticeably. The exhaust flow is increasingly aligned with the forward-flight stream. The interaction between the forward flight airflow and the rotor downwash results in more complex plume behavior. As the forward airflow moves past the helicopter fuselage, a low-pressure region forms behind it. When the exhaust plume reaches this region, it is entrained into the low-pressure zone. Because the exhaust outlet of Model R is positioned closer to the tail, a larger portion of its plume is drawn into this region, leading to a more significant deflection in exhaust flow compared to Model W.
In this study, the mixing duct of the conventional helicopter (Model W) features a circular exhaust outlet, while that of the helicopter equipped with an integrated infrared suppressor (Model R) adopts a slit-shaped exhaust outlet. The different nozzle geometries result in varying levels of flow resistance within the duct. Given that the inlet and outlet areas, inlet mass flow rates, and ambient pressures are the same for both helicopter models, the flow resistance in the mixing duct can be characterized by the pressure difference ∆P. This is defined as the difference between the total pressure P in * at the duct inlet and the static pressure P at the exhaust outlet, expressed as
Δ P = P in * P
The ejector coefficient of the mixing duct Pc is defined as the ratio of the entrained mass flow M p to the main inlet mass flow M i n , and is expressed as
P c = M p / M i n
Table 3 shows the calculated pressure loss and ejector coefficient of the mixing ducts for the two helicopter models. As shown in the table, during hover, the pressure loss of Model R is about 400–500 Pa higher than that of Model W, and about 700–800 Pa higher during cruise, indicating lower exhaust flow resistance in Model W’s mixing duct. Furthermore, the ejector coefficient of Model R is approximately 50–60% lower than that of Model W during hover, and 30–40% lower during cruise. These results suggest that the slit-type exhaust design of the helicopter equipped with an integrated infrared suppressor has a negative impact on both the flow and ejection performance of the mixing duct.
In addition, it is worth noting that due to the clockwise rotation of the helicopter’s main rotor, an asymmetry arises in the ejector performance of the left and right mixing ducts. Preliminary analysis reveals that the left duct consistently exhibits slightly higher ejector coefficients (e.g., 0.993 compared to 0.909 in hover conditions), suggesting that rotor-induced airflow could potentially be leveraged to optimize the mixing duct geometry. Future studies may exploit this asymmetric flow phenomenon by tailoring duct designs individually for each side, thereby minimizing aerodynamic penalties while maintaining balanced infrared and acoustic suppression effectiveness.

4.2. Analysis of Infrared Radiation

The intensity of infrared radiation is primarily influenced by the hot exhaust flow. Therefore, it is essential to first examine the thermal exhaust flow characteristics of the helicopter.
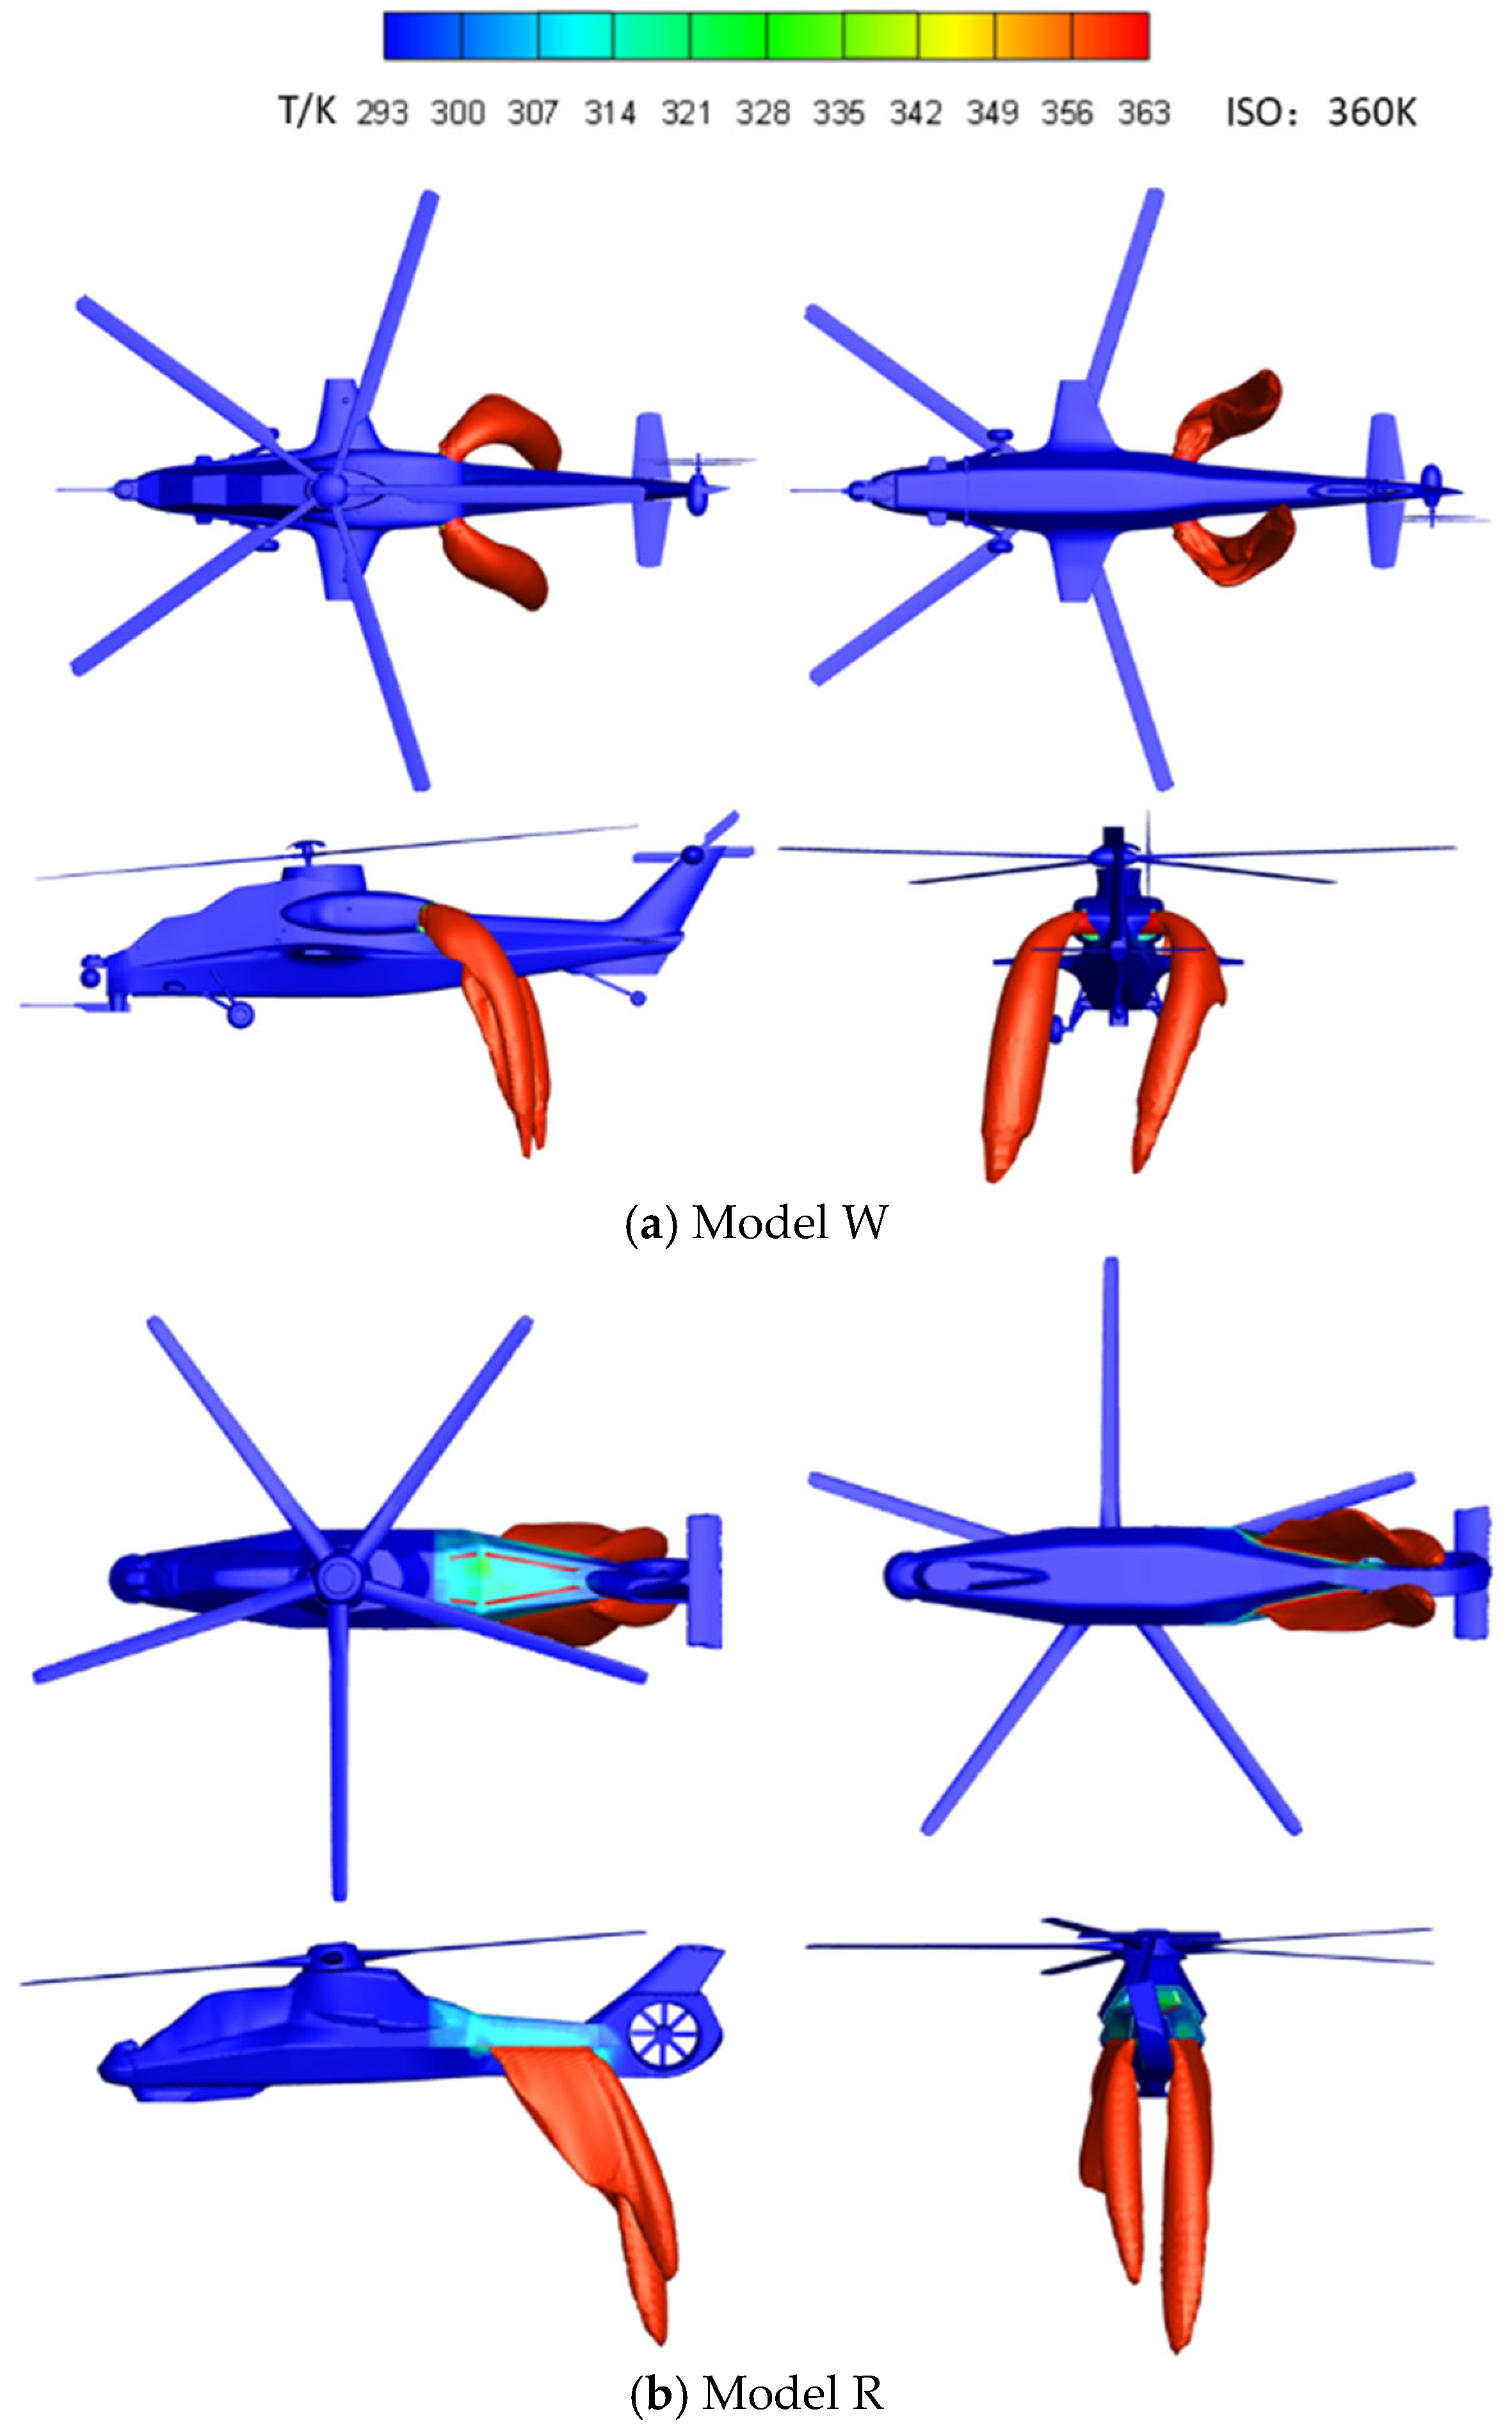
Figure 16 illustrates the 360 K isothermal surface of the exhaust jet during hover. Due to the differences in exhaust direction and nozzle geometry between the two helicopter models, the exhaust jets exhibit distinct shapes. Under the influence of the rotor downwash, the exhaust jets are deflected downward toward the lower part of the fuselage. Additionally, the rotational characteristics of the downwash induce a slight leftward deviation of the exhaust plume, which is more pronounced in Model W. Compared to Model R, the exhaust flow in Model W is farther from the fuselage and exhibits a more concentrated jet shape. In contrast, Model R, equipped with a slit-type nozzle, produces a sheet-like exhaust plume. This geometry promotes increased interaction with the surrounding airflow, enhancing mixing and cooling efficiency. The skin temperature of Model W is close to the ambient temperature, while in Model R, the exhaust system is embedded within the rear fuselage compartment, causing the rear fuselage skin to be heated by thermal radiation. Previous studies have assessed infrared suppression strategies for embedded exhaust configurations to mitigate fuselage skin heating [33].
Figure 17 shows the 360 K isothermal surface of the exhaust jet during helicopter cruise. Compared to the hovering condition, the exhaust jet during cruise is influenced not only by the rotor downwash but also by the forward flight airflow. Since the forward flight airflow is significantly stronger than the rotor downwash during cruise, the “downward pressing” effect of the rotor downwash on the exhaust jet is diminished, and the exhaust flow is more heavily influenced by the forward flight airflow. As illustrated in Figure 17, the exhaust jet is compelled to align with the direction of the forward flight stream. The rear fuselage skin of Model R still shows a temperature rise due to thermal radiation from the exhaust nozzle, but it is lower compared to the hovering condition.
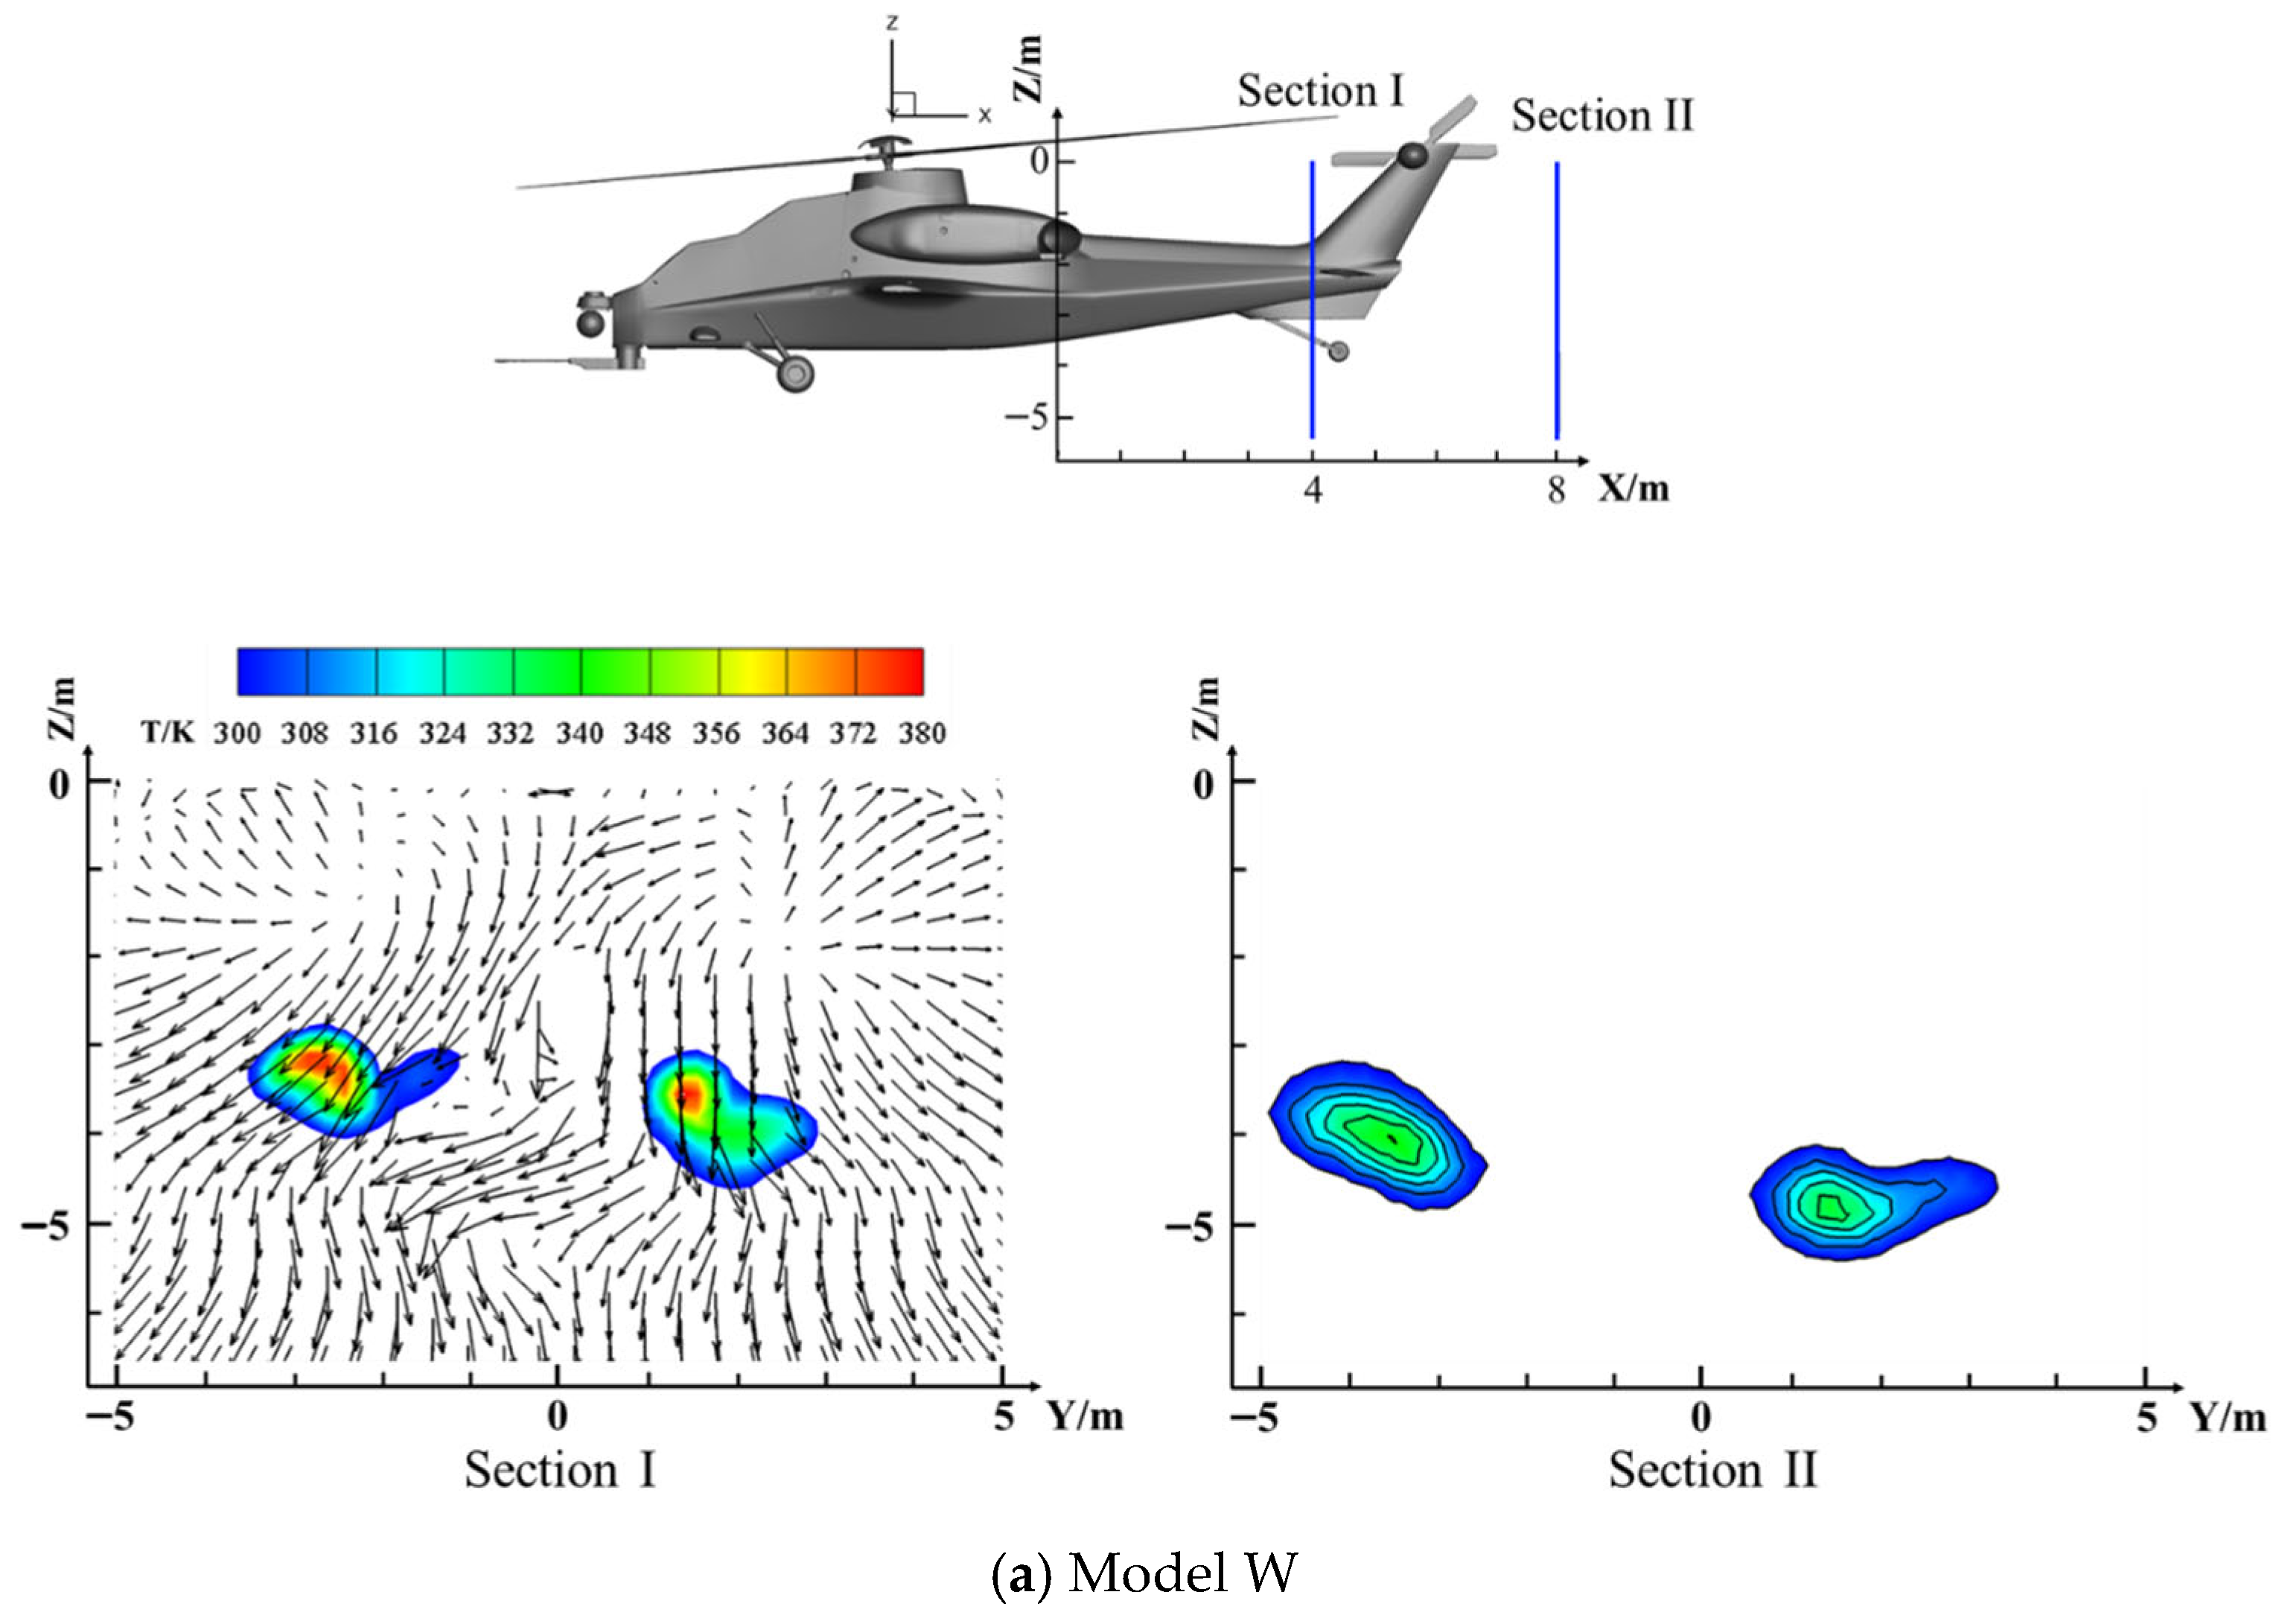
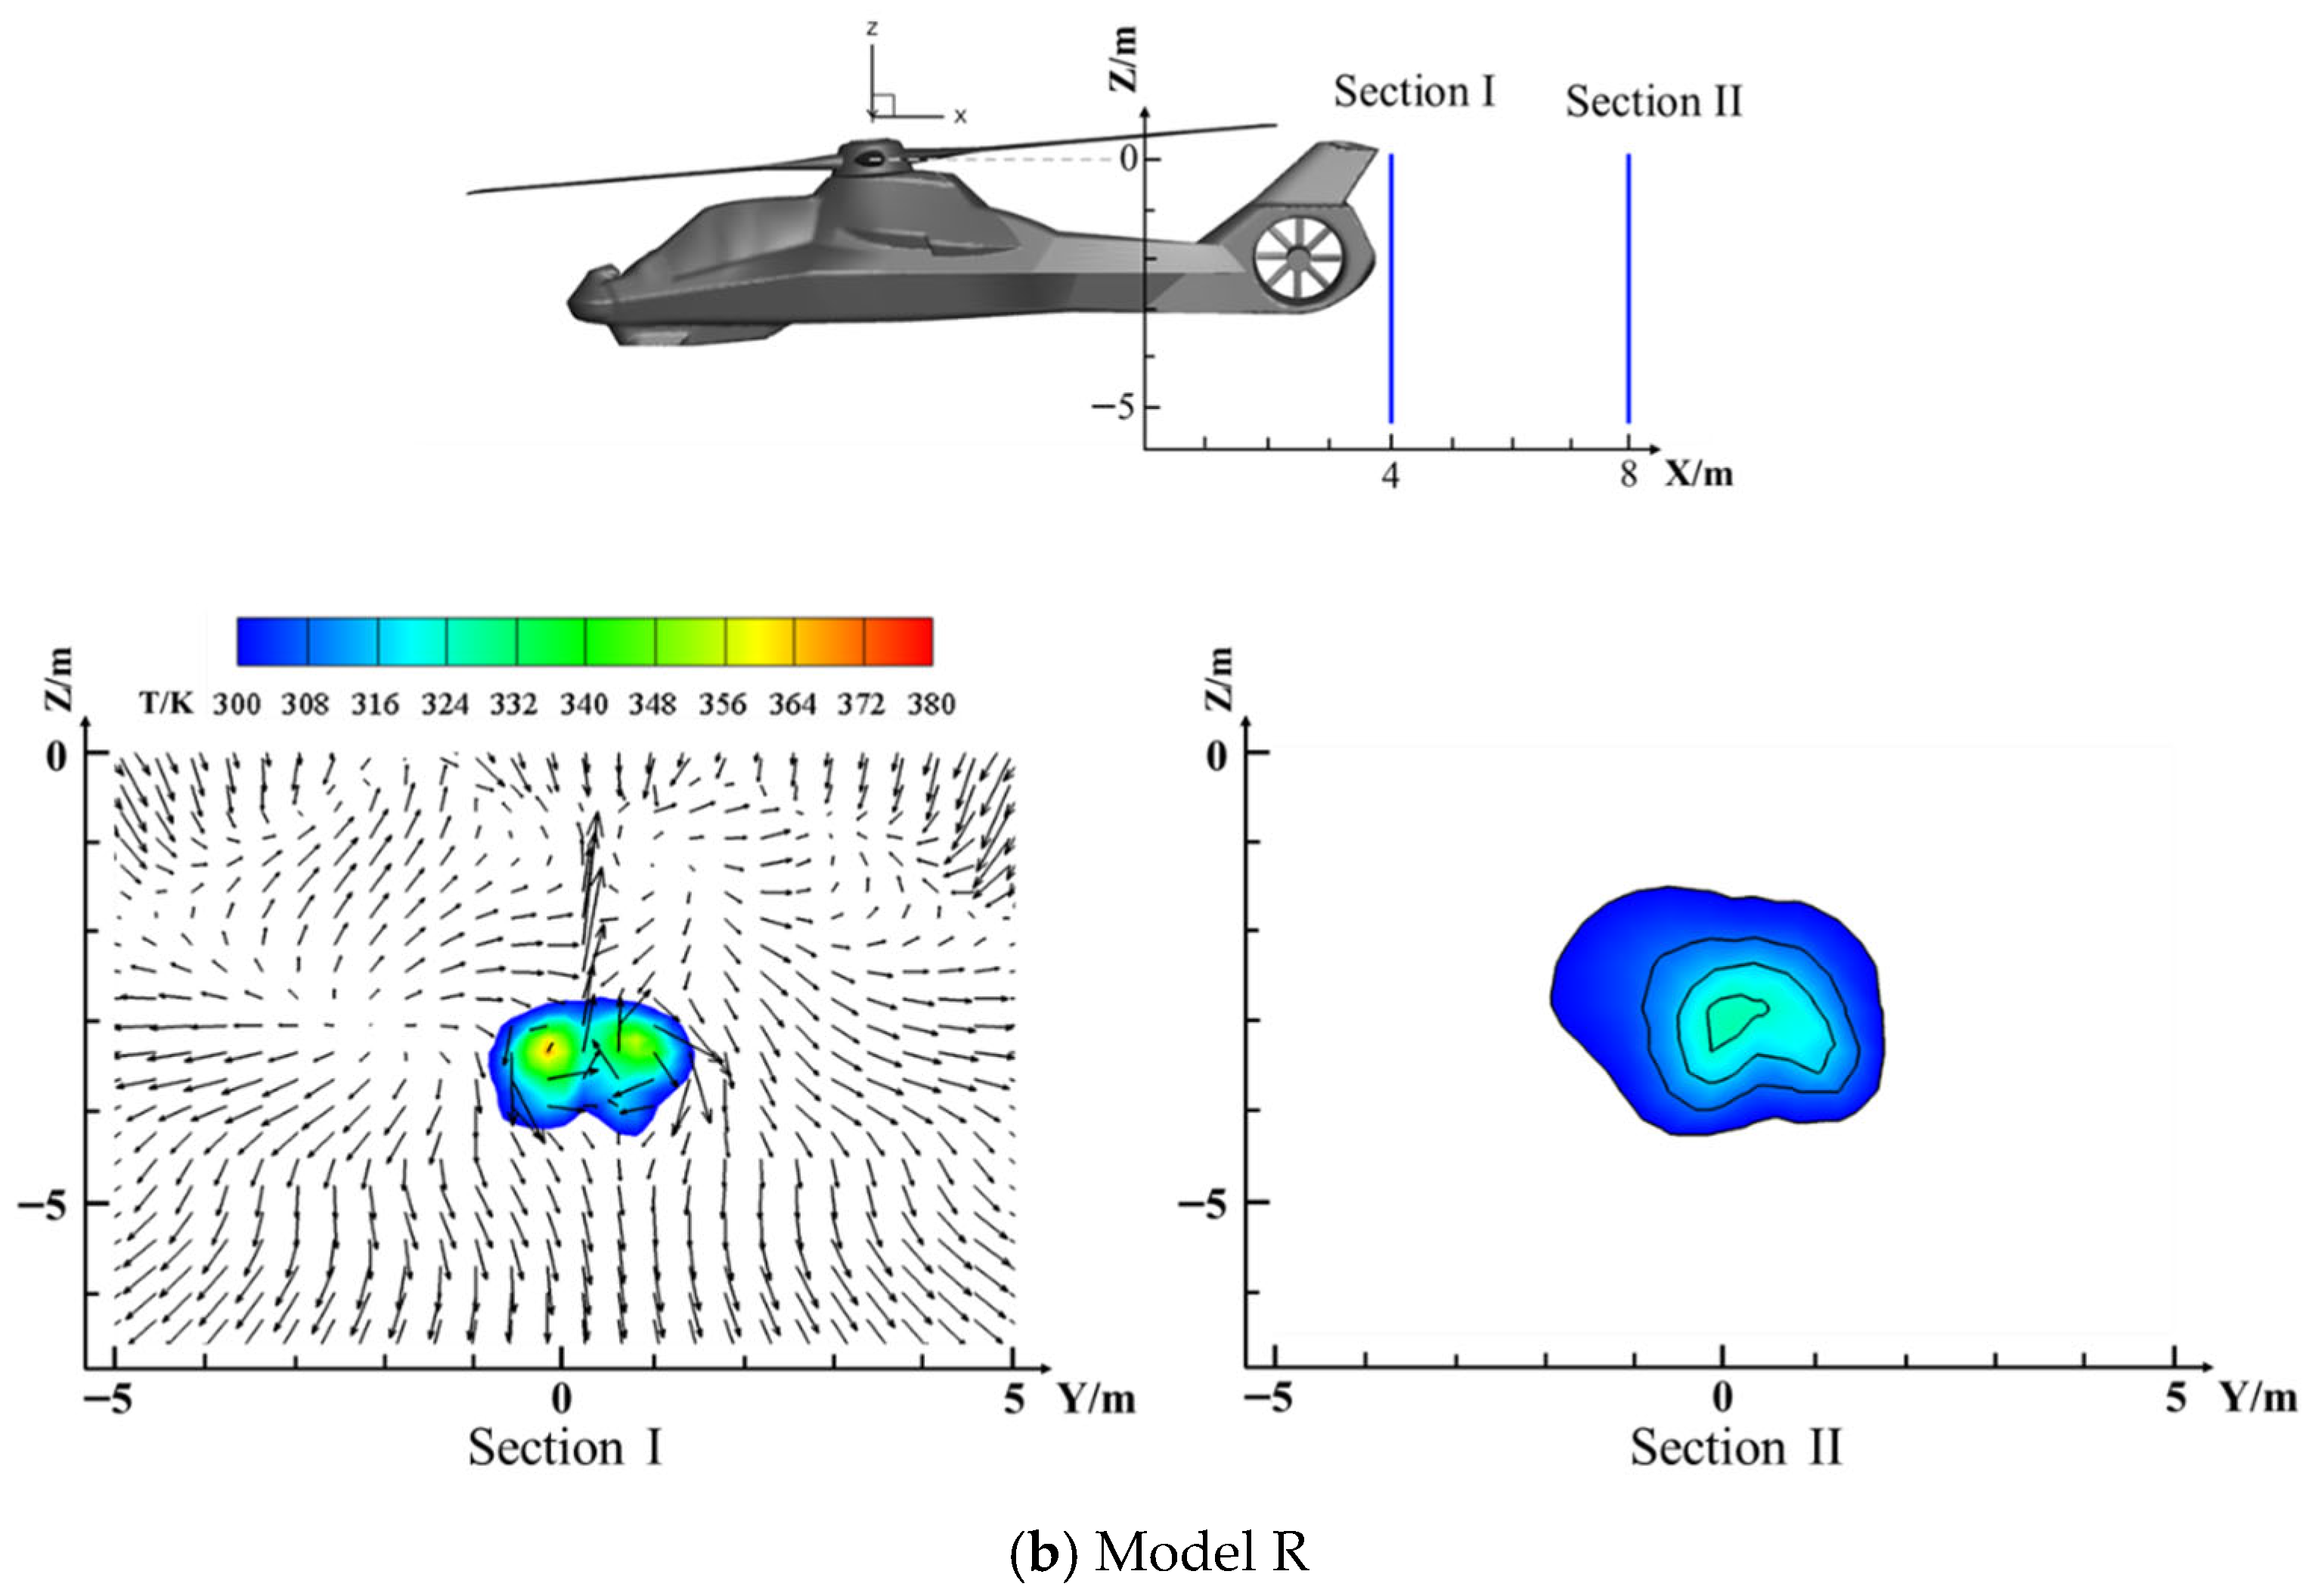
Figure 18 shows the temperature and flow field distributions at two specific cross-sectional locations during cruise, primarily to observe the downstream distribution of the hot exhaust flow. The first cross-section is located 4 m downstream from the exhaust nozzle in the direction of the forward flight airflow, and the second is 8 m downstream in the same direction. According to the analysis in Table 3, the Model W nozzle exhibits a higher entrainment flow rate and a lower exhaust temperature at the nozzle. However, the results in Figure 18 indicate that its downstream temperature is significantly higher. This suggests that the Model W nozzle has a lower thermal dissipation efficiency. A likely reason is the circular nozzle design, which results in slower heat exchange with the surrounding air. In contrast, the slit-shaped nozzle used in the Model R design facilitates more effective mixing with the ambient airflow, thereby enhancing the rate of exhaust temperature dissipation.
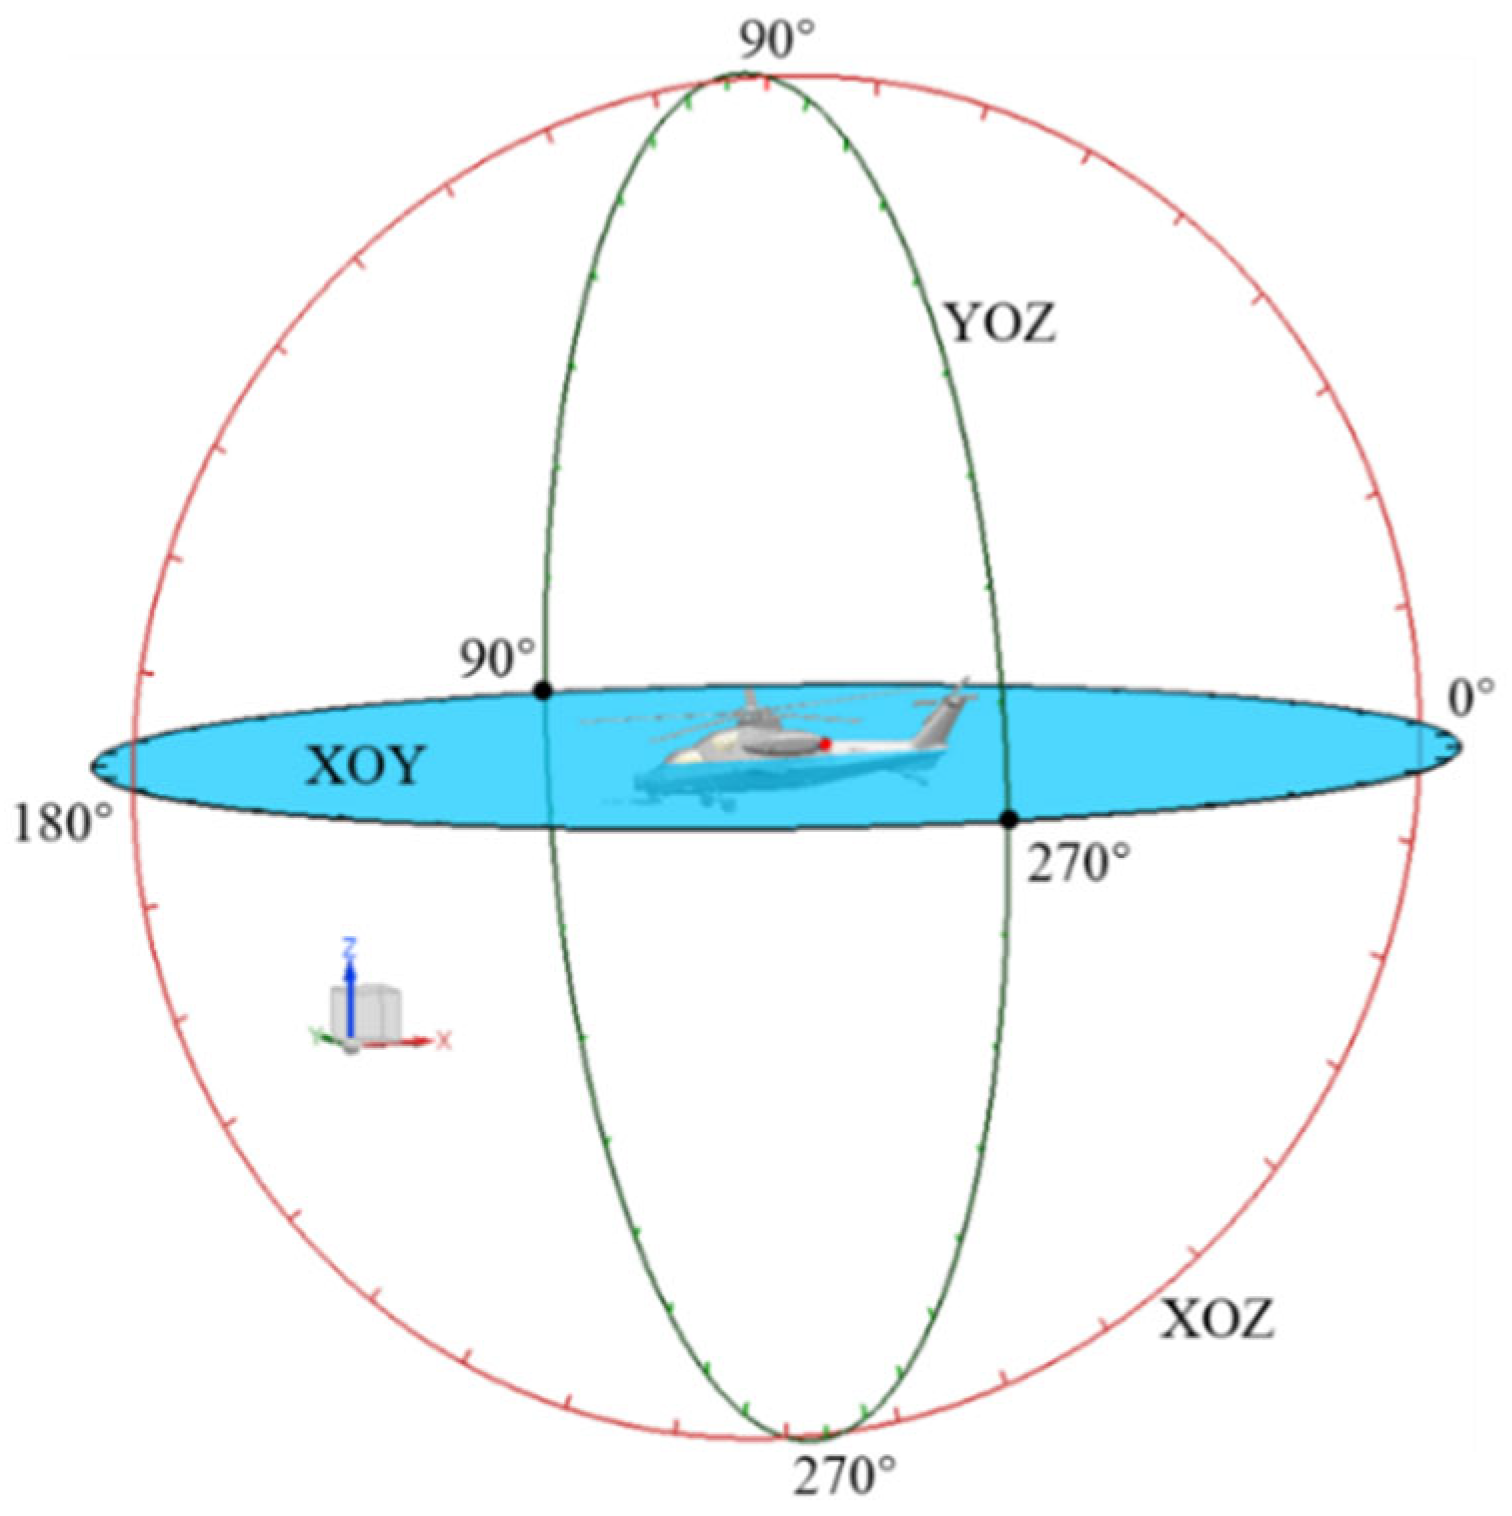
The infrared radiation calculation utilizes the forward and inverse ray tracing methods, without accounting for infrared radiation energy loss during atmospheric transmission. In this study, three representative detection planes are considered as follows: the horizontal detection plane (XOY), the longitudinal vertical detection plane (XOZ), and the transverse vertical detection plane (YOZ), as schematically shown in Figure 19. The detection points are uniformly distributed in the circumferential direction on each plane, with an angular interval of 10 degrees.
Figure 20 presents the infrared radiation intensity distributions in the 3~5 μm band for the conventional armed helicopter (Model W) and the helicopter equipped with an integrated infrared suppressor (Model R) during hover. In the infrared radiation intensity calculations, the emissivity of the helicopter surface was set to 0.8. Since infrared radiation in the 3~5 μm band primarily originates from high-temperature components and hot exhaust flows, the distribution of infrared radiation intensity in this band is closely related to the exhaust direction. Peak radiation intensity occurs at specific locations where the mixing duct exhaust outlet is directly visible.
On the horizontal detection plane, the peak infrared radiation intensity of Model W in the 3~5 μm band is approximately 150 W/Sr, nearly four times that of Model R. On the longitudinal and transverse detection planes, Model R exhibits significantly higher infrared radiation intensity than Model W within the 190~350° detection range, with a peak value around 150 W/Sr, compared to only about 70 W/Sr for Model W. Conversely, within the 0~180° detection range, Model R has a lower infrared radiation intensity than Model W, with a difference of approximately 20 W/Sr between the two models.
Figure 21 shows the infrared radiation intensity distribution in the 8~14 μm band for Model W and Model R during hover. As shown in the figure, except for certain detection directions at the bottom of the fuselage (210~290° on the longitudinal detection plane and 260~270° on the transverse detection plane), the infrared radiation intensity of Model W in the 8~14 μm band is generally higher than that of Model R. Infrared radiation in the 8~14 μm band is primarily emitted by the solid surfaces of the helicopter fuselage. Influencing factors include the surface area of the fuselage skin and its radiation temperature, while the contribution from gases to infrared radiation in this wavelength band is minimal.
As shown in Table 1, Model W has a slightly larger fuselage size than Model R. Therefore, when the infrared radiation intensity of Model W in the 8~14 μm band is higher than that of Model R, it is difficult to determine whether this is due to a larger radiating surface area or a higher surface radiation temperature. To clarify this, the projected areas of both helicopter models along the three principal axes were measured, as shown in Table 4.
The infrared radiation intensities in the 8~14 μm band along each axis direction are listed in Table 5. Each axis includes both positive and negative directions, with the positive directions defined as shown in Figure 19. Based on the data from Table 4 and Table 5, and by applying the blackbody radiation function, the equivalent radiation temperatures of each model along the three axes were inferred, as summarized in Table 6.
As presented in Table 6, the equivalent radiation temperatures of Model R are consistently lower than those of Model W in all directions except along the negative Z-axis. Quantitatively, the integrated suppressor yields reductions of approximately 12 K in the X direction and about 3 K in both the Y and Z directions. While Figure 16 and Figure 17 indicate localized high-temperature zones on the aft fuselage surface of Model R, the overall equivalent radiation temperature of Model W remains higher despite its fuselage skin being generally closer to ambient conditions. This suggests that the unshielded, high-temperature exhaust outlet of Model W plays a dominant role in infrared emissions within the 8~14 μm spectral band, underscoring the suppressor’s effectiveness in mitigating IR signatures.
The primary threat to armed helicopters on the battlefield comes from ground-based infrared (IR) detectors and IR-guided missiles. Considering that helicopters generally cruise at a maneuvering altitude of around 300 m, and that IR detectors on the ground can have detection ranges exceeding 10 km, the position of the ground-based IR detector is almost at the same horizontal level as the helicopter being detected. Therefore, the infrared radiation distribution in the horizontal detection plane during cruise is a key focus of the study.
Figure 22 shows the infrared radiation intensity distribution in the horizontal detection plane for Model W and Model R during cruise. Comparing Figure 20a and Figure 22a, it can be seen that the 3~5 μm band infrared radiation of Model R during cruise decreases significantly, to about 20 W/Sr, while Model W shows no noticeable change. The reduction in 3~5 μm IR radiation intensity for Model R during cruise is mainly due to the decrease in gas-phase radiation. The slit-type exhaust nozzle of Model R produces a sheet-like exhaust jet, which increases contact with ambient air, making the exhaust more easily dispersed and cooled by the forward airflow during cruise.
In contrast, comparing Figure 21a and Figure 22b, it is evident that flight status has little effect on the 8~14 μm band infrared radiation intensity of the helicopter. Overall, the use of an integrated infrared suppressor on the helicopter is effective in reducing its infrared signature.

4.3. Analysis of Exhaust Acoustic

According to aeroacoustic theory, jet noise is proportional to the eighth power of the jet velocity at the nozzle, making jet velocity the most critical factor influencing jet noise. In addition, jet noise is also related to the structure of the fluid. When the jet is subsonic, the primary noise source is the turbulent mixing noise between the jet and the ambient atmosphere [34]. Turbulent motion contains a large number of randomly generated small-scale vortices as well as large-scale quasi-organized vortex structures. Vorticity is one of the most important physical quantities used to describe vortex motion, and its mathematical expression is defined as [35]
H f = Ω x = w y v z Ω y = u z w x Ω z = v x u y
where x, y, and z represent the three coordinate axes, and u, v, and w denote the velocity components of the fluid in these directions. Among all vortex structures generated in fluid motion, streamwise vortices and transverse (orthogonal) vortices are two types that have a significant impact on the flow field. The directions of these vortices are parallel and perpendicular to the main flow direction, respectively. In this study, the streamwise and transverse vortices are defined as follows:
Ω s = w y v z
Ω n = u z w x 2 + v x u y 2
Streamwise vortices primarily occur in turbulent boundary layers and typically appear in alternating pairs of opposite rotation, extending along the direction of the main flow. Through a helical motion, they draw in ambient fluid toward the jet center. Under the influence of these vortices, the jet core spreads outward, promoting convective mixing between the core jet and the surrounding airflow. Therefore, given a fixed vorticity, stronger streamwise vortices lead to a faster decay of the main flow. Streamwise vortices are prone to compression from adjacent vortex structures and often coexist with vortices of the opposite rotation, intertwining with one another. As a result, their cross-sectional distribution is usually disordered and uneven in size.
Transverse (orthogonal) vortices are widely present in any free shear layer. During flow development, they interact with streamwise vortices. Their rotational direction is perpendicular to that of the streamwise vortices. Near the nozzle, their distribution pattern is constrained by the nozzle’s geometry and tends to exhibit a more uniform shape.
Table 7 presents the exhaust performance parameters of the Model W-0 and Model R-0. As shown in the table, the Model W-0 exhibits lower pressure loss, a higher ejector coefficient, and greater exhaust velocity. Since exhaust velocity has a significant impact on jet noise, in order to eliminate the influence of exhaust flow rate and isolate the effect of nozzle structure on jet noise, this section calculates not only the jet noise of the mixer under natural entrainment conditions, but also under non-entrainment conditions. The mixer models without entrainment are denoted with the subscript “No”.
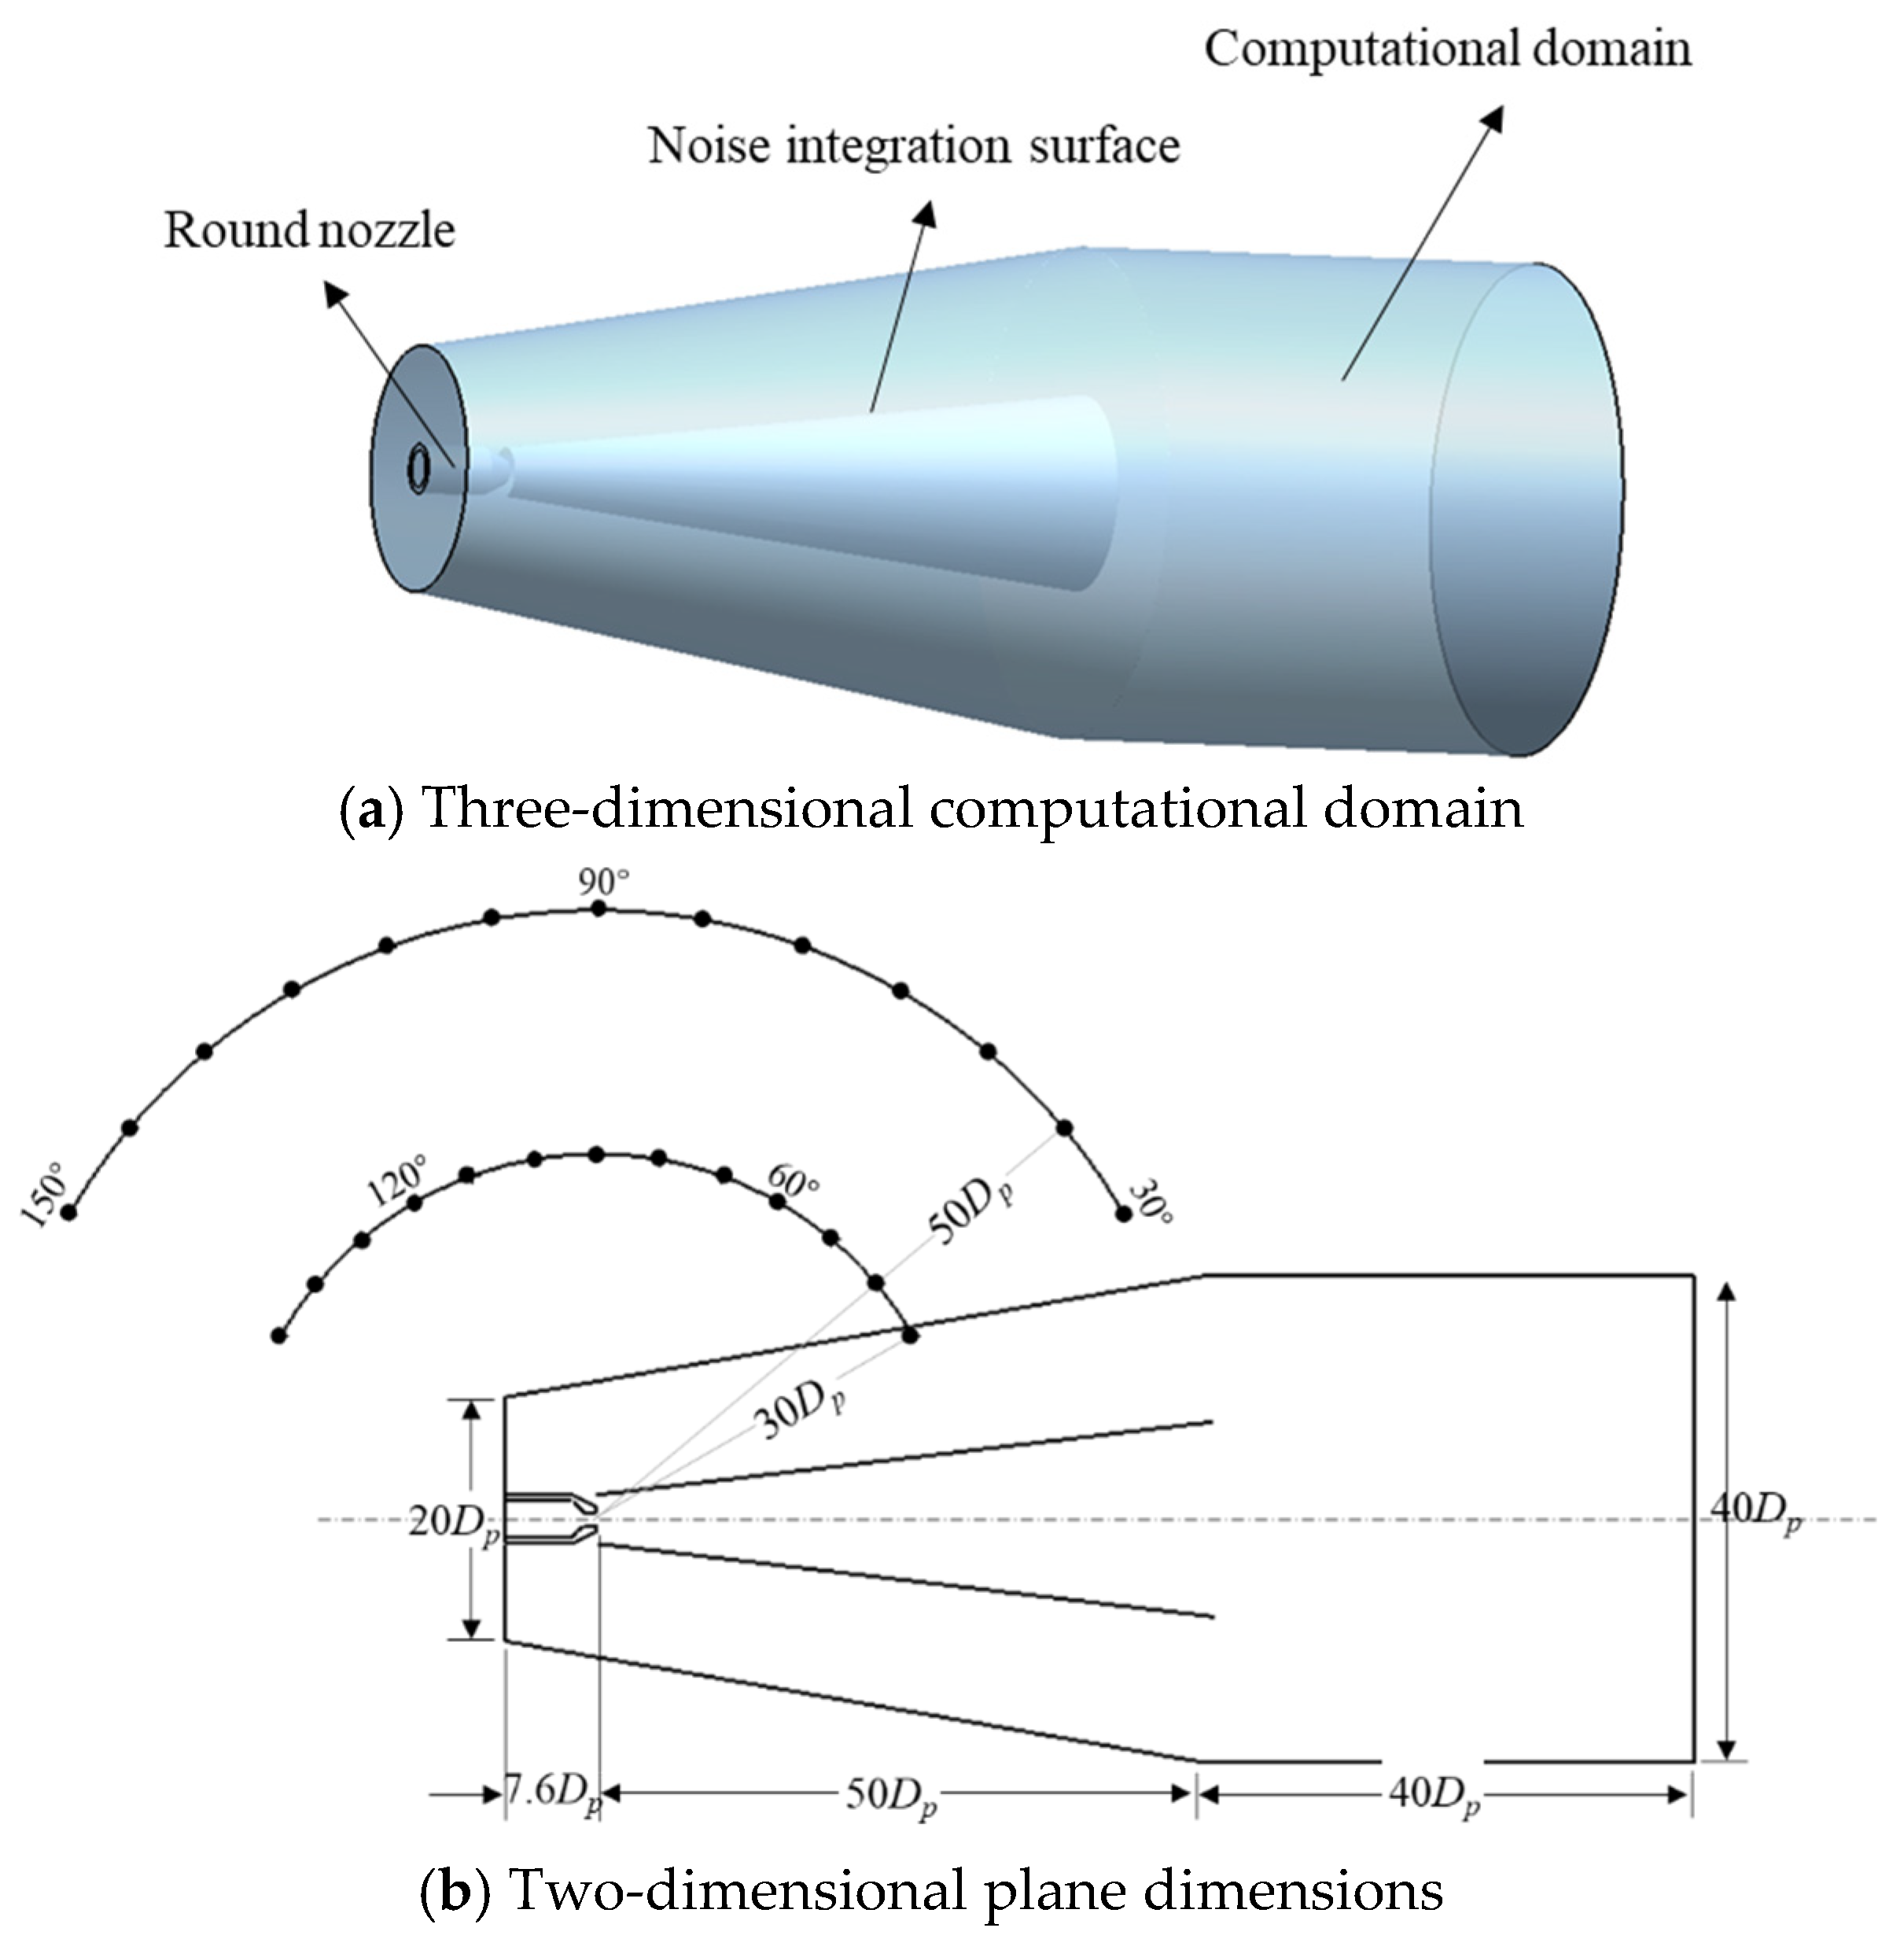
Three typical noise monitoring planes are considered as follows: the horizontal detection plane (XOY), the longitudinal vertical detection plane (XOZ), and the lateral vertical detection plane (YOZ). Due to the left-right symmetry of the mixing duct structure, only the jet noise on one side of the symmetrical plane is monitored. On each monitoring plane, noise monitoring points are evenly distributed along the circumferential direction with an angular interval of 10 degrees and a circumferential radius of 50 times the nozzle diameter (50 Dj), as shown in Figure 23.
The results calculated using the F-WH acoustic module in Fluent are shown in Figure 24. As can be seen, the noise distribution generally aligns with the jet development direction. Regardless of whether the mixing duct includes entrainment flow, the Model W-0 produces higher jet noise than the Model R-0 at all three detection circumferences. Quantitatively, the integrated suppressor reduces overall jet noise by up to 3 dB without entrainment flow and up to 5 dB when entrainment is included. These findings indicate that the large aspect ratio bent mixing duct used in the integrated infrared suppressor achieves lower jet noise levels compared to the conventional circular exhaust mixing duct.
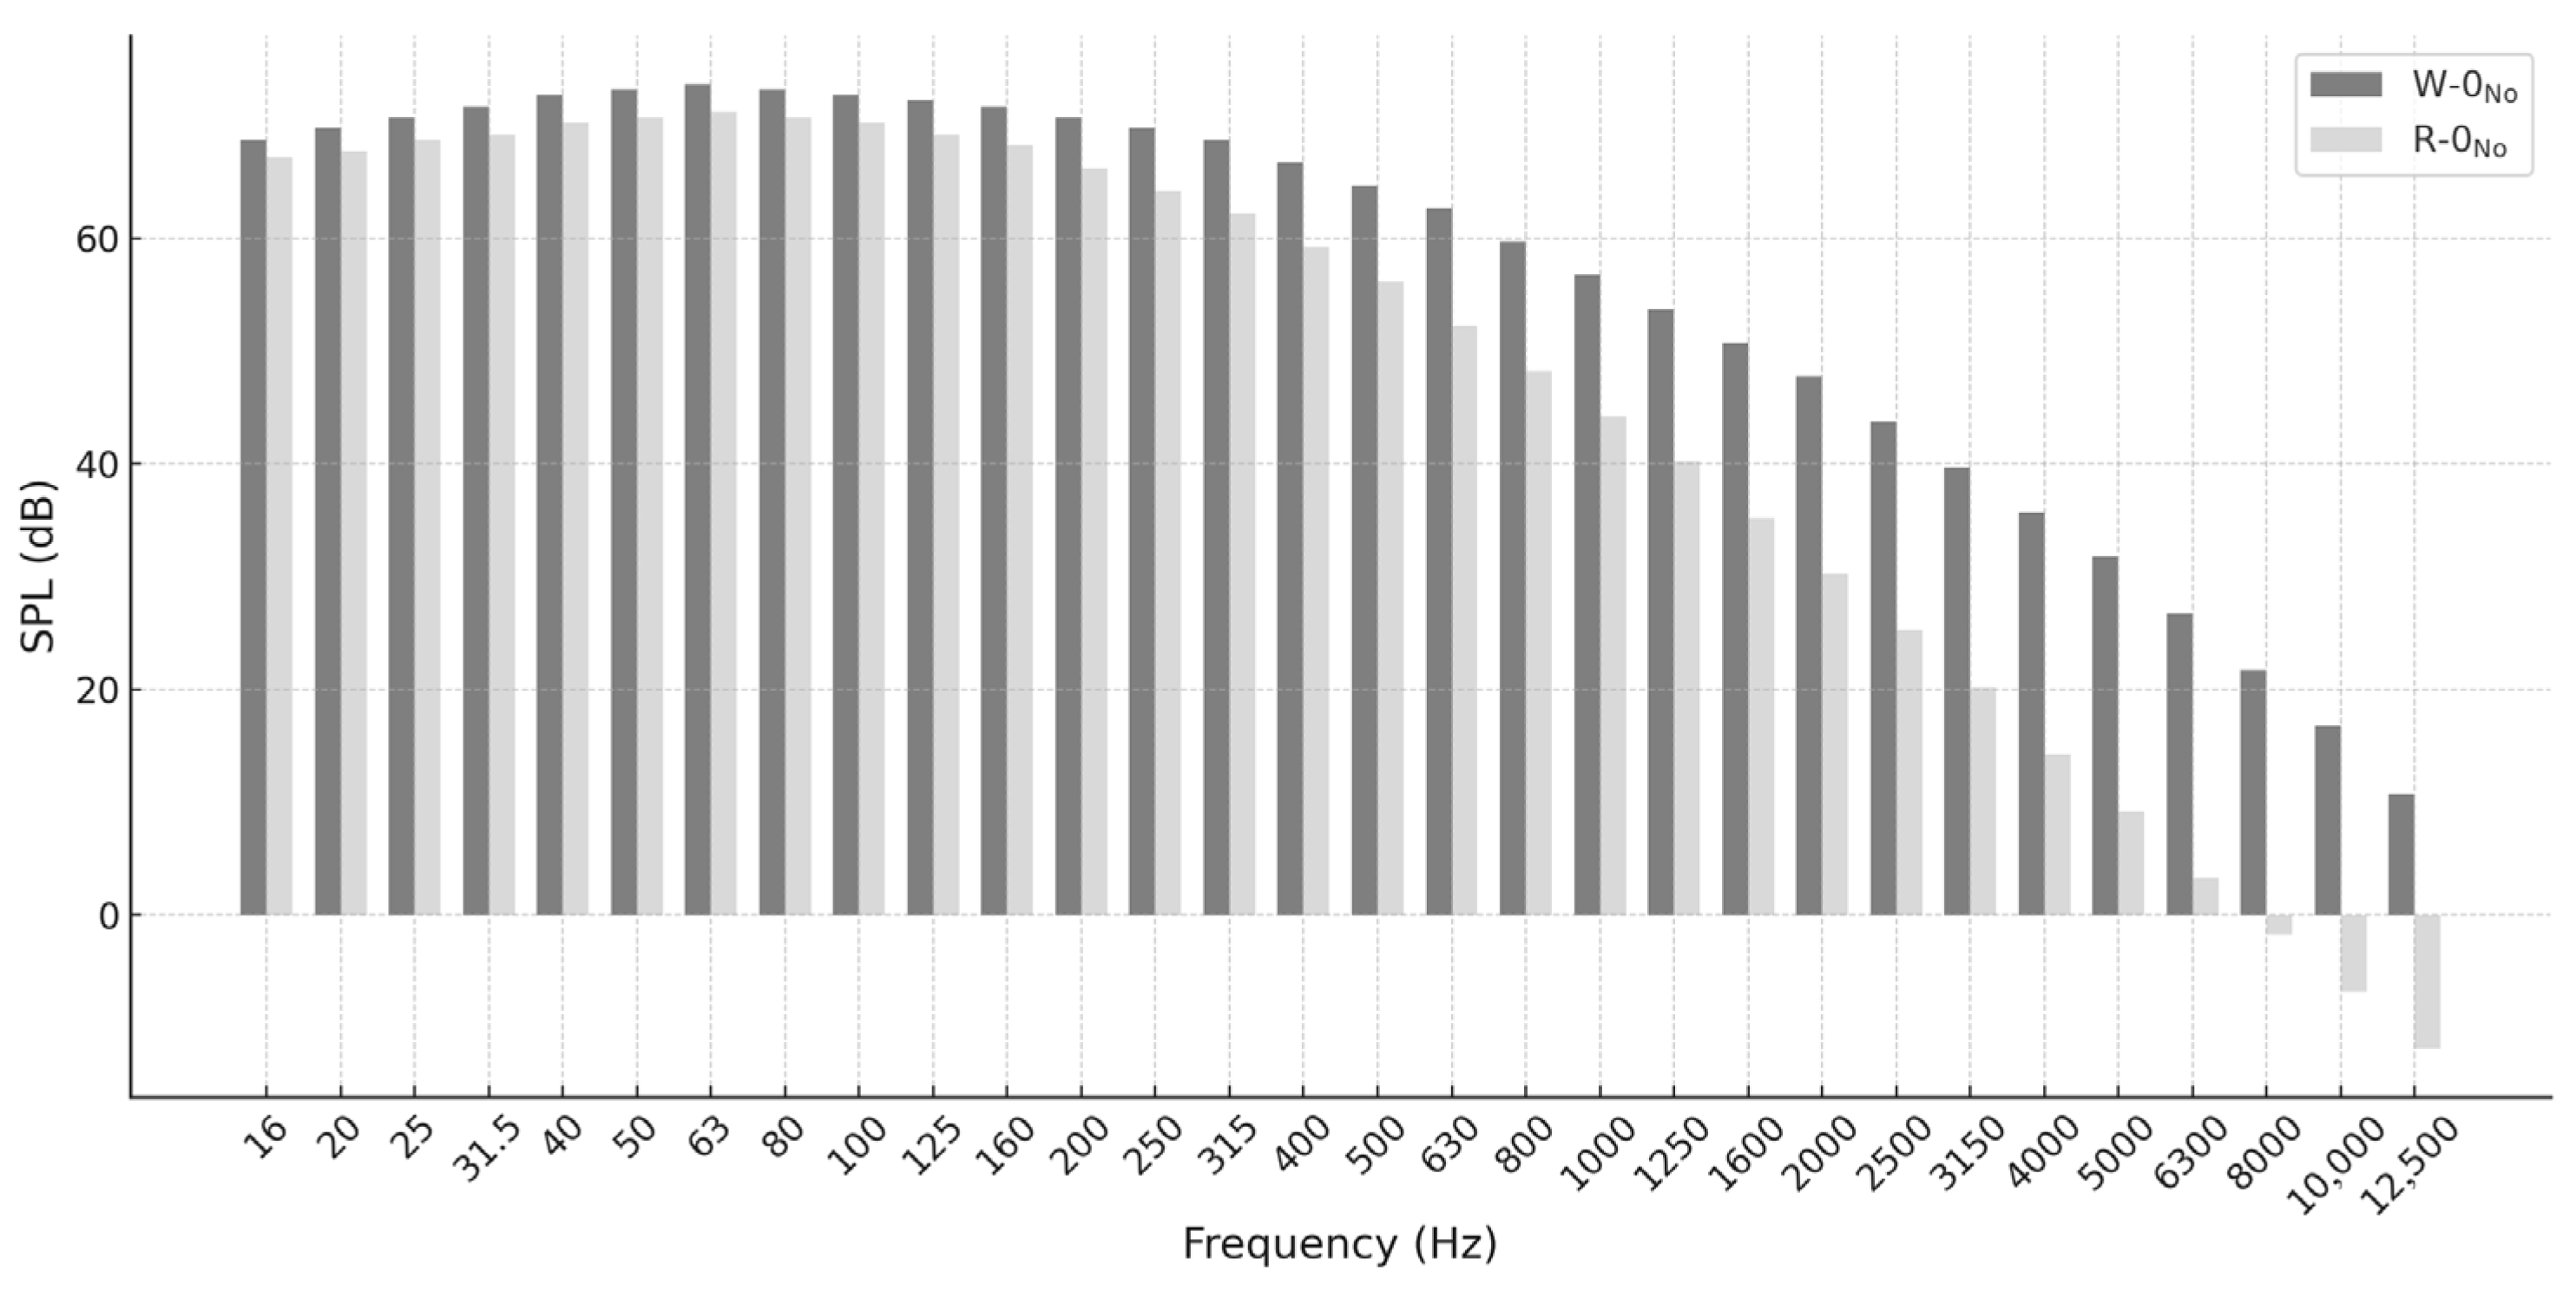
Figure 25 shows the SPL comparison of the two models without entrainment at the 300° detection point in the XOZ. The R-0No model exhibits similar performance to the W-0No model in the low-frequency range, but the sound pressure level decays more rapidly in the mid- to high-frequency range. This is related to the slit structure, which enhances the mixing effect between the exhaust flow and the surrounding air. The structure effectively reduces the turbulence intensity of the jet flow, thereby attenuating high-frequency noise components, resulting in a lower overall sound pressure level.
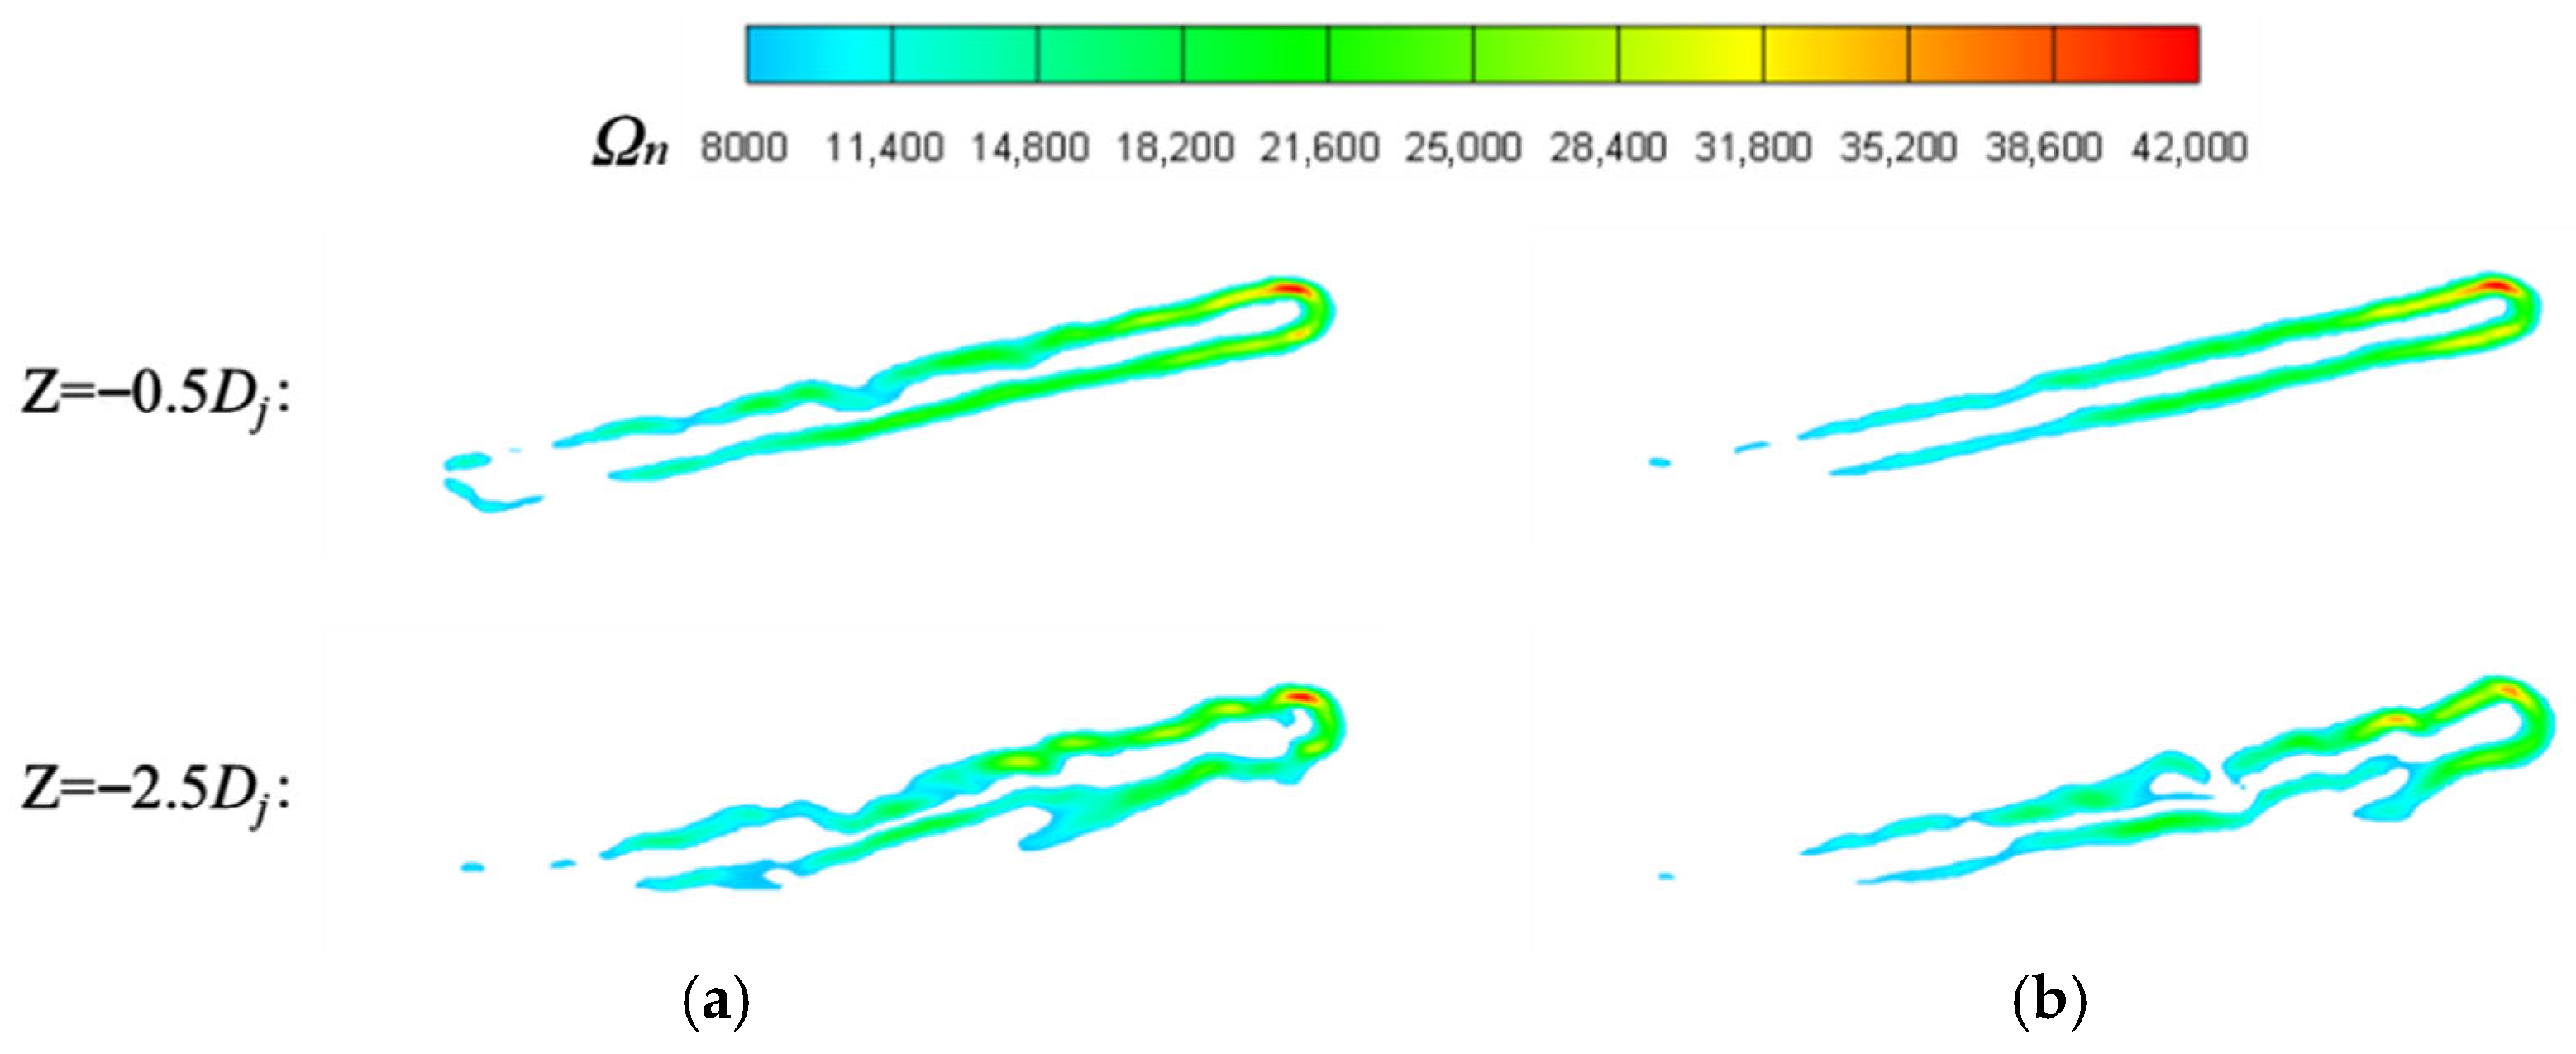
For the aft fuselage of the two helicopters, Model R-1 features two additional air intake slits on the top of the aft fuselage compared to Model W-1. These slits allow the rotor downwash airflow to enter the aft fuselage compartment to cool the mixing duct. After cooling the mixing duct, the airflow inside the aft fuselage is discharged together with the mixing duct jet through the exhaust outlet at the bottom of the aft fuselage. This creates an enveloping effect around the mixing duct exhaust flow, effectively suppressing the infrared radiation signal of the exhaust plume. However, the impact on the mixing duct jet noise requires further investigation. Measurements show that under the influence of the rotor downwash, the front intake slit on the top of the aft fuselage admits approximately 0.004 kg/s of air, while the rear intake slit admits about 0.02 kg/s. Therefore, in the noise calculations, the top aft fuselage intake slits of Model R-1 were set as mass flow inlets with corresponding flow rates to simulate the rotor downwash airflow entering the aft fuselage compartment. Additionally, a control model without the aft fuselage top intake flow was set up to explore the effect of the aft fuselage compartment airflow on the mixing duct jet noise.
Figure 26 shows the orthogonal vortex results of the aft fuselage exhaust flow. As observed, the model with the top intake airflow exhibits slightly lower orthogonal vortex intensity. This is because the airflow inside the aft fuselage, when discharged, wraps around the outer edge of the mixing duct jet, reducing the velocity gradient between the mixing duct exhaust jet and the surrounding ambient flow, which helps to reduce the jet noise.
On the other hand, when the top intake airflow is present, it lowers the pressure at the mixing duct exhaust outlet as it exits from the bottom of the aft fuselage, causing the mixing duct’s ejector coefficient to increase by 2%. This results in a higher exhaust velocity from the mixing duct, which in turn increases the jet noise.
The final calculated noise results of the two models on the horizontal detection circumference are shown in Figure 27. Overall, the presence of the top intake airflow on the aft fuselage has little impact on the mixing duct jet noise, with the maximum noise difference between the two models not exceeding 0.5 dB. At the front end of the jet direction (330–90°), the model with the top intake airflow exhibits slightly lower noise levels than the comparison model, indicating that in this region, the noise reduction effect from the top airflow lowering the velocity gradient outweighs the noise increase caused by the higher jet velocity due to the top airflow.
The two helicopter configurations differ in exhaust orientation, which leads to distinct aerodynamic noise distributions under the influence of rotor downwash. 
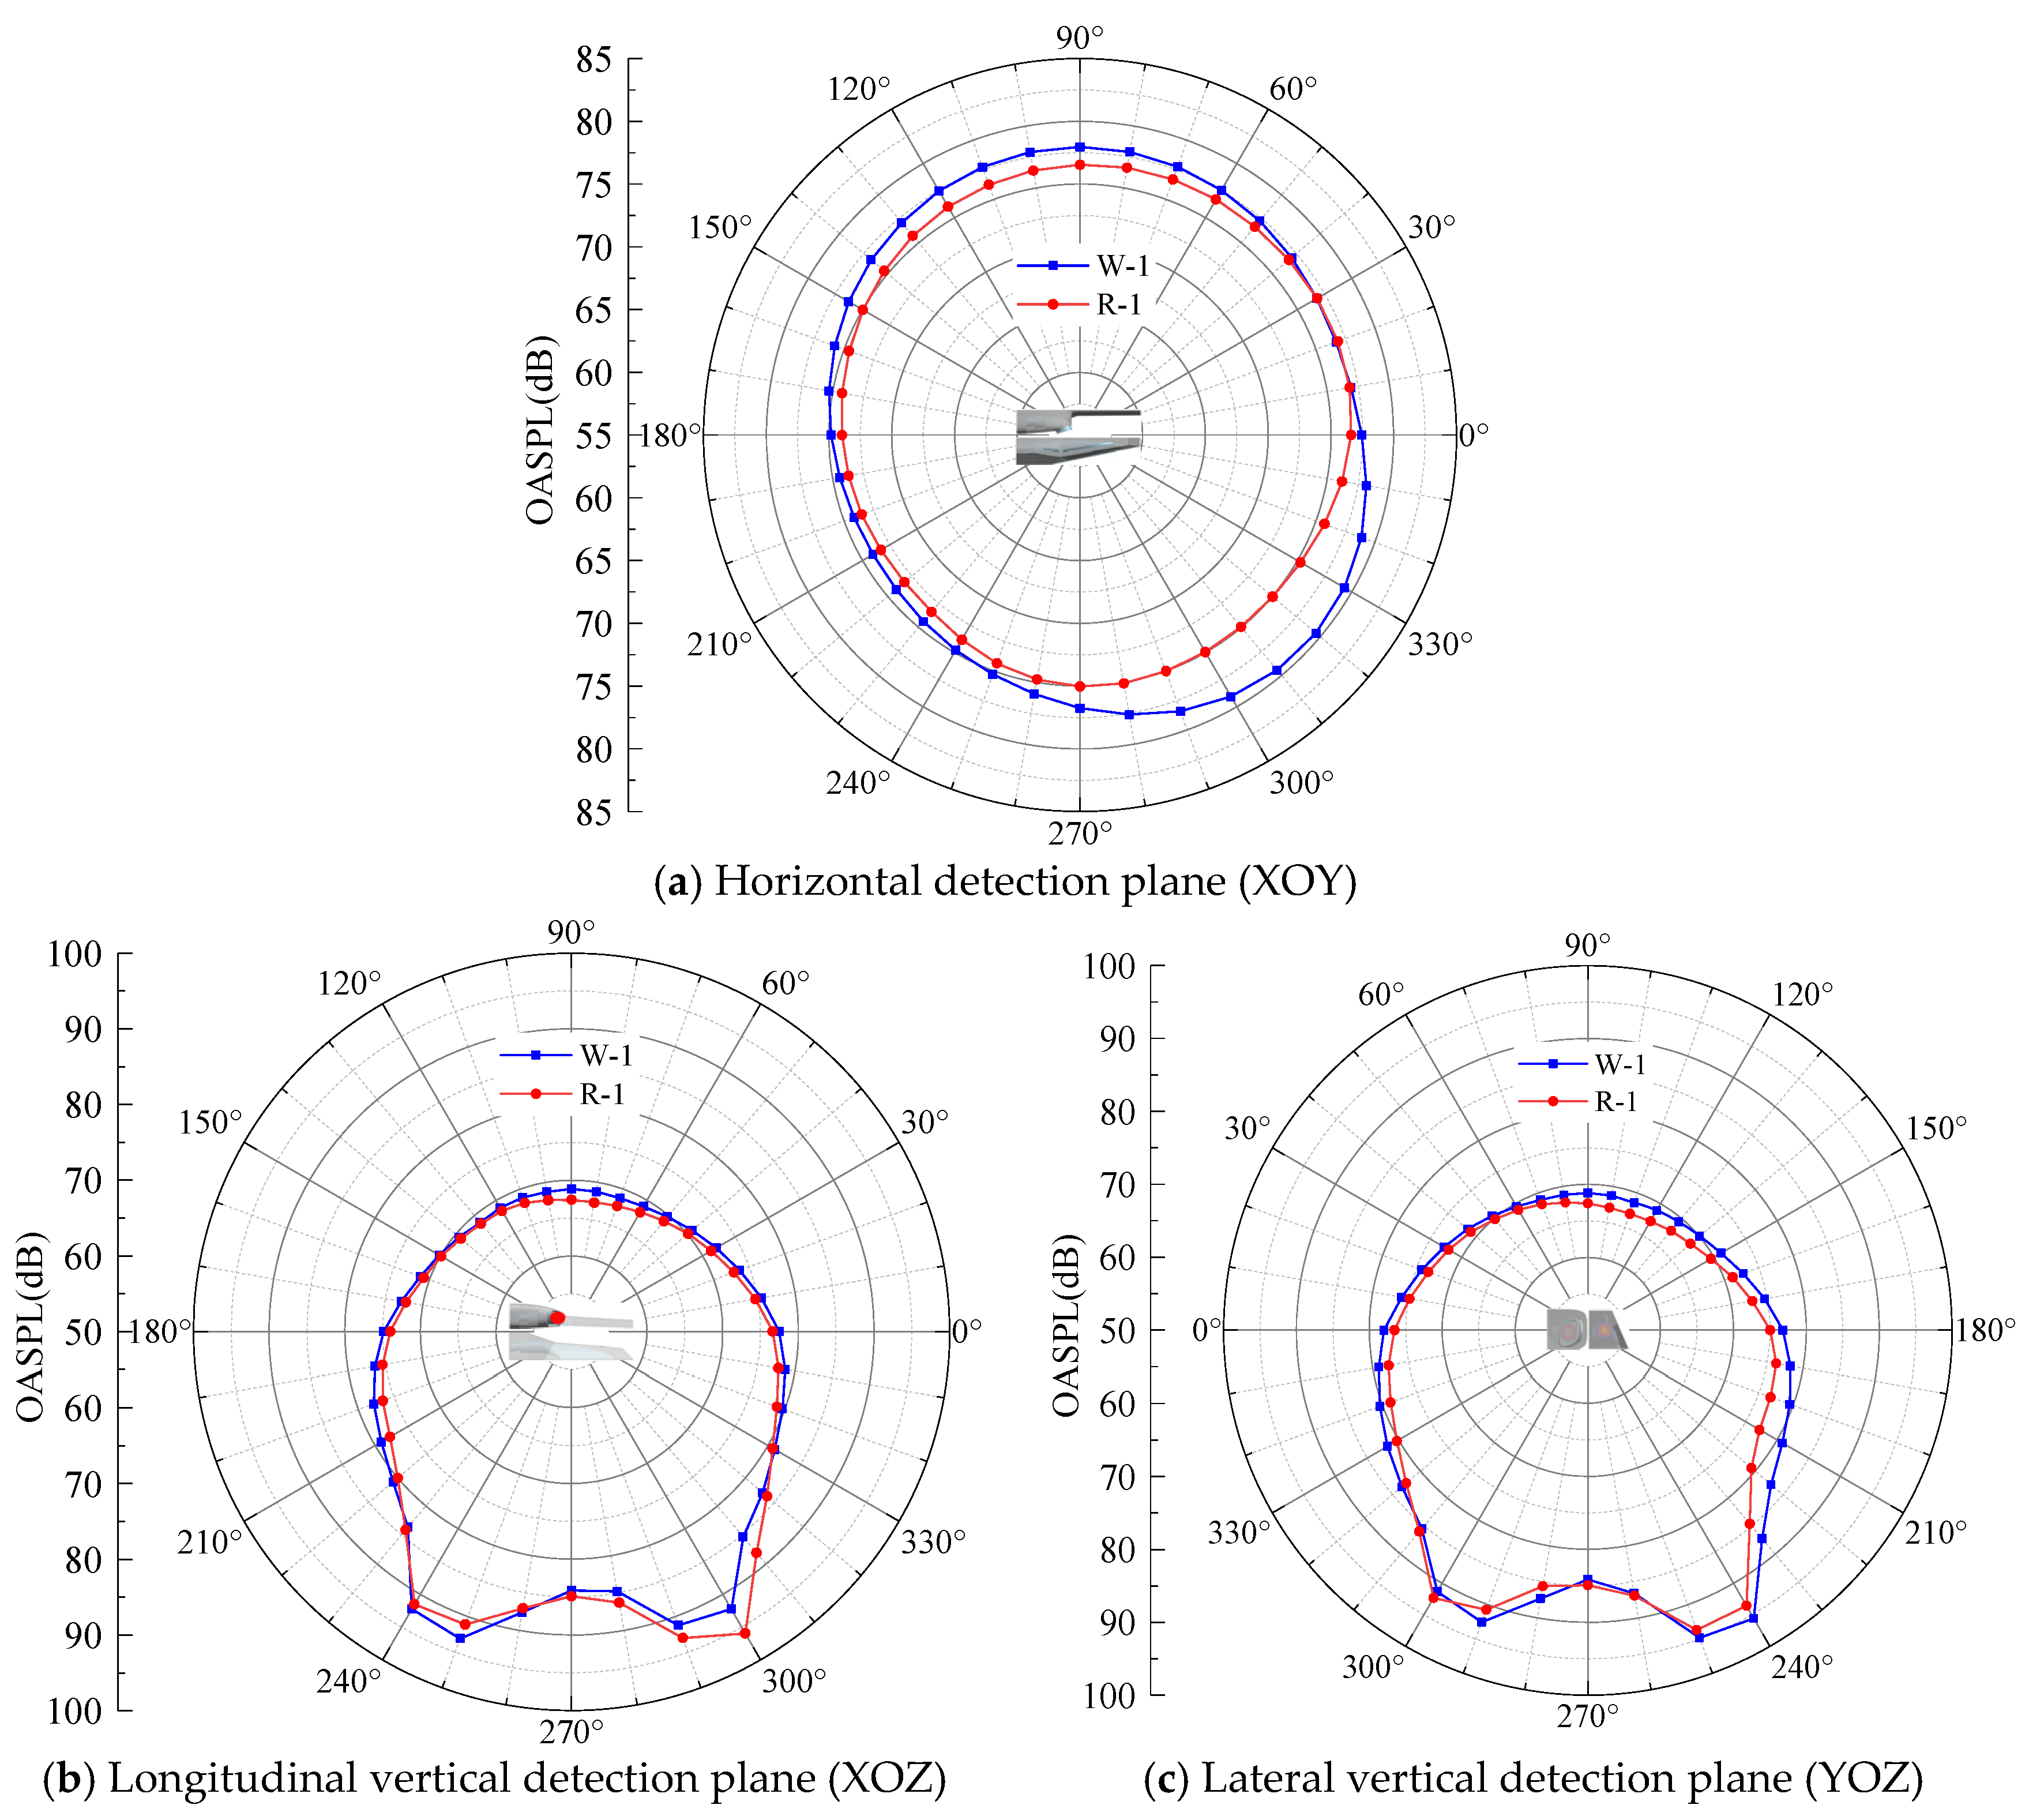
Figure 28 presents the computed rotor–jet interaction noise for both aft fuselage models, with the monitoring radius set at 50 times the inlet diameter of the mixing duct.
From Figure 28a, the noise distribution on the horizontal detection circle is approximately symmetric. Since the exhaust of Model W-1 is directed horizontally, the noise levels at positions aligned with this direction are significantly higher—up to 5 dB greater—than those of Model R-1, whose exhaust is deflected downward.
As shown in Figure 28b, on the vertical detection circle, rotor downwash induces a distinct front–rear noise asymmetry, with downstream regions exhibiting higher sound pressure levels. Additionally, due to the radial variation in rotor speed (peaking near 0.8 times the rotor radius), the downstream noise pattern shows a dip at the center and elevated levels on either side. In this case, the downward exhaust of Model R-1 results in a local noise increase of about 3 dB around the 300° position compared to Model W-1.
In Figure 28c, the lateral detection circle exhibits a noise distribution similar to the vertical plane. Both configurations yield comparable overall levels, but in the 180–240° range, Model W-1 demonstrates a noticeably higher noise level—up to 2 dB—due to its lateral jet exhaust orientation.
Overall, in regions not directly influenced by the exhaust jet, Model R-1 shows slightly improved aerodynamic noise performance relative to Model W-1. These results suggest that the adoption of an integrated infrared suppressor does not degrade, and may even improve, the acoustic characteristics of the helicopter in off-axis directions.

5. Conclusions

This study presents a comprehensive evaluation of the aerodynamic, infrared, and acoustic performance of an integrated infrared suppressor for helicopter stealth enhancement, combining experimental validation and numerical simulations. The proposed suppressor significantly improves both infrared and acoustic stealth by adopting a slit-type exhaust integrated within the aft fuselage. Specifically, the design achieves a reduction of up to 12 K in equivalent infrared radiation temperatures and lowers acoustic signatures by approximately 5 dB compared to conventional circular nozzles. The embedded configuration effectively reduces the direct visibility of high-temperature components, while internal airflow management enhances cooling and minimizes acoustic turbulence. These dual stealth improvements are achieved with acceptable aerodynamic trade-offs, providing important engineering insights and practical guidelines for the design of future low-observable rotorcraft and potentially broader aerial platforms.
Additionally, this study identifies that the helicopter rotor-induced asymmetric ejector performance could be leveraged to further optimize the suppressor geometry. By tailoring the design of the mixing ducts to better utilize rotor-generated airflow, future designs may minimize aerodynamic penalties while effectively balancing infrared and acoustic suppression. Future work may therefore include such geometry optimization strategies and extend performance assessments under varied mission-specific conditions to further enhance stealth effectiveness.
Despite the promising results demonstrated through validated numerical simulations, this study still lacks direct experimental testing, particularly in acoustic validation. Future work will therefore focus on conducting targeted infrared and acoustic experiments under realistic operational conditions to further verify and refine the simulation predictions, thereby enhancing the robustness and applicability of the proposed suppressor design.

Author Contributions

Conceptualization, J.Z.; Methodology, Z.Y.; Validation, X.Z.; Investigation, Z.Y.; Resources, J.Z.; Data curation, X.Z.; Writing—original draft, Z.Y.; Writing—review & editing, Z.Y. All authors have read and agreed to the published version of the manuscript.

Funding

This research was funded by Xiamen Natural Science Foundation, grant number 3502Z202571048.

Data Availability Statement

Data are contained within the article.

Conflicts of Interest

The authors declare no conflict of interest.

References

  1. Liu, Z.; Song, C.; Liu, J.; Zeng, Z.; Yuan, N.; Shi, H. Numerical study on infrared suppression (IRS) devices with streamlined lobed nozzles featuring Bezier curve characteristics. Appl. Therm. Eng. 2025, 267, 125801. [Google Scholar] [CrossRef]
  2. Li, Y.Q.; Xuan, Y.M. Thermal characteristics of helicopters based on integrated fuselage structure/engine model. Int. J. Heat. Mass. Tran. 2017, 115, 102–114. [Google Scholar] [CrossRef]
  3. Mukherjee, A.; Chandrakar, V.; Senapati, J.R. New correlations for infrared suppression devices having louvered diabatic tubes with surface radiation, Therm. Sci. Eng. Prog. 2023, 44, 102011. [Google Scholar]
  4. Qiu, C.; Zou, Y.; Kong, B.; Yuan, J.; Yang, K.; Shi, H. Multi-objective optimization of IRS device with scalloped lobed nozzle on flow features and thermal mixing performance. Int. Commun. Heat Mass Transf. 2024, 155, 107561. [Google Scholar] [CrossRef]
  5. Yuan, J.; Yang, K.J.; Shi, H.; Zou, Y.; Kong, B.; Jiang, Y. Optimal shape design and performance investigation of the diffuser for infrared suppression (IRS) device applying MO-SHERPA. Int. Commun. Heat Mass Transf. 2023, 147, 106960. [Google Scholar] [CrossRef]
  6. Zou, Y.; Shi, H.; Jiang, Y.; Kong, B. Numerical study of an infrared suppression (IRS) device with cooling hole configuration on the mixing tube. Appl. Therm. Eng. 2024, 236, 121866. [Google Scholar] [CrossRef]
  7. Zhou, Z.Y.; Huang, J.; Wang, J.J. Radar/infrared integrated stealth optimization design of helicopter engine intake and exhaust system. Aerosp. Sci. Technol. 2019, 95, 105483. [Google Scholar] [CrossRef]
  8. Zhou, Z.; Huang, J. Influence of Rotor Dynamic Scattering on Helicopter Radar Cross-Section. Sensors 2020, 20, 2097. [Google Scholar] [CrossRef]
  9. Zhao, M.; Zhu, H.; Qin, B.; Zhu, R.; Zhang, J.; Ghosh, P.; Wang, Z.; Qiu, M.; Li, Q. High-Temperature Stealth Across Multi-Infrared and Microwave Bands with Efficient Radiative Thermal Management. Nano-Micro Lett. 2025, 17, 199. [Google Scholar] [CrossRef] [PubMed]
  10. Kanclebo, S.W. Boeing Silorsky findings underscore RAH-66 stealth. Aviat. Week Space Technol. 1993, 139, 22–23. [Google Scholar]
  11. Zhang, J.; Pan, C.; Shan, Y. Progress in helicopter infrared signature suppression. Chin. J. Aeronaut. 2014, 27, 189–199. [Google Scholar] [CrossRef]
  12. Tang, Z.F.; Zhang, J.Z.; Shan, Y. Investigation on ejecting and mixing characteristics of lobed nozzle with curved mixing duct and slot exit. J. Aerosp. Power 2005, 20, 978–982. [Google Scholar]
  13. Tang, Z.F.; Zhang, J.Z.; Wang, X.W.; Liu, Q. Experimental research on infrared suppressor integrating the exhaust system with the tail part of a helicopter. J. Aerosp. Power 2007, 22, 233–237. [Google Scholar]
  14. Ren, L.; Zhang, J.; Wang, X.; Shan, Y. Analysis of stealth properties on IR radiation suppressor embed inside helicopter rear airframe. Infrared Laser Eng. 2011, 40, 2091–2097. [Google Scholar]
  15. Xiao, C.; Tong, Z.X. Investigating aerothermodynamic characteristics and mixing performance of fuselage-integrated IRS in helicopters, based on a multi-parametric design method with mathematical description. Aerosp. Sci. Technol. 2025, 158, 109929. [Google Scholar] [CrossRef]
  16. Li, Y.; Xuan, Y. The influence of helicopter rotor-fuselage flow interaction on temperature fields in forward flight. Appl. Therm. Eng. 2017, 116, 488–499. [Google Scholar] [CrossRef]
  17. Wikipedia. Boeing–Sikorsky RAH-66 Comanche. Available online: https://en.wikipedia.org/wiki/Boeing-Sikorsky_RAH-66_Comanche (accessed on 15 March 2024).
  18. Wikipedia (Chinese). CAIC Z-10 Attack Helicopter. Available online: https://zh.wikipedia.org/wiki/直-10 (accessed on 23 July 2025).
  19. Yang, Z.; Zhang, J.; Shan, Y. Research on the influence of integrated infrared suppressor exhaust angle on exhaust plume and helicopter infrared radiation. Aerosp. Sci. Technol. 2021, 118, 107013. [Google Scholar] [CrossRef]
  20. Kang, N.; Sun, M. Navier-Stokes calculations of induced velocity of a rotor in forward flight with ground effects. Acta Aerodyn. Sin. 1998, 16, 221–225. [Google Scholar]
  21. Uzun, A.; Lyrintzis, A.; Blaisdell, G. Coupling of Integral Acoustics Methods with LES for Jet Noise Prediction: AIAA-2004-0517; AIAA: Reston, VA, USA, 2004. [Google Scholar]
  22. International Civil Aviation Organization. International Standards and Recommended Practices of Aircraft Noise, 6th ed.; Annex 16; ICAO: Montreal, QC, Canda, 2011; Volume I. [Google Scholar]
  23. ANSYS Inc. ANSYS Fluent 19.0 User’s Guide; ANSYS Inc.: Canonsburg, PA, USA, 2018. [Google Scholar]
  24. Pan, C.; Zhang, J.; Shan, Y. Modeling and analysis of helicopter thermal and infrared radiation. Chin. J. Aeronaut. 2011, 24, 558–567. [Google Scholar] [CrossRef]
  25. Pan, C.X.; Zhang, J.Z.; Shan, Y. Effects of exhaust temperature on helicopter infrared signature. Appl. Therm. Eng. 2013, 51, 529–538. [Google Scholar] [CrossRef]
  26. Yang, Z.; Zhang, J.; Shan, Y. Effects of forward-flight speed on plume flow and infrared radiation of IRS-integrating helicopter. Chin. J. Aeronaut. 2022, 35, 155–168. [Google Scholar] [CrossRef]
  27. Möser, M. Engineering Acoustics: An Introduction to Noise Control; Springer Science and Business Media: Berlin/Heidelberg, Germany, 2009. [Google Scholar]
  28. Han, T.; Wang, L.; Cen, K.; Song, B.; Shen, R.; Liu, H.; Wang, Q. Flow-induced noise analysis for natural gas manifolds using LES and FW-H hybrid method. Appl. Acoust. 2020, 159, 107101. [Google Scholar] [CrossRef]
  29. Cai, Y. The definition and measurement of the maximum sound pressure level. J. Guangzhou Univ. 2008, 7, 43–46. (In Chinese) [Google Scholar]
  30. Jordan, P.; Gervais, Y.; Valiere, J.C.; Foulon, H. Final Results from Single Point Measurements. Project Deliverable D3.4, JEAN —EU 5th Framework Programme. G4RD-CT2000-00313. 2002. Available online: https://www.researchgate.net/publication/278769412 (accessed on 23 July 2025).
  31. Andersson, N.; Eriksson, L.; Davidson, L. Large-eddy simulation of subsonic turbulent jets and their radiated sound. AIAA J. 2005, 43, 1899–1912. [Google Scholar] [CrossRef]
  32. Lin, J.; Yu, X.; Lai, H. Large eddy simulation of circular jet with porous inner wall treatment. J. Eng. Thermophys. 2017, 38, 984–992. [Google Scholar]
  33. Yang, Z.; Zhang, J.; Shan, Y. Research on the Infrared Radiation Suppression of the High-Temperature Components of the Helicopter with an Integrated Infrared Suppressor. Aerospace 2023, 10, 351. [Google Scholar] [CrossRef]
  34. Crichton, D.; de la Rosa Blanca, E.; Law, T.R.; Hileman, J. Design and operation for ultra low noise take-off. In Proceedings of the 45th AIAA Aerospace Sciences Meeting and Exhibit, Reno, NV, USA, 8–11 January 2007. AIAA Paper 456. [Google Scholar]
  35. Silva, C.; Almeida, O.; Meneghini, J. Numerical and empirical approaches for jet noise reduction investigation of co-flow effects. In Proceedings of the 15th AIAA/CEAS Aeroacoustics Conference (30th AIAA Aeroacoustics Conference), Miami, FL, USA, 11–13 May 2009. AIAA Paper 3405. [Google Scholar]
Figure 1. Helicopter physical models.
Aerospace 12 00665 g001
Figure 2. The computational domain for the helicopter flow field and infrared radiation simulation.
Aerospace 12 00665 g002
Figure 3. Physical models for mixing duct jet noise calculation.
Aerospace 12 00665 g003
Figure 4. The computational domain for jet noise simulation.
Aerospace 12 00665 g004
Figure 5. Schematic of the aerodynamic noise calculation domain for the helicopter exhaust system.
Aerospace 12 00665 g005
Figure 6. The computational domain for aerodynamic noise simulation of a helicopter exhaust system.
Aerospace 12 00665 g006
Figure 7. Computational grids in CFD.
Aerospace 12 00665 g007
Figure 8. Validation of temperature distribution on an IRS-integrating rear-fuselage test model.
Aerospace 12 00665 g008
Figure 9. Infrared radiation intensity measurement systems and calculation models.
Aerospace 12 00665 g009
Figure 10. Spectral radiation intensity of the integrated infrared suppressor.
Aerospace 12 00665 g010
Figure 11. Schematic diagram of the round jet nozzle computational model.
Aerospace 12 00665 g011
Figure 12. Sound pressure level (SPL) spectrum at the monitoring point of θ = 60°.
Aerospace 12 00665 g012
Figure 13. Comparison of computed and experimental overall sound pressure levels (OASPL).
Aerospace 12 00665 g013
Figure 14. Streamline of the exhaust jet, downwash airflow, and tail-propeller slipstream under the hover status.
Aerospace 12 00665 g014
Figure 15. Streamline of the exhaust jet, downwash airflow, and tail-propeller slipstream under the cruise status.
Aerospace 12 00665 g015
Figure 16. Isothermal surface of a 360 K exhaust jet during hover.
Aerospace 12 00665 g016
Figure 17. Isothermal surface of a 360 K exhaust jet during cruise.
Aerospace 12 00665 g017aAerospace 12 00665 g017b
Figure 18. Temperature and flow field distributions at selected cross-sections during cruise.
Aerospace 12 00665 g018aAerospace 12 00665 g018b
Figure 19. Infrared radiation intensity detection planes of the helicopter.
Aerospace 12 00665 g019
Figure 20. Infrared radiation intensity distribution in the 3~5 μm band of the helicopter during hover.
Aerospace 12 00665 g020
Figure 21. Infrared radiation intensity distribution in the 8~14 μm band of the helicopter during hover.
Aerospace 12 00665 g021
Figure 22. Infrared radiation intensity distribution of the helicopter on the horizontal detection plane during cruise.
Aerospace 12 00665 g022
Figure 23. Schematic of noise detection position distribution.
Aerospace 12 00665 g023
Figure 24. Jet noise of the helicopter mixing duct.
Aerospace 12 00665 g024
Figure 25. Comparison of the SPL between Model W-0 and Model R-0.
Aerospace 12 00665 g025
Figure 26. Orthogonal vortex results of the aft fuselage exhaust flow. (a) The model without the aft fuselage top intake flow; (b) the model with the aft fuselage top intake flow.
Aerospace 12 00665 g026
Figure 27. Mixing duct jet noise with/without airflow in the rear fuselage compartment.
Aerospace 12 00665 g027
Figure 28. Helicopter exhaust system jet-rotor aerodynamic noise results.
Aerospace 12 00665 g028
Table 1. Main physical parameters of helicopters.
Specific PartsParametersModel WModel R
Fuselagelength/m14.312.8
width/m1.82.1
height/m3.32.9
Rotormain rotor diameter/m14.613.9
rotor installation angle/°55
tail rotor diameter/m2.71.45
Mixing ductmainstream inlet area/m20.0910.091
ejector inlet area/m20.1240.124
exhaust outlet area/m20.2360.236
length width ratio of exhaust outlet1.321
Table 2. Comparison between experimental and numerical IR intensity values.
Infrared BandMainstream TemperatureExperiment (W/Sr)Numerical (W/Sr)Difference
%
3~5 μm620 K1.40 1.464.3
730 K2.08 2.184.8
840 K2.79 2.935.0
8~14 μm620 K12.20 12.381.5
730 K17.39 17.711.8
840 K20.42 20.811.9
Table 3. Pressure loss and ejection coefficient of the Helicopter Exhaust Mixing Duct.
Flight StatusModel TypeP (Pa)Pc
LeftRightLeftRight
HoverW273628090.9930.909
R322832220.6110.607
CruiseW290729571.1061.071
R369036420.8170.788
Table 4. Projected areas of the helicopter along principal axes (m2).
Axial DirectionModel WModel R
Y27.3924.6
X7.66.76
Z31.7530.5
Table 5. Infrared radiation intensity of the helicopter in the 8~14 μm band along principal axes (W/Sr).
Axial DirectionModel WModel R
Y11981037
+12001038
X357287
+404299
Z13751464
+13741253
Table 6. Equivalent radiation temperature of the helicopter along principal axis (K).
Axial DirectionModel WModel R
Y300297
+300297
X305298
+313301
Z299306
+299296
Table 7. Exhaust performance parameters of the mixing duct for the two helicopter models.
ModelW-0R-0
Pressure loss (Pa) 27302840
Ejector coefficient0.720.57
Average exhaust speed (m/s)7365
Maximum exhaust speed (m/s)128108
Disclaimer/Publisher’s Note: The statements, opinions and data contained in all publications are solely those of the individual author(s) and contributor(s) and not of MDPI and/or the editor(s). MDPI and/or the editor(s) disclaim responsibility for any injury to people or property resulting from any ideas, methods, instructions or products referred to in the content.

