Abstract
To investigate the aerodynamic characteristics and multi-objective optimization of the variable camber airfoils, the influence of leading- and trailing-edge deflections on aerodynamic performance is conducted. A novel prediction model is presented using the Kriging surrogate model, with leading and trailing edge deflection angles as inputs and lift coefficients and drag coefficients as outputs. The Non-dominated Sorting Genetic Algorithm II (NSGA II) multi-objective optimization technique is applied to ascertain the ideal deflection parameters. The results show that upward deflection of the leading edge raises the lift, whereas downward deflection increases the value of the critical angle of attack. The deflection of the trailing edge increases the value of the critical angle of attack, while the downward deflection can enhance the lift coefficient. Appropriate upward deflections of both leading and trailing edges can delay the critical Mach number, while downward deflections of both the leading and trailing edges can enhance the value of the critical Mach number. The discrepancies between the Kriging model prediction and the CFD simulation are less than 2%. Compared to the basic airfoil, the aerodynamic performance of the optimized airfoil has been improved, with the lift coefficient increasing by 7.55% and 7.37% and the lift-to-drag ratio rising by 6.97% and 10.27% at two Mach numbers, respectively. The efficiency and reliability of this method have been verified.
1. Introduction
Variable camber wings (VCWs) can provide optimal aerodynamic performance and enhance the flight envelope by smoothly and continuously deforming their leading and trailing edges (LATEs), depending on flight conditions and mission objectives. VCWs have emerged as a focal point in morphing aircraft design owing to their low energy usage and superior cruising economy [1]. In recent years, some companies such as Boeing, NASA, and Airbus have sequentially advanced research on Variable Camber Flexible Wings (VCFWs) [2], demonstrating the viability of continuous VCWs through the application of smart materials and flexible structures.
Numerous academics are presently engaged in comprehensive investigations examining the aerodynamic performance and structural deformation of VCW. Kaul et al. investigated the aerodynamic effects of trailing-edge camber in the Variable Camber Continuous Trailing Edge Flap (VCCTEF) project [3,4], with the results demonstrating that appropriate trailing-edge deflection improves the lift-to-drag ratio and the numerical lift increments are in good agreement with the theoretical predictions [5,6]. However, excessive downward deflection angles increase the drag. For this purpose, drag reduction studies in various flight conditions are conducted in order to examine the performance of different flap configurations with selected camber deflection profiles [7]. To obtain the optimal profiles of VCWs under various flight conditions, the software environment Multidisciplinary Integrated Conceptual Aircraft Design and Optimization (MICADO) was developed. The software also features a sophisticated mission analysis to assess the impact on fuel planning [8]. Aimed at the structural deformation of VCWs, Keidel et al. [9,10] proposed an innovative structural deformation technique to tackle the difficulties encountered in the flight control of flying-wing aircraft. The deformation of the trailing edge was proven through experiments by improving internal flexible components and electromechanical actuators.
Aerodynamic optimization design of variable camber airfoils (VCAs) has yielded substantial scientific outcomes. Typically, three optimization search algorithms are incorporated into aerodynamic optimization design methodologies: (1) gradient-based optimization transformation techniques, such as the Quasi-Newton method [11]; (2) non-gradient optimization algorithms, such as the genetic algorithm (GA) [12,13,14,15]; and (3) surrogate model optimization methods [16,17,18]. The gradient technique identifies the search direction of the objective function based on the gradient information of the design variables and iteratively calculates until the objective function converges to a minimum or maximum value. However, the derivative value is calculated repeatedly, necessitating the invocation of the objective function analysis program, resulting in computing complexity that correlates with the quantity of design variables. As the quantity of design variables increases, the computational complexity of the optimization design process intensifies swiftly. Based on the principles of survival of the fittest, as articulated in Darwin’s Theory of Evolution, GA can emulate the process of biological genetic evolution and conduct a global search inside the optimization landscape. It is difficult to fall into local optima during the search process. However, GA necessitates a substantial quantity of objective function evaluations. The application of Euler or Navier–Stokes (NS) equations for the aerodynamic optimization of complicated forms with numerous design variables necessitates substantial processing resources, resulting in low computational efficiency.
The surrogate model is an approximate mathematical representation constructed by sampling the design space. It features low computational cost while maintaining a level of accuracy comparable to that of high-fidelity models, such as those based on the NS equations. Compared with CFD evaluations, surrogate modeling greatly improves the efficiency of aerodynamic optimization and facilitates global optimization searches. The most widely used surrogate models currently include the Polynomial Response Surface model, the Artificial Neural Network model, the Radial Basis Function model, and the Kriging surrogate model [19]. The Polynomial Response Surface model is suitable for linear or weakly nonlinear problems; however, its accuracy is limited in high-dimensional or strongly nonlinear cases. Although the Artificial Neural Network model offers strong fitting capability, it involves complex training. The Radial Basis Function model provides high interpolation accuracy, but it is sensitive to parameters and requires huge amounts of resources. In contrast, the Kriging model combines prediction accuracy with error estimation, making it the choice for this study due to fewer samples and high-precision modeling. The integration of the Kriging surrogate model with optimization methods has been extensively researched in the field of aircraft design, particularly concerning wings [20]. Rajagopal et al. [21] examined the multi-objective design optimization of low-speed, long-endurance UAV wings. They utilized the Kriging surrogate model to substitute high-fidelity analysis tools, hence decreasing computational time, and addressed the optimization problem employing the Non-dominated Sorting Genetic Algorithm II (NSGA-II). The findings disclosed several advantageous Pareto-optimal design methods that can inform the initial design of UAV wings. Qiu et al. [22] proposed a novel approach for optimizing supersonic airfoils by integrating orthogonal decomposition with data dimensionality reduction to develop a Kriging surrogate model. The results showed that this method reduced the number of design variables by 50% and enhanced optimization efficiency by 200%. Zhao et al. [23] tackled the multi-objective optimization problem in UAV flying wing control surface design by proposing a multi-objective control allocation method based on the Kriging surrogate model. This approach effectively solved the control allocation issue for UAVs’ continuously deformable trailing edges. Zhao et al. [24] subsequently used the Kriging surrogate model with NSGA-II for aerodynamic optimization. The optimization results of the RAE2822 airfoil at low Reynolds numbers in transonic and subsonic regimes were compared, and the mechanisms underlying the airfoil’s lift generation were analyzed. Ju et al. [25] proposed an optimization technique that integrates the particle swarm optimization algorithm with a Kriging surrogate model for the design of high-lift devices. The method was employed to optimize the parameters of flap configuration position, resulting in identification of the ideal flap deflection position with merely a 1% reduction in the lift-to-drag ratio. To enhance the computational efficiency of aerodynamic shape optimization, Raul et al. [26] proposed a least-squares programming technique utilizing the Kriging surrogate model. This method assisted in alleviating the dynamic stall characteristics of the airfoil. However, there are comparatively few research advancements in the optimal design of VCWs utilizing the Kriging surrogate model. Weaver-Rosen et al. [27] presented a parameter optimization method for the continuous variable camber design of lightweight aircraft wings. They applied the Kriging surrogate model to the output of a genetic algorithm to obtain the optimal solution. The results indicated that the parameter optimization strategy was applicable under diverse operating situations. Wang et al. [28] presented a deformation method that combines piezoelectric actuation with flexible dynamic shape control, based on the Kriging surrogate model and using only 150 sampling points. This approach provided an efficient solution for the swift optimization of flexible trailing-edge VCWs. Du et al. [29] investigated a variable camber airfoil design by integrating the X-foil application with a Kriging surrogate model to elucidate the correlation between driving variables and the aerodynamic characteristics of the airfoil, as summarized in Table 1.

Table 1.
Literature review on Kriging surrogate model.
Although many researchers have studied the aerodynamic characteristics of VCWs, most of these studies have been based on the trailing edge. There are few studies on the influence of leading-edge camber on the aerodynamic characteristics of wings. The Kriging surrogate model is primarily utilized for single-objective optimization and is infrequently employed in multi-objective optimization design of VCAs with LATEs. Consequently, it is essential to establish a Kriging prediction model for the multi-objective optimization of VCAs utilizing LATEs. This work focuses on the supercritical RAE2822 airfoil as the research object. First, the aerodynamic performance of the airfoil is investigated by varying the camber of the LATE. A Kriging surrogate model is established with LATE deflection angles as input variables and the lift coefficient and drag coefficient as output variables. Utilizing NSGA-II multi-objective optimization, the maximum lift coefficient, and the lift-to-drag ratio as optimization objectives, the optimal airfoil configurations for Mach numbers 0.74 and 0.76 are obtained. The discrepancy between the predicted optimization model and the traditional CFD optimization model is within 2%. The reliability and the efficiency of the surrogate model are demonstrated.
2. Model and Solution Method
2.1. Numerical Simulation and Grid Independence Verification
In NASA’s optimization design study of VCCTEF, it was found that when the mid-curve of the LATE of the airfoil is curved like a parabolic trajectory, it can better improve the aerodynamic performance and pressure distribution during cruising [6]. The VCW discussed in this paper is a flexible LATE with a continuous, smooth morphing wing without any gaps or sliding joints. A supercritical airfoil is a special airfoil engineered to elevate the critical Mach number, which can delay the phenomenon of a significant drag increase when the wing approaches the speed of sound. It has been widely used in military transport aircraft and civil aircraft. Based on this method, this work takes the supercritical RAE2822 airfoil as the research object, with the deflection centers for variable camber located at 30% of the chord length on both the leading and trailing edges. The deformable portion of the leading edge spans 7.5% to 25% of the chord length, whereas the deformable portion of the trailing edge extends from 60% to 80% of the chord length. The deformation curve is smoothly transitioned by B-spline interpolation. Figure 1 shows the schematic representation of the LATE camber variation for the transonic airfoil. The leading-edge deflection angle is denoted as η, and the trailing-edge deflection angle is denoted as δ, where upward deflection is indicated by the sign “-” and downward deflection by the sign “+”. A and B are deflection center.

Figure 1.
Schematic diagram of LATE camber variation.
To solve transonic viscous flows, we utilize commercial software ICEM and ANSYS FLUENT 2022R1 version for aerodynamic simulation, employing the two-dimensional steady-state compressible RANS equations, with numerical solutions obtained via the finite volume approach. Spatial discretization is performed using a second-order upwind scheme. The chosen turbulence model is the Spalart–Allmaras (S-A) one-equation model, which is suitable for simulating the interaction between surface shock waves and boundary layers. Figure 2 shows the computational domain and boundary conditions: a pressure far-field boundary is applied at the inlet, and a pressure outlet boundary is applied at the outlet. The reference chord length of the airfoil is 1000 mm, and the distance from the airfoil to the far-field boundary is established at 20 times the reference chord length. Based on the modified inflow parameters from the EUROVAL project for Test Case 9 [30], we use Ma = 0.73, α = 2.54°, and Re = 6.5 × 10⁶. The grid adopts a C-type structured mesh, which has been densified on the airfoil surface for LATE.
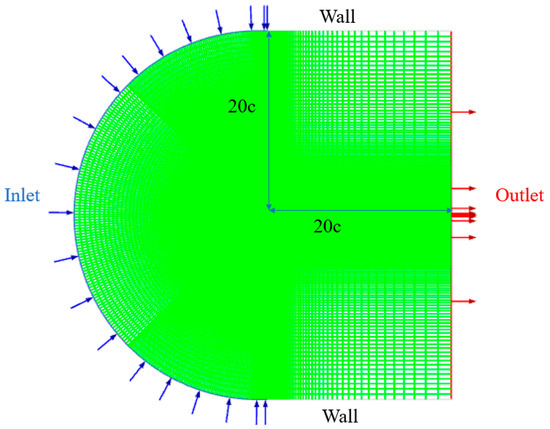
Figure 2.
Computational domain and boundary conditions.
Figure 3 illustrates the pressure coefficient curves of the RAE2822 airfoil. Mesh independence is investigated using 50,000, 100,000, 150,000, and 200,000 grids. It can be seen that the pressure coefficients closely approximate the experimental data [31]. However, 50,000 grids fail to distinctly depict the shock wave. 100,000, 150,000, and 200,000 grids align well with the experimental data. Table 2 presents a comparison between the aerodynamic coefficients obtained from different mesh sizes and the experimental results [31]. The differences in aerodynamic coefficients between the 150,000- and 200,000-cell meshes are less than 0.5%. Considering both computational accuracy and efficiency, the resolution of 150,000 grids is chosen for the simulation calculation. Figure 4 shows the near-wall mesh for the case with 150,000 grids, where the height of the first mesh layer is 1 × 10⁻⁶ m, and the wall-normal mesh spacing (y+) < 1.
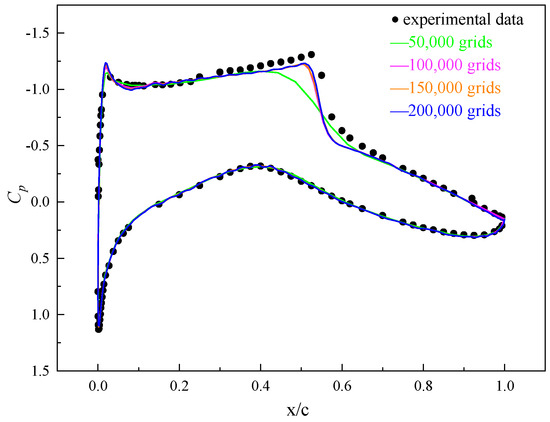
Figure 3.
Pressure coefficient curves of RAE2822 airfoil at Ma = 0.73.

Table 2.
Aerodynamic force coefficients with different mesh densities.
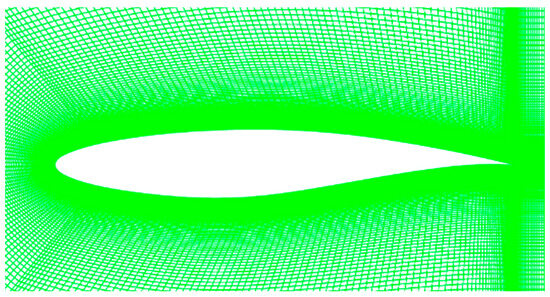
Figure 4.
Near-wall mesh model of RAE2822 airfoil.
2.2. Optimal Latin Hypercube Sampling Design
Latin Hypercube Sampling (LHS) design is a statistical experimental design method that divides the value range of each input variable into several sub intervals and ensures that each sub interval is evenly distributed in the sample space, thus obtaining sample points with good statistical properties. LHS can ensure sampling coverage in all dimensions and avoid sampling points being too concentrated in a certain dimension. However, the distribution of sampling points in multidimensional space may not be uniform enough, which may lead to clustering phenomena. Optimal Latin Hypercube Sampling (OLHS) is an improved version of the LHS technique, which can be used to efficiently generate sample points in a multidimensional parameter space for more comprehensive coverage of the parameter space [32]. The basic principle is to maximize the minimum distance between any two sample points through the optimization algorithm, which can prevent samples from clustering in certain areas and make the distribution of generated sample points more uniform, thereby improving the accuracy of the initial model. OLHS achieves comprehensive coverage of multi-dimensional parameter spaces, reduces sampling bias, and enhances the precision of the analysis results. Before constructing the Kriging surrogate model, it is necessary to sample the design space. Figure 5 compares LHS and OLHS sampling points. It is obvious from this figure that the sample points of OLHS exhibit a more uniform distribution.
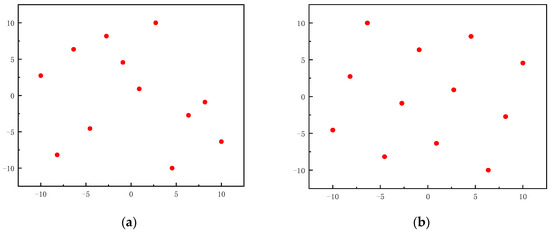
Figure 5.
Comparison of two sampling: (a) LHS design diagram; (b) OLHS design diagram.
2.3. Kriging Surrogate Model Construction
For a real function, the Kriging surrogate model can be written as:
where is an unknown function of and represents the global simulation of the design space, in which can be considered as a constant and replaced by ; is a Gaussian normal random function with a mean of 0 and a variance of , and denotes the deviation from the global simulation. So, expression (1) is estimated from the determined response values:
The covariance matrix of is as follows:
where is a diagonal symmetric correlation matrix, is a selectable correlation function, , , is the number of known response data points. The correlation function can be expressed as an isotropic Gaussian exponential function
where is a scalar coefficient, is the number of design variables, and the predicted estimate of the response value is given as
where is a column vector of length , which contains the response values corresponding to the sample data. When is a constant, is a unit column vector of length . is the correlation vector among the sample data of length .
In Equation (5), is estimated:
The estimated value of the variance is denoted as , which is given by and .
In Equation (4), the related parameter is given by the maximum likelihood estimation, which maximizes the following expression when > 0. and are functions of .
The root mean square error (RMSE) and the coefficient of determination (R2) are used to evaluate the predictive performance of the model in this paper.
The expression for RMSE is as follows:
where represents the true value at point , while is the predicted value by the surrogate model at point . is the number of sample points used for the surrogate model. The higher the prediction accuracy of the surrogate model, the smaller its value.
The expression for R2 is as follows:
where represents the average of the true outputs for all sample points. The higher the prediction accuracy of the surrogate model, the closer its value is to 1.
3. Analysis of VCA Aerodynamic Characteristics
3.1. Effect of Leading Edge Deflection on Airfoil Aerodynamic Performance
Figure 6 shows the effect of leading-edge deflection on the aerodynamic performance at Ma = 0.73, H = 6.5 km, and Re = 1.7 × 10⁷. As shown in Figure 6a, the lift coefficient (CL) of the airfoil first increases and then decreases with the increase in the angle of attack (AoA). Because of the stall AoA characteristics of the airfoil, the stall AoA of the supercritical airfoil is smaller at high speeds. When α < 4°, CL progressively increases with an upward deflection of the leading edge and progressively decreases with a downward deflection of the leading edge. When α > 4°, the deflection angle of the leading edge increases, resulting in a gradual acceleration of the descent speed of CL. The downward deviation of the leading edge increases the value of the critical AoA but inevitably causes lift loss. As shown in Figure 6b, the drag coefficient (CD) of the airfoil increases with the increase in the AoA, and the CD of the leading edge upward deflection is greater than that of the basic airfoil. According to Figure 6d, it can be seen that the shock wave appears earlier as the leading edge deflects upwards, resulting in greater shock drag and an increase in total drag. When α < 4°, the CD of the leading edge upward deflection is greater than that of the basic airfoil. When α > 4°, the CD of the leading edge upward deflection is smaller than that of the basic airfoil. Figure 6c illustrates that when α < 4°, a 1° upward deflection of the leading edge increases the lift-to-drag ratio (K) by 3.18% compared with the basic airfoil at α = 2°. When α > 4°, the K gradually diminishes with an upward deflection of the leading edge, while K increases with a downward deflection of the leading edge. Figure 6d shows pressure coefficient curves with α = 2°. When the leading edge deflects upwards, the shock wave position moves forward and the intensity increases, the suction peak force at the leading edge increases, and the positive pressure at various locations on the lower surface increases, resulting in an increase in the pressure difference between the upper and lower surfaces and an increase in lift. However, the shock wave approaches the leading edge, causing boundary layer separation and a rapid decrease in lift, as seen in Figure 6a. As the leading edge deflects downwards, the shock wave position on the upper surface moves backward and the intensity increases, the suction peak force at the leading edge decreases, and the positive pressure at various locations on the lower surface gradually decreases, resulting in a decrease in pressure difference between the upper and lower surfaces and a decrease in lift. It can be concluded that the downward deflection of the airfoil can improve the stall AoA characteristics to a certain extent.
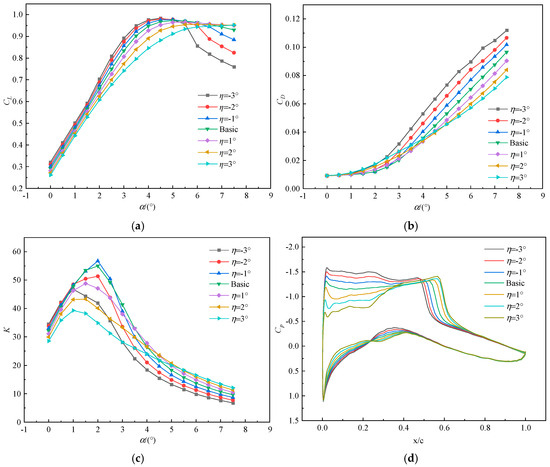
Figure 6.
Effect of leading-edge deflection on the aerodynamic performance of airfoils: (a) CL; (b) CD; (c) K; (d) Cp.
Figure 7 shows the pressure coefficient contours at α = 2° for various leading-edge deflection angles. As the leading edge deflects upwards, the negative pressure value on the upper wing surface gradually increases, and the negative pressure zone gradually expands toward the trailing edge, with an increase in area. The pressure difference between the upper and lower surfaces also increases, resulting in a rise in the CL. As the leading edge deflects downwards, the negative pressure zone in the front section of the upper wing gradually decreases and moves toward the trailing edge, resulting in a decrease in the pressure difference between the upper and lower surfaces and a decrease in the CL.
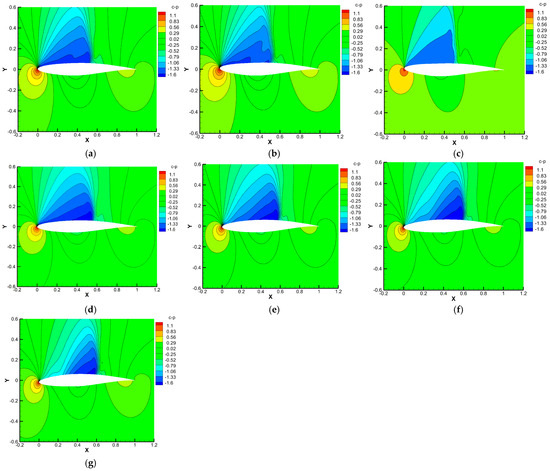
Figure 7.
Pressure coefficient contours of leading-edge deflection: (a) η = −1°; (b) η = −2°; (c) η = −3°; (d) η = 0°; (e) η = 1°; (f) η = 2°; (g) η = 3°.
Figure 8 illustrates the influence of leading-edge deflection on the aerodynamic performance across various Mach numbers with α = 2°. As shown in Figure 8a, an increase in the upper deflection angle corresponds to an increase in CL. The deflection angle diminishes, resulting in a decrease in CL. As shown in Figure 8b, when Ma < 0.75, CD remains essentially constant. At the drag divergence Mach number (Ma = 0.775), CD of the downward deflection is slightly larger than that of the upper deflection. When the incoming Mach number reaches the shock stall, the CD increases sharply. As shown in Figure 8c, as the upper deflection angle of the airfoil leading edge increases, K also increases, but an increase in the lower deflection angle of the airfoil leading edge results in a drop in K. As shown in Figure 8d, as the leading edge deflects upward, the critical Mach number (Macr) is initially delayed and then advanced. As the leading edge deflects downward, the Macr is incrementally advanced. As the deflection angle increases, the Macr is advanced earlier. An early Macr is unfavorable for the aircraft’s supersonic flight.
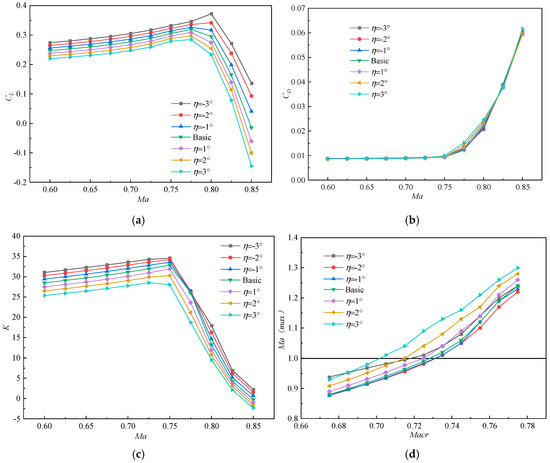
Figure 8.
Aerodynamic performance of leading-edge deflection: (a) CL; (b) CD; (c) K; (d) Macr.
3.2. The Effect of Trailing Edge Deflection on Airfoil Aerodynamic Performance
Figure 9 shows the effect of trailing edge deflection on the aerodynamic performance with Ma = 0.73, H = 6.5 km, and Re = 1.7 × 10⁷. As shown in Figure 9a, the CL of the airfoil first increases and then slowly decreases with the increase in the AoA. As the upward deflection of the trailing edge increases, CL gradually decreases. Conversely, as the downward deflection of the trailing edge increases, CL gradually increases. When there is a slight change in the camber of the trailing edge of a supercritical airfoil, that is , the CL of the trailing edge downward deviation is greater than that of the trailing edge upward deviation. The deflection of the trailing edge has a significant influence on the critical AOA. The downward deflection of the trailing edge increases the maximum lift coefficient CL, at α = 5°, a trailing edge downward deflection of 3° results in an 8.23% increase in CL compared with the basic airfoil. As shown in Figure 9b, the CD of the airfoil increases with the increase in the AoA. The CD with trailing-edge deflection downward is significantly more than that with deflection upward. When α < 4°, the increment of CD is small, while at α > 4°, the increment of the resistance coefficient is large. Figure 9c shows that when α increases, K initially increases and then decreases. When the trailing edge deflects from top to bottom, the maximum K increases, while the favorable AoA decreases. Figure 9d shows pressure coefficient curves with α = 2°. When the trailing edge deflects upwards, the shock wave position on the upper surface moves forward and is weakened, the suction peak force at the leading edge decreases, and the positive pressure at various locations on the lower surface decreases, resulting in a decrease in the pressure difference between the upper and lower surfaces and a decrease in lift. As the trailing edge deflection deflects downwards, the shock wave position on the upper surface moves backward, the suction peak force at the leading edge increases, and the positive pressure at various locations on the lower surface gradually increases, resulting in an increase in pressure difference between the upper and lower surfaces and an increase in lift.
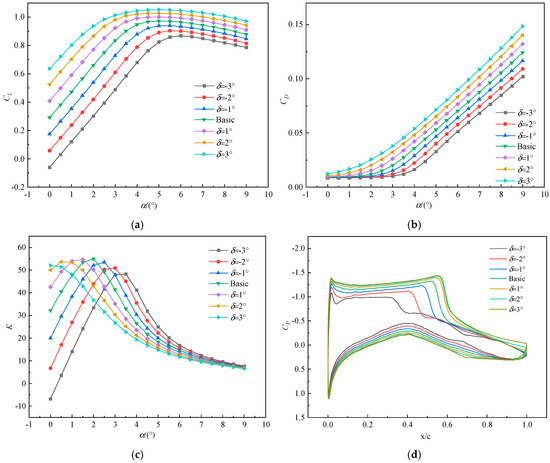
Figure 9.
Effect of trailing edge deflection on the aerodynamic performance of airfoils: (a) CL; (b) CD; (c) K; (d) CP.
Figure 10 shows the pressure coefficient contours at α = 2° for the trailing edge deflection. As the trailing edge deflects upwards, the negative pressure zone on the upper wing surface gradually decreases, the pressure difference between the upper and lower wing surfaces decreases, and the lift decreases. As the trailing edge deflects downwards, the negative pressure zone on the upper wing surface gradually expands and moves forward, and the positive pressure zone on the rear section of the lower wing surface gradually moves forward. The pressure difference between the upper and lower surfaces increases, and the lift increases.
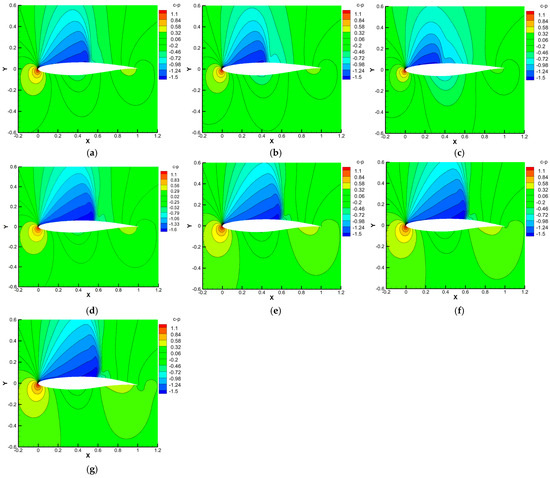
Figure 10.
Pressure coefficient contours of trailing edge deflection: (a) δ = −1°; (b) δ = −2°; (c) δ = −3°; (d) δ = 0°; (e) δ = 1°; (f) δ = 2°; (g) δ = 3°.
Figure 11 shows the influence of trailing-edge deflection on the aerodynamic performance at various Mach values with α = 2°. As shown in Figure 11a, when Ma < 0.825, the CL gradually decreases as the deflection angle of the trailing edge increases. However, when Ma > 0.825, the trend of lift coefficient change is completely opposite. As shown in Figure 11b, when Ma < 0.725, the CD remains nearly constant. When Ma > 0.725, the CD is modestly increased from upward to downward deviation of the trailing edge. It is seen from Figure 11c that the K value of the downward deviation of the trailing edge is greater than that of the upward deviation. When Ma < 0.725, the K increases as the downward deflection angle of the trailing edge increases. However, the K decreases as the upward deflection angle of the trailing edge increases. When Ma > 0.725, the K decreases as the downward deflection angle of the trailing edge increases and drops sharply. However, the K slightly increases as the upward deflection angle of the trailing edge increases. Figure 11d shows that as the upward deflection angle of the airfoil’s trailing edge increases, the Macr is initially delayed and then advanced. As the downward deflection angle of the trailing edge increases, the Macr is gradually advanced.
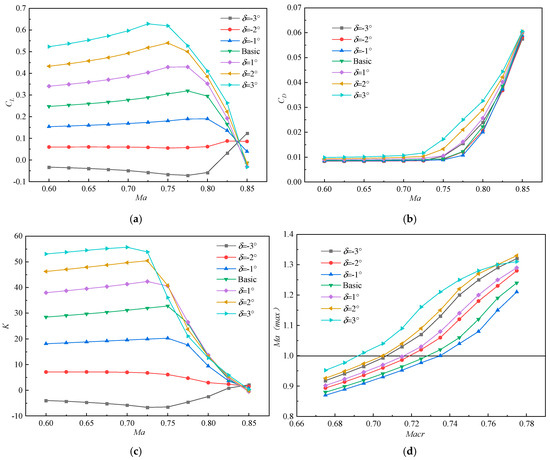
Figure 11.
Aerodynamic performance of trailing edge deflection: (a) CL; (b) CD; (c) K; (d) Macr.
4. Multi-Objective Airfoil Optimization Using Kriging Surrogate Model
From the aerodynamic analysis above, it can be concluded that Macr of the RAE2822 airfoil is 0.73 (Figure 11d), Re = 1.7 × 10⁷, α = 2°. To improve the aerodynamic characteristics of the airfoil beyond the critical Mach number, two distinct flight conditions at Ma = 0.74 and 0.76 will be chosen for multi-objective optimization. NSGA-II is a widely utilized multi-objective genetic algorithm that optimizes multiple objective functions concurrently via rapid non-dominated sorting and crowding distance computation. It generates a Pareto optimal solution set with good uniform distribution, making it easier to achieve diversity, uniformity, and robustness within the solution set [33]. The optimization process is illustrated in Figure 12.
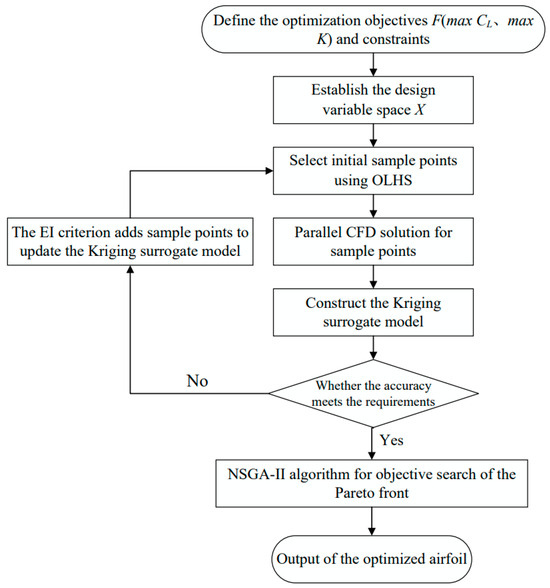
Figure 12.
Flowchart of multi-objective optimization for variable camber airfoils.
(1) Define the optimization objective functions F (max CL, max K) and design constraints and establish the design space X for the LATE deflections.
(2) Select initial sample points using the optimal Latin hypercube sampling technique and perform parallel CFD calculations to obtain the performance data.
(3) In the surrogate model construction process, the Expected Improvement (EI) criterion is used to guide the automatic dynamic addition of sample points, and EI < 10−3 serves as the convergence criterion to improve the accuracy of the Kriging surrogate model.
(4) Use the NSGA-II algorithm for optimization, generate a Pareto solution set and select the optimal solutions along the Pareto front as the final optimized airfoil configuration.
4.1. Interpolation Accuracy Verification for Kriging Surrogate Model
The OLHS is performed on the deflection angles of the LATE, where the sampling ranges for both angles are [−5°, 5°]. Based on the EI criterion, 30 sample points are collected under two different flight conditions to meet the accuracy requirements. The aerodynamic Kriging surrogate model is then fitted. The fitting accuracy is presented in Table 3, as indicated by Equations (10) and (11). The values of R2 for two Mach numbers are greater than 0.95, and the values of RMSE are less than 0.07, the results demonstrate that the surrogate model has remarkable reliability in handling complex aerodynamic data.

Table 3.
Accuracy of fitting for 30 sampling points.
Figure 13 and Figure 14 show the surrogate models for aerodynamic coefficients and the corresponding fitting validation plots for Ma = 0.74 and 0.76. CL and CD surrogate models are in good agreement with the aerodynamic analysis results (Figure 8 and Figure 11).
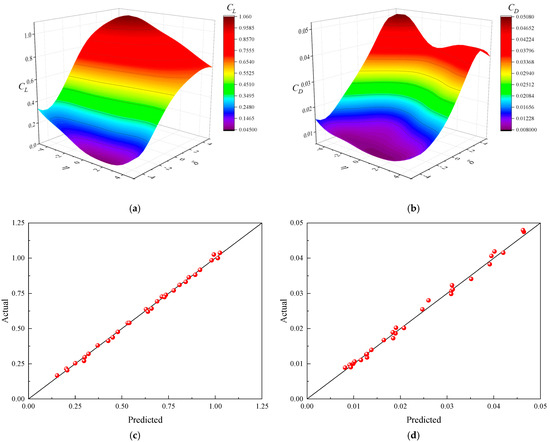
Figure 13.
Surrogate model of aerodynamic coefficients and fitting validation plot at Ma = 0.74: (a) CL surrogate model; (b) CD surrogate model; (c) CL fitting verification plot; (d) CD fitting verification plot.
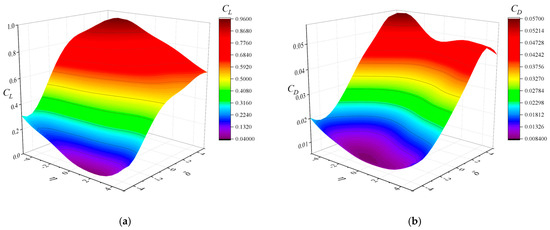
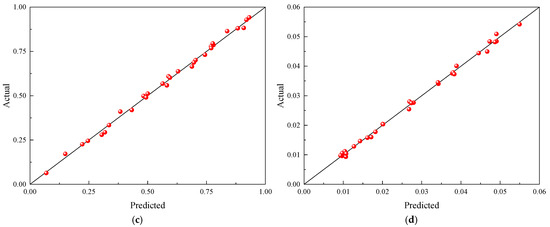
Figure 14.
Surrogate model of aerodynamic coefficients and fitting validation plot at Ma = 0.76: (a) CL surrogate model; (b) CD surrogate model; (c) CL fitting verification plot; (d) CD fitting verification plot.
The solid line in the fitting validation graphs denotes the locus where the true values coincide with the anticipated values. The closer the sample points are to this solid line, the smaller the prediction deviation, the more accurate the model. The percentage of high-confidence sample points exceeds 95% for Ma = 0.74 and 0.76.
4.2. Multi-Objective Optimization
The optimization processes at two Mach numbers emphasize maximizing the lift-to-drag ratio and the lift coefficient, utilizing a population size of 40 for the NSGA-II algorithm, with 200 evolutionary generations, a crossover probability of 0.9, and a mutation probability of 0.01. If the optimization is performed by sequential loop iterations, the numerical model may be called as many as 8000 times. The optimization process utilizing the Kriging surrogate model only requires 30 iterations of the numerical model, significantly reducing the computational burden.
The optimization model for Ma = 0.74 and 0.76 is as follows:
where represents the optimization objective of the lift coefficient and lift-to-drag ratio, denotes the design space, and represents the constraints: (1) the optimized airfoil area S1 is greater than and equal to the basic airfoil area S0 and (2) the aerodynamic coefficients of the optimized airfoil are greater than and equal to those of the basic airfoil. It can be seen from Figure 15 and Figure 16 that the most feasible solution is uniformly distributed across the constraint interval with high density, and both optimization objective values are improved.
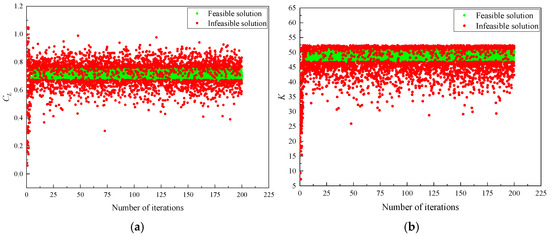
Figure 15.
Iteration process (Ma = 0.74): (a) CL; (b) K.
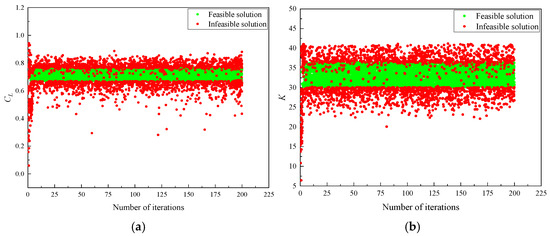
Figure 16.
Iteration process (Ma = 0.76): (a) CL; (b) K.
Figure 17 illustrates the optimized solutions at Ma = 0.74 and Ma = 0.76. The solutions include the Pareto front and the dominated solutions. Optimization solution 1 is closer to the lift-to-drag ratio, optimization solution 2 embodies a trade-off between the lift-to-drag ratio and the lift coefficient, and optimization solution 3 is closer to the lift coefficient. This study eventually selects the compromise represented by optimization solution 2. Table 4 and Table 5 demonstrate that the discrepancies between the approximate results of the Kriging surrogate model and the CFD simulation results are less than 2%, indicating the high reliability of the surrogate model.
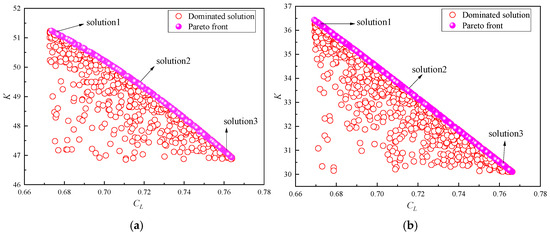
Figure 17.
Pareto front and optimized solutions: (a) Ma = 0.74; (b) Ma = 0.76.

Table 4.
Comparisons of Kriging and CFD results (Ma = 0.74).

Table 5.
Comparisons of Kriging and CFD results (Ma = 0.76).
The deflection angles of the LATE for the optimized airfoil at Ma = 0.74 and Ma = 0.76 are and , and and , respectively. The optimization results are shown in Table 6. CL increased by 7.55% and 7.37%, and K increased by 6.97% and 10.27%, respectively. The results achieve the desired multi-objective aerodynamic performance optimization.

Table 6.
Optimization results.
The pressure coefficient contours of the basic and optimized airfoils are shown in Figure 18. As shown in the figure, the lift of the wing mainly depends on the suction effect generated by the strong negative pressure zone in front of the upper wing, rather than the positive pressure on the lower surface. From Figure 18b,d, it can be seen that the negative pressure effect becomes stronger as the incoming Mach number increases. Compared with the basic airfoils, two negative pressure peaks appear on the upper surface of optimized airfoils, indicating an increase in lift. Both the basic and optimized airfoils exhibit significant shock wave phenomena on their upper surfaces, indicating a typical supersonic flight state. The optimized airfoil has significantly expanded the negative pressure zone in the leading-edge region of the upper surface and moved forward. It is obvious that the suction center shows a trend of moving forward compared to the basic airfoil. It indicates that the optimized design achieves local flow control through the deflections of the LATE, accelerating the airflow earlier and obtaining stronger suction effects, thereby effectively enhancing the lift performance of the wing.
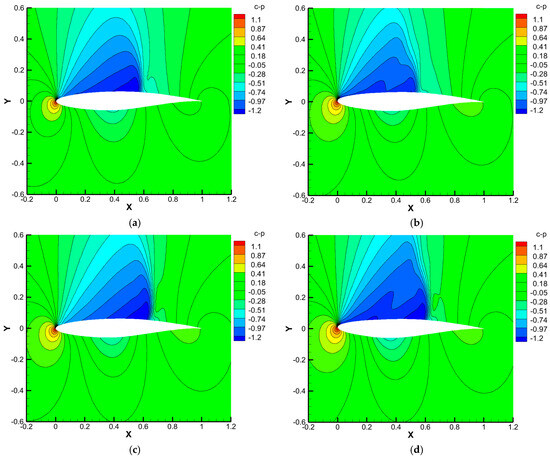
Figure 18.
Pressure coefficient contours: (a) basic airfoil (Ma = 0.74); (b) optimized airfoil (Ma = 0.74); (c) basic airfoil (Ma = 0.76); (d) optimized airfoil (Ma = 0.76).
The pressure coefficient curves of the basic airfoil and the optimized airfoil are shown in Figure 19. It can be seen that the suction peak of the optimized airfoil in the leading-edge region has significantly increased, indicating that the airflow acceleration at this location is stronger, while the shock wave position moves forward and the intensity is slightly weakened. This indicates that the adverse effects of shock wave interference on the boundary layer are reduced, thereby contributing to a decrease in overall drag levels. However, the weakening of shock waves can also change the boundary layer state on the wing surface, making it easier for the airflow to separate, subsequently resulting in a decrease in lift coefficient.
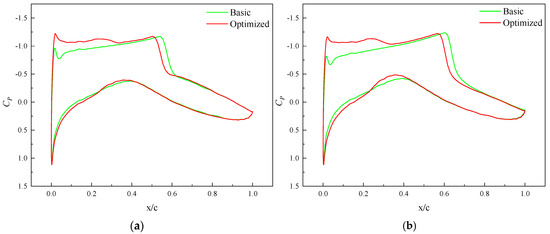
Figure 19.
Pressure coefficient curves: (a) Ma = 0.74; (b) Ma = 0.76.
5. Conclusions
Aiming at the supercritical RAE2822 airfoil, the aerodynamic effects of variable camber for the LATE are investigated. A multi-objective optimization strategy is established based on the Kriging surrogate model and NSGA II, and the following conclusions are achieved:
(1) The upward deflection of the leading edge marginally increases the lift-to-drag ratio, whilst the downward deflection of the leading edge improves the value of the critical angle of attack and the stall characteristics of the airfoil. The trailing-edge deflection has a significant influence on the critical angle of attack, while the downward deflection of the trailing edge increases the lift coefficient. Moderate upward deflection of both LATEs can delay the critical Mach number, while downward deflection of the LATE results in a reduction in the critical Mach number, which adversely affects the aerodynamic performance.
(2) Aerodynamic coefficient Kriging surrogate models are established for Ma = 0.74 and 0.76. The prediction deviations of the aerodynamic coefficients are fitted and investigated, and the R2 of the surrogate models is more than 0.95, while the RMSE is less than 0.1. The results of the Kriging surrogate model and CFD simulation are within 2%, satisfying the accuracy requirements.
(3) The results show that the optimized airfoil lift increased by 7.55% and 7.37%, respectively, and the lift-to-drag ratio increased by 6.97% and 10.27%, respectively. The feasibility and reliability are demonstrated. The method proposed in this paper reduces the computational cost of numerical simulation.
(4) In this paper, a predictive optimization method that combines the Kriging surrogate model with NSGA-II optimization is proposed. Theoretically, the lift and the lift-to-drag are improved to some extent. When optimizing solely based on given objectives, there is a risk of rapid separation of the boundary layer due to the forward movement of shock waves on the upper wing surface. Subsequently, we further investigate the optimization algorithm and expand the selection of variable curvature airfoils and study the impact of parameters such as camber position and camber radius on wing aerodynamics. In addition, wind tunnel tests will be conducted to verify the accuracy of the theoretical model.
Author Contributions
W.W., writing—review and editing, funding acquisition, project administration; H.F., writing—original draft, methodology; S.C., editing, validation, software; Z.L., formal analysis, investigation. All authors have read and agreed to the published version of the manuscript.
Funding
This research is supported by the Liaoning Provincial Natural Science Fund (2023-MS-243), the Aviation Scientific Fund, China (2020Z006054002), and the Liaoning Provincial Department of Education Fund (20240109).
Institutional Review Board Statement
Not applicable.
Informed Consent Statement
Not applicable.
Data Availability Statement
The study did not report any other data, and all data are included in this paper.
Acknowledgments
The authors would like to express their heartfelt thanks for the financial support of the Liaoning Provincial Natural Science Fund (2023-MS-243), the Aviation Scientific Fund, China (2020Z006054002), and the Liaoning Provincial Department of Education Fund (20240109) for this work.
Conflicts of Interest
The authors have no conflicts of interest to declare.
Nomenclature
| Symbols | |
| Ma | Mach number |
| α | Angle of Attack |
| Re | Reynolds number |
| CL | Lift Coefficient |
| CD | Drag Coefficient |
| CM | Pitching Moment Coefficient |
| Cp | Pressure Coefficient |
| K | Lift-to-Drag Ratio |
| x | X-axis Variable |
| f(x) | Unknown Function of x |
| Z(x) | Gaussian Normal Random Function |
| δ | An Unknown Constant |
| σ2 | Variance |
| R | Correlation Matrix |
| R | Correlation Function |
| cov | Covariance |
| ns | Number of Known Response Data |
| i and j | Index of Data Points at Different Spatial Positions |
| exp | Exponential Function |
| θ | Scalar Coefficient |
| nv | Number of Design Variables |
| y(x) | Response Value |
| Predicted Estimate | |
| y | Column Vector |
| f | Unit Column Vector |
| Variance Estimate | |
| Estimate of an Unknown Constant | |
| True Value at Point xi | |
| Predicted Value at Point xi | |
| Number of Sample Points in the Surrogate Model | |
| Mean of the True Outputs of All Sample Points in the Surrogate Model | |
| Critical Mach number |
Abbreviations
| CFD | Computational fluid dynamics |
| VCW | Variable camber wings |
| VCA | variable camber airfoils |
| GA | genetic algorithm |
| NS | Navier-Stokes |
| LATE | leading and trailing edges |
| VCFW | Variable Camber Flexible Wings |
| VCCTEF | Variable Camber Continuous Trailing Edge Flap |
| RMSE | Root Mean Square Error |
| R2 | Coefficient of Determination |
| NSGA-II | Non-dominated Sorting Genetic Algorithm II |
| SA | Spalart–Allmaras |
| EUROVAL | A European Initiative on Validation of CFD Codes |
| LHS | Latin Hypercube Sampling |
| OLHS | Optimal Latin Hypercube Sampling |
| AoA | Angle of Attack |
References
- Jentys, M.; Breitsamter, C. Aerodynamic Drag Reduction Through a Hybrid Laminar Flow Control and Variable Camber Coupled Wing. Aerosp. Sci. Technol. 2023, 142, 108652. [Google Scholar] [CrossRef]
- Smith, M.S.; Sandwich, C.; Alley, N.R. Aerodynamic Analyses in Support of the Spanwise Adaptive Wing Project; Report Number: AFRC-E-DAA-TN57436); U.S. Armstrong Flight Research Center: Edwards, CA, USA, 2018. [Google Scholar]
- Lebofsky, S.; Ting, E.; Nguyen, N.T.; Trinh, K.V. Aeroelastic Modeling and Drag Optimization of Flexible Wing Aircraft with Variable Camber Continuous Trailing Edge Flap. In Proceedings of the 32nd AIAA Applied Aerodynamics Conference, Atlanta, GA, USA, 16–20 June 2014. [Google Scholar] [CrossRef]
- Livne, E.; Precup, N.; Mor, M. Design, Construction, and Tests of an Aeroelastic Wind Tunnel Model of a Variable Camber Continuous Trailing Edge Flap (VCCTEF) Concept Wing. In Proceedings of the 32nd AIAA Applied Aerodynamics Conference, Atlanta, GA, USA, 16–20 June 2014. [Google Scholar] [CrossRef]
- Kaul, U.K.; Nguyen, N.T. Drag Characterization Study of Variable Camber Continuous Trailing Edge Flap. J. Fluids Eng. 2018, 140, 101108. [Google Scholar] [CrossRef]
- Kaul, U.K.; Nguyen, N.T. Drag Optimization Study of Variable Camber Continuous Trailing Edge Flap (VCCTEF) using OVERFLOW. In Proceedings of the 32nd AIAA Applied Aerodynamics Conference, Atlanta, GA, USA, 16–20 June 2014. [Google Scholar] [CrossRef]
- Ting, E.; Chaparro, D.; Nguyen, N.; Fujiwara, G.E. Optimization of Variable-Camber Continuous Trailing-Edge Flap Configuration for Drag Reduction. J. Aircr. 2018, 55, 2217–2239. [Google Scholar] [CrossRef]
- Peter, F.N.; Risse, K.; Schueltke, F.; Stumpf, E. Variable Camber Impact on Aircraft Mission Planning. In Proceedings of the 53rd AIAA Aerospace Sciences Meeting, Kissimmee, FL, USA, 5–9 January 2015. [Google Scholar] [CrossRef]
- Keidel, D.; Molinari, G.; Ermanni, P. Aero-Structural Optimization and Analysis of a Camber-Morphing flying Wing: Structural and Wind Tunnel Testing. J. Intell. Mater. Syst. Struct. 2019, 30, 908–923. [Google Scholar] [CrossRef]
- Keidel, D.; Fasel, U.; Ermanni, P. Control Authority of a Camber Morphing Flying Wing. J. Aircr. 2020, 57, 603–614. [Google Scholar] [CrossRef]
- Fakhari, S.M.; Mrad, H. Aerodynamic Shape Optimization of NACA Airfoils Based on a Novel Unconstrained Conjugate Gradient Algorithm. J. Eng. Res. 2024, 7, 1–10. [Google Scholar] [CrossRef]
- Bao, N.; Peng, Y.; Feng, H.; Yang, C. Multi-Objective Aerodynamic Optimization Design of Variable Camber Leading and Trailing Edge of Airfoil. Proc. Inst. Mech. Eng. Part C J. Mech. Eng. Sci. 2022, 236, 4748–4765. [Google Scholar] [CrossRef]
- Niu, W.; Zhang, Y.; Chen, H.; Zhang, M. Numerical Study of a Supercritical Airfoil/Wing with Variable-Camber Technology. Chin. J. Aeronaut. 2020, 33, 1850–1866. [Google Scholar] [CrossRef]
- Zhao, A.; Hui, Z.; Jin, H.; Wen, D. Analysis on the Aerodynamic Characteristics of a Continuous Whole Variable Camber Airfoil. In Proceedings of the 2018 the 9th Asia Conference on Mechanical and Aerospace Engineering, Chicago, IL, USA, 12–16 October 2025. [Google Scholar] [CrossRef]
- Takahashi, H.; Yokozeki, T.; Hirano, Y. Development of Variable Camber Wing with Morphing Leading and Trailing Sections Using Corrugated Structures. J. Intell. Mater. Syst. Struct. 2016, 27, 2827–2836. [Google Scholar] [CrossRef]
- Aleisa, H.; Kontis, K.; Pirlepeli, B.; Nikbay, M. Conceptual Design of a Nonconstant Swept Flying Wing Unmanned Combat Aerial Vehicle. J. Aircr. 2023, 60, 1872–1888. [Google Scholar] [CrossRef]
- Jesus, T.; Sohst, M.; Vale, J.L.D.; Suleman, A. Surrogate Based MDO of a Canard Configuration Aircraft. Struct. Multidiscip. Optim. 2021, 64, 3747–3771. [Google Scholar] [CrossRef]
- Wauters, J. Design Optimization-Under-Uncertainty of a Forward Swept Wing Unmanned Aerial Vehicle Using SAMURAI. Int. J. Micro Air Veh. 2022, 14, 17568–17578. [Google Scholar] [CrossRef]
- Kleijnen, J.P.C. Kriging metamodeling in simulation: A review. Eur. J. Oper. Res. 2009, 192, 707–716. [Google Scholar] [CrossRef]
- Liu, B.; Hua, L.; Hua, H.Z.; Guang, Y. Surrogate-based aerodynamic shape optimization of a sliding shear variable sweep wing over a wide Mach-number range with plasma constraint relaxation. Struct. Multidiscip. Optim. 2023, 66, 43. [Google Scholar] [CrossRef]
- Rajagopal, S.; Ganguli, R. Multidisciplinary Design Optimization of Long Endurance Unmanned Aerial Vehicle Wing. Comput. Model. Eng. Sci. 2011, 81, 1–34. [Google Scholar]
- Yasong, Q.I.U.; Junqiang, B.A.I.; Nan, L.I.U.; Chen, W.A.N.G. Global Aerodynamic Design Optimization Based on Data Dimensionality Reduction. Chin. J. Aeronaut. 2018, 31, 643–659. [Google Scholar] [CrossRef]
- Zhao, X.; Yang, Y.; Ma, X. Kriging Aerodynamic Modeling and Multi-Objective Control Allocation for Flying Wing UAVs with Morphing Trailing-Edge. IEEE Access 2021, 9, 62394–62404. [Google Scholar] [CrossRef]
- Zhao, Y.; Liu, J.; Li, D.; Liu, C.; Fu, X.; Wang, H. Aerodynamic Performance Optimization of a UAV’s Airfoil at Low-Reynolds Number and Transonic Flow Under the Martian Carbon Dioxide Atmosphere. Acta Astronaut. 2024, 223, 512–524. [Google Scholar] [CrossRef]
- Ju, S.; Sun, Z.; Guo, D.; Yang, G.; Wang, Y.; Yan, C. Aerodynamic-Aeroacoustic Optimization of a Base Wing and Flap Configuration. Appl. Sci. 2022, 12, 1063. [Google Scholar] [CrossRef]
- Raul, V.; Leifsson, L. Surrogate-Based Aerodynamic Shape Optimization for Delaying Airfoil Dynamic Stall Using Kriging Regression and Infill Criteria. Aerosp. Sci. Technol. 2021, 111, 106555. [Google Scholar] [CrossRef]
- Weaver-Rosen, J.M.; Leal, P.B.; Hartl, D.J.; Malak, R.J., Jr. Parametric Optimization for Morphing Structures Design: Application to Morphing Wings Adapting to Changing Flight Conditions. Struct. Multidiscipl. Optim. 2020, 62, 2995–3007. [Google Scholar] [CrossRef]
- Wang, X.; Hu, X.; Xing, J.; Zhou, W. Theoretical and Experimental Investigations on a Data-Driven Trajectory Planning Scheme for Dynamic Shape Control of Piezo-Actuated Compliant Morphing Structures. Eng. Struct. 2024, 316, 118608–118624. [Google Scholar] [CrossRef]
- Du, C.; Zhao, D. Sensitivity Analysis of Airfoil Deformation for Aerial-Aquatic Navigation. Engineering 2024, 8, 1–16. [Google Scholar] [CrossRef]
- Haase, W.; Brandsma, F.; Elsholz, E.; Leschziner, M.; Schwamborn, D. EUROVAL—An European Initiative on Validation of CFD Codes: Results of the EC/BRITE-EURAM Project EUROVAL, 1990–1992, 1st ed.; Springer: Berlin, Germany, 2013; pp. 77–96. [Google Scholar]
- Schmitt, V.; Charpin, F. Experimental Data Base for Computer Program Assessment (AGARD Advisory Report No. 138); North Atlantic Treaty Organization: Washington, DC, USA, 1979. [Google Scholar]
- Pholdee, N.; Bureerat, S. An Efficient Optimum Latin Hypercube Sampling Technique Based on Sequencing Optimisation Using Simulated Annealing. Int. J. Syst. Sci. 2015, 46, 1780–1789. [Google Scholar] [CrossRef]
- Zhang, J.; Liu, H. Multi-objective Optimization of Aerodynamic and Erosion Resistance Performances of a High-Pressure Turbine. Energy 2023, 277, 127731. [Google Scholar] [CrossRef]
Disclaimer/Publisher’s Note: The statements, opinions and data contained in all publications are solely those of the individual author(s) and contributor(s) and not of MDPI and/or the editor(s). MDPI and/or the editor(s) disclaim responsibility for any injury to people or property resulting from any ideas, methods, instructions or products referred to in the content. |
© 2025 by the authors. Licensee MDPI, Basel, Switzerland. This article is an open access article distributed under the terms and conditions of the Creative Commons Attribution (CC BY) license (https://creativecommons.org/licenses/by/4.0/).