Article

Geometric Optimization of Coanda Jet Chamber Fins via Response Surface Methodology

1
School of Energy and Environmental Engineering, University of Science and Technology Beijing, Beijing 100083, China
2
Shunde Graduate School, University of Science and Technology Beijing, Shunde 528399, China
*
Author to whom correspondence should be addressed.
Aerospace 2025, 12(7), 571; https://doi.org/10.3390/aerospace12070571
Submission received: 1 May 2025 / Revised: 8 June 2025 / Accepted: 18 June 2025 / Published: 23 June 2025

Abstract

A highly loaded axial flow compressor often leads to significant flow separation, resulting in increased pressure loss and deterioration of the pressure increase ability. Improving flow separation within a compressor is crucial for enhancing aeroengine performance. This study proposes adding a fin structure to the jet cavity of the Coanda jet cascade to improve flow separation at the trailing edge and corner area. The fin structure is optimized using response surface technique and a multi-objective genetic algorithm based on numerical simulation, enabling more effective control of the simultaneous separation of the boundary corner and trailing edge of the layer. The response surface model developed in this study is accurately validated. The numerical results demonstrate a 2.13% reduction in the optimized blade total pressure loss coefficient and a 12.74% reduction in the endwall loss coefficient compared to those of the original unfinned construction under the same air injection conditions. The optimization procedure markedly improves flow separation in the compressor, leading to a considerable decrease in the volume of low-energy fluid on the blade’s suction surface, particularly in the corner area. The aerodynamic performance of the high-load cascade is enhanced.

1. Introduction

The primary objective of current high-performance aeroengine research is to enhance the thrust–weight ratio, which requires a higher load on both the stator and the rotor, as well as a larger turning angle of airflow in the compressor [1,2]. However, this trend may lead to deteriorated flow conditions, resulting in higher total pressure losses and reduced diffusion ability. Therefore, finding efficient methods to suppress flow separation in compressor cascades is of utmost importance due to the significant flow loss and disruption caused by trailing edge separation and corner separation, which are among the most prominent causes of these issues. Extensive research has been conducted to increase the compressor load, demonstrating the successful approach of controlling external flow [3,4,5] or modifying and optimizing blade shape [6,7,8].
Researchers have successfully applied the Coanda effect to rotating machinery, building upon its previous application in outflow loop control of wings [9,10]. Previous experimental studies have indicated that incorporating a Coanda jet into a compressor effectively prevents compressor stalling [11,12,13]. Numerical simulations were also conducted to assess the effect of the total jet pressure and turbine blade nozzle height on the aerodynamic performance of the cascade. The findings reveal that when the voltage supply ratio falls within the appropriate range, the cyclic control cascade’s performance matches or even surpasses that of the original cascade. However, when the voltage supply ratio surpasses a specific threshold, the flow angle and expansion ratio at the cascade outlet increase even further, causing more energy loss than in the initial cascade [14].
Moreover, researchers have investigated the influence of the Coanda surface curvature on the cascade’s aerodynamic performance to determine the optimal curvature for the Coanda surface. The results indicate that there is an optimal value for selecting the Coanda surface curvature, with a larger curvature yielding better results. When the curvature is low, the trailing edge of the Coanda surface experiences poor wall attachment. Conversely, when the curvature is significant, the trailing edge jet detaches from the wall prematurely, leading to an extensive separation region at the trailing edge of the suction surface [15].
Additionally, numerical simulations have been utilized to evaluate the suppressive effect of the Coanda jet approach on high-load compressor cascade separation, as well as the most effective Coanda blade profile modeling method. The effects of three primary geometric factors, along with the volume of air injection, on the cascade’s total pressure loss coefficient and static pressure increase coefficient are investigated. The findings indicated that modifying the ideal jet volume can decrease the total pressure loss coefficient by as much as 18.4% across different operating situations [16]. All of these investigations confirm the effectiveness of the Coanda jet approach in improving the flow state of the trailing edge of compressor cascades and mitigating flow loss.
However, in the traditional Coanda jet method, while the jet can reach the trailing edge and the upper end wall of the blade, it fails to reach the corner area of the lower end wall of the blade. As a result, the improvements in reducing separation in the lower end-wall corner area are not ideal, and there is a blank area in the jet cavity, potentially leading to a decrease in jet efficiency.
Determining the optimal fin shape is crucial for effectively controlling the flow separation of the Coanda jet, as the structure of the jet cavity strongly affects the flow field. With advancements in geometric parameterization technology and intelligent optimization algorithms, a computer-aided design (CAD)–computational fluid dynamics (CFD) joint optimization design technique based on multi-objective genetic algorithms has emerged [17]. The nondominated sorting genetic algorithm (NSGA) was first proposed in 1995 [18]. This algorithm is based on the dominance and nondomination hierarchy among individuals. The NSGA offers several advantages, including the ability to select any number of optimization objectives, uniformly distributed nondominated optimal solutions, and the presence of multiple equivalent alternative solutions. However, the NSGA also has several drawbacks, such as high computational complexity, lack of an elite strategy, and reliance on the sharing parameter “бshare.” Nevertheless, the NSGA has been frequently used in real-world problem solving [19,20]. In 2000, researchers proposed an enhanced algorithm called NSGA-II to address the shortcomings of the NSGA [21]. NSGA-II introduces an elitist method and eliminates the need for shared parameter sharing, thus preserving the benefits of NSGA-II while overcoming its drawbacks. The NSGA-II has achieved positive results while retaining the advantages of the NSGA. Several researchers have parameterized the centrifugal guiding vane profile of a pump via geometric design. Using the NSGA-II method, they optimized the guide vane, which had poor consistency with the conventional guide vane profile and was able to achieve a consistency of 0.89 [22]. Numerical studies have shown that the improved guide vane profile exhibits superior hydraulic performance compared to that of the prototype [23]. Additionally, optimization technologies have been added to the pneumatic design system of compressors. The NSGA-II algorithm of COPES has successfully improved the aerodynamic performance of CAD blades. The optimization objective is to minimize the boundary layer shape factor minus the boundary layer separation position, with the input parameters being the blade’s maximum thickness position and exit angle [24]. In certain experimental investigations, the optimization goal was set to minimize the overall cascade voltage loss coefficient, while the input parameter was the change in the blade profile’s vertical coordinate. After the optimization, the range of the low loss angle of attack was expanded, and the loss of the CAD blade profile at the design points was reduced [25]. Based on the aforementioned research progress, the CAD-CFD joint optimization design technique, which utilizes intelligent optimization algorithms, is both efficient and time-saving. Furthermore, this approach frees designers from the repetitive and arduous task of trial-and-error calculations. Consequently, this optimization design method will likely reach the forefront of mechanical optimization technology in the future. While this technique has been applied mainly to the design and development of geometry, such as blade geometry, in previous studies, it was infrequently employed in the jet cavity of a blade once the geometry was established. Nonetheless, the shape of the jet cavity significantly impacts the suppression of flow separation phenomena caused by air injection.
This research proposes a double-cavity construction in the Coanda cascade cavity with a fin. The flow separation of the trailing edge and the corner region can be cooperatively regulated by varying the rates and directions of the two jet flows. This work presents the development of a three-dimensional numerical model of the flow in a Coanda jet cascade with two jet cavities. The dependability of the model was confirmed using data from earlier research projects. A study is carried out to analyze how the main geometric features of the fin affect the flow field. A response surface model was developed using the Latin hypercube design method and RSM to analyze the relationships between key parameters. The input parameters included the coordinates of the geometrical control points of the fins, while the goal functions were the overall pressure loss coefficient and the end-wall loss coefficient. According to this assumption, the control points of the air jet cavity’s geometric structure are optimized utilizing the NSGA-II multi-objective genetic algorithm, targeting the minimization of both the overall pressure loss coefficient and the endwall loss coefficient as optimization targets. The improved simulation findings ultimately indicate an enhancement in the flow separation between the trailing edge and the corner region, leading to a decrease in the overall loss within the flow field.

2. Computational Methodology
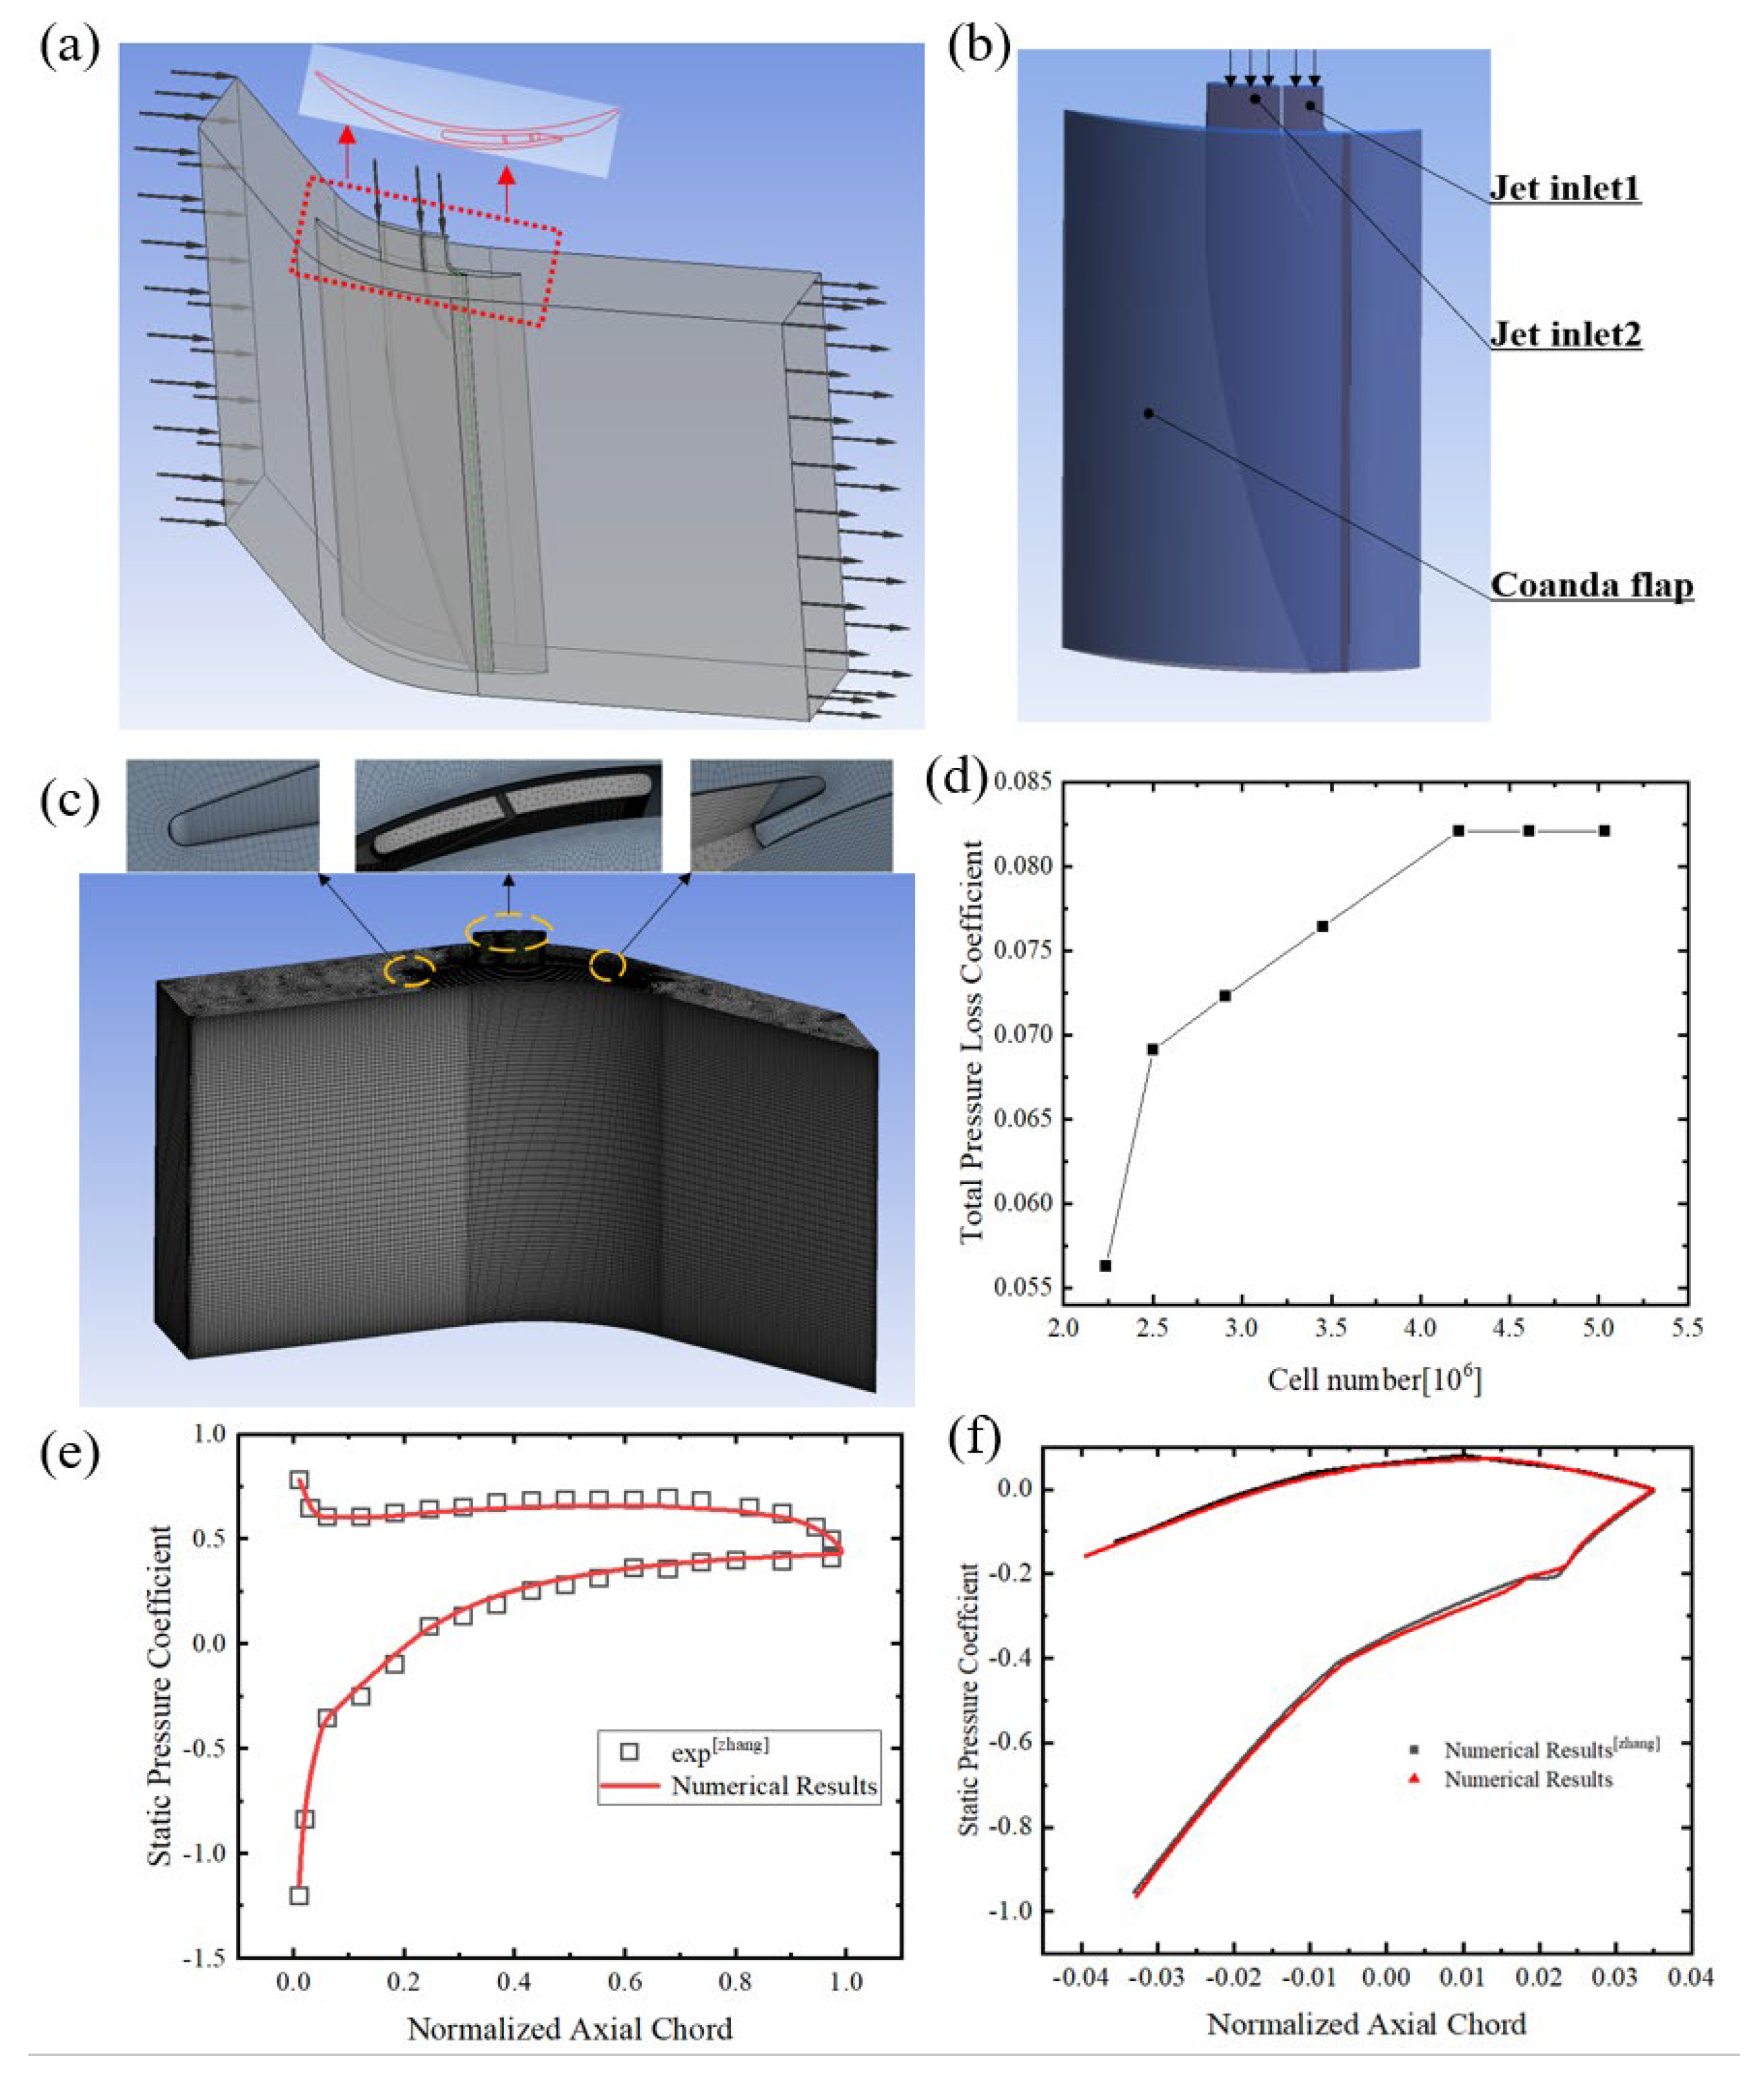
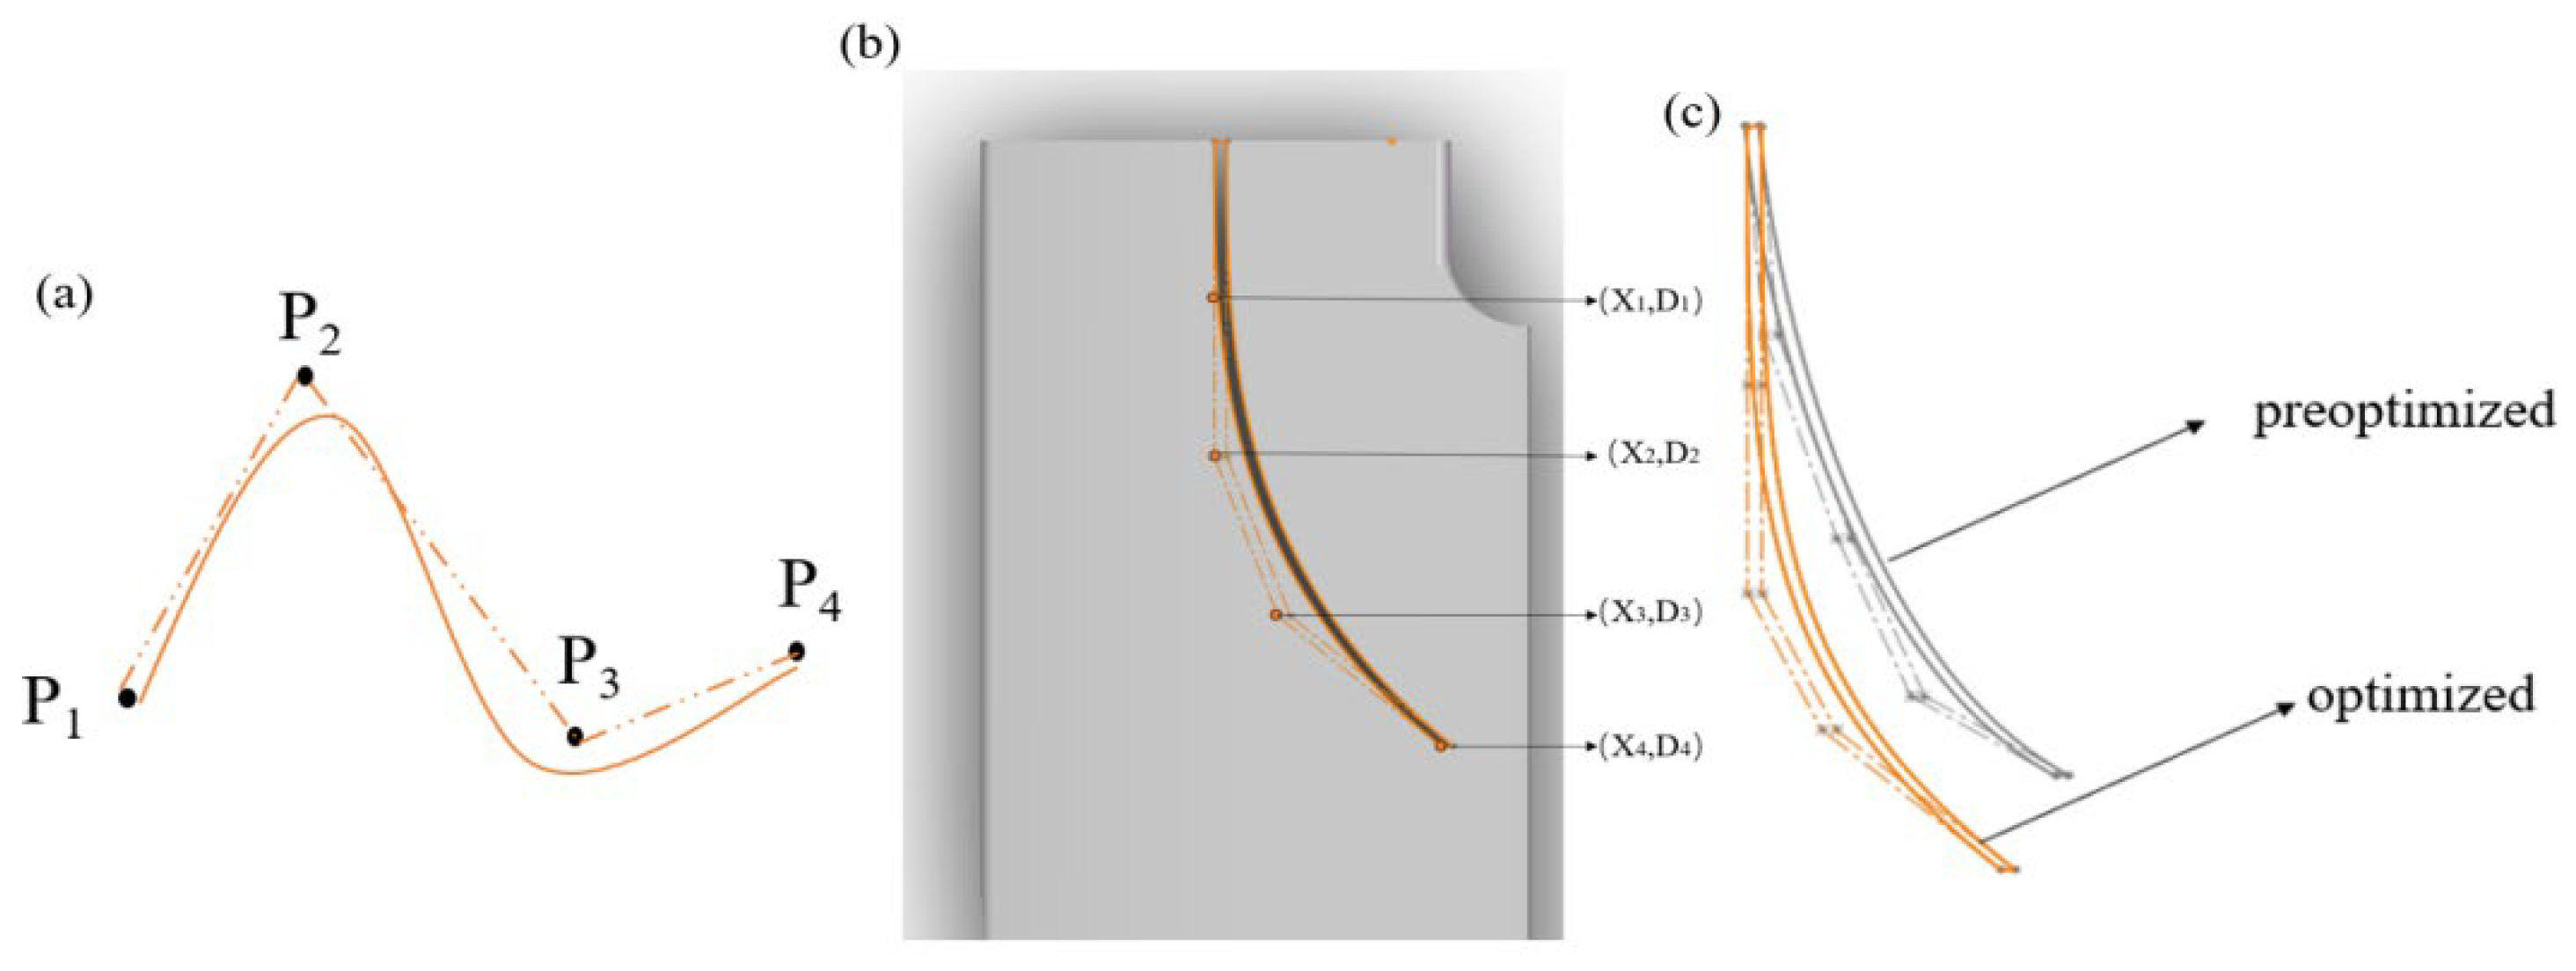
2.1. Geometry Model

The subject of the research is the Zierke & Deutsch airfoil using the Double-Circular-Arc profile. The compressor cascade experiences significant flow separation across the entire span at an incidence angle of 5°. Therefore, this heavily burdened compressor airfoil is an ideal match for the prototype. The major geometric properties of the blade profile are presented in Table 1. Figure 1a,b depict the three-dimensional geometric comparison between the Zierke & Deutsch airfoil and the Coanda jet flap. As shown in Figure 1a,b, this study presents the construction of a jet cavity with fins. The figure displays certain characteristics of the fins.

2.2. Numerical Model

Numerical simulations employing CFD methods are performed to assess the flow field and aerodynamic performance of the compressor cascade. They primarily address the compressible Navier–Stokes equations, which are articulated as follows:
ρ t + ρ U = 0
ρ U t + ρ U × U = P + τ
t ρ e + 1 2 U 2 + ρ e + 1 2 U 2 U = ρ U + σ v i s c U + κ T
σ v i s c = 2 3 μ U + μ U + U T
In this context, t denotes the time variable, ρ signifies the density of air, U represents the velocity, p indicates the static pressure, σ v i s c refers to the viscous stress tensor, e stands for internal energy, κ symbolizes thermal conductivity, and T defines static temperature. The air density is denoted by ρ , U represents the velocity, p signifies the static pressure, σ v i s c indicates the viscous stress tensor, e refers to the internal energy, κ symbolizes the thermal conductivity, and T stands for the static temperature.
The governing equations are addressed using the Reynolds-averaging approach, which incorporates the shear stress transport (SST-κ-ε) turbulence model and the correlation-based γ Re θ transition model. All simulations are conducted using the commercial flow solver ANSYS/CFX, with advection terms discretized via second-order upwind schemes and diffusion terms discretized using central difference schemes.
Figure 1c illustrates the computational domain and mesh, representing a single-blade passage to simulate the experimental compressor cascade through translationally periodic conditions. The computational domain is divided into two subdomains: the primary flow field and the injection flow field, interconnected via a fluid interface. Structured meshes are utilized in the primary flow domain, whereas unstructured meshes are applied in the jet flow domain. Supplementary grid information adjacent to the Coanda jet slot is illustrated in Figure 1c. The nondimensional wall distance y+ is kept below 1 to satisfy the turbulence model’s criteria. According to the findings of the grid dependence analysis depicted in Figure 1d, a meshing configuration comprising 4.53 × 10⁶ grid nodes is selected for the ensuing numerical simulations.

2.3. Model Verification

Figure 1e,f present the static pressure coefficient distributions obtained from both the experimental study [26] and the numerical simulation at an inlet incidence angle of 5°. Furthermore, a comparison is made between the numerical simulation in this study and the numerical simulation conducted in the literature [26]. The numerical method employed in this paper accurately captures the flow characteristics within the compressor passage while accounting for any errors in the experimental measurements.

3. Design Optimization

The geometric dimensions of the fin substantially influence the efficacy of jet flow enhancement. This paper integrates design and operational parameters for analysis and optimization, in contrast to prior studies that employed the control variable technique to evaluate the geometric structure of blade-flow performance independently. Consequently, we present an optimization technique that utilizes the design exploration tool within the commercial flow solver ANSYS/CFX. Figure 2 depicts the optimization procedure. We first establish the input parameters together with their corresponding value ranges and identify the objective functions. Subsequently, we employed Latin hypercube sampling (LHS) to formulate the experimental design (DOE). CFX is utilized to numerically compute the relevant objective functions in accordance with the restrictions of each variable. Response surface models are developed between the input parameters and objective functions with response surface methodology (RSM). Ultimately, the NSGA-II algorithm is employed to optimize the data acquired from the initial two phases.

3.1. Optimization Factors

In this study, the Bezier curve is used to parameterize the geometry of the fins. The Bezier curve has been proven to be highly reliable in geometric design. To better represent the finned structure, we parameterize the finned mechanism using a fourth-degree Bezier curve, with the coordinates of the B-spline control vertex chosen as the design variable. Figure 3 illustrates the finned geometry and associated control points. The value ranges of the four coordinate points are presented in Table 2.
The efficacy of a compressor cascade is predominantly determined by the total pressure loss coefficient and the endwall loss coefficient. In compressor optimization engineering, the primary focus is on the total pressure loss coefficient and the endwall loss coefficient. The loss coefficient is delineated in Equation (5).
ω = p t 1 p t 2 p t 1 p 1
where pt1 is the total pressure at the cascade inlet, pt2 is the local total pressure, and p1 is the static pressure at the cascade inlet.

3.2. Experimental Design

Design of experiments (DOE) is a mathematical technique for analyzing complex problems that involve multiple responses affected by main and interaction effects from various independent variables. DOE allows for efficient experimental arrangement and maximum assimilation of information from the results, providing reliable results for complex systems with reasonable time and resource expenditure. This study employed the LHS approach to establish the design space and acquire sampling points, yielding a total of 83 design points derived from boundary and center points. The numerical method utilized for these 83 examples aligns with the description provided in Section 2.

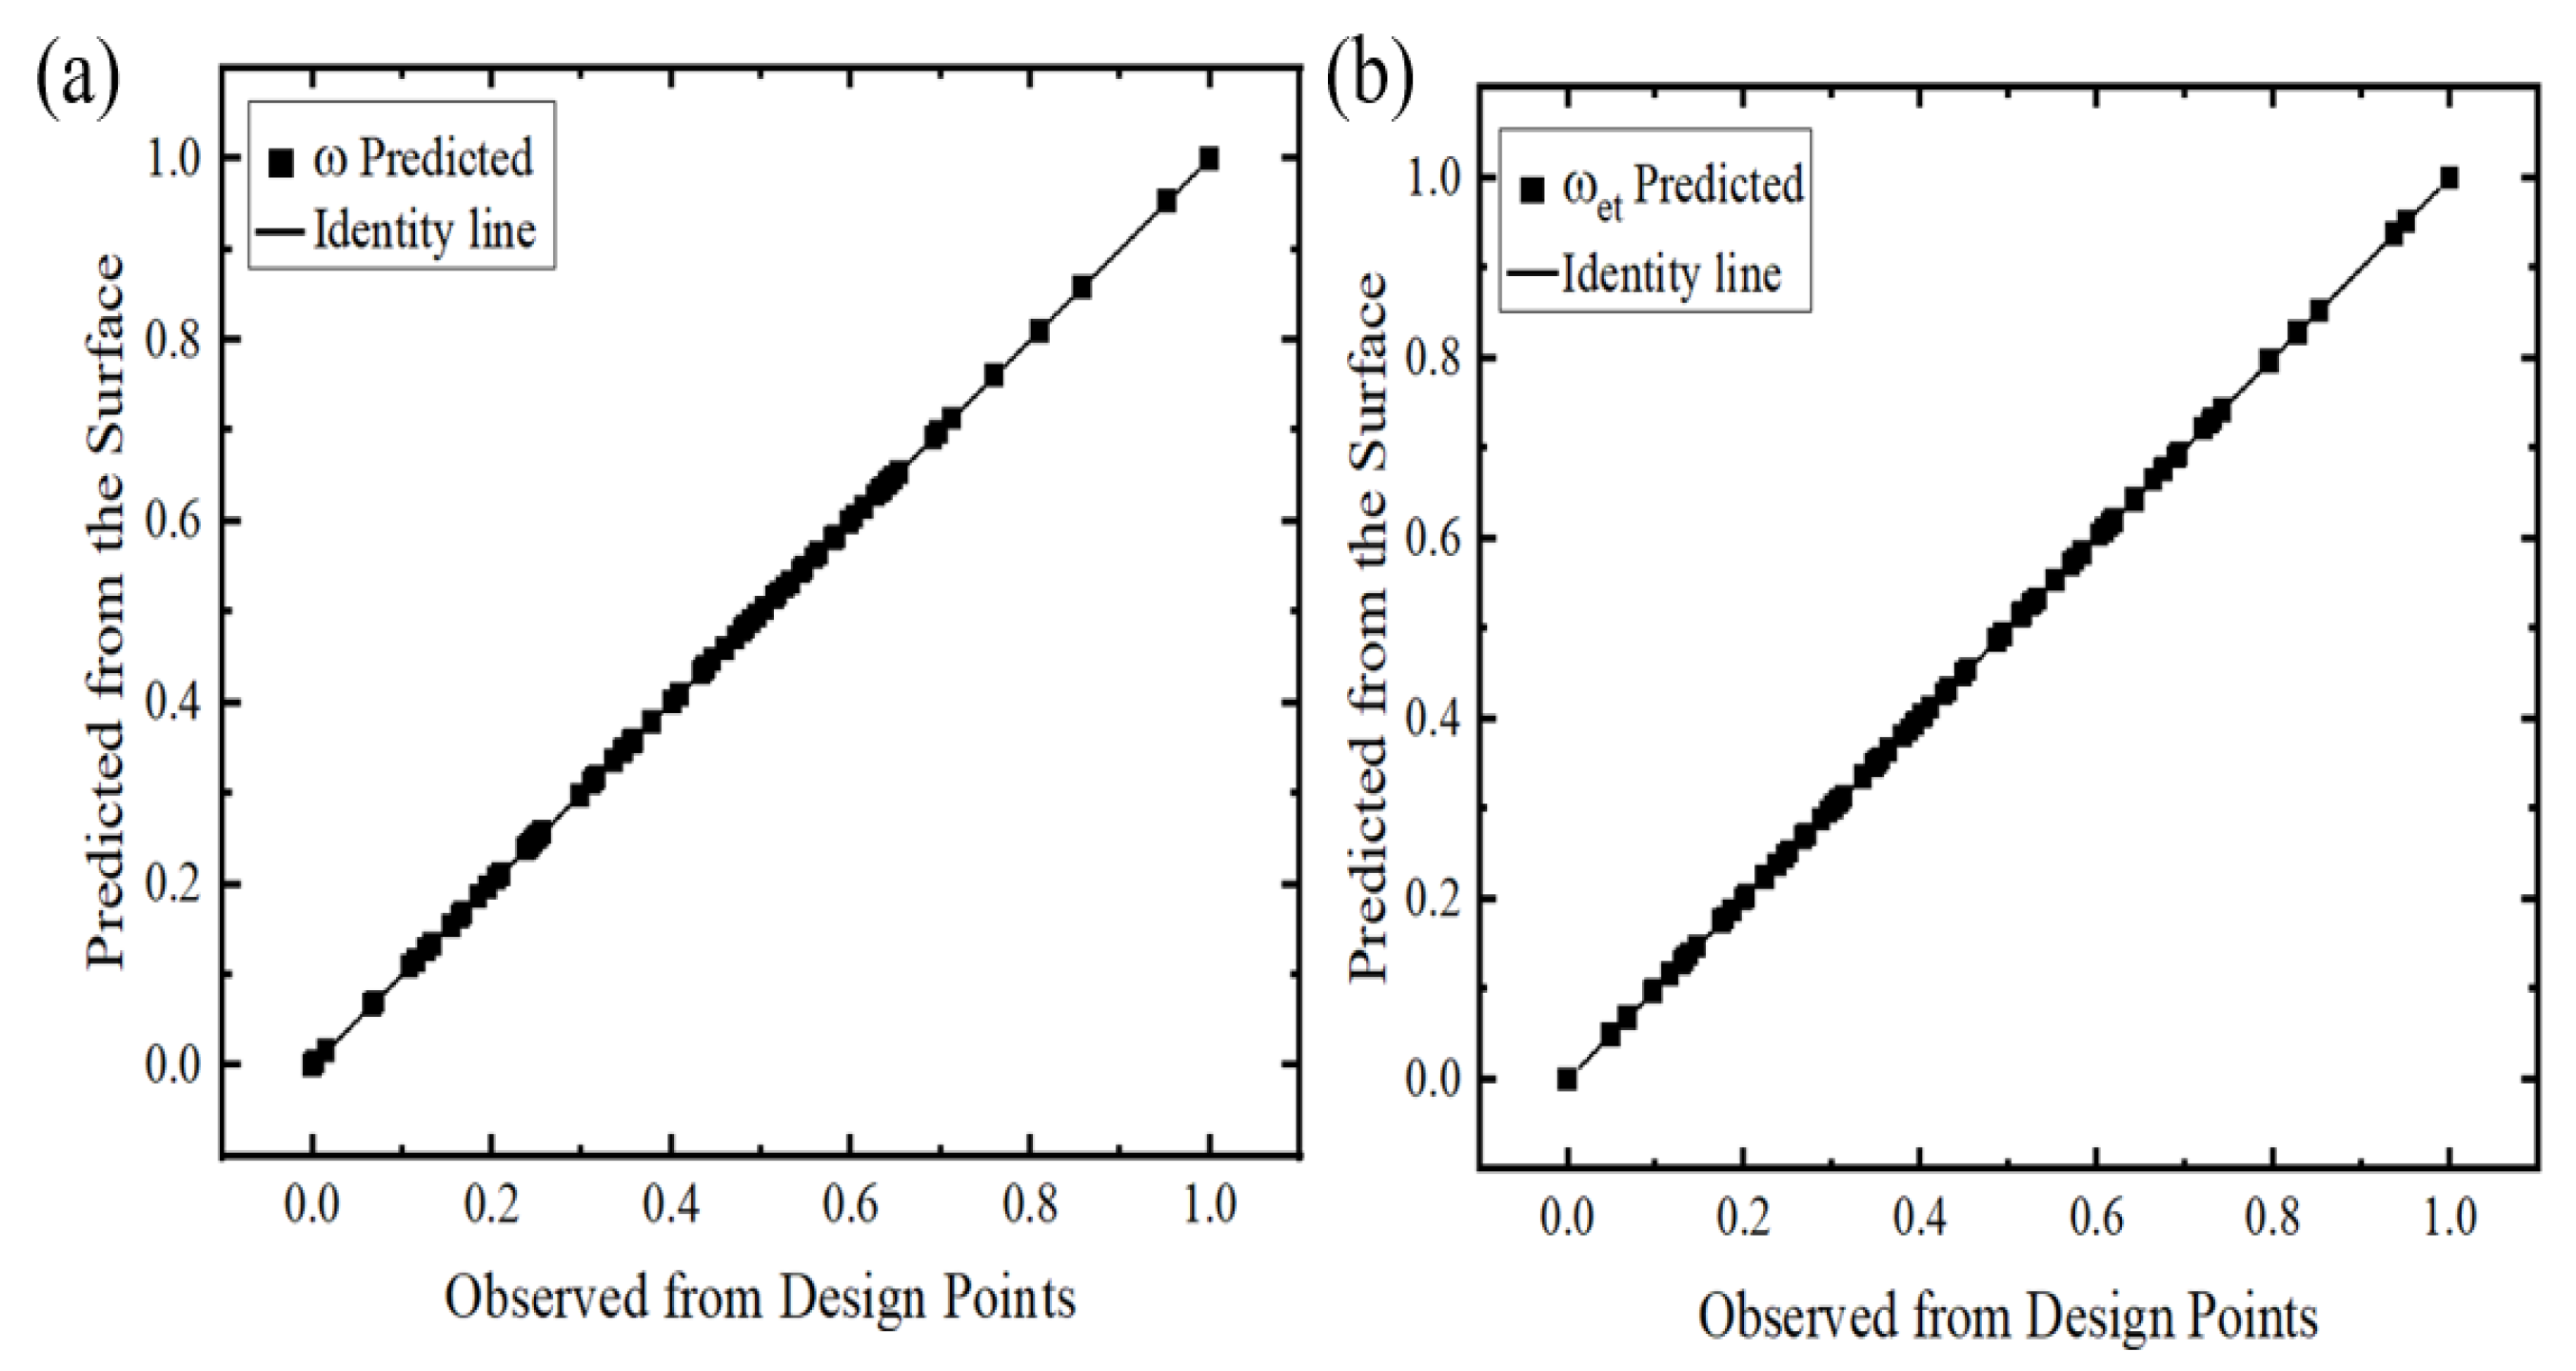
3.3. Response Surface Methodology

The RSM was employed to develop a response surface model and analyze the effects, interactions, and relationships among the input parameters and objective functions. The response surface model can be expressed as follows.
y = f X 1 , X 2 , X 3 , X 4 , Y 1 , Y 2 , Y 3 , Y 4 + γ
where y denotes the response and γ represents the fault in the response. A second-order response surface model is typically employed to fit a parameterized model to the objective function. The model encompasses linear, cross-interaction, and quadratic terms, and can be articulated in general form as
y = β 0 + i = 1 N β i x i + i = 1 N β i i x i 2 + i = 1 N j > i N β i j x i x j + γ
Here, β0 signifies a constant; βi, βii, and βij represent the regression coefficients for the linear, quadratic, and cross-interaction factors, respectively; x is the independent variable; and N indicates the number of independent variables.

3.4. Multi-Objective Optimization

In the process of optimizing the fin structure, it is crucial to evaluate the influence of each control point on the endwall loss coefficient as well as the total pressure loss coefficient. The NSGA-II is a prominent algorithm for addressing multi-objective problems, utilizing Pareto optimal solutions as its foundational principle. This study utilized the NSGA-II algorithm to determine optimal design and operational parameters for simultaneous multi-objective optimization. The vertical coordinates (D1, D2, D3, D4) and horizontal coordinates (X1, X2, X3, X4) of the fin control points served as input parameters, whereas the total pressure loss coefficient and end wall loss coefficient were designated as objective functions. The following outlines the objective functions and constraint conditions relevant to this study:
M i n i m i z e   ω = f 1 X 1 , X 2 , X 3 , X 4 , D 1 , D 2 , D 3 , D 4
M i n i m i z e   ω e t = f 2 X 1 , X 2 , X 3 , X 4 , D 1 , D 2 , D , D 4
The constraints are D1 ∈ (7.3, 12.3) mm, D2 ∈ (14.3, 19.3) mm, D3 ∈ (22, 25) mm, D4 ∈ (26, 30) mm, X1 ∈ (5.2, 7.2) mm, X2 ∈ (5.2, 7.2) mm, X3 ∈ (2.6, 4.6) mm, X4 ∈ (1.5, 3) mm. f1 and f2 are the objective functions of ω and ω e t , respectively.

4. Results and Discussion

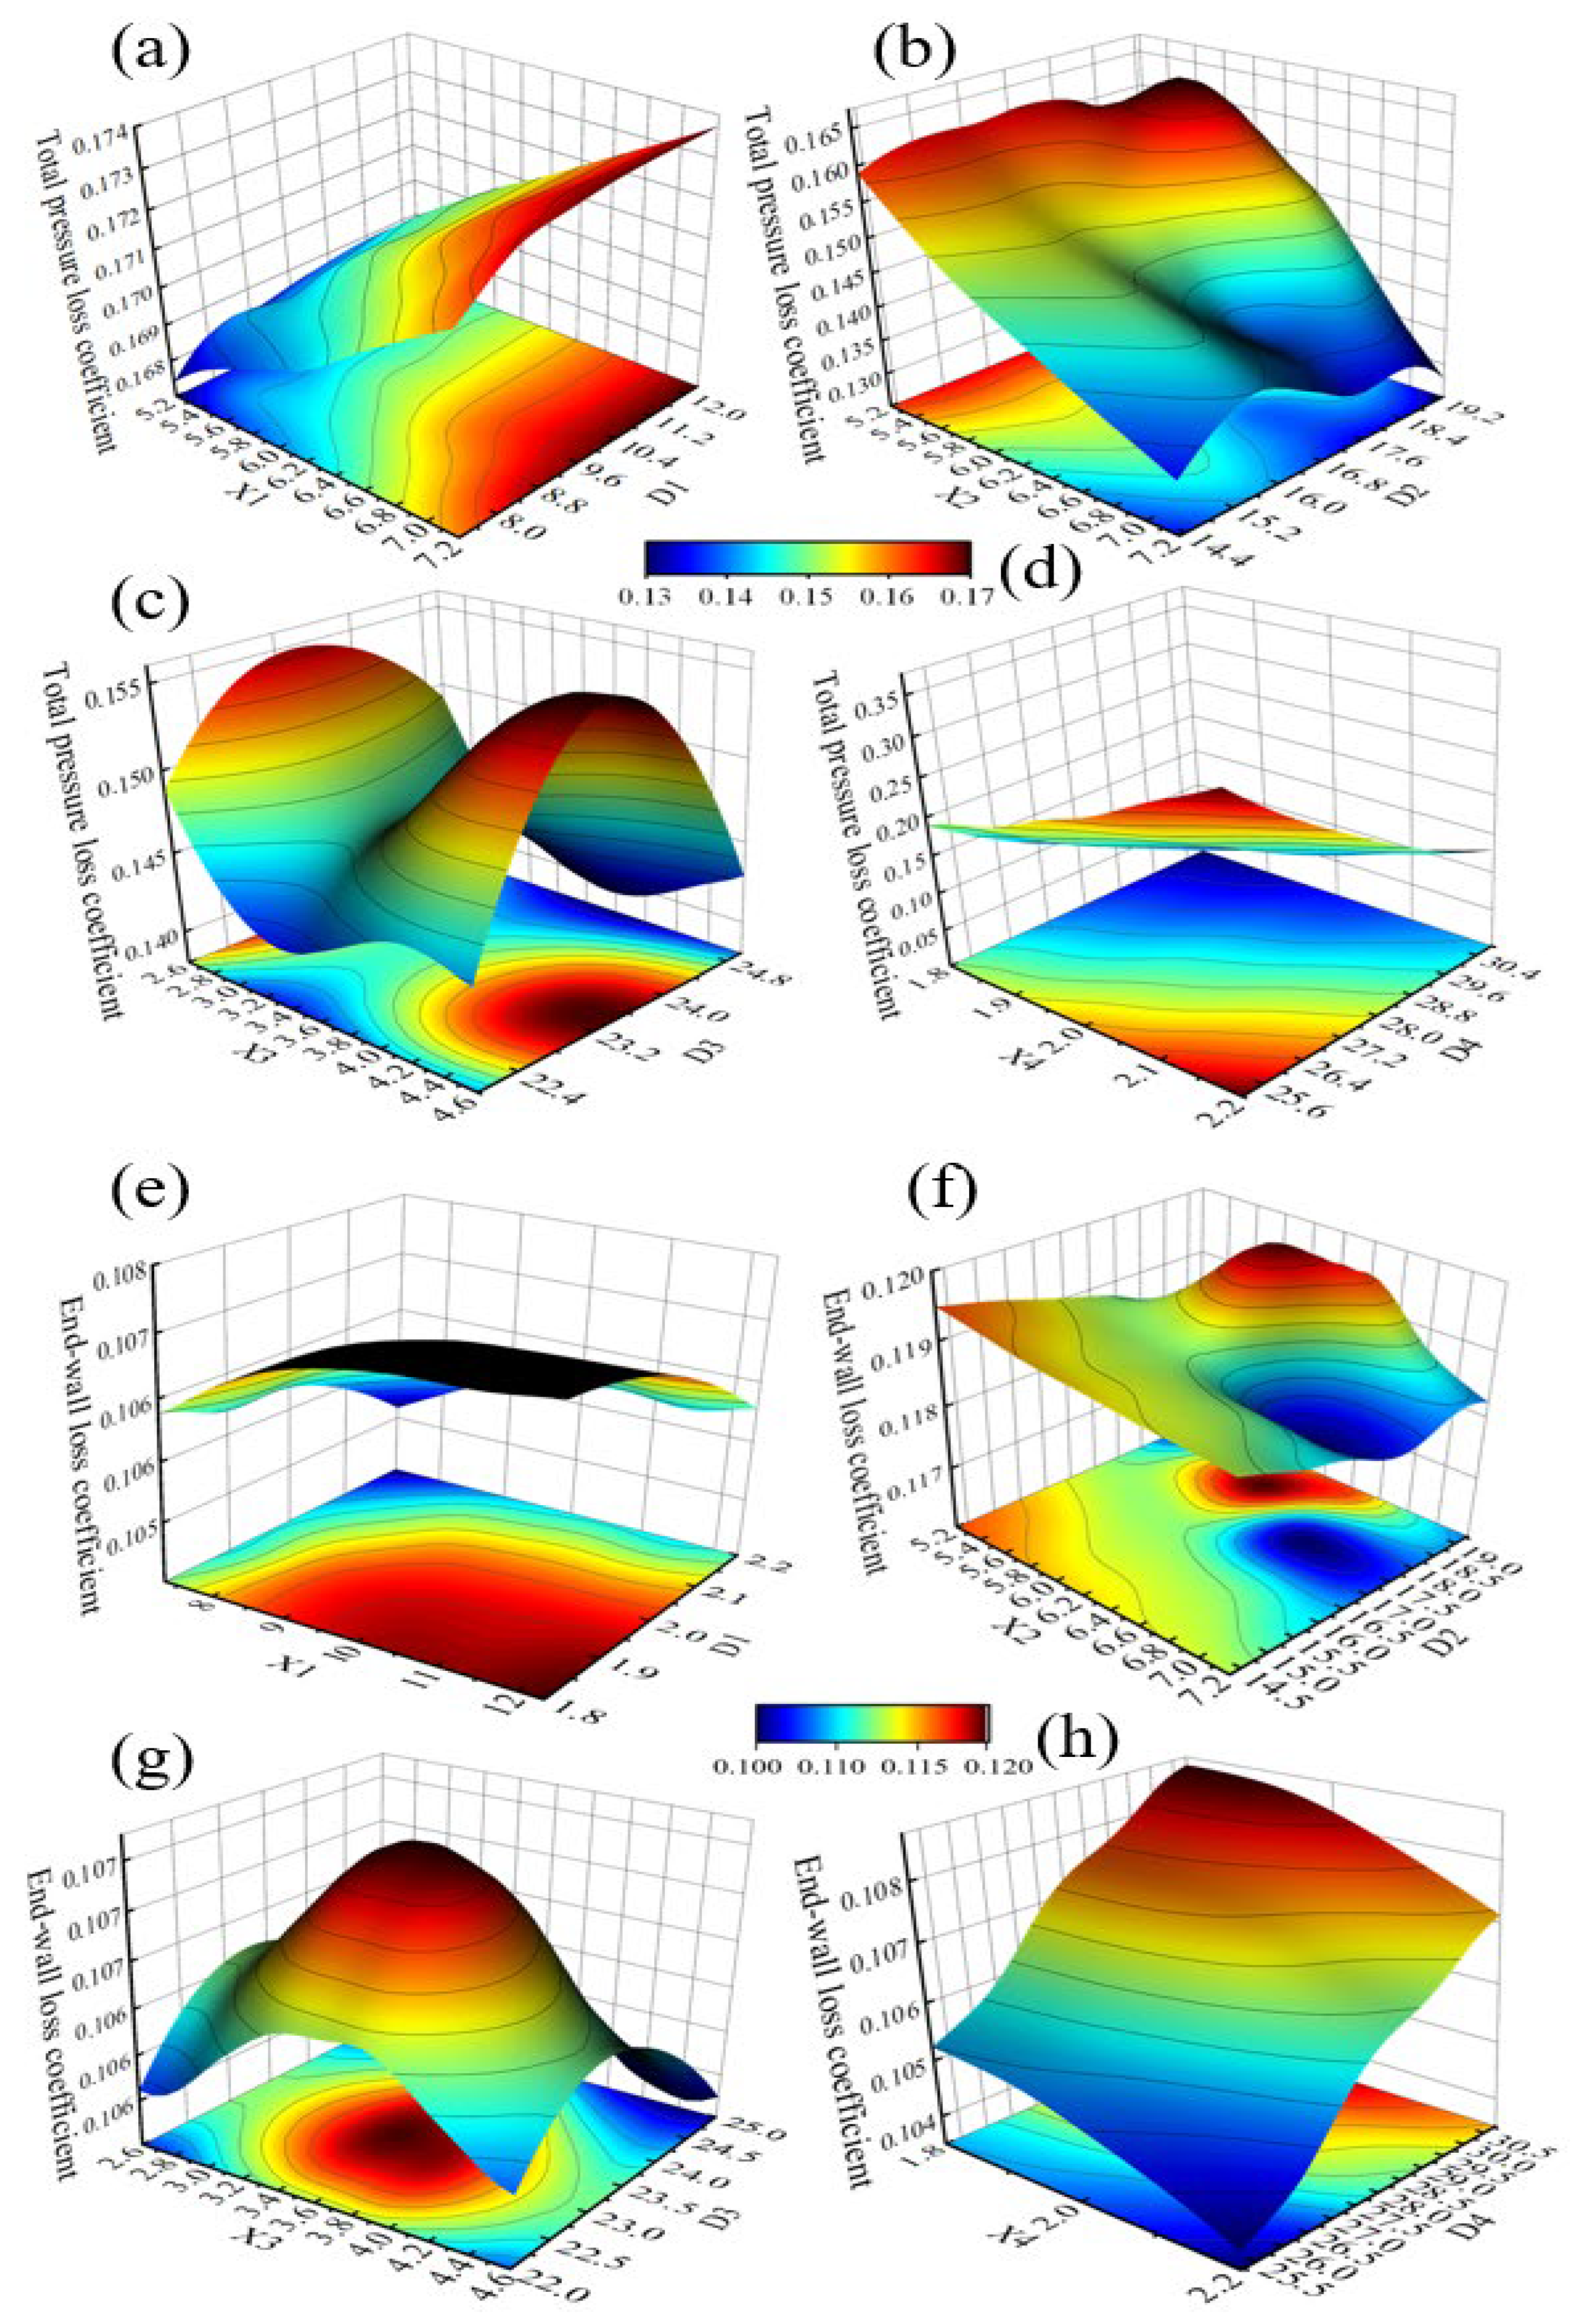
4.1. Response Surface Models

According to the Latin hypercube design, 83 numerical simulations were conducted on the Coanda blades with ribbed jet cavities. Subsequently, a response surface model based on gene aggregation was established using the simulation data. The accuracy of the response surface model was verified by comparing the predicted values with the actual values of the total pressure loss coefficient and the endwall loss coefficient. The linear fitting results in Figure 4 indicate that the established model is sufficient and that the predicted values are highly consistent with the actual values. The sum of the squared residuals is 2.48 × 10⁻¹⁷ and 4.52 × 10⁻¹⁷, respectively, which proves the satisfactory performance of the response surface model and its applicability in output prediction. The three-dimensional response surface plots shown in Figure 5 depict the effects of the studied parameter levels and are useful in investigating the interaction of parameters with the corresponding objective functions. The two color levels represent the values of the total pressure loss coefficient and the end-wall loss coefficient.

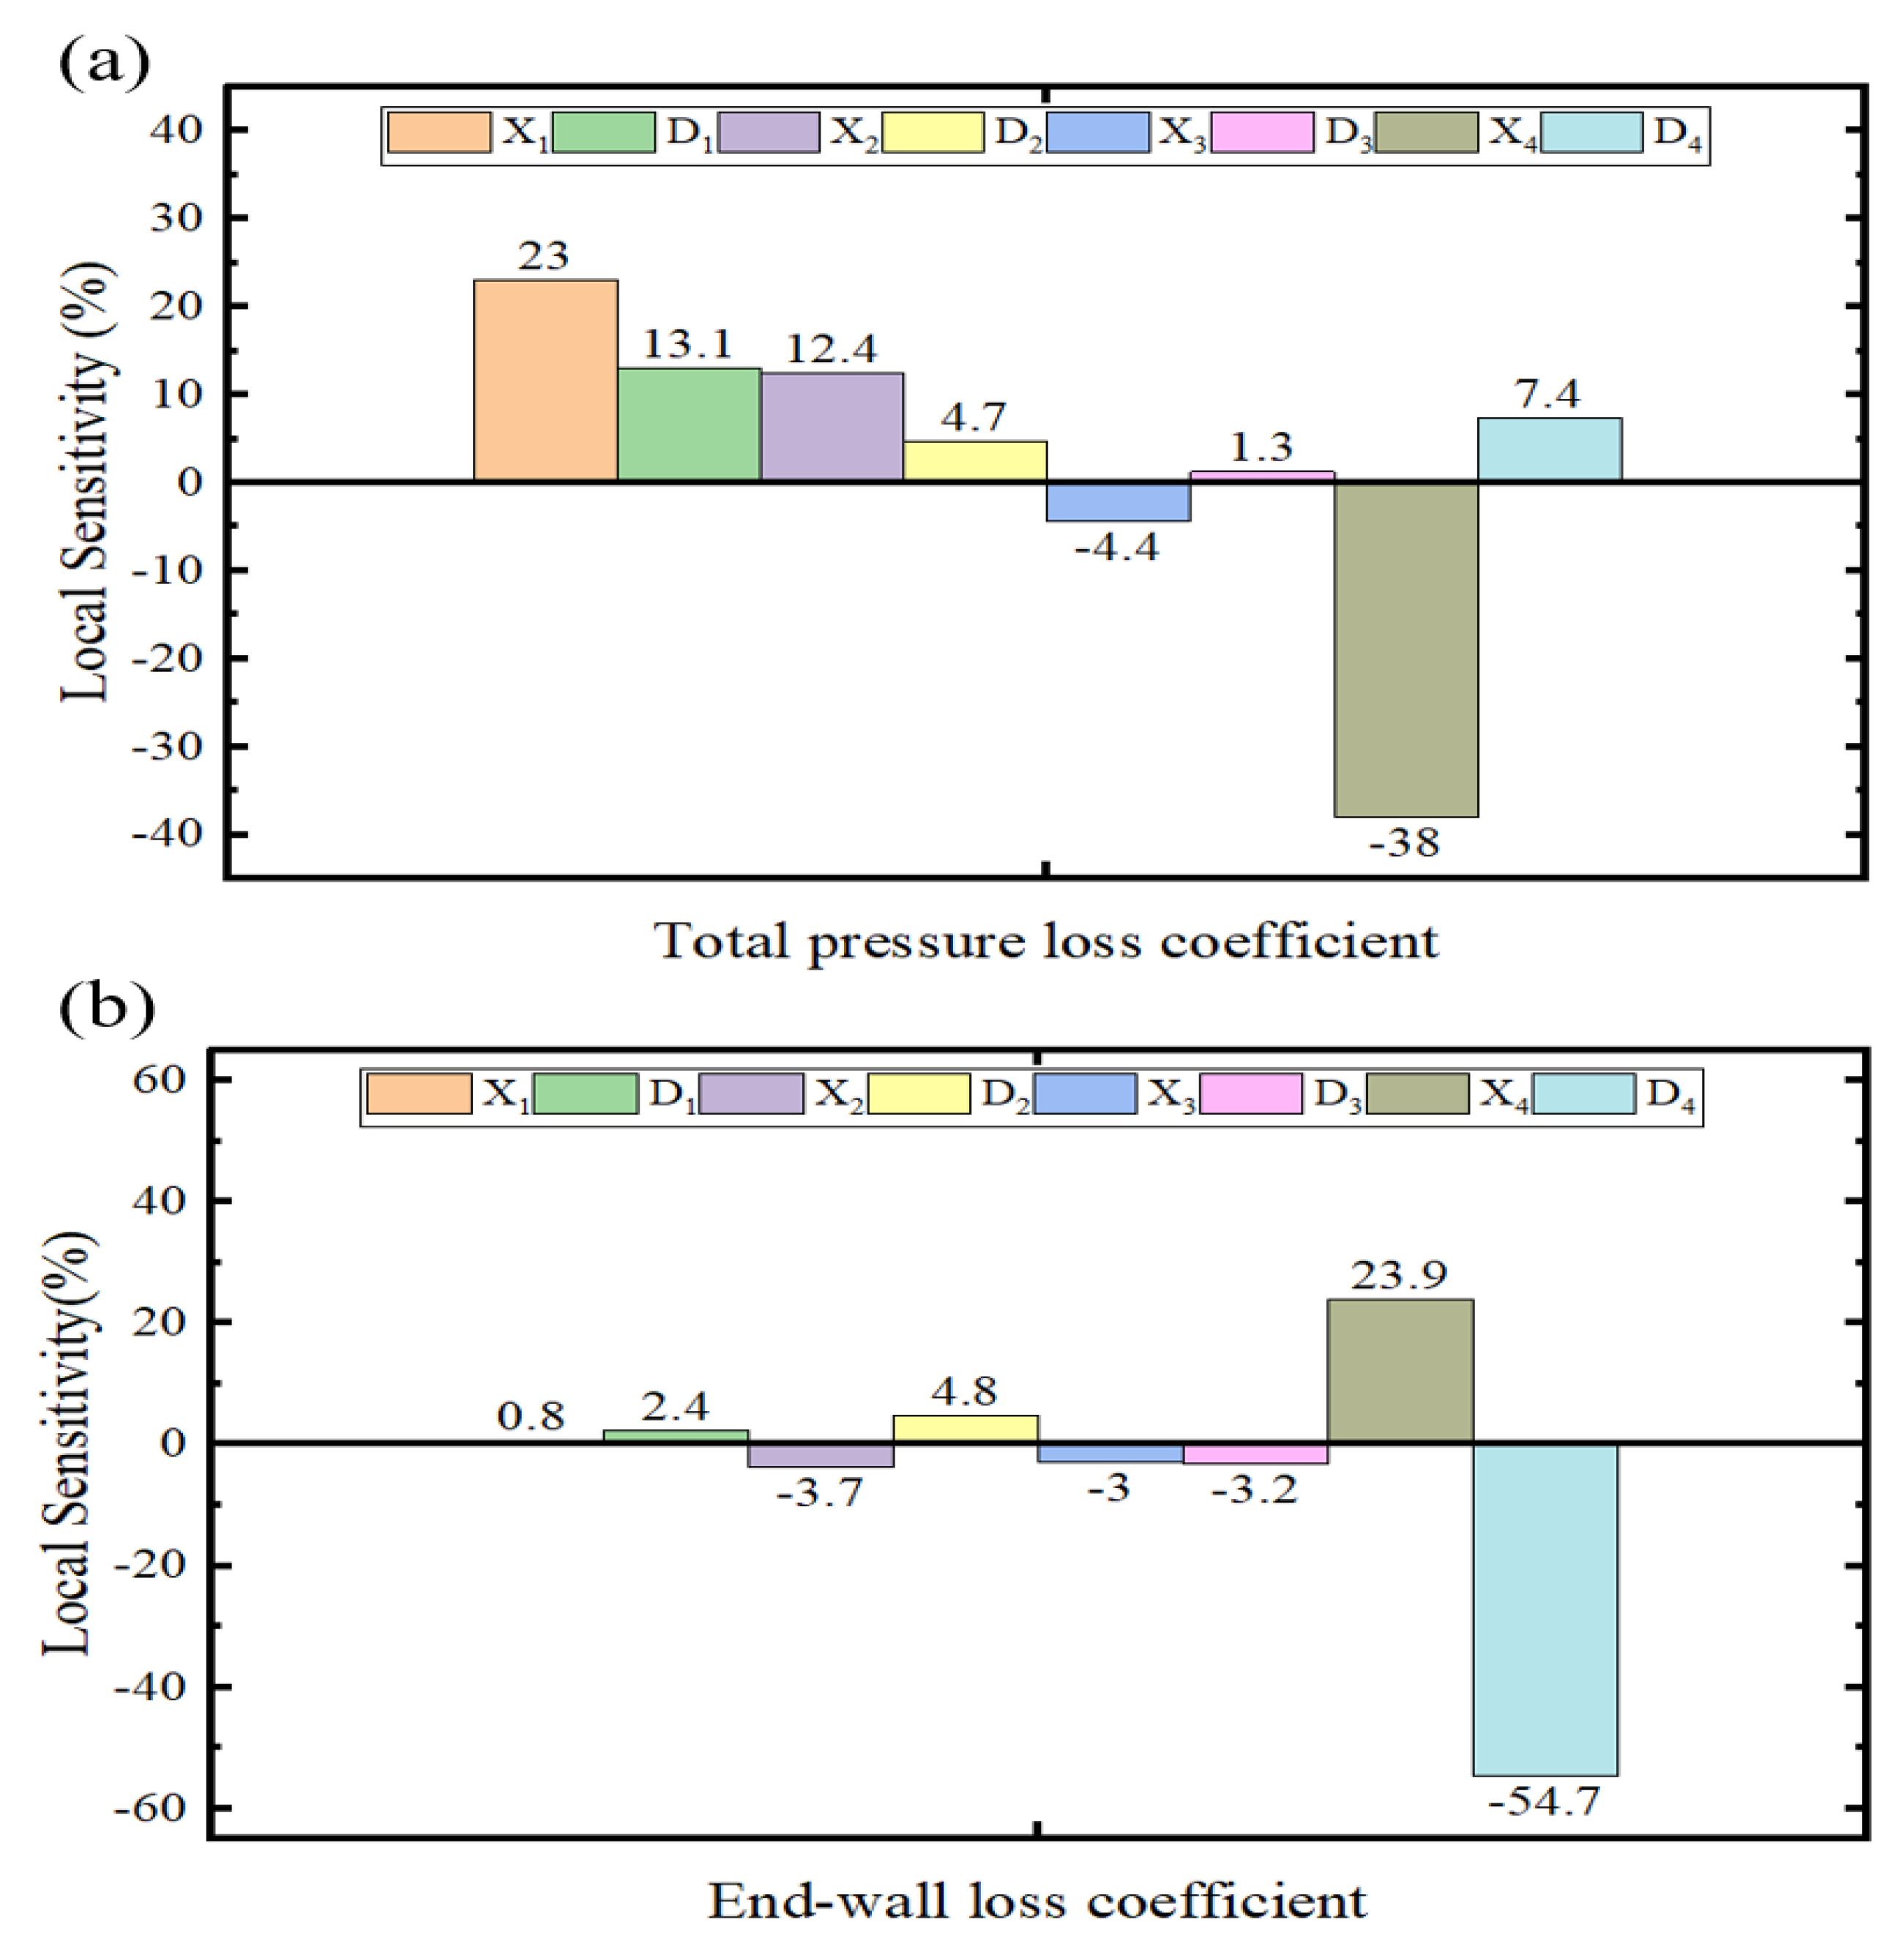
4.2. Sensitivity Analysis

The consecutive input parameters, including the manufacturable value parameters, have an effect on the output parameters, as reflected in the local sensitivity. The sensitivity chart represents the sensitivity of single parameters at the response surface level. Based on the current value of each input parameter, the sensitivity analysis estimates the change in output due to a change in the input. Larger changes in the output parameters indicate greater importance of the input parameters.
Figure 6 shows the influence of the input parameters on the output parameter. The total pressure loss coefficient is most significantly affected by the coordinates of the first control point and the fourth control point. Increasing X4 and reducing X1 and D1 yield favorable results in reducing the total pressure loss coefficient. The fourth control point has the most significant effect on the endwall loss coefficient, while the remaining control points have minimal influence. To decrease the endwall loss coefficient, it is advantageous to decrease X4 and increase D4.

4.3. Optimization Results

The NSGA-II can be utilized to enhance the design and operational parameters by reducing ω and ω e t . At the outset of the optimization process, NSGA-II generated 8000 samples, followed by 1600 samples per iteration, ultimately uncovering three potential design points in 20 iterations. Figure 7 illustrates the Pareto optimal solution sets corresponding to the objective functions ω and ω e t following the convergence of the NSGA-II algorithm. The implementation of the NSGA-II led to the creation of multiple nondominated Pareto fronts, encompassing all potential trade-offs between the two objective functions. This chart functions as an effective instrument for facilitating optimal decision-making. The new sample set yielded three optimal parameter combinations selected by NSGA-II, as detailed in Table 3. Figure 3c illustrates a two-dimensional geometric structural comparison of the fins prior to and following optimization.

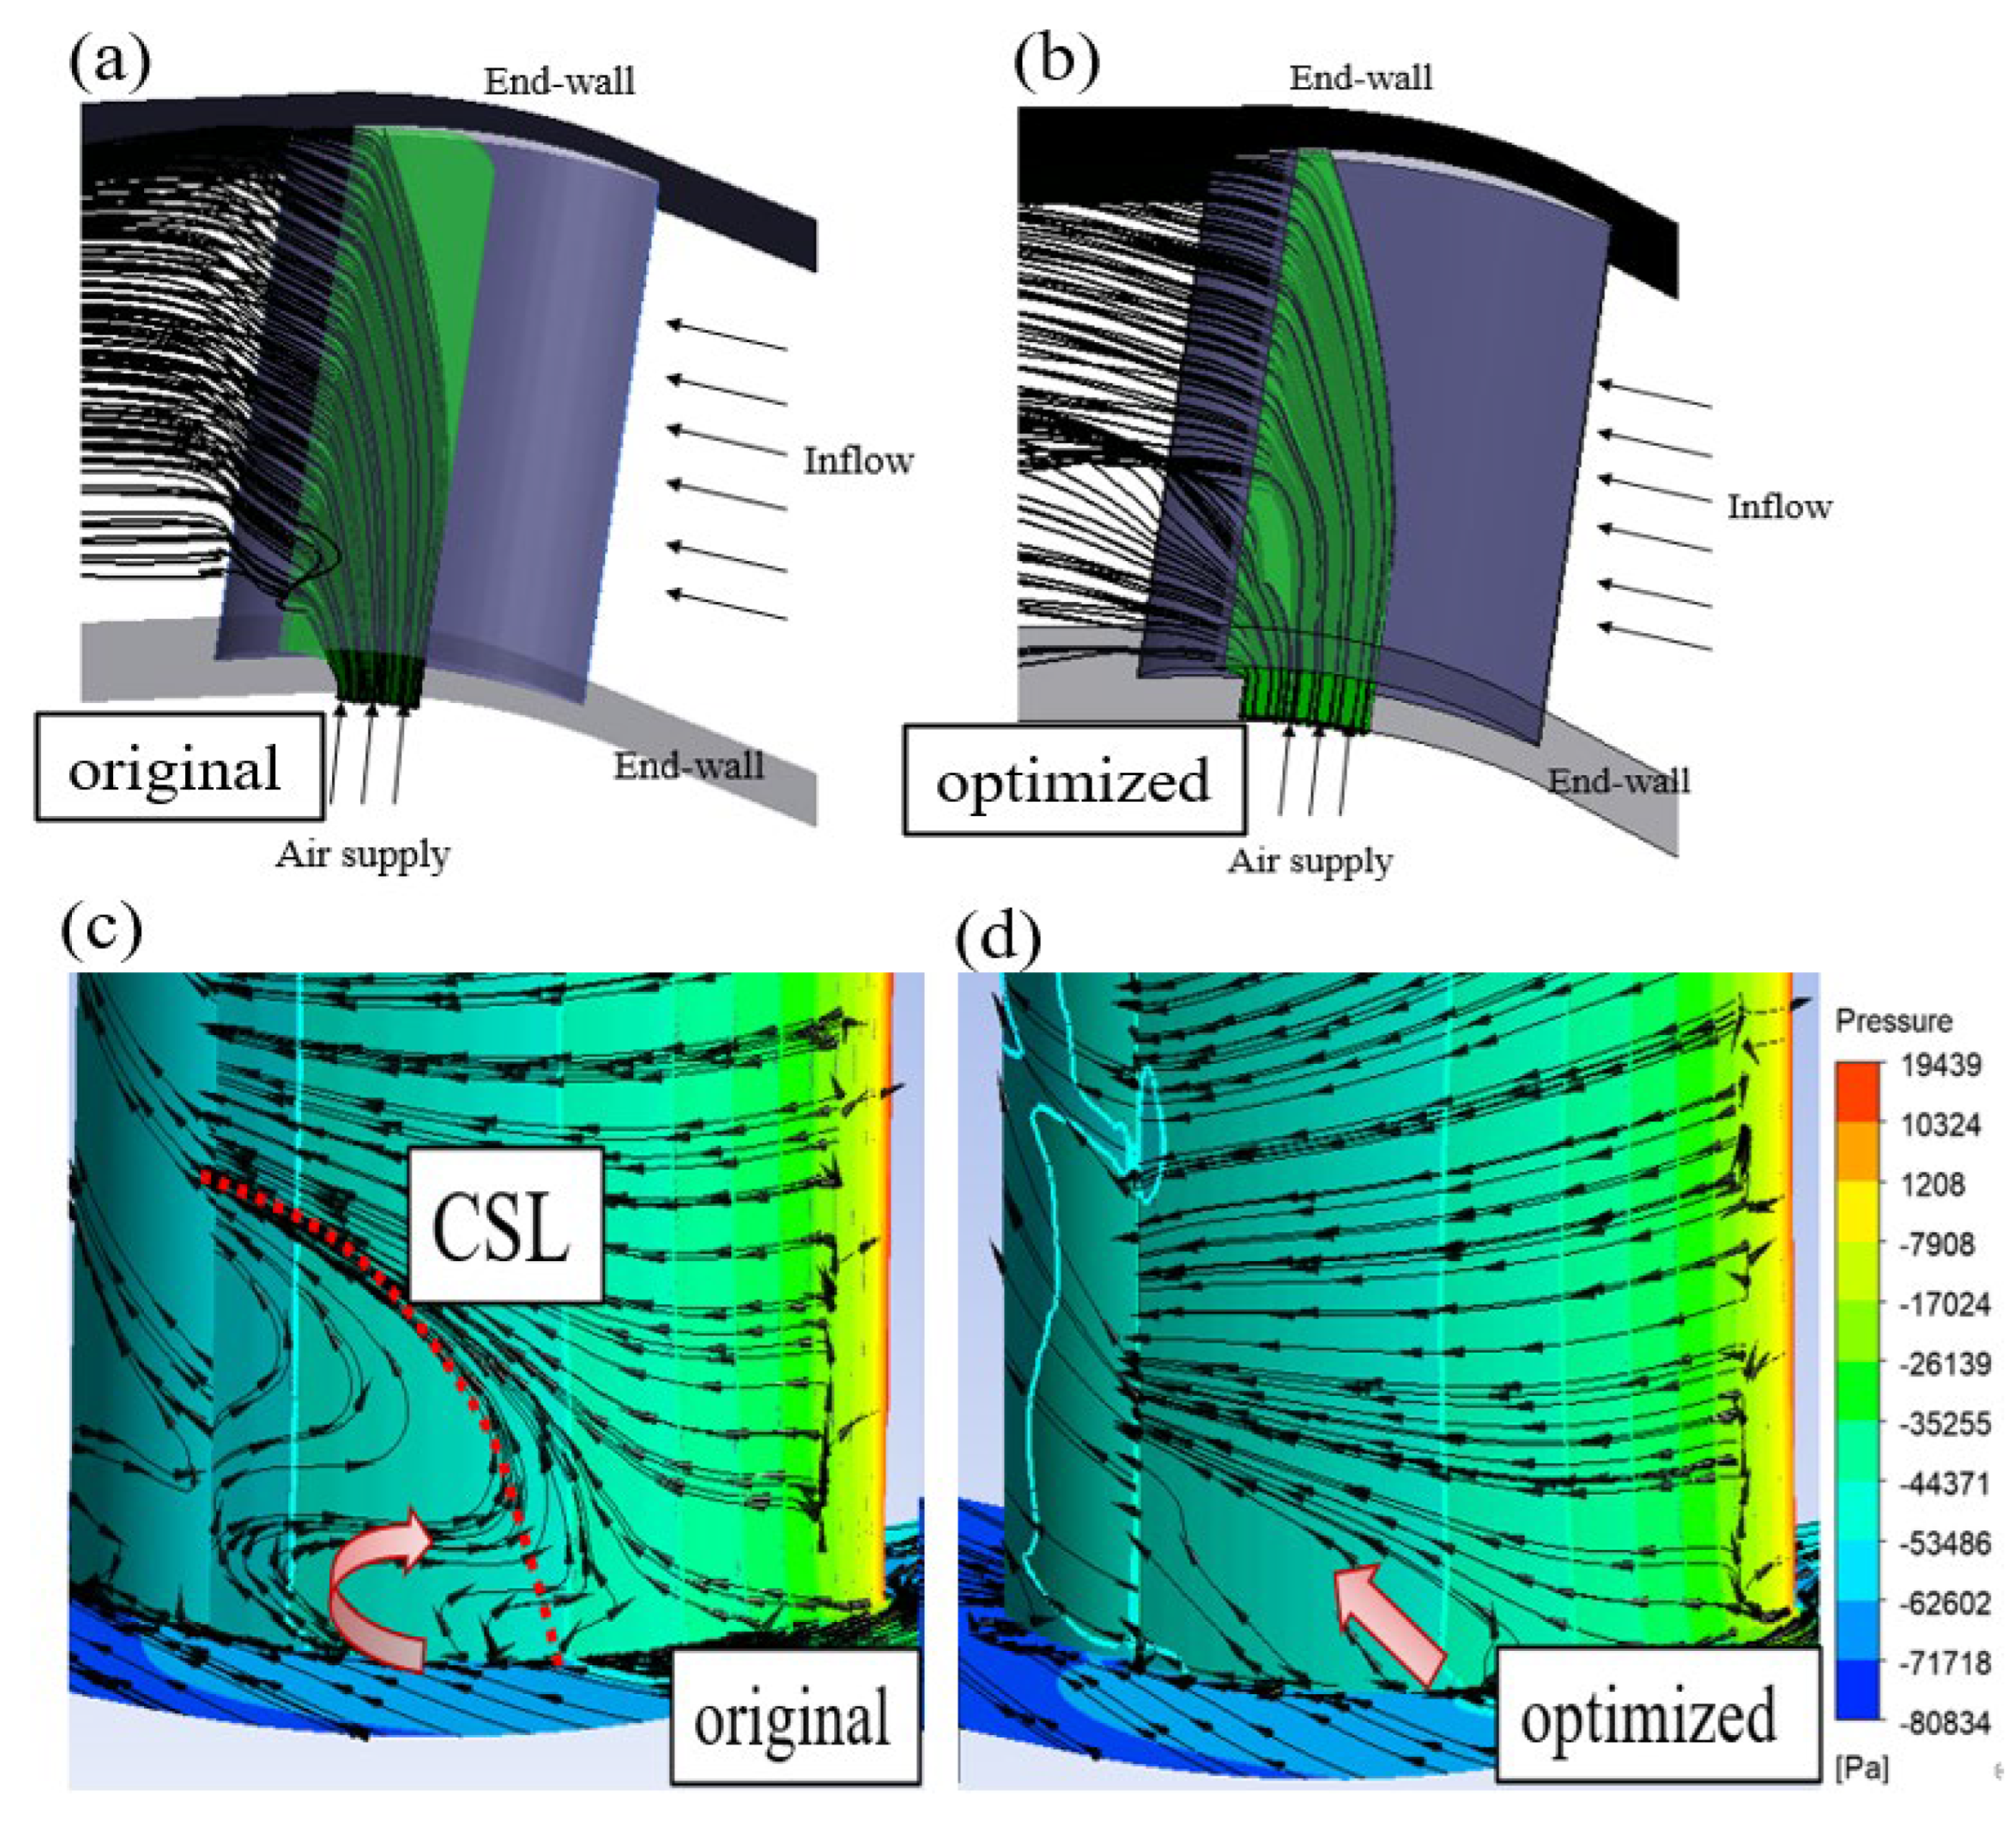
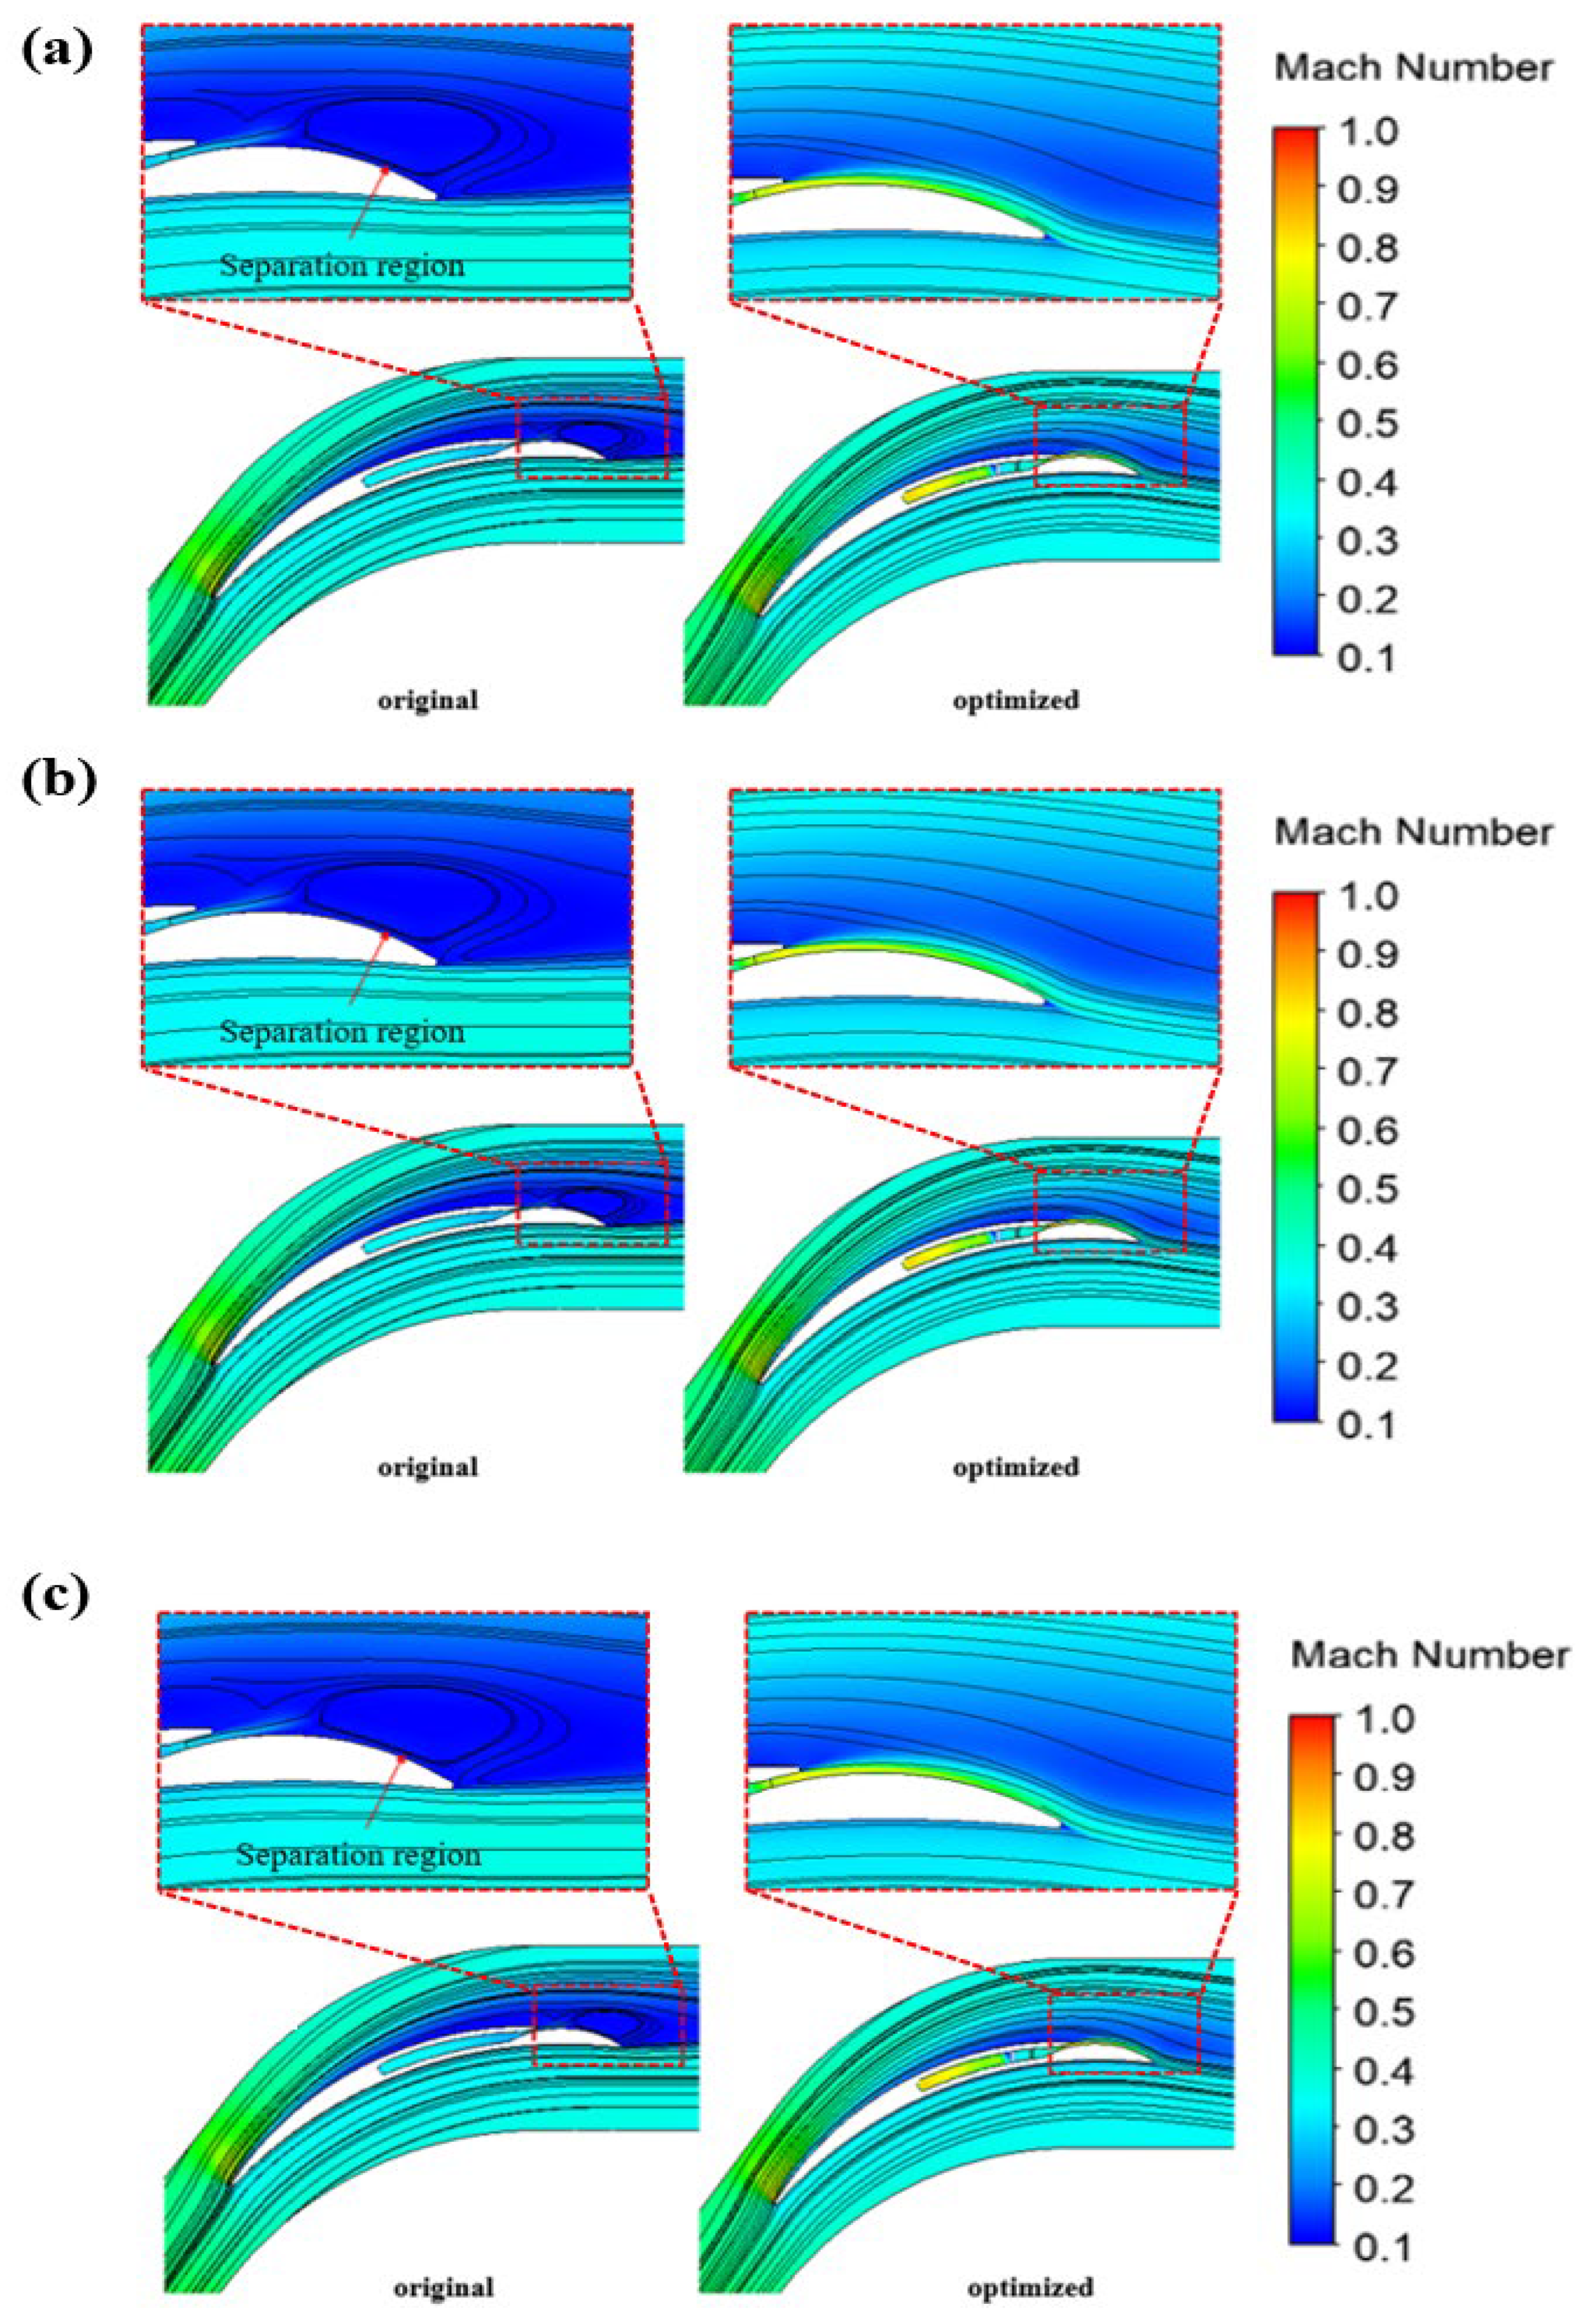
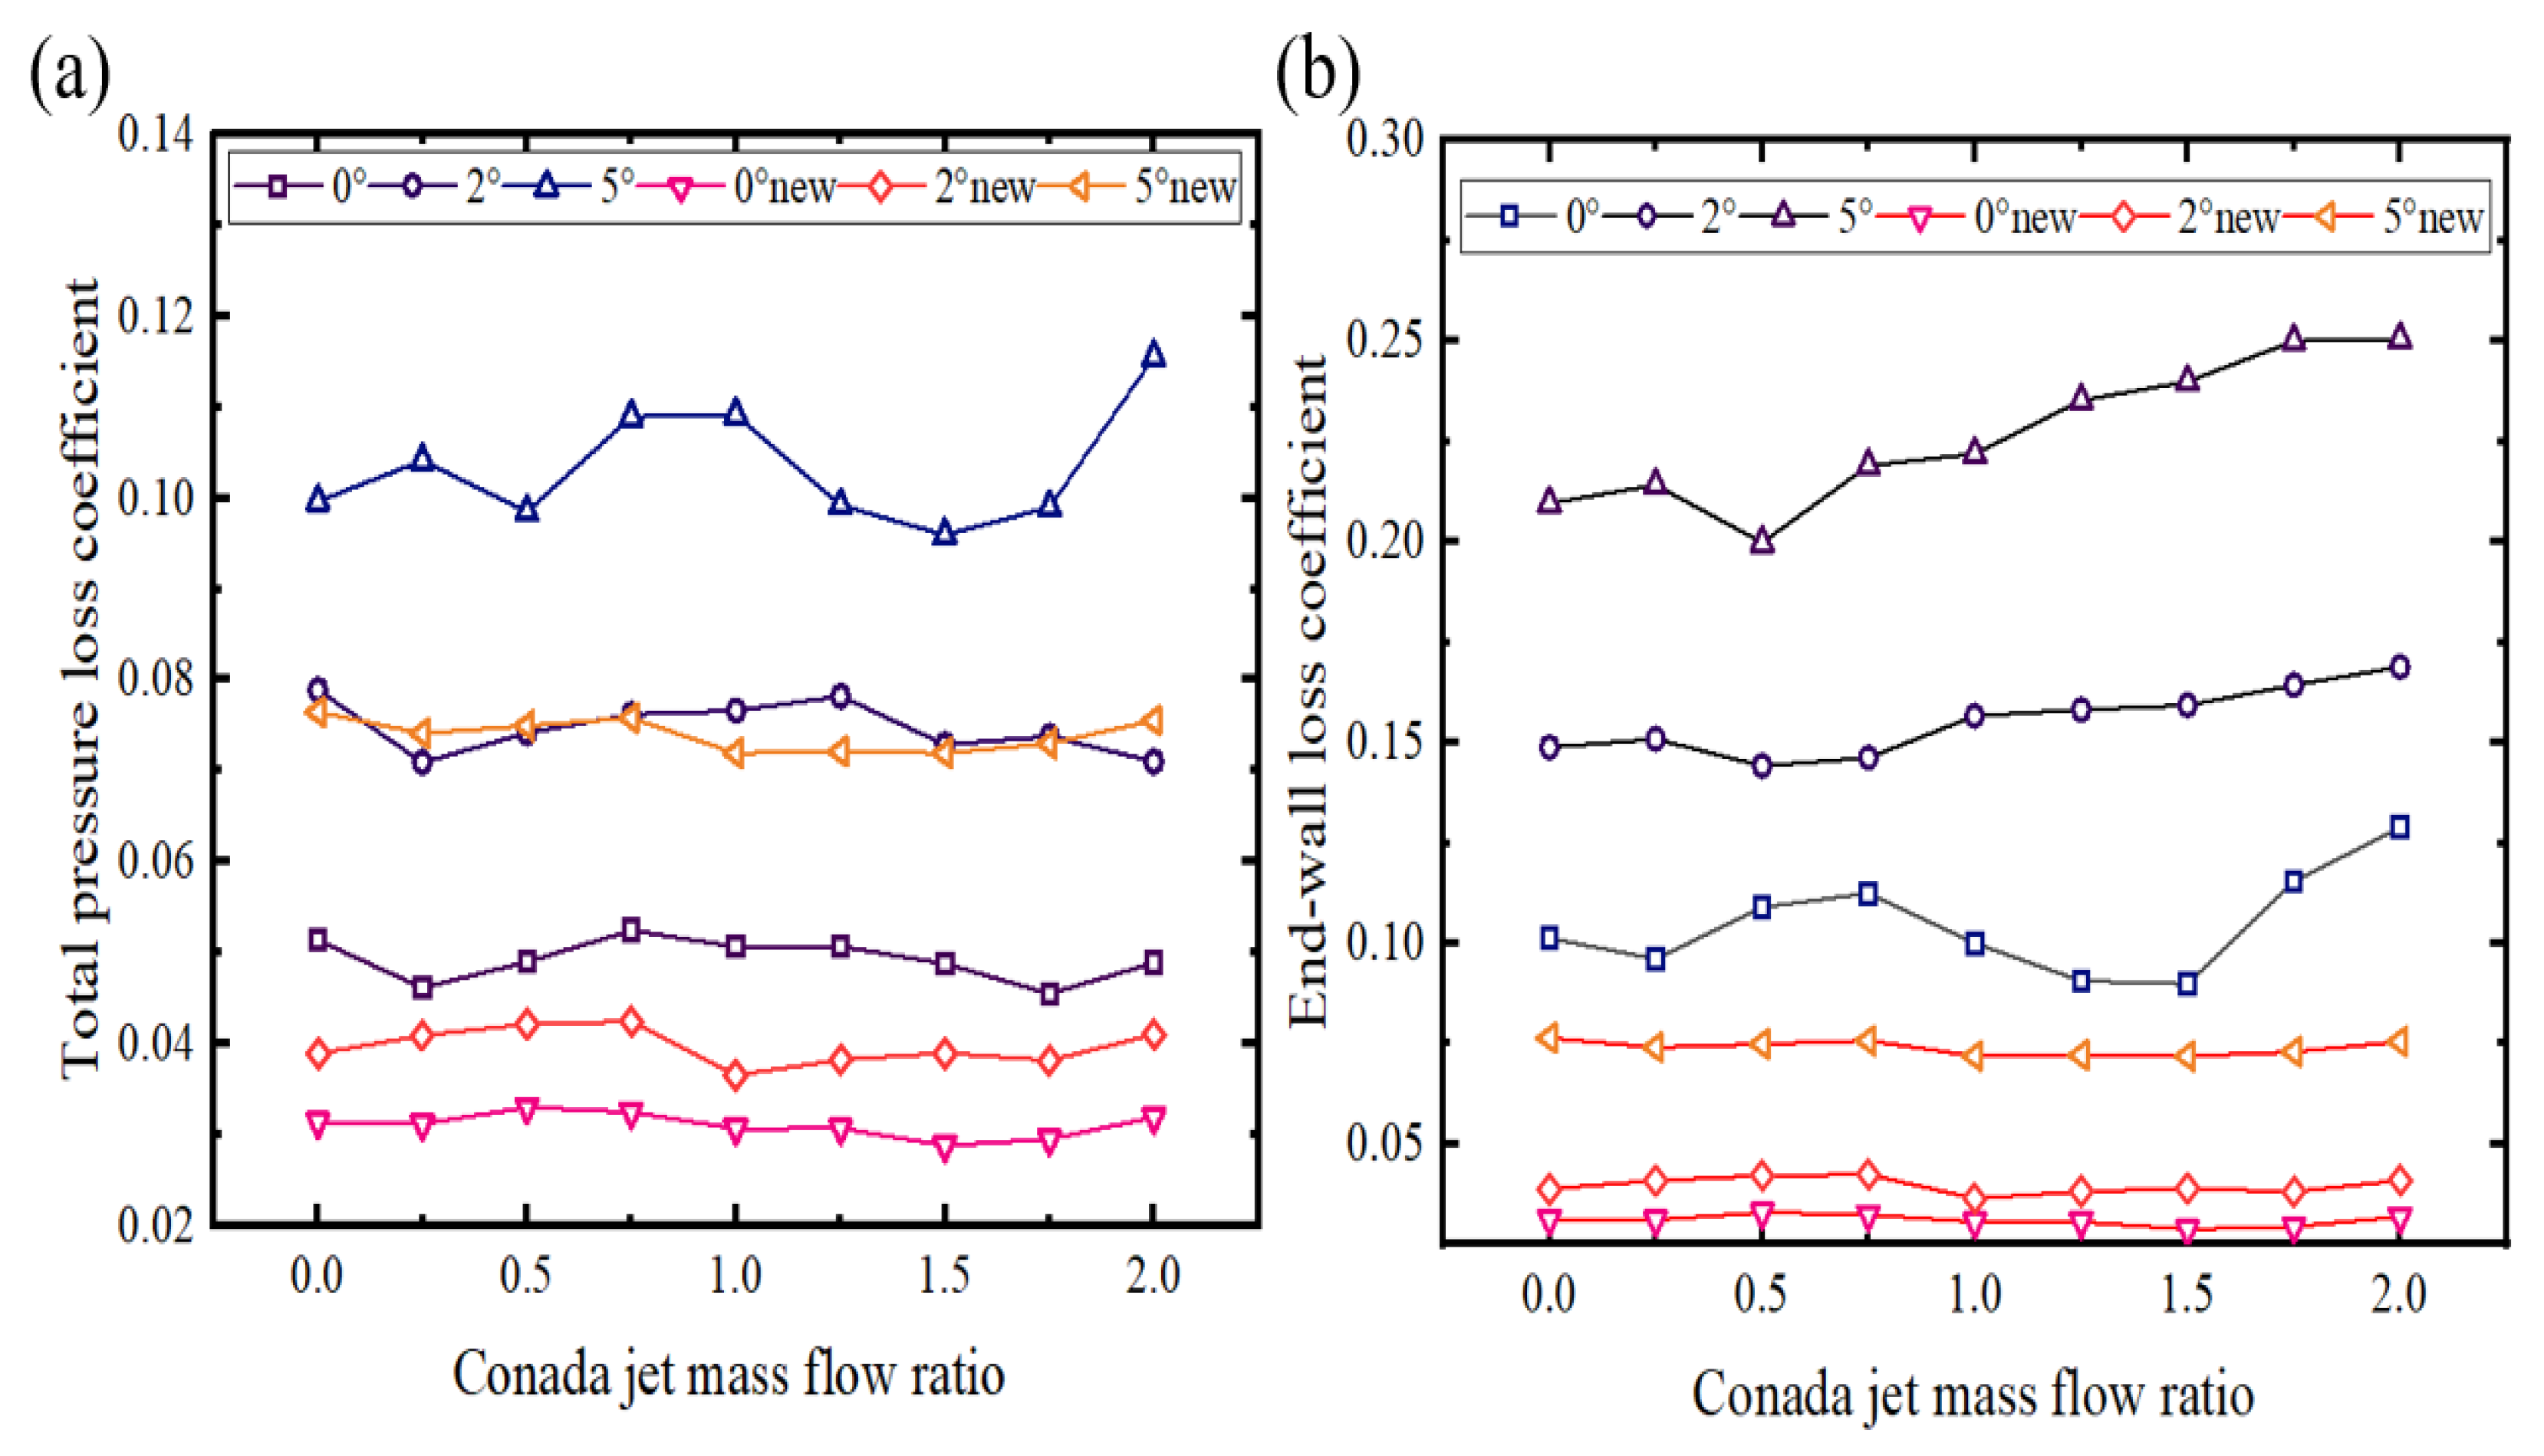
4.4. Analysis of the Flow Field Before and After Optimization

A comparison between the optimized jet streamlines and the original structure, as depicted in Figure 8a,b, demonstrates that in the original cascade, the jet flow can extend to the trailing edge and upper endwall region of the blade but not to the bottom corner edge. Thus, the original cascade exhibits inadequate flow separation control on the corner end wall. On the other hand, the optimized cascade jet effectively covers the entire jet output area and provides superior control overflow separation in the trailing edge and corner regions. Consequently, the optimized cascade can significantly enhance the degradation of the angular flow field.
The static pressure distribution and limiting streamlines on the blade suction surface offer valuable information regarding the position and occurrence of flow separation. Figure 8c,d illustrate the distributions of static pressure and limiting streamlines for both the original and optimized cascade suction surfaces. Severe counterflow is observed in the corner region of the suction surface, indicating the occurrence of corner separation in the highly loaded compressor cascade, as denoted by the corner separation line. In this corner region, flow separation is more pronounced, with a notable volume of fluid demonstrating counterflow from the blade root to 20% of the chord length. This results in heightened turbulence and a significant propensity to produce a shedding vortex.
The occurrence of corner separation results in a higher static pressure at the suction corner than at the blade midspan, as shown by the static pressure coefficient contours. This indicates a decrease in the diffusion ability of the compressor cascade due to corner separation. However, after endwall injection, the reversed flow in the suction corner is almost completely eliminated and is replaced by spanwise migrating limiting streamlines (as denoted by the red arrows).
In the axial portion, the flow line and Mach number distribution can represent the flow field near the blade and the beginning point of flow separation. The flow line and Mach number cloud pictures of 20%, 50%, and 80% blade height portions of the prototype and optimized cascade are shown in Figure 9, which enlarges the area near the trailing edge. The flow field in the corner area of the lower end-wall of the blade is reflected by the 20% blade energy. The prototype cascade, as shown in Figure 9a, has a relatively obvious boundary layer separation at the rear edge of the lower end-wall blade, as well as a relatively obvious saddle point and spiral point, demonstrating the topological form of saddle point-spiral point, which belongs to closed separation in the separation state. This type of separation will result in very high mixing, with a somewhat substantial loss of cascade. The flow performance of the optimized cascade near the wall is good, no noticeable flow separation occurs, and the flow loss of the lower end wall is decreased, as illustrated in Figure 9b,c. The flow field at the corner area of the middle and top wall of the blade is reflected by 20% and 80% of the blade energy, respectively. The improved cascade and the original cascade both improve the flow field at cross sections of 50% and 80% blade height, and there is no visible flow separation point in either section. The optimized cascade at the trailing edge of the blade has a higher Mach number than the original cascade. This demonstrates that the improved cascade has a smaller inverse pressure gradient than the original cascade, which might help to minimize flow separation and enhance the margin of inflow Angle of attack. The results show that the optimized cascade can effectively control both trailing edge separation and corner separation, improve the blade trailing edge force, and significantly improve the corner separation phenomenon in the cascade’s lower end wall region, thereby improving the cascade’s ground aerodynamic performance.
Following optimization, the reflux height decreases from 20% of the blade height to 8%, resulting in a reduction in the formation of a corner separation vortex. This leads to a more stable flow field and a significant decrease in cascade loss. Additionally, compared to those on the baseline cascade, the static pressure on the suction surface and endwall significantly increase after injection.
Figure 10 illustrates the total pressure loss coefficient and the end wall loss coefficient for different air flows at entering attack angles of 0°, 2°, and 5°. A lower entering attack angle corresponds to lower values for both coefficients. However, as the attack angle increases, both coefficients also increase. When the attack angle reaches 5°, the total pressure loss coefficient is 11.9%, and the endwall loss coefficient is 24.8%. The observed issue is due to the insufficient fin structure in the initial cascade, leading to an ineffective air injection impact on the end-wall region. As a result, there is a notable increase in the end-wall loss coefficient and a considerable reduction in flow within the end-wall region. The rising volume of the jet prevents it from extending to the end-wall region. The implementation of the finned structure results in a decrease in both the total pressure loss coefficient and the endwall loss coefficient. After the optimization process, the total pressure loss coefficient has been reduced by 2.13%, while the end wall loss coefficient has been reduced by 12.74%.

5. Conclusions

This study examined the impact of various operational parameters on the flow characteristics of a Coanda jet blade and optimized these parameters through the application of Response Surface Methodology (RSM) and Non-dominated Sorting Genetic Algorithm II (NSGA-Ⅱ). A three-dimensional numerical model was created to examine the flow characteristics, and its reliability was confirmed by comparing it with experimental and simulation data from prior research. The parametric study analyzed the impact of the geometrical control points of the fins on the total pressure and end-wall loss coefficients. Subsequently, the RSM was utilized to create a response surface model, which identified the relationships between the input parameters and the objective function for optimization purposes. The optimal parameter combinations were obtained using NSGA-Ⅱ. This research effectively elucidated the impact of operational parameters on the flow characteristics of a Coanda jet blade and outlined viable optimization strategies.
The results of the response surface analysis demonstrate a nonlinear relationship between the input and output parameters, indicating that a complex correlation between the selected parameters and the output results is suitable for multi-objective optimization conditions. The parameter sensitivity analysis reveals that the coordinates of the first and fourth control points have a significant effect on the total pressure loss coefficient and end-wall loss coefficient. This underscores the critical importance of prioritizing the manipulation of the first and fourth control points in the geometric design process. Compared to the original unfinned jet cascade, the presence of fins modifies the jet direction, enabling more effective regulation of flow separation on the suction surface of the blade. The optimization leads to significant reductions of 2.13% and 12.74% in the total pressure loss coefficient and endwall loss coefficient of the blade, respectively. Moreover, the optimization enhances the flow field within the blade in comparison to the original configuration, notably decreasing the presence of low-energy fluid on the suction surface of the blade, particularly in the corner area. This reduction suppresses flow separation and improves the stability of the blade flow field. The findings of this study can potentially aid designers in the development of high-efficiency aeroengines.

Author Contributions

The Methodology was presented by K.Y. H.Z. wrote the majority of the manuscript text. Y.Z. and H.Z. conducted the wind tunnel experiments and subsequent data processing and simulation calculation. K.Y. reviewed the manuscript. All authors have read and agreed to the published version of the manuscript.

Funding

This work was supported by the National Natural Science Foundation of China for financial support (Grant Nos. 51890891 and 51890894) and the Scientific and Technological Innovation Foundation of Foshan (Grant No. BK20AE002).

Data Availability Statement

The related data is available under reasonable request.

Conflicts of Interest

The authors have no conflicts of interest to declare that are relevant to the content of this article.

References

  1. Day, I. Stall, Surge, and 75 Years of Research. J. Turbomach. 2015, 138, 11001. [Google Scholar] [CrossRef]
  2. Lieblein, S. Loss and Stall Analysis of Compressor Cascades. J. Basic Eng. 1959, 81, 387–400. [Google Scholar] [CrossRef]
  3. Jothiprasad, G.; Murray, R.C.; Essenhigh, K.; Bennett, G.A.; Saddoughi, S.; Wadia, A.; Breeze-Stringfellow, A. Control of tip-clearance flow in a low speed axial compressor rotor with plasma actuation. J. Turbomach. 2012, 134, 021019. [Google Scholar] [CrossRef]
  4. Lieblein, S.; Schwenk, F.C.; Broderick, R.L. Diffusion factor for estimating losses and limiting blade loadings in axial-flow-compressor blade elements. Tech. Rep. Arch. Image Libr. 1953, NACA RM E53DOI, 10004207426. [Google Scholar]
  5. Lee, N.K.W.; Greitzer, E.M. Effects of endwall suction and blowing on compressor stability enhancement. J. Turbomach. 1990, 112, 133–144. [Google Scholar] [CrossRef]
  6. Sonoda, T.; Olhofer, M.; Hasenjaeger, M.; Schreiber, H.A. Airfoil for Axial-Flow Compressor Capable of Lowering Loss in Low Reynolds Number Region. U.S. Patent No. 8,152,459, 10 April 2012. [Google Scholar]
  7. Culley, D.E.; Bright, M.M.; Prahst, P.S.; Strazisar, A.J. Active Flow Separation Control of a Stator Vane Using Surface Injection in a Multistage Compressor Experiment. J. Turbomach. 2003, 36894, 1039–1050. [Google Scholar]
  8. Culley, D.E.; Bright, M.M.; Prahst, P.S.; Strazisar, A.J. Active Flow Separation Control of a Stator Vane Using Embedded Injection in a Multistage Compressor Experiment. Am. Soc. Mech. Eng. 2004, 126, 24–34. [Google Scholar] [CrossRef]
  9. Wang, B.; Wu, Y.; Spence, S. Loss reduction in a high-speed compressor cascade using an L-shaped endwall groove to generate a streamwise vortex. Aerosp. Sci. Technol. 2022, 123, 107486. [Google Scholar] [CrossRef]
  10. Sun, J.; Ottavy, X.; Liu, Y.; Lu, L. Corner separation control by optimizing blade end slots in a linear compressor cascade. Aerosp. Sci. Technol. 2021, 114, 106737. [Google Scholar] [CrossRef]
  11. Abbott, F.T., Jr.; Library, I. Test of NACA 66,2-116, a = 0.6 airfoil section fitted with pressure balanced and slotted flaps for the wing of the XP-63 airplane. Tech. Rep. Arch. 1942, 41, 47–55. [Google Scholar]
  12. Landsberg, T.J.; Krasnoff, E. An Experimental Study of Rectilinear Jet-Flap Cascades. J. Fluids Eng. 1972, 94, 97–104. [Google Scholar] [CrossRef]
  13. Menter, F.R. Two-equation eddy-viscosity turbulence models for engineering applications. Aiaa J. 1994, 32, 1598–1605. [Google Scholar] [CrossRef]
  14. Dal Monte, A.; Castelli, M.R.; Benini, E. A retrospective of high-lift device technology. Int. J. Aerosp. Mech. Eng. 2012, 6, 2561–2566. [Google Scholar]
  15. Feng, Y.; Song, Y.; Chen, F. Numerical simulation of circulation control turbine cascade with Coanda jet and counter-flow blowing at high Mach numbers. Aeronaut. J. 2017, 121, 1239–1260. [Google Scholar] [CrossRef]
  16. Horn, J.; Nafploitis, N.; Goldberg, D.E. A niched Pareto genetic algorithm for multi-objectiveoptimization. In Proceedings of the First IEEE Conference onEvolutionary Computation, Orlando, FL, USA, 27–29 June 1994; IEEE Service Center: Piscataway, NJ, USA, 1994. [Google Scholar]
  17. Samad, A.; Kim, K.-Y. Shape Optimization of an Axial Compressor Blade by Multi-objective Genetic Algorithm. Proc. Inst. Mech. Engineers. Part A J. Power Energy 2008, 222, 599–611. [Google Scholar] [CrossRef]
  18. Ma, C.; Su, X.; Yuan, X. An Efficient Unsteady Adjoint Optimization System for Multistage Turbomachinery. J. Turbomach. 2017, 139, 11003. [Google Scholar] [CrossRef]
  19. Benini, E. Three-Dimensional Multi-Objective Design Optimization of a Transonic Compressor Rotor. J. Propuls. Power 2004, 20, 559–565. [Google Scholar] [CrossRef]
  20. Fonseca, C.M.; Fleming, P.J. Genetic Algorithms for Multiobjective Optimization: Formulation, Discussion and Generalization. In Proceedings of the Fifth International Conference on Genetic Algorithms, San Mateo, CA, USA, 17–21 July 1993. [Google Scholar]
  21. Deb, K.; Agrawal, S.; Pratap, A.; Meyarivan, T. A Fast Elitist Nondominated Sorting Genetic Algorithm for Multi-Objective Optimization: NSGA-II. In Proceedings of the 6th International Conference Parallel Problem Solving from Nature-PPSN VI, Paris, France, 18–20 September 2000. [Google Scholar]
  22. Jameson, A. Aerodynamic Shape Optimization Using the Adjoint Method; Von Karman Institute: Brussels, Belgium, 2003. [Google Scholar]
  23. Luo, J.; Zhou, C.; Liu, F. Multipoint Design Optimization of a Transonic Compressor Blade by Using an Adjoint Method. J. Turbomach. 2014, 136, 051005. [Google Scholar] [CrossRef]
  24. Bellman, M.; Straccia, J.; Morgan, B.; Maschmeyer, K.; Agarwal, R. Improving Genetic Algorithm Efficiency with an 19 Artificial Neural Network for Optimization of Low Reynolds Number Airfoils. In Proceedings of the 47th AIAA Aerospace Sciences Meeting including The New Horizons Forum and Aerospace Exposition, Orlando, FL, USA, 5–8 January 2009. [Google Scholar]
  25. Srinivas, N.; Deb, K. Multiobjective Function Optimization Using Nondominated Sorting Genetic Algorithms. Evol. Comput. 1995, 2, 221–248. [Google Scholar] [CrossRef]
  26. Zhang, J.; Du, J.; Zhang, M.; Chen, Z.; Zhang, H.; Nie, C. Aerodynamic Performance Improvement of a Highly Loaded Compressor Airfoil with Coanda Jet Flap. J. Therm. Sci. 2022, 31, 151–162. [Google Scholar] [CrossRef]
Figure 1. Geometry and model verification study; (a) 3D geometry of the Coanda jet flap, (b) 3D geometry of the Coanda jet flap with a fin, (c) computational domain and grid scheme, (d) grid dependency study, (e) contrast between the experimental and CFD results. and (f) Comparison of numerical simulation results between manuscripts and document.
Aerospace 12 00571 g001
Figure 2. Flow chart of the optimization process.
Aerospace 12 00571 g002
Figure 3. Four-degree Bessel curve and control points: (a) four-degree Bessel curve, (b) the control points of the fin, (c) the preoptimized fin and optimized fin.
Aerospace 12 00571 g003
Figure 4. The predicted and actual values. (a) The total pressure loss coefficient; (b) The endwall loss coefficient.
Aerospace 12 00571 g004
Figure 5. Response surface plots of ω in terms of (a) X1 and D1, (b) X2 and D2, (c) X3 and D3, and (d) X4 and D4 and response surface plots of ωet in terms of (e) X1 and D1, (f) X2 and D2, (g) X3 and D3, and (h) X4 and D4.
Aerospace 12 00571 g005
Figure 6. Sensitivity analysis. (a) The total pressure loss coefficient; (b) The endwall loss coefficient.
Aerospace 12 00571 g006
Figure 7. Pareto optimal solution calculated using NSGA-Ⅱ (the green color shows a possible feasible value): (a) (X1, D1) and ω, (b) (X2, D2) and ω, (c) (X3, D3) and ω, (d) (X4, D4) and ω; (e) (X1, D1) and ωet, (f) (X2, D2) and ωet, (g) (X3, D3) and ωet, (h) (X4, D4) and ωet.
Aerospace 12 00571 g007
Figure 8. Comparison of the static pressure and limiting streamlines: (a) original streamlines of the jet, (b) optimized streamlines of the jet, (c) original static pressure and limiting streamlines of the cascade suction surface, and (d) optimized static pressure and limiting streamlines of the cascade suction surface.
Aerospace 12 00571 g008
Figure 9. Mach number/flow line comparison of cascade axial section: (a) 20% blade height portions, (b) 50% blade height portions, (c) 80% blade height portions.
Aerospace 12 00571 g009
Figure 10. Comparison of the total pressure loss coefficient and endwall loss coefficient: (a) total pressure loss coefficient and (b) endwall loss coefficient.
Aerospace 12 00571 g010
Table 1. Zierke & Deutsch profile key parameters.
ParameterValue
Chord length62.1 mm
Pitch width29 mm
Solidity2.14
Stagger angle20.5°
Camber angle65.0°
Aspect ratio1.61
Inlet metal angle53°
Outlet metal angle12°
Table 2. The value ranges of the four coordinate points.
ParameterRange (mm)
(X1, D1)(5.2~7.2, 7.3~12.3)
(X2, D2)(5.2~7.2, 14.3~19.3)
(X3, D3)(2.6~4.6, 22~25)
(X4, D4)(1.5~3, 26~30)
Table 3. Optimal parameter combinations.
#1#2#3
(X1, D1)(7.1864, 10.6730)(7.1882, 9.0353)(7.1854, 9.0939)
(X2, D2)(7.1864, 19.2922)(7.1875, 19.2439)(7.1885, 19.2175)
(X3, D3)(4.5477, 24.9869)(3.8512, 24.9944)(4.5672, 24.9944)
(X4, D4)(1.8000, 30.7916)(1.8003, 30.7941)(1.8003, 30.7939)
ω0.06220.06210.0648
ωet0.06480.06200.0647
Disclaimer/Publisher’s Note: The statements, opinions and data contained in all publications are solely those of the individual author(s) and contributor(s) and not of MDPI and/or the editor(s). MDPI and/or the editor(s) disclaim responsibility for any injury to people or property resulting from any ideas, methods, instructions or products referred to in the content.

