Article

Constant Strain Aging Model of HTPB Propellant Involving Thermal–Mechanical Coupled Effects

1
National Key Laboratory of Solid Rocket Propulsion, Northwestern Polytechnical University, Xi’an 710072, China
2
The 41st Institute of the Fourth Academy of China Aerospace Science and Technology Corporation, Xi’an 710025, China
*
Author to whom correspondence should be addressed.
Aerospace 2025, 12(7), 589; https://doi.org/10.3390/aerospace12070589
Submission received: 15 May 2025 / Revised: 26 June 2025 / Accepted: 26 June 2025 / Published: 29 June 2025
(This article belongs to the Special Issue Combustion of Solid Propellants)

Abstract

To investigate the aging behavior of HTPB composite solid propellant under constant strain conditions, this study analyzed the aging patterns of the propellant’s maximum elongation at four temperatures (323.15 K–343.15 K) and five strain levels (0–18%) using thermal–mechanical coupled accelerated aging tests. The results show that the maximum elongation initially increases, then decreases under constant strain conditions. To measure the mechanical work-induced decrease in the activation motor, we created a modified Arrhenius model with a strain correction factor based on empirical observations. The acceleration coefficient of a solid motor grain at the accelerated aging temperature (323.15 K) in comparison to the long-term storage temperature (293.15 K) was found to be 20.08 through finite element analysis. This means 206.80 days at the accelerated aging temperature is equivalent to 10 years at the long-term storage temperature.

1. Introduction

Chemical rocket power units that use solid propellants are known as solid rocket motors. As a key energy source for rockets and missiles, the performance stability and reliability of the propellant are crucial for successful launches [1,2,3]. Solid motor grains are exposed to a range of complex loads during their service life. These loads include temperature cycling effects, gravitational load, curing and cooling stress, and vibration from transportation. During storage, the motor is constantly under stress or strain due to the interaction of these loads [4,5,6]. To guarantee the propellant’s reliability in practical applications, it is crucial to investigate its aging properties under varied circumstances.
Several researchers have studied the effect of constant strain on the aging performance of composite solid propellants. Chang et al. [7] explored the constant strain aging mechanism of propellants, particularly HTPB propellants, and identified that chemical aging and interfacial damage between bonding agents and fillers are two competing factors that determine the mechanical properties of HTPB propellant aging under constant strain. Li et al. [8] discovered that the aging of HTPB propellant is initially dominated by molecular chain breakage, followed by oxidative cross-linking, as revealed by molecular dynamics simulations coupled with experimental data. This process is accelerated under constant strain. Zeng et al. [9], through thermal–mechanical coupled aging experiments, demonstrated that coupled aging has a more significant effect on HTPB propellant than either thermal or mechanical aging alone in the temperature range of 323–363 K. Wei et al. [10] developed a constant strain–temperature cyclic accelerated test method and determined an equivalent von Mises strain of 9.4% via finite element analysis. This was combined with a modified Coffin-Manson model to predict a minimum storage life of 20 years. Dong et al. [11] used NEPE propellant as the subject of study and conducted high-temperature accelerated aging experiments under a constant strain of 10%. He employed various aging performance testing methods to examine the propellant’s performance characteristics during the aging process from three perspectives: appearance morphology, key component content, and mechanical properties. Zhou et al. [12,13] investigated the effect of accelerated aging under pre-strain on the maximum elongation of a composite solid propellant and established an aging model to analyze the impact of temperature and pre-strain on the model parameters. Geng et al. [14] advanced the field by formulating a coupled physical–chemical degradation model that integrates the WLF equation with the Arrhenius equation. This model was substantiated using 22–26 years of natural storage data, showing a prediction error of only 7.5%. Remarkably, this represents an accuracy enhancement of 75% compared to conventional methods. Zhang et al. [15] incorporated the stress factor into the dynamic equation, establishing a correlation between stress and propellant service life. His approach effectively forecasts the aging behavior of propellants, offering foundational insights for designing acceleration tests. For instance, the low-temperature stress equivalent acceleration method, developed by Zhang et al. [16], has been adeptly utilized in evaluating the lifespan of motors.
Maximum elongation, a crucial mechanical property parameter of HTPB propellant that varies during storage, plays a pivotal role in determining the structural integrity of solid motor grains. This is particularly significant in light of potential failures due to the degradation of mechanical properties [17,18,19]. Furthermore, since the aging process of propellants is inherently slow, it necessitates high-temperature accelerated aging tests to emulate several years of aging behavior under actual storage conditions within a shorter timeframe. Regrettably, while Zhou et al. [13] proposed an aging model for HTPB propellant, this model only considers the impacts of pre-strain and temperature on its parameters. It does not provide a comprehensive aging model that accounts for performance changes under consistent temperatures and stresses. Consequently, it falls short in effectively guiding accelerated aging tests based on the strains experienced by the solid motor combustion chamber grains at varying temperatures.
The aging performance of a HTPB propellant is examined in this work at different strain levels (0–18%) and temperatures (323.15–343.15 K). A strain modification coefficient was used in order to measure the mechanical work. A modified Arrhenius model was also developed. Solid motor grains are produced by following these procedures. An accelerated aging test at high temperatures was then used to simulate how long these grains could be stored at a specific temperature over a number of years.

2. Experiment

2.1. Sample Preparation

The HTPB solid propellant specimen was mainly composed of 68 mass-% of AP, 17 mass-% of Al, 10.86 mass-% of HTPB, 3.5 mass-% of DOS, 0.09 mass-% of TDI, 0.06 mass-% of methyl MAPO, 0.06 mass-% of DPPD, and 0.37 mass-% of a few other minor components. Initially, a predetermined ratio was used to blend raw components from the same batch. Once the HTPB propellant square billet was produced and cured for seven days at 331.15 K (according to the type B uniaxial tensile specimen size specified in method 413.1 of the standard GJB 770B-2005 “Gunpowder Test Method” [20]), the specimen was reshaped to have a standard dumbbell-shaped form (Figure 1).

2.2. Thermal Accelerated Aging Test for Propellants

The type of propellant and the test’s objective dictate the test temperature selection. However, there is frequently a contradiction when deciding on the temperature for thermally accelerated aging. The following guidelines are typically followed when choosing temperature points for artificially accelerated aging experiments in order to resolve this contradiction:
(1).
To increase accuracy, the lowest temperature should be as near to the propellant’s typical storage temperature as feasible. However, it must not be too close, or the experiment will take too long.
(2).
In order to ensure safety and avoid altering the failure mechanism, the maximum value of the accelerated aging temperature should be determined. The temperature that can provide the highest acceleration effect should be chosen to the greatest extent feasible.
(3).
Generally speaking, three to five is the number of acceleration temperature points. A lower value will impact the statistical analysis accuracy, while a higher value will result in higher test costs.
Based on the aforementioned considerations, four temperatures, 323.15 K, 333.15 K, 338.15 K, and 343.15 K, were chosen for the test in this work. The aging temperature deviation was kept under ±0.5 K during the whole aging test procedure.
Additionally, in the accelerated aging test, the following variables are mostly taken into account when determining the constant strain value:
(1).
Over the course of its whole life cycle, a solid rocket grain’s propellant grain can experience a maximum strain of 16.3% while being stored.
(2).
A safety buffer of 10% was taken into account based on the maximum strain.
(3).
Three intermediate strain levels, ranging from 0% to 18%, were established.
The accelerated aging test in this research chose five constant strains—0%, 8%, 12%, 15%, and 18%—based on the aforementioned guidelines.
Table 1 and Table 2 provide a detailed description of the precise sampling techniques used for the specimens at each aging temperature condition.
Immediately after preparation, propellant specimens under zero strain conditions had to be vacuum sealed in aluminum foil bags to ensure correct labeling. Heat preservation was then applied to the packaged specimens at the predetermined aging temperatures listed in Table 1 while they were kept in a temperature-controlled aging chamber. The specimen was removed for additional mechanical property investigation after the specified age period was over.
In the accelerated aging test of the propellant, the constant strain ε M i s of the propellant is defined as
ε M is = l l 0 l 0
where l represents the gauge length of the specimen after tensile testing, and l 0 is the initial gauge length. Based on the measured data of the initial gauge length of the propellant specimens and the preset constant strain level value ε M i s , the final tensile length required for each specimen to reach the target strain value ε M i s can be calculated through Equation (1).
For propellant specimens under non-zero strain conditions, the constant strain loading device shown in Figure 2 is used to slowly stretch the specimens to the length corresponding to the target strain value (8%, 12%, 15%, or 18%) using a quasi-static loading method. The specimen and fixture were properly marked and sealed in an aluminum foil bag when the strain steadied. At the temperatures listed in Table 2, the packaged specimens were exposed to accelerated aging while kept in a temperature-controlled environment. Following the aging time, the fixtures were emptied, and the specimens were removed in order to be ready for the next round of mechanical property testing.

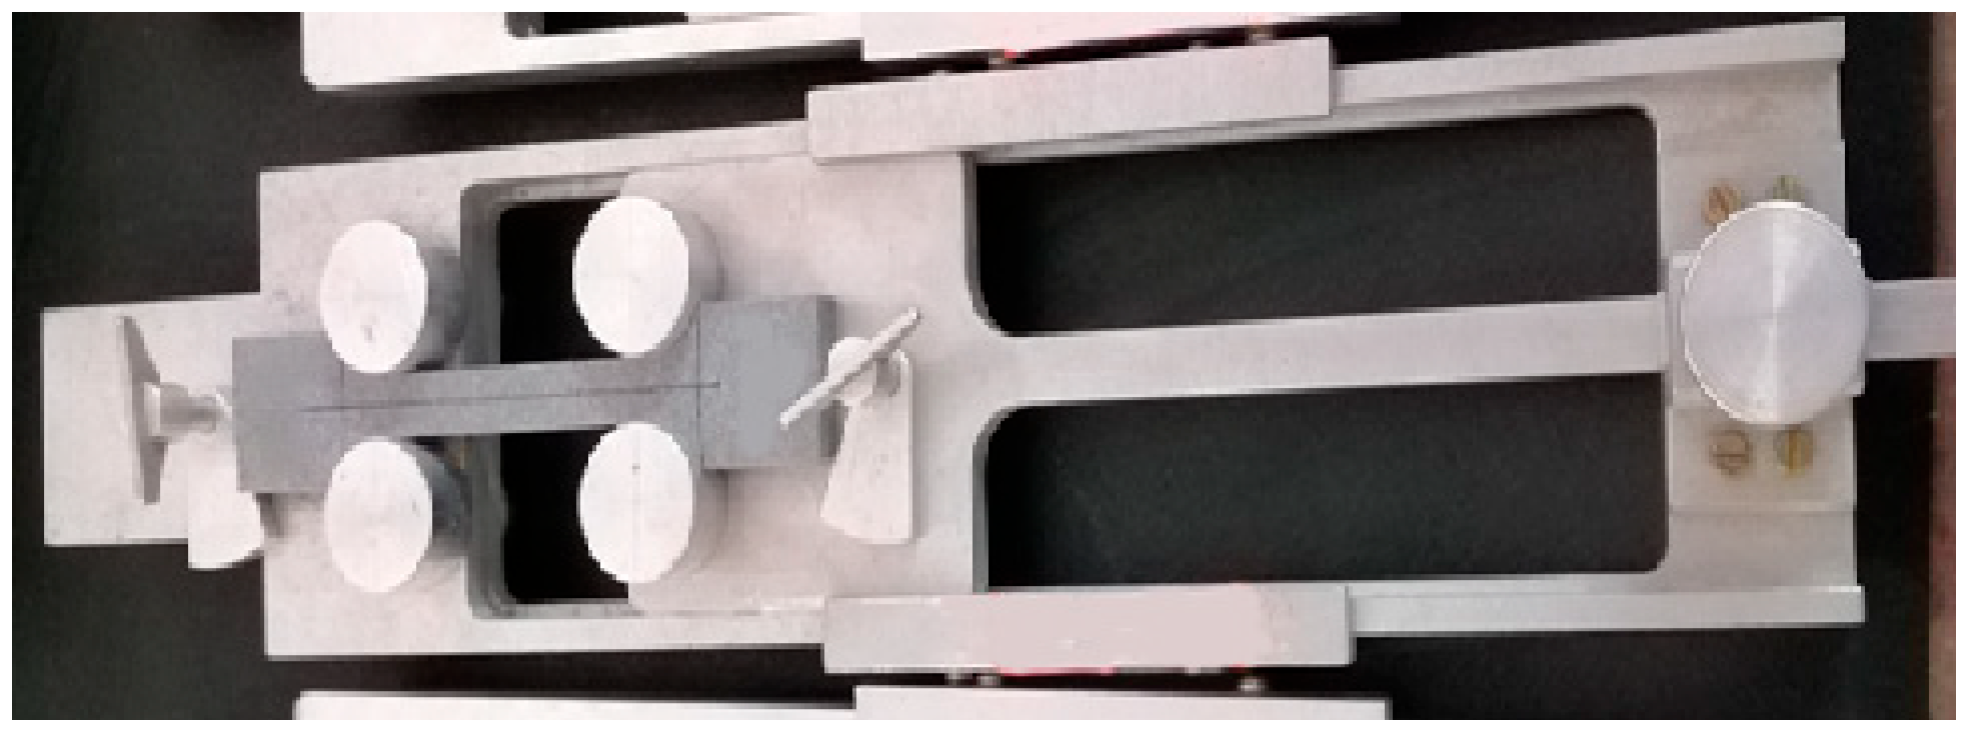
2.3. Propellant Mechanical Property Testing

Upon completion of the aging test, all propellant samples were transferred to sealed glass desiccators containing desiccants. They were allowed to stand at room temperature for a period of 24 h to negate any potential effects of viscoelastic recovery and environmental humidity on their mechanical properties. Subsequently, uniaxial tensile tests were performed using the universal testing machine, with an accuracy of ±0.5% in its load cell. The tests were conducted at a constant temperature of 293.15 K ± 0.5 K, with a loading speed set at 100 mm/min.

3. Test Results and Discussion

According to the existing research [14,21], the HTPB propellant’s maximum elongation, ε m , a crucial factor in determining the material’s ductility, is extremely vulnerable to the aging state. This characteristic is one of the most important performance markers as the propellant ages. Additionally, it is a crucial mechanical performance parameter that needs to be carefully taken into account when designing the propellant.
The ε m degradation curves for the HTPB propellant at four different aging temperatures—323.15 K, 333.15 K, 338.15 K, and 343.15 K—are plotted against aging time, t, in Figure 3a–d. Constant strain levels of 0%, 8%, 12%, 15%, and 18% are represented by each curve.
Figure 3a–d illustrate the aging behavior of the HTPB propellant under zero strain conditions. The pattern is a typical monotonic attenuation mode, with the ε m decreasing continuously as the aging time advances. This observation aligns with the general understanding of HTPB propellant aging [22,23].
However, under a constant strain condition of 8~18%, the evolution of ε m exhibits markedly distinct characteristics, specifically evident as
(1).
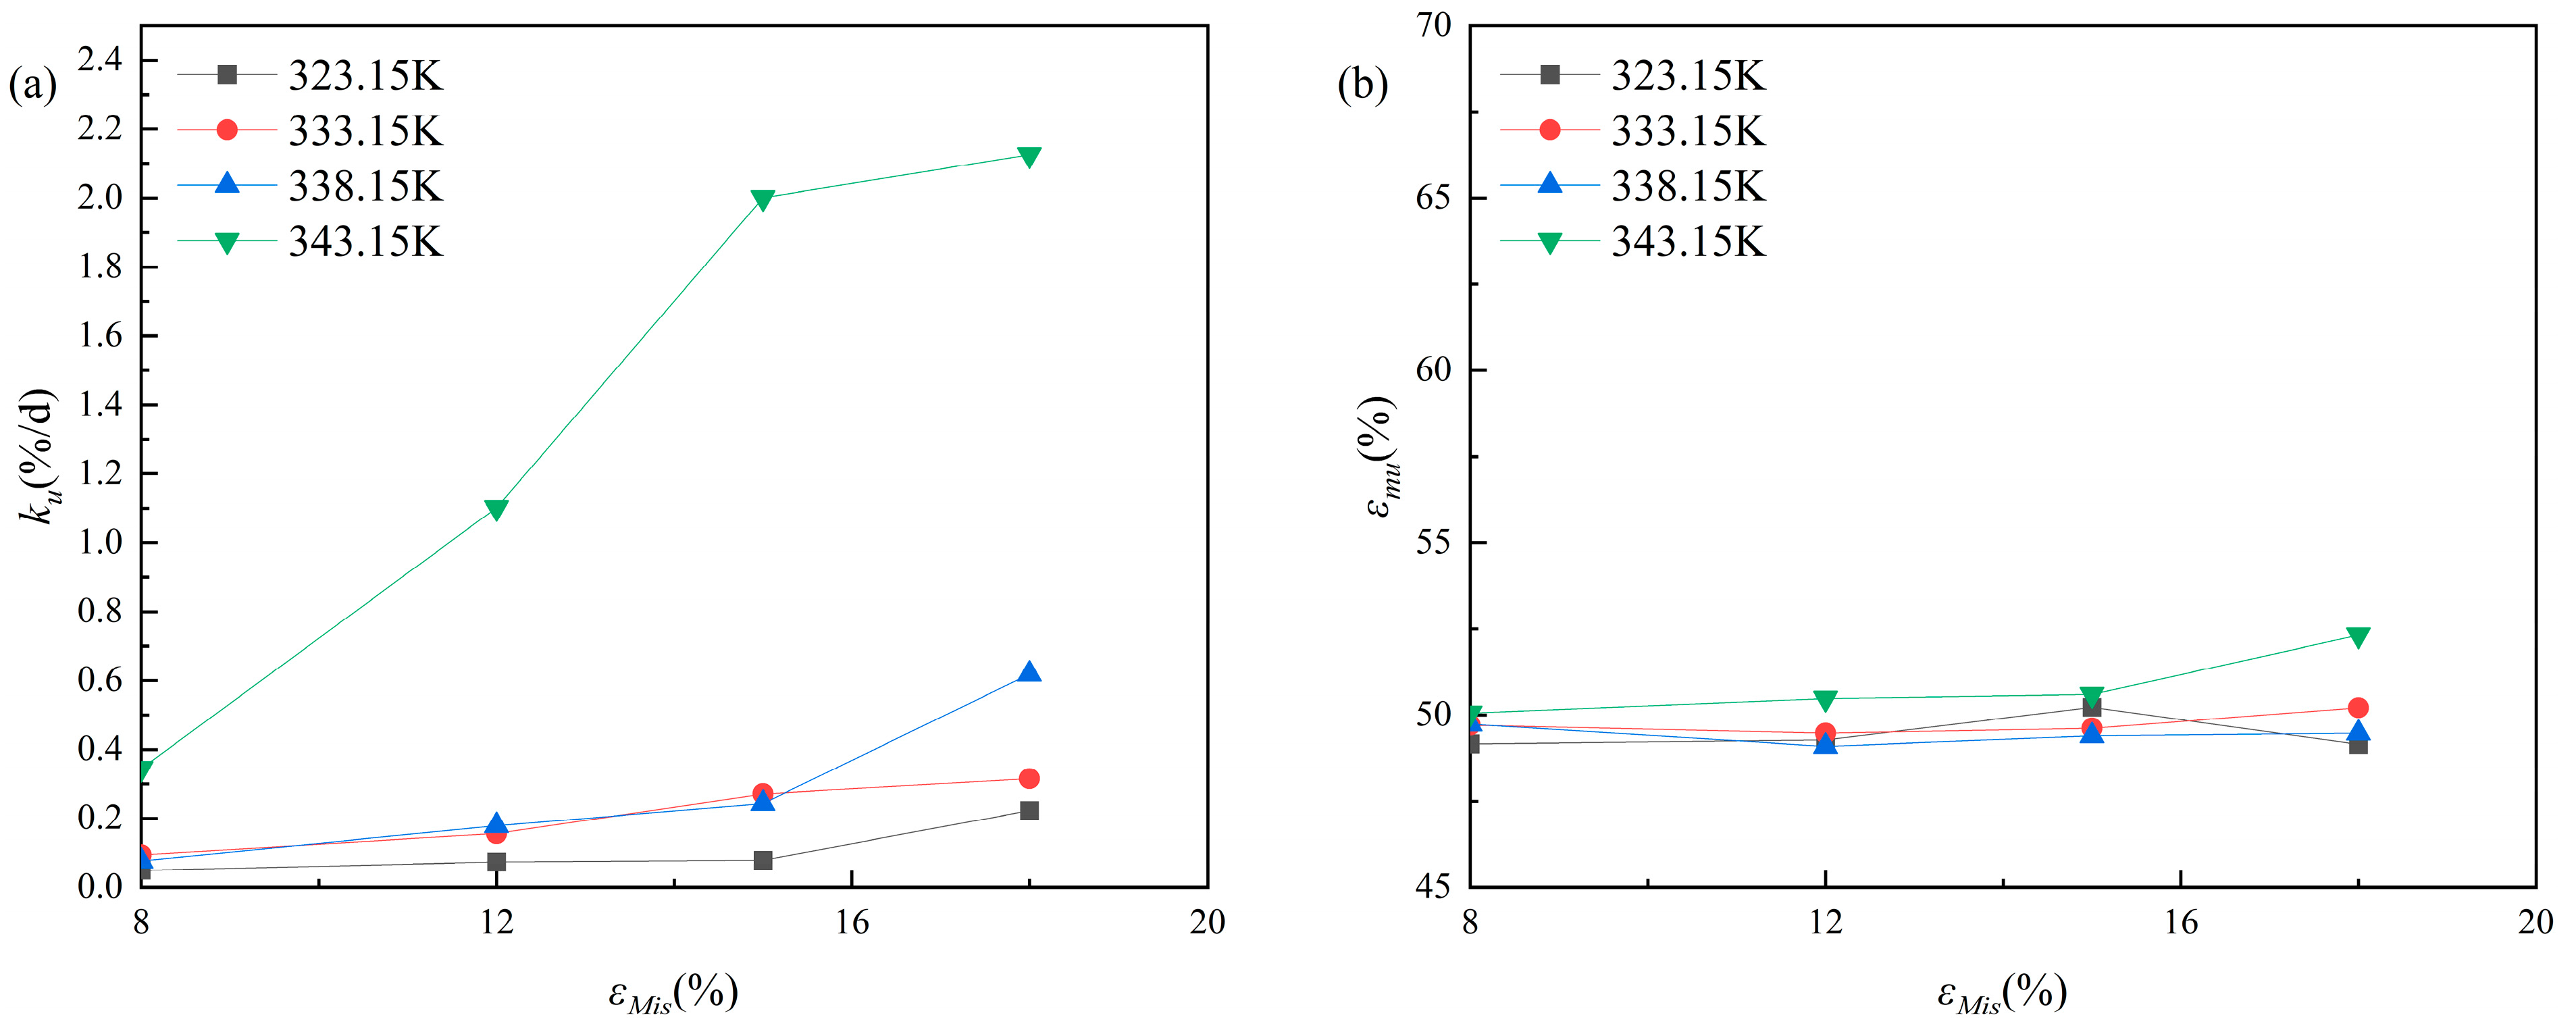
Two-stage aging dynamics:
Initial rising phase: ε m increases with the aging time, reaching a peak before transitioning to a decline. This trend is observed under strain conditions ranging from 8% to 18%.
Subsequent decline stage: ε m begins to decrease monotonically, following a degradation pattern similar to zero strain condition.
(2).
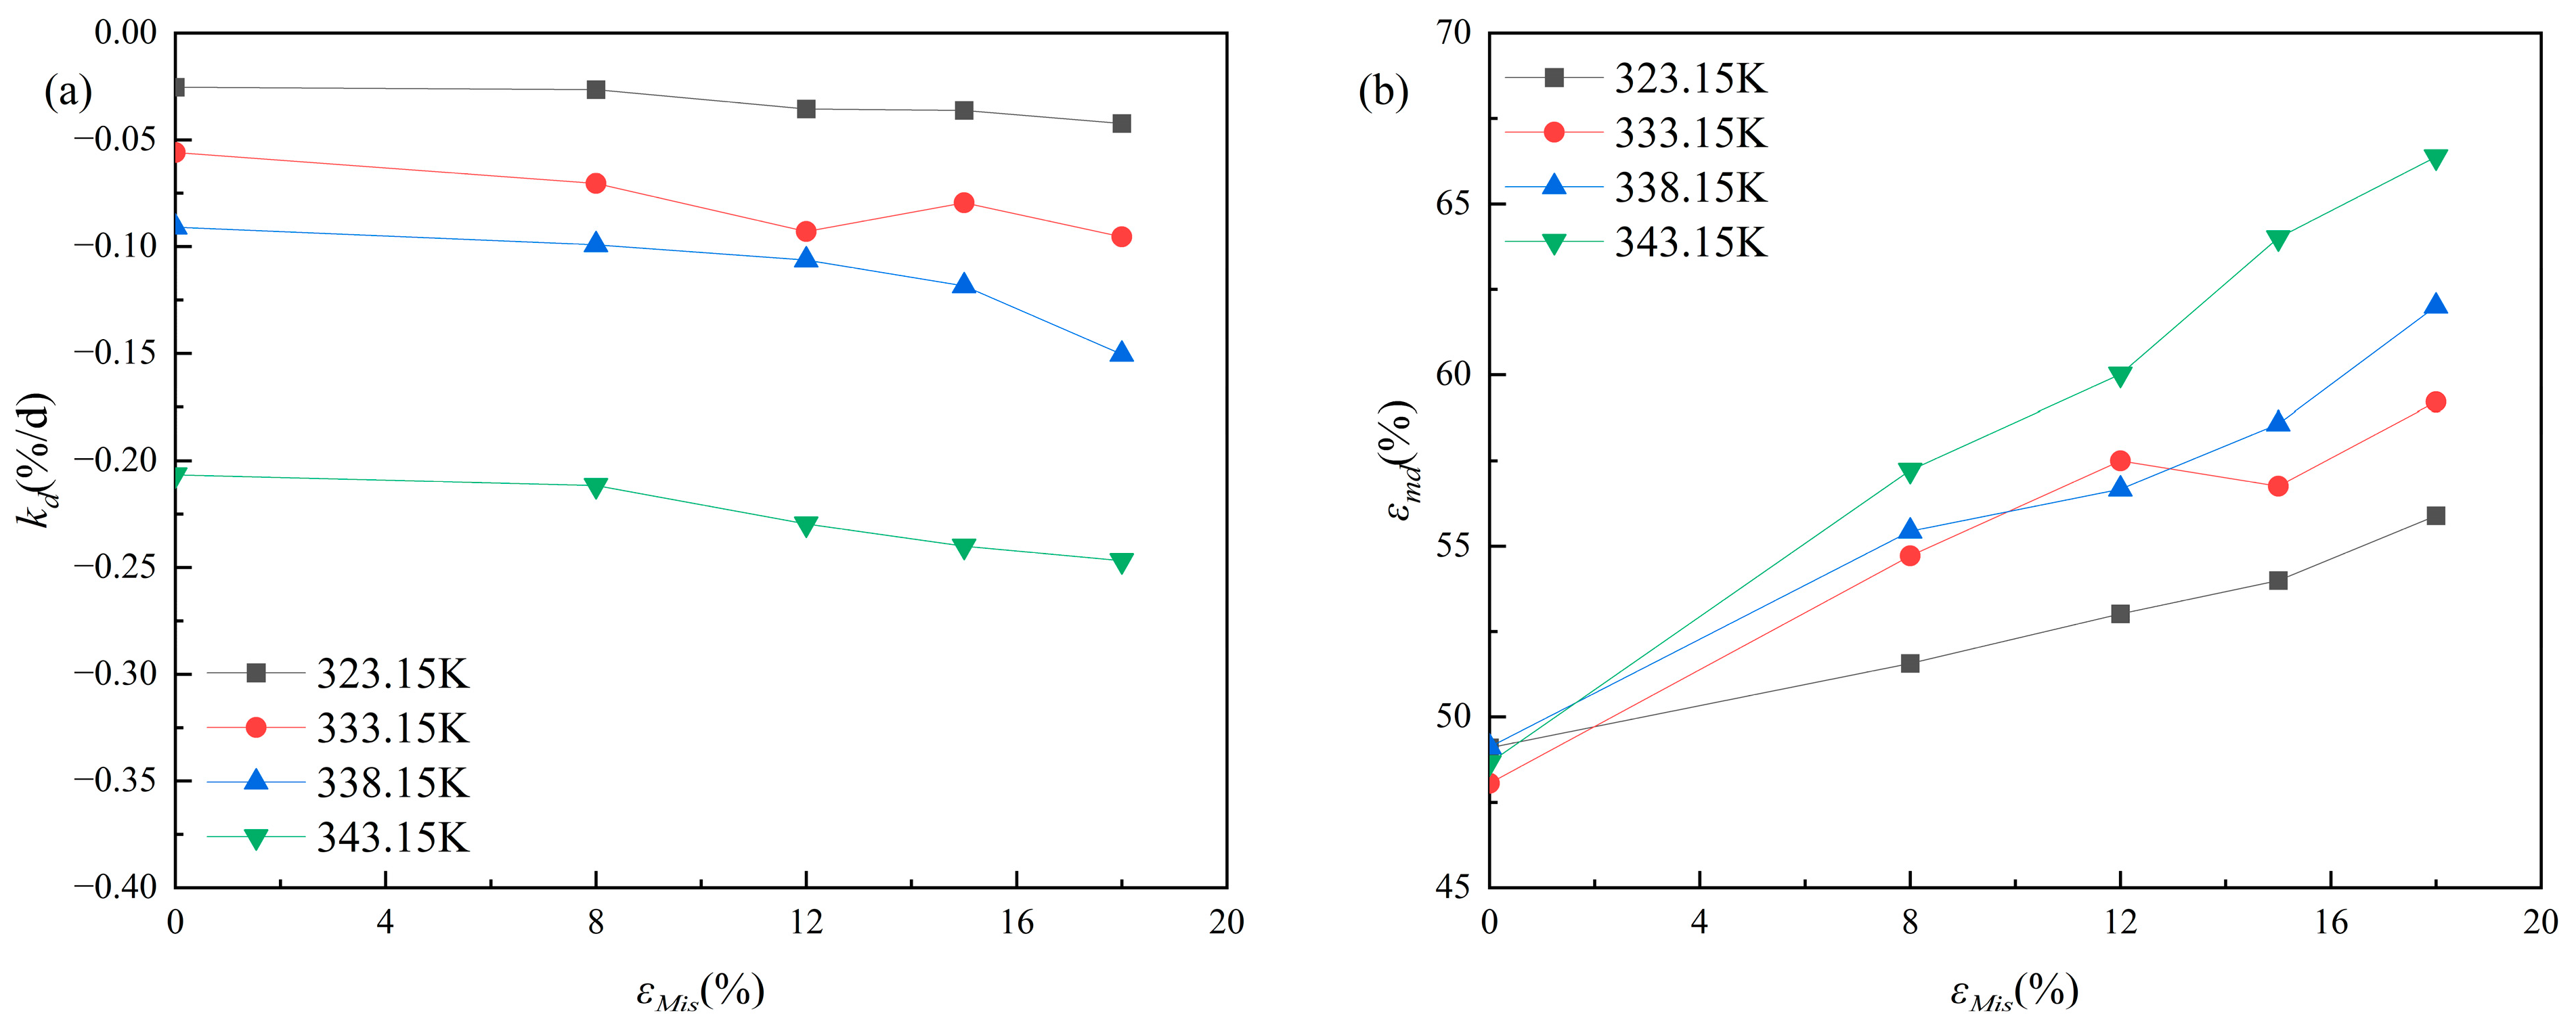
Competing mechanisms of physical and chemical aging
During the period when physical aging is dominant, the applied constant strain causes the HTPB molecular chains to extend from their initial curled state and realign along the stress direction. This process increases the elongation of the propellant [8]. The initial increase in ε m is a result of the temporary halting of chemical aging brought about by the unfolding of molecular chains. However, as the propellant ages, the internal stress progressively decreases [24], allowing chemical aging to become increasingly dominant. During this phase, the lattice structure of the propellant begins to cross-link or degrade progressively, resulting in a decrease in elongation.

4. Aging Model

4.1. Model of the Maximum Elongation of the Propellant and Aging Time

The correlation between the maximum elongation of a HTPB propellant at a specific aging temperature and the corresponding aging time is commonly characterized by either a linear model or an exponential decay model.
The linear model:
ε m = ε m 0 k t
The exponential decay model:
ε m = ε m 0 e k t
where t is the aging time, ε m indicates the maximum elongation at time t , ε m 0 indicates the initial maximum elongation, and k is the aging rate constant of ε m .

4.1.1. Model of the Maximum Elongation and Aging Time for the Propellant Under Zero Strain

As shown in Figure 3, the propellant ε m consistently decreases monotonically over aging time under zero strain conditions. A linear aging model has been applied to fit the experimental data using the least square method. The results derived from this fitting process are displayed in Table 3. Notably, the determination coefficient, R 2 , has a 90% confidence probability ( R c r i t 2 = 0.622, degrees of freedom n − 2 = 6) and exceeds the crucial correlation coefficient for all temperature circumstances. This indicates a high degree of fitting accuracy for the test data.

4.1.2. Model of the Maximum Elongation and Aging Time for the Propellant Under Constant Strains

The propellant ε m shows a two-stage evolution with aging time under different strain circumstances, as shown in Figure 3, with, first, a rising phase and then a subsequent decline phase. Table 4 summarizes the findings of fitting the experimental data to a linear aging model. With the exception of the two high-strain circumstances of 333.15 K/18% and 343.15 K/18%, the critical value is exceeded for the remaining working conditions during the ascending phase at a 90% confidence level. This shows that the linear model works well for most of the data in the ascending segment.
According to the analysis of the fitted data in Table 4, the linear regression parameters (intercept ε m u and slope k u ) for the rising phase and the linear regression parameters (intercept ε m d and slope k d ) for the decline phase can be obtained separately.

4.1.3. Analysis of the Model Parameters for the Maximum Elongation and Aging Time

k u , which indicates the performance variation during the rising phase of maximum propellant elongation, has been fitted to a constant strain value ε M i s at different aging temperatures, as shown in Figure 4a. k u displays a significant synergy between strain and temperature; it increases with higher ε M i s values at the same aging temperature and also with increasing the temperature under constant strain conditions.
The relationship between ε m u and the constant strain value ε M i s for the rising phase is depicted in Figure 4b. It is evident that ε m u remains relatively consistent across various temperature–strain combinations.
Figure 5a shows the relationship of k d during the decline phase of the propellant ε m to ε M i s at different aging temperatures. It was found that k d dropped when the ε M i s increased under the same aging temperature conditions. Likewise, an increase in the aging temperature led to a drop in k d , while the constant strain conditions were unchanged.
Figure 5b shows the relationship of ε m d to the constant strain value ε M i s at different aging temperatures during the decline phase of the propellant ε m . At the same aging temperature, as the constant strain ε M i s increases, so does ε m d . The fluctuation law of ε m d with the aging temperature is not evident when the constant strain values are the same.

4.2. Modeling of the Aging Parameters

4.2.1. Parametric Modeling of Aging Under Zero Strain

The correlation between the velocity constant of the propellant’s maximum elongation aging and temperature aligns with the principles of the Arrhenius equation [25].
k ( T ) = Z exp ( E a R T )
where k ( T ) represents the aging rate constant of the propellant ε m at a temperature denoted as T . The term Z refers to the pre-exponential factor, while E a signifies the aging activation energy, R is defined as the gas constant, and T is the thermodynamic temperature.
Converting Equation (4) to
ln k ( T ) = ln Z E a R T
Let Y = l n k ( T ) , X = 1 / T , a = l n Z , a n d   b = E a / T , then Equation (5) is transformed into a linear equation:
Y = a b X
Based on the above equation, a quantitative definition of the relationship between k(T) and T under zero strain conditions was established. Table 5 showed the results of this analytical procedure, and the standard errors at the 95% confidence level of a and b are 4.746 and 1585.9, respectively. It is noteworthy that the precision of the model fitting surpasses the critical value of the correlation coefficient by a significant margin, with a confidence probability of 90%. This implies that the propellant’s aging rate constant at zero tension is consistent with the Arrhenius model.
According to the linear fitting relationship, the confidence limit of Y after fitting is
Y = a b X ± t α Y S Y
where SY is the standard deviation of Y . When the degree of freedom is (n − 1) and the confidence probability is (1 − α), the t-distribution value is denoted by t α Y . Four sets of data for zero strain are used in this paper.
S Y = L Y Y b L X Y n 2 1 + 1 n + ( X X ¯ ) 2 L X X
L Y Y = i = 1 n ( Y Y ¯ ) 2
L X X = i = 1 n ( X X ¯ ) 2
L X Y = i = 1 n ( X X ¯ ) ( Y Y ¯ )
X ¯ = i = 1 n X i n
Y ¯ = i = 1 n Y i n
Then, considering the confidence limit of the propellant under zero strain conditions, the aging rate constant of the propellant is
k ( T ) = exp ( 30.765 11159.7 T ± t α Y S Y )

4.2.2. Parametric Modeling of Aging Under Constant Strain

The primary objective of conducting thermally accelerated aging tests on HTPB propellant is to expedite the dynamic process of internal chemical reactions within the material by elevating the ambient temperature. This approach simulates the aging behavior under actual storage conditions over several years within a condensed timeframe, allowing for the observation of the propellant’s performance degradation law. Therefore, while the maximum elongation of propellant subject to constant strain initially increases and subsequently decreases with the aging time, this study primarily focuses on the propellant’s decline process.
HTPB propellant, a type of polymer, performs mechanical work ( W e ) on the propellant under constant strain ( ε M i s ). This mechanical work mitigates some of the energy barriers necessary for the reaction, leading to a reduction in activation energy [15,18,26,27].
Suppose the mechanical work caused by strain is
W e = γ ε M i s
where γ is the strain correction factor, which indicates the amount of energy that a unit strain contributes by changing the microstructure of the material (such as bond stretching and defect propagation).
Then, the modified activation energy is
E e f = E a W e = E a γ ε M i s
Together with Equation (4), the relationship between the aging rate constant of ε m and the aging temperature T , the constant strain ε M i s is [15]
k ( T , ε M i s ) = Z exp ( E e f R T ) = Z exp ( E a γ ε M i s R T )
where k ( ε M i s , T ) represents the aging rate constant of ε m at the temperature T and constant strain ε M i s . The definitions and specific values of Z , E a , and R are the same as those under zero strain.
Equation (17) can be converted to
ln k ( T , ε M i s ) = ln Z E a γ ε M i s R T
Let Y = l n k ( ε M i s , T ) ,   X 1 = ε M i s , X 2 = 1 / T , a = l n Z ,   b = E a / T , and c = γ / R . Then, Equation (18) is transformed into a linear equation:
Y = a + ( b c X 1 ) X 2
where   a = 30.765   a n d   b = 11159.7 are obtained by fitting the aging test results of the propellant under zero strain.
Rewrite Equation (19) as follows:
Y a b X 2 = c X 1 X 2 + ξ
where ξ is the error term of the fit, and ξ ~ n ( 0 , σ 2 ) is assumed to be used to calculate the confidence bounds.
Let
Z = Y a b X 2
Then, the model simplifies to
Z = C X 1 X 2 + ξ
Convert to a univariate linear regression model about c .
The minimized residual sum of squares fitted by the least squares method is
R S S = i = 1 m ( Z i + c X 1 i X 2 i ) 2
Take the partial derivative with respect to c and set the derivative to zero:
R S S c = 2 i = 1 m ( X 1 i X 2 i ) ( Z i + c X 1 i X 2 i ) = 0
Expand it as
i = 1 m X 1 i X 2 i Z i + c i = 1 m ( X 1 i X 2 i ) 2 = 0
The solution is
c ^ = i = 1 m X 1 i X 2 i Z i i = 1 m ( X 1 i X 2 i ) 2
The aging rate constant of ε m at the T and ε M i s , as determined by the experiment, was fitted to the temperature using the equation above. Table 6 and Figure 6 exhibit the fitting findings, and the standard error at the 95% confidence level of c is 88.334.
According to Equation (19), the variance in predicted values of Y , based on X 1 and X 2 , primarily comprises the estimated variance in parameter values and the error term’s variance. Consequently, the total variance is
V a r ( Y ^ ) = V a r ( a ) + X 2 2 V a r ( b ) + ( X 1 X 2 ) 2 V a r ( c ) +   2 X 2 C o v ( a , b ) 2 X 1 X 2 2 C o v ( b , c ) + σ 2
Since a   a n d   b have been fixed and their error terms are given in Equation (7), only the equations and error terms that need to be considered are
V a r ( Y ^ ) ( X 1 X 2 ) 2 V a r ( c ) + σ 2
For Equation (22),
V a r ( c ) = σ 2 i = 1 m ( X 1 i X 2 i ) 2
The standard deviation considering only the predicted value of c is
S D = σ ^ ( 1 + ( X 1 X 2 ) 2 i = 1 m ( X 1 i X 2 i ) 2 )
σ ^ 2 = i = 1 m ( Z i + c X 1 i X 2 i ) 2 m 1
Then, the confidence limit of Y after fitting is
Y = a + ( b c X 1 ) X 2 ± t α D S D ± t α Y S Y
When the degree of freedom is (m − 1) and the confidence probability is (1 − α), the t-distribution value is denoted by t α D . There are twenty sets of data for the definite strain in all this publication.
The aging rate constant of the propellant considering the confidence limit under constant strain conditions is
k ( T , ε M i s ) = exp ( 30.756 11159.7 712.487 ε M i s T ± t α D S D ± t α Y S Y )

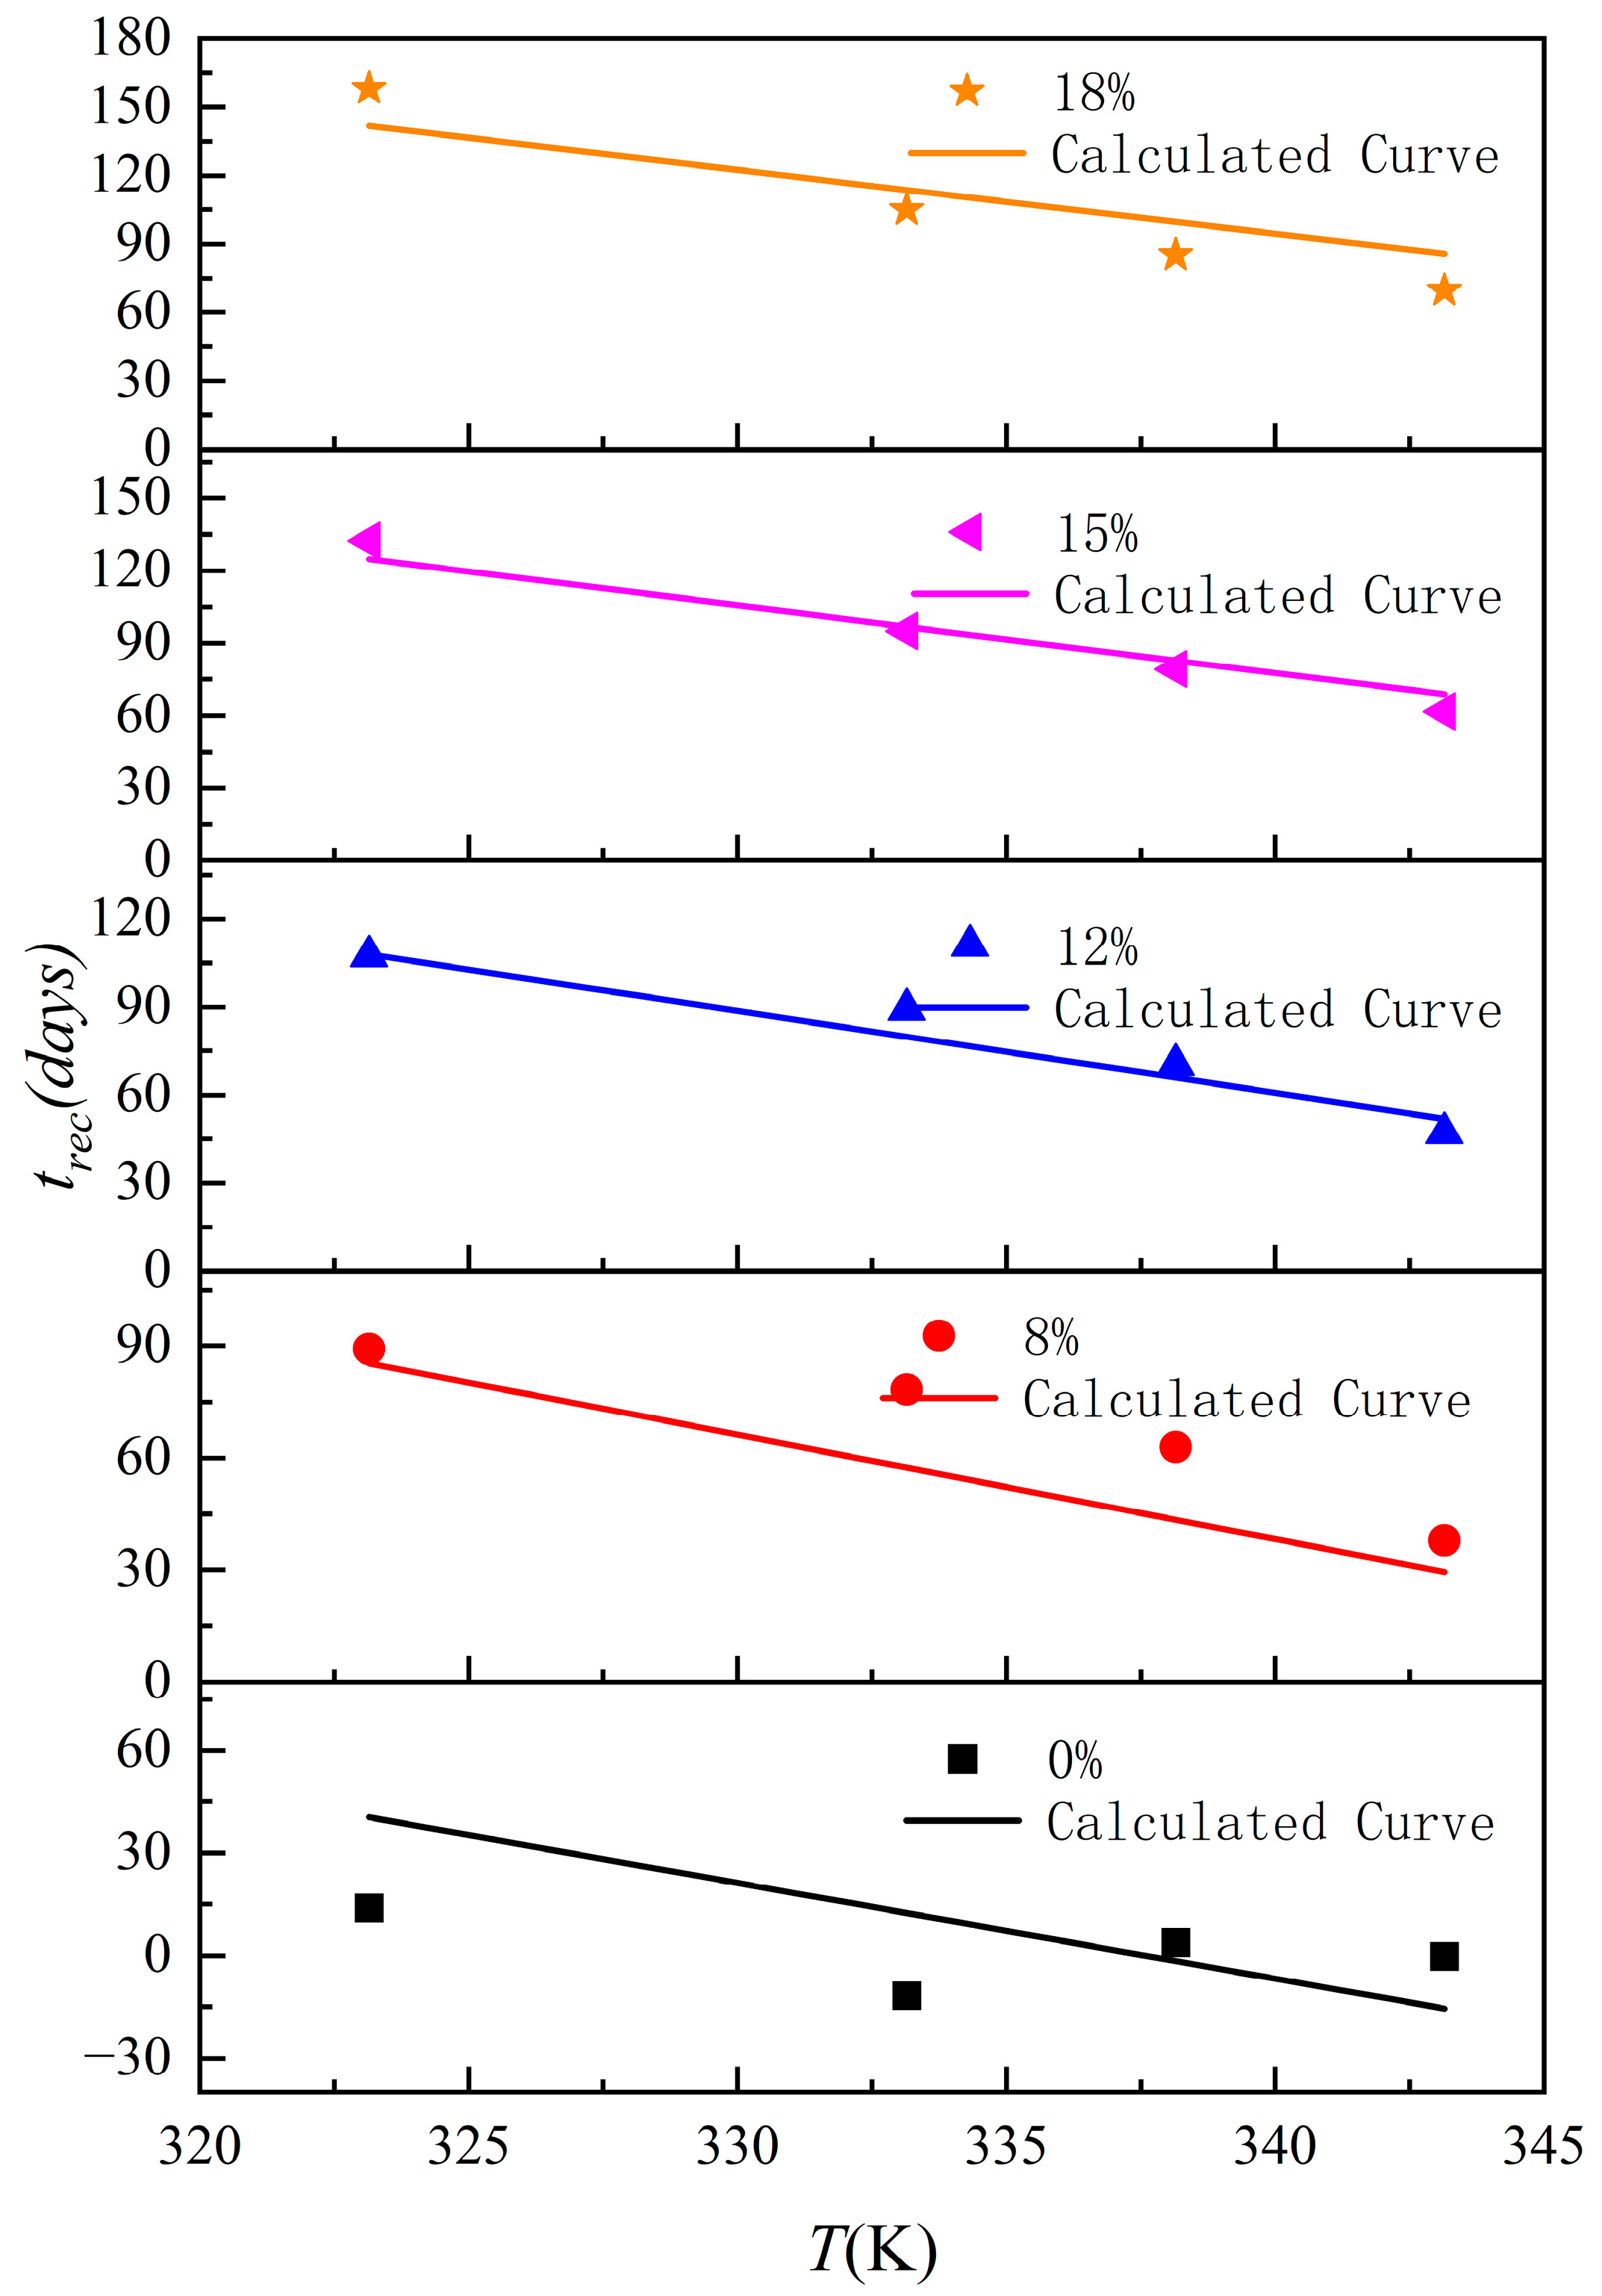
4.2.3. Elongation Recovery Time Model

The phenomenon of HTPB propellant maximum elongation entails an initial increase followed by a decrease under constant strain aging. Thus, after a sufficient aging period, the propellant inevitably reverts to ε m 0 . This process is schematically represented in Figure 7. We define t r e c as the elongation recovery time.
The fitting results ( ε m d and k d ) and the initial maximum elongation of the propellant ( ε m 0 ) in Table 4 reveal that, under different constant strains ( ε M i s = 8 18 % ) and aging temperatures (T = 323.15–343.15 K), the elongation recovery time, t r e c , can be calculated. The relationship between t r e c and the aging temperature under different constant strains is depicted in Figure 8. It is evident that, as the aging temperature increases, t r e c remains consistent across different constant strains but significantly decreases. Conversely, when the aging temperature remains constant, t r e c increases in proportion to the increase in the constant strain. Furthermore, there is an approximate linear relationship between t r e c and both the aging temperature and the constant strain level.
The relationship between t r e c and aging temperature and constant strain can be described as
t r e c ( T , ε M i s ) = γ ε ε M i s + γ T T + t r e c 0
where γ ε is the strain restitution coefficient of the propellant, γ T is the temperature restitution coefficient of the propellant, and t r e c 0 is a constant.
Obviously, Equation (34) is a binary linear model, which can be represented by a matrix as
Y = X β + ξ
where
Y = t r e c , 1 t r e c , 2 t r e c , m
X = 1 ε M i s , 1 T 1 1 ε M i s , m T m
β = t r e c 0 γ ε γ T
ζ = ξ 1 ξ 2 ξ m
where ζ is the error term of the fit, and ζ ~ 0 , σ 2 is assumed to be used to calculate the confidence bounds.
Minimize the residual sum of squares as
S S E = i = 1 m ( t r e c , i t ^ r e c , i ) 2 = ( Y X β ) T ( Y X β )
Take the derivative of S S E with respect to β and set the derivative to zero:
S S E β = 2 X T ( Y X β ) = 0
Then,
X T X β = X T Y
When X T X is reversible,
β ^ = ( X T X ) 1 X T Y
After fitting the data in Figure 8, the values of γ ε , γ T , and t r e c 0 are 562.42 d/%, −2.799 d/T, and 944.91 d, respectively. The correlation coefficient was 0.951.
The fitting result relationship between t r e c and T under different constant stresses is displayed in Figure 9. The figure indicates good accuracy in fitting the data.
The expectation E ( β ^ ) and variance C o v ( β ^ ) for the predicted values are
E ( β ^ ) = β
C o v ( β ^ ) = σ 2 ( X T X ) 1
The sum of squared residuals S S E is
S S E = Y T Y β ^ X T Y
σ 2 = S S E m p
where p = 3 is the parameter to be fitted in Equation (34), and m = 20 is the total number of test groups under constant strain.
For the given x 0 = ( 1 , ε M i s 0 , T 0 ) T , there is
y ^ 0 = x 0 T β ^
V a r ( y ^ 0 ) = σ 2 x 0 T ( X T X ) 1 x 0
The standard error of the predicted value is
S r e c = σ ^ 2 ( 1 + x 0 T ( X T X ) 1 x 0 )
Then, under the condition of constant strain, the elongation recovery time limit of the propellant is
t r e c ( T , ε M i s ) = 562.42 ε M i s + 2.799 T + 944.91 ± t α S r e c

5. Accelerated Aging Coefficients of Grains

Once cast, the solid propellant slurry undergoes a high-temperature curing process. After the curing reaction is completed, the temperature of the grains gradually decreases to match the ambient temperature. During this process, discrepancies arise due to the different thermal expansion coefficients of the shell material, insulation layer, and propellant. These differences lead to inconsistent contraction among the various components, causing the grains to experience constrained contraction and deformation. Consequently, a residual thermal stress/strain field develops within the grains. The curing temperature is generally considered as the zero stress temperature reference for the grains, where the thermal strain of the grains is eliminated.

5.1. Theoretical Model of Accelerated Aging

The motor grains are made of a HTPB solid propellant, the temperature of long-term storage is T s t , and the maximum strain of the grains under T s t is ε s t ; then, the upper limit of the aging rate constant of the propellant under this condition, k ( T s t , ε s t ) , and the elongation recovery time, t r e c T s t , ε s t , are, respectively,
k ( T s t , ε s t ) = exp ( 30.756 11159.7 712.487 ε s t T s t + t α D S D + t α Y S Y )
t r e c ( T s t , ε s t ) = 562.42 ε s t + 2.799 T s t + 944.91 t α S r e c
An accelerated aging test on the motor is required to evaluate the performance of the combustion chamber grain during storage time, represented as t s t . T a c is the temperature at which this accelerated aging process occurs. The grain experiences its maximum strain, represented by ε a c , at this temperature. t r e c T a c , ε a c and k ( T a c , ε a c ) for the propellant at the accelerated aging temperature can thus be found.
k ( T a c , ε a c ) = exp ( 30.756 11159.7 712.487 ε a c T a c + t α D S D + t α Y S Y )
t r e c ( T a c , ε a c ) = 562.42 ε a c + 2.799 T a c + 944.91 t α S r e c
Then, the accelerated aging time t a c at the accelerated aging temperature is
t a c = t a c _ r e c + t a c _ p e r
where t a c _ r e c is the grain’s elongation recovery time under T a c , and t a c _ p e r is the grain’s maximum elongation accelerated aging time under T a c .
According to Equation (33), the acceleration factor of the grain at the accelerated aging temperature T a c equivalent to the storage temperature T s t is
τ a c _ p e r = k ( T a c , ε a c ) k ( T s t , ε s t )
Therefore,
t a c _ p e r = t r e c ( T a c , ε a c ) + t s t t r e c ( T a c , ε a c ) τ a c _ p e r

5.2. Engineering Applications of Accelerated Aging

A solid motor grain composed of HTPB propellant completes the solidification molding process at 331.15 K. This motor was kept in a storage environment at 293.15 K for a long time, which caused the temperature load to vary by 38 K between the storage temperature of 293.15 K and the zero stress temperature of 331.15 K. The finite element analysis method was used to numerically simulate the distribution of thermal strain across the grain under these conditions. Figure 10 displays the grain’s strain cloud diagram as a result. According to the simulation results, the inner hole region—a crucial area because of the concentration of geometric stress under thermal contraction—experiences the highest strain (6.314%).
An accelerated aging test was conducted at high temperatures within the motor combustion chamber to assess the condition of a grain that had been stored for 10 years. In order to reduce the effect of temperature and strain on the grain and shorten the test period as much as feasible, the aging temperature was chosen to be 323.15 K. The temperature differential (ΔT) was 8 K as the temperature loading changed from the stress-free temperature of 331.15 K to the storage temperature of 323.15 K. Figure 11 shows the grain’s strain cloud diagram under these circumstances. Because of the reduced temperature gradient, the maximum strain in the inner hole region drops to 1.329%.
A t-distribution value of 0.978 was used to measure statistical uncertainty in the aging kinetics model, and an 80% confidence probability was used in the accelerated aging analysis.
S Y and S D at the storage temperature T s t of 293.15 K are determined to be 0.7060 and 0.1435, respectively, using Equations (8) and (30). At the storage temperature T s t of 293.15 K, the values of k T s t , ε s t and t r e c T s t , ε s t can be found to be 1.726 × 10⁻³%/d and 128.88 days, respectively, using Equations (32) and (51).
S Y and S D at the accelerated aging temperature T a c of 323.15 K are determined to be 0.2875 and 0.1424, respectively, using Equations (8) and (30). At the accelerated aging temperature T a c of 323.15 K, the values of k T a c , ε a c and t r e c T a c , ε a c can be found to be 3.466 × 10⁻²%/d and 26.34 days, respectively, using Equations (32) and (51).
Considering the confidence limit at the accelerated aging temperature T a c   = 323.15 K, the acceleration factor with respect to the storage temperature T s t   = 293.15 K is
τ a c _ p e r = k ( T a c , ε a c ) k ( T s t , ε s t ) = 3.466 × 10 2 1.726 × 10 3 = 20.08
Therefore, according to Equation (58), when the accelerated aging temperature is 323.15 K, the time required to accelerate the aging of the propellant grain to an equivalent of 10 years is
t a c _ p e r = t r e c ( T a c , ε a c ) + t s t t r e c ( T a c , ε a c ) τ a c _ p e r = 26.34   days + 10 years 26.34 days 20.08 = 206.80   days

6. Conclusions

The following important findings are the result of this study’s methodical investigation of the thermomechanical aging behavior of HTPB propellant:
(1).
Under conditions of constant strain ranging from 8% to 18%, HTPB propellant exhibits characteristic two-stage aging dynamics behavior. At first, the rearrangement in molecular chain orientation causes a brief rise in the maximum elongation. Maximum elongation steadily declines as a result of chemical aging.
(2).
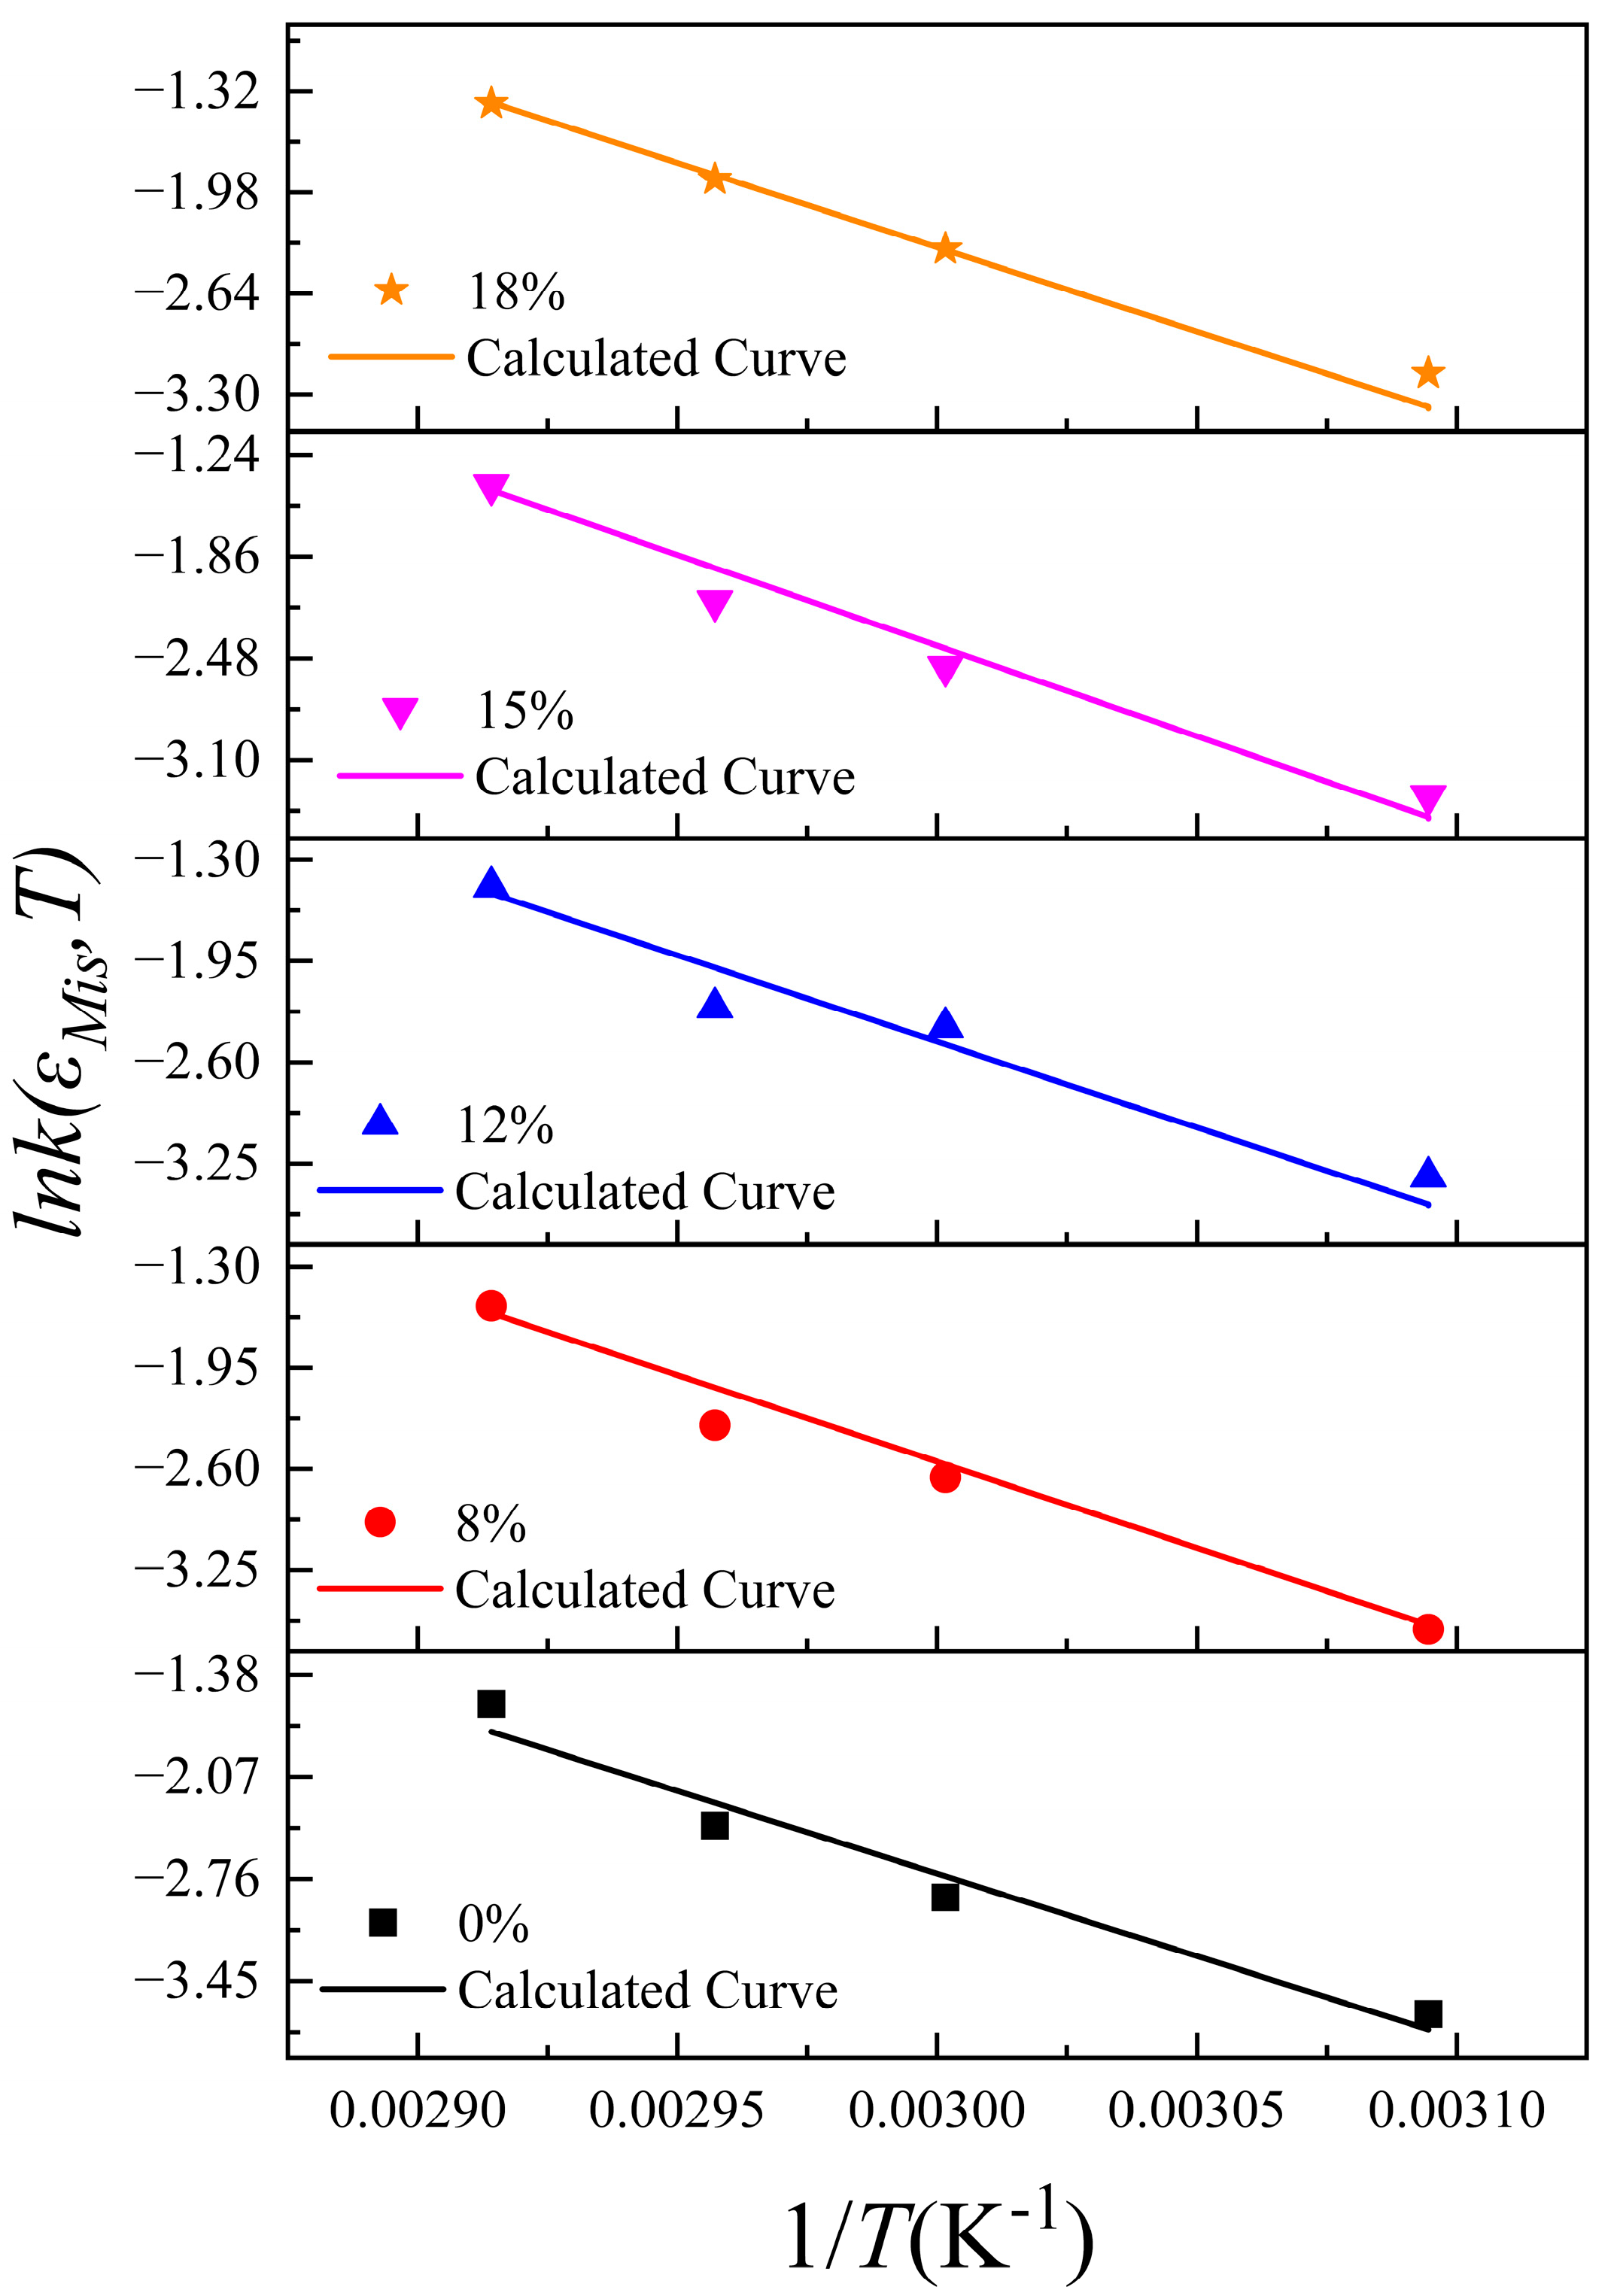
A strain correction term is correlated with the Arrhenius equation to create an aging model under thermal–mechanical interaction. This term quantifies the synergistic impact of temperature and constant strain on the rate constant of aging.
(3).
The elongation recovery time is correlated with aging temperature and constant strain using a binary linear relationship model. The fitted results show that the elongation recovery time lowers with the increasing temperature, while the recovery time elongates with the increasing strain.
(4).
Using finite element simulation and the propellant aging model under continuous strain, this work examines the acceleration coefficient of a particular solid motor grain type during accelerated aging at high temperatures (323.15 K). This corresponds to the acceleration coefficient (293.15 K) when stored at room temperature. To calculate the accelerated aging period appropriately, the high-temperature (323.15 K) accelerated test method is used.

Author Contributions

Conceptualization, P.Q. and X.Z.; Methodology, J.C.; Software, P.Q.; Formal analysis, K.J.; Writing—original draft, P.Q.; Writing—review & editing, J.C. All authors have read and agreed to the published version of the manuscript.

Funding

This research was funded by the National Natural Science Foundation of China [52103128].

Data Availability Statement

The data presented in this study are available on request.

Conflicts of Interest

Authors Pengju Qin, Xiangyu Zhang and Kai Jiang were employed by the company The 41st Institute of the Fourth Academy of China Aerospace Science and Technology Corporation. The remaining authors declare that the research was conducted in the absence of any commercial or financial relationships that could be construed as a potential conflict of interest.

Glossary

Nomenclature
ε M i s Applied constant strain elongation amplitude, kept constant during aging
t α D Degree of freedom is (m − 1) and the confidence probability is (1 − α), the t-distribution value
l Gauge length of the specimen after tensile testing
mNumber of samples of aging time at constant strain at each T
l 0 Initial gauge length of the specimen
t r e c Elongation recovery time
ε m Maximum elongation of the propellant in uniaxial tensile test
γ ε Strain restitution coefficient
tAging time
γ T Temperature restitution coefficient
ε m 0 Initial maximum elongation
t r e c 0 Constant of elongation recovery time
k aging rate constant of ε m
pParameter to be fitted in the Equation (34)
R 2 Determination coefficient
mTotal number of test groups under constant strain
R c r i t 2 90% confidence probability of the determination coefficient
T s t Temperature for long-term storage
ε m u Intercept of the linear regression parameters for the rising phase
ε s t Maximum strain of the grains under T s t
k u Slope of the linear regression parameters for the rising phase
t r e c T s t , ε s t Elongation recovery time under T s t
ε m d Intercept of the linear regression parameters for the decline phase
k ( T s t , ε s t ) Upper limit of the propellant’s aging rate constant under T s t
k d Slope of the linear regression parameters for the decline phase
T a c Accelerated aging temperature
k ( T ) Aging rate constant of the propellant ε m at a temperature T
ε a c Maximum strain of the grains under T a c
T Aging temperature (K)
t r e c T a c , ε a c Elongation recovery time under T a c
SYStandard deviation of Y
k ( T a c , ε a c ) Upper limit of the propellant’s aging rate constant under T a c
t α Y Degree of freedom is (n − 1) and confidence probability is (1 − α), the t-distribution value
t a c Accelerated aging time t a c at the accelerated aging temperature
nNumber of samples of aging time at zero strain at each T
t a c _ r e c Grain’s elongation recovery time under T a c
γ Strain correction factor (J/(mol·%))
t a c _ p e r Grain’s maximum elongation accelerated aging time under T a c
k ( ε M i s , T ) Aging rate constant of ε m at T and ε M i s
Abbreviation
HTPBHydroxyl-Terminated Polybutadiene
DOSDicapryl sebacate
NEPENitrate Ester Plasticized Ether
TDIToluene diisocyanate
WLFWilliams–Landel–Ferry
MAPOAziridinyl phosphine oxide
APAmmonium perchlorate
DPPDN,N’-Diphenyl-p-phenylenediamine

References

  1. Cerri, S.; Bohn, M.A.; Menke, K.; Galfetti, L. Characterization of ADN/GAP-Based and ADN/Desmophen®-Based Propellant Formulations and Comparison with AP Analogues. Propellants Explos. Pyrotech. 2014, 39, 192–204. [Google Scholar] [CrossRef]
  2. DeLuca, L.T.; Galfetti, L.; Maggi, F.; Colombo, G.; Merotto, L.; Boiocchi, M.; Paravan, C.; Reina, A.; Tadini, P.; Fanton, L. Characterization of HTPB-Based Solid Fuel Formulations: Performance, Mechanical Properties, and Pollution. Acta Astronaut. 2013, 92, 150–162. [Google Scholar] [CrossRef]
  3. Geng, T.; Qiang, H.; Wang, Z.; Wang, X.; Zhu, Z.; Qiao, D. Biaxial Compression Mechanical Properties of HTPB Propellant under Dynamic Loading. AIP Adv. 2022, 12, 015123. [Google Scholar] [CrossRef]
  4. Song, S.; Shi, H.; Liu, Z.; Sha, B. Structural Analysis of Solid Rocket Motor Grain at Ignition Transient under Low Temperature. J. Solid Rocket Technol. 2018, 41, 278–283. [Google Scholar]
  5. Liu, Z.; Zhou, Y.; Zhang, B. Structural Integrity Analysis on Grains of Solid Rocket Motor at Low Temperature Ignition. J. Solid Rocket Technol. 2015, 38, 351–355. [Google Scholar]
  6. Zhang, H.; Pang, A.; Peng, S. Investigation on the Differences Between Predicted Lifetime of Propellant Carton and Actual Lifetime of Motor Propellant Grain. J. Solid Rocket Technol. 2005, 28, 53–56. [Google Scholar]
  7. Chang, X.; Jian, B.; Liu, C.; Wang, B.; Zhang, X.; Hu, K. Experiments on HTPB Propellant Aging Properties under Constant Strain. J. Propuls. Technol. 2010, 31, 576–580. [Google Scholar]
  8. Li, Y.Q.; Li, G.C.; Kong, L.Z.; Zang, H.B. Experimental Measurement and Molecular Dynamics Simulation Analysis of Thermal Aging Performance in Composite Solid Propellants. Polym. Degrad. Stab. 2024, 225, 110812. [Google Scholar] [CrossRef]
  9. Zeng, Y.; Huang, W.; Chen, J.X.; Xu, J.S.; Chen, X.; Wu, R.; Song, Q.X. Analysis of Thermomechanical Coupled Accelerated Aging of HTPB Propellants. Propellants Explos. Pyrotech. 2024, 49, e202300123. [Google Scholar] [CrossRef]
  10. Wei, X.; Li, H.; Zhao, Y.; Li, Z.; Zhao, F. Accelerated Test Method of Composite Solid Propellant with Constant Strain-Temperature Cycle. Equip. Environ. Eng. 2022, 19, 65–72. [Google Scholar]
  11. Dong, K.; Pei, L.; Kong, L.; Chen, S.; Zhang, C.; Xia, C. Storage Aging Performance of NEPE Propellant under Constant Strain. J. Solid Rocket Technol. 2019, 42, 403–408. [Google Scholar]
  12. Zhou, D.; Liu, X.; Sui, X.; Wei, Z.; Wang, N. Effect of Pre-Strain During Ageing on the Maximum Elongation of Composite Solid Propellants and Its Modelling. Polym. Test. 2016, 50, 200–207. [Google Scholar] [CrossRef]
  13. Zhou, D.; Liu, X.; Sui, X.; Wei, Z.; Wang, N. Elongation Aging Model of HTPB Propellant under Constant Strain. J. Propuls. Technol. 2017, 38, 207–213. [Google Scholar]
  14. Geng, T.; Qiang, H.; Miao, H.; Wang, X.; Wang, Z.; Zhang, H. Maximum Elongation Degradation Model and Service Life Prediction for HTPB Propellant under Constant Strain and Chemical Aging Effects. Polym. Test. 2025, 143, 108711. [Google Scholar] [CrossRef]
  15. Zhang, H.; Peng, S.; Pang, A. Relationship Between Stress-Strain and Service Life of Solid Propellant. J. Propuls. Technol. 2006, 27, 372–375. [Google Scholar]
  16. Zhang, F.; Feng, S.; Sha, B.; Chi, X. Study on Equivalent Accelerated Test Method of Low Temperature Stress for Solid Propellant Charge. J. Solid Rocket Technol. 2019, 42, 409–413. [Google Scholar]
  17. Yıldırım, H.; Özüpek, Ş. Structural Assessment of a Solid Propellant Rocket Motor: Effects of Aging and Damage. Aerosp. Sci. Technol. 2011, 15, 635–641. [Google Scholar] [CrossRef]
  18. Zhao, F.; Wei, X.; Li, H.; Yin, S.; Li, Z.; Huang, W. Study on the Aging Mechanism of Polyether Propellant under Temperature Cycle and Strain. Equip. Environ. Eng. 2021, 18, 1–6. [Google Scholar]
  19. Zhang, G.; Wang, J.; Liu, X.; Li, M.; Chen, C.; Wang, N.; Hou, X. Correlation Between the Micro-Structure and Macroscopic Mechanical Properties of GAP-Based Propellant During Aging. Polym. Degrad. Stab. 2023, 214, 110411. [Google Scholar] [CrossRef]
  20. GJB 770B-2005; Committee of National Defense Science, Technology and Industry Marh 1990. Available online: https://www.doc88.com/p-4059176473593.html (accessed on 26 May 2025).
  21. Liu, M.; Gao, B.; Dong, X.; Gao, J. Failure Criterion of Solid Motors at Ignition Pressurization Loading. J. Solid Rocket Technol. 2018, 41, 424–427. [Google Scholar]
  22. Layton, L. Chemical Structural Aging Studies on an HTPB Propellant; Technical Report; Defense Technical Information Center: Fort Belvoir, VA, USA, 1975. [Google Scholar]
  23. Cao, R.; Zhao, C.; Peng, S.; Chi, X. Study on Mechanical Performance of HTPB Propellant under Natural Storage and High Temperature Accelerated Aging Conditions. Chem. Propellants Polym. Mater. 2017, 15, 58–62. [Google Scholar]
  24. Liu, J.; Tong, X.; Luo, X.; Chen, X.; Wang, T.; Xu, J. The Relaxation Behavior of Composite Double-Base Propellants with Various Stabilizer Content under Thermal Aging. Mech. Time-Depend. Mater. 2022, 27, 651–663. [Google Scholar] [CrossRef]
  25. Parepalli, P.; Nguyen, Y.T.; Sen, O.; Hardin, D.B.; Molek, C.D.; Welle, E.J.; Udaykumar, H.S. Multi-Scale Modeling of Shock Initiation of a Pressed Energetic Material III: Effect of Arrhenius Chemical Kinetic Rates on Macro-Scale Shock Sensitivity. J. Appl. Phys. 2024, 135, 085901. [Google Scholar] [CrossRef]
  26. Kaupp, G. Mechanochemistry: The Mechanical Activation of Covalent Bonds. Chem. Rev. 2005, 105, 2921–2948. [Google Scholar]
  27. Caruso, M.M.; Davis, D.A.; Shen, Q.; Odom, S.A.; Sottos, N.R.; White, S.R.; Moore, J.S. Mechanically-Induced Chemical Changes in Polymeric aterials. Chem. Rev. 2009, 109, 5755–5798. [Google Scholar] [CrossRef]
Figure 1. Diagram of a propellant specimen illustrative schematic.
Aerospace 12 00589 g001
Figure 2. Loading conditions of the propellant specimens under 8% constant strain.
Aerospace 12 00589 g002
Figure 3. Maximum elongation versus aging time at different aging temperatures and constant strains under (a) 323.15 K, (b) 333.15 K, (c) 338.15 K, and (d) 343.15 K.
Aerospace 12 00589 g003
Figure 4. Fitting model parameters of the rising phase, (a) slope k u versus strain value ε M i s (b) intercept ε m u versus strain value ε M i s .
Aerospace 12 00589 g004
Figure 5. Fitting model parameters of the decline phase. (a) slope k d versus strain value ε M i s (b) intercept ε m d versus strain value ε M i s .
Aerospace 12 00589 g005
Figure 6. Fitting results of l n k ( ε M i s , T ) to 1 / T at different constant strains.
Aerospace 12 00589 g006
Figure 7. Schematic diagram of ε m under constant strain versus aging time.
Aerospace 12 00589 g007
Figure 8. Relationship between t r e c and T under different constant strains.
Aerospace 12 00589 g008
Figure 9. Relationship between the fitting results of t r e c and T under different constant strains.
Aerospace 12 00589 g009
Figure 10. A von Mises equivalent strain cloud diagram of a grain at 293.15 K.
Aerospace 12 00589 g010
Figure 11. A von Mises equivalent strain cloud diagram of a grain at 323.15 K.
Aerospace 12 00589 g011
Table 1. Sampling aging times at different aging temperatures ( ε M i s = 0 % ).
Aging Temperature (K)Aging Time (Days)
323.1505690126175224280336
333.15014285690126168210
338.15028497090105147168
343.15014283549637090
Table 2. Sampling aging times at different aging temperatures ( ε M i s   = 8 % ,   12 % ,   15 %   a n d   18 % ).
Aging Temperature (K)Aging Time (Days)
323.150714212842567091126154196224
333.150410212842567087101112126154
338.15041017283549637791119133153
343.150147142128354262708498
Table 3. Fitted relationship between the propellant ε m and aging time ( ε M i s = 0 % ).
Aging Temperature (K)Model Parameters R 2
323.15 ε m = 49.10 0.0254 t 0.9821
333.15 ε m = 48.06 0.0559 t 0.9640
338.15 ε m = 49.12 0.0909 t 0.9615
343.15 ε m = 48.66 0.2066 t 0.9670
Table 4. Fitted relationship between the propellant ε m and aging time ( ε M i s = 8 ~ 18 % ).
Aging Temperature(K)Constant Strain Value(%)Model Parameters R 2 Number of Fitted R c r i t 2
323.15 8rising phase ε m = 49.16 + 0.0496 t 0.960360.729
decline phase ε m = 51.56 0.0265 t 0.952280.622
12rising phase ε m = 49.27 + 0.0735 t 0.984560.729
decline phase ε m = 53.02 0.0356 t 0.958980.622
15rising phase ε m = 50.23 + 0.0787 t 0.949850.805
decline phase ε m = 53.99 0.0362 t 0.926190.582
18rising phase ε m = 49.15 + 0.2231 t 0.980050.805
decline phase ε m = 55.89 0.0423 t 0.919090.582
333.15 8rising phase ε m = 49.71 + 0.0943 t 0.869750.805
decline phase ε m = 54.72 0.0704 t 0.964190.582
12rising phase ε m = 49.47 + 0.1560 t 0.988750.805
decline phase ε m = 57.50 0.0930 t 0.944490.582
15rising phase ε m = 49.62 + 0.2716 t 0.972840.900
decline phase ε m = 56.75 0.0795 t 0.9865100.549
18rising phase ε m = 50.21 + 0.3153 t 0.884840.900
decline phase ε m = 59.21 0.0954 t 0.8697100.549
338.15 8rising phase ε m = 49.74 + 0.0765 t 0.808750.805
decline phase ε m = 55.43 0.0992 t 0.940890.582
12rising phase ε m = 49.09 + 0.1791 t 0.944650.805
decline phase ε m = 56.67 0.1063 t 0.984090.582
15rising phase ε m = 49.40 + 0.2435 t 0.946750.805
decline phase ε m = 58.57 0.1184 t 0.988490.582
18rising phase ε m = 49.47 + 0.6186 t 0.971540.900
decline phase ε m = 62.00 0.1504 t 0.9483100.549
343.15 8rising phase ε m = 50.05 + 0.3447 t 0.830850.805
decline phase ε m = 57.22 0.2116 t 0.989590.582
12rising phase ε m = 50.48 + 1.1016 t 0.902540.900
decline phase ε m = 60.01 0.2296 t 0.9922100.549
15rising phase ε m = 50.60 + 2.0005 t 0.928040.900
decline phase ε m = 64.01 0.2400 t 0.9835100.549
18rising phase ε m = 52.32 + 2.1259 t 0.849440.900
decline phase ε m = 66.38 0.2469 t 0.9649100.549
Table 5. Fitting relationship between k(T) and T under zero strain.
Arrhenius Model R 2 R c r i t 2
l n k ( T ) = 30.765 11159.7 / T 0.9610.90
Table 6. Results of fitting l n k ( ε M i s , T ) to T and ε M i s . .
Model R 2 Number of Fitted R c r i t 2
l n k ( ε M i s , T ) = 30.756 ( 11159.7 712.487 · ε ) / T 0.963200.378
Disclaimer/Publisher’s Note: The statements, opinions and data contained in all publications are solely those of the individual author(s) and contributor(s) and not of MDPI and/or the editor(s). MDPI and/or the editor(s) disclaim responsibility for any injury to people or property resulting from any ideas, methods, instructions or products referred to in the content.

